Financial Markets, Industry Dynamics, and Growth
48
HAL Id: halshs-01947973 https://halshs.archives-ouvertes.fr/halshs-01947973 Submitted on 7 Dec 2018 HAL is a multi-disciplinary open access archive for the deposit and dissemination of sci- entific research documents, whether they are pub- lished or not. The documents may come from teaching and research institutions in France or abroad, or from public or private research centers. L’archive ouverte pluridisciplinaire HAL, est destinée au dépôt et à la diffusion de documents scientifiques de niveau recherche, publiés ou non, émanant des établissements d’enseignement et de recherche français ou étrangers, des laboratoires publics ou privés. Financial Markets, Industry Dynamics, and Growth Maurizio Iacopetta, Raoul Minetti, Pietro Peretto To cite this version: Maurizio Iacopetta, Raoul Minetti, Pietro Peretto. Financial Markets, Industry Dynamics, and Growth. The Economic Journal, In press, 10.1111/ecoj.12635. halshs-01947973
Transcript of Financial Markets, Industry Dynamics, and Growth

HAL Id: halshs-01947973https://halshs.archives-ouvertes.fr/halshs-01947973
Submitted on 7 Dec 2018
HAL is a multi-disciplinary open accessarchive for the deposit and dissemination of sci-entific research documents, whether they are pub-lished or not. The documents may come fromteaching and research institutions in France orabroad, or from public or private research centers.
L’archive ouverte pluridisciplinaire HAL, estdestinée au dépôt et à la diffusion de documentsscientifiques de niveau recherche, publiés ou non,émanant des établissements d’enseignement et derecherche français ou étrangers, des laboratoirespublics ou privés.
Financial Markets, Industry Dynamics, and GrowthMaurizio Iacopetta, Raoul Minetti, Pietro Peretto
To cite this version:Maurizio Iacopetta, Raoul Minetti, Pietro Peretto. Financial Markets, Industry Dynamics, andGrowth. The Economic Journal, In press, 10.1111/ecoj.12635. halshs-01947973

Acc
epte
d A
rtic
le Financial Markets, Industry Dynamics, and GrowthMaurizio Iacopetta Raoul Minetti∗ Pietro F. Peretto
Abstract
This paper introduces corporate governance frictions into a growth model with
endogenous market structure. Managers engage in corporate resource diversion and
empire building. Shareholders discipline managers with incentive compensation con-
tracts. A reform that mitigates corporate governance frictions boosts firms’ entry and,
∗Department of Economics, 486 W. Circle Drive, 110 Marshall-Adams Hall, Michigan State University,
East Lansing, MI 48824-1038, USA. E-mail: [email protected] . We thank the editor, two anonymous
referees, Guido Cozzi, Tullio Jappelli, Florencio Lopez-de-Silanes, Marco Pagano, Alessandra Pelloni, John
Seater, Daniel Trefler, and seminar and conference participants at Birkbeck College, Duke University, Emory
University, St. Louis Fed, Luiss University (Rome), Michigan State University, OFCE (Nice), Oxford Uni-
versity, Sant’Anna School for Advanced Studies (Pisa),Universita’ Cattolica (Milan), University of Naples
Federico II and CSEF, University of Rome Tor Vergata, University of St. Gallen, University of York, U.S.
Treasury (Washington), Barcelona GSE Summer Forum, Degit (Geneva), Midwest Macroeconomics Meet-
ings (Vanderbilt), SED meetings (Warsaw), Workshop on “Macroeconomics, Financial Frictions and Asset
Prices” (University of Pavia), Workshop “Finance, Growth and Crises” (OFCE-Science Po, Paris), Workshop
“Economic Growth and Macroeconomics” (North Carolina State-OFCE-SKEMA). All remaining errors are
ours.
This article has been accepted for publication and undergone full peer review but has not been through the copyediting, typesetting, pagination and proofreading process, which may lead to differences between this version and the Version of Record. Please cite this article as doi: 10.1111/ecoj.12635This article is protected by copyright. All rights reserved.

Acc
epte
d A
rtic
lefor a given market structure, has an ambiguous impact on incumbents’ return to prod-
uct improvement. However, as the market structure adjusts, becoming more diffuse,
incumbents invest less in product improvement. Calibrating the model to U.S. data,
we find that a reform of the kind recently enacted in several advanced economies can
lead to a welfare loss.
Keywords: Endogenous Growth, Market Structure, Corporate Governance.
JEL Codes: E44, O40, G30
A broad consensus exists that corporate governance can be relevant for growth in both
advanced and emerging economies (La Porta et al., 2000; De Nicolo’ et al., 2008; Bloom and
Van Reenen, 2010). There is little agreement, however, about the channels through which it
operates. The “rule of law” viewmaintains that economies with better shareholder protection
and managerial discipline enjoy stronger entrepreneurship and innovative activity (OECD,
2012). On the other hand, the policies of several emerging countries and some advanced ones
often accommodate firms’ informational opacity, for example allowing government-protected
business group affiliates to disclose limited information to financial markets (OECD, 2010).
A consequence is that managers are able to engage in resource diversion at the expense
of shareholders. In addition, governments often favour the appointment of managers with
empire building attitudes. Advocates of these policies stress that large incumbent businesses
have engaged in aggressive investment and boosted growth in several countries such as Korea,
Indonesia, Thailand, Brazil, Chile, and Japan (see, e.g., Jwa, 2002; Chang, 2007, for reviews).
Opponents maintain that these policies have inhibited competition and entrepreneurship.
It is tempting to conclude that this debate and the evidence it hinges on are inconclusive
This article is protected by copyright. All rights reserved.

Acc
epte
d A
rtic
le(Khanna, 2000; Morck et al., 2005). Nevertheless, from the debate it emerges that to under-
stand the effects of corporate governance on growth one needs to investigate how corporate
governance affects both the process of firm entry into product markets (entrepreneurship)
and the process of growth of incumbent firms, and the interaction between the two. To date,
studies that examine the influence of corporate governance on firm investment have treated
market structure as given. Yet, scholars document the profound effects that corporate gov-
ernance reforms have had on market structure in various countries in recent decades via the
induced changes in the ease with which firms enter product markets (see, e.g., Fulghieri and
Suominen, 2012, and references therein).
The goal of this paper is to help fill this gap by studying the effects of corporate gov-
ernance frictions on the investment and growth patterns of an economy in which corporate
governance shapes the evolution of the market structure (firm entry and size). We draw from
the literature that has extended endogenous growth theory to include endogenous market
structure (see, e.g., Peretto, 1996, 1999, and, for a recent survey, Etro, 2009) and build a
model where growth is driven both by the foundation of new firms that offer new intermediate
products (entry/extensive margin) and by the investment of incumbent firms in the improve-
ment of intermediate products (investment/intensive margin). To apply the framework to
the study of corporate governance, we do two things. First, we posit separation of ownership
and control: households can act as founding shareholders and managers of firms; managers
are in charge of production and investment decisions concerning existing products. Second,
we allow for moral hazard to generate frictions: managers can divert resources from firms
(profit stealing) and pursue private benefits tied to investment volumes (empire building);
This article is protected by copyright. All rights reserved.

Acc
epte
d A
rtic
leshareholders can only partially discipline managers through incentive compensation (equity)
contracts. This way of modelling corporate governance builds on prior corporate finance
studies (e.g., Nikolov and Whited, 2014) and on the mentioned evidence on the corporate
governance problems of several countries.
We find that both managerial resource diversion and empire building discourage firm
entry and, hence, the expansion of product variety. Intuitively, the corporate governance
frictions act as a barrier to entry, directly eroding the profits that founding shareholders
expect to receive and forcing shareholders to surrender a fraction of expected profits to
managers to mitigate moral hazard via incentive contracts. As for incumbents’ investment
in product improvement, the joint effect of the two frictions would be ambiguous for given
market structure: on the one hand, managers’ resource diversion depresses the return to
investment from shareholders’ viewpoint; on the other hand, empire building boosts man-
agers’ investment incentives. However, in our economy with endogenous market structure,
the net effect of the frictions is to induce more aggressive investment of incumbents in free-
entry equilibrium because of the market consolidation and the larger firm size due to the
weaker entry. In fact, exactly because of the market consolidation and the larger firm size
sustainable in equilibrium, incumbents can reap larger benefits from investing in product
improvement.
Our analysis thus shows that, allowing for the endogeneity of market structure, captured
by firm size in our model, a nuanced perspective emerges on the growth effects of governance
frictions. For example, following a reform that mitigates the frictions, a non-trivial trade-
off arises between the acceleration of firm entry and the impact of the growing mass of
This article is protected by copyright. All rights reserved.

Acc
epte
d A
rtic
lefirms on incumbents’ incentive to invest in product improvement. We assess this trade-off
analytically and quantitatively. Calibrating the model to U.S. data, we find that a reform of
the kind implemented in several advanced economies in 2006-2012 on impact boosts firms’
entry rate by 0.12%, from the steady-state value 1.61% to 1.73%, and depresses incumbents’
investment in product improvement by 0.05%, from 1.60% to 1.55%. These responses are
larger in economies with weaker corporate governance than the United States. Further, we
find that, relative to a reform targeting empire building, a reform curbing resource diversion
can boost entry with a smaller fall in incumbents’ investment.
Because of its tractability, the model allows to trace the full dynamic response to a gov-
ernance reform through the evolution of the market structure and characterise analytically
the welfare effects. Following a reform, household utility is initially driven by the acceler-
ation of firm entry, which responds immediately to the reform as firm founders expect to
appropriate a larger share of firms’ value. As the market structure adjusts and firms’ size
falls, however, incumbents’ investment declines. Consequently, the negative comovement
between number of firms and incumbent firms’ growth which is at the heart of the model
produces a dynamic product variety/quality trade-off that manifests itself as a trade-off be-
tween the short- and long-run welfare effects of the reform. The relative importance of the
short- and long-run welfare effects depends on technological and market structure features:
for example, in economies with lower investment externalities the welfare benefit of faster
entry gains relevance relative to the drop in incumbents’ investment driven by the market
structure adjustment. However, for the baseline parameterization we obtain that the welfare
benefit due to faster entry is dominated by the welfare cost due to reduced investment rates.
This article is protected by copyright. All rights reserved.

Acc
epte
d A
rtic
leThus, an improvement in corporate governance leads to a net welfare reduction.
Theoretical work on the growth effects of corporate governance has lagged behind the
policy debate. In a related work, Akcigit et al., (2014) study an effort model in which firm
entry rate is given. By holding up firms ex post, managers can discourage the increase in the
scope of firms’ product lines. More in general, a strand of literature stresses that corporate
governance frictions can hinder growth by inhibiting investment and product improvement
(Stein, 1993; Morck et al., 2005; Driver and Coelho Guedes, 2012). We contribute to the
debate by showing that in an economy with endogenous market structure, corporate gov-
ernance frictions can inhibit entry (the extensive margin of growth) but promote a more
aggressive investment of incumbents, which benefit from the market consolidation and the
larger firm size induced by imperfect governance. We also investigate this trade-off quan-
titatively. Our paper is also related to the literature on imperfect financial markets and
growth (e.g., Greenwood and Jovanovic, 1990; Bencivenga and Smith, 1991; Cooley and
Quadrini, 2001; Aghion et al., 2005). In this strand, Caselli and Gennaioli (2013) model
an economy in which credit frictions can inhibit the reallocation of ownership to the most
productive agents, slowing down growth.1 Finally, the paper relates to a strand of studies on
managerial misbehaviour (e.g., Eisfeldt and Rampini, 2008; Immordino and Pagano, 2012).
For example, Cooley et al. (2014) investigate the long-run implications of managers’ risk
taking in financial firms.
The structure of the paper is as follows. Section 1 provides suggestive evidence from
country- and firm-level data motivating our focus. Sections 2 and 3 present and solve for
1For studies on the misallocation of inputs, see Restuccia and Rogerson (2008) and Guner et al. (2008).
This article is protected by copyright. All rights reserved.

Acc
epte
d A
rtic
leagents’ decisions. Section 4 characterises the general equilibrium and solves for the steady
state. Sections 5 and 6 investigate analytically and numerically the dynamics of the economy
and its response to corporate governance reforms. Section 7 concludes. Proofs and details
on the data are in the online Appendix while additional robustness analysis is relegated to
a Supplement.
1. Some Motivational Evidence
This section asks whether the trade-off between the effects of corporate governance frictions
on firm entry and on incumbents’ investment finds preliminary support in the data (details
on the tests are in the Appendix).
In Panel A of Table 1, column 1, we use data from 87 advanced and emerging economies
and regress firms’ entry rate (in percentage) in 2012 on the World Bank 10-point index of
corporate governance quality and on several macroeconomic and institutional factors that
are generally used to explain entry. To mitigate possible endogeneity problems, we include
the controls lagged by one year. The results suggest a positive correlation between corpo-
rate governance quality and firm entry. In column 2, we perform a panel data analysis over
the 2006-2012 period. We regress firms’ percentage entry rate on the index of corporate
governance quality, on an indicator of the cycle (GDP growth in the country), and saturate
the regression with year and country fixed effects. Between 2006 and 2012 several countries
enacted corporate governance reforms, so that the governance index exhibits substantial in-
tertemporal, within-country variation. The estimated coefficient on the index of corporate
governance quality suggests that an increase of the index by 1 is associated with a higher
This article is protected by copyright. All rights reserved.

Acc
epte
d A
rtic
leentry rate by 0.2 percentage points (on average the reforms in OECD economies approxi-
mately increased the governance quality index by 0.3). This impact is roughly one order of
magnitude smaller than the entry rates that various countries in the sample experience in a
typical year.
In Panel B of Table 1, we turn to explore the link between corporate governance and
incumbents’ investment in product improvement. In the literature, the more comprehensive
investment in intangible assets (R&D capital, software, brands) is frequently used as a
proxy for investment in product improvement rather than R&D expenses (see, e.g., OECD,
2013).2 In columns 3-4, using data from 40 advanced and emerging countries, we regress
incumbents’ average rate of investment in intangibles in 2013 on the governance quality
index and on control variables that could drive investment (data source: Orbis, Bureau van
Dijk).3 The results suggest a negative correlation between the index of governance quality
and incumbents’ investment in intangibles. Regressing the firm-level percentage investment
in intangibles in 2013 on the governance index and on aggregate and firm controls (columns
5-6) or performing a firm-level panel analysis for the years 2010-2014 (columns 7-8) yields
results that are consistent with the country-level regressions in columns 3-4.4
2Countries may differ in the relative importance of formal R&D activities, investment in brands or in
training.
3A number of studies estimate a positive effect of corporate governance quality on R&D and innovation
(see, e.g., Wurgler, 2000; Xiao, 2013). Other studies, however, find a negative effect (see, e.g., Bargeron et
al., 2010; Driver and Coelho Guedes, 2012; and, for a discussion, Kose et al., 2008).
4The magnitude of the estimated coefficient on the governance index is lower than in the country-level
regressions. In firm-level regressions countries with a larger business sector (e.g., advanced economies) weigh
more. In advanced countries, the impact of governance frictions may be less strong, as we will see in the
This article is protected by copyright. All rights reserved.

Acc
epte
d A
rtic
leIn Panel C, we experiment with alternative dependent variables. Column 9 shows a
negative correlation between governance quality and incumbents’ investment in fixed assets.
Finally, the model predicts that governance frictions can make incumbents invest aggressively
by inducing market structure consolidation and allowing to sustain a larger firm size in
equilibrium. In column 10, we indeed find a negative association between governance quality
and incumbents’ size (sales).
2. The Model: Preferences and Technology
The growth model takes its key elements from a large literature.5 Time is continuous and
infinite. All variables are functions of time but to simplify the notation we omit the time
argument unless necessary to avoid confusion. The economy is closed. The production side
consists of a final sector producing a homogeneous good and an intermediate sector producing
a continuum of differentiated non-durable goods. To keep things simple, there is no physical
capital. The intermediate sector is the core of our economy: new firms enter the sector
by developing new intermediate goods while incumbent firms invest in the improvement of
existing intermediate goods.
2.1. Households
The economy is populated by a representative household with () = 0, 0 ≡ 1, mem-
model. Moreover, firm controls may capture some channels through which corporate governance influences
investments (partially absorbing its effect).
5For growth models with endogenous market structure, see, e.g., Peretto (1996, 1999) and, for a survey,
Etro (2009).
This article is protected by copyright. All rights reserved.

Acc
epte
d A
rtic
lebers, each endowed with one unit of labour. The household has preferences
() =
Z ∞
−(−)(−) log
µ ()
()
¶ ≥ 0 (1)
where is the point in time when the household makes decisions, is the discount rate,
is the population growth rate, and is consumption. The household supplies labour
inelastically. It thus faces the flow budget constraint
= + − (2)
where is assets holding, is the rate of return on assets and is the wage. The intertem-
poral consumption plan that maximises (1) subject to (2) consists of the Euler equation
= − + (3)
the budget constraint (2) and the usual boundary conditions.
2.2. Final producers
A competitive representative firm produces a final good that can be consumed, used to
produce intermediate goods, invested in the improvement of the quality of existing interme-
diate goods, or invested in the creation of new intermediate goods. The final good is our
numeraire. The technology for its production is
=
Z
0
∙
1−
1−
¸1− 0 1 0 ≤ 1 (4)
where is output, is the mass of intermediate goods and is the quantity of intermediate
good used in production. Given the inelastic labour supply of the household and the one-
sector structure of the economy, labour market clearing yields that employment in the final
This article is protected by copyright. All rights reserved.

Acc
epte
d A
rtic
lesector equals population size . Quality is the ability of an intermediate good to raise the
productivity of the other factors: the contribution of intermediate good depends on its
own quality, , and on the average quality, =R 0() , of intermediate goods. We
show below that the parameters and regulate the private returns to quality and the
social returns to variety, respectively. The first-order conditions for the profit maximization
problem of the final producer yield that each intermediate firm faces the demand curve
=
µ
¶ 11−
1−
1− (5)
where is the price of intermediate good . The first-order conditions then imply that the
final producer pays total compensationZ
0
= and = (1− ) (6)
to intermediate goods and labour suppliers, respectively.
2.3. Intermediate producers
The typical intermediate firm operates a technology that requires one unit of final good
per unit of intermediate good produced and a fixed operating cost,
1−, also in units
of the final good.6 The firm can increase the quality of its intermediate good according to
the technology
= (7)
where is the firm’s investment in units of final good. Using (5), the firm’s net profit is
Π =
"( − 1)
µ
¶ 11−
1− −
#
1− − (8)
6Writing the fixed operating cost as κ 1−κ , κ ∈ [0 1], produces the same qualitative results.
This article is protected by copyright. All rights reserved.

Acc
epte
d A
rtic
leAccording to this expression, is the elasticity of the firm’s gross profit with respect to
its own quality so that throughout the analysis we can think of it as the private return to
quality. (We show below that the social return to quality is 1.) The value of the firm is
defined as
() =
Z ∞
− ()Π() (9)
The typical intermediate firm comes into existence when units of final good are invested
to set up operations, where =³R
0
´ denotes the average sales of the intermediate
firms. Because of this sunk entry cost, the firm cannot supply an already existing good in
Bertrand competition with the incumbent monopolist but must introduce a new intermediate
good that expands product variety. The firm enters at the average quality level and, hence,
at average size. This simplifying assumption preserves symmetry of equilibrium at all times.
3. Corporate Governance
Our goal is to study how corporate governance frictions stemming from the separation of
ownership and control affect economic growth and market structure by influencing entry,
investment and production decisions. In this section we concentrate on the micro (firm-
level) components of the analysis. We study their general equilibrium implications in the
following sections.
3.1. Conceptual setup: frictions and control mechanisms
Households provide the resources to pay the entry cost in exchange for equity. We thus iden-
tify them as the firms’ principal and refer to them as the founding shareholders (or simply
This article is protected by copyright. All rights reserved.

Acc
epte
d A
rtic
leas the founders or financiers). Next, we postulate that the principal hires a manager, the
agent, to set up the firm and then run everyday’s operations. The manager’s objective func-
tion is not aligned with that of the founder due to a “resource diversion” friction, whereby
the manager siphons resources off the firm, and an “empire building” friction, whereby the
manager derives private benefits from investing beyond what shareholders’ value maximiza-
tion calls for. To address this problem, the manager’s compensation consists of an equity
share.
At the foundation of a new firm, the founder makes two decisions. First, taking into
account the conflict of interest with the manager, he chooses the path of the manager’s
equity share that maximises the value of his own stake in the firm. We develop the analysis
for a generic path but for analytical tractability then focus on the case in which the equity
allocation chosen at foundation is held constant (see below for interpretation and robustness).
Second, the founder decides whether to finance the start-up of the firm in the first place. This
decision is represented by the participation constraint that the (maximised) value of his stake
in the firm be weakly larger than the funds he provides. Assuming that any household can
fund the start-up of a firm, no-arbitrage requires that the founder’s participation constraint
hold with equality.
3.2. Managers
The compensation package of the manager consists of an equity share . The manager
can steal a fraction of net profit, Π. The effort cost of stealing is () · Π, where the
function () is increasing and convex.7 Moreover, as in Stulz (1990) and Jensen (1986),
7Specifically, the function is of class ∞ with (0) = 0, () 0, →0 () = 0,
This article is protected by copyright. All rights reserved.

Acc
epte
d A
rtic
lethe manager derives private benefits from the firm’s volume of investment . Formally, we
write the manager’s utility flow as
manager =
£ (1− ) + − ()
¤ · (Π + Ω) (10)
The parameter Ω ≥ 0 governs the intensity of the empire building friction.8
At time , the manager chooses for ∈ [∞) the paths of price, (), investment, (),
and stealing effort, (), given the path of his shareholding, (), that maximise
manager () =
Z +∞
− ()
manager () (11)
Expressions (10)-(11) make clear that, due to stealing and empire building, the manager’s
objective is not the maximization of the value () in (9). Instead, he forms the Hamiltonian
=£ (1− ) + − ()
¤ · (Π + Ω) +
where is the shadow value of the marginal increase in product quality. The first-order
conditions with respect to , , and are (dropping the index of calendar time for
simplicity): £ (1− ) + − ()
¤ · Π
= 0; (12)
£ (1− ) + − ()
¤ · ∙Π
+ Ω
¸+ = 0; (13)
£ (1− ) + − ()
¤ · Π
= − + ; (14)
£ (1− ) + − ()
¤
· (Π + Ω) = 0 (15)
→1 () =∞.
8We obtain the same qualitative results if the empire building friction is Ω (details available on request).
This article is protected by copyright. All rights reserved.

Acc
epte
d A
rtic
leEquation (12) yields = 1. Combining this result with (13) and (14) yields the manager’s
rate of return to investment:
=
1−Ω
"µ1
− 1¶
−
µ
¶1−#+
(16)
where
=£ (1− ) + − ()
¤ · (1−Ω) (17)
These expressions make clear the distortions of the return to investment. First, the manager’s
return is higher than the purely value-maximizing one because he obtains the additional
marginal benefit£ (1− ) + − ()
¤ · Ω from the volume of investment . Second,
the manager’s return can be distorted by the potential temporal variation of his shadow value
of investing due to the possible temporal variation in and . For example, a manager
with a profit share that declines over time is induced to invest less today as he expects to
reap a smaller share of profits in the future. Formally, in (16) a decline in or implies
0. In an economy in which the manager’s objective is perfectly aligned with the
founder’s one unit of investment is worth one unit of consumption so that the shadow value
of investment satisfies = 1 and = 0.9
The first-order condition for the stealing effort , (15), says that the manager sets the
marginal benefit of his stealing effort equal to its marginal cost,
1− =()
(18)
9The Supplement presents the case of an economy without corporate governance frictions. We can think
of this as an economy in which managers’ cost of stealing is infinite and their investment decision is fully
contractible, so that managers can commit ex ante to undertaking a specified investment path vis-a-vis firms’
founders.
This article is protected by copyright. All rights reserved.

Acc
epte
d A
rtic
leThe marginal benefit is the net profit that the manager diverts from the share 1 −
that the ownership structure allocates to the founder. Accordingly, the equity share
discourages stealing because it raises the extent to which the manager makes costly effort to
steal from himself. Given the properties of the function (), straightforward application
of the implicit function theorem to equation (18) yields a function () characterising the
manager’s stealing decision that has the following properties: (0) = max ; 0 () 0;
(1) = 0.
3.3. Founding shareholders
The founder makes two decisions: the first is whether to fund the start-up project in the
first place; the second is to set the path () for ∈ [∞) of the manager’s equity share.
The first decision is represented by the participation constraint,
() ≤ founder () (19)
which we argued holds with equality because any household can finance entry of a new firm.
This constraint, therefore, yields the economy’s free-entry condition. The value that must
equal the entry cost is not the value defined in (9) but the value of the founder’s stake in
the firm. The two differ because of the need to delegate the firm’s management to an agent
that pursues his own objectives. To study the second decision, we use the function ()
constructed above and write
founder () =
Z +∞
− () [1− ()] [1− ( ())]Π() (20)
Our first result is then the following.
This article is protected by copyright. All rights reserved.
Acc
epte
d A
rtic
lePROPOSITION 1. (Equity Shares) Assume that the share is chosen at the time of
foundation of the firm, , and then held constant for . Then the founder’s problem
reduces to
max()
[1− ()] [1− ( ())] (21)
The solution yields a value , constant over calendar time, that allows us to define
Θ ≡ (1− ) [1− ()] (22)
At any date the founder receives as dividends only a constant fraction Θ of the net profits.
Proof. See the Appendix.
To understand this result, recall expressions (16) and (17) for the manager’s return to
investment. Temporal variation of the manager’s equity share would influence the investment
path () and hence the path of profits Π(). Our assumption that the ownership shares are
set at time shuts down this dependence and, therefore, yields that the founder knows that
for the path Π () does not depend on the shares. More precisely: (i) his problem
does not have a dynamic constraint, and thus reduces to a sequence of identical problems;
(ii) it features Π () () = 0. A useful way to think about the latter property is to
write the dividend flow inside (20) as
[1− ()] [1− ( ())]| z share of the pie
· Π()| z size of the pie
(23)
Our structure isolates the “size of the pie” part from the equity shares decision. Accordingly,
the founder solves the static (i.e., intratemporal) problem (21), equalizing the marginal cost
of incentivizing the manager through ownership shares to the marginal benefit due to the
This article is protected by copyright. All rights reserved.

Acc
epte
d A
rtic
lereduction of the manager’s stealing. The next step in the argument is to note that the
decision rule () obtained from the manager’s first-order condition does not contain
time-varying factors or other endogenous variables of the model. Therefore, the solution of
the founder’s problem yields a value that does not depend on the foundation date, ,
and thus is constant with respect to the model’s index of calendar time. Accordingly, the
founder’s “share of the pie” is also constant.
The founder’s appropriation factor Θ, defined in (22), fully captures the consequences of
the manager’s stealing for the founder. To see the implications of resource diversion for the
entry decision, now recall that the participation constraint of the founder (19) gives us the
free-entry condition () = founder (). Taking logs and time derivatives yields the return
to entry
=ΘΠ
founder
+ founder
founder
=Θ
Π
+
(24)
which equals the dividend price ratio plus capital gains/losses. The dividend features the
appropriation factor Θ that captures the two channels through which the resource diversion
distortion manifests itself. The first channel is direct: the founder surrenders a fraction
of the dividend flow to the manager to mitigate the manager’s resource diversion. The
second channel is indirect: given the shares (1− ), the manager makes his stealing
decision that results in a share of the net profits being diverted from dividend distribution
to the manager’s pockets.
3.4. Discussion
It is useful to take stock of what we have so far. The key simplification in our structure is
This article is protected by copyright. All rights reserved.

Acc
epte
d A
rtic
lethat the appropriation factor Θ is time-invariant because the equity shares ( 1− ) are
constant. Firms’ ownership structures exhibit strong inertia for several reasons, including
sunk costs, externalities, and stakeholders’ vested interests (Bebchuk and Roe, 1999). For
example, managers could oppose a change in the equity allocation that would reduce their
appropriation of profits. Moreover, because of free rider problems, dispersed shareholders
could be reluctant to sell shares. One advantage of this approach is thatΘ summarises all the
effects of resource diversion that are relevant for the macroeconomic analysis. Consequently,
our aggregate analytical results do not require specific functional forms but hold under
very general conditions. It is only when we want to know how Θ depends on features of
the environment represented by specific properties of the function () that we need to
specify it. We will do so in our numerical work in Section 6, since in that context we want
to perform comparative statics and dynamics exercises on the role of micro parameters that
govern the costs and benefits of the decisions of our principal and agent.
As stressed above, on the other hand, separability of the “share of the pie” and “size of the
pie” components is important. More precisely, the following simplifications were instrumental
in guaranteeing this separability: we scale costs and benefits of stealing by the net profit Π;
we scale the empire building friction Ω by the factor£ (1− ) + − ()
¤; and we
impose that the equity shares are chosen at foundation and then held constant throughout
the life of the firm. The benefit of these restrictions is that we are able to solve in closed
form the general equilibrium dynamics of the model and thus gain substantial analytical
insight on the mechanism that we study. The cost is that they suppress the potential
dynamic interdependence of the manager’s investment decision with the stealing and the
This article is protected by copyright. All rights reserved.

Acc
epte
d A
rtic
leequity shares decisions. The robustness analysis in the Supplement shows that the insights
carry through if we relax these restrictions.
4. General Equilibrium
We now turn to the general equilibrium of our economy. In this section we concentrate on
the steady state. We study dynamics in Sections 5-6.
4.1. Structure of the equilibrium
Models of this class have symmetric equilibria in which all intermediate firms charge the
same price and have the same quality level at all times.10 Specifically, they charge price
= 1 and receive · = from the final producer. We can then write = 2 .
Next, we impose symmetry in the production function (4) and use the previous result to
eliminate , obtaining
= 21− (25)
The reduced-form representation of the production function shows that both firm entry and
incumbents’ investment in product quality influence total factor productivity. In particular,
the social return to variety equals and the social return to quality equals 1.
10See Peretto (1996, 1999) for the formal arguments. The conditions for symmetry in this paper are (i)
that the firm-specific return to quality innovation is decreasing in (in this paper’s setup this follows from
1) and (ii) that entrants enter at the average level of quality . The first condition implies that if one
holds constant the mass of firms and starts the model from an asymmetric distribution of firm sizes, then
the model converges to a symmetric distribution. The second requirement simply ensures that entrants do
not perturb such symmetric distribution.
This article is protected by copyright. All rights reserved.

Acc
epte
d A
rtic
leThe definition of profit (8), symmetry and Proposition 1 allow us to rewrite (16) and
(24) as:
=
1−Ω
∙µ1
− 1¶
−
¸; (26)
=Θ
∙µ1
− 1¶− −
¸+
(27)
These expressions show that the returns to investment and to entry depend on quality-
adjusted firm size, measured by the quality-adjusted volume of production, . They thus
suggest that we use ≡ as our stationary state variable in the analysis of dynamics
since in this model steady-state growth is driven by exponential growth in intermediate
product quality. Using (25),
≡
=1
·
|zmarket size
· 1
|zmarket share
=
µ
¶ 11−
1− (28)
This expression shows the equilibrium determinants of quality-adjusted firm size and ratio-
nalises our assumption that the social return to variety satisfies 1: it ensures that the
market share effect in the intermediate goods market – at the denominator of –
dominates over the love-of-variety effect in final production so that the mass of firms ends
up at the denominator of the expression for quality-adjusted gross firm size. Henceforth, we
call “firm size” for short.
With our choice of state variable, we obtain the following expressions for the returns to
incumbents’ investment and to firms’ entry:
=
1− Ω
∙µ1
− 1¶−
¸; (29)
=Θ
∙µ1
− 1¶− +
¸+
+ (30)
This article is protected by copyright. All rights reserved.

Acc
epte
d A
rtic
lewhere ≡ = is the investment rate. These two equations show how the returns to
investment and to entry depend on corporate governance frictions. Specifically, the empire
building problem, Ω, increases the return to investment (29) because managers derive utility
from unprofitably expanding investment. The return to entry is decreasing in the severity
of the resource diversion problem (1−Θ): with no profit stealing Θ = 1, with profit stealing
Θ 1.
To complete this characterization we subtract the cost of intermediate production from
final output and use (28) to obtain GDP per capita as
=
µ
¶ 1−
| z final demand (static)
·∙1−
µ1 +
¶¸| z
intermediate efficiency (static IRS)
· | z intermediate technology (dynamic IRS)
(31)
where denotes GDP and = 1. The first term in this expression captures the role of
the pricing decision in locating firms on their demand curve, thus determining their scale of
activity. The second captures the existence of static economies of scale, which imply that
larger firms produce at lower average cost. The third captures the role of product variety and
product quality, which evolve over time according to the behaviour dictated by the returns
discussed above.
4.2. The steady state
We now turn to the characterization of the steady state. Households’ saving behaviour yields
= +
1− + (32)
Substituting this expression in the returns to investment (29) and to entry (30) we obtain:
=
1− Ω
µ1
− 1¶−
1−Ω−
µ+
1−
¶; (CI)
This article is protected by copyright. All rights reserved.

Acc
epte
d A
rtic
le =
∙1
− 1−
Θ
µ+
1−
¶¸− (EI)
The first curve, which we call the corporate investment (CI) locus, describes the steady-state
investment rate that incumbent firms generate given the firm size that they expect to achieve
in equilibrium. In an economy with a higher , for instance, the typical firm invests, for a
given level of , at a greater rate, as it appropriates a larger fraction of the investment return.
Similarly, with a fatter mark-up 1 it pays more to invest in product improvement. Stronger
managerial empire building, Ω, also causes the CI to become steeper. The second curve,
which we call the entrepreneurial investment (EI) locus, describes the steady-state investment
rate that equalises the return to entry and the return to investment, given the value of firm
size that both entrants and incumbents expect to achieve in equilibrium. Observe that in an
economy where the mark-up 1 is higher or the return to variety is lower, arbitrage in the
rate of returns to investment and to entry is achieved with a higher investment in product
improvement. A less intense managerial resource diversion (higher Θ) also causes the EI to
become steeper.
The steady state is the intersection of the CI and EI curves in the ( ) space.11 The
formal result is as follows.
11Existence and stability of this steady state require the intercept condition that the EI curve starts out
below the CI curve and the slope condition that the EI curve is steeper than the CI curve. Together they say
that intersection exists with the EI line cutting the CI line from below. The restrictions on the parameters
that guarantee this configuration are those that yield the global stability of the economy’s dynamics (see the
Appendix for more).
This article is protected by copyright. All rights reserved.
Acc
epte
d A
rtic
lePROPOSITION 2. (Steady State) In steady state (quality-adjusted) firm size is
∗ =
¡1−
1−Ω¢− ¡+
1−¢¡
1− 1−Ω
¢ ¡1− 1¢−
Θ
¡+
1−¢ (33)
The associated rates of growth of quality, variety and income (GDP) per capita are, respec-
tively:
∗ =
£1−Ω+
¡+
1−¢¤
Θ−
1−Ω¡1− 1¢¡
1− 1−Ω
¢ ¡1− 1¢−
Θ
¡+
1−¢ µ
+
1−
¶; (34)
∗ ≡Ã
!∗=
1− ; (35)
Ã
!∗− =
Ã
!∗− =
1− + ∗ (36)
Proof. See the Appendix.
Figure 1 plots the CI locus and the EI locus and performs comparative statics exercises.
For example, imagine a business environment that accommodates informational opacity
in financial markets or that (perhaps unintentionally) facilitates resource diversion via lax
accounting rules. These features yield a low stealing cost () and lead to intense profit
stealing, that is, a low Θ. Figure 1, Panel A, shows that a drop in Θ rotates the EI
locus clockwise: for given firm size, , firms can meet the reservation rate of return of
households only through a drop in the investment rate, , that compensates the lower Θ.
The intensification of stealing does not affect the CI locus, in contrast, because it equally
erodes benefit and cost of investment.12 As Panel A shows, the overall effect of the shock
is greater steady-state firm size and higher investment. Put differently, the increase in
12The cost of stealing does not affect the slope or position of the CI locus because managers steal net
profits. Thus, a change in their stealing cost changes the cost and the return from investment equally.
This article is protected by copyright. All rights reserved.

Acc
epte
d A
rtic
lethe severity of stealing makes the intermediate sector more concentrated, via the fall in
product variety, and prompts incumbents to invest more aggressively. Several studies that
take market structure as given conclude that worse corporate governance frictions tend to
depress investment.13 This mechanism is also present in our economy and is captured by
the investment drop for given firm size . However, our general equilibrium analysis shows
that conclusions become nuanced when the endogeneity of the market structure is taken into
account. In equilibrium, the slowdown of firm entry and the resulting consolidation of the
market structure is both the consequence of and the condition for incumbents that invest
more aggressively in product improvement.
Figure 1, Panel B, considers an increase in the intensity of empire building (Ω). This
pushes the CI locus up because empire building raises the manager’s return to investment.
Accordingly, it yields higher investment and larger firm size . The latter occurs because
in equilibrium a more concentrated market structure is required to support firms that invest
more aggressively.
Finally, it is useful to examine under what conditions corporate governance frictions have
larger effects. The slope of the loci affects the magnitude of the effects. For example, it is
immediate that incumbents respond with more aggressive investment to a lower Θ especially
when the private return to investment in quality () and the markup (1) are higher
(these imply a steeper CI locus, as noted). Intuitively, larger private investment returns and
markups strengthen the impact of this corporate governance friction through the market
structure consolidation.
13See Stein (2003) and Driver and Coelho Guedes (2012) for reviews and, e.g., Xiao (2013) for evidence.
This article is protected by copyright. All rights reserved.

Acc
epte
d A
rtic
le5. Dynamics and Welfare: Analytical Results
This section briefly describes the dynamics of the model. The objective is twofold: to have
an analytical guide for assessing the quantitative effects of changes in corporate governance
and to articulate the channels through which such changes affect welfare. The model is so
tractable that we obtain an explicit solution for the equilibrium path of the state variable
and analytical expressions for all other variables as functions of (see the Appendix for the
details.)
The economy evolves through three stages of development. In the most advanced stage,
there is both entry and incumbents’ investment in product improvement. In earlier stages,
either the entry rate or the investment rate, or both, are zero. To focus the discussion on the
role of corporate governance, we consider only the most advanced stage.14 Our main result
is as follows.
PROPOSITION 3. (Dynamics and Welfare) Consider the transition path of an economy
that starts at time 0 with initial condition 0 and converges to ∗. Under the approximation
Θ ∼= 0 (i.e., sufficiently large), evolves according to the linear differential equation
= · (∗ − ) (37)
where
≡ (1− )
∙µ1−
1− Ω
¶µ1
− 1¶Θ
−µ+
1−
¶¸ (38)
14The qualitative properties of the global dynamics are as in Peretto (2015). We refer the reader interested
in the details of the global dynamics to that paper.
This article is protected by copyright. All rights reserved.

Acc
epte
d A
rtic
leTherefore, the explicit solution for the economy’s path is
() = 0− + ∗
¡1− −
¢ (39)
Using this result, the utility flow is
log
µ
¶= logΛ+
µ
1− + ∗
¶+
∙
1−Ω
0
µ1
− 1¶+
1−
¸µ1− ∗
0
¶¡1− −
¢
(40)
where
Λ ≡∙1− +
(− )2
Θ
¸
21− (41)
Upon integration, welfare is
0 =logΛ
− | z initial consumption
+
1− + ∗
(− )2| z
steady-state growth
+
1−Ω0
¡1− 1¢+
1−(− ) (− + )
µ1− ∗
0
¶| z
transition
(42)
Proof. See the Appendix.
According to Proposition 3, the welfare associated to the transition to the steady state
∗ from initial condition 0 has three components: the intercept component (or level effect)
due to initial consumption, the steady-state growth component (or growth effect), and the
transitional component. The expression for 0 assigns to each of the three components
its own weight reflecting discounting and the duration of the transition. The transitional
component captures a key channel at work in this economy. Consider an increase in the
intensity of stealing or of empire building that triggers a consolidation of the industry, so
that over time it converges to larger firms that grow faster, i.e., a transition with ∗ 0.
While such consolidation entails an acceleration of incumbents’ investment (quality growth),
This article is protected by copyright. All rights reserved.

Acc
epte
d A
rtic
leit also entails a slowdown of entry and thus a loss of product variety relative to the baseline
path. To see it, recall the definition of firm size , which gives us:
=
=
21−
1− ⇒ =
1− −
(43)
Throughout the transition to the higher ∗, the rate of entry falls below its steady-state
value (1− ). In other words, the model exhibits a dynamic quality/variety trade-off
that manifests itself as a trade off between firm size and firm growth on one side and the
mass of firms on the other.
We can also compute analytically how a shock to a parameter that governs the intensity
of profit stealing or empire building affects households’ welfare, from any initial condition.
Denoting the pre-shock and post-shock steady states as 0 and 1, respectively, we obtain
1 − 0 =1
−
"log
µΛ1
Λ0
¶+
1 − 0
− +
1−Ω0
¡1− 1¢+ 1
1−− + 1
µ1− 1
0
¶# (44)
where 1 is the eigenvalue in (38) associated with the new value of the parameter. The first
term in square brackets captures the effect on initial consumption, the second reflects the
steady-state growth change, and the third reflects the change in entry (variety growth) along
the transition. In line with the discussion above, consider an increase in the intensity of profit
stealing, causing a drop inΘ. The first term is positive because initial consumption increases,
i.e., Λ1Λ0. The second term is also positive, reflecting the acceleration of incumbents’
investment. The third term is negative because firms become larger (industry consolidation),
implying a slowdown of entry (product variety growth) along the transition. Consequently,
the increase of profit stealing leads to a welfare loss if the transitional effect of slower firm
entry is larger than the sum of the positive effect on incumbents’ investment in product
This article is protected by copyright. All rights reserved.
Acc
epte
d A
rtic
lequality and the initial effect due to the higher consumption-output ratio. This occurs when
the weight on the third term in square brackets is large relative to the weights on the first
two terms. In particular, expression (44) shows that, while the first two terms have weights
1 and 1(− ), respectively, the weight on the third term depends on several things, most
prominently the private investment return, , the mark-up 1, 0, and the love of variety
parameter . The expression suggests that, following an increase in the intensity of profit
stealing (resulting in a drop in Θ), economies with high , which have large firms that
invest aggressively, and with strong love-of-variety in production, high , are more likely to
suffer. In the next section we use expression (44) to assess the welfare effects of changes in
fundamentals that drive corporate governance.
6. Dynamics: Quantitative Analysis
In recent decades, reforms both in advanced and emerging countries have modified the rules
governing the activity of auditors, the prerogatives of boards of directors, the allocation
of power among corporate stakeholders, the punishment of corporate frauds, the disclosure
requirements in capital markets (OECD, 2012). In this section we study, through the lens
of the model, the adjustment process of an economy hit by a corporate governance shock.
The exercise has mainly the purpose of illustrating the main mechanisms of the model and
relating them to the evidence of Section 1. Specifically, the growth effects of a corporate
reform will be shown first for a U.S.-like economy, for which there is consensus on the set
of technological and market structure parameters, and then for economies that differ from
this on the quality of governance dimension. While the model gives prediction on several
This article is protected by copyright. All rights reserved.

Acc
epte
d A
rtic
leindustry and macroeconomic variables, such as the average firm size, the saving rate, the
interest rate, and the growth rate of the gross domestic product, the illustration will focus
on the response of firms’ entry rate, , and on the pace of the quality improvement, , that
captures the reaction of incumbents. The Appendix contains a wider range of results.
6.1. A U.S.-like economy
The baseline parameterization of the U.S.-like economy is summarised in Table 2.A. We
set = 121%, equal to the long run average population growth rate in the United States.
The social return to variety is determined through (35): = 1 − . The U.S. Census
Bureau database indicates that from 1982 to the 2008 crisis firms’ net entry rate was 2.5%,
implying = 05. Over a similar period, Lee and Mukoyama (2015, p.24) and Hathaway
and Litan (2014, p.2) report lower entry rates for the U.S. manufacturing sector, close to
the rate of population growth, implying = 0. Hence we choose a baseline = 025, with
associated = 161%, but also study an economy with = 05. The private return to
quality, , is 16. We infer this by comparing the private and social return on investments.
The investment return that internalises spillover effects would be 1 times the private
return (see (29)). In Jones and Williams (1998) the social rate of return on R&D, a proxy
for investment in product quality, is in the 30-100% range. Taking the lower bound, and
a 5% private rate, = 00503 = 16 with investment spillovers, 1 − , of 83%. While
the implied spillovers magnitude might seem surprisingly large, Baumol (2002, pp.133-134)
reaches a similar conclusion through two different methods for estimating uncompensated
external benefits. Nevertheless, as with , given the elusive nature of externalities, we study
also an economy with different levels of investment spillovers. The monopolistic price
This article is protected by copyright. All rights reserved.

Acc
epte
d A
rtic
leis 1.3 (and hence = 0769) — within the range of mark-up ratios for the manufacturing
sector (Christopoulou and Vermeulen, 2012). We target a growth rate of per capita output
of 2%, an interest rate of 5%, and = 3% The parameters and are set to match
= 2% and a long run saving rate ( = 1−) of about 10%.15 The resulting investment
rate = − = 160% (see 35 and 36) — coincidentally close to the net entry rate. To
choose a value for the empire building parameter Ω we employ the estimates of Nikolov and
Whited (2014). For a sample of 1438 U.S. firms over the period 1992-2008 they find an empire
building distortion of 0.7% gross profits (Π+ in our model) and an average investment rate
of 12% (see their Tables VI.b and II, respectively).16 Since in our model the steady state
firm’s value is Π, with = 5%, the distortion Ω corresponds to 07% · (512 + ), and
Ω ' 1%. For the effort cost of resource diversion we employ a simple quadratic function:
() =1
22 + (45)
Following equation (18), the manager’s reaction function satisfies
1− = + . (46)
The founder’s marginal benefit and cost of giving away a higher share of profits to the
manager (see 21) is
1
(1− ) = 1− . (47)
15According to data from the Bureau of Economic Analysis the gross national saving rate in the post-war
period fluctuated between 15% and 20%. Allowing for a depreciation rate of 5-10 percent, we obtain a net
saving rate, as a ratio of GDP, in the interval of 5-15 percent. Our calibration delivers a saving rate in the
middle of this interval.
16A similar investment rate is reported by OECD (2013).
This article is protected by copyright. All rights reserved.

Acc
epte
d A
rtic
leAn improvement in corporate governance, captured by an increase in the parameters and
, causes a rotation of the () (see Figure 2.A), an upward shift of the manager’s reaction
function (46) and of the founder’s decision rule (47) — see Figure 2.B. As a result the share
of profits retained by the founder (1 − ) increases, and the stealing effort declines, as
long as the parameter is sufficiently large to induce a significant shift of the manager’s
reaction function. (Section 6.3 elaborates on the ramifications of such a governance shock
on investments and on firms’ entry).
The values of and are determined by targeting and . Nikolov and Whited (2014)
estimate a 0.01% diversion of profits and cash holdings. Adjusting for 10% of cash and taking
a profit rate of 17% (see their Tables II and III), = 0016%. While this appears to be a low
value, Figure 2.B suggests that to achieve it founders may need to give up a significant share
of profits. Leslie and Oyer (2009) and Muscarella and Vetsuypens (1990) estimate equity
stakes of managers of 36% and 127%, respectively. Kaplan (1989) and Morck et al. (1988)
show estimates closer to the higher value. We set = 10%.
6.2. Steady-state interpretation of the cross-country data
The empirical evidence of Section 1 suggests that in countries with a higher governance index
there is stronger entry dynamics but their incumbent firms appear to be more reluctant to
make investments in intangibles. Figure 3 provides a first quantitative link between this
evidence and the predictions of the model. The figure shows the steady state investment
rate and firm size against the range of governance quality – the variation is generated
through alterations of and in (45) in the [0,1] interval, moved in lock-step to preserve the
same gap of the U.S. specification. When the cost of diverting resources rises, shareholders
This article is protected by copyright. All rights reserved.

Acc
epte
d A
rtic
lecan retain a larger share of firms’ value because they surrender a smaller share to managers,
and possibly because of the diminished stealing effort (Figure 2.B). A diversion-free economy
emerges with = = 1, as these values imply = = 0 andΘ = 1. The range of equilibria
can be read as being generated through downward shifts of the EI curve in Figure 1.A: when
diversion is easier, the return on entry declines, incumbents become larger and invest more
aggressively. Figure 3 gives a quantitative steady state assessment of these associations. A
country with a one point higher governance index comes with about 1% lower investment rate
for economies similar to the United States; the effect is slightly stronger for economies with
higher diversion (lower Θ) – observe that to ease the comparison with the 10-point World
Bank governance index the running variable is Θ× 10. Such a correlation is somewhat high
compared to the coefficient on the governance index in the intangible investment regressions
of Table 1 (e.g., −0.85 in the cross-country one). However, the prediction assumes that
economies are in steady state where the investment response to diversion is the strongest.
Along the transition the investment rate is more modest (see the Appendix). Therefore,
economies farther away from the stationary state have investment rates lower than those
shown in Figure 3.
6.3. Response to reforms
This section explores the consequences of a corporate governance reform through a perma-
nent shock to managers’ ability to divert resources or to managers’ private benefits of empire
building. Agents do not anticipate the arrival of the shock and they perceive it as perma-
nent. Section 5 noted that any governance shock affects the two sources of growth, entry
and incumbents’ investment, in opposite directions: it boosts one and depresses the other.
This article is protected by copyright. All rights reserved.

Acc
epte
d A
rtic
leThis section clarifies the relative importance of the two effects for a U.S.-like economy and
for economies with different levels of variety and investment spillovers.
Section 1 suggested that governance reforms enacted in OECD countries in 2006-2012
increased the World Bank corporate governance 10-point index by approximately 0.3, on
average. The reform is then represented by an alteration of the diversion cost function
() so as to cause a rise of the equilibrium level of Θ by 0.03 (see Figure 2). Managers’
equity stake goes from 10% to 7%; the equilibrium level of stealing is only marginally
affected. The reform lifts the entry rate upward. The increased number of firms, however,
means smaller market size and a reduced profitability of quality improvement. As a result,
the investment rate, , drops (see Figure 4). The 0.12% jump of the entry rate right after
the shock is about twice as much that suggested by the panel regression in column 2 of Table
1 (0.06%) and about half that of the cross-sectional regression in column 1 (0.2%).
Because the estimation of investment spillovers, 1−, and of the social return to variety,
, is notoriously an elusive exercise, we replicated the numerical experiment with stronger
externalities. With a higher 1− the firm’s appropriation of its own investment is smaller.
Therefore, the amplitude of the impulse responses is more modest (see Figure 4) — in Figure
2 a shift of the EI curve has a smaller impact than in the baseline case. Conversely, the
investment and entry responses to the shock are amplified in an economy with stronger
variety externalities — the expected profitability of entry is relatively higher, for a given
number of firms. Table 3 summarises the long-run effects of the three experiments on the
key industry and macro variables. It also reports the welfare effects divided according to
the three components in equation (40): a long run component, which is negative due to the
This article is protected by copyright. All rights reserved.

Acc
epte
d A
rtic
ledrop in investment, a transition component, which is positive because greater entry leads
to a larger variety of intermediate goods, and a level component, which is negative, because
running firms absorbs resources that otherwise could have been consumed.17 Interestingly,
Table 3 shows that in the baseline parameterization the welfare benefit is clearly dominated
by the welfare costs so that overall the governance reform leads to a net welfare reduction.
If a permanent increase in the stealing cost causes an upward shift of the EI curve, a
permanent decline of the empire building parameter Ω induces a downward shift of the CI
curve (see Figure 1). The implications of the two shocks are qualitatively similar (to conserve
space, the impulse response for the empire building shock are not shown). In the long run,
the economy ends up with smaller firms that invest less aggressively. In the short run, the
effects are also comparable: the reduction in Ω leads to a jump in the entry rate and a drop
in the investment rate. The main difference with respect to the diversion experiment is that
investment responds more – the shock has a direct effect on the manager’s incentive to
invest. Thus if the policy objective of a corporate governance reform is to stimulate firm
entry, the intervention should target first managerial resource diversion, as this has a lower
negative impact on incumbents’ investment in product improvement.
7. Conclusion
This paper has investigated the impact of corporate governance frictions on growth in an
economy with endogenous market structure. The analysis reveals that managers’ empire
17Any change in real resource losses directly due to the change in stealing costs shows up in the level
component. Such direct welfare effects play a minor role.
This article is protected by copyright. All rights reserved.

Acc
epte
d A
rtic
lebuilding and resource diversion tend to depress firm entry and increase the concentration
of the market structure. At the same time, these frictions make incumbents invest more
aggressively in product improvement, despite having an ambiguous impact on the investment
return for a given degree of consolidation of the market structure. The welfare impact of
a corporate governance reform is not obvious a priori. Following a reduction of corporate
resource diversion or of empire building, the acceleration in firm entry can boost welfare. Yet,
the less aggressive investment of incumbents induced by the acceleration of entry and by the
resulting adjustment of the market structure can lead to a welfare reduction. We have studied
how the quality of corporate governance before the reform and technological features of the
economy affect the magnitude and relative importance of the entry and investment effects.
Interestingly, our quantitative analysis reveals that, for the baseline parameterization, an
improvement in corporate governance leads to a net welfare reduction.
The paper leaves interesting questions for future research. Since in the model firms en-
ter at the average size, the analysis downplays differences between start-ups and mature
firms. This not only preserves tractability but is also consistent with our goals. The gover-
nance frictions we consider are a more typical feature of relatively established firms, where
management is often separated from ownership. Moreover, as noted, the analysis can help
capture the experience of established businesses that have frequently been protected by poli-
cies accommodating empire building and informational opacity. Nonetheless, an integrated
approach that differentiates between start-ups and more mature firms, allowing for different
start-up and post-entry governance frictions, would probably give a more accurate quanti-
tative assessment of the importance of such frictions. This could also change the welfare
This article is protected by copyright. All rights reserved.

Acc
epte
d A
rtic
lepredictions about corporate governance reforms. We leave this and other issues to future
research.
SKEMA Business School, Université Côte d’Azur (GREDEG) and OFCE Sciences Po
Michigan State University
Duke University
This article is protected by copyright. All rights reserved.
Acc
epte
d A
rtic
leReferences
[1] Aghion, P., Howitt, P. and Mayer-Foulkes, D. (2005). ‘The effect of financial devel-
opment on convergence: theory and evidence’, Quarterly Journal of Economics, vol.
120(1), pp. 173—222.
[2] Akcigit, U., Alp, H. and Peters, M. (2014). ‘Lack of selection and imperfect manage-
rial contracts: firms dynamics in developing countries’, Working Paper, University of
Pennsylvania.
[3] Bargeron, L. L., Lehn, K. M. and Zutter, C. J. (2010). ‘Sarbanes-Oxley and corporate
risk-taking’, Journal of Accounting and Economics, vol. 49(1-2), pp. 34—52.
[4] Baumol, W. J. (2002). The Free-Market Innovation Machine: Analyzing the Growth
Miracle of Capitalism, Princeton University Press, Princeton, NJ.
[5] Bebchuk, L. A. and Roe, M. J. (1999). ‘A theory of path dependence in corporate
ownership and governance’, Stanford Law Review, vol. 52(1), pp. 127—170.
[6] Bencivenga, V. R. and Smith, B. D. (1991). ‘Financial intermediation and endogenous
growth’, Review of Economic Studies, vol. 58(2), pp. 195—209.
[7] Bloom, N. and Van Reenen, J. (2010). ‘Why do management practices differ across
firms and countries?’, Journal of Economic Perspectives, vol. 24(1), pp. 203—24.
[8] Caselli, F. and Gennaioli, N. (2013). ‘Dynastic management’, Economic Inquiry, vol.
51(1), pp. 971—996.
This article is protected by copyright. All rights reserved.
Acc
epte
d A
rtic
le[9] Chang, H.-J. (2007). The East Asian Development Experience: The Miracle, the Crisis
and the Future, University of Chicago Press, Chicago.
[10] Cooley, T. F., Marimon, R. and Quadrini, V. (2014). ‘Risky investments with limited
commitment’, Working Paper, University of Southern California.
[11] Cooley, T. F. and Quadrini, V. (2001). ‘Financial markets and firm dynamics’,American
Economic Review, vol. 91(5), pp. 1286—1310.
[12] Christopoulou, R and Vermeulen, P. (2012). ‘Markups in the euro area and the US over
the period 1981—2004: a comparison of 50 sectors’, Empirical Economics, vol. 42(1), pp.
53—77.
[13] De Nicolò, G., Laeven, L. and Ueda, K. (2008). ‘Corporate governance quality: trends
and real effects’, Journal of Financial Intermediation, vol. 17(2), pp. 198—228.
[14] Driver, C. and Coelho Guedes, M. J. (2012). ‘Research and development, cash flow,
agency and governance: UK large companies’, Research Policy, vol. 41(9), pp. 1565—
1577.
[15] Eisfeldt, A. L. and Rampini, A. (2008). ‘Managerial incentives, capital reallocation, and
the business cycle’, Journal of Financial Economics, vol. 87(1), pp. 177—199.
[16] Etro, F. (2009). Endogenous Market Structures and the Macroeconomy, Springer, New
York.
[17] Fulghieri, P. and Suominen, M. (2012). ‘Corporate governance, finance, and the real
sector’, Journal of Financial and Quantitative Analysis, vol. 47(6), pp. 1187—1214.
This article is protected by copyright. All rights reserved.

Acc
epte
d A
rtic
le[18] Greenwood, J. and Jovanovic, B. (1990). ‘Financial development, growth, and the dis-
tribution of income’, Journal of Political Economy, vol. 98(5), pp. 1076—1107.
[19] Guner, N., Ventura, G. and Xu, Y. (2008). ‘Macroeconomic implications of size-
dependent policies’, Review of Economic Dynamics, vol. 11(4), pp. 721—744.
[20] Hathaway, I. and Litan, R. E. (2014). ‘What’s driving the decline in the firm formation
rate? A partial explanation’, Economic Studies, at Brookings.
[21] Immordino, G. and Pagano, M. (2012). ‘Corporate fraud, governance and auditing’,
Review of Corporate Finance Studies, vol. 1(1), pp. 109—133.
[22] Jensen, M. (1986). ‘Agency costs of free cash flow, corporate finance and takeovers’,
American Economic Review, vol. 76(2), pp. 323—329.
[23] Jones, C. I. and Williams, J. C. (1998). ‘Measuring the social return to R&D’, Quarterly
Journal of Economics, vol. 113(4), 1119—1135.
[24] Jwa, S.-H. (2002). The Evolution of Large Corporations in Korea: A New Institutional
Economics Perspective of the Chaebol, Edward Elgar, Cheltenham.
[25] Kaplan, S. N. (1989). ‘The effects of management buyouts on operating performance
and value’, Journal of Financial Economics, vol. 24(2), pp. 217—54.
[26] Khanna, T. (2000). ‘Business groups and social welfare in emerging markets: existing
evidence and unanswered questions’, European Economic Review, vol. 44(4-6), pp. 748—
761.
This article is protected by copyright. All rights reserved.

Acc
epte
d A
rtic
le[27] Kose, J., Litov, L. and Yeung, B. (2008). ‘Corporate governance and risk-taking’, Jour-
nal of Finance, vol. 63(4), pp. 1679—1728.
[28] La Porta, R., Lopez-de-Silanes, F., Shleifer, A. and Vishny, R. (2000). ‘Investor pro-
tection and corporate governance’, Journal of Financial Economics, vol. 58(1-2), pp.
3—27.
[29] Leslie, P. and Oyer, P. (2009). ‘Managerial incentives and value creation: evidence from
private equity’, Working Paper, Stanford University.
[30] Morck, R., Shleifer, A. and Vishny, R. W. (1988). ‘Management ownership and market
valuation: an empirical analysis’, Journal of Financial Economics, vol. 20(1-2), pp.
293—315.
[31] Morck, R., Wolfenzon, D. and Yeung, B. (2005). ‘Corporate governance, economic en-
trenchment, and growth’, Journal of Economic Literature, vol. 43(3), pp. 655—720.
[32] Muscarella, C. J. and Vetsuypens, M. R. (1990). ‘Efficiency and organizational structure:
a study of reverse LBOs’, Journal of Finance, vol. 45(5), pp. 1389—1413.
[33] Nikolov, B. and Whited, T. (2014). ‘Agency conflicts and cash: estimates from a dy-
namic model’, Journal of Finance, vol. 69(5), pp. 1883—1921.
[34] OECD (2010). Competition and Corporate Governance, OECD, Paris.
[35] OECD (2012). Corporate Governance, Value Creation and Growth, OECD, Paris.
[36] OECD (2013). Supporting Investment in Knowledge Capital, Growth and Innovation,
OECD, Paris.
This article is protected by copyright. All rights reserved.

Acc
epte
d A
rtic
le[37] Peretto, P. F. (1996). ‘Sunk costs, market structure and growth’, International Economic
Review, vol. 37(4), pp. 895-923.
[38] Peretto, P. F. (1999). ‘Cost reduction, entry, and the interdependence of market struc-
ture and economic growth’, Journal of Monetary Economics, vol. 43(1), pp. 173—195.
[39] Peretto, P.F. (2015). ‘From Smith to Schumpeter: a theory of take-off and convergence
to sustained growth’, European Economic Review, vol. 78, pp. 1-26.
[40] Restuccia, D. and Rogerson, R. (2008). ‘Policy distortions and aggregate productivity
with heterogeneous plants’, Review of Economic Dynamics, vol. 11(4), pp. 707—720.
[41] Stein, J. C. (2003). ‘Agency, information and corporate investment’, in (G.M. Constan-
tinides, M. Harris and R. M. Stulz, eds.), Handbook of the Economics of Finance 1, pp.
111—165, Elsevier, North Holland.
[42] Stulz, R. M. (1990). ‘Managerial discretion and optimal financing policies’, Journal of
Financial Economics, vol. 26(1), pp. 3—27.
[43] Wurgler, J. (2000). ‘Financial markets and the allocation of capital’, Journal of Finan-
cial Economics, vol. 58(1-2), pp. 187—214.
[44] Xiao, G. (2013). ‘Legal shareholder protection and corporate R&D investment’, Journal
of Corporate Finance, vol. 23, pp. 240—266.
This article is protected by copyright. All rights reserved.

Acc
epte
d A
rtic
lePanel A: Corporate Governance and Entry Rate (percent) Panel B: Corporate Governance and Incumbents' Investment Rate in Intangibles (percent) Panel C: Other Outcomes
Cross-section,
countries
Panel, countries
(1) (2) (3) (4) (5) (6) (7) (8) (9) (10) Corporate governance index 0.78** 0.22** Corporate governance index -0.85*** -0.84*** -0.13*** -0.12*** -0.14*** -0.08*** -0.01*** -2.46e+07***
(0.33) (0.09) (0.23) (0.28) (0.009) (0.010) (0.01) (0.01) (0.0001) (4.78e+06)
Macroeconomic Controls Macroeconomic Controls GDP per capita 0.0001** GDP per capita -0.00004** -0.00005* -8.16e-07 1.49e-07 -3.13e-06*** -7.38e-07*** 919.13***
(0.00004) (0.00002) (0.00002) (5.41e-07) (5.89e-07) (7.00e-07) (3.86e-08) (187.01)
Dependency ratio -0.04 Dependency ratio -0.51** -0.59** -0.006 -0.03*** 0.005 -0.007*** 2988841(0.14) (0.22) (0.24) (0.006) (0.007) (0.006) (0.0004) (2261559)
Population growth rate -0.79 Population growth rate -2.86e-08 6.43e-10 -0.013 -0.04** -0.068*** -0.0096*** -3.01e+07***(0.58) (1.76e-08) (2.08e-08) (0.015) (0.016) (0.013) (0.001) (6621510)
GDP growth rate 0.06*** Public Expenditure/GDP -0.13 -0.15 -0.039*** -0.05*** -0.013*** 0.0001 1.86e+07***(0.02) (0.16) (0.17) (0.004) (0.005) (0.004) (0.0003) (3160760)
Credit Market Depth Credit Market Depth Credit bureau coverage -0.01 Credit bureau coverage -0.007 0.0001 0.0003 -0.0001*** 731420***
(0.02) (0.02) (0.0003) (0.0003) (0.00002) (142033)
Credit registry coverage -0.03 Credit registry coverage 0.03 0.002*** 0.002 -0.0002*** 546218***(0.03) (0.03) (0.0005) (0.0004) (0.00003) (112444)
Entry Costs Firm-level Controls Time (days) to start a business -0.001 Firm age (years) -0.00002 -0.0006 -0.001** -0.001* -0.0001 1137420***
(0.003) (0.0004) (0.0005) (0.0003) (0.0003) (0.00002) (278643)
Procedures to build warehouse -0.09 Firm no. of employees 5.53e-06* 2.11e-06 6.88e-06*** 6.98e-06*** 1.04e-07 203353***(0.09) (3.22e-06) (2.01e-06) (1.47e-06) (1.85e-06) (7.99e-08) (34200)
Time (year) & Country dummies No YesObservations 87 583 Observations 40 38 158,496 148,647 460,461 434,727 215,149 171,527Notes . This table reports coefficient estimates and standard errors for the effect of corporate governance quality on firm entry (Panel A), incumbents' investment in intangibles (Panel B), incumbents' fixed assetinvestment and size (Panel C). The WB governance index is on a 1-10 scale. The dependent variable is: cols. 1-2) firms' entry rate in the country in 2012, in %; cols. 3-4) average incumbents' investment inintangibles in the country in 2013, in %; cols. 5-6) incumbent firm investment in intangibles in 2013, in %; cols. 7-8) incumbent firm investment in intangibles in the year, in % (the panel is over 2010-2014); col. 9)incumbent firm fixed investment in 2013, in %; col. 10) incumbent firm sales in 2013, in U.S. dollars. See also the Appendix. *, **, *** denote significant at the 10, 5, and 1%, respectively.
Cross-section, firmsFixed Inv. Size
(percent) (sales)
Table 1 Empirical Backround. Corporate Governance, Firm Entry and Incumbents' Investments
Cross-section, countries
Cross-section, firms
Panel, firms
This article is protected by copyright. All rights reserved.

Acc
epte
d A
rtic
leCorporate Governance
α φ β λ a b Ω
0.167 0.715 2.2 0.0121 0.9001 0.8999 0.01
Ratioz n y h em Θ S
3.37 1.60 1.61 2 9.24 0.1 89.99 0.016
HouseholdsProduction and Entry
Table 2 Baseline Economy, Steady State
Panel A: Parameters
x*
θ
0.769
σ
0.25
Percentages
Notes . α: private return to product quality; σ: social return to product variety; θ: markup parameter; φ: fixed operating costparameter; β: fixed entry cost parameter; λ: population growth rate; a and b: stealing cost function parameters; Ω: empirebuilding parameter.
Panel B: Steady State
Notes . x: firm size; z: investment rate; n: entry rate; y: per capita output growth rate; h: saving rate;em manager's equity share; Θ: founders' appropriation factor; S: share of profits stolen.
This article is protected by copyright. All rights reserved.

Acc
epte
d A
rtic
leRatio
x z n r h em Θ S
3.37 1.60 1.61 5 9.24 0.1 89.99 0.016
3.32 1.33 1.61 4.73 8.89 0.07 92.99 0.016Notes . for the meaning of the symbols, see note to Table 2. r: interest rate.
x z Level Trans. Long RunBaseline -1.6 0.27 -0.18 2.34 -8.46α=0.13 -4.93 -0.19 -0.18 1.66 -6.06σ=0.5 -5.92 -0.30 -0.18 5.56 -13.20
Table 3 Corporate Governance Reform (Higher Stealing Costs)
Δ Steady StatePanel B
Δ Welfare
Before the reform
After the reform
(percentages)
Percentages
Notes . The reform causes em to decline by 3 percentage points (see also Fig. 5). Panel
A reports the steady state values before and after the reform. Panel B reports steadystate differences relative to the pre-shock values. The changes of z are expressed inpercentage points. The remaining figures are proportional percentage deviations.Welfare calculations are based on equation (39). The last two rows of Panel B refer toeconomies with stronger externalities.
(percentages)
Panel A
This article is protected by copyright. All rights reserved.
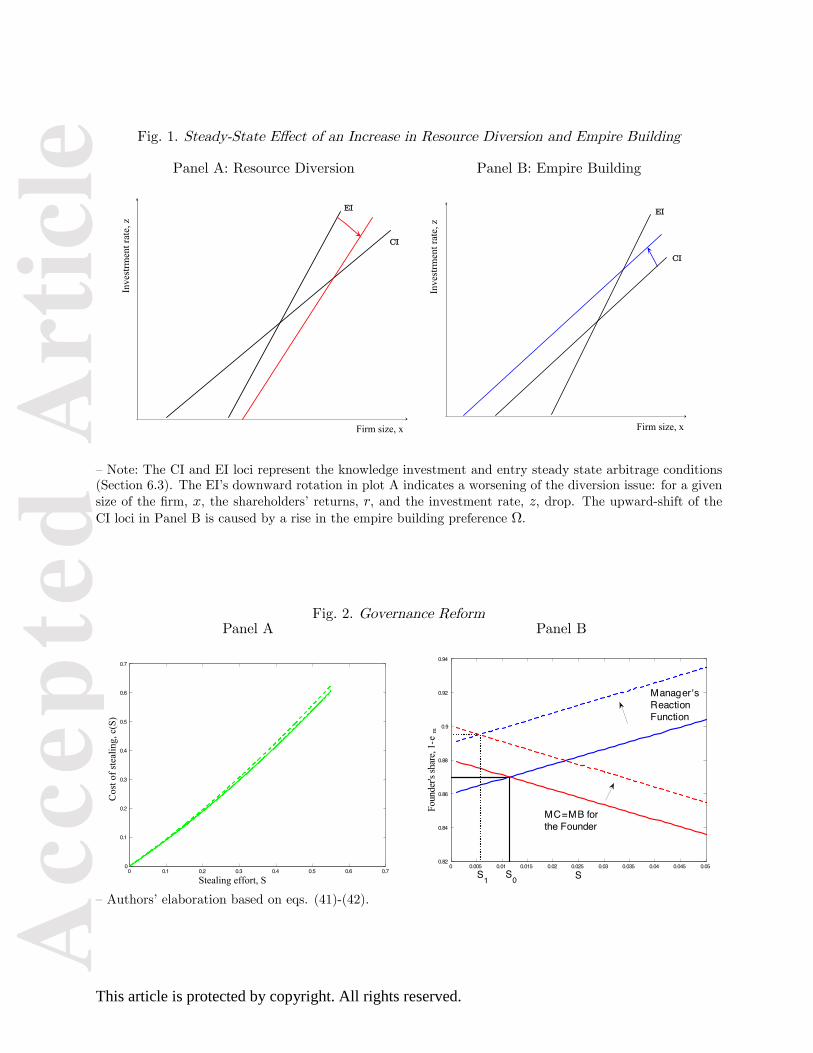
Acc
epte
d A
rtic
le Fig. 1. Steady-State E§ect of an Increase in Resource Diversion and Empire Building
Panel A: Resource Diversion Panel B: Empire Building
ñ Note: The CI and EI loci represent the knowledge investment and entry steady state arbitrage conditions (Section 6.3). The EIís downward rotation in plot A indicates a worsening of the diversion issue: for a given size of the Örm, x, the shareholdersí returns, r, and the investment rate, z, drop. The upward-shift of the CI loci in Panel B is caused by a rise in the empire building preference ,.
Fig. 2. Governance ReformPanel A Panel B
0 0.1 0.2 0.3 0.4 0.5 0.6 0.70
0.1
0.2
0.3
0.4
0.5
0.6
0.7
Cos
t of
stea
ling, c
(S)
0 0.005 0.01 0.015 0.02 0.025 0.03 0.035 0.04 0.045 0.050.82
0.84
0.86
0.88
0.9
0.92
0.94
Foun
der's
sha
re, 1
-em
S
Manager'sReactionFunction
MC=MB forthe Founder
S0S1Stealing effort, S
ñ Authorsí elaboration based on eqs. (41)-(42).
CI
EI
CI
EI
Firm size, xFirm size, xIn
vest
rmen
t rat
e, z
Inve
strm
ent r
ate,
z
This article is protected by copyright. All rights reserved.

Acc
epte
d A
rtic
leFig. 3. Quality of Corporate Governance and Rate of Investment
8 8.5 9 9.5 100.5
2
Investment Rate (z)
Founder's appropriation, Θ x 108 8.5 9 9.5 10
0
2
6
10
Relative Firm's Size
Founder's appropriation, Θ x 10
USA
1.1(slope)
0.81(slope)
NoDiversion,PositiveEmpireBuilding
No Diversion,No Empire Building
Note: is the founders appropriation factor. The relative rms size is a percentage deviation from thesmallest one (when = 1). Rates are in percentages.
Fig. 4. Impulse Responses to Stealing Cost Shock
0 20 40 60 80 1000.35
0.3
0.25
0.2
0.15
0.1
0.05
0Investment Rate (z)
Time (years)0 20 40 60 80 100
0
0.02
0.04
0.06
0.08
0.1
0.12
0.14
0.16Entry Rate (n)
Time (years)
Higher VarietyExternalities, σ
Higher VarietyExternalities, σ
Higher InvestmentSpillovers, 1 α
Higher InvestmentSpillovers, 1 α
Note: Rates are in percentages. A shock to c(s) in Eq. (40) leads to a decline of and em by 3 percentage points (for the initial state of the economy see Table 2.b). In the baseline case (bold lines) the entry rate jumps up by about 0.12% after the reform. The dashed and dotted lines refer, respectively, to economies with a higher (0:5) and lower (0:13):
This article is protected by copyright. All rights reserved.