FINANCIAL MARKETS - Digital Economist is facilitated by financial markets and the use of different...
22
Financial Markets and Instruments Copyright 2003, Douglas A. Ruby FINANCIAL MARKETS In an aggregate economy, we often find that the expenditure needs of one sector (households) is often less than income or revenue resulting is a surplus of funds. These funds are often known as savings and more specifically, private savings. The opposite is often true for the business sector and government sector of the economy. For these sectors expenditure often exceeds revenue such that there is a need to borrow funds from the household sector. The transfer of funds from one sector to another via lending and borrowing is facilitated by financial markets and the use of different financial instruments. There are two methods by which these funds may be transferred. One method is through financial intermediation that involves the use of a commercial banking system to attract deposits from individuals and institutions and make loans to other individuals or institutions. The key assets for these banks are money (cash balances) and deposits. These banks act as intermediaries between lender and borrower hopefully minimizing the transactions costs (risk-assessment of borrower and liquidity needs of the depositor) related to this type of financial activity. A second method is known as direct finance when borrower and lender directly interact through activity in equity or debt markets. In this case the lender will buy financial instruments (shares of stock or bonds) being sold by borrowers. Households with surplus funds (income in excess of spending needs) will seek to choose the best way in which to use these funds. This best way depends on the liquidity needs of the household, attitudes towards financial risk, and desired return when these funds are made available to financial markets. These households may deposit these funds in a commercial bank or savings institution, maintain a high level of liquidity (easy and quick access to these funds), be exposed to small risk of capital loss, and earn a small return in the form of simple interest. An alternative would be to buy a share of stock or a bond where the returns may be higher in the form of dividends, interest, and capital gains. However, this activity exposes the individual to more risk (default in the case of bonds and capital losses) and less liquidity (having to convert these types of financial instruments into cash). Other possibilities would be to buy commodity assets or properties that often pay no interest or dividends but may appreciate over time. The returns may be greater combined with more risk and less liquidity. A final option available to the household would be to remain perfectly liquid, that is, avoid financial risk and hold these surplus funds as cash (money) even though this type of asset pays no return (interest, rents, dividends, or capital gains). The information made available by financial markets (as well as commodity and property markets) to the owners of these surplus funds helps in making decisions about the best use of these funds. However, because perfect liquidity is an option, money plays a special role in financial market activity.
Transcript of FINANCIAL MARKETS - Digital Economist is facilitated by financial markets and the use of different...

Financial Markets and Instruments
Copyright 2003, Douglas A. Ruby
FINANCIAL MARKETSIn an aggregate economy, we often find that the expenditure needs of one sector(households) is often less than income or revenue resulting is a surplus of funds. Thesefunds are often known as savings and more specifically, private savings. The opposite isoften true for the business sector and government sector of the economy. For thesesectors expenditure often exceeds revenue such that there is a need to borrow funds fromthe household sector. The transfer of funds from one sector to another via lending andborrowing is facilitated by financial markets and the use of different financialinstruments.
There are two methods by which these funds may be transferred. One method is throughfinancial intermediation that involves the use of a commercial banking system to attractdeposits from individuals and institutions and make loans to other individuals orinstitutions. The key assets for these banks are money (cash balances) and deposits.These banks act as intermediaries between lender and borrower hopefully minimizingthe transactions costs (risk-assessment of borrower and liquidity needs of the depositor)related to this type of financial activity. A second method is known as direct financewhen borrower and lender directly interact through activity in equity or debt markets. Inthis case the lender will buy financial instruments (shares of stock or bonds) being soldby borrowers.
Households with surplus funds (income in excess of spending needs) will seek to choosethe best way in which to use these funds. This best way depends on the liquidity needs ofthe household, attitudes towards financial risk, and desired return when these funds aremade available to financial markets. These households may deposit these funds in acommercial bank or savings institution, maintain a high level of liquidity (easy and quickaccess to these funds), be exposed to small risk of capital loss, and earn a small return inthe form of simple interest. An alternative would be to buy a share of stock or a bondwhere the returns may be higher in the form of dividends, interest, and capital gains.However, this activity exposes the individual to more risk (default in the case of bondsand capital losses) and less liquidity (having to convert these types of financialinstruments into cash). Other possibilities would be to buy commodity assets orproperties that often pay no interest or dividends but may appreciate over time. Thereturns may be greater combined with more risk and less liquidity. A final optionavailable to the household would be to remain perfectly liquid, that is, avoid financial riskand hold these surplus funds as cash (money) even though this type of asset pays noreturn (interest, rents, dividends, or capital gains).
The information made available by financial markets (as well as commodity and propertymarkets) to the owners of these surplus funds helps in making decisions about the bestuse of these funds. However, because perfect liquidity is an option, money plays a specialrole in financial market activity.

Financial Markets and Instruments
Copyright 2003, Douglas A. Ruby
Financial InstrumentsTwo common capital market financial instruments are Stocks (or Equities) and Bonds. Ashare of stock conveys certain ownership rights to the holder such that person may sharein the profits or earnings of a publicly-held corporation and, in some cases, have a voicein how that company is managed. A bond is a debt contract explicitly stating the amountborrowed and to be repaid, date of repayment, and interest to be paid by the borrower tothe lender. Bonds may be issued (sold) by large corporations, municipal governments, orthe federal government to meet budgetary needs.
Bonds and the Inverse Relationship between Asset Prices and Asset YieldsA Bond represents a long-term debt contract between a borrower and lender. The termsof this contract include the face value (the amount borrowed per bond issued) F, a rate of(annual or semi-annual) interest r, and the maturity (the date when the face amount mustbe repaid) N. The coupon of the bond R represents the periodic dollar amount of interestpaid to the lender/owner of the bond over the life of that bond. This coupon amount iscalculated simply by taking the product of the face value and rate of interest:
R = (F)(r)
The price (or present value) of a 30 year bond that pays an annual coupon of 'R' and has aface value of 'F' to be repaid at the end of 30 years is defined by the following formula:
Pbond = PVbond = Σ[t=1,30] Rt(1+r)-t + F(1+r)-30
or using the formula for a sum of a geometric series:
= (R/r)[1 - (1+r)-30] + F(1+r)-30
If the current rate of discount 'r' is the same as the printed interest rate on the bond(so that R/r = F) then:
Pbond = F
As 'N' approaches infinity, (the Bond never matures) for any rate of discount, thisexpression reduces to:
Pbond = (R/r)
which is known as the present value of a perpetuity and provides a simple formula forunderstanding the relationship between asset prices 'P' and asset yields 'Ψ' (or interestrates).
Ψ = R / Pbonds
Bonds are first issued in primary bond markets where the seller represents the borrowerand the buyer represents the lender. Activity in primary markets is modeled by the flow

Financial Markets and Instruments
Copyright 2003, Douglas A. Ruby
of funds model. The coupon payment and face value are fixed by contract over the life ofthe bond. If market interest rates are the same as the printed rate of interest on the bond,then the price (present value) of that bond is the same as its face value-- the bond sells atpar-value. If market interest rates have risen, prior to the sale of the bond, such thatinvestors can receive higher yields on competing investments; then, the market price ofthe bond will be less than its face value. The bond will sell at a discount. If the oppositeis true such that market rates have fallen, then the bond will sell at a premium -- themarket price will exceed its face value. Bond prices move in the opposite direction ofmarket interest rates.
In order to maintain liquidity with respect to bond (and stock) ownership, a secondarybond market also exists for the buying and selling of these bonds at current interestrates. This buying and selling does not represent any new debt activity but rather theexchange of bonds (and other securities) among investors.
Activity in secondary markets often reflects changes in the economic environment wherebuying and selling activity is driven by changes in inflationary expectations, changingattitudes towards (credit and interest rate) risk, and changes in perceived uncertaintyabout the future.
Figure 1, An Increase in Inflationary Expectations
For example, suppose that information becomes available such that investors revise theirinflationary expectations upward. Given that inflation lowers the real rate of returnreceived by lenders (or those holding bonds and other securities), these individuals willbegin to sell existing bonds in the secondary market. This selling creates a surplus ofbonds being offered such that bond prices must fall to induce potential buyers to acceptthese securities in an accelerating inflationary environment. With this decline in bondprices, secondary bond yields increase:
(R / Pbonds ↓ ) = Ψ ↑
When yields do rise, investors have the option of buying existing bonds in the secondarybond market or new bonds in the primary market. In order for these new bonds to be

Financial Markets and Instruments
Copyright 2003, Douglas A. Ruby
competitive with existing bonds, a higher rate of interest must be offered. This higher rateof (nominal) interest will reflect the upward revision of expected inflation.
Table 1: A Bond Market Example:Secondary Market Primary Market(Existing Bonds) (New Debt Issues)F = $1,000 F = $1000i = 5%, R = $50 i = 8%, R = $80Ψ' = 8%Pmkt = $625.00 = ($50/Ψ') Pmkt = $1,000 = $80/iYield = $50/$625.00 = 8% Yield = $80/$1,000 = 8%
Secondary markets also facilitate portfolio adjustments in reaction to a changingeconomic environment. For example given two different assets one being higher risk (aBBB rated 5 year corporate bond) and the other no risk (i.e., a Treasury Note), we wouldexpect that:
ΨBBB-Corporate > ΨT-Note such that: ρ = (ΨBBB-Corporate � ΨT-Note)
If for some reason the perceived risk of holding debt instruments were to increase, wewould expect to observe a flight to quality � a selling the corporate bonds and buying ofTreasury instruments.
Secondary Market Activity – “A Flight to Quality” Figure 2a, Risky Debt Instruments Figure 2b, Risk-free Debt Instruments
Increased selling will drive the price of Corporate bonds down and buying activity willdrive the price of Treasury Notes up or:
PBBB-Corporate ↓ ΨBBB-Corporate ↑ and PT-Note ↑ ΨT-Note ↓
Such that:
(ΨBBB-Corporate↑ � ΨT-Note ↓ ) ⇒ ρ ⇑

Financial Markets and Instruments
Copyright 2003, Douglas A. Ruby
This increase in perceived risk will translate into higher risk premiums in secondarymarkets and thus require that riskier borrowers pay a higher premium (higher nominalinterest rates) in primary markets.
Common StockCommon stock represent ownership (equity) shares in publicly-held corporations. Theserights of ownership often include a share in the profits (earnings) of that corporation.However, these earnings may be used either as a source of internal financing, known asretained earnings, or paid out as a periodic payment to the owners as dividends. Thevalue of the corporation is thus based on the present value of this stream of earnings �E�whether they are paid out or not.
Pshare = Σ Et(1+r)-t
Much is made of the price/earnings (PE) ratio of different common stocks with a lowPE being often preferred to a high PE for a given stock. This ratio is often used as abenchmark to determine if that corporation is over-valued (too high) or under-valued (toolow) by the stock market based on its current trading price. This ratio is nothing morethan the reciprocal of a simple yield calculation based on the present-value of a perpetuityformula:
Passet = (R/r)or
Ψasset = R/Passetor
Ψstock = E/Pshare
The earnings-over-price ratio is often in percentage form and by taking the reciprocal wedefine an integer expression that is often easier for use in making comparisons amongdifferent stocks. However, for purposes of evaluation, we can use the reciprocal of the PEand compare with investments of equivalent risk and maturity or against the yields onperhaps safer marketable assets.
What is unique about equity instruments is that their value often is based not just on theperiodic return (earnings in this case) but also the expected rate of growth for thecorresponding corporation. The rate of return on common stock is often (usually for well-established mature corporations) calculated by the following formula:
Ψ = E/Pshare + E[g]
where 'Ψ' is the rate of return, 'E' represents annual earnings (or dividend), 'P' is thepurchase price of a share of the stock, and E[g] is the expected growth rate in futureearnings.
Given annual earnings of $1.00/share, a purchase price of $30.00 per share, and anexpected growth rate of 5%; the rate of return would be:

Financial Markets and Instruments
Copyright 2003, Douglas A. Ruby
Ψ = ($1.00/$30.00) + .05 = .0333 + .05 = 8.33%
This formula can also be used to determine the appropriate price to be paid per share ofstock given expected growth rates in the annual dividend and some measure of the rate ofreturn 'r*' based on similar investments. Solving for 'P', we have:
Pshare = E/(r* - g)
or given annual earnings per share of $2.00, an expected (or required) rate of return of8%, and an expected growth rate in future earnings for that company of 3% per year; wecalculate the purchase price to be:
P = $2.00 / (0.08 - 0.03) = $40.00Quite often the explanation for the existence of both buyers and sellers of the same sharesof stock is that buyers expect higher growth rates in future dividends relative to theexpectations of sellers.
Treasury Bills, Money Market and other Short-term Debt instruments.Most Treasury bills and/or commercial paper (due to their short maturity -- 1 year or less)are discounted at the time of sale rather than pay some coupon payment over the holdingperiod. This discount is calculated as follows:
Discount = (F)(r)(d) 365
where F is the face value (the amount borrowed or principal), 'd' is the days to maturity,and r is the market interest rate.
For example, if a business needs to borrow roughly $1,000,000 for six months (182 days)to finance seasonal inventory needs, and current market rates are 10% then the amount ofthe discount would be:
($1,000,000)(0.10)(182) = $49,683365
thus the actual amount borrowed by that business firm is:
$1,000,000 - $49,683 = $950,137
However the full $1,000,000 is repaid at the maturity date.

Financial Markets and Instruments
Copyright 2003, Douglas A. Ruby
The rate of return (the yield) on this short-term debt instrument is equal to the amount ofthe discount divided by the amount borrowed or:
$49,683 = Ψ = 5.23% semi-annually$950,137
or an effective rate of:
(1.0523)2 - 1 = 10.7% annually
Note: the effective yield �Ψeffective�, for �k� compounding periods and annual interest rate�r�, is calculated as follows:
Given: FVk = P(1 + r/k)k
Ψeffective = [P(1 + r/k)k - P]/P
= (1 + r/k)k - 1
Trading of money market instruments of particular face value �F� is based on pricesoffered for these instruments in secondary markets or via auction in primary markets. Theyield is then computed as follows:
Ψ = F � Poffered = F - 1 Poffered Poffered
such that as Poffered ↑ , Ψ ↓ .
The Expected Total Rate of Return (ETRR)Since stocks, bonds and money market instruments are marketable securities, thepotential exists for changes in market price which may translate into capital gains orperhaps capital losses. A capital gain occurs when the selling price of a security 'Ps'exceeds the purchase price 'Pp'. If the selling price is less than the purchase price then theowner will incur a capital loss.
Capital gains and losses can either enhance or reduce the normal rate of return on a givensecurity. For this reason, acquisition of these securities are often based on expectations offuture capital gains in addition to the normal rate of return. This overall yield orExpected Total Rate of Return 'ETRR' defined as follows:
ETRR = [R + E[Ps]- Pp]/Pp = rn + (E[Ps]- Pp)/Pp
where 'rn' represents the normal rate of return (current yield -- R/Pp) on the security and'E[Ps]' represents the expected selling price of the security at some point in the future.

Financial Markets and Instruments
Copyright 2003, Douglas A. Ruby
Expectations about the selling price (E[Ps]) depend on expected changes in marketinterest rates (such that these prices and interest rates will move in opposite directions),and/or expected rates of growth in earnings (in the case of equities). Lower marketinterest rates or higher rates of growth can lead to capital gains on the sale of these assetssuch that the ETRR is greater than the current yield. If market interest rates are expectedto increase or growth rates in earnings are revised downwards, then these assets may sella price below the price paid and thus a capital loss results. In this case the ETRR may beless than the current yield and, in the case of an extreme increase in interest rates, benegative with a significant decline in the selling price (the capital loss more than offsetsthe normal yield). In situations where investors expect the total rate of return to benegative on a financial asset, cash will present a suitable alternative given that:
TRRcash = 0.
Thus solid reasons may exist for holding cash in a portfolio of financial assets eventhough cash does not pay any type of periodic return. In the expectation of capital losseson marketable securities, principal may be preserved by holding cash.
Cash as a Financial AssetIn any economy, money plays several roles:
• To act as a medium of exchange to facilitate the payment of income andpurchase of goods and services.
• To act as a unit of account--a measure by which all prices are established, and• To act as a store of value -- that is to alter the timing of spending decisions
relative to earning income.
Because of the dual role of money as a medium of exchange and store of value, severaleconomic variables affect the desire to hold this type of financial asset.
Money can be narrowly defined as anything that may be used for purchasing goods andservices or more broadly to include anything of value that may be used for trade. Twocommon definitions as established by monetary authorities are M1 and M2:
• M1 = Currency + Demand Deposits (checking accounts or current accounts)• M2 = M1 + Time Deposits (simple interest-bearing savings accounts)
The first measure is known as the narrow definition of money that represents componentsthat are readily accepted as payments for goods or to satisfy debts. The second measure isknown as a broader definition that includes savings accounts that can easily be convertedinto currency or demand deposits.
Individuals typically hold cash balances (money) to allow for making transactions (that isbuying goods and services) and the paying of bills and other obligations. The volume ofthese transactions tends to be proportional to that individual's level of income such that

Financial Markets and Instruments
Copyright 2003, Douglas A. Ruby
the demand for these cash balances in support of transactions needs will also beproportional to income �Y�.
Md = k[+](Y)
This is best understood by looking at the cash balances held by an individual over time.Assume that a person is paid a monthly salary of $3000 and paid twice a month. On the1st and 15th of each month, this person is paid $1500 which is held as cash or as a depositin a checking (current) account. Over the days that follow these cash balances are run-down as this person buys goods and services or pays his monthly bills such that towardsthe end of a pay period, his cash balances are close to $0. However, at the beginning ofthe next pay period $1500 is received and his cash balances are restored. Thus at thebeginning of a pay period this person is holding (demanding) $1500 and towards the endof the pay period he is holding some amount close to $0. On average this person has cashbalances of about $750 [($1500-0)/2] or 25% of his/her monthly income.
Figure 3, A time profile of Cash Balances
This represents part of his individual demand for cash balances or money. By aggregatingover all individuals and institutions in the economy we can derive the aggregate demandfor money as the sum of individual demands. With an increase in income (either for anindividual or in the aggregate) we would expect that more is held such that the averageamount held over time increases.
MdT = f[+](Y) note: Y = NGDP in the aggregate.
One might question the notion that at the end of a pay period, cash balances are equal to$0. Cash balances not used for transactions represent a source for savings (a surplus offunds). The individual might choose to keep these "savings" in the form of currency of ondeposit in a checking account. But by making this choice, the individual is giving up theopportunity to earn some form of return (or yield) on these funds in the form of interest,profits, or rents. As yields rise, the opportunity cost of holding cash balances alsoincreases inducing the individual to minimize his cash holdings. The individual can dothis by buying an alternative financial asset in the form of a time deposit (or certificate ofdeposit), share of stock, or a bond. When one of these assets is purchased (or demanddeposit balances are converted to time deposit balances) the individual's cash balances arereduced.

Financial Markets and Instruments
Copyright 2003, Douglas A. Ruby
The expression for money demand can be amended as follows:
Md = f (Y[+], i[-]).
We can therefore state that money demand is directly proportional to Nominal GDP andinversely related to market interest rates and yields on different financial assets. Insummary, economic performance in the real sector (changes in income) or activity infinancial markets (buying and selling of stocks, bonds, and related financial instrumentsaffecting these asset yields) can influence the demand for money/cash balances.
The Inventory-Theoretic Model of Money DemandOne approach to derive the functional form of money demand is that based on inventorycontrol theory common in many models of management. In this approach, optimal cashbalances are based on minimizing the total cost of holding these cash balances. This totalcost is based on the sum of making transactions into or out of cash and the increasingopportunity cost of holding larger balances.
This cost relationship can be expressed as follows:
min Costs = b(Y/M) + M(i)
where:• b = the cost of making a single cash transaction
(i.e., withdrawals from a checking or savings account or conversion into stocks and bonds)• Y = Income.• i = a market-determined interest rate or yield.• M = the size of Cash Balances.
The ratio Y/M represents the number of transactions made per time period. For exampleis an individual's income is $2000 per month and he/she holds on average $400 at anypoint in time, that individual will make 5 transactions per month. A smaller amount heldas cash balances results in a greater number of transactions being made per time periodand thus an increase in the cost of holding these cash balances. Given this secondcomponent, larger cash balances result in greater opportunity costs measured in foregoneinterest income. Thus a tradeoff exists where an individual may want to hold larger cashbalances to minimize the transactions costs but may want to hold smaller balances toreduce the opportunity cost of holding these balances. These cost relationships may beseen in the following diagram:

Financial Markets and Instruments
Copyright 2003, Douglas A. Ruby
Figure 4, Cost of holding Cash Balances
Minimizing the sum of these costs implies finding the lowest point on the total cost curvein the above diagram. This point occurs at point 'A' corresponding with optimal balancesof 'M*' This optimal value may also be found by using calculus and taking the derivativeof the cost function with respect to M and setting the result equal to zero:
dC/dM = -bY/M2 + i = 0or
bY/M2 = ior
M* = (bY/i)1/2 = (bY)1/2(i)-1/2
also known as the "square-root" rule. This result can be generalized as:
M* = (bY)α(i)-β
The exponent �α� represent the income elasticity of money demand and �β� represents theinterest elasticity of money demand. These elasticities measure the sensitivity of cashbalance holdings to changes in the corresponding variable (income or the interest rate).
The above result states that optimal cash balances M* are directly related to income 'Y'and inversely related to interest rates 'i'. Lower interest rates lead to greater demand forcash balances as shown in the diagram below (left). An increase in Income (NGDP) willhave the same effect by shifting the Money Demand function outward (below right):

Financial Markets and Instruments
Copyright 2003, Douglas A. Ruby
Money Demand Figure 5a, Change in the Interest Rate Figure 5b, A Change in Income
The Money Supply ProcessGiven the unique characteristics of money as a financial asset, manipulation of theMoney Supply presents an opportunity for policy makers (Central Bankers) to affect thestructure of interest rates and influence real economic activity. The use of monetarypolicy can target one particular short-term rate � the Federal Funds Rate that serves as abarometer of liquidity within the banking system. Typically as the Federal Funds rateincreases or decreases, other short-term rates tend to follow. Thus monetary policy maybe used to control the flow of funds through financial intermediaries � commercial banks.
Changes to the money supply can occur due to:
• changes in behavior (i.e., a desire to hold more cash 'C' relative to demanddeposits 'DD' or time deposits 'TD'),
• changes in expectations (optimism or pessimism on behalf of the non-bank publicor perhaps among bank managers), or
• changes in monetary policy (reserve requirements and open market operations).
To best understand how these changes occur, it is useful to look at the basic componentsand sample values of the balance sheets of the non-bank public, the commercial banks(that also includes balances for their treasury bond-trader customers), and the centralbank (i.e., the Federal Reserve):

Financial Markets and Instruments
Copyright 2003, Douglas A. Ruby
Commercial Non-Bank Public Banking System The Federal ReserveAssets Liabilities Assets Liabilities Assets LiabilitiesC = $2000 rR = $500 DD = $5000 C = $2000DD = $5000 xR = $500 TD=$0 R = $1000TD = $0
L = $3000 L = $3000SC = $1000 SF = $2000
In the above example, C represents currency in circulation -- an asset of the non-bankpublic and a liability of the central bank. DD refers to demand deposits, TD refers to timedeposits � deposits being assets of the non-bank public and an liabilities of commercialbanks. rR (required reserves), xR (excess reserves) , and their sum R represent totalreserves and are non-income producing assets of the commercial banks and a liability ofthe central bank respectively. L refers to loans outstanding -- a liability of the non-bankpublic and an income-producing asset for the commercial banks. Finally S (= SC + SFheld by commercial banks and the Fed respectively) is a reference to securities,specifically government securities (treasuries), that are liabilities of the FederalGovernment.
The M1 Money MultiplierIf we focus on M1 = C + DD, we find that this measure represents the main liquidfinancial assets of the non-bank public. In a similar manner we can define the monetarybase B (also known as high-powered money), as the sum of the main liabilities of centralbank. If we relate these two measures to one-another, we can define a link between thetwo, known as the Money Multiplier. This is accomplished as follows:
M1 = [1 + (C/DD)](DD)
B = rdDD + xR + C = [rd + (xR/DD) + (C/DD)](DD)
where rd represents the reserve requirements on demand deposits. Rearranging, we canwrite:
DD = B / [rd + (xR/DD) + (C/DD)]thus
M1 = {[1 + (C/DD)] / [rd + (xR/DD) + (C/DD)]}B
orM1 = mm (B)
where
mm = {[1 + (C/DD)] / [rd + (xR/DD) + (C/DD)]}and
mm > 1.0 if (rd + xR/DD) < 1.0
Financial Markets and Instruments
Copyright 2003, Douglas A. Ruby
This money multiplier represents the ability of a fractional-reserve banking system tocreate money within the economy, that is, for each dollar of reserves the money supply issome multiple of that value.
See: The Digital Economist: http://www.digitaleconomist.com/m_mult.html to experiment withchanges the in relevant parameters of the money multiplier.
Increasing the reserve requirement, an infrequent tool of monetary policy, �rd� will reducethe value of the money multiplier and thus when holding the monetary base constant,reduce the money supply. Increases to the excess reserve-demand deposit ratio 'xR/DD'(pessimism among bank management) will have a similar affect on the money supply.Finally, changes in the currency-demand deposit ratio 'C/DD' will directly affect themoney multiplier -- holding more cash in relative terms will reduce the money supply.
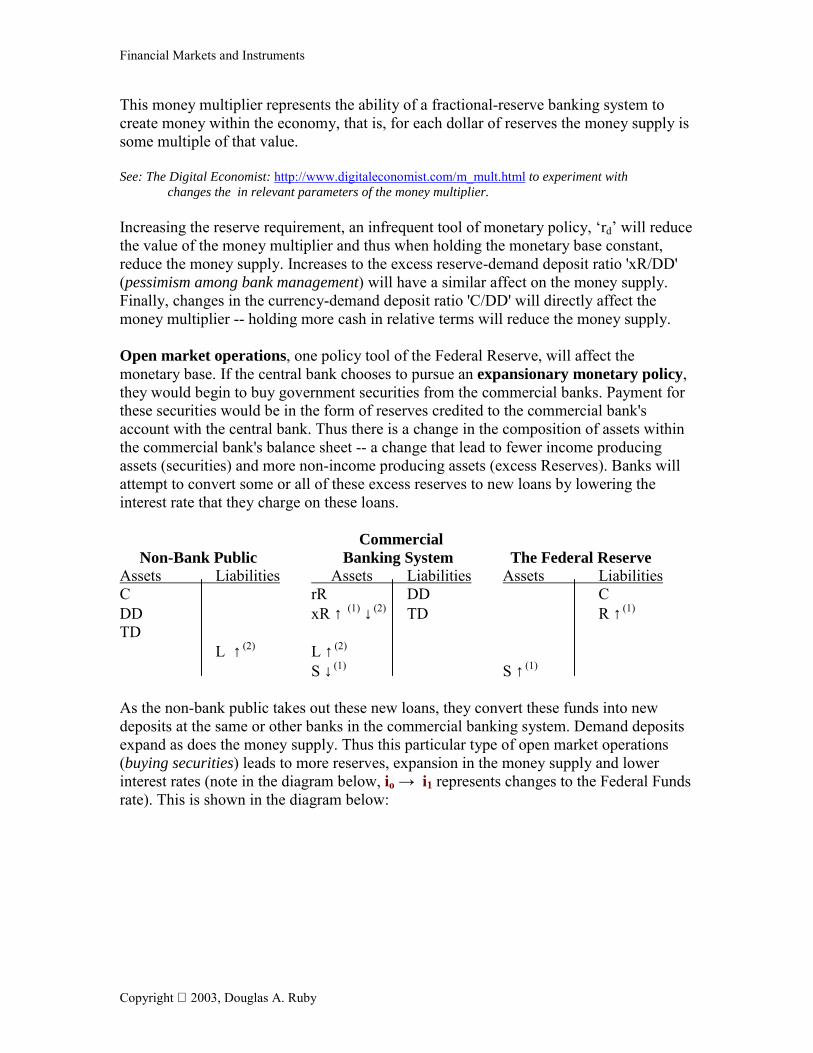
Open market operations, one policy tool of the Federal Reserve, will affect themonetary base. If the central bank chooses to pursue an expansionary monetary policy,they would begin to buy government securities from the commercial banks. Payment forthese securities would be in the form of reserves credited to the commercial bank'saccount with the central bank. Thus there is a change in the composition of assets withinthe commercial bank's balance sheet -- a change that lead to fewer income producingassets (securities) and more non-income producing assets (excess Reserves). Banks willattempt to convert some or all of these excess reserves to new loans by lowering theinterest rate that they charge on these loans.
Commercial Non-Bank Public Banking System The Federal ReserveAssets Liabilities Assets Liabilities Assets LiabilitiesC rR DD CDD xR ↑ (1) ↓ (2) TD R ↑ (1)
TDL ↑ (2) L ↑ (2)
S ↓ (1) S ↑ (1)
As the non-bank public takes out these new loans, they convert these funds into newdeposits at the same or other banks in the commercial banking system. Demand depositsexpand as does the money supply. Thus this particular type of open market operations(buying securities) leads to more reserves, expansion in the money supply and lowerinterest rates (note in the diagram below, io → i1 represents changes to the Federal Fundsrate). This is shown in the diagram below:

Financial Markets and Instruments
Copyright 2003, Douglas A. Ruby
Figure 6, Money Supply and Money Demand
Contractionary monetary policy would do just the opposite. The central bank wouldsell government securities to the commercial banks, removing reserves from the system,causing these banks to curtail their loan activity and raising the interest rates charged onloans.
The Federal Reserve System and Central BankingThe Federal Reserve System, the Central Bank of the United States, was created by an actof Congress in 1913. Originally, the �Fed� was designed as a decentralized Central Bankwith 12 District banks located throughout the U.S. and the Board of Governors �BOG�located in Washington D.C. However, over time the development and direction ofmonetary policy has migrated from these District banks to the BOG. Also by design, theFed is both a quasi-public / quasi-private institution. Public in that the 7 members of theBOG are appointed by the President to staggered single 14 year terms and confirmed byCongress. Private in that the assets of the Fed are privately owned through stock ownedby commercial banks as ownership shared in their local District bank.
The Fed is a system composed of roughly 3000 member commercial banks (nationallychartered banks must be a member of the Federal Reserve System � State chartered bankshave the option of joining), 12 District Banks and 25 Branch District Banks. Inaddition the system includes the seven-member Board of Governors and a twelvemember Federal Open Market Committee � the FOMC. It is the FOMC; composed ofthe 7 Governors, 4 District Bank presidents serving on a rotating basis, and the Presidentof the N.Y. District Bank that is responsible for providing directives guiding OpenMarket Operations.

Financial Markets and Instruments
Copyright 2003, Douglas A. Ruby
Figure 7, The Federal Reserve System
The Fed has four main areas of responsibility:• To act as lender of last resort or the banker’s bank. In this role, the Fed is
responsible for maintaining liquidity and solvency of the private commercialbanking system.
• To maintain the purchasing power of the currency; that is, to promote pricestability
• To promote stable economic growth by providing for an elastic currency to meetthe needs of a dynamic market economy.
• To manage the international value of the Dollar on foreign exchange markets.
Sometimes these responsibilities are complementary but more often one goal is inconflict with another. Inflation fighting can sometimes come at the expense of economicgrowth. Injecting liquidity into the banking system in times of crisis can also lead tofuture inflationary pressure in the economy.
The above responsibilities can often be thought of as primary goals. The Fed will work toachieve certain goals by influencing different intermediate targets. These targets include:interest rates (specifically the Federal Funds rate), Money supply targets (M1 or M2), ora particular exchange rate. These targets are affected through three tools of monetarypolicy.
• Open Market Operations -- the buying and selling of Government Securities inthe open market thus injecting or removing liquidity from the banking system.These operations will have direct effect on the Monetary Base,
• Changes to Reserve Requirements (thus changing the value of the MoneyMultiplier), or
• Changes to the Discount Rate.

Financial Markets and Instruments
Copyright 2003, Douglas A. Ruby
Open market operations as described above, is the most common tool used in theimplementation of monetary policy. For example, if the goal is to fight inflation, the Fedwill set a target of a higher Federal Funds rate (the directive will be to buy and, morelikely, sell securities on the open market to achieve this target rate). A higher FederalFunds rate will be an indication of less liquidity in the banking system and thus higherinterest rates charged by these banks to their customers. With higher borrowing rates,certain investment projects will become less profitable and thus investment spending willdecline. With the reduction in this investment spending, aggregate expenditure (NominalGDP) should also decline. Less spending in the demand-side of the economy shouldeliminate any upward pressure on prices that may exist.
See: The Federal Reserve Website for more: http://www.federalreserve.gov/general.htmalso: Monetary Policy: http://www.newyorkfed.org/pihome/addpub/monpol
Interest rates thus act as a barometer of changing expectations, reaction to newinformation about economic events and of changes in monetary policy In addition interestrates provide the linkage between financial markets and the real economy. Changes in themoney supply, the buying and selling of financial assets in secondary markets, or theissue and acquisition of financial assets in primary markets all affect returns to lendersand more importantly the cost of borrowing. It is these borrowing costs that affectinvestment spending decisions and thus real economic activity.

Financial Markets and Instruments
Copyright 2003, Douglas A. Ruby
Be sure that you understand the following concepts and terms:• Financial Markets• Direct Finance• Indirect Finance• Financial Intermediary• Primary (Financial) Market• Secondary (Financial) Market• Stocks• Bonds• Money Market Instrument• Yield• Present Value• Present Value of a Perpetuity• Discount• Earnings• Dividends• Price-Earnings Ratio• Expected Total Rate of Return• Medium of Exchange• M1 & M2
• Demand Deposits• Time Deposits• Required Reserves• Excess Reserves• Reserve Requirements• Open Market Operations• Central Bank• The Quantity Equation• Money Velocity
Suggested Readings:• Blustein, Paul, The Chastening, Inside the Crisis That Rocked the Global Financial
System and Humbled the IMF, 2001, Perseus Book Group.• Friedman, Milton and Anna Schwartz, Monetary History of the United States (1867-
1960), 1963, Princeton University Press.• Galbraith, John Kenneth, MONEY Whence it Came, Where it Went, 1975, Houghton
Mifflin.• Greider, William, Secrets of the Temple, How the Federal Reserve Runs the Country,1987, Touchstone Books.
• Kindleberger, Charles P., Manias, Panics, and Crashes: A History of FinancialCrises, 2000, John Wiley & Sons.
• Shiller, Robert J., Irrational Exuberance, 2000, Broadway Books.• Woodward, Bob, Maestro, Greenspan's Fed and the American Boom, 2000, Simon
and Schuster.

Financial Markets and Instruments
Copyright 2003, Douglas A. Ruby
Problem Set #5: Present Value Calculations
1. Given the following: n
PVbond = ΣRt(1+r)-t + F(1+r)-n = Rt[1-(1+r)-n] + F__ t=1 r (1+r)n
Calculate the following for a $1000 -- 30 year bond issued at 6% interest.
a. The Present Value of the first five interest payments (rmkt = 6%) :
b. The Present Value of this bond two years after it was originally sold (rmkt = 6%):
c. The Present Value of this bond two years after it was originally sold (rmkt = 8%):
2. Calculate the Total Rate of Return on this bond (from question #1) assuming that youpaid full face value when it was issued and held it for exactly one year. However, in sellingthe bond, market interest rates had risen to 7%:
TRR = Rt + Psold - Ppaid Ppaid
Repeat these calculations for a market interest rate of 5% and 5.5%.

Financial Markets and Instruments
Copyright 2003, Douglas A. Ruby
Problem Set #5, page 23. You have choice between two assets:
i. Asset 1 which pays a single payment �R� of $5000 at the end of 24 months.ii. Asset 2 which pays $2,400 (R1) at the end of 12 months and $2500 (R2)at the
end of 24 months.
The current price of each asset is $3500.
a. Calculate the rate of interest �r� by which you would be indifferent between thesetwo assets.
b. If the market rate of interest is 10% (r = 0.10) and Asset 2 is priced at $3500, howmuch would you be willing to pay for Asset 1 such that the present value of thesetwo assets were equal?
4. Calculate the present value of an asset that pays a net return �R� of $450 annually overa 20 year period with the first payment received at the end of year five. (20 paymentstotal). The annual rate of interest to be used is 5%. Show your work.
5. Which asset would be preferred: the asset described in problem #2 or an asset that pays$400 over a 20 year period with the first payment received at the end of year 1. (20payments total). Use the same rate of interest (5%) and explain your answer. How is adrop in the market rate of interest likely to affect your answer
6. How much would you bid on a $10,000 twelve-month T-bill if your desired annualyield is 8%? How much would you bid on a 6-month T-bills?
7. Calculate the effective rate of interest �re� given an annual rate of interest �r� of 8%compounded quarterly. Perform the same calculate for monthly compounding.

Financial Markets and Instruments
Copyright 2003, Douglas A. Ruby
Problem Set #6: The Money Supply
1. Given the following (all values in billions):
C = Currency in circulationDD = Demand Deposits = $1,200XR = Excess Reserves
rd = reserve requirement on Demand Deposits = 0.10
(C/DD) = 0.25, (XR/D) = 0.05
• Calculate the value of the monetary base.
• What does the monetary base represent?
• Calculate the value of the M1 money supply.
• What is the value of the money multiplier?
If the central bank desires to target M1 at $1,600, by how much should it change themonetary base?
How will this change affect: Currency in Circulation (∆C)?, Demand Deposits (∆DD)?
Explain exactly how Open Market Operations will be used to achieve this goal.
Financial Markets and Instruments
Copyright 2003, Douglas A. Ruby
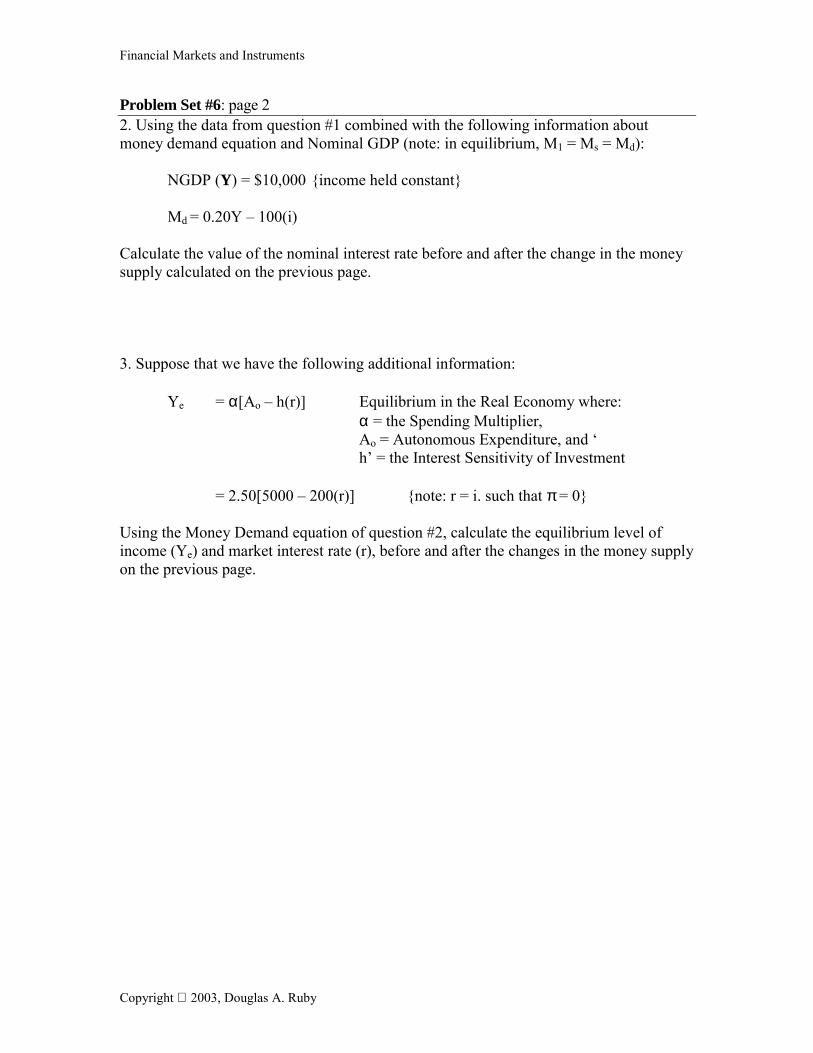
Problem Set #6: page 22. Using the data from question #1 combined with the following information aboutmoney demand equation and Nominal GDP (note: in equilibrium, M1 = Ms = Md):
NGDP (Y) = $10,000 {income held constant}
Md = 0.20Y � 100(i)
Calculate the value of the nominal interest rate before and after the change in the moneysupply calculated on the previous page.
3. Suppose that we have the following additional information:
Ye = α[Ao � h(r)] Equilibrium in the Real Economy where:α = the Spending Multiplier,Ao = Autonomous Expenditure, and �h� = the Interest Sensitivity of Investment
= 2.50[5000 � 200(r)] {note: r = i. such that π = 0}
Using the Money Demand equation of question #2, calculate the equilibrium level ofincome (Ye) and market interest rate (r), before and after the changes in the money supplyon the previous page.