FINANCIAL MANAGEMENT SYSTEMS AND PRACTICES OF GA …
117
FINANCIAL MANAGEMENT SYSTEMS AND PRACTICES OF GA RURAL WOMEN AND THEIR INFLUENCE ON FAMILY WELFARE BY EVELYN BARBARA NELSON THIS THESIS IS SUBMITTED TO THE UNIVERSITY OF GHANA, LEGON, IN PARTIAL FULFILLMENT OF THE REQUIREMENT FOR THE AWARD OF M.PHIL HOME SCIENCE DEGREE JUNE, 2013 University of Ghana http://ugspace.ug.edu.gh
Transcript of FINANCIAL MANAGEMENT SYSTEMS AND PRACTICES OF GA …

FINANCIAL MANAGEMENT SYSTEMS AND PRACTICES
OF GA RURAL WOMEN AND THEIR INFLUENCE ON
FAMILY WELFARE
BY
EVELYN BARBARA NELSON
THIS THESIS IS SUBMITTED TO THE UNIVERSITY OF
GHANA, LEGON, IN PARTIAL FULFILLMENT OF THE
REQUIREMENT FOR THE AWARD OF M.PHIL HOME
SCIENCE DEGREE
JUNE, 2013
University of Ghana http://ugspace.ug.edu.gh

ii
DECLARATION
I, Evelyn Barbara Nelson, hereby declare that except for references to other people‟s
work which have been duly cited, I have personally undertaken this research project
under due supervision. I further affirm that this thesis has neither in whole or part been
presented for another degree elsewhere.
EVELYN BARBARA NELSON
Signature...…………………………
(Student)
Prof. Dr. (Mrs.) Laetitia A. P. Hevi -Yiboe
Signature……………………………
(Major supervisor)
Dr. (Mrs.) Cynthia Gadegbeku
Signature…………………………….
(Co-supervisor)
University of Ghana http://ugspace.ug.edu.gh

iii
ABSTRACT
FINANCIAL MANAGEMENT SYSTEMS AND PRACTICES BY GA RURAL
WOMEN AND THEIR INFLUENCE ON FAMILY WELFARE
The study was conducted to find out the financial management systems and practices
used by rural women in the Ga East District of the Greater Accra Region and their
influence on the welfare of their families. The systematic random sampling technique
was used to select 120 respondents from Danfa and Adoteiman for the study. A
structured interview schedule was developed and used for data collection. The data were
analysed using the Census and Survey Processing (CSPro 4.1) software and Predictive
Analytic software (PSAW 18.1) programmes. The Statistical/Data Analysis (Stata)
software programme was used for the regression analysis and the chi-square test, used to
test the two null hypotheses. It was hypothesized that: HO1: There was no relationship
between financial management by respondents and family welfare; HO2: There was no
relationship between level of income of respondents and family welfare. Most of the
respondents (82%) worked in the informal sector. Respondents received income from
various sources with 88% receiving it from their occupations. The study revealed that a
greater proportion of the total expenditure (53.9%) was on food and the least expenditure
(2.8%) was on non-durable household goods. Respondents used a variety of financial
management systems with the main one being the allowance system (36%) and the least
used system being the family money management system used by (1%) of the
respondents. The respondents also used various financial management practices such as
mental planning of expenditure (89%), bulk purchases (33%) and credit purchases (36%).
The chi-square test revealed there was a statistically significant relationship between
management of finances and family welfare ( = 21.139 df = 1 p = 0.000) hence the
first null hypothesis was rejected. It also revealed there was statistically no significant
relationship between household income and family welfare ( = 3.593 df = 3 p = 0.300)
therefore the second null hypothesis was accepted. To find out if any other extraneous
variable influenced financial management practices, a logit regression analysis was done.
The logit regression analysis revealed that financial management practices (e.g.
unplanned spending) and certain demographic characteristics (e.g. respondents‟ age and
University of Ghana http://ugspace.ug.edu.gh

iv
household size) influenced respondents‟ family welfare both positively and negatively.
For instance, women with higher education (e.g. Senior High School Qualification) have
0.12 higher probability of influencing family welfare positively. On the other hand
household size relates negatively to family welfare. Therefore if a household size is less
by one person, there is a probability of influencing family welfare positively by 0.4
holding all other regressor variables constant. The study revealed that women with high
education were more satisfied with their welfare than those with basic or no formal
education. It is therefore recommended that rural folk be sensitized by relevant
stakeholders like the Ministry of Education to encourage more girls to be educated at
least to the Senior High School level. Public health workers and relevant stake holders
could intensify their education on family planning methods to help control family size,
because the study showed that families with small household size had enhanced welfare
than those with large household size. Department of Family and Consumer Sciences of
the College of Agriculture and Consumer Sciences of the University of Ghana and other
relevant stake holders could organize programmes to enlighten rural women on financial
management practices to help reduce unnecessary household expenditures and save
money.
University of Ghana http://ugspace.ug.edu.gh

v
ACKNOWLEDGEMENT
Special thanks go to the Almighty God for the great things He has done. I wish to express
my sincere gratitude to my supervisors: Prof. Dr. (Mrs.) Laetitia Hevi-Yiboe and Dr.
(Mrs.) Cynthia Gadegbeku for their guidance, advice, and useful suggestions that led to
the successful completion of this thesis. My appreciation goes to the Chief of Danfa, Nii
Afutu Brempong III and the women‟s organizer Madam Victoria Ababio for their help
and support during data collection. With heartfelt gratitude I wish to thank my husband
Mr. Robertson Adjei, and a family friend Mr. George Agbenyo for their help, support and
encouragement. Finally, I thank all Lecturers of the Department of Family and Consumer
Sciences for their constructive criticisms and useful suggestions which also led to the
successful completion of this thesis.
University of Ghana http://ugspace.ug.edu.gh

vi
DEDICATION
This thesis is dedicated to God Almighty for His love, care, and protection; to my
siblings Dorothy, Godfried and Teresa, my husband Robertson for their help and
encouragement and finally to my children Emmanuella and Samuel for their support.
University of Ghana http://ugspace.ug.edu.gh

vii
TABLE OF CONTENT
Page
DECLARATION ................................................................................................................ ii
ABSTRACT ....................................................................................................................... iii
ACKNOWLEDGEMENT .................................................................................................. v
DEDICATION ................................................................................................................... vi
TABLE OF CONTENT .................................................................................................... vii
LIST OF APPENDICES .................................................................................................... xi
LIST OF TABLES ............................................................................................................ xii
LIST OF FIGURES ......................................................................................................... xiii
LIST OF ACRONYMS ................................................................................................... xiv
CHAPTER ONE: INTRODUCTION ........................................................................... 1
1.1 BACKGROUND INFORMATION ................................................................................... 1
1.2 STATEMENT OF THE PROBLEM .................................................................................. 5
1.3 AIM OF STUDY .......................................................................................................... 5
1.4 SPECIFIC OBJECTIVES ................................................................................................ 5
1.5 HYPOTHESES ............................................................................................................ 6
1.6 SIGNIFICANCE OF THE STUDY .................................................................................... 6
1.7 OPERATIONAL DEFINITION OF TERMS ...................................................................... 6
CHAPTER TWO: LITERATURE REVIEW ........................................................... 8
2.1 INTRODUCTION ......................................................................................................... 8
2.1 CONCEPT OF MANAGEMENT ..................................................................................... 8
2.2 CONCEPT OF FINANCIAL MANAGEMENT ................................................................... 9
2.2.1 Budgeting ......................................................................................................... 9
2.2.2 Benefits of financial management .................................................................. 10
University of Ghana http://ugspace.ug.edu.gh
viii
2.2.3 Effective financial management ..................................................................... 11
2.2.4 Family financial problems ............................................................................ 13
2.2.5 Successful Money Management Skills .......................................................... 13
2.3 THE ROLE OF WOMEN IN THE FAMILY ..................................................................... 14
2.4 SOURCES OF INCOME OF FAMILIES ......................................................................... 15
2.5 EXPENDITURE PATTERNS OF FAMILIES IN GHANA ................................................... 16
2.5.1 Household expenditure .................................................................................. 16
2.5.2 Savings of households .................................................................................... 19
2.6 OVERVIEW OF FINANCIAL MANAGEMENT PRACTICES ............................................. 21
2.7 DIFFERENT FINANCIAL MANAGEMENT SYSTEMS USED BY FAMILIES ...................... 23
2.7.1 The family money manager system .................................................................. 23
2.7.2 Whole Wage System ......................................................................................... 24
2.7.3 Allowance system ............................................................................................. 24
2.7.4 Pooling/Shared Management System .............................................................. 24
2.7.5 Independent Management System .................................................................... 25
2.7.6 The Handout System ........................................................................................ 25
2.7.7 The Equal Salary System ................................................................................. 25
2.8 WELFARE OF FAMILIES ........................................................................................... 26
2.9 CONCLUSION ......................................................................................................... 27
CHAPTER THREE: METHODOLOGY ................................................................... 28
3.1 INTRODUCTION ....................................................................................................... 28
3.2 STUDY DESIGN ......................................................................................................... 28
3.3 STUDY AREA ........................................................................................................... 28
3.4 TARGET POPULATION ............................................................................................. 29
3.5 SAMPLE SIZE & SAMPLING PROCEDURE .................................................................. 29
3.6 INSTRUMENT FOR DATA COLLECTION ..................................................................... 31
3.7 PRE-TEST ................................................................................................................ 31
3.8 DATA COLLECTION ................................................................................................. 31
3.9 DATA ANALYSIS ..................................................................................................... 32
University of Ghana http://ugspace.ug.edu.gh

ix
CHAPTER FOUR: RESULTS AND DISCUSSIONS ............................................... 33
4.1 INTRODUCTION ....................................................................................................... 33
4.2 SOCIO-DEMOGRAPHIC CHARACTERISTICS OF RESPONDENTS .................................. 33
4.2.1 Age distribution of respondents .................................................................... 33
4.2.2 Marital status of respondents........................................................................ 34
4.2.3 Ethnic groups ................................................................................................. 35
4.2.4 Religion ......................................................................................................... 35
4.2.5 Educational levels attained by respondents. .................................................. 36
4.2.6 Type of dwelling and residence status ........................................................... 37
4.2.7 Household size .............................................................................................. 37
4.2.8 Main occupation of respondents .................................................................... 37
4.3 INCOME OF RESPONDENTS ...................................................................................... 38
4.3.1 Average Income of Respondents ................................................................... 39
4.4 EXPENDITURE PATTERNS OF RESPONDENTS ........................................................ 40
4.4.1 Average monthly expenditure ....................................................................... 40
4.5 FINANCIAL MANAGEMENT SYSTEMS AND PRACTICES USED BY RESPONDENTS ..... 41
4.5.1 Financial management systems ..................................................................... 41
4.5.2 Ways of spending income ............................................................................... 45
4.5.3 Household financial decision making ............................................................ 46
4.5.4 Purchases ....................................................................................................... 46
4.5.5 Credit purchases ............................................................................................ 47
4.5.6 Family savings and loans............................................................................... 49
4.6 EVALUATION .......................................................................................................... 52
4.7 WELFARE OF FAMILY .............................................................................................. 52
4.7.1 Provision of housing by respondents ............................................................. 53
4.7.2 Families who seek medical treatment ............................................................ 54
4.7.3 Provision of educational needs by respondents ............................................. 55
4.7.4 Satisfaction from savings ............................................................................... 55
4.7.5 Provision of basic needs ................................................................................ 57
4.8 TEST OF HYPOTHESES ............................................................................................. 61
University of Ghana http://ugspace.ug.edu.gh
x
CHAPTER FIVE:SUMMARY, CONCLUSIONS AND RECOMMENDATIONS . 64
5.1 INTRODUCTION ....................................................................................................... 64
5.2 SUMMARY .............................................................................................................. 64
5.3 CONCLUSION .......................................................................................................... 67
5.4 RECOMMENDATION ................................................................................................ 67
BIBLIOGRAPHY ........................................................................................................... 69
University of Ghana http://ugspace.ug.edu.gh

xi
LIST OF APPENDICES
Page
APPENDIX 1: A STRUCTURED INTERVIEW SCHEDULE ..................................... 79
APPENDIX 2: WHOQOL-Bref questionnaire ................................................................ 90
APPENDIX 3: Descriptive Statistics ............................................................................ 102
University of Ghana http://ugspace.ug.edu.gh
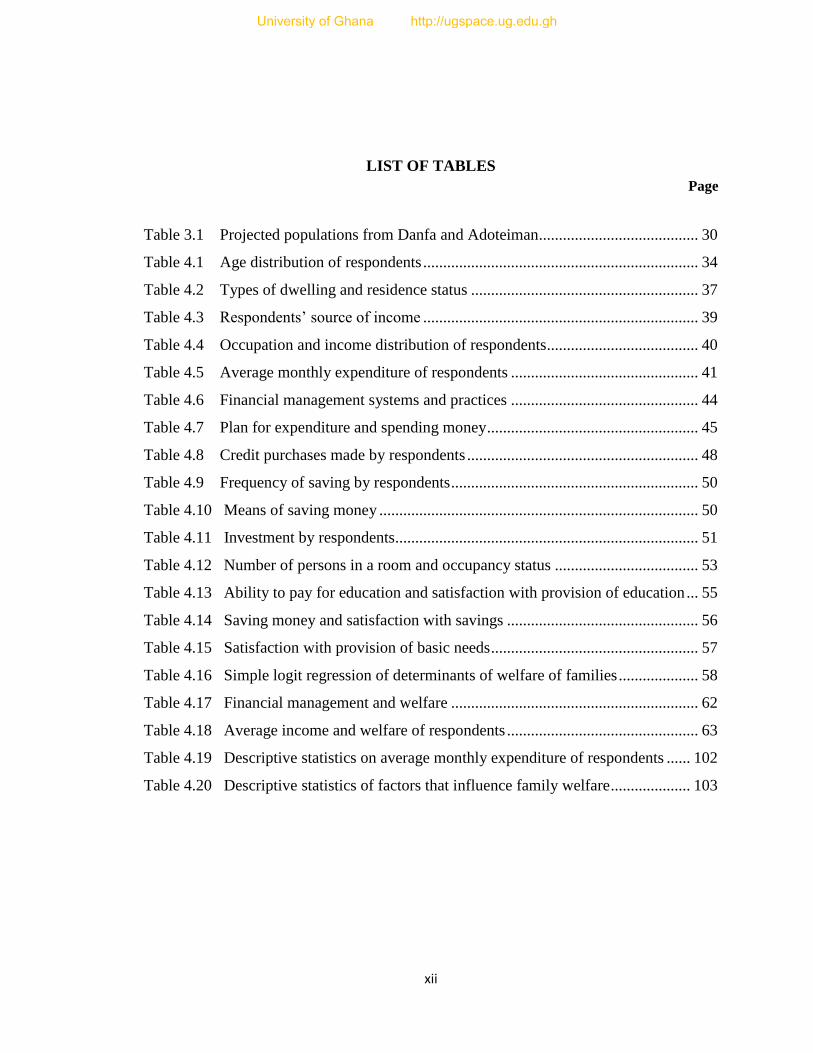
xii
LIST OF TABLES
Page
Table 3.1 Projected populations from Danfa and Adoteiman ........................................ 30
Table 4.1 Age distribution of respondents ..................................................................... 34
Table 4.2 Types of dwelling and residence status ......................................................... 37
Table 4.3 Respondents‟ source of income ..................................................................... 39
Table 4.4 Occupation and income distribution of respondents...................................... 40
Table 4.5 Average monthly expenditure of respondents ............................................... 41
Table 4.6 Financial management systems and practices ............................................... 44
Table 4.7 Plan for expenditure and spending money ..................................................... 45
Table 4.8 Credit purchases made by respondents .......................................................... 48
Table 4.9 Frequency of saving by respondents .............................................................. 50
Table 4.10 Means of saving money ................................................................................ 50
Table 4.11 Investment by respondents............................................................................ 51
Table 4.12 Number of persons in a room and occupancy status .................................... 53
Table 4.13 Ability to pay for education and satisfaction with provision of education ... 55
Table 4.14 Saving money and satisfaction with savings ................................................ 56
Table 4.15 Satisfaction with provision of basic needs .................................................... 57
Table 4.16 Simple logit regression of determinants of welfare of families .................... 58
Table 4.17 Financial management and welfare .............................................................. 62
Table 4.18 Average income and welfare of respondents ................................................ 63
Table 4.19 Descriptive statistics on average monthly expenditure of respondents ...... 102
Table 4.20 Descriptive statistics of factors that influence family welfare .................... 103
University of Ghana http://ugspace.ug.edu.gh

xiii
LIST OF FIGURES
Page
Figure 4.1: Marital status of respondents ........................................................................ 34
Figure 4.2 Ethnic groups of respondents ........................................................................ 35
Figure 4.3 Educational level attained by respondents .................................................... 36
Figure 4.4 Occupation of respondents ............................................................................ 38
Figure 4.5 Financial management systems used by respondents .................................... 42
University of Ghana http://ugspace.ug.edu.gh
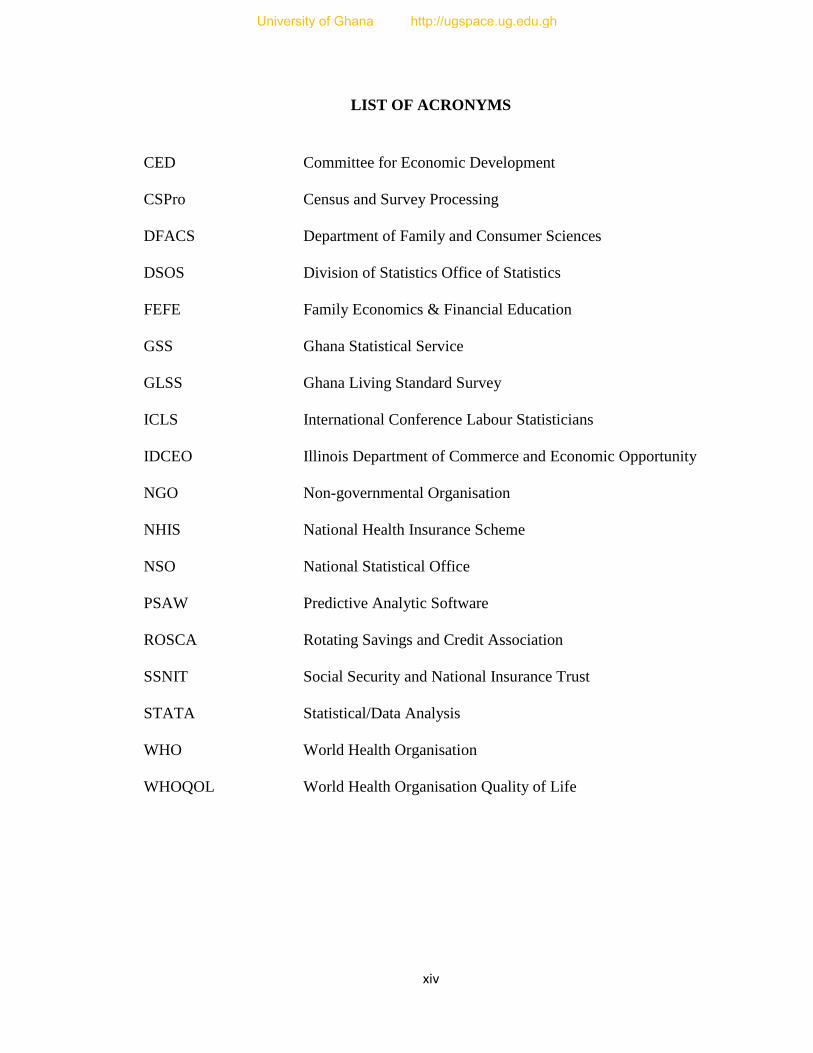
xiv
LIST OF ACRONYMS
CED Committee for Economic Development
CSPro Census and Survey Processing
DFACS Department of Family and Consumer Sciences
DSOS Division of Statistics Office of Statistics
FEFE Family Economics & Financial Education
GSS Ghana Statistical Service
GLSS Ghana Living Standard Survey
ICLS International Conference Labour Statisticians
IDCEO Illinois Department of Commerce and Economic Opportunity
NGO Non-governmental Organisation
NHIS National Health Insurance Scheme
NSO National Statistical Office
PSAW Predictive Analytic Software
ROSCA Rotating Savings and Credit Association
SSNIT Social Security and National Insurance Trust
STATA Statistical/Data Analysis
WHO World Health Organisation
WHOQOL World Health Organisation Quality of Life
University of Ghana http://ugspace.ug.edu.gh

1
CHAPTER ONE
INTRODUCTION
1.1 Background Information
In the past, women played the reproductive role and took care of the family while men
played the productive role. The role of women has however changed because of
increasing financial needs and woman‟s own cultural evolution (Nosé, 2010). In addition
to performing their reproductive role, women now play an important role in the
household economy which is productive role by working in both formal and informal
sectors of the economy in order to earn income to support themselves and their families
(Agyeman, 2007). They now have major responsibilities for the sustenance and welfare
of households and managing of family finance even when they live with a husband
(Brown, 1994).
One of the important goals of families worldwide is financial security. This is achieved if
money is managed effectively to meet present needs and future goals. Family financial
management refers to the day-to-day financial activities necessary to manage income
(McGraw-Hill, 2001). Family financial resources come mostly from the family‟s earned
income. Money comes into the family as income in the form of wages, salaries, profit,
rent, and remittances. Other sources of income include: social security, pension receipts,
educational scholarships, and dividends on investment and interest on savings (Ghana
Statistical Service, 2000).
University of Ghana http://ugspace.ug.edu.gh
2
The central objective of financial management is to improve the family‟s financial well-
being (Godwin, 1990:222). Successful money management requires effective
coordination of personal financial records, personal financial statements and budgeting
activities (McGraw-Hill, 2001). Family financial management focuses on recommended
practices such as: setting financial goals, having a budget, keeping lists and records of
household inventory, credit cards and insurance policies believed to ensure long-term
financial security. Yet studies have found that few people actually implement such
practices (Winter & Muske, 2004). Families face a variety of financial tasks, such as
preparing a budget, dealing with unforeseen expenses and planning for the future (Leigh
and Clark 2000). As a culture we are ignorant of what money is and how to handle it.
Ignorant is not lack of intelligence; it is lack of knowledge on a particular subject such as
basic principles of managing or making financial decisions for our own family (Ramsey,
2003).
Financial management has several benefits. One benefit is that, it helps minimize
personal economic risk that makes people vulnerable to events such as property loss,
disability and medical expenses and even premature death (Deacon and Firebaugh,
1988:131). Another benefit of financial management is that, it helps lessen non-financial
demands on the family‟s time, energy, attention and concern for contingencies. Effective
management of resources including finances enables individuals and families derive
maximum benefit from every resource (Hevi-Yiboe, 2004). For instance with money one
can purchase any material needs by individuals or families, or provide for the family in
times of emergencies, such as sudden illness.
University of Ghana http://ugspace.ug.edu.gh

3
Financial management within the family is a difficult task for many homes. Several
families find out that they run out of financial resources and are helpless at emergency
situations (Prokerala, 2013). To address financial management properly, it is important to
design a strategy to ensure the proper utilization of funds. Proper management of
available resources can bring maximum benefit and satisfaction to individuals and
families (Hevi-Yiboe, 2004). Therefore good resource management must be the goal of
everyone and every family. A study by Chatzky (2003, as cited in Agyeman, 2007) also
reported that one does not have to be a millionaire to be happy, provided one ensures
effective management of one‟s limited income.
The ability to manage is one of the most crucial skills in the world today. In financial
management for instance, there is a wide range of resources such as time, money, energy
and abilities available to the family to manage (Oppenheim, 1972). However, these
resources must be apportioned wisely among the various family needs and desires. For
instance, money or family finance is one of the resources that need to be managed well.
It is a powerful force in our society and can have a major impact on the success of a
family. This is because it has alternate uses and therefore can be used to provide the
needs and wants of family members. For instance money must be shared among the many
possible needs of the family members.
Money is strategic as individuals and families make their daily financial decisions. It is
important in addressing questions relating to economic well-being. For example, how
attitudes about money relate to economic success and the relation of economic conditions
and its use (Deacon and Firebaugh, 1988). Money can either be a major cause of stress
University of Ghana http://ugspace.ug.edu.gh

4
for many people or provide a way of release for others depending on how it is managed
(Park et al, 2002).
Effective financial management in the family can be achieved through various financial
management styles. Research suggests that there is no one correct method of handling
finances in the family. Family members need to thoughtfully consider their situation and
communicate about how best to manage their money. When spouses communicate
openly, make decisions together, and have mutual trust and respect, they greatly increase
the likelihood that they will manage their finances successfully. On average however,
families engage in little systematic financial management such as the existence of a
written budget, or financial record keeping (Godwin, 1990); or wives taking the task of
„family financial officers‟ by handling money and allocating income (Godwin 1990) and
(Agyeman, 2007). Another financial management system is having joint responsibility of
financial management by couples (Godwin 1990). Other means of managing finance as
explained by Freeman, (2006), include the following; getting organized, always saving a
regular amount of income, having financial goals, paying off debts as quickly as possible
and avoiding impulse spending.
Financial management in the family is a shared responsibility in most Ghanaian homes.
However, there is a considerable variation in the extent to which husbands and wives
share the task of providing for material needs in the family. Men usually supply bulky
items which meet their long term needs whilst women on the other hand, are expected to
put their small, repetitively acquired incomes towards day-to-day needs Oppong, (1983),
and Leach (1991 as cited in Brown 1994).
University of Ghana http://ugspace.ug.edu.gh

5
1.2 Statement of the Problem
Women have major responsibilities for the sustenance and welfare of household
members, even when they live with a husband. They are also in charge of managing
family finances. Literature suggests people have problems managing financial resources.
Is this the case with women in Ga East District? There is also lack of information about
how women in third world countries including Ghana, actually manage their finances and
their influence on the welfare of their households. It is against this background that the
researcher wants to investigate how rural women in Ga East District of Greater Accra
manage their finances and their influence on family welfare.
1.3 Aim of Study
The aim of the study was to investigate how rural women in Ga East District manage
their finances and their influence on the welfare of their families.
1.4 Specific objectives
The specific objectives of the study were to:
1. Identify the various sources of income of respondents.
2. Investigate how women spend their income.
3. Find out the different financial management systems and practices used by
women.
4. To investigate how financial management by women influence the welfare of
their family members.
University of Ghana http://ugspace.ug.edu.gh

6
1.5 Hypotheses
HO1: There is no relationship between financial management by respondents and family
welfare.
HO2: There is no relationship between level of income of respondents and family welfare.
1.6 Significance of the study
1. The study would contribute to knowledge on financial management and their
influence on the welfare of families.
2. It would serve as a guide for the Department of Family and Consumer Sciences
(DFACS) to educate women on financial management.
3. It would also serve as a guide to policy makers when drawing intervention
programmes for women.
1.7 Operational Definition of Terms
Financial management-
Managing all household income effectively to achieve satisfaction for every
member of the household.
Financial management system-
This is the system couples agree upon in managing their money/income.
Welfare-
Refers to the ability to provide and manage basic needs adequately to satisfy
every member of the family.
University of Ghana http://ugspace.ug.edu.gh

7
Individual system-
This is a term used to describe a new financial management system identified in
the study. It is a financial management system whereby women take sole
responsibility of providing and managing income at home. Women using this
system were either single, separated or divorced, or married but living with
spouses who do not work.
University of Ghana http://ugspace.ug.edu.gh

8
CHAPTER TWO
LITERATURE REVIEW
2.1 Introduction
This chapter presents a review of relevant literature to the study on a number of topics
beginning with the concept of management followed by concept of financial
management. It also looked at the role of women in the family, their sources of income,
expenditure patterns, financial management practices and systems and welfare.
2.1 Concept of Management
Management occurs in many different situations. In general it is often defined as the wise
use of resources to achieve what is wanted. Management is using what you have to get
what you want (Hevi-Yiboe, 2004; p.7). It also means utilizing available resources in the
best possible manner and also for achieving well defined objectives (Patil, 2012). It can
also be defined as a distinct and dynamic process involving the use of different resources
for achieving well defined objectives (Patil, 2012). Management is the activity of facing
and solving problems. It is a process that involves planning, controlling and evaluating
the use of available resources to reach goals. Individuals and households make choices
and decisions to use family resources to achieve their goals daily (Stephenson, 1997; p.
94). Families need to recognize the limitation of every resource and manage the available
resources wisely to meet individual and family needs and wants and to accomplish their
goals (Stephenson, 1997; p. 96).
University of Ghana http://ugspace.ug.edu.gh
9
2.2 Concept of Financial Management
Financial management means putting together the economic resources at hand to make
efficient use of them and taking decisions that can successfully help in acquiring more
assets for the family (Borade, 2011). Financial management is synonymous to money
management. Money management is the process of knowing how money is spent now
and in the future (Balance, 2011). This involves setting financial goals, getting organized,
and tracking spending to ensure that expenditure does not exceed income, thus avoiding
debt. It aims at creating a budget to control spending, saving money regularly, making
investment to help achieve financial goals and finally assessing how money was managed
(Balance, 2011; IDCEO, 2013).
Every family, whether rich or ordinary, requires a financial plan because financial
management is a lifelong process that requires ongoing review (Sherin, 2011). Most
people wrongly believe that, financial management is only practicable and desirable for
families with high earnings, that families with sizable incomes can only spare enough
funds to create financial planning through investing in various investment products
(Sherin, 2011). For the purpose of this study, financial management is described as how
household income is managed effectively to achieve satisfaction for all household
members.
2.2.1 Budgeting
One of the keys to successful money management is having a budget. A budget is a plan
for using available money. A budget is necessary no matter the amount of income
available. It enables individuals to take critical look at needs and wants before parting
University of Ghana http://ugspace.ug.edu.gh
10
with any money (Hevi-Yiboe, 2004; p.17). Budgeting includes allocating the family
income for different spending needs such as bills, food, entertainment and miscellaneous
expenses. A budget helps to understand how much money comes into the family and
how to spend to avoid debt. A budget also helps to manage credit and to save money for
the future (IDCEO, 2013). Budgeting is viewed as most important because it includes
using all household funds. It is usually intended to ensure that some money is available
for major purchases. It allows an individual to track monthly expenditures so that savings
strategies for short and long term goals can be planned. A budget or spending plan helps
to gain greater control over the following: financial resources, savings, impulse buying,
and emergencies (IDCEO, 2013).
The concept of financial management manifests itself in the way a budget is managed and
also how investments are managed. Money management should take into account
present and expected future income of a family. Without proper financial management or
budgeting, savings and investments will not be possible because spending habits will
force a person to invade and destroy savings and investments (IDCEO, 2013).
2.2.2 Benefits of financial management
The central objective of family financial management is to improve the family‟s financial
well-being. This should reflect in the family‟s way of living such as higher net worth,
higher levels of savings and lower debt ratio (Godwin, 1990: 222). But for these to
happen then there should be consistency in proper financial management over a period of
time.
University of Ghana http://ugspace.ug.edu.gh

11
Financial management helps to reduce risk. It ensures that expenditure is less than
income. It includes making allowances for unforeseen circumstances and making savings
a priority. It identifies the risk of running out of money (for instance in a month) and also
identifies the risk of running out of money in future (Frankle, 2013).
With effective financial management, money is made available to meet short term and
long term requirement of the family. Financial management aims at reducing the size of
a problem and ensures smooth running of the home (Borade, 2011). Financial
management is critical to the success and happiness of any relationship, including
marriage. It is a key to a happy family, and goes beyond physical survival. A family‟s
emotional survival depends on financial stability and tranquility (Sherin, 2011). The well-
being of a rural household can be quantifiably improved if only one person in that
household has adequate knowledge in financial management and also has a savings
account. A significantly higher level of well-being is achieved when that person is a
woman (Sibley and Liew, 2009).
2.2.3 Effective financial management
Handling finances is a challenge for many families, but it is important to manage money
effectively and create a sense of financial security and comfort (Leigh and Clark, 2000).
Effective financial management involves calculation of risk, cost and control and
maintaining cost of funds at minimum (Borade, 2011). To address financial management
very well, a strategy needs to be designed to ensure proper utilization of funds. This
prevents wasting available funds (Borade, 2011). Effective money management
University of Ghana http://ugspace.ug.edu.gh

12
prevents a great deal of stress and tension and leads to healthier family functioning
(Leigh and Clark, 2000).
Effective financial Management may be achieved through the following means:
1. Couples should identify each other‟s different values, standards, and goals that
influence his/her view of money and its uses and discuss how to manage the
family income (Leigh and Clark, 2000).
2. Experiment with different methods of handling finances until a system that works
well for the family is achieved. Example, keeping separate accounts, pooling all
money, or combine these two practices (Leigh and Clark, 2000; Osteen & Neal
2012).
3. Develop a budget and make joint decisions regarding finances which define each
spouse‟s financial roles and responsibilities (Leigh and Clark, 2000).
4. Purchases made should be appropriate to one‟s income level and avoid impulse
buying as much as possible (Leigh and Clark, 2000).
5. Needs should be separated from wants, and expenses should be kept constant
even when income increase (Leigh and Clark, 2000).
6. Discuss the family‟s financial situation with children as they mature (Leigh and
Clark, 2000).
7. Prepare for unforeseen problems by planning how to handle unexpected expenses
and financial emergencies by establishing an emergency saving fund (Leigh and
Clark, 2000).
University of Ghana http://ugspace.ug.edu.gh

13
2.2.4 Family financial problems
Families face a variety of financial tasks, such as preparing a budget, dealing with
unforeseen expenses and planning for the future. Family financial problems are caused
by a number of factors. These include: lack of financial understanding which could result
in making unwise decisions, personal behavior problems, and relationship problems
(Sherin, 2011).
Financial problems caused by personal financial behavior include: impulse buying,
excessive materialism, preoccupation with social image, and using money to control
others. Other factors of personal financial behaviours are emotions, personality and an
individual‟s attitude toward money (Sherin, 2011).
2.2.5 Successful Money Management Skills
Successful money management skills include:
1. Setting goals which are an important process and following it to help secure a
good financial future (Osteen & Neal 2012).
2. Making a monthly budget which is a key to successful money management
because it helps to spend money wisely by avoiding impulse buying and spending
money within the means of the family (IDCEO, 2013).
3. Keeping a written spending plan to know exactly how money is spent (Osteen &
Neal 2012).
4. Saving for the future (IDCEO, 2013).
University of Ghana http://ugspace.ug.edu.gh

14
2.3 The role of women in the family
Women have worked from time immemorial to care for their families. From the dawn of
history they have helped to provide food and make clothing for their families (Oppong
and Abu, 1987). A study in rural households in Fiji reveals that women assume greater
responsibility than men for the management of their household‟s finances (Sibley and
Liew, 2009). They are more likely than men to plan savings and to set financial goals for
their households. Women are more competent than men because they are more diligent
at managing household expenditures and accepting the principal role in the management
of household finances (Sibley and Liew, 2009).
In addition they keep household records such as checking bills that need to be settled and
monitoring household expenditure. In other words, women keep written record of
household income and expenditure (Sibley and Liew, 2009). They understand their
family financial situation better and know how well their households are meeting their
current financial commitments (Sibley and Liew, 2009). Women appear to be better at
saving money but on the contrary fewer women own bank account (Sibley and Liew,
2009). The role that women play in managing their household finances is necessary to
improve the well being of their households (Sibley and Liew, 2009).
Studies show that women are responsible for buying 80% of household goods. As such
they have a great deal of influence in the economy and a lot of spending
power (McCracken, 2001). They are also often responsible for clothing themselves and
their families (McCracken, 2001). Women spend more of their income on their
households, for instance on children‟s education, food, health and clothing
University of Ghana http://ugspace.ug.edu.gh

15
(Agyemang, 2007).Women lives under a great deal of pressure and must find ways to
feed their families on a limited budget. As a result, they have more purchasing power
than ever before even though they still earn significantly less than their male colleagues
(McCracken, 2001). Ghanaian women play an important role in the household economy
in spite of the difficulties they encounter in the discharge of their duties (Brown, 1994).
Women are still less financially literate than men. In all areas they have a heavier
emotional involvement with money than men and have more worries, fears and anxieties
about money. They are more likely to be in debt too. Despite all these challenges women
are still managing family budgets, paying bills, and making major purchasing decisions
(Pine, 2009).
2.4 Sources of income of families
Income is the money received in the form of wages and salaries for work done. Other
sources of household income are profits on sale of goods, interest or dividend on
investment, rent and other forms of earnings received in a given period of time (Elmblad,
2013). Household members typically derive their income from employment both paid and
self-employment (that is wages and salaries); property income, (a major source of this is
rent on the ownership of dwellings), income from the production of household services
for own consumption; and current transfers received (ICLS, 2003; DSOS, 2007, & GLSS,
2008). In many households there may be more than one individual who is an active
member of the labour force. Moreover, such individuals may undertake more than one
economic activity during any year, any week, or indeed, at any period of time (GLSS,
2008).Women have also used agriculture and other kinds of trade to earn their income
University of Ghana http://ugspace.ug.edu.gh

16
(Yankey, 2006). Women also earn their income through petty trading and the preparation
and sale of food Levin et al (1999 as cited in Yankey, (2006). Other sources of income to
the family are remittances which constitute less than 10% of household income, interest
on savings, social security and pension receipts. However, the three main sources of
household income in Ghana are income from agricultural activities (35%), wage income
from employment (29%) and income from self employment (25%) (GLSS, 2008).
On average annual household income in Ghana is about GH¢1,217.00 whilst the average
per capita income is almost GH¢400. There are regional differences with Greater Accra
region recording the highest of GH¢544.00. Urban localities have higher per capita
income than rural localities (GLSS, 2008). Sources of income varied according to the
employment status of the household head (Ormsby & Fairchild, 1987).
2.5 Expenditure patterns of families in Ghana
2.5.1 Household expenditure
Household expenditure data has been used extensively to monitor general household
living standards and consumption patterns (WHO, 2007). Household expenditure
includes all the monies spent on different items which are used to satisfy the needs and
wants of family members (ICLS, 2003). According to Ghana Statistical Service Report
(GSS 2000), estimates of household income and expenditure are of interest for a wide
variety of statistical and analytical purposes. One of the most obvious was the estimation
of household welfare and of poverty.
In Ghana, average annual household expenditure is GH¢1,918.00 whilst the mean annual
per capita consumption expenditure is GH¢644.00. Regional differences exist with
University of Ghana http://ugspace.ug.edu.gh

17
Greater Accra Region having the highest per capita expenditure of GH¢1,050.00 (GLSS
2008). Major expenditure percentages are helpful when creating a spending plan, but
other expenses need to be considered as well. If major expenditure percentages are
adjusted according to values, needs and wants, individuals are able to live within their
means and have enough money for other expenses as well. Housing, transportation, food
and insurance are considered as major household expenses. Housing takes about 30% of
income, transportation (20%), food (15%), insurance (7%), and other items takes (28%)
(FEFE, 2009). Similarly, DSOS, (2007) found that the highest household expenditures
were on food, housing & related expenses, and transportation & communications.
In the Philippines, food accounts for a little more than two-thirds of the family‟s spending
(42.6%); rent (housing) takes 13.6% of the family‟s spending; transport &
communication (7.4%); fuel, light and water (6.5%); education (4.0%); personal care &
effects (3.9%); and clothing, footwear & others (2.9%) (NSO, 2003).
Expenditure on food
In Ghana, food expenditure accounts for 2∕5 of total household expenditure: Greater Accra
spends about 40% of its total expenditure on food; households in the highest quintile
spends about half of the total expenditure on food; and food forms about 60% of the total
expenditure of households in the lowest quintile (GLSS, 2008). In the localities,
households in urban centres spend about 44% of total expenditure on food, while
households in the rural areas spend more than 60% of total expenditure on food (GLSS,
2008). On the contrary, a study by Minot and Dewina (2010) in Ghana, revealed that food
production represent 36% of household income while food consumption accounts for
University of Ghana http://ugspace.ug.edu.gh

18
49% of household expenditure. Among food growers barely one-third of them are net
sellers of food. They further stated that households that do not grow food (including
most urban households), food consumption represents 41% of their budget. In Chile,
households spent, on average, 53% while in Mexico households spent an average of 54%
of their income on food (Ormsby & Fairchild, 1987) and in Micronesia about ⅓ to ½ of
total household expenditures in the states was on food (DSOS, 2007).
Expenditure on housing
Expenditure on housing in Ghana averages 2.4% of the total household expenditure.
Expenditure on housing is higher in Greater Accra Region than the other regions.
According to the standard set by the Ghana Statistical Service, the room occupancy ratio
of a household is a measure of housing adequacy. Any room occupancy ratio in excess of
two persons per room is an indication of overcrowding (Boamah, 2010).
Other expenditures
Within the non-food expenditure group, transport contributes the highest of 16.7% to the
total expenditure. The next most important expenditure groups in terms of amount spent
are housing, water, electricity and gas (7.9%), recreation and culture (6.1%), clothing and
footwear (8.6%) and education (5.3%) (GLSS, 2008).
Credit
More than 27% of all households owe money or goods to other persons, institutions or
businesses and only 6% are able to pay fully a loan in the preceding 12 months. The
extent of indebtedness, as measured by the proportion of households taking out loans, is
lower in urban areas (24.1 %) than in rural areas (29.8 %). Over half of household loans
University of Ghana http://ugspace.ug.edu.gh

19
come from relatives, friends and neighbours (GLSS, 2008). In Chile, only 19%
households had borrowed money during the year (Ormsby & Fairchild, 1987).
2.5.2 Savings of households
The act of saving money can be very rewarding. Saving is setting some money aside for
future use or needs. Savings can be used as an emergency cushion for retirement or for
something to reward yourself with, when you complete a goal (GLSS, 2008). Savings is
important for security and safety; planning ahead for major expenses and to meet
emergencies (Avery & Kennickell, 1991; Chang, 1994).
There are at least three main reasons to save money. These are:
1. Save until you have an emergency.
2. Save for purchases to avoid debt.
3. Save for wealth building (Ramsey, 2003).
However, certain factors were found to be associated with savings by households. Income
was found to be positively associated with consumer savings (Avery & Kennickell, 1991;
Chang, 1994). Other factors which influenced family savings include age, number of
children, type of employment, household size and education (Xiao, 1996).
Just a third of all households in Ghana have savings accounts. Two-fifth of urban
households operates savings accounts as against only 22% of their rural counterparts.
More males (60%) have savings accounts than females (40%). Rural areas have higher
proportions (78%) of households without saving accounts compared to urban areas (61%)
(GLSS, 2008). A study by Ormsby & Fairchild, (1987) showed that 23.3% of households
saved money. Women use different means of obtaining money for their businesses or
University of Ghana http://ugspace.ug.edu.gh

20
household purposes. This study focuses on only three of such methods: money lenders,
susu collectors and susu associations. Another form of obtaining money is through the
banks.
Money lenders.
Money lending is one of the oldest forms of making credit available to the family. The
family is expected to pay back the money borrowed plus interest charged on it between
periods of 3 months to 6 months. The activities of money lenders have reduced
considerably, due to the emergence of rural banks, credit union, and susu associations
(Steel and Andah, 2003).
Susu collectors.
These are people who collect daily amounts set by each of their clients and return the
accumulated amount at the end of the month minus one day‟s amount as their
commission (Steel and Andah, 2003).
Susu associations.
These associations are of two types: these are Rotating Savings and Credit Association
and Accumulating Savings.
A Rotating Savings and Credit Association (ROSCA).
Members of this group contribute a fixed amount regularly (for example weekly or
monthly) that is allocated to each member in turn (according to lottery, bidding, or other
system that the group establishes) (Steel and Andah, 2003).
University of Ghana http://ugspace.ug.edu.gh

21
Accumulating saving.
Members of this group make regular contributions which may be lent to members as
loans or paid out under certain circumstances such as death of a family member (Steel
and Andah, 2003).
2.6 Overview of financial management practices
Financial management studies show that most families follow few of the normative or
“good” financial management practices (Godwin, 1990; 221). Families prove this
through their day-to-day activities of paying bills, keeping food on the table, providing
through their day-to-day activities of paying bills, keeping food on the table, providing
clothes and shelter for its members and trying to avoid financial trouble. But it is
expected that good management should translate into increased satisfaction (Muske,
1995). Money is active and needs to be managed continually (Ramsey, 2003). The
recommended practices have been shown to provide the family with greater wealth
accumulation (Hira, 1987). Researchers have noted, however, that often people using the
recommended practices fail to do so completely. Things such as putting the budget in
writing (Davis & Carr, 1992), or keeping records and then comparing those records to
actual expenses were not completed (Godwin, 1990). In a related study, some families
had financial expenses, reviewed and evaluated their spending habits but fewer families
had written plan of their income and expenditure (Titus et al, 1989).
Families engage in little systematic financial management behavior such as written
budget, or record keeping and account management (Godwin, 1990: 222). Mental
management was used extensively but only limited amount of written planning was done.
University of Ghana http://ugspace.ug.edu.gh
22
The fact that mental management was so important was an important factor in the
development of the individual tools for good management (Muske & Winter, 2004: 82).
In a study by Godwin and Carroll (1986, as cited in Godwin, 1990: 222), they found that
fewer families had a written budget, a household inventory or explicit financial goals for
the next year, whilst a majority of families reported that they discuss some financial
goals, kept monthly records of expenditures, and saved a specific amount of money each
time they receive income. Families who had written financial plans, written record
keeping systems and who had planning horizons of up to a year reports significantly
higher net worth than other families (Beutler and Mason, 1987).
Financial planning was positively related to families‟ net worth, when families estimated
their household incomes and expenses, reviewed and evaluated their spending and had
relatively concrete plans to achieve those goals. A family‟s subjective financial well-
being is more strongly related to their attitudes and perceptions rather than any
observable management behavior (Titus, et al., 1989). Lack of knowledge about
principles of financial management and financial matters could explain why some
families do not follow recommended financial practices such as setting financial goals,
having a budget, keeping lists and records of household inventory, credit cards and
insurance policies.
In a study of over 50,000 couples, it was found that the top five financial problems
couples experienced involved couples spending money, saving money, making major
purchases, debts and use of credit cards (Olson, Olson-Sigg & Larson, 2008). A study in
Sweden on gender equality on money and marriage, revealed that couples have a plan
University of Ghana http://ugspace.ug.edu.gh

23
about how to manage their day-to-day finances regardless of whether or not they had
joint or separate accounts and each spouse agreed on equal opportunity to the couple‟s
money (Nyman, 1999). The most important influential demographic variables related to
financial management practices are education of husband, education of wife and family
income (Ormsby & Fairchild, 1987).
2.7 Different financial management systems used by families
There are various financial management systems used by families. These include: family
money manager, whole wage system, allowance system, pooling or shared management
system, independent management system, handout system and equal salary system Pahl
(1983, as cited in Marshall and Wolley, 1993); Hevi-Yiboe, (2004).
2.7.1 The family money manager system
With this system a family member handles majority of the financial transactions for the
family (Muske, 1995). Early studies show that the most common financial arrangement
in families is for wives to be the “family financial officer” or the primary financial
officer. They handle routine tasks such as managing money, paying bills and allocating
income (Godwin, 1990). Reasons for having a primary financial manager were that, one
spouse may have more expertise, extra time, or a greater desire to manage the finances
(Horrock, 2010). Again probably because women are better at budgeting and keeping
track of their spending and are also less likely to build up debt on credit card or through a
loan because they set priorities and know what the family has to spend on (Barnett,
2010).
University of Ghana http://ugspace.ug.edu.gh

24
2.7.2 Whole Wage System
This is a system where one partner, usually the wife is responsible for managing all
finances of the household. She is also responsible for all expenditures except for the
personal spending money of the other partner. Both partners have access to money
coming into the household, but the wife is responsible for management (Marshall and
Wolley, 1993; Osteen & Neal 2012). For instance family financial management by the
Effutus of Winneba in Ghana rests solely on the women. The economic fortunes of the
family depend on fishing activities of the husband (Brown, 1990). A man gives money to
his wife in between fishing season and the wife is expected to manage the money even
during the off season. He expects the woman to feed the whole family and also provide
other needs of the family for the whole of the ensuing year (Brown, 1990).
2.7.3 Allowance system
In households using this system, the husband gives the wife a set amount of money every
week or month to which she adds her own earnings if there are any. The woman is
responsible for paying for specific items such as food and clothing while the remainder of
the money stays under the control of the husband and he pays for other items such as rent,
electricity and water bills. The husband has access to the main source of income; the
wife has access to only that part of it which he chooses to give her Pahl (1983, as cited in
Marshall and Wolley, 1993); Hevi-Yiboe, (2004).
2.7.4 Pooling/Shared Management System
Families using this system utilize a joint account or common kitty into which all income
are paid and from which both can draw. Both husband and wife have access to all
University of Ghana http://ugspace.ug.edu.gh

25
income and responsibility for expenses is shared more or less equally. Families reported
that both spouses jointly handle the family finances and are also responsible for financial
decision making and implementation (Hira, 1987; Osteen & Neal, 2012). Financial
management is a central subject in couple relationship (Horrocks, 2010). Partners placed
a high value on the moral characteristics of their spouse. Integrity, honesty, and loyalty
were also highly valued attributes (Horrocks, 2010). A study in the United States by
Horrocks, (2010), revealed that couples pooled resources together to take care of
expenses but each partner has some private money for their own spending and each
couple was responsible for some particular expenditure.
2.7.5 Independent Management System
With this system both partners earn income and neither has access to all households‟
funds because they believe that everything should be kept separately. Each maintains
separate control over his/her own income and each partner is responsible for specific
items of expenditure Pahl (1983 as cited in Marshall and Wolley, 1993); Osteen & Neal
(2012).
2.7.6 The Handout System
This is a system where husbands give money to their wives on daily basis or as and when
needed to take care of household expenditure (Hevi-Yiboe, 2004).
2.7.7 The Equal Salary System
Both husband and wife contribute equal amount of money for the up keep of the house
(Hevi-Yiboe, 2004; Pine, 2009). But in relationships many women make the short-term
spending decisions while their partner plans and invests for the future (Pine, 2009).
University of Ghana http://ugspace.ug.edu.gh

26
2.8 Welfare of families
According to The Oxford Dictionary‟s (2001), welfare means well-being, happiness,
health and prosperity of a person or community. Welfare derives its meaning from “well
in it‟s still familiar sense and fare, primarily understood as a journey or arrival and also
as a supply of food” (Greve, 2008). Welfare can be interpreted in one way in a person‟s
everyday life perspective, and another when looking at it at the societal/macro level. It
can be related both to the individual and to the collective and involves material as well as
immaterial needs. Moreover, it will often be connected to various interpretations of social
justice (Greve 2008). When looking at welfare at the macro level; money can be and is
used as an indicator or an instrument for achieving welfare. In economic theory more
generally, welfare is seemingly just another word for utility. It is the evaluation assigned
by the individual to income or, more generally, to the contribution to our well-being from
those goods and services that we can buy with money” (Van Praag & Frijerts, 1999).
In economics, welfare is mainly connected to individual‟s perception and utility of the
use of income. It also refers to how utility can be maximized by choices made by the
individual (Walker, 2005).Welfare at its core has something to do with fulfilling essential
needs of the individuals and the families. This implies that welfare can change over time,
and, to a certain degree, be dependent on the level of income and having a job (Greve,
2008). Essential indicators of welfare are happiness; well-being; capabilities, that is,
being capable of attaining high level of education and working to earn income and being
capable of managing income; and not living in poverty Tella, et al. (2003; 809 as cited in
Greve, 2008). Indicators of welfare as stated by Ormsby & Fairchild, (1987), were; type
University of Ghana http://ugspace.ug.edu.gh
27
of employment, rate of unemployment, level of perceived income adequacy, education
levels, levels of debt and savings and percentage of income spent on food.
2.9 Conclusion
From the literature reviewed, financial management means how economic resources are
put together and the decisions that are taken for efficient use of these resources. The
decisions that families take are the management systems and practices that they use in
handling their money. Families use different financial management systems and practices
in allocating their income. Some of these practices include setting financial goals,
budgeting (mental and written), savings, taking care of day-to-day management of
family finances such as paying bills, keeping food on the table, and providing clothes
(which are considered as the recommended practices or good management practices),
mostly rest on women. It is expected that good management should translate into
increased satisfaction. But researchers have noted that often people using the
recommended practices fail to do so completely. There seems to be a gap in knowledge
about financial management practices and its influence on the welfare of families in
developing countries like Ghana. This study hoped to fill this gap in knowledge by
accessing financial management systems and practices of Ga rural women and their
influence on family welfare.
University of Ghana http://ugspace.ug.edu.gh

28
CHAPTER THREE
METHODOLOGY
3.1 Introduction
Data gathering is crucial in research. It then becomes imperative to select the manner of
obtaining data and from whom the data is acquired especially since no amount of analysis
can make up for improperly collected data (Tongco, 2007). This chapter provides
information on the study design, the study area, target population, sample size, sample
and sampling procedure, instrument for data collection, how data was collected and
analysed.
3.2 Study design
A cross-sectional study design was used for this study. In this type of research study,
either the entire population or a subset of the population is selected. Data is collected
from the selected population (respondents) to help answer research questions of interest.
The information gathered from the respondents represents what is going on in the entire
population at only one point in time (Olsen & George, 2004).
3.3 Study area
The study was carried out at Danfa and Adoteiman in the Ga East District of the Greater
Accra Region. Danfa and Adoteiman are twin towns located 27 kilometres (km) north of
the capital Accra. These are indigenous Ga communities but have other ethnic groups
residing there. The natives moved from Teshie and Nungua (their original homes), which
are coastal towns to settle in these new communities in the Accra plains, with the aim of
University of Ghana http://ugspace.ug.edu.gh
29
engaging in subsistence farming. These towns were chosen for the study because the
researcher is familiar with these communities and also because of proximity.
3.4 Target population
The target population comprised all women between the ages of 18-60 years in all
households in Danfa and Adoteiman. Women were targeted because they have a major
responsibility for the sustenance and welfare of household members even when they live
with a husband (Brown, 1994). The women in these communities work in both formal
and informal sectors of the economy (GSS, 2011).
3.5 Sample size & sampling procedure
A sample is a carefully selected portion of the population, which is considered to be
representative of the total population as to the aspects to be investigated and enumerated
(Kumekpor, 2002). A proportionate sampling size was selected in each community. The
projected population of the two communities was derived from the Ghana Statistical
Service. To arrive at a sample size of 120 women, the total sample of women was divided
proportionally.
Number of women in specific community X Sample size
Total number of women in two communities
Danfa = 677 X 120 = 77 Adoteiman = 389 X 120 = 43
1066 1066
This is presented in Table 3.1. Thus one hundred and twenty women comprising 77
women from Danfa and 43 women from Adoteiman were the study sample.
University of Ghana http://ugspace.ug.edu.gh

30
Table 3.1 Projected populations from Danfa and Adoteiman
Communities Female population Percentage of females (%) Sample size
Danfa 677 64 77
Adoteiman 389 36 43
Total 1066 100 120
Source: Ghana Statistical Service (2000)
The systematic random sampling technique was used to select respondents for the study.
Within this study, numbers were assigned to households in which there were women and
then every kth
household with a woman willing to be part of the study was chosen for
inclusion in the sample. There were 208 households in Danfa and 98 households in
Adoteiman (GSS, 2011). To get the kth
element, the number of households within a
selected community was divided by the proportionate sample size:
Total number of households in community = kth
element
Proportionate sample size
Danfa = 208 = 2.7 = 3(every 3rd
household)
77
Adoteiman = 91 = 2.1 = 2 (every 2nd
household).
43
In Danfa, a point was selected (that is the first house at the entrance to the village), then
every third house was selected till the total sample size of 77 houses with women willing
to participate in the study were selected. These women were told the purpose of the
study and then with their consent, they were interviewed. In Adoteiman however, the kth
element was 2 thus after selecting a starting point, women in every second house were
interviewed till the sample size of 43 was attained.
University of Ghana http://ugspace.ug.edu.gh

31
3.6 Instrument for data collection
A structured interview schedule was developed for the study. Structured interviews
normally follow a systematic order and give uniformity in the interviewing procedure.
This saves time and makes data analysis simpler (Kumekpor, 2002). A structured
interview allows for information to be collected from illiterates in their local language.
The interview schedule was designed to collect information on the: socio-demographic
characteristics, sources of income of respondents, how families spend their income,
different financial management systems and practices used by families, and welfare of
families (Refer to Appendix 2).
3.7 Pre-test
To ensure reliability, objectivity, and clarity of items in the interview schedule, the
instrument was pre-tested on ten women selected from Otinibi in the Ga East District.
Otinibi was chosen because the residents have similar characteristics as the study sample.
The dominant ethnic group is Gas. The women also work in both formal and informal
sectors of the economy. The pre-testing helped to ensure that the questions were clear and
well understood by the respondents. Again it helped to determine the average number of
interviews that could be made in a day and also the average duration for each interview.
After the pre-test a few questions were added to the interview guide. For example,
questions to assess the welfare of respondents and questions to find out if respondents
reviewed their budget.
3.8 Data collection
Data was collected within a period of six weeks. The interview took place in the morning
or afternoon depending on when respondents were available. The respondents were
University of Ghana http://ugspace.ug.edu.gh

32
interviewed at home or at their work places using the structured interview schedule
developed. Each interview lasted between 40 to 50 minutes. On average four respondents
were interviewed daily. Where necessary the items were interpreted in the local language
that is, (Ga, Dangbe, Ewe, or Akan).
3.9 Data analysis
Data was hand coded and entered into the Census and Survey Processing system (CSPro
4.1) software version. After entering the data in the CSPro it was exported into the
Predictive Analytic Software (PSAW 18.1) and Statistical/Data Analysis (Stata 11.2)
software programmes for analysis. Data was presented using percentage distribution,
tables and graphs and analysed using statistical measures including means, logit
regression and chi square test. The logit regression analysis was used to identify the
influence of the following factors: age, education, ethnicity, household size and financial
management practices on the welfare of families. The chi-square test was used to
establish the relationship between study variables.
University of Ghana http://ugspace.ug.edu.gh

33
CHAPTER FOUR
RESULTS AND DISCUSSIONS
4.1 Introduction
The results of the study on financial management systems and practices of women in
Danfa and Adoteiman, and their influence on family welfare are presented in this chapter.
The findings are presented under the following headings: socio-demographic
characteristics, sources of income, expenditure patterns, financial management systems
and practices and welfare of family.
4.2 Socio-demographic characteristics of respondents
The demographic characteristics of respondents are presented in this section. These are
information about the: age, marital status, ethnic group, religion, educational level
attained type of dwelling/residence status, household size and main occupation of
respondents.
4.2.1 Age distribution of respondents
Table 4.1 presents the age distribution of the respondents. The ages of the respondents
ranged between 22 to 55 years with the average age being 34.5 years. Majority of the
women (73%) were between the ages of 20 to 39. The implication is that these women
are still in their active ages and are strong enough to engage in several income generating
activities.
University of Ghana http://ugspace.ug.edu.gh

34
Table 4.1 Age distribution of respondents
Age Grouping N (%)
20-29 33 28
30-39 54 45
40-49 23 19
50-59 10 8
Total 120 100
4.2.2 Marital status of respondents
More than half of the women were married (61%), and only 2% were widowed. About
92% of the married women were in monogamous relationships while 8% were in
polygamous relationships.
Figure 4.1: Marital status of respondents
0
10
20
30
40
50
60
70
Married Consensual
Union
Separated Single Widowed
61
1713
72
Per
cen
tage
Marital status of respondents (n=120)
University of Ghana http://ugspace.ug.edu.gh

35
4.2.3 Ethnic groups
Findings in Figure 4.2 suggest that although the study was conducted in a predominant
Ga ethnic community, there were a variety of respondents belonging to other ethnic
groups. The major ethnic groups from the study were Gas (42%), while minorities 3%
were, Hausas and Guans respectively.
Figure 4.2 Ethnic groups of respondents
4.2.4 Religion
Majority of the respondents (90%) were Christians and 6% were Moslems. Two percent
of the respondents belonged to the traditional religion and the remaining 2% did not
belong to any religion.
Ga
42%
Ewe
32%
Akan
16%
Dangbe
4%
Hausa
3%
Guan
3%
(n=120)
University of Ghana http://ugspace.ug.edu.gh

36
4.2.5 Educational levels attained by respondents.
Figure 4.3 shows the varied educational backgrounds of respondents. The study sample
attained different levels of education ranging from basic to post secondary education,
with majority (62%), having only basic education.
Figure 4.3 Educational level attained by respondents
Hilgert, et al., (2003), examined the linkage between knowledge or education and
behavior and realized that lack of knowledge about financial management in the
household could explain why some families do not follow effective financial
management practices. They further indicated that those who have higher levels of
education are more likely to engage in financial matters in the households.
Elementary/Middle
31%
Junior High
31%
No formal
education
25%
Senior High
9%
Voc./Comm./
Tech.
3%Post-
Secondary
1%
(n=120)
University of Ghana http://ugspace.ug.edu.gh

37
4.2.6 Type of dwelling and residence status
Table 4.2 shows a cross tabulation of the type of dwelling that the respondents lived in
and their residence status. The findings suggest most respondents (80%) lived in
compound houses while (1%) of the respondents lived in kiosk.
Table 4.2 Types of dwelling and residence status
Type of dwelling Rented Owned
Family
house
Squatting/
Encroaching Total
N (%) N (%) N (%) N (%) N (%)
Compound house 36 86 14 50 44 94 2 67 96 80
Detached house 6 14 14 50 2 4 1 33 23 19
Kiosk 0 0 0 0 1 2 0 0 1 1
Total 42 100 28 100 47 100 3 100 120 100
The study revealed that 65% of the respondents did not spend any money on rent or
maintenance of the house. They lived in their own houses, family houses or in kiosks.
About 37% of the respondents living in compound houses lived in their family houses,
whilst (2%) of the respondents lived in uncompleted houses belonging to other persons.
4.2.7 Household size
Findings of the study revealed that households‟ size ranged from 1 to 9 members with the
average household size being 4 members. This is similar to the households‟ size of 4.4
identified in the Ghana Living Standard Survey (GLSS, 2008).
4.2.8 Main occupation of respondents
Figure 4.4 shows respondents‟ occupation ranged from self employment to public service
jobs. Majority of them (82%) worked in the informal sector and only 5% of the women
University of Ghana http://ugspace.ug.edu.gh

38
were in the formal sector. Forty-six percent of those in the informal sector were traders
and 3% worked as labourers (other occupations) 1
.
Figure 4.4 Occupation of respondents
The findings of this study are consistent with the findings of Agyemang (2004) and
Dolphyne (1991) that most Ghanaian women engage in various economic activities such
as petty trading, farming, hairdressing and teaching, to generate income for themselves
and their families.
4.3 Income of respondents
The sources of respondents‟ income are presented in Table 4.3. The responses show that
respondents received income from a variety of sources with the main source being their
1 The category of women who belong to other occupations worked as labourers in homes and at building sites as and
when their services were needed.
.0
5.0
10.0
15.0
20.0
25.0
30.0
35.0
40.0
45.0
50.0 46
14 139
6 4 3 3 2
Per
cen
tage
Occupation (n=120)
University of Ghana http://ugspace.ug.edu.gh

39
occupation/job (88%) and the least being payment of rent (2%). The findings of the study
on sources of income are similar to the findings of (ICLS, 2003; DSOS, 2007, & GLSS,
2008), which stated that households received income from employment (wages and
salaries), rent, remittances, and gifts. Majority of respondents (60%) also received items
from their husbands in addition to money received to manage the home. The items were
detergent, food, clothing (dresses and diapers) and fuel.
Table 4.3 Respondents’ source of income
Source of Income N (%)
Occupation/job 106 88
Remittances 91 76
Gifts 22 18
Rent 2 2
Husbands‟ contribution 72 60
Multiple response were observed
4.3.1 Average Income of Respondents
Table 4.4 presents the average monthly income and occupation of respondents. The
monthly income of respondents ranged from GH¢20 - GH¢800 and the mean household
income was GH¢128.72. The study showed that majority of respondents, (63%) earned
up to GH¢50 and about (29%) of these respondents were traders; and 7% earned GH¢150
or more. Respondents indicated that their incomes were not enough to meet all their
household needs.
University of Ghana http://ugspace.ug.edu.gh
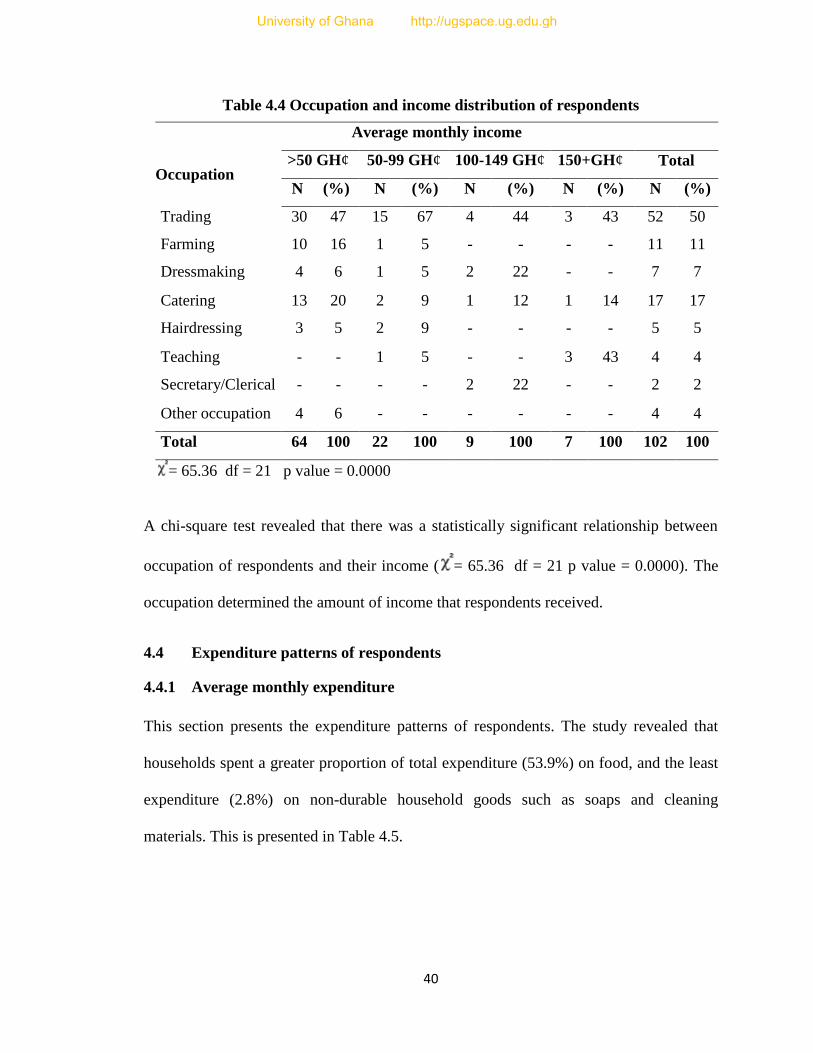
40
Table 4.4 Occupation and income distribution of respondents
Average monthly income
Occupation >50 GH¢ 50-99 GH¢ 100-149 GH¢ 150+GH¢ Total
N (%) N (%) N (%) N (%) N (%)
Trading 30 47 15 67 4 44 3 43 52 50
Farming 10 16 1 5 - - - - 11 11
Dressmaking 4 6 1 5 2 22 - - 7 7
Catering 13 20 2 9 1 12 1 14 17 17
Hairdressing 3 5 2 9 - - - - 5 5
Teaching - - 1 5 - - 3 43 4 4
Secretary/Clerical - - - - 2 22 - - 2 2
Other occupation 4 6 - - - - - - 4 4
Total 64 100 22 100 9 100 7 100 102 100
= 65.36 df = 21 p value = 0.0000
A chi-square test revealed that there was a statistically significant relationship between
occupation of respondents and their income ( = 65.36 df = 21 p value = 0.0000). The
occupation determined the amount of income that respondents received.
4.4 Expenditure patterns of respondents
4.4.1 Average monthly expenditure
This section presents the expenditure patterns of respondents. The study revealed that
households spent a greater proportion of total expenditure (53.9%) on food, and the least
expenditure (2.8%) on non-durable household goods such as soaps and cleaning
materials. This is presented in Table 4.5.
University of Ghana http://ugspace.ug.edu.gh

41
Table 4.5 Average monthly expenditure of respondents
Item Amount
(GH¢)
Percent
(%)
Food 228.62 53.9
Education expenses 37.69 8.8
Transportation 31.71 7.4
Fuel and light (electricity, kerosene, wood, gas) 24.65 5.8
Communication (use of mobile phone) 22.04 5.2
Contribution to associations 15.57 3.6
Personal care services 14.31 3.3
Remittance/gift to family members 13.73 3.2
Clothing and textiles 13.41 3.1
Health expenses 12.61 2.9
Non-durable household goods 12.01 2.8
The finding is similar to findings in literature that show the main components of
household expenditure are on food, education, transportation and health (Agyemang,
2007; NSO, 2003; Birim Central Municipal, 2006; GLSS, 2008). These are basic needs
of all families and households
4.5 Financial management systems and practices used by respondents
4.5.1 Financial management systems
Couples usually have a system2 that they agree on to manage their family income. These
systems sometimes determine which financial management practices are used by
families. The financial management systems used by respondents are presented in Figure
4.5. The study revealed that respondents used a variety of financial management systems
with the main one being the allowance systems (36%) and the least (1%) being the family
2 Refer to notes on financial management systems on section 2.7
University of Ghana http://ugspace.ug.edu.gh

42
money manager which was used by only (1%) of the respondents. The findings confirm
studies that showed that although couples pooled resources together to take care of
expenses, each partner had some private money for their own spending. Partners (in
marriage) also maintained separate control over their own income and were responsible
for specific items of expenditure Pahl (1983, as cited in Marshall and Wolley, 1993);
Horrocks, (2010).
Figure 4.5 Financial management systems used by respondents
A new financial management system was identified in the study. This was termed the
“individual system”3 by the researcher. It was used by 22% of respondents (who were
mainly women living with spouses who do not work). These women take sole
responsibility of providing and managing family income.
Table 4.6 compares the financial management systems and practices used by families and
the satisfaction they derived from it in terms of how it influenced the well-being of their
families. Some of the financial management practices included: planning what to
3 Refer to the definition of individual system in section 1.5
05
10152025303540
3633
22
62 1P
erce
nta
ge
Financial management sytems n=120
University of Ghana http://ugspace.ug.edu.gh
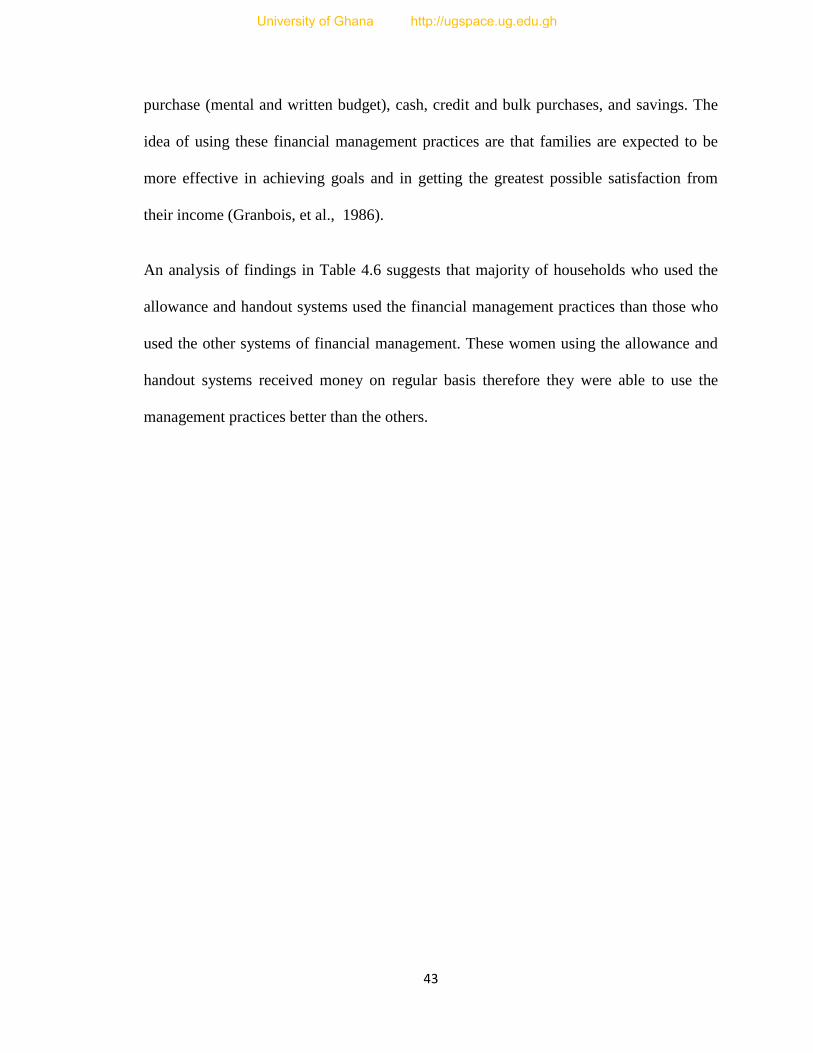
43
purchase (mental and written budget), cash, credit and bulk purchases, and savings. The
idea of using these financial management practices are that families are expected to be
more effective in achieving goals and in getting the greatest possible satisfaction from
their income (Granbois, et al., 1986).
An analysis of findings in Table 4.6 suggests that majority of households who used the
allowance and handout systems used the financial management practices than those who
used the other systems of financial management. These women using the allowance and
handout systems received money on regular basis therefore they were able to use the
management practices better than the others.
University of Ghana http://ugspace.ug.edu.gh

44
Table 4.6 Financial management systems and practices
Financial
management
systems
Financial management practices
Planned
expenditure
Record
keeping
Compared
prices
Bulk
purchases
Credit
purchases
Saved
money
Evaluation
of plan
Satisfaction
with financial
mgt
Satisfaction
with
welfare
N (%) N (%) N (%) N (%) N (%) N (%) N (%) N (%) N (%)
Allowance 21 17 9 7 42 35 16 13 10 8 31 26 36 30 33 27 17 14
Handout 15 12 2 2 37 31 14 11 16 13 25 21 30 25 27 23 17 14
Individual 14 12 1 1 26 21 8 7 11 9 16 13 16 13 16 13 13 11
Equal 3 3 1 1 7 6 2 2 3 3 5 4 7 6 5 4 4 3
Independent - - - - 2 2 - - 3 3 2 2 3 3 2 2 3 3
Family money
manager - - - - - - - - - - 1 1 1 1 1 1 1 1
University of Ghana http://ugspace.ug.edu.gh

45
To address financial management very well, a strategy needs to be designed to ensure
proper utilization of funds and prevent wasting available funds (Borade, 2011). Couples
often have differing attitudes and beliefs about family finances. Therefore for effective
financial management couples need to experiment different methods of handling finances
until a system that works well for the family is achieved (Leigh & Clark 2000).
4.5.2 Ways of spending income
Financial management demands that any available money to the family should be spent
wisely in order to derive maximum satisfaction for family members. This section presents
information on how money was spent by the study sample. Table 4.7 shows how
respondents plan and spend their income.
Table 4.7 Plan for expenditure and spending money
Spending money
Plan of expenditure
Total Written Mental
N (%) N (%) N (%)
Plan before spending 11 85 42 39 53 44
Spend when necessary 2 15 65 61 67 56
Total 13 100 107 100 120 100
= 9.67 df = 1 p value = 0.0018
An analysis of the table above using the chi-square test revealed that there is a significant
relationship between plan of expenditure and how money was spent ( = 9.67 df = 1 p
value = 0.0018). About 44% of the respondents plan before spending. Majority of these
did mental instead of written planning of expenditure. This is confirmed in literature that
although, a budget is necessary no matter the amount of income available because it
University of Ghana http://ugspace.ug.edu.gh

46
enables individuals to take critical look of their needs and wants before parting with
money, majority of families did mental planning (Hevi-Yiboe, 2004 p.17; Muske &
Winter, 2004; 82).
4.5.3 Household financial decision making
The management process involves careful decision making to reach goals with the least
expenditure of time, energy and money (Sparks, 2008). It is important to make careful
decisions and manage wisely the resources available. From the study, majority of the
respondents indicated that they decided how to use family income with their spouses
before the income was used. About 47% of the respondents decided how to use their
family income most often; 17% of the respondents took decisions on the use of their
income less often and 36% took separate decisions on the use of family income. Decision
making in the family implies that more than one member‟s suggestion is involved
(Sparks, 2008), and families goals, values, needs and wants are considered (FEFE, 2009).
4.5.4 Purchases
Majority of the women (95%) observed good financial management practices as
indicated in Table 4.6 such as comparing prices of items before buying and a minority
(33%), purchased items for household use in bulk. The items bought in bulk include food,
detergents, and clothes. When prices of items are compared before purchases are made, to
some extent it enables quality goods to be bought at moderate prices. Bulk buying also
saves money in terms of getting bulk goods at reduced prices and also saves money on
transportation cost. Besides it enables household goods to be available most of the time.
University of Ghana http://ugspace.ug.edu.gh

47
4.5.5 Credit purchases
About 36% of the women bought household items on credit to supplement their income
for the family. Even though credit purchases can affect a family‟s financial management
in the long run because additional money is paid on credit purchases than on cash
purchases, it helps to ease a family‟s burden of being able to provide enough household
needs.
On the other hand, credit transactions could be as a result of the absence of a financial
budget. Without a budget specifying how available income could be used, wants may be
satisfied before realizing that there were needs which have not been satisfied.
Respondents made purchases of household items on cash and on credit. Apart from
buying on cash, which all the respondents did, 10% of the women bought on credit and
made part payment. However, 64% of the women made no credit purchases.
Those who made credit purchases give the following reasons: money not enough for cash
purchases (69%), most of the family‟s needs were met (17%); credit purchases are paid
for in installment and does not put stress on family income (9%); and items sold on credit
look attractive (5%). Table 4.8 shows how respondents made their credit purchases.
University of Ghana http://ugspace.ug.edu.gh
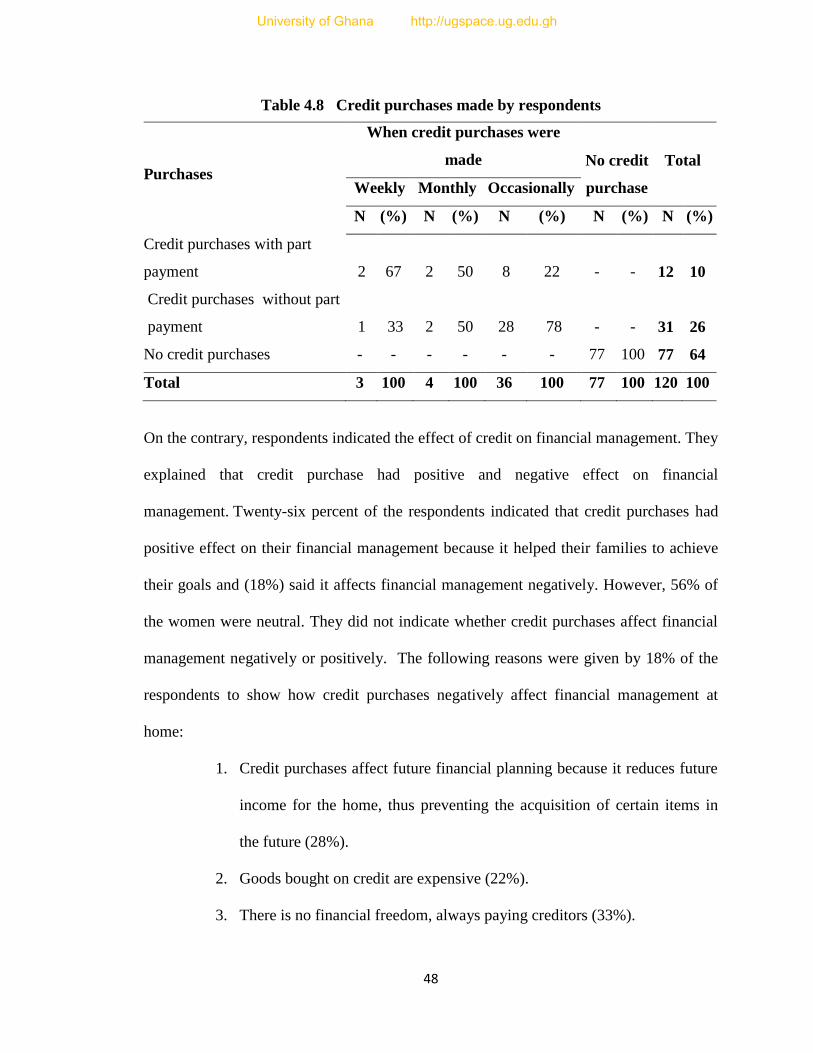
48
Table 4.8 Credit purchases made by respondents
Purchases
When credit purchases were
made No credit
purchase
Total
Weekly Monthly Occasionally
N (%) N (%) N (%) N (%) N (%)
Credit purchases with part
payment
2
67
2
50
8
22
-
-
12
10
Credit purchases without part
payment
1
33
2
50
28
78
-
-
31
26
No credit purchases - - - - - - 77 100 77 64
Total 3 100 4 100 36 100 77 100 120 100
On the contrary, respondents indicated the effect of credit on financial management. They
explained that credit purchase had positive and negative effect on financial
management. Twenty-six percent of the respondents indicated that credit purchases had
positive effect on their financial management because it helped their families to achieve
their goals and (18%) said it affects financial management negatively. However, 56% of
the women were neutral. They did not indicate whether credit purchases affect financial
management negatively or positively. The following reasons were given by 18% of the
respondents to show how credit purchases negatively affect financial management at
home:
1. Credit purchases affect future financial planning because it reduces future
income for the home, thus preventing the acquisition of certain items in
the future (28%).
2. Goods bought on credit are expensive (22%).
3. There is no financial freedom, always paying creditors (33%).
University of Ghana http://ugspace.ug.edu.gh

49
4. If payments are not made on time, it can lead to misunderstanding
between creditors and debtors and can bring reproach on the family (17%).
4.5.6 Family savings and loans
Although respondents claimed their income was not enough, majority of them (67%)
saved money. This is a good financial management practice. This finding is however
contrary to some studies in literature that only a minority of families save money
(Ormsby & Fairchild, 1987; Kwahu West Municipal Assembly, 2006; and GLSS, 2008).
The minority of women (33%) who did not save money gave the following reasons for
not saving:
1. Income was not sufficient (30%).
2. Money for family use was not sufficient (30%).
3. They do not have money to even take care of all family needs (20%).
4. They do not have any job (10%).
5. They were paying for a loan and therefore did not have excess money to
save (10%).
The study went further to assess how frequent respondents saved money. A summary of
their responses is presented in Table 4.9. The finding suggests that majority of women
(67%) saved some money with most either saving weekly (38%) or monthly (25%). This
was similar to findings that majority of women in Ghana save a little money
(myjoyonline.com, 2012). Women are often in charge of household finances and because
of this, most women try to save despite the little income at their disposal (Barber, 2012).
It is expected that regular savings which is necessary helps to meet some of the family‟s
University of Ghana http://ugspace.ug.edu.gh

50
needs especially during emergency situations. However, only 20% of respondents who
saved money were able to handle emergency situations well.
Table 4.9 Frequency of saving by respondents
Frequency of saving N (%)
Daily 12 15
Weekly 30 38
Monthly 20 25
Occasionally 18 22
Total 80 100
Means of Saving
Respondents who saved money used different means of saving their money and this is
presented in Table 4.10. The study revealed that only 4% of the respondents had multiple
means of saving. About 44% of the women saved money with a (ROSCA). The
respondents claimed that these associations were formed by small groups of people and
were much more reliable than the old system of saving money with susu collectors.
However, 10% of the respondents believe that they can save and have full control over
their money in a susu box.
Table 4.10 Means of saving money
Means of saving N (%)
ROSCA 35 44
Bank 27 34
Susu collector 10 12
In a susu box 8 10
Total 80 100
University of Ghana http://ugspace.ug.edu.gh

51
Investment plans
The investment plans of the women are presented in Table 4.11. Families find a way of
creating financial security for the future and this is normally done in a way that is suitable
for the family. This study found that women invested their monies in different ventures
for their future.
Table 4.11 Investment by respondents
Type of investment N (%)
Savings 80 67
Housing project 9 7
Business investment 7 6
Education 6 5
SSNIT 4 3
No investment 14 12
Total 120 100
Multiple responses were observed
The study revealed that majority of the women 88% had some form of investment and
most of them (67%), had their investment in the form of savings whilst 3% of the women
were specifically relying on (SSNIT) as a form of their financial security for the future.
Mean while, 12% of the women do not have any form of investment.
Family Loan
Only 13% of the women took loans from; friends, family members, money lenders and
banks for the upkeep of their homes and also for investment in their businesses. The
minimum interest paid on the loan in a month was GH¢13 and the maximum interest paid
was GH¢22. About 5% of the women took loans from banks; 3% of the women from
University of Ghana http://ugspace.ug.edu.gh

52
family members; another 3% from money lenders; and the remaining 2% took their loan
from friends. This finding is similar to that of the GLSS, (2008), that 27% of all
households owe money or goods to other persons, institutions or businesses and also over
half of household loans come from relatives, friends and neighbours.
4.6 Evaluation
Evaluation as part of the home management process is very important because it helps to
assess the progress of a plan. The analysis and effectiveness of the implementation is
determined by evaluation (Hevi-Yiboe, 2004). Respondents were asked if they reviewed
their budgets and the responses were that 78% of respondents reviewed their budgets and
made effort to provide unmet needs. This finding is consistent with Sherin, (2011) that
financial planning is a lifelong process that requires ongoing review. The rest of the
respondents (22%) said they do not evaluate their budgets but rather plan to provide new
needs.
4.7 Welfare of family
This section assesses the welfare of respondents by looking at factors that impact on the
welfare of the family. Essential indicators of welfare are happiness; well-being,
capabilities that is, being capable of attaining high level of education and working to earn
income and being capable of managing income, and not living in poverty (Greve,
(2008).Welfare was assessed using the World Health Organization Quality of Life Bref
(WHOQOL-BREF) June 1997, (Refer to Appendix 2).
University of Ghana http://ugspace.ug.edu.gh

53
4.7.1 Provision of housing by respondents
As stated earlier, respondents lived in different types of houses but this section looked at
the number of people who lived in one room. This was necessary to check the welfare of
families in terms of providing accommodation for its members. Table 4.12 presents the
number of persons in one room and the residence status of respondents. The study
revealed that 44% of families had enough room space (accommodation), which is on the
average two persons sleep in one room. By the GSS, 2005 standard, the room occupancy
ratio of a household is a measure of housing adequacy. Any room occupancy ratio in
excess of two persons per room is an indication of overcrowding (Boamah, 2010).
Therefore 56% of families lived in overcrowded room: 21% of these families lived in
family houses, another 21% of those who lived in overcrowded rooms were in rented
apartments, and 2% lived in uncompleted houses belonging to other people. This could
be expected because in our traditional setting, family houses belonged to a large number
of people and the houses are mostly overcrowded.
Table 4.12 Number of persons in a room and occupancy status
Residence/Occupancy status
Number of
persons in a
room
Rented Owned
Family
house Squatting Total
N (%) N (%) N (%) N (%) N (%)
One person 3 7 0 0 3 7 0 0 6 5
Two persons 13 62 15 54 18 38 1 33 47 39
Three to eight 26 31 13 46 26 55 2 67 67 56
Total 42 100 28 100 47 100 3 100 120 100
University of Ghana http://ugspace.ug.edu.gh

54
The phenomenon of paying for rent in advance may also be a factor why some families
lived in overcrowded rooms because they could not afford to pay for houses with enough
room space for their families. As stated earlier in this study, 65% of the respondents did
not spend any money on either rent or maintenance of their houses, yet 56% of the
respondents could not provide enough room space for their families. Therefore housing
as aspect of family welfare was not well catered for by majority of the families. On the
other hand, respondents could be ignorant about the room occupancy ratio as specified by
GSS, (2005), so providing enough room space for family members was not their priority.
The provision of enough room space should be a priority for families in order to improve
the well-being of family members.
4.7.2 Families who seek medical treatment
The study revealed that majority of the women (82%) sought medical treatment at the
clinic or hospital almost always, because there is a clinic at Danfa, (17%) sought medical
treatment less often while (1%) of respondents did not seek medical treatment at the
clinic or hospital. To further access the welfare of the respondents in terms of their
health, their levels of satisfaction with their provision of medical treatment was assessed.
Eighty-three (83%) of the respondents were satisfied with their provision of medical
treatment while (17%) of the respondents were not satisfied with the provision of medical
treatment. About 29% of respondents used National Health Insurance Scheme (NHIS) to
access medical treatment. Good health for family members is one of the key elements of
family welfare. Since majority of the respondents were able to provide good health for
their families, then it was sign of good welfare.
University of Ghana http://ugspace.ug.edu.gh

55
4.7.3 Provision of educational needs by respondents
Table 4.13 below shows how well respondents were able to pay for education of family
members and the satisfaction derived from provision of educational needs of family
members. Even though 25% of the women had no formal education and 62% had
attained only basic education, yet they saw the need to educate their children. This
decision is in the right direction since education is the key to success. Majority of the
women (92%) were able to pay for the education of their family member most often and
were satisfied with the provision of educational needs. There was however, no
statistically significant relationship between ability to pay for education and the
satisfaction with the provision of health needs. A reason for respondents‟ ability to afford
education was because of free education in public schools. Education of family members
enhances financial decision making and thus helps to improve family welfare.
Table 4.13 Ability to pay for education and satisfaction with provision of education
Able to pay for
education
Satisfaction with provision of education
Satisfied Not satisfied Total
N (%) N (%) N (%)
Most often 92 100 19 68 111 93
Less often - - 9 32 9 7
Total 92 100 28 100 120 100
4.7.4 Satisfaction from savings
Savings represent the part of income which is not used in the present but serves as a
reliable source of income in the case where regular income was not available. It also
enables families to have sound mind because they can handle emergencies well. Table
4.14 presents respondents opinion about their satisfaction with saving money.
University of Ghana http://ugspace.ug.edu.gh

56
Respondents were asked to indicate how well they were satisfied with their savings.
About 79% of respondents indicated that they were not satisfied with their savings whilst
only 21% of respondents indicated that they were satisfied with their savings. There was
statistically significant relationship between savings and satisfaction with savings ( =
12.227 df =1 p<0.0004). A savings survey undertaken by Banking on change, a
partnership between Barclays, Care International UK and Plan UK (2012), found that
majority of women in Ghana save a little money each month.
Table 4.14 Saving money and satisfaction with savings
Satisfaction with
savings
Saving money
Total Saved Do not save
N (%) N (%) N (%)
Satisfied 24 30 1 2 25 21
Not satisfied 56 70 39 98 95 79
Total 80 100 40 100 120 100
= 12.227 df =1 p<0.0004
About 56% of those who saved were not satisfied with their savings. About 34% of
respondents saved between GH¢30 and GH¢80 a month, 22% of the women saved
occasionally and they normally reinvest their savings in their business, and (44%)
respondents saved money with a Rotating Savings and Credit Association (ROSCA)
could only receive the bulk of their savings based on the terms of payment agreed by the
group (for example weekly or monthly). Furthermore, 12% of the respondents saved
money with a susu collector and 10% of the respondents saved in a susu box at home.
These two groups (saving with susu collectors and saving in susu box) use their money
University of Ghana http://ugspace.ug.edu.gh

57
any time they want. The above facts from the data confirm that respondents did not
handle financial emergencies adequately.
4.7.5 Provision of basic needs
It is the wish of most families to provide its members with their basic needs as a way of
improving the welfare of their members. As stated earlier, respondents set priorities when
they provided the needs of their families. This section looks at the basic needs provided
by the families and the satisfactions derived from the use of these needs.
Table 4.15 Satisfaction with provision of basic needs
Basic needs
Satisfaction with needs
Not satisfied Satisfied Total
N (%) N (%) N (%)
Food 4 3 116 97 120 100
Clothing 16 13 104 87 120 100
Room space 48 40 72 60 120 100
Health 20 17 100 83 120 100
Education 24 24 76 76 100 100
Savings 96 80 24 20 120 100
Handling emergencies 99 82 21 18 120 100
= 316.354 df = 6 p = 0.000
The findings show that with the exception of savings and handling emergencies, majority
of respondents were satisfied with the provision of their basic needs. There was
statistically significant relationship between provision of basic needs and satisfaction
with basic needs ( = 316.354 df = 6 p = 0.000).
University of Ghana http://ugspace.ug.edu.gh
58
The simple logit regression was used to investigate how some social characteristics of
respondents and financial management practices that they used influenced the welfare of
their families. The dependent variable was welfare of families. The details are presented
in the Table 4.16 below.
Table 4.16 Simple logit regression of determinants of welfare of families
Variable Coefficient
Average Partial
Marginal Effects
Age 0.3283(0.412)*** 0.0253
Satisfaction with management of finances 7.7859(0.387)*** 0.3817
Household size -0.4834(0.203)*** -0.0372
Household income -0.0463(0.010)*** -0.0036
Husband's age -0.2841(0.036)*** -0.0219
Unplanned spending 1.5583(0.495)*** 0.125
Ethnicity
Dangbe -8.2336(1.250)*** -0.5098
Akan -5.8467(2.775)*** -0.3702
Ewe -1.4627(1.993) -0.1221
Religious affiliation
Other religions -3.3614(1.098)*** -0.2758
Type of dwellings
Detached 2.8771(1.098)*** 0.1883
Residence status
Owned -4.0354(0.383)*** -0.2739
Family house -0.195(0.979) -0.0152
Educational level
Elementary/Middle education 1.5575(0.472)*** 0.1002
Junior High School -4.147(2.683)* -0.2295
Senior High School 2.2615(0.592)*** 0.1229
Voc./Comm. education -4.5221(1.941)*** -0.3473
Intercept 11.7647(4.777)***
Pseudo R – Squared 0.4973
Log pseudo likelihood -16.991934
* Significant at 10%; ** Significant at 5%; *** Significant at 1%. Robust standard errors in parentheses in
column 2
University of Ghana http://ugspace.ug.edu.gh
59
The analysis of the logit regression revealed that some variables had positive influence
while others had negative influence on the well-being of families. The variables that had
positive influence were: age of respondents, satisfaction with management of finances,
unplanned spending, ethnicity (Ga ethnic group), type of dwelling (detached), and
educational level (Elementary/Middle and Senior high school). The following were the
variables which had negative influence on the well-being of families: household size,
household income, ethnicity (Dangbe, Akan and Ewe), residence status, and educational
level (Junior high and Voc/Comm. school).
Age
There was a positive relationship between the age of the respondents and welfare. This
implies that being a year older can bring an improvement in welfare of respondents. This
is attributed to the fact that as people grow, they mature and gain more experience in
handling situations and therefore take decisions that helps to bring satisfaction.
Satisfaction with management of own finances
Again, there is a positive relationship between welfare and the independent variable
„satisfaction with management of own finances‟; that is a woman who managed her
finances well was more likely to have positive influence on her family‟s welfare as
compared to a woman who do not manage her finances well. This shows that financial
management is good and therefore had positive influence on the welfare of families.
Unplanned spending
Interestingly, women who did not plan before spending or spend as and when necessary
were also found to have positive influence on the welfare of their families. This group of
University of Ghana http://ugspace.ug.edu.gh

60
women constitutes about 56% of the total sample. Even though they did not plan before
spending, they observed some financial management practices which had positive
influence on the welfare of their families. For instance 53% of them compared prices of
goods before buying, about 51% of them provided basic needs before other items and
27% bought goods on credit to supplement their household needs.
Household size
Household size relates negatively with the dependent variable „welfare of families‟. If a
household size is less by one person, there is a higher probability of having a positive
influence on welfare of the family. In other words the study indicates that for households
to have improved welfare, the household size should be less than four.
Ethnicity
With ethnicity, the Ga ethnic group was used as a reference to Dangbe, Akan and Ewe4.
Ga ethnic group were more likely to have positive influence on their welfare than other
ethnic groups in the study. The Gas‟ might have more sense of belonging and access to
ownership (house or farm land) because they are the indigenous ethnic group.
Type of dwelling and occupancy status
Women dwelling in detached houses have positive influence on their families‟ welfare
compared to women living in compound and hut houses. Interestingly women who own
and live in their houses did not have positive influence on their families‟ welfare (that is
4 Ethnicity variable is a discrete variable; therefore the responses become variables which are referred to as dummy
variables (each response was re-coded as a variable). Therefore the variable which was not included in the regression
became the reference variable of which the others were compared. Variables without asterisk are the same as the
reference variable.
University of Ghana http://ugspace.ug.edu.gh
61
their occupancy status did not influence their welfare positively). Owning a house is
therefore not a guarantee for happiness, therefore to increase welfare of families owning a
house should not be an issue.
Educational level
Women with Elementary/Middle school and Senior High School background had
improved welfare as compared to women who had attained education up to the Junior
High and Vocational/ Commercial School levels.
4.8 Test of hypotheses
Two null hypotheses were postulated for the study. HO1: There is no relationship
between financial management by respondents and family welfare and HO2: There is no
relationship between level of income of respondents and family welfare. A chi-square test
was used to test the hypotheses.
Hypothesis 1
Table 4.17 shows the relationship between financial management and family welfare.
The result showed there was statistically significant relationship between financial
management and family welfare ( = 21.139 df = 1 p = 0.000). Therefore the null
hypothesis was rejected. This result showed that financial management does enhance
family welfare. Women who managed their finances well had a higher probability of
having enhanced welfare as compared to women who did not manage their finances well.
University of Ghana http://ugspace.ug.edu.gh
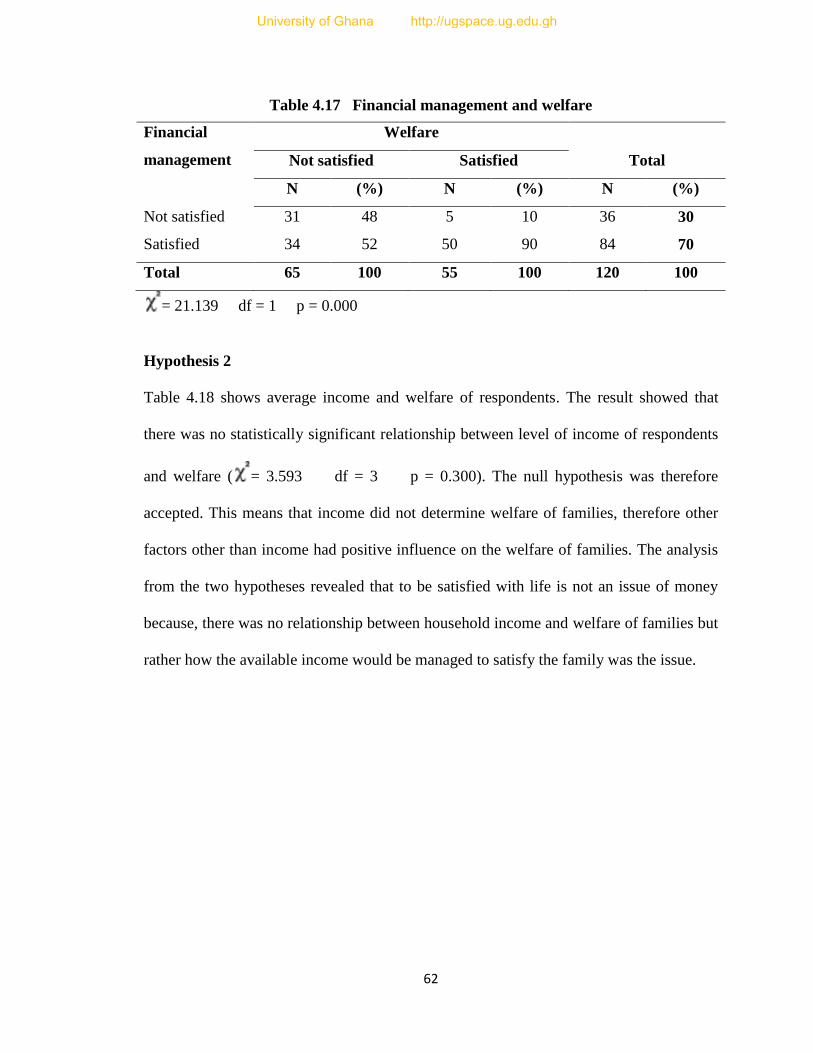
62
Table 4.17 Financial management and welfare
Financial
management
Welfare
Not satisfied Satisfied Total
N (%) N (%) N (%)
Not satisfied 31 48 5 10 36 30
Satisfied 34 52 50 90 84 70
Total 65 100 55 100 120 100
= 21.139 df = 1 p = 0.000
Hypothesis 2
Table 4.18 shows average income and welfare of respondents. The result showed that
there was no statistically significant relationship between level of income of respondents
and welfare ( = 3.593 df = 3 p = 0.300). The null hypothesis was therefore
accepted. This means that income did not determine welfare of families, therefore other
factors other than income had positive influence on the welfare of families. The analysis
from the two hypotheses revealed that to be satisfied with life is not an issue of money
because, there was no relationship between household income and welfare of families but
rather how the available income would be managed to satisfy the family was the issue.
University of Ghana http://ugspace.ug.edu.gh
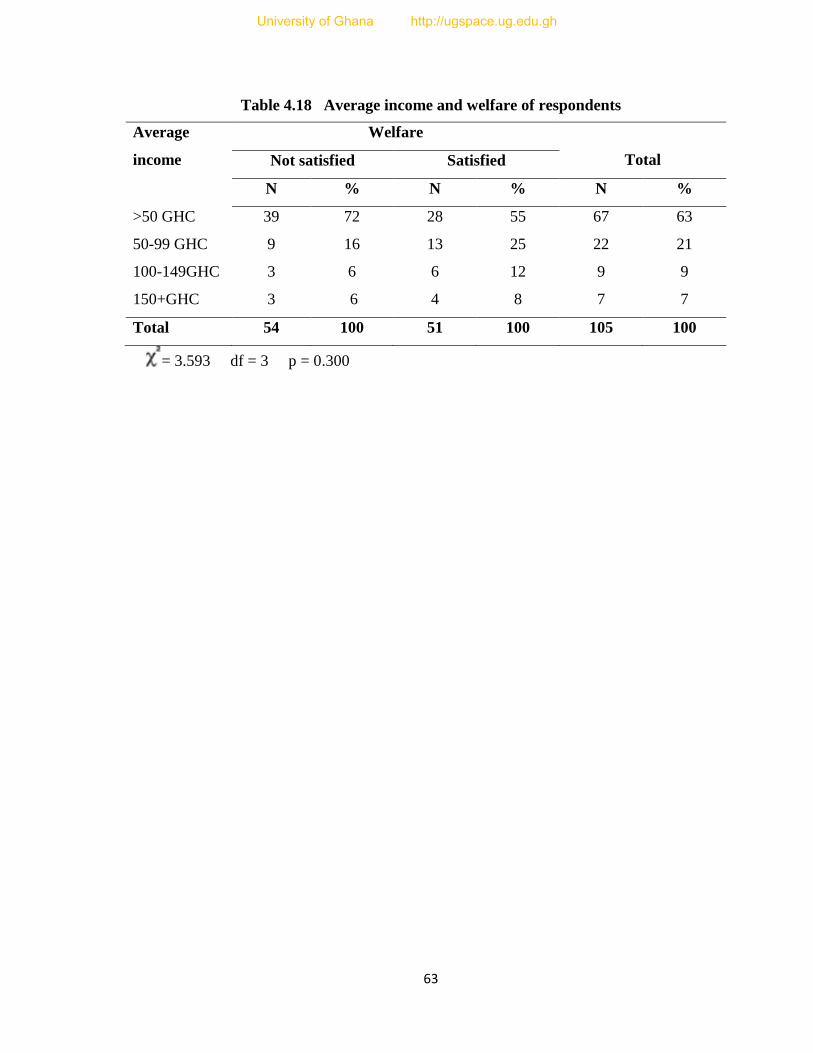
63
Table 4.18 Average income and welfare of respondents
Average
income
Welfare
Total Not satisfied Satisfied
N % N % N %
>50 GHC 39 72 28 55 67 63
50-99 GHC 9 16 13 25 22 21
100-149GHC 3 6 6 12 9 9
150+GHC 3 6 4 8 7 7
Total 54 100 51 100 105 100
= 3.593 df = 3 p = 0.300
University of Ghana http://ugspace.ug.edu.gh

64
CHAPTER FIVE
SUMMARY, CONCLUSIONS AND RECOMMENDATIONS
5.1 Introduction
This chapter presents a brief summary of this study. It also draws conclusions and gives
recommendations for future research.
5.2 Summary
The study was conducted to find out financial management systems and practices used by
rural women in the Ga East District of the Greater Accra Region and their influence on
the welfare of their families. The specific objectives of the study were to: identify the
various sources of income of respondents, investigate how women spend their income,
examine the different financial management systems and practices used by women and
assess how income management by women influence the welfare of their members. It
was hypothesized that: HO1: There was no relationship between financial management by
respondents and family welfare; and HO2: There was no relationship between level of
income of respondents and family welfare.
The systematic random sampling technique was used to select respondents from Danfa
and Adoteiman for the study. A structured interview schedule was developed and used
for the data collection. The data were analysed using the Census and Survey Processing
(CSPro 4.1) software and Predictive Analytic software (PSAW 18.1) programmes. The
Statistical/Data Analysis (Stata) software programme was used for the regression analysis
to find out the contribution of selected variables to the welfare of the households and the
chi-square statistical test was used to test the two null hypotheses. The data was
University of Ghana http://ugspace.ug.edu.gh

65
presented in the form of frequency and percentage distribution tables, graphs and pie
charts.
Respondents‟ ages ranged from 22 to 55 years, with their average age being 34.5 years.
More than half of the women (61%) were married and 62% had basic education. The
average household size was 4.0. Majority of the respondents, (80%) lived in compound
houses, 39% owned houses. Most of the respondents (82%) worked in the informal
sector. The mean household income was GH¢128.72 per month. Respondents received
income from various sources with 88% receiving from their occupation. The study
revealed that greater proportion of total expenditure was on food (53.9%) and the least
expenditure of (2.8%) was on non-durable household goods such as soaps and cleaning
materials.
The respondents used a variety of financial management systems with the main one being
the allowance system and the least used system being the family money manager system.
The respondents also practiced various financial management practices including mental
planning of expenditure (89%). Only one-third of the women (33%) bought household
goods in bulk. Respondents gave priority to basic needs when purchasing items for the
home. About 36% of the respondents bought household items on credit to supplement
what they buy on cash. Two-thirds of the women (67%) saved money but majority of
them were not satisfied with their savings. The women had some investments in the form
of savings, buildings, business investment and education of their children. About 79% of
the respondents indicated that they could not handle emergencies well because of
insufficient savings. With regards to evaluation of plan as part of good management
University of Ghana http://ugspace.ug.edu.gh
66
practice, 78% of the women indicated that they evaluated their plans. A number of factors
influenced the welfare of families. These are: age of respondents, management of
finances, household size, household income, type of dwelling, ethnicity and educational
level of respondents.
Two null hypotheses were tested using the chi-square test. The chi-square test revealed
that there was a positive relationship between management of finances and welfare,
therefore the first null hypothesis was rejected. Women who were able to manage their
finances well had a higher probability of having enhanced welfare as compared to women
who did not manage their finances well. The chi-square test was used again to test the
second null hypothesis and it revealed there was statistically no significant relationship
between household income and family welfare. The null hypothesis stating that there is
no relationship between level of income of respondents and family welfare was therefore
accepted.
The logit regression analysis revealed that some variables had positive influence while
others had negative influence on the well-being of families. The variables that had
positive influence were: age of respondents, satisfaction with management of finances,
unplanned spending, ethnicity (Ga ethnic group), type of dwelling (detached houses), and
educational level (Elementary/Middle and Senior high school). The following variables
had negative influence on the well-being of families: household size, household income,
ethnicity (Dangbe, Akan and Ewe), residence status, and educational level (Junior High
and Vocational/Commercial School).
University of Ghana http://ugspace.ug.edu.gh

67
5.3 Conclusion
In conclusion, Ga rural women in Danfa and Adoteiman used various financial
management systems such as allowance, handout, individual and equal salary systems;
and financial management practices such as planning expenditure, saving money, making
bulk purchases and evaluating financial plans. Their financial management practices
influenced their family welfare both positively and negatively. Family income was low
and the use of credit which seems to contribute to family welfare was also low. In
addition to their financial management practices certain demographic characteristics like
age of respondents, residence occupancy, ethnicity and education also influenced family
expenditure which influenced family welfare.
5.4 Recommendation
In the light of these findings it is recommended that:
1. Since the study revealed that women who attained education up to the Senior
High School level or higher were more satisfied with life than those who had
informal education, it is suggested that the rural folk be sensitized by relevant
stakeholders (for example, Ministry of Education) through programmes like
music and cultural festivals, counseling programs in schools to educate the girl
child and encourage more girls to be educated. In addition financial management
should be incorporated into the school curriculum from the Junior High School
level so that in future they could manage their finances better.
2. It was also realized that a greater proportion of household expenditure was on
food. It is suggested that relevant stakeholders e.g. the Ministry of Agriculture,
University of Ghana http://ugspace.ug.edu.gh

68
NGO‟s should encourage rural women to engage in small scale farming and
other income generating activities to help increase the family income and also
reduce expenditure on food.
3. Public health workers should also intensify their education on family planning
methods to help control household size, because the study showed that household
size relates negatively to welfare of families. This implies that the less the size of
the household the more families would have enhanced welfare.
4. Relevant stake holders including Department of Family and Consumer Sciences
of the College of Agriculture and Consumer Sciences of the University of Ghana
and NGO‟S could organize training programmes to enlighten the women on
financial management practices to help reduce unnecessary household
expenditure.
University of Ghana http://ugspace.ug.edu.gh

69
BIBLIOGRAPHY
Agyemang, D., (2007). A Comparative study of Financial Management Practices of
Women in the Formal and Informal Sectors at Dodowa. A Thesis presented to the
University of Ghana in partial fulfillment of the requirement for the award of
Master of Philosophy Degree in Family Resources Management.
Avery R. B., & Kennickell A. B., (1991). Household Savings in the U.S. Review of
Income and Wealth. Vol. 37 Issue 4.
Balance T., (2011). Money Management. Balance Track. Retrieved from
http://www.balancetrack.org/moneymanagement/podcast.html
Barber R., (2012). Global Community Investment, Barclays. Retrieved March 10, 2012,
from http://wwwhuffintonpast.cp.uk/newwsinternational-womens-day
Barclays, Care International UK and Plan UK., (2012). Myjoyonline.com March 9, 2012.
Retrieved from
http://www.business.myjoyonline.com/page/news/20120382955.php&contentid
Barnett, L., (2010). Why women are better handling the family cash. Retrieved May 28,
2013, from http://www.express.co.uk/news/uk/162497/why-women-are-better-
handling-the-family-cash
Beutler, I. F. & Mason, G. W., (1987). Family cash-flow budgeting. Home Economics
University of Ghana http://ugspace.ug.edu.gh

70
Research Journal, 16(1)
Birim Central Municipal, (2006). Retrieved August 2, 2012, from
http://www.birimcentral.ghanadistricts.gov.gh/?arrow=asp&_=69
Boamah, N. A., (2010). Housing Affordability in Ghana: A Focus on Kumasi and
Tamale. Ethiopian Journal of Environmental Studies and Management.Vol. 3 No.
3.
Borade, G., (2011). Retrieved from
http://www.buzzle.com/articles/financial-management-styles-and-
techniques.html
Brown, C. K., (1994). Gender Roles in Household Allocation of Resources and Decision-
Making in Ghana.The family and Development Programme, University of Ghana.
Chang, Y. R., (1994). Saving Behaviour of US 1980‟s; Results from the 1983 and 1986
Survey of consumer finance. Retrieved October 24, 2013, from
http://www.afcpe.org/assets/pdf/vol53.pdf 24-10-13.
Chatzky, J., (2012). The Ten Commandments of Financial Happiness. Retrieved from
http://www.chatzky.ten.commandments.financial.happiness.
Davis, E.P. and Carr, R. A., (1992). Budgeting Practices over the Life Cycle. Retrieved
October 24, 2013, from
http://www.academic.research.microsoft.com/Paper/6375264.spx
University of Ghana http://ugspace.ug.edu.gh

71
Deacon, R. E. and Firebaugh, F. M., (1988). Family Resource Management. Principles
and Applications, Second Edition. Allyn and Bacon, Inc.
Division of Statistics Office of Statistics, (DSOS)., (November 2007). Budget and
Economic Management, Overseas Development Assistance and Compact
Management Federated States of Micronesia, Palikir, Pohnpei FM 96941
Elmblad, S., (2013). Financial Software Guide, About.com Guide. Retrieved May 7,
2013, from http://www.financialsoft.about.com/bio/Shelley-Elmblad=70326.html
Edmonds, M., (2013). How stuff works, Inc. Retrieved May 7, 2013, from
http://www.howstuffworks.com/men-women-roles-changing.html
Family Economics & Financial Education, (September, 2009). Take Charge America,
Inc., University of Arizona.
Frankle, N., (2013). WealthPilgrim. Retrieved May 19, 2013, from
http://www.wealthpilgrim.com/what-is-money-management/
Freeman, S., (2006). Retrieved July 24, 2011, from
http://www.sheilafreemanconsulting.biz/index.htm
Ghana Statistical Service, (2000). Ghana Living Standard Survey: Report of the fourth
round (GLSS 4)
GhanaStatistical Service, (2008). Ghana Living Standard Survey: Report of the fifth
round (GLSS 5).
University of Ghana http://ugspace.ug.edu.gh

72
Godwin, D. D., (1990). Family Financial Management Vol. 39, No. 2 (Apr., 1990). pp.
221-228. Athens: National Council on Family Relations.
Retrieved from http://www.jstor.org/stable/585728.
Granbois, D. H., Rosen, D. L., & Acito, F., (1986). A Developmental Study of Family
Financial Management Practices in Advances in Consumer Research Volume
13, eds. Richard J. Lutz, Provo, UT : Association for Consumer Research. Pp.
170-174.
Greve, B., (2008). What is welfare? Central European Journal of Public Policy.Vol. 2 No.
1.Roskilde University.
Hevi- Yiboe, L. A. P., (2004). Family Resource Management in Action. The Shepherd
Printing Press, Accra.
Hilgert, M. A., Hogarth, J. M. and Beverly, S. G. (2003). Household financial
management: The connection between knowledge and behavior. Federal Reserve
Bulletin July, 2003.
Hira, T. K. (1987). Satisfaction with money management practices among dual earner
households. Journal of Home Economics, 79, 19-22.
Horrocks, A. M., (2010). Financial Management Practices and Conflict Management
Styles of Couples in Great Marriages (Master‟s Thesis, Utah State University)
Illinois Department of Commerce and Economic Opportunity (IDCEO), (2013).
University of Ghana http://ugspace.ug.edu.gh
73
International Conferences of Labour Statisticians, (ICLS)., (3rd December 2003). United
Nations.
Kwahu West Municipal Assembly, (2006). Retrieved May 9, 2013, from
http://kwahuwest.ghanadistricts.gov.gh/?arrow=atd&_=79&sa=2146
Leigh, S. and Clark, J. A., (2000). Financial Decision Making in Step Families. Outreach
and Extension, University of Missouri Extension – Colombia. pp 1-6.
Marshall, J. J. & Wolley, F., (1993).“What‟s Mine is Mine And What‟s Yours is Ours:
Challenging the Income Pooling Assumptions”, in Advances in Consumer,
Research Volume 20, eds Leigh Alister and Michael L. Rothschild, Provo, UT:
Association for Consumer Research, Page: 541-545.
McCracken, M., (2001). Women as Consumers. UNPAC, The Netherlands.
Minot, N. and Dewina, R., (2010). Impact of Food Price Changes on Household Welfare
in Ghana. International Food Policy Research Institute, Washington, DC, USA.
Muske, G., (1995). Family Financial Management: A Case Study from the Perspective of
the Money Manager. Journal of the Family Economics and Resource
Management Division of AAFCS. Iowa State University. pp 120-135.
National Statistics Office, (NSO)., (2003). Family Income and Expenditure Survey,
Volume 1. Republic of the Philippines, Manila.
Nosé, C., (2010). The role of modern women in the family structure. Retrieved from
University of Ghana http://ugspace.ug.edu.gh

74
http://www.online-guide.nosecnet.com
Nyman, C. (1999). Gender equality in „The Most Equal Country in the world‟? Money
and Marriage in Sweden. Sociological Review, 47, 766-793.doi: 101111/1467-
954x.00195
Olsen, C. & George, D. M. (2004). Cross-Sectional study design and data analysis,
College Entrance Examination Board.
Olson, D. H., Olson-Sigg, A., & Larson, P. J. (2008). The couples check up. Nashville,
TN: Thomas Nelson.
Oppenheim, I., (1972). Management of the Modern Home. Macmillan Publishing Co.,
Inc.
Oppong, C. and Abu, K., (1987). Seven Roles of Women: Impact on Education,
Migration and Employment on Ghanaian Mothers, ILO, (Geneva).
Ormsby, P. and Fairchild, T., (1987). Perceived Income Adequacy and Selected Financial
Management Practices among Families in Chile and Mexico. Socila Indicators
Research 19, 317-327. D. Reidel Publishing Company.
Osteen, S. R. and Neal, R. A., (2012). Couples and Money: Let‟s Talk about it.
Oklahoma State University. pp. T-4201-5.
Owusu-Ansah, D., (November 1994).“The Position of Women”.A Country Study: Ghana
(La Verle Berry, editor). Library of CongressFederal Research Division.
University of Ghana http://ugspace.ug.edu.gh
75
Patil, M., (2012). Management Functions and Process. Gaurav Akrani. Retrieved April
29, 2012, from http://kalyan.city.blogspot.com/2010/06/management-functions-
process-management.html
Park, J., Turnbull, A. P. and Turnbull, H. R., (2002). Impacts of Poverty on Quality of
life in Families of Children with Disabilities.Vol.68. No. 2, University of Kansas.
pp. 151-170.
Pine, K. J., (2009). Report on a Survey into Female Economic Behavior and the Emotion
Regulatory Role of Spending. Sheconomics Survey Report. University of
Hertfordshire. pp. 4-5.
ProKerala., (2013). Tips on maintaining the financial balance in the family. Retrieved
January 14, 2012, from http://www.prokerala.com/relationships/family-financial-
planning.php
Ramsey, D., (2003). Financial Peace Revisited. Marriage, singles, kids and families.
Penguin Putnam, Inc., New York.
Sherin, D., (2011). Cathy Pareto & Associates, Inc. Retrieved from
http://www.cathypareto.com/
Sparks, L., (2008). Family Decision Making. In W. Donsbach (Ed.) the International
Encyclopedia of Communication, 4, (pp. 1729-1733). Oxford, UK and Malden,
MA. Retrieved April 6, 2012, from http://www.chapman.edu/our-faulty/lisa-
sparks.com.
University of Ghana http://ugspace.ug.edu.gh
76
Steel, W. F. and Andah, D. O., (2003). Rural and Micro Finance Regulation in Ghana:
Implications for Development and Performance of the Industry. The Africa
Region Working Paper Series. Pp 15- 16
Stephenson, M. J., (1997). Managing Family Resources. Fact Sheet 710, University of
Maryland. Adapted from “The Family Manages,” Cooperative Extension Service,
University of Kentucky.
Sykes, A.O., (n.d). An Introduction to Regression Analysis. The Inaugurul Coase Lecture
Retrieved October 24, 2013, from
http://www.law.uchigo.edu/files/20.Sykes_Regresion
The McGraw-Hill companies, Inc., (2001). Money Management Strategy: Financial
Statement and Budgeting. Irwin/McGraw-Hill.
Titus, P. M., Fanslow, A. M. and Hira, T. K., (1989). Effect of Financial Management
Knowledge of Household Money Managers on Behaviours and Financial Outputs.
Journal of Vocational Home Economics Education Volume 7, Number 1, Spring
1989, Iowa State University.
Tongco, M. D. C., (2007). A Journal of Plants, People, and Applied Research.
Purposive Sampling as a tool for Informant Selection. Retrieved from
http://www.scholarspace.manoa.hawaii.edu/bitstream/handle/10125/227/i1547-
3465-05-147.pdf?sequence=4
Van Praag, B.M.S. and Frijters, P. (1999). “The measurement of welfare and well-being.
University of Ghana http://ugspace.ug.edu.gh

77
The Leyden approach.” In foundations of Hedomic Psychology: Scientific Perspec
tives on Enjoyment and Suffering, ed. D. Kahneman, E. Diener, and N. Schwarz.
New York: Russel Sage Foundation.
Vasisht, A. K., (n.d). Logit and Pobit Analysis. I. A. S. R. I., Library Avenue, New Delhi-
110 012. Retrieved July 11, 2012 http://[email protected]
Walker, R. (2005). Social Security and Welfare: Concepts and Comparisons. Berkshire:
Open University Press.
Winter, M. and Muske, G., (2004). Personal Financial Management Education: An
Alternative Paradigm Vol. 15(2) Association for Financial Counseling and
Planning Education. pp.70-88.
W H O, (2007). Assessing the Reliability of Household Expenditure
Data: Results of the World Health Survey.
W H O, (1997). Quality of Life-BREF (WHOQOL-BREF).
Xiao, J. J., (1996). Effects of Family Income and Life Cycle Stages on Financial Asset
Ownership. University of Rhode Island. Association for Financial Counseling and
Planning Education, pp 21-3.
Yankey, S. B., (2006). The Financial Contribution of Women to their Households in
Some Selected Communities in the Central Region. A Thesis presented to the
University of Ghana in partial fulfillment of the requirement for the award of
Master of Philosophy Degree in Home Science.
University of Ghana http://ugspace.ug.edu.gh

78
LIST OF APPENDICES
University of Ghana http://ugspace.ug.edu.gh

79
APPENDIX 1
A STRUCTURED INTERVIEW SCHEDULE
A STRUCTURED INTERVIEW SCHEDULE ON FINANCIAL MANAGEMENT
SYSTEMS AND PRACTICES OF GA RURAL WOMEN AND THEIR
INFLUENCE ON FAMILY WELFARE
I am a student at the University of Ghana, Legon. I would be grateful if you could
provide answers to the following questions to enable me satisfy the requirements for
obtaining M.Phil in Family Resource Management. All information gathered will be
treated as confidential. Thank you.
Section A. Socio-Demographic Information
1. Name of respondent (optional)………………………………………….…………
2. Place of Residence………………………………………………………………….
3. Age (in completed years)...........................................................................................
4. What is your marital Status? ....................................................................................
5. If married, state the type of marriage………………………………………………
6. Which ethnic group do you belong to? ….................................................................
7. What is your religious affiliation? ............................................................................
8. What is the highest education you received? ............................................................
9. Do you work for pay or profit? ................................................................................
10. If no, why don‟t you work? .......................................................................................
11. If yes, what is your occupation? ...............................................................................
12. Type of Dwelling? ................................................................................................
University of Ghana http://ugspace.ug.edu.gh

80
13. Do you own the house? .............................................................................
14. How many members are in your household? …………………………………….
15. Which members of the household helps with house work?
Member of household Area of help How often does he/she help
16. What is your husband‟s age? …………………………………………………….
17. What is the occupation of your husband? ……………………………………….
18. If he is retired, what is he doing now? …………………………………...............
Section B: Systems of Financial Management/ Sources of Finance
19. What financial management system do you use?
………………………………………………………………………………………
………………………………………………………………………………………
………………………………………………………………………………………
20. What are your main sources of income?
………………………………………………………………………………………
………………………………………………………………………………………
……………................................................................................................................
21. What is your average weekly income?
GH¢……………………………………………......................................................
University of Ghana http://ugspace.ug.edu.gh

81
22. Do you receive money from your husband for housekeeping?
………………………………………………………………………………………
23. If yes, how much do you receive on average in a week?
GH¢…………………………………………………………………………………
24. Do you receive other items from your husband?
………………………………………………………………………………………
25. If yes, what other items do you receive from your husband to manage the home?
………………………………………………………………………………………
………………………………………………………………………………………
………………………………………………………………………………………
26. If no, does he buy items for the home?
………………………………………………………………………………………
………………………………………………………………………………………
………………………………………………………………………………………
27. If yes, how often does he bring these items to the home?
………………………………………………………………………………………
………………………………………………………………………………………
………………………………………………………………………………………
28. How much of your income do you contribute for housekeeping?
GH¢…………………………………………………………………………………
29. What proportion of your income do you contribute?
………………………………………………………………………………………
University of Ghana http://ugspace.ug.edu.gh
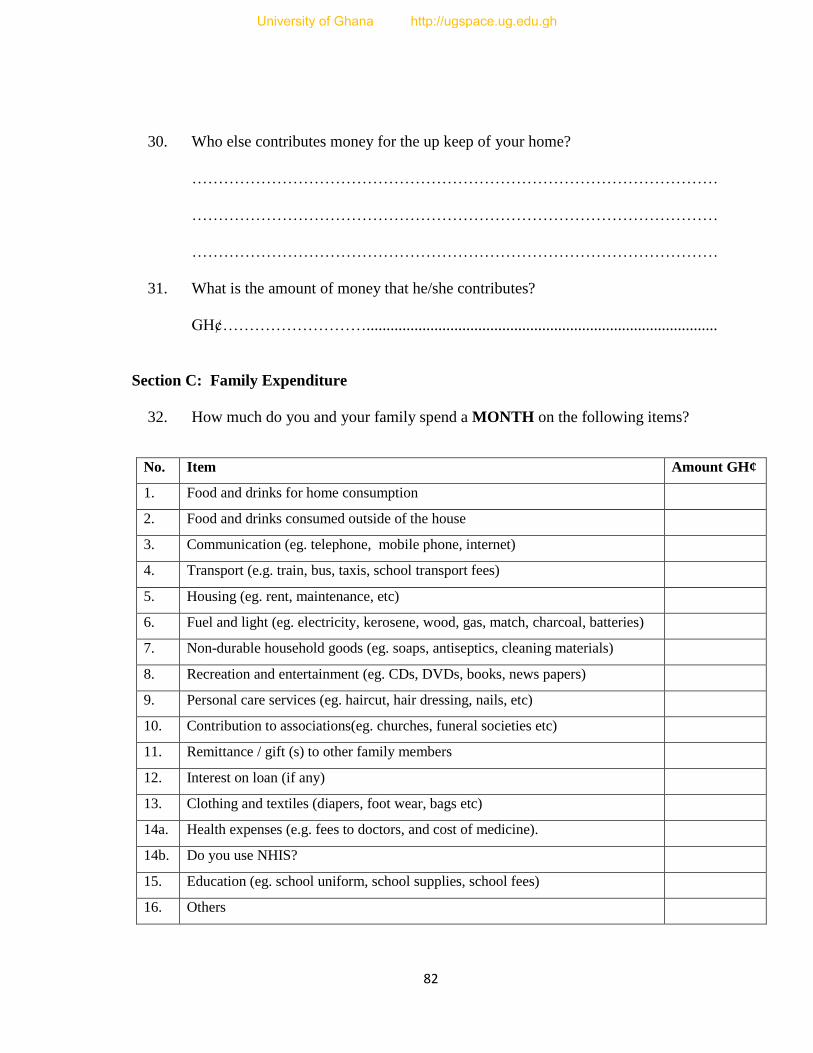
82
30. Who else contributes money for the up keep of your home?
………………………………………………………………………………………
………………………………………………………………………………………
………………………………………………………………………………………
31. What is the amount of money that he/she contributes?
GH¢………………………........................................................................................
Section C: Family Expenditure
32. How much do you and your family spend a MONTH on the following items?
No. Item Amount GH¢
1. Food and drinks for home consumption
2. Food and drinks consumed outside of the house
3. Communication (eg. telephone, mobile phone, internet)
4. Transport (e.g. train, bus, taxis, school transport fees)
5. Housing (eg. rent, maintenance, etc)
6. Fuel and light (eg. electricity, kerosene, wood, gas, match, charcoal, batteries)
7. Non-durable household goods (eg. soaps, antiseptics, cleaning materials)
8. Recreation and entertainment (eg. CDs, DVDs, books, news papers)
9. Personal care services (eg. haircut, hair dressing, nails, etc)
10. Contribution to associations(eg. churches, funeral societies etc)
11. Remittance / gift (s) to other family members
12. Interest on loan (if any)
13. Clothing and textiles (diapers, foot wear, bags etc)
14a. Health expenses (e.g. fees to doctors, and cost of medicine).
14b. Do you use NHIS?
15. Education (eg. school uniform, school supplies, school fees)
16. Others
University of Ghana http://ugspace.ug.edu.gh
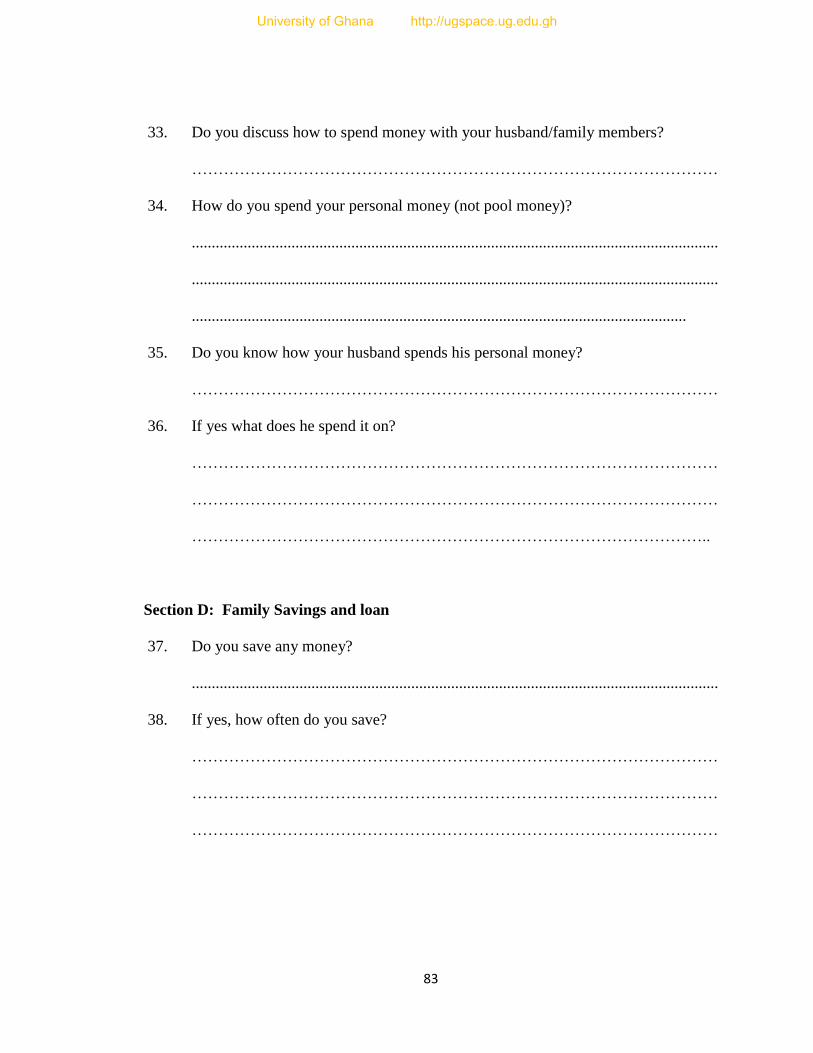
83
33. Do you discuss how to spend money with your husband/family members?
………………………………………………………………………………………
34. How do you spend your personal money (not pool money)?
....................................................................................................................................
....................................................................................................................................
............................................................................................................................
35. Do you know how your husband spends his personal money?
………………………………………………………………………………………
36. If yes what does he spend it on?
………………………………………………………………………………………
………………………………………………………………………………………
……………………………………………………………………………………..
Section D: Family Savings and loan
37. Do you save any money?
....................................................................................................................................
38. If yes, how often do you save?
………………………………………………………………………………………
………………………………………………………………………………………
………………………………………………………………………………………
University of Ghana http://ugspace.ug.edu.gh

84
39. Where do you save?
………………………………………………………………………………………
………………………………………………………………………………………
………………………………………………………………………………………
40. If you do not save money explain why?
………………………………………………………………………………………
………………………………………………………………………………………
………………………………………………………………………………………
41. Have you ever taken a loan?
………………………………………………………………………………………
………………………………………………………………………………………
42. If yes for what purpose?
………………………………………………………………………………………
………………………………………………………………………………………
……………………………………………………………………………………..
43. Where did you take the loan?
………………………………………………………………………………………
………………………………………………………………………………………
………………………………..…………………………………………………….
44. What financial security are you building for your old age and for your children?
………………………………………………………………………………………
………………………………………………………………………………………
………………………………………………………………………………………
University of Ghana http://ugspace.ug.edu.gh

85
Section E: How respondents spend their income
45. How do you spend your money? (Planning)
………………………………………………………………………………………
………………………………………………………………………………………
………………………………………………………………………………....……
46. Do you write your expenditure?
………………………………………………………………………………………
………………………………………………………………………………………
………………………………………………………………………………………
………………………………………………………………………………………
47. If there isn‟t enough money what will you spend on? List them in order of
priority:
………………………………………… …………………………………………
………………………………………... …………………………………………
………………………………………... …………………………………………
48. Why are these important?
………………………………………………………………………………………
………………………………………………………………………………………
………………………………………………………………………………………
………………………………………………………………………………………
49. Which of the above (q49) do you provide without much difficulty?
………………………………………………………………………………………
………………………………………………………………………………………
University of Ghana http://ugspace.ug.edu.gh

86
………………………………………………………………………………………
………………………………………………………………………………………
50. Which of them (q49) do you provide with much difficulty?
………………………………………………………………………………………
………………………………………………………………………………………
………………………………………………………………………………………
………………………………………………………………………………………
51. What happens to unmet needs? (Evaluation of plan)
………………………………………………………………………………………
………………………………………………………………………………………
………………………………………………………………………………………
………………………………………………………………………………………
52. Do you buy items in bulk?
………………………………………………………………………………………
………………………………………………………………………………………
53. If yes, which items are these?
………………………………………………………………………………………
………………………………………………………………………………………
………………………………………………………………………………………
………………………………………………………………………………………
University of Ghana http://ugspace.ug.edu.gh
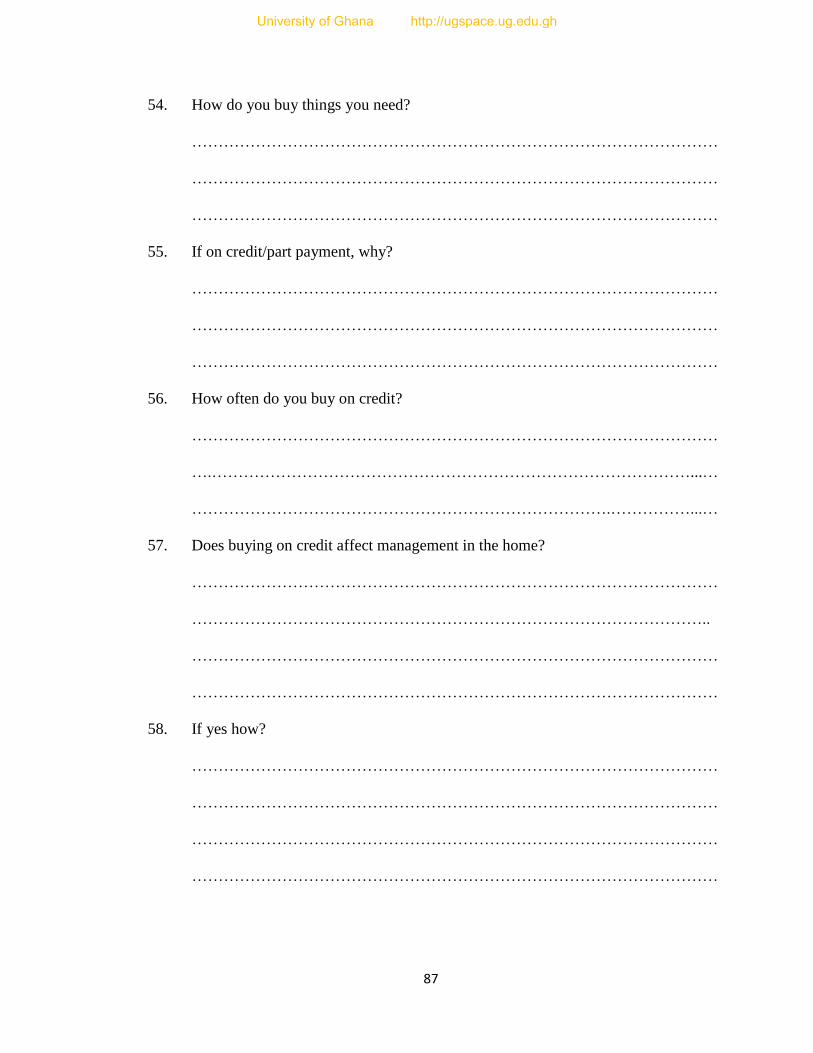
87
54. How do you buy things you need?
………………………………………………………………………………………
………………………………………………………………………………………
………………………………………………………………………………………
55. If on credit/part payment, why?
………………………………………………………………………………………
………………………………………………………………………………………
………………………………………………………………………………………
56. How often do you buy on credit?
………………………………………………………………………………………
….………………………………………………………………………………...…
…………………………………………………………………….……………...…
57. Does buying on credit affect management in the home?
………………………………………………………………………………………
……………………………………………………………………………………..
………………………………………………………………………………………
………………………………………………………………………………………
58. If yes how?
………………………………………………………………………………………
………………………………………………………………………………………
………………………………………………………………………………………
………………………………………………………………………………………
University of Ghana http://ugspace.ug.edu.gh

88
59. Do you compare prices before buying items and personal care?
………………………………………………………………………………………
………………………………………………………………………………………
………………………………………………………………………………………
Section F: Welfare of family
60. How satisfied are you with the provision of the following needs in the house?
1=Not at all, 2=Not Satisfied, 3=Satisfied, 4=Very Satisfied
Item 1 2 3 4
Food (quantity)
Clothing
Space in room
Health
Education
Savings
How well are you able to
handle emergencies
61. (a) How many people sleep in one room?
………………………………………………………………………………
(b) How often do you seek medical treatment when sick?
………………………………………………………………………………
………..……………………………………………………………………..
………………...…………………………………………………………….
University of Ghana http://ugspace.ug.edu.gh

89
62. Are you able to provide the following items for household members?
Item
1.
Always
2. Most
often
3. Often
4. Less
often
5. Not at
all
6. Other
specify
Breakfast
Lunch
Supper
School fees on time
Utilities on time
Clothing
Medical bills
All other household
needs
63. How satisfied are you with management of your finances?
………………………………………………………………………………………
………………………………………………………………………………………
……………………………………………………………………………………..
64. How satisfied are you with your life as a whole, example general well being,
happiness, and work?
………………………………………………………………………………………
………………………………………………………………………………………
………………………………………………………………………………………
University of Ghana http://ugspace.ug.edu.gh

90
APPENDIX 2
WHOQOL-Bref questionnaire
Sample of WHOQOL-Bref questionnaire adapted to measure family welfare.
University of Ghana http://ugspace.ug.edu.gh
91
University of Ghana http://ugspace.ug.edu.gh

92
WHOQOL – BREF
About You
Before you begin we would like to ask you to answer a few general questions about
yourself by circling the correct answer or by filling in the space provided.
1. What is your gender? Male Female
2. What is your date of birth? / /
Day Month Year
3. What is the highest education you received? None at all Elementary High
School College
4. What is your marital status? Single Married Living as Married
Separated Divorced Widowed
5. Are you currently ill? Yes No
6. If something is wrong with your health, what do you think it is?
Illness Problem
Instructions
This questionnaire asks how you feel about your quality of life, health, or other areas of
your life. Please answer all questions. If you are unsure about which response to give to
a question, please choose the one that appears most appropriate. This can often be your
first response.
Please keep in mind your standards, hopes, pleasures and concerns. We ask you to think
about your life in the last two weeks. For example, thinking about the last two weeks, a
question might ask:
University of Ghana http://ugspace.ug.edu.gh

93
Do you get the kind of support that you need from others?
(Please circle the number)
For office use Not at all A little Moderately Mostly Completely
1 2 3 4 5
Do you get the kind of support from others that you need?
You should circle the number that best fits how much support you got from others over
the last two weeks. So you would circle the number four (4) if you got a great deal of
support from others.
(Please circle the number)
For office use Not at all A little Moderately Mostly Completely
1 2 3 (4) 5
Do you get the kind of support from others that you need?
You would circle number one (1) if you did not get any of the support that you needed
from others in the last two weeks.
(Please circle the number)
For office use Not at all A little Moderately Mostly Completely
(1) 2 3 4 5
Please read each question, assess your feelings, and circle the number on the scale that
gives the best answer for you for each question.
1. How would you rate your quality of life?
(Please circle the number)
For office use Very poor Poor Neither poor
nor good
Good Very good
G1/G1.1 1 2 3 4 5
2. How satisfied are you with your health?
(Please circle the number)
For office use Very
dissatisfied
Dissatisfied Neither
satisfied nor
dissatisfied
Satisfied Very
satisfied
G4 / G2.3 1 2 3 4 5
University of Ghana http://ugspace.ug.edu.gh

94
The following questions ask about how much you have experienced certain things in the
last two weeks.
(Please circle the number)
For office use Not at all A little A moderate
amount
Very much An extreme
amount
F1.4/ F1.2.5 1 2 3 4 5
3. To what extent do you feel that physical pain prevents you from doing what you need
to do?
1 2 3 4 5
4. How much do you need any medical treatment to function in your daily life?
F11.3/F13.1.4 1 2 3 4 5
5. How much do you enjoy life?
F4.1/F6.1.2 1 2 3 4
6. To what extent do you feel your life to be meaningful?
F24.2/F29.13 1 2 3 4 5
(Please circle the number)
For office use Not at all Slightly A moderate
amount
Very much Extremely
1 2 3 4 5
7. How well are you able to concentrate?
F5.2/F7.1.6 1 2 3 4 5
(Please circle the number)
For office use Not at all Slightly A moderate
amount
Very much Extremely
1 2 3 4 5
University of Ghana http://ugspace.ug.edu.gh

95
8. How safe do you feel in your daily life?
F16.1/F20.1.2 1 2 3 4 5
9. How healthy is your physical environment?
F22.1/F27.1.2 1 2 3 4 5
The following questions ask about how completely you experience or were able to do
certain things in the last two weeks.
(Please circle the number)
For office use Not at all A little Moderately Mostly Completely
1 2 3 4 5
10. Do you have enough energy for everyday life?
F2.1/F2.1.1 1 2 3 4 5
11. Are you able to accept your bodily appearance?
F7.1/F9.1.2 1 2 3 4 5
12. Have you enough money to meet your needs?
F18.1/F23.1.1 1 2 3 4 5
13. How available to you is the information that you need in your day-to-day life?
F20.1/F25.1.1 1 2 3 4 5
14. To what extent do you have the opportunity for leisure activities?
F21.1/F26.1.2 1 2 3 4 5
University of Ghana http://ugspace.ug.edu.gh

96
15. How well are you able to get around?
(Please circle the number)
For office use Very poor Poor Neither poor
nor well
Well Very well
F9.1/F11.1.1 1 2 3 4 5
The following questions ask you to say how good or satisfied you have felt about
various aspects of your life over the last two weeks.
(Please circle the number)
For office use Very
dissatisfied
Dissatisfied Neither
satisfied nor
dissatisfied
Satisfied Very
satisfied
1 2 3 4 5
16. How satisfied are you with your sleep?
F3.3/F4.2.2 1 2 3 4 5
17. How satisfied are you with your ability to perform your daily living activities?
F10.3/F12.2.3 1 2 3 4 5
18. How satisfied are you with your capacity for work?
F12.4/F16.2.1 1 2 3 4 5
19. How satisfied are you with your abilities?
F6.4/F8.2.2 1 2 3 4 5
20. How satisfied are you with your personal relationships?
F13.3/F17.2.3 1 2 3 4 5
21. How satisfied are you with your sex life?
F15.3/F3.2.1 1 2 3 4 5
University of Ghana http://ugspace.ug.edu.gh

97
22. How satisfied are you with the support you get from your friends?
F14.4/F18.2.5 1 2 3 4 5
(Please circle the number)
For office use Very
dissatisfied
Dissatisfied Neither
satisfied nor
dissatisfied
Satisfied Very
satisfied
1 2 3 4 5
23. How satisfied are with the conditions of your living place?
F17.3/F21.2.2 1 2 3 4 5
24. How satisfied are you with your access to health services?
F19.3/F24.2.1 1 2 3 4 5
25. How satisfied are you with your mode of transportation?
F.23.3/F28.2.2 1 2 3 4 5
The following question refers to how often you have felt or experienced certain things in
the last two weeks.
26. How often do you have negative feelings, such as blue mood, despair, anxiety,
depression?
(Please circle the number)
For office use Never Seldom Quite often Very often Always
F8.1/F10.1.2 1 2 3 4 5
Did someone help you to fill out this form? (Please circle Yes or No)
How long did it take to fill out this form?
_______________________________________________
University of Ghana http://ugspace.ug.edu.gh

98
WHOQOL-BREF SCORING
The WHOQOL-Bref, still in field trials, is a subset of 26 items taken from the
WHOQOL-100. The same steps for the scoring WHOQOL-100 should be followed to
achieve scores for the Bref. Although scoring the Bref is identical to scoring the
WHOQOL-100, there are some differences that need to be addressed:
The WHOQOL-Bref does not have facet scores
Mean substitutions are recommended for Domain 1 Physical Health and Domain 4
Environment if no more than one item is coded missing
Only three items need to be reversed before scoring
The WHOQOL-Bref (Field Trial Version) produces a profile with four domain scores
and two individually scored items about an individual‟s overall perception of quality of
life and health. The four domain scores are scaled in a positive direction with higher
scores indicating a higher quality of life. Three items of the Bref must be reversed before
scoring. They can be seen in the Table below, indicated by the “- (reverse)” denotation in
the Direction of scaling column.
Scoring Domains of the WHOQOL-BREF
Domains and questions 23.6/BREF
Direction
of
scaling
Raw
domain
score
Raw
item
score
Overall Quality of Life and General Health …(2-10)
G1.1/B1 How would you rate your quality
of life? - …(1-5)
G2.3/B2 How satisfied are you with your
health? - …(1-5)
Domain 1 Physical Health …(7-35) …(1-5)
F1.2.5/B3 To what extent do you feel that
physical pain prevents you from
doing what you need to do?
-(reverse) …(1-5)
F13.1.4/B4 How much do you need medical
treatment to function in your daily
life?
-(reverse) …(1-5)
University of Ghana http://ugspace.ug.edu.gh

99
F2.1.1/B10 Do you have enough energy for
everyday life
- …(1-5)
F11.1.1/B15 How well are you able to get
around? - …(1-5)
F4.1.1/B16
How satisfied are you with your
sleep?
-
…(1-5)
F12.2.3/B17 How satisfied are you with your
ability to perform your daily living
activities.
- …(1-5)
F16.2.1/B18 How satisfied are you with your
capacity for work - …(1-5)
Domain 2 Psychological - …(6-30)
F6.1.2/B5 How much do you enjoy life? - …(1-5)
F29.1.3/B6 To what extent do you feel your
life to be meaningful? - …(1-5)
F7.1.6/B7 How well are you able to
concentrate? - …(1-5)
F9.1.2/B11 Are you able to accept your body
appearance? - …(1-5)
F8.2.1/B19 How satisfied are with yourself? - …(1-5)
F10.1.2/B26 How often do you have negative
feelings such as blue mood,
despair, anxiety, depression? -(reverse) …(1-5)
Domain 3 Social Relationships - …(3-15)
F17.1.3/B20 How satisfied are you with your
personal relationships? - …(1-5)
F3.2.1/B21 How satisfied are you with your
sex life? - …(1-5)
F18.2.5/B22 How satisfied are you with the
support you get from your friends? - …(1-5)
Domain 4 Environment - …(8-40)
F20.1.2/B8 How safe do you feel in your daily
life? - …(1-5)
F27.1.2/B9 How healthy is your physical
environment? - …(1-5)
F23.1.1/B12 Have you enough money to meet
your needs? - …(1-5)
F25.1.1/B13 How available to you is the
information that you need in your
day-to-day life?
- …(1-5)
University of Ghana http://ugspace.ug.edu.gh

100
F26.1.2.2/B14 To what extent do you have the
opportunity for leisure activities? - …(1-5)
F21.2.2/B23 How satisfied are you with the
condition of your living place? - …(1-5)
F24.2.1/B24 How satisfied are you with your
access to health services? - …(1-5)
F28.2.2/B25
How satisfied are you with your
transport?
-
…(1-5)
If no more than one item from the Physical Health or Environment domains has been
coded as missing, we recommend that a domain score be calculated by substituting a
person specific average across the completed items in the same scale. For example, if a
respondent does not have a value for item B16, How satisfied are you with your sleep? in
the Physical Health domain, but has answered all of the other items in that domain, then
the value for item B16 would be the average of the remaining 6 items. If two or more
items are coded missing in these two domains, the domain score should be calculated,
likewise if any items are coded missing in the Psychological and Social Relationships
domains, a domain score for that respondent would not be calculated.
After item recording and handling of missing data, a raw score is computed by a simple
algebraic sum of each item in each of the four domains. Once complete, check the
frequencies of each domain to be sure that the scores are within the correct range
indicated in Table Raw domain score column. The next step is to transform each raw
scale score using the given formula. The possible raw score ranges for each domain are as
follows: Physical Health = 28, Psychological=24, Social Relationships=12, and
Environment=32.
SCORING EXERCISE AND TEST DATASET FOR THE WHOQOL-BREF
INSTRUMENT
The purpose of this scoring exercise is to help WHOQOL-Bref users to evaluate results
from each step in the process of calculating the Domain summary scores of the
University of Ghana http://ugspace.ug.edu.gh
101
instrument. This exercise was created for SPSS users, but with minor modifications, can
be adapted for other computer programs or can be useful for those scoring the survey
manually
University of Ghana http://ugspace.ug.edu.gh

102
APPENDIX 3
Descriptive Statistics
Table 4.19 Descriptive statistics on average monthly expenditure of respondents
Monthly Consumption Obs. Mean Std. Dev. Min. Max.
Food and Drink 120 228.62 138.5729 10 860
Communication 120 22.04 19.02382 0 90
Transport 120 31.74 44.69439 0 380
Housing 120 8.11 18.06747 0 140
Fuel and Light 120 24.65 15.83404 0 80
Personal Care Products 120 12.01 7.108399 0 40
Recreation and Entertainment 119 1.36 3.857045 0 25
Personal Care Services 120 14.31 9.698649 0 60
Contribution to Associations 119 15.57 20.67282 0 160
Remittances/Gifts 120 13.73 36.22194 0 300
Interest on Loans 119 3.19 20.59179 0 180
Clothing and Textiles 120 40.23 53.858 0 300
Health 120 37.83 76.49884 0 500
Education 120 113.08 150.8347 0 1300
University of Ghana http://ugspace.ug.edu.gh

103
Table 4.20 Descriptive statistics of factors that influence family welfare
Variable No of
Obs.
Mean Std. Dev. Min. Max.
Age 120 34.5333 8.4525 22 55
Satisfaction with management of finances 120 0.4583 0.5004 0 1
Household Size 119 4.0000 1.78519 1 9
Household Income 72 128.7222 79.6834 30 370
Husband‟s Age 101 40.1782 9.3887 24 70
Unplanned spending 120 0.5417 0.5004 0 1
Dangbe 120 0.0417 0.2007 0 1
Akan 120 0.1583 0.3666 0 1
Ewe 120 0.3167 0.4671 0 1
Other Religions 120 0.0167 0.1286 0 1
Detached house 120 0.1917 0.3953 0 1
Owned (house) 120 0.2333 0.4247 0 1
Family House 120 0.3917 0.4902 0 1
Elementary/Middle Education 120 0.3083 0.4637 0 1
Junior High School 120 0.3083 0.4637 0 1
Senior High School 120 0.0917 0.2898 0 1
Voc./Comm./Technical Education 120 0.0333 0.1803 0 1
University of Ghana http://ugspace.ug.edu.gh