Financial Management and Ratio Analysis for MFIs Toolkit
45
Website: www.MicroSave.net Website: www.meda.org Basic Financial Management and Ratio Analysis for MFIs Toolkit March 2008 Mennonite Economic Development Associates Ruth Dueck Mbeba Microsave – Market-led solutions for financial services
-
Upload
trackingdown -
Category
Documents
-
view
34 -
download
4
description
Financial Management and Ratio Analysis for MFIs Toolkit
Transcript of Financial Management and Ratio Analysis for MFIs Toolkit
Website: www.MicroSave.net Website: www.meda.org
Basic Financial Management and Ratio
Analysis for MFIs Toolkit
March 2008
Mennonite Economic Development Associates
Ruth Dueck Mbeba
Microsave – Market-led solutions for financial services
Acknowledgements
MEDA acknowledges the contribution and input of David Cracknell of MicroSave Africa in writing and development of the overall toolkit. Many thanks to the helpful input and support from MEDA staff in making this effort possible, especially to Trudy Rejeski. A learning toolkit is never “final” as new techniques, tools and resources become available and are shared with one another. Participant feedback and comments will assist to continually improve this toolkit and its resources.
Microsave – Market-led solutions for financial services
MFI Basic Financial Management and Ratio Analysis for MFIs page i
Table of Contents
Introduction..............................................................................................................1
1. ....................................................................................2 Accounting Overview
Accounting Conventions or Guidelines .............................................................................. 3
Micro-Finance Accounting and Management Information Systems .................................. 6
The Chart of Accounts ........................................................................................................ 7
Policies and Procedures .................................................................................................... 10
Qualified, Trained and Motivated Staff ............................................................................ 10
External and Internal Audits ............................................................................................. 11
The Accounting Cycle ...................................................................................................... 11
Trial Balance..................................................................................................................... 12
Reconciliations.................................................................................................................. 12
Accounting Adjustments................................................................................................... 12
Draft Financial Statements................................................................................................ 13
2. ................................14 The Financial Statements and Operational Reports
The Financial Statements.................................................................................................. 14
Cash Flow Statements....................................................................................................... 18
Cash Flow Projections ...................................................................................................... 20
The Portfolio and Operational Reports ............................................................................. 20
Understanding the Relationships - Provisions for Loan Losses, Allowance for Loan Losses and Write-offs ....................................................................................................... 21
Accounting for Loan Write-Offs ...................................................................................... 25
3. .................................................................................26 Basic Financial Ratios
Using Financial Indicators or Ratios................................................................................. 26
What are Ratios? ............................................................................................................... 26
What are the Key Areas to Measure? ............................................................................... 27
Profitability and Sustainability ......................................................................................... 27
Asset and Liability Management ...................................................................................... 29
Portfolio Quality ............................................................................................................... 32
Efficiency and Productivity .............................................................................................. 34
4. ...................................................................37 Basic Financial Ratio Analysis
Where to Go From Here ................................................................................................... 39
Bibliography ..................................................................................................................... 40
MicroSave – Market-led solutions for financial services
MFI Basic Financial Management and Ratio Analysis for MFIs page ii Figures:
Figure 1.1: Accounting Debits and Credits ............................................................................................ 6 Figure 1.2: Accounting System and Client Portfolio System (MIS) Microfinance ............................... 7 Figure 1.3: Sample Chart of Account Structure ..................................................................................... 8 Figure 1.4: Accounting Cycle .............................................................................................................. 11 Figure 2.1 Understanding Relationships between Financial Statements ............................................. 18 Figure 2.2 Portfolio Management Report Schedule ............................................................................. 21 Figure 2.3 Sample Aging Report ......................................................................................................... 22 Figure 2.4 Understanding the Relationships between Loan Losses and Write-Off Accounts ............. 23 Figure 2.5 Illustration of Accounting for the Allowance for Loan Losses and Provisions .................. 24 Figure 2.6 Illustration of Accounting for Loan Write-offs .................................................................. 25
List of Handouts:
Section 1: Accounting Overview 1.1 Session Plan Section 2: Financial Statements and Operational Reports 2.1 Sample Income and Expense Statement 2.2 Sample Balance Sheet 2.3 Sample Cash Flow Statements 2.4 Sample Audited MFI Statements - India 2.5 Sample Cash Flow Projections 2.6 Sample Portfolio Reports 2.7 Sample Non-Financial Data Section 3: Basic Financial Ratios 3.1 SEEP Microfinance Ratios 3.2 Comparing Performance Using BenchMarking 3.3 MicroBanking Bulletin Benchmarks for Asia 3.4 Calculating Effective Interest on Loans Section 4: Financial Ratio Analysis 4.1 CGAP Focus Note 22 – MFI Rating Systems 4.2 CAMEL Rating Technical Note – ACCION 4.3 GIRAFE Rating Methodology- Planet Rating 4.4 PEARLS Rating - WOCCU 4.5 Course Evaluation
List of Exercises
Section 1: Accounting Overview 1.1 Sample Transactions – Balance Sheet
Section 2: Financial Statements and Operational Reports
2.1 Financial Statement Relationships 2.2. Accounting for Loan Provisions and Write-Offs Section 3: Basic Financial Ratios 4.3 ACME-MDI Case Study Part I
MicroSave – Market-led solutions for financial services
MFI Basic Financial Management and Ratio Analysis for MFIs page iii
MicroSave – Market-led solutions for financial services
3.1 Team Activity – A “Financial Bee” 3.2 Case Study – Delinquency Management 3.3 Competition and Efficiency vs. Effectiveness
Section 4: Financial Ratio Analysis 4.1 ACME-MDI Case Study
4.1 ACME-MDI Case Study – Ratios template 4.2 Ratios and Trends 4.2 Ratios and Trends – Sample Answers 4.3 Sensitivity Analysis
MFI Basic Financial Management and Ratio Analysis for MFIs Section 1 - 1
Introduction “Isn’t the repayment rate the most important ratio I need to know?” “My MIS generates the ratios that I need! Why do I want to know more?” Do these comments and questions sound familiar? Microfinance ratios often include a few popular ratios like the repayment rate, the operating self-sufficiency and the portfolio at risk. In general, they speak to the ratios that are commonly looked at as benchmarks in the early days of an institution. Other MFI managers may rely on their Management Information System that automatically produces ratios with information from financial statements and the portfolio loan tracking system. In general, they m ight understand what num bers and anal ysis is taking place, but the prim ary obj ective of producing ratios may be for reporting purposes rather than management purposes. This toolkit provides an overview of basic accounting principles and systems in order for managers to understand the foundation of financial information used for financial management and ratio analy sis. MFI stakeholders expect MFI senior managers to ensure that strong and adequate financial systems are in place in the MFI. Therefore, it is essential that MFI managers have a solid understanding and appreciation of the accounting system. This toolkit a lso discusses the comm only accepted ratios for microfinance analysis within four broad categories: sustainability and pr ofitability, portfolio quality, asset and liability management, and efficiency an d pro ductivity. The p urpose of ratio analy sis is often for e xternal repor ting and comparison with other MFIs. This t oolkit will f ocus on operational analysis and performance management. There is an internationally accepted “st andard” of ra tios and indic ators for m icrofinancanalysis. In recent y ears, donors, raters, investor s and practit ioners have come toconsensus around comm on financial definitions , and basic indicators that are used forMFI reporting, performance measurement a nd analy sis around t he world. A recent publication includes the CGAP “Microfinance Consensus Gui delines: Defi nition oSelected Terms, ratios and Adjustments for Microfinance,” September 2003.
e
f 1 As a result of that work,
a 2005 publication was released and is reco mmended as a co mpanion g uide to th is toolkit , “Measuring Perfor mance of Microfinance Institutio ns: A Framework for Reporting, Analy sis and Monitoring.”2 It is available online without charge at www.seepnetwork.org/frame. A fr ee download of the FRAME, an excel-based monitoring tool is also available. While there are many other ratios and tools us ed in m icrofinance, this toolkit will focus on International Accounting Standards, International Financial Reporting St andards and generall y accepted international performance rati os for m icrofinance. Refer ences to the Indian sector will be made fro m tim e to time as appropriate. MFIs sho uld also consult with the regulatory bodies to determine if additional financial or rati o reporting is required of the m, specifically the Reserve Bank of India and the appropriate Companies Division.
1 www.cgap.org 2 www.seepnetwork.org
MicroSave – Market-led solutions for financial services
MFI Basic Financial Management and Ratio Analysis for MFIs Section 1 - 2
1. Accounting Overview Accounting is one of the key cornerstones of good information systems in microfinance institutions. A good accounting s ystem produces accurate, relevant and tim ely reports and enables meaningful analysis and monitoring o f operations. It is also im portant that your MFI e mploys quali fied and trained staff to carry out accounting responsibilities. Bookkeepers or data entr y staff record financial transactions and activities, and must know how to do that correctly. Accountants verify, reconcile and produce financial statements supported by acco mpanying schedules, and m ust know how t o do tha t well. Financial managers and CEOs of MFIs m ust be able to understand fi nancial infor mation, analyze performance, and make the necessary decisions to improve and strengthen the institution. The MicroSave toolkit “Basic Financial and Accounting S ystems for MFIs” (Dueck Mbeba 2008) provides tool s and resources toolkit designed to provide MFI and Self Help Groups t he core components of basic accounting s ystems needed to record, classify and su mmarize financial transactions and to produce meaningful, tim ely and accurate fin ancial state ments and reports. Ke y practical aspects of accounting for microfinance institutions are highlighted in that toolkit. What is Accounting?
• Is the process of recording, classifying, and summarizing economic events, that
• Leads to the preparation of financial statements, and
• Provides essential information that allows the manager to choose actions that will redirect the enterpri se’s activities to be m ore consistent with the m ission and objectives
of the business plan Accounting is often referred to as “the language of business” and like any ot her language, it has its own unique structure and vocabulary. Since accounting terms like assets, revenue, expenses and cash flow are used regularly, it is important that managers and those making business decisions understand basic accounting concepts. These concepts form the basis of accounting and financial management. Accounting falls into two broad categ ories: fi nancing accountin g and management acco unting. Financial accounting is concerned with recording, organizing and summarizing the financial results of past operations. Financial accounting reports are gen erally prepared on a monthly basis for internal and external purposes. The annual financial statements are subject to an independent auditor’s opinion to verify the fairness and reasonableness of info rmation presented. External a udits are r equired by statutory regulation for MFIs, but they can also fulfil many other management and Board o bjectives, such as an independent and external review of systems, re commendations for i mprovements in the management letter, and investor requests, among others. Management accounting information is tracked and presented at a much more detailed level (e.g. by activity, or b y Branch or departm ent). Management reports focus not sim ply on a sufinancial transactions, but on future pr ojections, budgets, and previous historical reports. Management reports are flexible, change as needed, and donot conform to any external standa rd, because they are for internal management analysis and decision making only.
mmary of period
g ow ll to
Not everyone in y our MFI needs to unde rstand all the details of its accountinsystem like the bookkeeper and the accountant. However, managers need to knhow to inter pret the information that acc ounting pr ovides. It is helpful for aunderstand the conventions or guidelines that form the base of the accounting system.
MicroSave – Market-led solutions for financial services
MFI Basic Financial Management and Ratio Analysis for MFIs Section 1 - 3 A strong, effective accounting system – including a loan and saving tracking system – is an essential foundation for reporting and analysis of your MFI’s performance. Without a good accounting system, your reports are not necessarily reliable. And without reliable reports, you as an MFI manager are not able to confidently understand financial reports or make reliable judgement or decisions to improve and strengthen performance.
Accounting Conventions or Guidelines Accounting practice is based on commonly accepted “conventions” or “guidelines” that guide policies
ccounting p ractice and reporting stan dards vary fr om country t o countr y. It is reco mmended that
enerally Accepted Accounting Principles (GAAP) in India are sourced in the following: f Chartered
Legal Decisions by Indian courts arliament (such as Reserve Bank of
eporting obligations m ay also var y according to the legal act governi ng t he t ype of your MFI ’s
. Business Entity Concept: Every business is a separate entity, distinct from it s owner and fro m
retired banker decided t o open a community microfinance organisation in the rural centre to which
ed, reco rdinhy
al
and accounting treatment of transactions. AMFI managers consult with local accountants, regul atory bodies and m icrofinance networks in order to learn about and take local issues into consid eration when developing their own accounting policies and procedur es. There is a growing trend in the world towa rds co mmon accounting standards articulated in International Accounting Standa rds (IAS) and Internationa l Financial Reporting Standards (IFRS). National Indian standards may or may not reflect so me of the global shifts, and need to be reviewed from time to time to see how standards continue to evolve.3 Ga. Accounting standards, guidance notes and ot her pronouncement of the Institute o
Accountants of India, b. Companies Act, 1956, c. Any central, state, provincial act or special act by the p
India Act 1934) Rregistration. If y our MFI is subject to central bank registration, there will be specific accounting and reporting obligations and e xpectations that demand com pliance. However, this toolkit will a ssume a “standardized” reporting definitions and formats fo r analy tical and com parative purposes within the sector. The following are commonly accepted accounting conventions or guidelines. aevery other business. Therefore, the records and reports of a busi ness should not include t he personal transactions or assets of either its owner(s) or those of another business. Ahe retired after 35 years of banking sector experience. He invested his own severance package as start
up capital, an d launched operations. He woul d withdraw funds fro m the organisation for personal use when need g the withdrawals a gainst his original investment. Occasionally he al e surpluses of a small business that he also initiated in his retirement. N , the annual auditors were not i mpressed with the retired banker’s app MFI’s ca sh resource s. They felt that the retired banker did not segrega transactions from the MFI’s transactions.
so invested teedless to saroach to the
te his person b. Fair Value vs. Historical Cost Principle: General past pra ctice has been t o record ass ets at their ctual, historical cost. This is still the practice at the time of purchasing and recording the asset .
a
3 Accounting and auditing firms may be able to provide resources, for example, “Accounting Standards and
Guidelines for Micro-Finance Institutions in India” (V. Nagarajan & Co).
MicroSave – Market-led solutions for financial services
MFI Basic Financial Management and Ratio Analysis for MFIs Section 1 - 4 However, over time, the historical cost might be much less than the cost to r eplace the a sset today (e.g. A computer, a vehicle) OR a lot less than which the asset could be sold for (e.g. land, a building). Note: International Accounting Standards and International Financial Reporting Standards recommend revaluing assets from their historical cost to reflect current values as necessary in International Accounting Standard 16. The Institute of Chartered Accountants in India recommends the revaluation of fixed assets for MFIs as well in Accounting Standard 10.
The same MFI purchased an office building for a deal at 1,00,000 Rs in 2000. Five years later, the area was targeted for intensive business development, and new commercial
e statem Un
ilding shou
construction boomed. The value of th ce building increased 5 times to 5,00,000 Rs. What is the effect on the MFI’s financial der the historical cost convention? None. However, under fair value accounting, the bu ld be re-valued in the accounting records from its historical cost to the current market price.
MFI offients?
c. Going Concern Concept: The reco rds and ba lance sheet of an organisation and a bus iness is eveloped with the assu mption that the business wil l continue to operate inde finitely, and that the
2006, the auditors note d that cash fl ow in the community MFI was incre asingly ery, very difficult. A large, national MFI had opened a Branch in the community
t actually be able
dassets used in conducting business and operations w ill not be sold, and the lia bilities will be paid as recorded. Invin 2005 and offered more efficient service, and better interest rates. Although not regulated, the community group did offer savings services to its clients, but clients complained about t he time to withdraw funds, and h ow at times, funds were not available. The auditors began to evalua te whether the community based group mighto operate with its cash flow problems and competition for qualified staff. d. Consistency Principle: Organisations should co nsistently apply the s ame accounting principles
om period to period. This ensures that reports from various periods m ay be com pared to produce
he co mmunity based MFI operated by the retired banker was anxious to present a vourable financial position when presenting his 2005 audited fi nancial statements
e ake
for changes,
frmeaningful conclusions on the financial position of the organisation a nd the results of the o perations. Any changes to accounting principles should alway s be disclosed in the notes to the financial statements. Generally , audi tors will rest ate previous year’s figures and adjust t hem retroactively for comparison purposes. Tfato the local government office overseeing community activities of this natur e. He changed his accounting policy on setting an Allowance for Loa n Losses and for depreciation, resulting in a 50,000 Rs profit for the year. However, he failed to disclosthe change in the financials presented. The audit or had no c hoice but to madjustments and disclosures for the change in accounting policy, highlighting the reasonsand results of changes. e. Accrual: The accrual or realisation principle requi res that revenue be recogni sed in the accounting eriod it is e arned, and expenses be recognised when they are incurred, rather than when there is
ppayment or collection of cash. (Recent changes to International Accounting Standards include special rules for recording certain revenues, distinguishing recognition from realisation of revenue, dependent on the substance and the circumstances of transactions).
MicroSave – Market-led solutions for financial services
MFI Basic Financial Management and Ratio Analysis for MFIs Section 1 - 5 MFIs choose either a cash basis of accounting or a n accrual basis of accounting.
he community m icrofinance group mana ged b y t he banker ope rated on a c ash asis. In late 2003, they group received 2,00,000 Rs donation from an international
e revenues when
Tbdonor. However, the fund s were not spent until the following year, so the 2003 December year end reflected a very large surplus. The funds were spent in 2004, resulting in a very large loss for the year. Accrual accounting would have recorded threcorded and recognized when spent for the expenses intended. f. Matching Principle: Organisations incur expenses to earn revenues. Expenses should be reported on the Inco me Statement during the same pe riod as the revenues generated as a result of incurring
ose expenses.
ng would imply that the grant expenses for the approved grant would be matched” by the related grant revenue in th e same period. Revenue would be recorded nd recognised as spent for the objectives of the grant agreement.
mortised monthly in order to match the expenses to the revenue generated in the same period.
th Accrual accounti“a The community MFI purchases insuran ce on its fixe d assets at the beginning of each fis caleffect pre-pa ying a year’s insurance in advance. The pay ment is charged to prepaid insurance, an
year, in d
a g. Conservatism and Prudence: When presented with a choice, acco untants should choose procedures and methods of recording tr ansactions that ensures that asset s, revenues and gains a re not
VERSTATED, and that liabilities, expenses and losses are not UNDERST ATED. This principle is
institutions in the area required that at a inimum all MFIs allocate 2% of their total portf olio as the Allowance for Loan Losses. However, e actual portfolio quality of the community based microfinance group was very poor,
al health.
Ointended to result in the fair presentation of information. The local g overnment b ody governi ng m icrofinance mthwith delinquency as high a s 20% in some months. In fact a 2 % Allowance fo r Loan Losses was definitely inadequate to cov er the actual losses that were more realistically expected. The co mmunity MFI kept the low allowance in an effort to make the organisation look stronger than it actually was. Assets were OVERSTSAT ED as a result, and expenses UNDERSTATED, presenting an unfair picture of the MFI’s financi h. Substance over form implies that the accounting treatment and presentation of transactions shobe governed by their subs tance and not merely by their legal form . This has further application
uld for
ore advanc ed accounting topics and for specific i ssues r elated to a malgamations, specia l agenc y
y had knowledge of the same. Disclosure, notes to e financial statements and errors or misstatements in the financia l statements all affect the i ssue of
, liabilities, or equity.
mrelationships or sophisticated investment vehicles. i. Materiality implies that financial statements should disclose all item s which might influence the decisions of the users of financial statements if thethmateriality. Materiality is in itself relative and s ubjective, as the size and volume of MFIs differs greatly, and therefore levels of materiality or immateriality will also vary greatly. j. Double-Entry Accounting
• Any given transaction will affect a minimum of two accounts within assets
MicroSave – Market-led solutions for financial services
MFI Basic Financial Management and Ratio Analysis for MFIs Section 1 - 6
• If the accounting equ ation is to remain in balance, any change in the assets must be
increase or decrease) in another asset account.
Account Debit Credit
accompanied by an equal change in the liabiliti es or equity , or by an equal but opposite change (
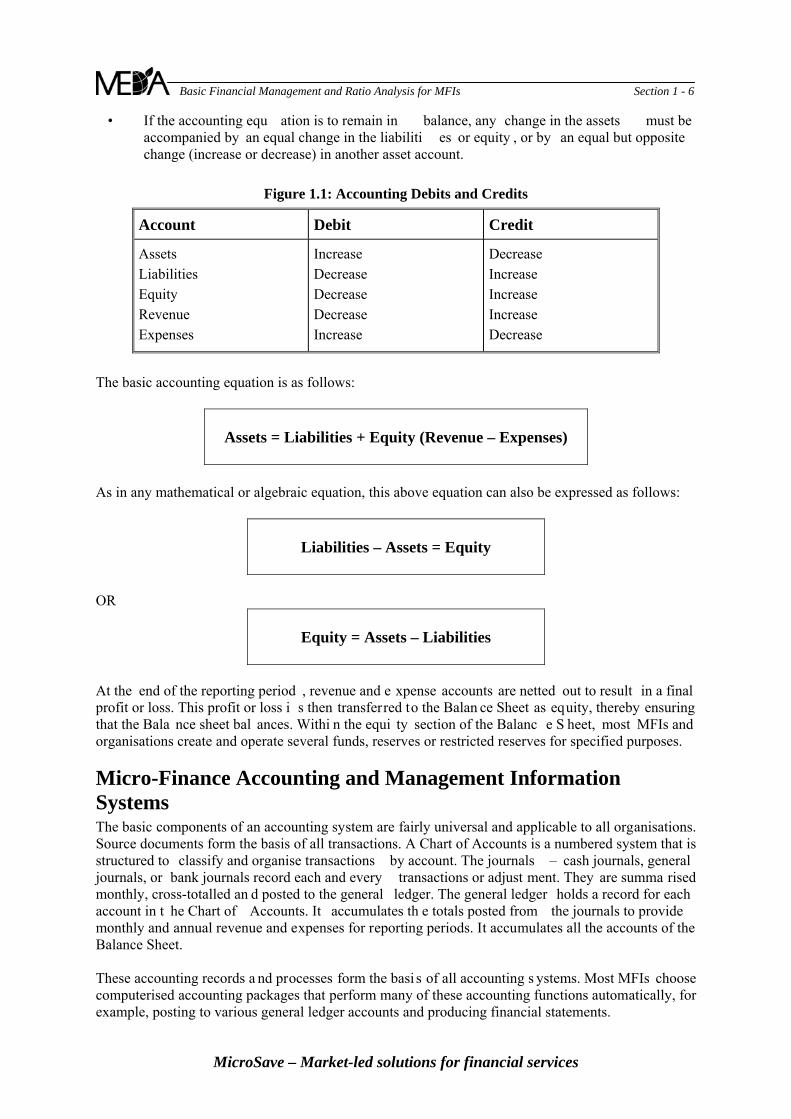
Figure 1.1: Accounting Debits and Credits
Assets
Equity e
e Decrease
e
Increase
Increase DecreasDecreas
Decrease Increase
Increase
Increase Decrease
Liabilities
RevenuExpenses
The ba ing equation is as f
Equity (Revenue – Expenses)
sic account ollows:
Assets = Liabilities +
As in any mathematic ressed as follows:
al or algebraic equation, this above equation can also be exp
Liabilities – Assets = Equity
OR
Equity = Assets – Liabilities
At the end of the reporting period are netted out to result in a final profit or loss. This profit or loss i s then transferred to the Balan ce Sheet as equity, thereby ensuring
at the Bala nce sheet bal ances. Withi n the equi ty section of the Balanc e S heet, most MFIs and
anisations. stem that is
classify and organise transactions by account. The journals – cash journals, general
counting packages that perform many of these accounting functions automatically, for example, posting to various general ledger accounts and producing financial statements.
, revenue and e xpense accounts
thorganisations create and operate several funds, reserves or restricted reserves for specified purposes.
Micro-Finance Accounting and Management Information Systems The basic components of an accounting system are fairly universal and applicable to all orgSource documents form the basis of all transactions. A Chart of Accounts is a numbered systructured to journals, or bank journals record each and every transactions or adjust ment. They are summa rised monthly, cross-totalled an d posted to the general ledger. The general ledger holds a record for each account in t he Chart of Accounts. It accumulates th e totals posted from the journals to provide monthly and annual revenue and expenses for reporting periods. It accumulates all the accounts of the Balance Sheet. These accounting records a nd processes form the basi s of all accounting s ystems. Most MFIs choose computerised ac
MicroSave – Market-led solutions for financial services
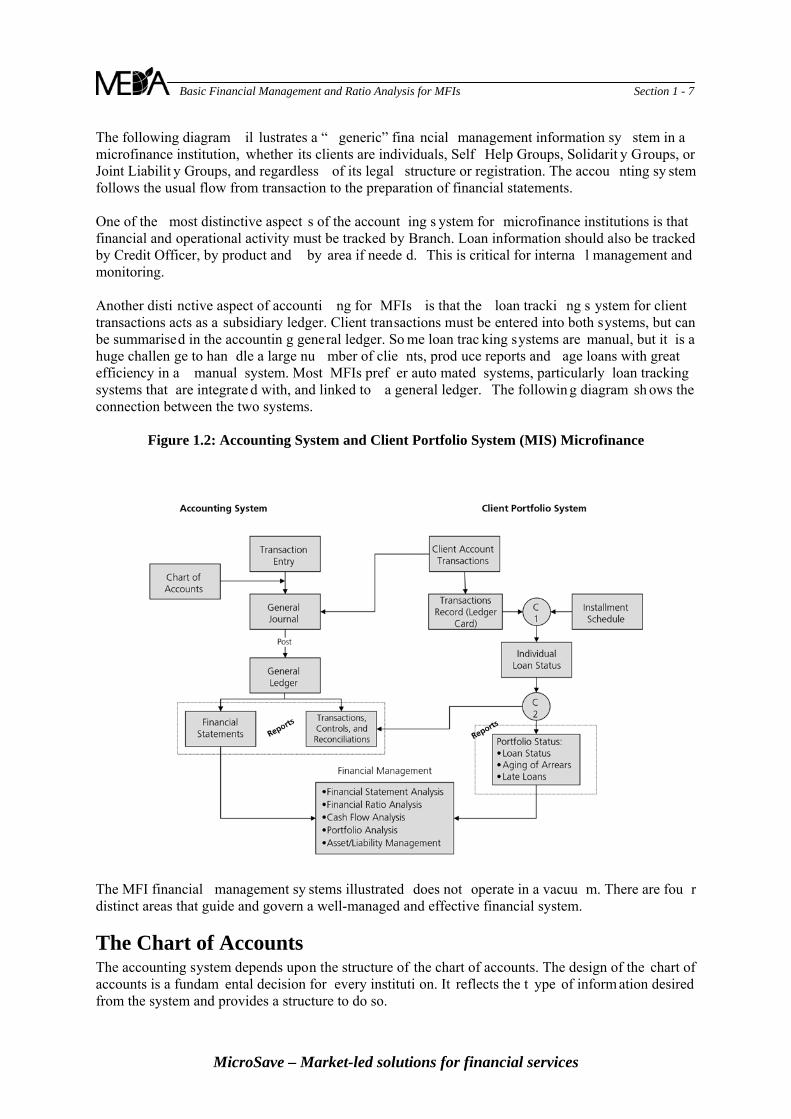
MFI Basic Financial Management and Ratio Analysis for MFIs Section 1 - 7 The following diagram il lustrates a “ generic” fina ncial management information sy stem in a microfinance institution, whether its clients are individuals, Self Help Groups, Solidarit y Groups, or Joint Liabilit y Groups, and regardless of its legal structure or registration. The accou nting sy stem
llows the usual flow from transaction to the preparation of financial statements.
l management and onitoring.
d in the accountin g general ledger. So me loan trac king systems are manual, but it is a uge challen ge to han dle a large nu mber of clie nts, prod uce reports and age loans with great
fo One of the most distinctive aspect s of the account ing s ystem for microfinance institutions is that financial and operational activity must be tracked by Branch. Loan information should also be tracked by Credit Officer, by product and by area if neede d. This is critical for internam Another disti nctive aspect of accounti ng for MFIs is that the loan tracki ng s ystem for client transactions acts as a subsidiary ledger. Client transactions must be entered into both systems, but can be summarisehefficiency in a manual system. Most MFIs pref er auto mated systems, particularly loan tracking systems that are integrate d with, and linked to a general ledger. The followin g diagram sh ows the connection between the two systems.
Figure 1.2: Accounting System and Client Portfolio System (MIS) Microfinance
The MFI financial management sy stems illustrated does not operate in a vacuu m. There are fou r distinct areas that guide and govern a well-managed and effective financial system.
he Chart of Accounts
ation desired from the system and provides a structure to do so.
TThe accounting system depends upon the structure of the chart of accounts. The design of the chart of accounts is a fundam ental decision for every instituti on. It reflects the t ype of inform
MicroSave – Market-led solutions for financial services
MFI Basic Financial Management and Ratio Analysis for MFIs Section 1 - 8
It is the foundation for recording transactions into the general ledger and for presenting the accounts in the financial statements.
Using a well-designed chart of accounts structure will: p follow cost accounting and f nch activity provide a simple way of adding accounts and therefore allow for growth, and
idual needs of the institution.
ch, by donor and by area unts. Too much
ming, and provide irrelevant inform ation. Too little de tail does not provide
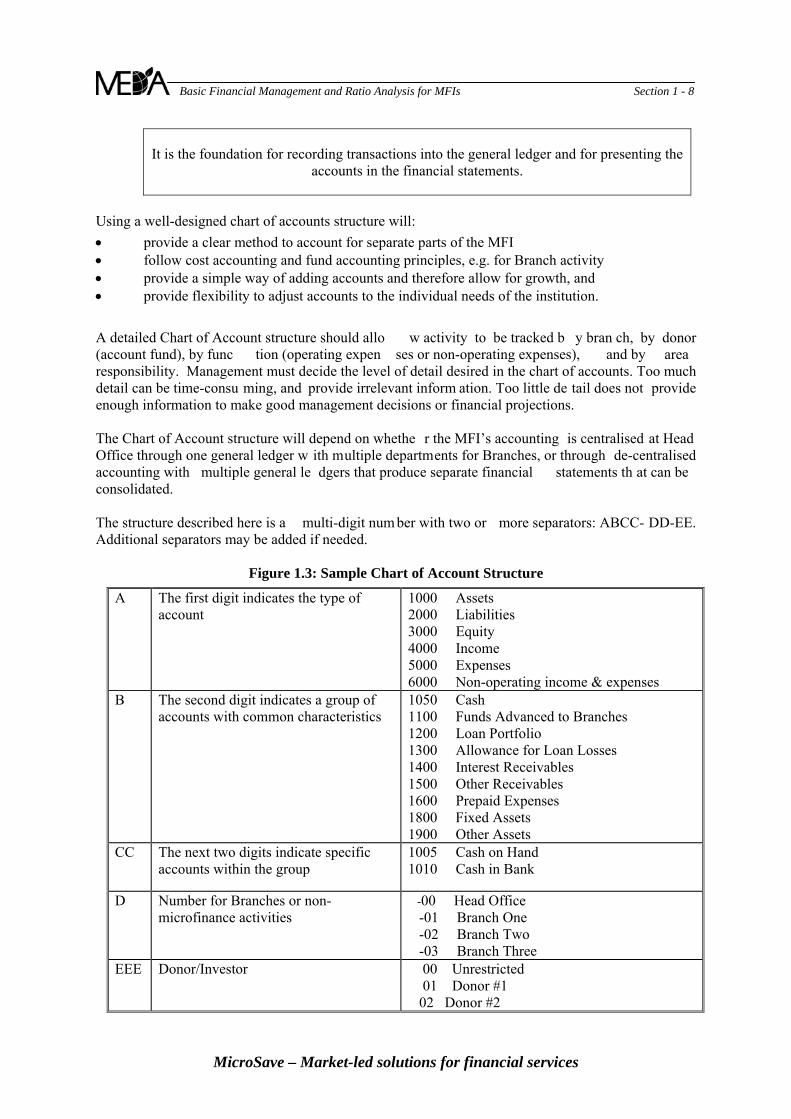
Figure 1.3: Sample Chart of Account Structure
2000 Liabilities 3000 Equity
ting income & expenses
rovide a clear method to account for separate parts of the MFI und accounting principles, e.g. for Bra
provide flexibility to adjust accounts to the indiv
A detailed Chart of Account structure should allo w activity to be tracked b y bran(account fund), by func tion (operating expen ses or non-operating expenses),responsibility. Management must decide the level of detail desired in the chart of accodetail can be time-consuenough information to make good management decisions or financial projections. The Chart of Account structure will depend on whethe r the MFI’s accounting is centralised at Head Office through one general ledger w ith multiple departments for Branches, or through de-centralised accounting with multiple general le dgers that produce separate financial statements th at can be consolidated. The structure described here is a multi-digit num ber with two or more separators: ABCC- DD-EE. Additional separators may be added if needed.
A The first digit indicates the type of account
1000 Assets
4000 Income 5000 Expenses 6000 Non-opera
B nd digit indicates a group of accounts with common characteristics
vanced to Branches folio
The seco 1050 Cash 1100 Funds Ad1200 Loan Port1300 Allowance for Loan Losses 1400 Interest Receivables 1500 Other Receivables 1600 Prepaid Expenses 1800 Fixed Assets 1900 Other Assets
CC The next two digits indicate specific accounts within the group
1005 Cash on Hand 1010 Cash in Bank
D Number for Branches or non-microfinance activities
-00 Head Office -01 Branch One -02 Branch Two -03 Branch Three
EEE Donor/Investor 00 Unrestricted 01 Donor #1 02 Donor #2
MicroSave – Market-led solutions for financial services
MFI Basic Financial Management and Ratio Analysis for MFIs Section 1 - 9
How would it work in practice? Here are some examEx 1
ples: ample : If 1010 is Cash in Bank, then
1010-00-00 is the balance of cash held in the head of nd it is unrestricted 1010-02-00 is the balance of cash held in the Branch Two bank account and it is also unrestricted Example 2
fice bank account a
: If 4010 is the interest income from egular loans, then 1 for donor number 6.
the MFI’s own funds.
asis ecutive Director, is
d the Branch
an account should be adde d for the new product in
d
ey may also be engaged in. This m ay in fact ctivities,
activities in this way. While this is a manageable approach for
r4010-01-06 is the interest income from loans from Branch
s th m Branch 3 from4010-03-00 i e interest income from loans fro Maintaining the Chart of Accounts
and revised on a regular bThe chart of accounts is not a static docu ment. It needs to be reviewedas needs dictate. The Head Office Finance Manager, in consultation with the Exgenerally responsible to maintain the chart of accounts for bot h the Head Office an
ffices, and to ensure that all accou nting st aff t hroughout t he institution knows which account Onumbers they should be using. From time to time it may be necessary to add acco unts to the ch art. If the M FI receives additional operating grants or loan capital from a new donor , and is requir ed to report to the d onor for those specific activities, it is useful to open accounts with the appropriate donor code. If the MFI expands to a new Branch, accounts need to be opened to handle all the standard financial activities of the branch.
the MFI ex pands to offer another loan product, Iforder to track performance of the new product in the financial and management reports. If the MFI uses an automated general ledger, there may be some additional things to consider for the Chart of Accounts. Account s need to be set up for Fund Accounting and the potential to post so me revenues and expenses to specific capital or equity accounts. Donations an d grant equit y m ight also require special treat ment. This im plies that the apital or e quity structure of the auto mated syste m ne eds careful atten tion on c
installation and planni ng. It also needs atte ntion and a cle ar aud it trail when closing year end transactions to th e system. If not, most income and exp ense accounts will be automatically closed to the retained earnings account. Alternately, the MFI can choose to set up spreadsheets and track the historical grants andonations from various donors outside the accounting system. Finally, it is worth emphasizing that organisations are strongly encouraged to operate microfinance
nances separate from other operational activities that thfibe a challeng e, since many organisations combine microfinance with other developmental aincluding staffing. This tends to complicate th e transparency and clarity of understanding the erformance of financial operations, particularly if the organisation struggles with setting up distinctp
cost centres. The general practice and accepted guideline in accounting m icrofinance is to segregate and report all microfinance activities separately . This is accom plished most easily by operating a separat e general ledger for microfinance, and if needed, c onsolidate it with other general ledgers of the organisation for consolida ted reporting . Other orga nisations carry one gene ral ledger with separat e
epartments, segregating microfinance dtracking income and expenses, it is us ually m ore c hallenging to segregate de partments by balance sheets. A balance sheet that reflects only microfinance assets and liabilities is very important, as much of the performance and ratio analysis is based on balance sheet information. The following reco mmendations are adapted fr om “Accounting Standar ds for Micro-Finance Institutions in India” V. Nagarajan & Co. SIDBI Foundation for Micro Credit.
MicroSave – Market-led solutions for financial services
MFI Basic Financial Management and Ratio Analysis for MFIs Section 1 - 10
Separate Set of Books to be kept for Micro-Finance Activities: Accounting standards for microfinance institutions in India have been designed to promote transparency. First and foremost, separate accounting books and records must be maintained for microfinance.
entry system of accounting should be followed.
m borrowers. s
ures rela ted t o microfinance activities must be prop erly recorded and
icrofinance institution must be properly recorded and disclosed.
nd advances to e mployees, directors, trustees or any other person managing the
s related to other asset s and liabilities of the microfinance institution must be properly
Books of accounts are to be kept on accrual basis and a double
Loan and s avings tracking sy stems must be maintained, detailing all collections and disbursements fro
Transactions with related agencies (Sel f Help Gr oups) who the le nd to individual to borrowermust be detailed
All revenue and expenditdisclosed.
Fixed asset transactions of the m
Details of loans aaffairs of the MFI must be disclosed.
Transactionrecorded and disclosed.
Policies and Procedures A microfinance institution ne
counting and financial management eds clear and comprehensive Board approved accounting policies for its
system. Documented policies and procedures provide guidance nt of financial data, and the foundation for internal
ng policies sh ould be developed within the context of local ractices in microfinance to the extent possible.
he MicroSave toolkit “Basic Financial and Accounting S ystems for MFIs” (Dueck Mbeba 2007)
inance.
staff shoul d h ow to do t hat roduce financial
acand structure to staff, a basis for consistent treatmecontrol and accountability. Accountiaccounting standards, and apply best p Examples include depreciation p olicies, write-off pol icies, loan loss write-offs, loan loss provisions, deferred revenue or expenses, Allowance for Loan Losses policies, accrued interest policies, and a t times, reporting formats. Tincludes tools that give exam ples of what types of topics and items need to be covered in accountin g policies. That toolkit also provi des explanati ons and details for vari ous accounting pr ocedures commonly used in microf
Qualified, Trained and Motivated Staff An accounting s ystem is only as good as the accounting staff that use and manage it. It is important that your MFI employs qualified and trai ned staff to carry out accounting responsibilities. Bookk eepers or data entryrecord financial transactions and activi ties, and m ust knowcorrectly. A ccountants should verif y, reconcile and pstatements supported by acco mpanying schedules, and m ust know how to do that well. MFI Finance Managers and Executive Directors need to understand financial information, verify report s, analy se performance, an d make the
MicroSave – Market-led solutions for financial services
MFI Basic Financial Management and Ratio Analysis for MFIs Section 1 - 11 necessary decisions to improve and strengthen the institution.
External and Internal Audits External audits are generally required of most MFIs, if not by the donor, then by local regulating bo dies. External audits can be useful in verify ing t he
d credibility to the t ransparency of nal auditors to m aintain an orde rly
se is to d etermine rary, identify risks
ment to minimize those risks. An internal udit functio n in an MFI greatly strengthens intern al control syste ms, and al so gives the external
mulations occur w ithin t he e same as if a manual system were used.
tutory requirements and at reports provide timely, necessary information needed to manage and guide the institution.
reasonableness of financial statements, a nd adyour MFI. However, it is not the role of exterset of financial records, or to be res ponsible for mai ntaining strong s ystems and preventing fraud. This is your responsibility – as the MFI. Internal audits can im prove a MF Is fin ancial and o perating sy stems; their purpowhether stated policies and procedures are followed, report any findings to the contto the institut ion, and m ake reco mmendations to manageaauditor confidence to rely on the financial statements.
The Accounting Cycle The accounting cycle described here illustrates both automated and manual accounting systems. In an automated system , many of the calcul ations, pos ting and account accusoftware. However, the process is th The role of senior management with respect to the accounting cy cle is to understand the ke y processes, key controls in the cy cle, hire and s upervise qualified and m otivated staff, ens ure that policies address the areas of identified risk, ensure that policies meet local stath
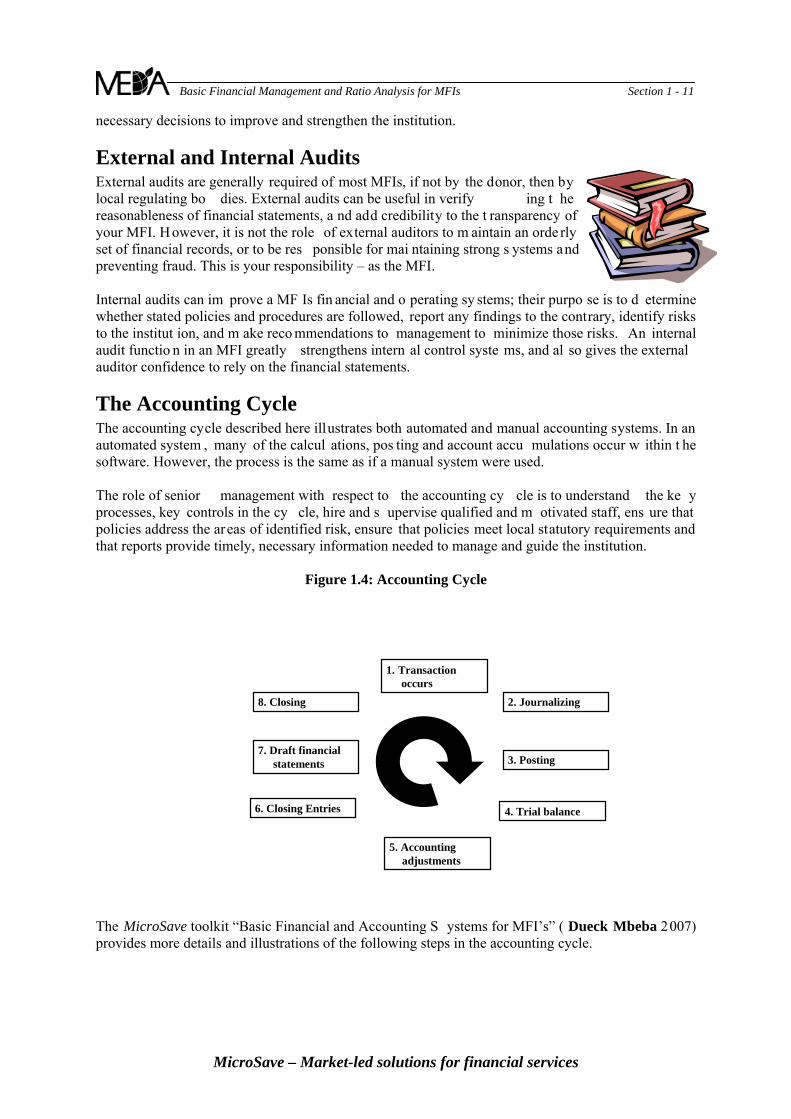
Figure 1.4: Accounting Cycle
1. Transaction occurs
2. Journalizing
3. Posting
4. Trial balance
5. Accounting adjustments
6. Closing Entries
7. Draft financial statements
8. Closing
The MicroSave toolkit “Basic Financial and Accounting S ystems for MFI’s” ( Dueck Mbeba 2007) provides more details and illustrations of the following steps in the accounting cycle.
MicroSave – Market-led solutions for financial services
MFI Basic Financial Management and Ratio Analysis for MFIs Section 1 - 12
Transactions he accounting cy cle beg ins with the source docum ent that verifies, supports and documents the ansaction, and its accounting transaction vo ucher. Financial transactions generally do not occur in a
documents. The accounting transaction voucher is the MFI’s document that triggers cess in the MFI’s accounting system. Before being entered, the voucher is drawn up,
as a daily diary of transactions, chronological order from the accounting transaction vouchers.
heet amounts, and annual revenue and expenses amounts in those
b.
s, adjustments (if posting errors), and savings contributions.
At the eposted to t
nts.
having debit balances in one column and those having credit balances in
bit and credit columns agree
conciliations of various proc esses and nancial data . Reconciliations usuall y
cash, bank reconciliations, disbursements (reconciling the general ledger to nts (reconcilin g the genera l ledger to the MIS) travel advances, accounts
ents also include non-cash adjustments or transactions like the following item s: record depreciation, recognise or amortise pre-paid rent, record accrued expenses like in terest payable, expenses payable, allowance for
Ttrvoid without anythe recording proaccount codes assigned, calculations checked and managerial approval granted. Classifying Transactions The first step in the cycle is to classify the transaction. The Chart of Accounts will provide the proper
de to record the transaction in the accounting system. co Journaling All financial transactions are entered into the accounting system by means of the journals, whether the
sh journal, the bank journal or the general journal. The journals actcalisting them in Posting to the General Ledger a. Posting is the proces s of transferring jour nal entry inf ormation fro m the Journals to the
General ledger. The general ledge r is a record of every account i n the Chart of Accounts. It stores cumulative Balance Saccounts.
In addition, detailed client transactions ( not sum marised) must be posted to each client account in t he subsidiar y ledgers (or client accounts, MIS). This includes disbursem ents, repayment
Trial Balance nd of an accounting period, after all journal entries have been made and
he General Ledger, a trial balance is prepared to help in the preparation of the financial stateme The trial balance is prepared by: 1. Taking the account balances from the General Ledger
. Listing the accounts2the other column.
3. Ensuring that the total de
Reconciliations Before finali sing the trial balance, it is i mportant to make reaccounts to e nsure good i nternal control and integr ity of the fiinclude items like petty the MIS), loan repay mepayable, and outstanding loan balances (the general ledger to the MIS).
Accounting Adjustments Accounting adjustments are usually recorded in the general journal, as they often do not involve cash or bank, an d if they do , they are to record corrections. Accounting adjustm
MicroSave – Market-led solutions for financial services
MFI Basic Financial Management and Ratio Analysis for MFIs Section 1 - 13
MicroSave – Market-led solutions for financial services
loan losses, write-offs, etc. These are bThere may be others as wel l, and it is th
ased on the broader acco unting policies adopted by the MFI.
hat all the num bers have been posted correctly as well. Usually, draft statements are pr epared fi rst, allowing Accountants t o c onduct the necessary
eeded to ensure that i nformation is accurate. Cash Flow
vious periods, become a barometer of measuring change
gers, Boards, g overnment agencies and financial
. materiality): Information provided by the financial statements must be relevant to
e work of accountants to use their professional discretion and local resources to know how to make these entries.
Draft Financial Statements The Balance Sheet and the Income Sta tement are pr epared by us ing the information from the tria l balance. The Income Statement is often prepared fi rst. The Net Inco me/(Loss) can then be posted to the Balance Sheet. This acts as a che ck to ensure t
reconciliations and make t he correction s nstatements involve both the Balance Sheet and the Income Statement, and the movements of cash and bank accounts included in the general ledger. The financial state ments a re the final t angible output of the acc ounting sy stem. It is the f inancial statements – the balance s heet and the income a nd expense state ment -- that provide the heart of financial information needed for financial analy sis. Financial stat ements and portfolio repor ts allow for the calculation and analy sis of financial perform ance ratios. Financial st atements, par ticularly when compared to budget, or compared to preand growth, and performance according to plans. The presentation of financial statements varies from country to country. The primary issue is that they provide meaningful and easy to understand information. Indian accounting standards for microfinance promote the following qualitative char acteristics of MFI financial statements. They are int ended to promote industry wide best practices, hi gh quality, and to ensure that all information needs of MFI stakeholders are met – investors, donors, manapartners of MFIs. Clarity and understanding: the infor mation provided in financ ial statements should be readily
understandable by users. This does no t mean that information about intricat e matters that is important for decision-making sh ould be exclude d merely on th e ground tha t it m ight be too difficult for certain users to understand.
Relevance (i.ethe users of those statements. This implies that MFI financial statements should be structured and produced to be useful an d relevant to all st akeholders such as funding age ncies, government agencies, etc.
Reliability: To be useful , inform ation and reports must also be reliable. Information has the quality of reliabilit y when it is free fr om material errors, misstatements and bias and can be depended upon by internal as well as outside users.
Comparability: The financial st atement of the microfinance institutions shoul d be drawn b ased upon principles and poli cies that are followed c onsistently and un iformly throug h o ut the institution. This is necessary to make the information generated by the financials comparable over the years, within the same institution, as well across institutions. A common “Chart of Accounts” is meant to meet this purpose. Reports that show actual performance against budget also provide a means to evaluate performance.
MFI Basic Financial Management and Ratio Analysis for MFIs Section 2 - 14
2. The Financial Statements and Operational Reports The purpose of financial management is to m aintain financial integrity a nd high performance levels within the microfinance institution. Financia l management helps the organisation evaluate performance, plan, and make decisions. Financial reports allow the manager to sort throug h all th e information generated, and to organise it into a meaningful framework. Financial information is like a map that tells what is actually going on in an MFI and where it is headed. Who uses Financial Information? The key stakeholders of t he organisation all need a ccess to fina ncial information. Key stakeholders include: MFI credit staff (supervisors and credit o fficers), Branch managers, the Executive Director, and the Board of Directors. There are also external stakeholders like banks, donors, invest ors, raters and perhaps also the Central Bank, if the MFI is regulated. What Financial Information and Reports? Generally, an MFI's financial status can be determin ed by three types of financial reports that have their basis in two separate, yet interdependent systems: Financial statem ents (fro m the accounting s ystem) – the Balance Sheet, the Income and
Expense statement Cash flow statements (from the accounting s ystem) – Cash Flow Statements; Cash Flo w
Projections can be prepared from the statements as well in order to plan for smooth operations Portfolio reports (from the client portfolio system, essentially the sub-ledger of the accounting
system) and operational reports
The Financial Statements The starting point for sound financial management is the ti mely and accurat e production of financial reports. This is absolutely critical to the health of a microfinance program. If financial records are not produced accurately and punctually , the ratio analy sis becomes misleading and unreliable. An MFI should produce financial statements fr om its accounting s ystem on a m onthly basis. Though the particular format varies somewhat from country to country, financial statements include: the Income Statement, also called Profit and Los s Stat ement, or Incom e and Expense
Statement, and the Balance Sheet
Financial Statement formats vary from country to country, and perhaps by legal registration as well. The format is not considered very important in this toolkit – however, it is very important that the financial definitions of terms and ratios remain consistent, and adhere to international sector standards! This is to enable relevant comparisons between MFIs, nationally and internationally. Of course – the basic accounting equation must apply to all balance sheet formats!
The Income and Expense Statement The prim ary indicators o f an organisation' s capaci ty to generate inco me are found in its Income Statement. The Inco me and Expense State ment provides an overview of fin ancial performance and activity over a given period of time, such as a month, quarter or year. While the balance sheet is like a photograph at a point in time, or a “stock” statement, the income statement covers a period of tim e. It is a “flow” statement. The income statement summarises the total revenue earned in the period and the total expenses incurred in the period. An exces s of revenue over expenditure is called a profit or surplus; when expenses are greater than income, the MFI will report a loss or deficit.
MicroSave – Market-led solutions for financial services
MFI Basic Financial Management and Ratio Analysis for MFIs Section 2 - 15 Income Statement presentation generally includes two or even more columns of data. It will show the current period’s activity , and also a column that shows the pa st period’s activity. Som e MFIs show budget colu mns, percentage of budg et, current quarter activity, year to date activity and so on. Information on the Inco me Statement is normally divided bet ween revenu e accounts and expense accounts. It also generally segregates operatin g fr om non-operating account s. Operating accounts relate to the core business of an MFI – its fi nancial service activity. Non-operating accounts include any revenue and expenses from other activities. Income Income is w hat a m icrofinance organisation receives for what it does, provide financial services , including lending money. MFIs also generate income from non-operating activities – such as training, the sale of merchandise or books, and from external sources. Most MFIs generate internal income from their financial service activity. These include: interest income fees for services penalties for late loan payments registration and application fees
External income is the amount received as grants from donors in support of the MFI. It is generally considered as non-operating activity and reported on separately in the Income and Expense Statement. This enables analysis and performance to be measured on the basis of microfinance activities only. Expenses Expenses are costs the MFI must incur to carry out its activities. Expenses are broken down into different categories such a s salaries, rent and transportation. Expenses ar e usually considered direct or indirect. Direct expenses are those which relate to a particular activity , product or service. For example, salaries for credit officers are the direct expense of the credit department. Indirect expenses, also called overhead, are those expenses which can not be tied e xclusively to a single activity . For example, the salary of the Executive Director is cons idered overhead when he/she is part of an MFI that has many pr oducts and services, and may also provide non-financial services to its clients. Typical expenses for the MFI include: financial costs (interest on loans or debt invest ments, interest paid on deposits or an y o ther
client savings) provision for loan losses (the estimate of future losses incurred) operating expenses (all other expenses incurred in operating the activities of the MFI) Handout 2.1 Sample Income and Expense Statement illustrates a typical MFI Income and Expense Statement. It is taken from the SEEP document “Measuring Performance of Microfinance Institutions: A Framework for Reporting, Analysis, and Monitoring”, 2005. The Balance Sheet The balance sheet is a statement of financial position of the MFI at a particular point in time. It is like a stock statement, giving account for the MFI’s financial structure. It reflects the state of affairs on a given date, usually at the end of a particular period, a month or a year. Most MFIs produce a balance sheet on a monthly basis at a minimum, giving the ending balance of all assets, liabilities and equi ty accounts – the three balan ce sheet co mponents. Equity is also referred to as n et worth or capital at times. A balance s heet always balances, m eaning that the debits must equal the credits. The basic accounting equation applies to the balance sheet:
MicroSave – Market-led solutions for financial services
MFI Basic Financial Management and Ratio Analysis for MFIs Section 2 - 16
Assets = Liabilities + Equity (Revenue – Expenses)
As in any mathematical or algebraic equation, this above equation can also be expressed as follows:
Liabilities – Assets = Equity
OR
Equity = Assets – Liabilities
The presentation of the balance sheet may var y fro m country t o countr y, and from instit ution to institution. International Accounting St andards do not recommend any particular format; as long as the accounts are in balance and the above equations are in agreement, an y t ype of f ormat is acceptable. Assets Assets are what a MFIs organisation has or is owed. For an MFI these typically include: cash investments – short and long term client loan portfolio (an Allowance f or Loan Losses, also ref erred to as t he Loan Loss
Reserve, or the I mpairment Loss All owance, known as a “co ntra” account, reduces the balance of the loan portfolio by an amount set aside to cover future losses), and
fixed assets -- equipment, property, vehicles (the Accumulated Depreciation account is also a “contra” account since it reduces the value of th e assets based on their wear and tear, and provides a “net value” of assets that is more in line with their fair market value, as used items)
Assets also i nclude other items like pr epaid expenses, miscellaneous accounts receivable, intangible assets (e.g. software developm ent and goodwill). Fr om a financi al perspective, asset s represent an investment f or the genera tion of future receipts of c ash and reve nue for the MFI. For exa mple, a microfinance organisation lends out funds with the expectation that the funds will be rep aid with interest. In order to purchase or build the ass et base, an org anisation either borrows money (a liability), invests its own m oney (accumulated surpluses), or attracts investors who contribute capital or equity. Assets are generally classified on the balance by type and then by maturity of their liquidation to cash. Traditionally, the reporting emphasis has been on asset maturity – and to report and list assets by their cash or near- cash value. This created t he e mphasis on long-term and short-te rm as sets. A ssets that were readily liquidated were reported first on the Balance Sheet. The current trend in International Financial Reporting Standards is to report the assets according to their use or intended use. However, for ratio calculation purposes, specific ally, the liqui d ratio, MFI financial state ments do encourage reports that segregate assets between those that mature in less than 12 m onths from those that mature in more than 12 months. The sample balance sheet in Handout 2.2 Sample Balance Sheet is typical of the current reporting formats.
MicroSave – Market-led solutions for financial services
MFI Basic Financial Management and Ratio Analysis for MFIs Section 2 - 17 Liabilities Liabilities are what an MFI owes to others. Liabil ities are debts the m icrofinance institut ion has incurred and must pay off in the future. The balance sheet records the amount payable – principal and interest as of the date of the balance sheet. For MFIs these typically include: client savings and deposits trade accounts payable bank overdraft accounts and lines of credit borrowed funds Liabilities are an important source of funds for MFI operations. They can be an efficient and effective way to generate revenue. For exam ple, an MFI w ill often borrow money (either from clients in the form of savings or from a bank, donor or other fina ncial institution) and lend this money to their clients at a higher rate of interest than the y pay fo r the b orrowed m oney. Without this source of borrowed funds, the MFI will have fewer assets (speci fically, less cash to lend to its client b ase) and therefore lower potential for generating future income. Liabilities, like assets, are also classified on the balance by ty pe and then by maturity an obligation to repay. The reporting distinction on liability maturity is that short-term liabilities are those that mature within 1 y ear and long-term liabilities mature beyond 1 y ear. The sam ple balance sheet in Handout 2.2 Sample Balance Sheet is ty pical of the current microfinan ce reporting formats and the ty pes of liabilities common in MFIs. Equity (Net Worth or Capital) An MFI’s equity or net w orth represents what the organisation owns. Net Worth is made up of two components: contributed o r paid-in capital such as grant funds, share capital, or privatel y invested contributed capital. It is also made up of th e accumulated earnings/deficits from operations. Unlike liabilities, the equity or net worth does not have to be paid back. Payment of dividends to shareholders will reduce the value of the capital that is accumulated in the MFI. An institution, whose assets have been financed largely by debt, will have high liabilities compared to its capital; one might wonder about its ability to pay off its debts or to meet its cash flow or liquidity requirements. On the other hand, an MFI that has high net worth compared to its liabilities may not be leveraging its resources adequately to access external funding sources, assuming they are available. The advantage of funding asset s through equity rather than liabili ties is that th e money does not need to be repaid. Therefore the cash earned from assets can be us ed to cover operating expenses, or it can be reinvested. A strong equity base is criti cal to building an institution t hat will survive and grow. Finding the appropriate structural balance between liabilities and equity is an ongoing process; there is no simple or magic solution, as there are many variables that enter into this analysis. The availability of funds and the t ypes of funds are critical factors. Are funds available at
concessional rates or market rates? Concessional rates will help to maximise cash flows in the short term.
MFI competition will affect the decisions on t he balance sheet capital structure. What interest rates are MF I borrowers willing and a ble to pa y for credit products? What are other MFIs offering? A highl y com petitive MFI market will drive down borrowing c osts to client s, forcing the MFI to use the lowest possible cost o f funds available in order to allow for adequate margins to cover their operating costs.
MicroSave – Market-led solutions for financial services
MFI Basic Financial Management and Ratio Analysis for MFIs Section 2 - 18 Handout 2.2 Sample Balance Sheet illustrates a typical MFI Balance Sheet. It is taken from the SEEP document “Measuring Perfor mance of Microfina nce Institutions: A Fra mework for Reporting, Analysis, and Monitoring”, 2005.
Cash Flow Statements Cash Flow statements are useful tools in the analy sis of liquidit y (comparing actual liquidi ty to the policy set b y the MFI), in reviewing external liquidit y requirements (e.g. for the Central Bank or for other regulatory bodies) and for smooth management of operations. The traditional Cash Flow Statement is usually included in t he organisation’s audited financial statements. It shows the sources of changes in cash balances throughout the year, the sources and uses of funds, thr ough operati ons, through increases and decreases in invest ments, receivables, and liabilities, and the resulting cash bal ances at the en d of the fiscal y ear. In act ual practice, the Cash Flow Statement is used the least by most MFI practitioners, particularly those in young MFIs that ar e focussed on the bottom line performance of the opera tions. MFIs that borrow funds for the ir loan portfolio or offer client savings tend to be very c onscious of the d ynamics on the Cash Flo w Statements.
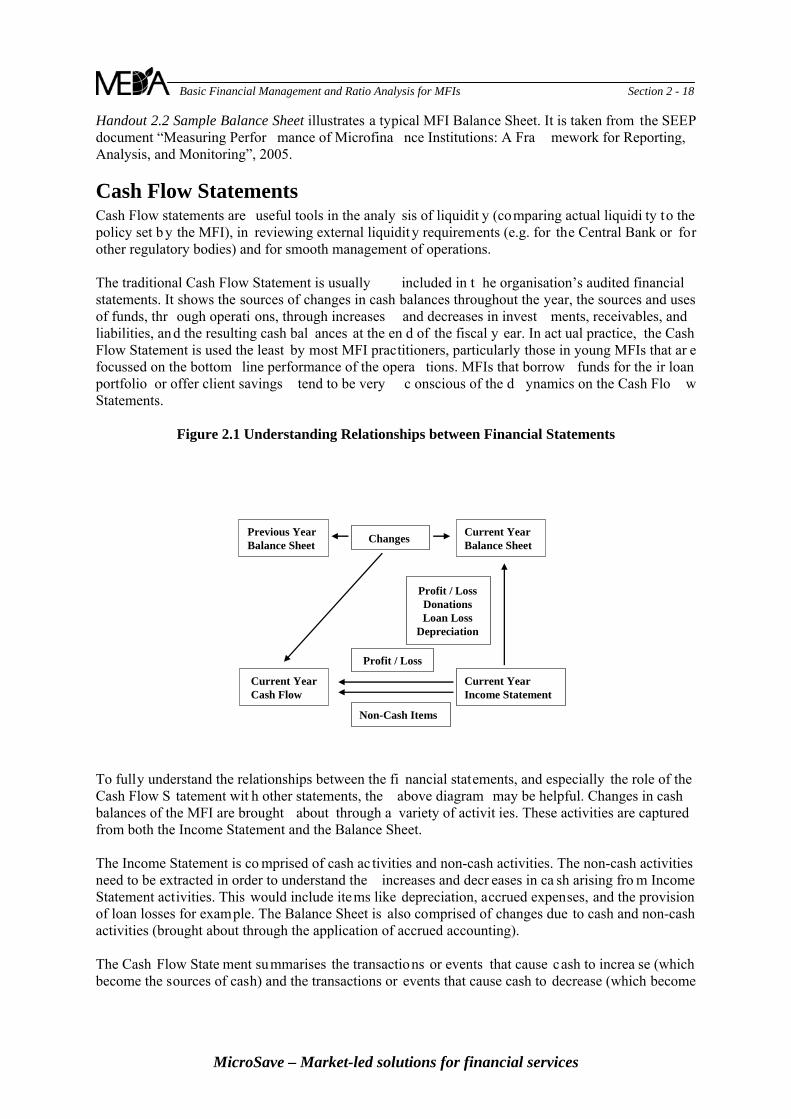
Figure 2.1 Understanding Relationships between Financial Statements
Previous Year Balance Sheet
ChangesCurrent Year Balance Sheet
Current Year Cash Flow
Current Year Income Statement
Profit / LossDonationsLoan Loss
Depreciation
Profit / Loss
Non-Cash Items
To fully understand the relationships between the fi nancial statements, and especially the role of the Cash Flow S tatement wit h other statements, the above diagram may be helpful. Changes in cash balances of the MFI are brought about through a variety of activit ies. These activities are captured from both the Income Statement and the Balance Sheet. The Income Statement is co mprised of cash ac tivities and non-cash activities. The non-cash activities need to be extracted in order to understand the increases and decr eases in ca sh arising fro m Income Statement activities. This would include items like depreciation, accrued expenses, and the provision of loan losses for example. The Balance Sheet is also comprised of changes due to cash and non-cash activities (brought about through the application of accrued accounting). The Cash Flow State ment summarises the transactions or events that cause cash to increa se (which become the sources of cash) and the transactions or events that cause cash to decrease (which become
MicroSave – Market-led solutions for financial services
MFI Basic Financial Management and Ratio Analysis for MFIs Section 2 - 19 the uses of cash). The following three paragraphs are adapted from the SEEP Framework.4 The sources of cash can include events that cause the following changes:
A decrease in assets other than cash, such as receiving loan repayments from clients; An increase in liabilities, such as accepting a deposit or borrowing from a bank; An increase in Paid-In Capital, such as selling shares to investors or members; and An increase in retained earnings through generating net income.
The uses of cash can include events that cause the following changes:
Increases in assets other than cash, such as making loans to clients; Decreases in liabilities, such as repaying a deposit or paying the principal on borrowed funds; Decreases in Paid-In Capital, such as re-purchasing shares or reimbursing member shares; and Decreases in retained earnings throu gh genera ting a net loss (after taxes and donations) o r
payment of dividends to shareholders. A Cash Flow Statement classifies these inflows and outflows of cash into the following three major categories:
Operating Activities, the cash receipts a nd payments related to the MFI’s ongoing provision of financial services, including lending and deposit services;
Investing Activities, the cash receipts or outla ys for acquiring or selling Fixed Assets or financial investments; and
Financing Activities, the borrowing and repayment of borrowings, the sale and redem ption of Paid-In Capital, and the payment of di vidends. This does not include the fina ncial activities related to regular operating activities.
There are two approaches to prepare a Cash Flow Statement. One is the called the “direct method” and it is probabl y the m ore intuitive of the two a pproaches. The Direct Cash Flow Statement in a sense reconstructs the Income Stat ement and tracks al l operational events that have caused an inflow or outflow of cash. It also captures all i nvesting and financing events that have created an inflow or outflow of cash. Handout 2.3 Sample Cash Flow Statements illustrates a both Direct and Indirect Cash Flo w Statements. The sam ple is also tak en fro m the SEEP document “Measuring Perfor mance o f Microfinance Institutions: A Framework for Reporting, Analysis, and Monitoring”, 2005. The Indirect Cash Flow S tatement take s a deductive approach to preparation and format. It begins with the Net Income reported on the In come and Expense Statement and then adds back all non-cas h expenses fro m the Inco me State ment. It also then a dds or subtracts all cash i ncreases or d ecreases from operational events, including loan disbursements and loan re payments, increases and decreases in trade payables and other liabilities, and increases and decreases in client deposits and in other assets or Trade Investments. Then it shows all increases and decreases in cash due to investing activities and also financial activities. Again, financial activ ities are those related to borrowings and debt investments with the MFI, and not regular opera ting activities that relate d to providi ng financial services. As MFIs grow and divers ify – an d include the m obilisation of deposits as a financial service and a means to generate capital, and ac cess debt financ ing, the Cash Flow Statement takes on increasing importance. It is an i mportant tool for m onitoring and managing the changes in cash positi on of the MFI, and may signal issues to address in the debt and equity balance and capital structure of the MFI.
4 “Measuring Performance of Microfinance Institutions: A Framework for Reporting, Analysis, and
Monitoring”, SEEP Network, 2005, pg. 23.
MicroSave – Market-led solutions for financial services
MFI Basic Financial Management and Ratio Analysis for MFIs Section 2 - 20
Handout 2.4 Sample Audited MFI Statements – India illustrates reporting formats common in India.
Cash Flow Projections Cash Flow projections are also critical tools in liquidity analy sis – partic ularly f or expanding operations, managing seas onal demand for loans and for the s mooth management of operations. It is critical to pay staff salaries on time and to continue to meet the demand for loans. Projections become even more important when the MFI begins to attract client savings and deposits, or acquire external debt funding from other banks or investors. In orde r to build and maintain the trust of the co mmunity and the investors, MFIs must be able to pay de posits on demand, and meet their debt obligations according to schedule. This necessitates very careful cash monitoring and forecasting. When making Cash Flow Projections, it is often more useful to show projected collections of loan s (interest and principal), projected disbursement of loans, and other projected cash inflows and outla ys along side actual m ovements of cash in the various categories. The Sam ple Cash Flow Projection presented in Handout 2.5 Sample Cash Flow Projections can be adapted on a spreadsheet by the MFI to include the items significant to their operations. Many MFIs also use the MICROFIN planning an d projection tool for both business planning and ongoing cash management and projections. MFIs that have many more variables, or need more advanced tools should r efer to the Women’s World Banking “Financial Risk Managem ent Toolkit.” It provides more sophisticated resources an d spreadsheets for m onitoring interest rate margins, managing foreign exchange risks, and maximizing liquidity levels in microfinance institutions (www.swwb.org).
The Portfolio and Operational Reports The information on the portfolio report is technically not part of the general ledger accounting system, but part of the subsidiary ledger that manages client loans and savings transactions. The summarized Portfolio Report provides the status of loan dis bursements and co llections during the current month and the current y ear. G ood p ortfolio tracking s ystems also report the total am ount of loans outstanding, the amount of loans late, the am ount at risk, and the aging of the loans. Most sy stems also track the number of loans and/or clients in these categories. Many MFIs look to the portfolio tracking systems to provide much more information on im pact, and to segment portfolio by Loan Officer, by product, by Branch, and so on. The financial information on portfolio reports is consi dered the most i mportant for financial management and ratio analy sis purposes. Together with the financial statements, the inform ation on the Portfolio Report is used to calculate key financial ratios that h elp to measure the progres s and health of the financial institution. For this reason, the focus of the Portfolio Re port in th is toolkit is o n actual output of financi al service operations, a nd n ot client im pact. Some portfolio tracking s ystems ar e very extensive, and include options for generating the Allowance f or Loan Losses, and Hu man Re source data reports. Othe r systems are l ess sophisticated and si mply provide the raw data with which to collate and prepare Portfolio Reports. The following chart lists t he Portfolio r eports that are usually gen erated by an MFI, how of ten they are produced, and their major purpose.
MicroSave – Market-led solutions for financial services
MFI Basic Financial Management and Ratio Analysis for MFIs Section 2 - 21
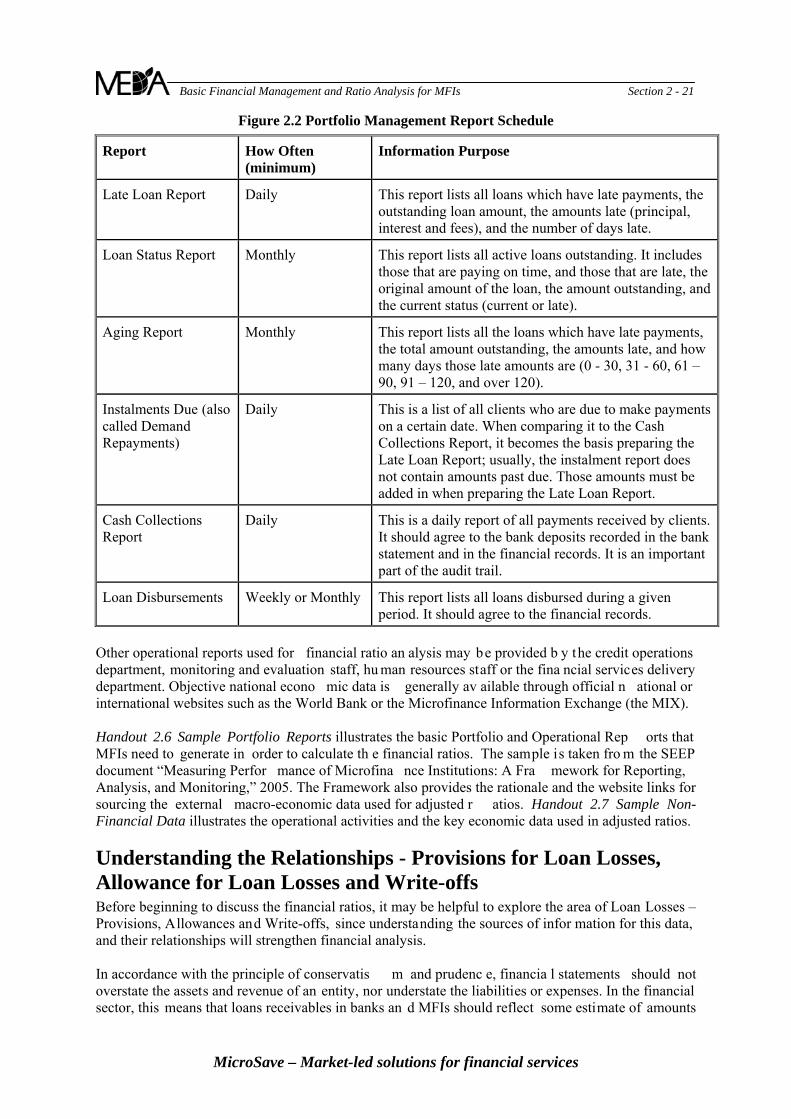
Figure 2.2 Portfolio Management Report Schedule
Report How Often (minimum)
Information Purpose
Late Loan Report Daily This report lists all loans which have late payments, the outstanding loan amount, the amounts late (principal, interest and fees), and the number of days late.
Loan Status Report Monthly This report lists all active loans outstanding. It includes those that are paying on time, and those that are late, the original amount of the loan, the amount outstanding, and the current status (current or late).
Aging Report Monthly This report lists all the loans which have late payments, the total amount outstanding, the amounts late, and how many days those late amounts are (0 - 30, 31 - 60, 61 – 90, 91 – 120, and over 120).
Instalments Due (also called Demand Repayments)
Daily This is a list of all clients who are due to make payments on a certain date. When comparing it to the Cash Collections Report, it becomes the basis preparing the Late Loan Report; usually, the instalment report does not contain amounts past due. Those amounts must be added in when preparing the Late Loan Report.
Cash Collections Report
Daily This is a daily report of all payments received by clients. It should agree to the bank deposits recorded in the bank statement and in the financial records. It is an important part of the audit trail.
Loan Disbursements
Weekly or Monthly This report lists all loans disbursed during a given period. It should agree to the financial records.
Other operational reports used for financial ratio an alysis may be provided b y the credit operations department, monitoring and evaluation staff, hu man resources staff or the fina ncial services delivery department. Objective national econo mic data is generally av ailable through official n ational or international websites such as the World Bank or the Microfinance Information Exchange (the MIX). Handout 2.6 Sample Portfolio Reports illustrates the basic Portfolio and Operational Rep orts that MFIs need to generate in order to calculate th e financial ratios. The sample is taken fro m the SEEP document “Measuring Perfor mance of Microfina nce Institutions: A Fra mework for Reporting, Analysis, and Monitoring,” 2005. The Framework also provides the rationale and the website links for sourcing the external macro-economic data used for adjusted r atios. Handout 2.7 Sample Non-Financial Data illustrates the operational activities and the key economic data used in adjusted ratios.
Understanding the Relationships - Provisions for Loan Losses, Allowance for Loan Losses and Write-offs Before beginning to discuss the financial ratios, it may be helpful to explore the area of Loan Losses – Provisions, Allowances and Write-offs, since understanding the sources of infor mation for this data, and their relationships will strengthen financial analysis. In accordance with the principle of conservatis m and prudenc e, financia l statements should not overstate the assets and revenue of an entity, nor understate the liabilities or expenses. In the financial sector, this means that loans receivables in banks an d MFIs should reflect some estimate of amounts
MicroSave – Market-led solutions for financial services
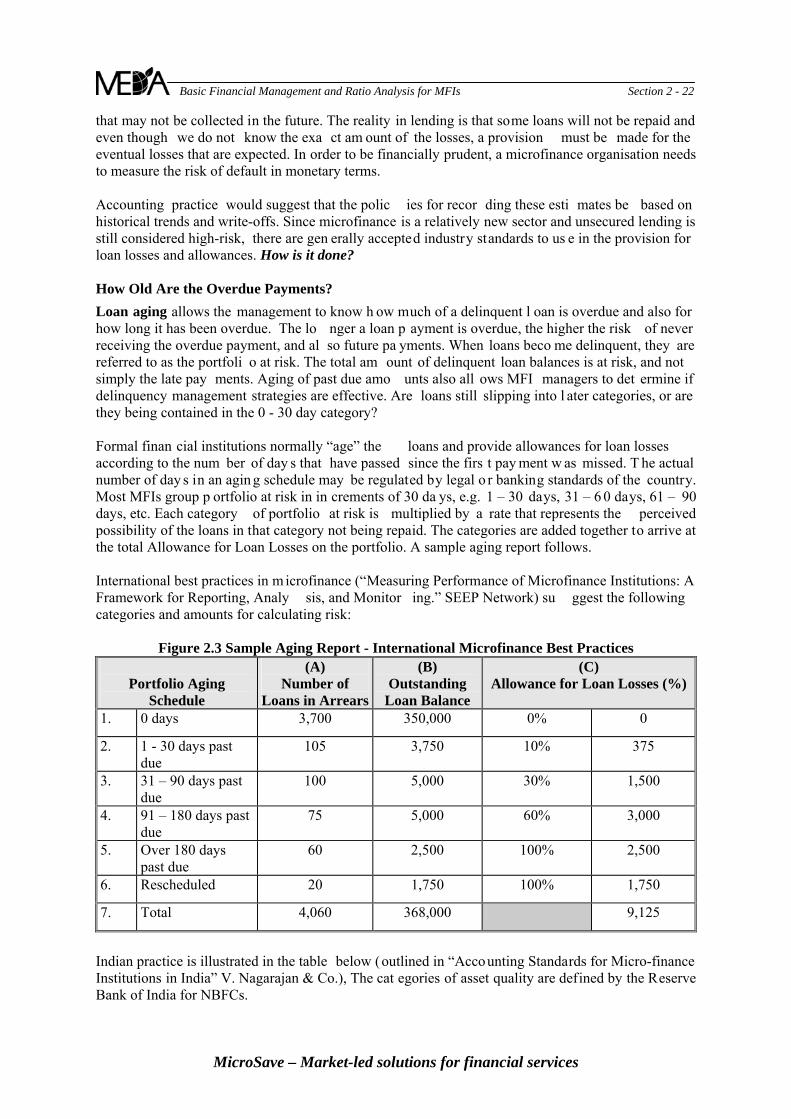
MFI Basic Financial Management and Ratio Analysis for MFIs Section 2 - 22 that may not be collected in the future. The reality in lending is that some loans will not be repaid and even though we do not know the exa ct am ount of the losses, a provision must be made for the eventual losses that are expected. In order to be financially prudent, a microfinance organisation needs to measure the risk of default in monetary terms. Accounting practice would suggest that the polic ies for recor ding these esti mates be based on historical trends and write-offs. Since microfinance is a relatively new sector and unsecured lending is still considered high-risk, there are gen erally accepted industry standards to us e in the provision for loan losses and allowances. How is it done? How Old Are the Overdue Payments?
Loan aging allows the management to know h ow much of a delinquent l oan is overdue and also for how long it has been overdue. The lo nger a loan p ayment is overdue, the higher the risk of never receiving the overdue payment, and al so future pa yments. When loans beco me delinquent, they are referred to as the portfoli o at risk. The total am ount of delinquent loan balances is at risk, and not simply the late pay ments. Aging of past due amo unts also all ows MFI managers to det ermine if delinquency management strategies are effective. Are loans still slipping into l ater categories, or are they being contained in the 0 - 30 day category? Formal finan cial institutions normally “age” the loans and provide allowances for loan losses according to the num ber of day s that have passed since the firs t pay ment w as missed. T he actual number of day s in an agin g schedule may be regulated by legal o r banking standards of the country. Most MFIs group p ortfolio at risk in in crements of 30 da ys, e.g. 1 – 30 days, 31 – 6 0 days, 61 – 90 days, etc. Each category of portfolio at risk is multiplied by a rate that represents the perceived possibility of the loans in that category not being repaid. The categories are added together to arrive at the total Allowance for Loan Losses on the portfolio. A sample aging report follows. International best practices in m icrofinance (“Measuring Performance of Microfinance Institutions: A Framework for Reporting, Analy sis, and Monitor ing.” SEEP Network) su ggest the following categories and amounts for calculating risk:
Figure 2.3 Sample Aging Report - International Microfinance Best Practices
Portfolio Aging Schedule
(A) Number of
Loans in Arrears
(B) Outstanding
Loan Balance
(C) Allowance for Loan Losses (%)
1. 0 days 3,700 350,000 0% 0
2. 1 - 30 days past due
105 3,750 10% 375
3. 31 – 90 days past due
100 5,000 30% 1,500
4. 91 – 180 days past due
75 5,000 60% 3,000
5. Over 180 days past due
60 2,500 100% 2,500
6. Rescheduled 20 1,750 100% 1,750
7. Total 4,060 368,000 9,125
Indian practice is illustrated in the table below (outlined in “Accounting Standards for Micro-finance Institutions in India” V. Nagarajan & Co.), The cat egories of asset quality are defined by the Reserve Bank of India for NBFCs.
MicroSave – Market-led solutions for financial services
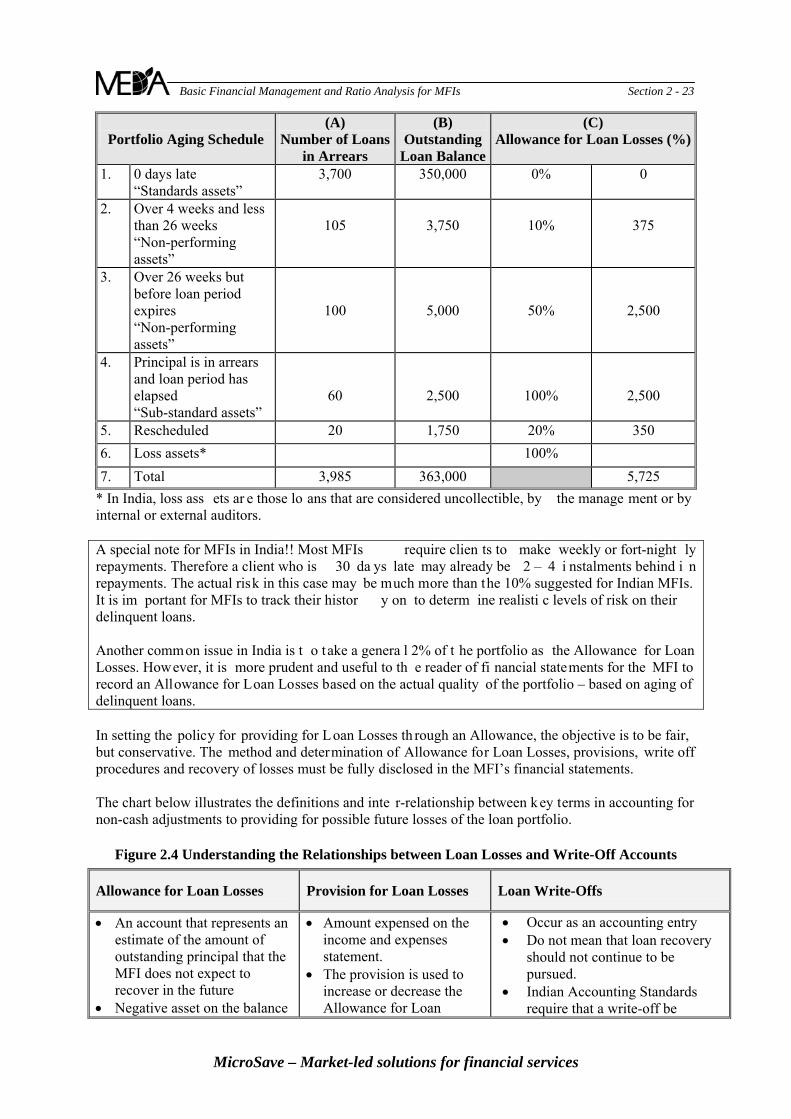
MFI Basic Financial Management and Ratio Analysis for MFIs Section 2 - 23
Portfolio Aging Schedule
(A) Number of Loans
in Arrears
(B) Outstanding
Loan Balance
(C) Allowance for Loan Losses (%)
1. 0 days late “Standards assets”
3,700 350,000 0% 0
2. Over 4 weeks and less than 26 weeks “Non-performing assets”
105
3,750
10%
375
3. Over 26 weeks but before loan period expires “Non-performing assets”
100
5,000
50%
2,500
4. Principal is in arrears and loan period has elapsed “Sub-standard assets”
60
2,500
100%
2,500
5. Rescheduled 20 1,750 20% 350 6. Loss assets* 100% 7. Total 3,985 363,000 5,725
* In India, loss ass ets ar e those lo ans that are considered uncollectible, by the manage ment or by internal or external auditors. A special note for MFIs in India!! Most MFIs require clien ts to make weekly or fort-night ly repayments. Therefore a client who is 30 da ys late may already be 2 – 4 i nstalments behind i n repayments. The actual risk in this case may be much more than the 10% suggested for Indian MFIs. It is im portant for MFIs to track their histor y on to determ ine realisti c levels of risk on their delinquent loans. Another common issue in India is t o take a genera l 2% of t he portfolio as the Allowance for Loan Losses. However, it is more prudent and useful to th e reader of fi nancial statements for the MFI to record an Allowance for Loan Losses based on the actual quality of the portfolio – based on aging of delinquent loans. In setting the policy for providing for Loan Losses th rough an Allowance, the objective is to be fair, but conservative. The method and determination of Allowance for Loan Losses, provisions, write off procedures and recovery of losses must be fully disclosed in the MFI’s financial statements. The chart below illustrates the definitions and inte r-relationship between key terms in accounting for non-cash adjustments to providing for possible future losses of the loan portfolio.
Figure 2.4 Understanding the Relationships between Loan Losses and Write-Off Accounts
Allowance for Loan Losses Provision for Loan Losses Loan Write-Offs
An account that represents an estimate of the amount of outstanding principal that the MFI does not expect to recover in the future
Negative asset on the balance
Amount expensed on the income and expenses statement.
The provision is used to increase or decrease the Allowance for Loan
Occur as an accounting entry Do not mean that loan recovery
should not continue to be pursued.
Indian Accounting Standards require that a write-off be
MicroSave – Market-led solutions for financial services
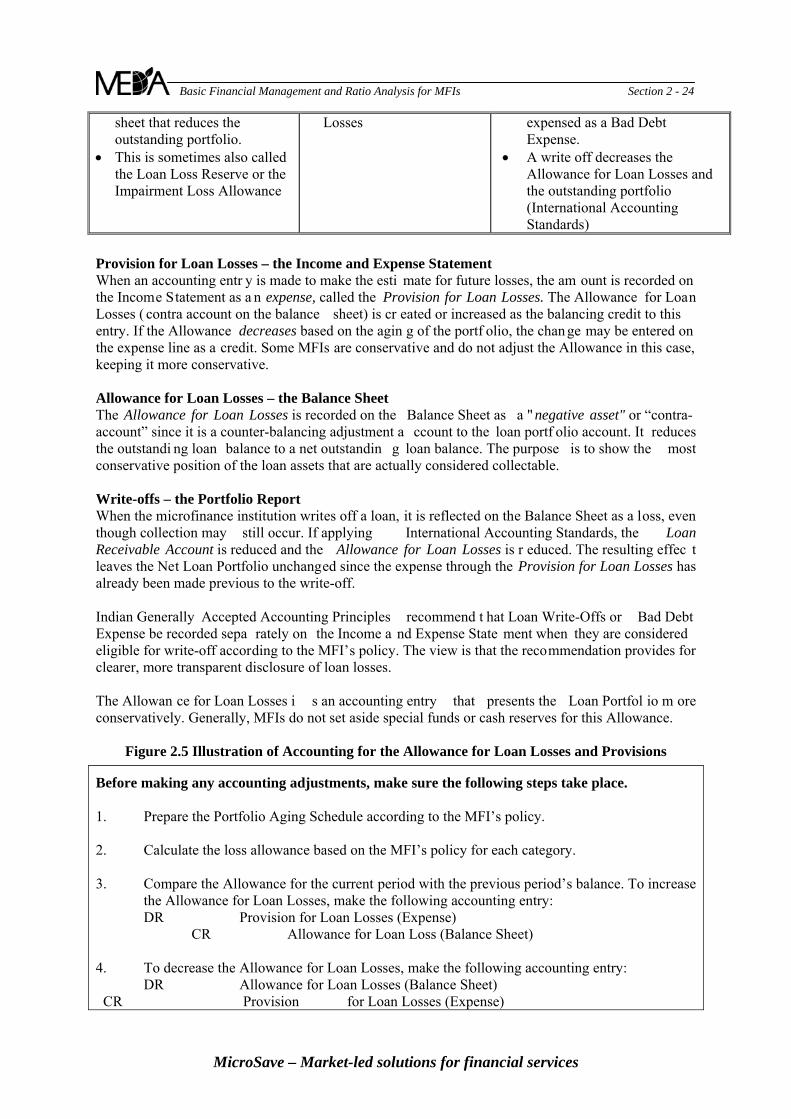
MFI Basic Financial Management and Ratio Analysis for MFIs Section 2 - 24
MicroSave – Market-led solutions for financial services
sheet that reduces the outstanding portfolio.
This is sometimes also called the Loan Loss Reserve or the Impairment Loss Allowance
Losses expensed as a Bad Debt Expense.
A write off decreases the Allowance for Loan Losses and the outstanding portfolio (International Accounting Standards)
Provision for Loan Losses – the Income and Expense Statement When an accounting entr y is made to make the esti mate for future losses, the am ount is recorded on the Income Statement as a n expense, called the Provision for Loan Losses. The Allowance for Loan Losses ( contra account on the balance sheet) is cr eated or increased as the balancing credit to this entry. If the Allowance decreases based on the agin g of the portf olio, the chan ge may be entered on the expense line as a credit. Some MFIs are conservative and do not adjust the Allowance in this case, keeping it more conservative. Allowance for Loan Losses – the Balance Sheet The Allowance for Loan Losses is recorded on the Balance Sheet as a "negative asset" or “contra-account” since it is a counter-balancing adjustment a ccount to the loan portf olio account. It reduces the outstandi ng loan balance to a net outstandin g loan balance. The purpose is to show the most conservative position of the loan assets that are actually considered collectable. Write-offs – the Portfolio Report When the microfinance institution writes off a loan, it is reflected on the Balance Sheet as a loss, even though collection may still occur. If applying International Accounting Standards, the Loan Receivable Account is reduced and the Allowance for Loan Losses is r educed. The resulting effec t leaves the Net Loan Portfolio unchanged since the expense through the Provision for Loan Losses has already been made previous to the write-off. Indian Generally Accepted Accounting Principles recommend t hat Loan Write-Offs or Bad Debt Expense be recorded sepa rately on the Income a nd Expense State ment when they are considered eligible for write-off according to the MFI’s policy. The view is that the recommendation provides for clearer, more transparent disclosure of loan losses. The Allowan ce for Loan Losses i s an accounting entry that presents the Loan Portfol io m ore conservatively. Generally, MFIs do not set aside special funds or cash reserves for this Allowance.
Figure 2.5 Illustration of Accounting for the Allowance for Loan Losses and Provisions
Before making any accounting adjustments, make sure the following steps take place. 1. Prepare the Portfolio Aging Schedule according to the MFI’s policy. 2. Calculate the loss allowance based on the MFI’s policy for each category. 3. Compare the Allowance for the current period with the previous period’s balance. To increase
the Allowance for Loan Losses, make the following accounting entry: DR Provision for Loan Losses (Expense)
CR Allowance for Loan Loss (Balance Sheet) 4. To decrease the Allowance for Loan Losses, make the following accounting entry:
DR Allowance for Loan Losses (Balance Sheet) CR Provision for Loan Losses (Expense)
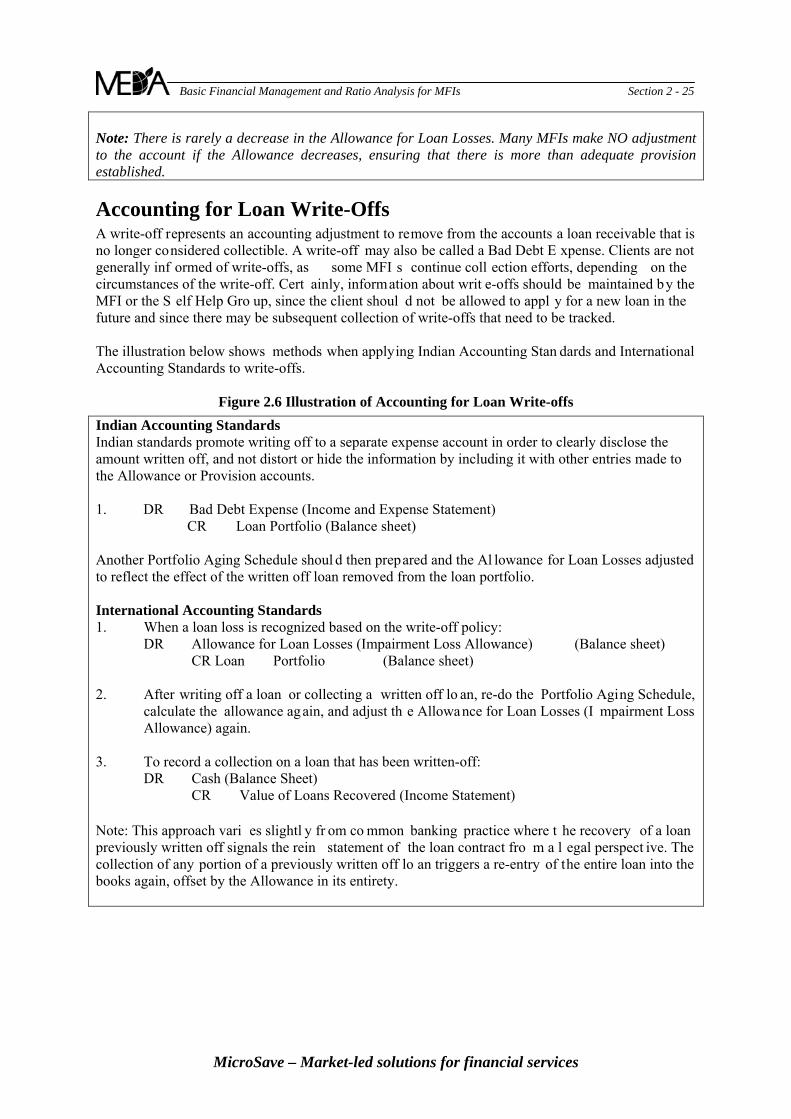
MFI Basic Financial Management and Ratio Analysis for MFIs Section 2 - 25
Note: There is rarely a decrease in the Allowance for Loan Losses. Many MFIs make NO adjustment to the account if the Allowance decreases, ensuring that there is more than adequate provision established.
Accounting for Loan Write-Offs A write-off represents an accounting adjustment to remove from the accounts a loan receivable that is no longer considered collectible. A write-off may also be called a Bad Debt E xpense. Clients are not generally inf ormed of write-offs, as some MFI s continue coll ection efforts, depending on the circumstances of the write-off. Cert ainly, information about writ e-offs should be maintained by the MFI or the S elf Help Gro up, since the client shoul d not be allowed to appl y for a new loan in the future and since there may be subsequent collection of write-offs that need to be tracked. The illustration below shows methods when applying Indian Accounting Stan dards and International Accounting Standards to write-offs.
Figure 2.6 Illustration of Accounting for Loan Write-offs
Indian Accounting Standards Indian standards promote writing off to a separate expense account in order to clearly disclose the amount written off, and not distort or hide the information by including it with other entries made to the Allowance or Provision accounts. 1. DR Bad Debt Expense (Income and Expense Statement) CR Loan Portfolio (Balance sheet) Another Portfolio Aging Schedule shoul d then prepared and the Al lowance for Loan Losses adjusted to reflect the effect of the written off loan removed from the loan portfolio. International Accounting Standards 1. When a loan loss is recognized based on the write-off policy:
DR Allowance for Loan Losses (Impairment Loss Allowance) (Balance sheet) CR Loan Portfolio (Balance sheet)
2. After writing off a loan or collecting a written off lo an, re-do the Portfolio Aging Schedule,
calculate the allowance again, and adjust th e Allowance for Loan Losses (I mpairment Loss Allowance) again.
3. To record a collection on a loan that has been written-off:
DR Cash (Balance Sheet) CR Value of Loans Recovered (Income Statement)
Note: This approach vari es slightl y fr om co mmon banking practice where t he recovery of a loan previously written off signals the rein statement of the loan contract fro m a l egal perspect ive. The collection of any portion of a previously written off lo an triggers a re-entry of the entire loan into the books again, offset by the Allowance in its entirety.
MicroSave – Market-led solutions for financial services
MFI Basic Financial Management and Ratio Analysis for MFIs Section 3 - 26
3. Basic Financial Ratios
Management is a skill, but like most professions and vocations, the skill relies on adequate and reliable tools with which to perform its tasks.
Using Financial Indicators or Ratios Ratios are n othing m ore than relationships betwee n num bers. However, in a financial institution, financial ratios are am ong the m ost significant m anagement tools available. There are many ratios used in banking and micro-finance; the categories and ratios discussed in this toolkit are often referred to as the “S EEP ratios.” SEEP – th e S mall Ent erprise Education and Prom otion Net work, has published a Framework that advocates industr y standa rd ratios for the m onitoring of m icrofinance institutions i n credit operations. The Fram ework builds on a consensus of practitioners, donors (including CGAP), evaluators and others in the microfinance industry (including The MIX). The publication “Measuring Perform ance of Microf inance Institutions: A Framework for Reporting, Analysis, and Monitori ng” illustrates the 18 SEEP Ratios u sed as standards of measuring and monitoring financial perform ance of microfinance institutions. (It is available at www.seepnetwork.org free of charge). It also presents a number of analytical adjustments often made to financial r ecords in or der to clearly understand true performance, the effect of su bsidies, and t he impact of inflation. Analytical adjustments are also applied to compare various MFIs with one another using a consistent base. Handout 3.1 SEEP Microfinance Ratios presents the ratios, the formulae used in calculations and a brief explanation of the ratio. This toolkit onl y provide s the det ails and the back ground to th e basic ratios, and not the adjusted ratios. Each of the ratios is nu mbered consiste ntly with the num bering sy stem used in t he SEEP Framework. The analy tical adjustments are discussed and illustra ted at length in the Framework, but not in this toolkit. Ratios are generally m ore meaningful – particular ly in microfinance – when compared wi th other financial profitable MFIs in the regio n. Handout 3.2 Comparing Performance Using BenchMarking and Handout 3.3 MicroBanking Bulletin Benchmarks for Asia provide interesting and inf ormative data about microfinance institutions generally and in the Indian context. MFIs should visit T he MIX website regularly to get updates of regional and country benchmarking activities (www.themix.org)
What are Ratios? In simple terms, ratios are relationships between numbers. They are generally calculated by dividi ng the numerator by a denominator. The re sult is expressed as a perc entage (Operating Self-Sufficiency ratio), a monetary value (Portfolio per Loan Offi cer), or through a comparison of whole num bers, as 3:1 (Debt / Equity ratio). When ratios are used primarily for benchmark purposes or comparative purpo ses, the focus tends to be on the rat io itself and its movement and perfo rmance over time. Howev er, if an MFI wishes to explore its trends more deeply, or u nderstand what operational decisions need to be made to im prove performance, it is more useful to understand the numerical co mponents of th e numerator and the denominator in the ratio. Managers sh ould know where the numbers are co ming from, specifically from which f inancial report. They should understand the trends – whether increasing or decr easing – of the numerator alone and the denominator alone because these are the factors or “drivers” that affect the overall trend of the ratio. It is worth noting a few points about the data s ources for the numerator and the denom inator in t he ratio. One needs to ask – is this num ber fro m th e Incom e S tatement, the Balance Sheet, or the
MicroSave – Market-led solutions for financial services
MFI Basic Financial Management and Ratio Analysis for MFIs Section 3 - 27 Portfolio Report? Is it a num ber reflect ing a period of time (e.g. the Inco me S tatement, and so me numbers from the Portfolio Report)? Is the number reflective of information from a point in time – as from the Balance Sheet? When Income State ment numbers or any num ber reflecting a period of activit y is used to calculate a ratio, the second com ponent of the ratio must also reflect a period of activit y. Therefore, some of the ratio components take the average of Balance Sheet numbers. Remember to note these distinctions in the ratio calculations!
What are the Key Areas to Measure? Analytical tools or indicat ors for finan cial and portfolio anal ysis can be divided into four key areas. Each measure is one importa nt aspect of the financial organisation. When co mbined, the key areas give a well-round ed global perspective of the financial situation. The key categories are: Profitability/ It shows the financial returns to the use of the capital and Sustainability assets e mployed. The profit level also shows the MFI’ s self-sufficiency in
relation to covering costs and buildin g its equity . It answers th e question: Will our MFI have the financial res ources to continue serving members and clients tomorrow as well as today?
Asset/ Liability These ratios illustrate the ability of the MFI to manage it’s financial Management obligations when the y become due, while maximizing the utilisation of assets
for profitable purposes. The overall objective is to maximise idle resources as profitably as possible, while pay ing its expenses, debts and obligations on time without borrowing funds.
Portfolio Quality This group o f ratios measures the “health” of the loans outstanding in term s
of its risk. It answers the question: Is our MFI responsible in managing our most important asset?
Efficiency & These ratios measure the costs of an MFI in relation to the outputs. It Productivity shows how p roficient the organisation and m anagement is in o perating its
financial acti vities, particularly its use of assets and hum an re sources. It answers the question: Does my MFI serve as many clients as possible with its resources, for the lowest possible cost?
Profitability and Sustainability R 1 Operating Self-Sufficiency (OSS) Operational Self-Sufficiency measures the degree to which internally generated operational revenue covers all operating expenses fro m the MFI’s core business of providing financial servic es. The ratio excludes non-operating revenues and donations. It do es include Financial Expenses and the Provision for Loan Losses together with other operating expen ses. This ratio measures the degree to which the institution is able to function i ndependent of grant support. A rati o of 100% is the MFI’s break-even point and indicates that the MFI’s income is equal to operating expenses. Young, immature MFIs may take several years to break-even. This ratio shoul d show a gradual increasing trend, and not fluctuate too greatly . It is sim ple to calculate on a manual basis and therefore it is recommended to calculat e and monitor monthly.
MicroSave – Market-led solutions for financial services
MFI Basic Financial Management and Ratio Analysis for MFIs Section 3 - 28
Operating Self-Sufficiency = Financial Revenue
(Financial Expenses + Provision for Loan Losses + Operating Expenses Trend: An increasing Operating Self-Sufficiency is positive. Financial Self-Sufficiency (FSS) Financial Self-Sufficiency is one of the adjusted ratios that are not discussed in depth in this toolkit – but is important because of its significance to MFI sustainability. Financial self-sufficiency gauges whether the institution is able to cover not only actual operating costs, but its ability to maintain the value of its equity relative to inflation and to operate and expand without subsidies, in-kind costs, or concessional interest rates. Financial income is the total income from lending operations and investments, and do not include grants or donor funds. The adjusted costs include: a subsidy in the cost of funds resulting in “subsidized” cost of funds (donations or
concessional loan funds) the effect of inflation on the equity base operating subsidies resulting from in-kind contributions write-offs or provision for loan losses that bring the MFI’s performance in line with industry
standards
Financial Self-Sufficiency = Financial Revenue (Adjusted Financial Expenses + Adjusted Provision for Loan Losses + Adjusted Operating Expenses Trend: An increasing Financial Self-Sufficiency is positive. R2 Return on Assets (ROA) A Return on Asset s is an indication of how well an MFI is managing its asset base to maximize its profits. The ratio does not evaluate the source of the asset base – whether through debt or equit y, but simply the return of the portfolio and other re venue generated fr om investments and operations. A return on assets should be positive. There is a positiv e relationship between Return on Assets and the Portfolio to Assets ratio discussed in the next section. MFIs that maintain most of their ass ets in the loan portfolio tend to break even sooner, and generate higher returns on their assets, provided the loan portfolio performs well and other costs are also controlled.
Return on Assets = Net Operating Income – Taxes____ Average Assets Trend: An increasing Return on Assets is positive. R3 Return on Equity A Return o n Equit y is probabl y one of the most i mportant profitabilit y indicators for commercial banks and MFIs, particularly in com parison with other institutions. The return is measured only in relation to what the MFI has built from operating surpl uses, or what it has generated through donations or
MicroSave – Market-led solutions for financial services
MFI Basic Financial Management and Ratio Analysis for MFIs Section 3 - 29 other contributed sources. The shareholders of a for-profit MFI or bank, is very interested in this ratio, as it is a measure of their investment choice, and its ability to pa y dividends. Increasing equity also strengthens the MFI’s cap ital structure and its abilit y to leverage debt financing. As markets mature and competition increases, Return on Equity m ay level off and maintain a positive position without increasing dramatically or at all.
Return on Equity = Net Operating Income – Taxes____ Average Equity Trend: An increasing Return on Equity is positive. Tips for Managing for Profitability and Sustainability: The primary focus in a young MFI is to achieve break-even and ensure that financial revenues
exceed all operating expenses, include financial costs and the provision for loan losses. A high quality portfolio that generates high yields but operates with low financial expenses and efficient operations is the priority. Each one of the variables in Operating Self-Sufficiency should be monitored on a monthly basis. Quality growth with efficiency!
MFIs that receive high levels of donations and grants (as NGOs) need to maximize that opportunity by investing primarily in a productive portfolio that generates high levels of revenues. As they break-even and become more profitable, their Return on Assets and Return on Equity may be as high, or higher than commercial or for-profit MFIs. However, the tendency when receiving a high level of grants or donations is to operate without the financial discipline or perspective of maximizing capital. It may be too easy to slip into a donor dependent mentality or to build cost structures that are not operationally sustainable in the long-term.
Asset and Liability Management R 4 Yield on Portfolio The Yield on Portfolio me asures how much the MF I receives from its portfolio by the way of cash from interest, fees and commis sions. This is im portant because c ash receipts a re needed in order for the MFI to s urvive, to pa y for its operational expen ses, and to c ontinue its business opera tions. It is useful becaus e it can alert manage ment to proble ms with the loan portfolio. Generally, the MFI’ s yield does not fluctuate very much, unless there is a change in interest rates, the method of calculating interest or in fees. If it varies significantly from the effective interest rate (often called a “yield gap”) then it may be a sign of de linquency. However, the portfolio yield cannot exceed the effective rate of interest charged by the i nstitution. Handout 3.4 Calculating Effective Interest on Loans clearly presents the variables and issues that affect the act ual amount of interest and fees paid by a borrower to the institution.
Yield = Cash Received from Interest, Fees and Commissions On Loan Portfolio_________________
Average Gross Loan Portfolio Trend: An increasing yield is positive although it will level off as it nears the effective interest rate. R5 Portfolio to Assets The Portfolio to Assets ratio is a si mple ratio th at l ooks at how much of the MFI’s asset base i s invested in a high performing loan portfolio. An MFI’s primary business is to provide loans a nd other
MicroSave – Market-led solutions for financial services
MFI Basic Financial Management and Ratio Analysis for MFIs Section 3 - 30 financial serv ices to micro-entrepreneurs. This is als o the MFI’ s most profitable activity and use of assets. It is reco mmended that this ratio be m onitored monthly. Fluctuations may be due to seasonal activity or rigid operational patterns (e.g. “batch” lending). The ratio can also signal excess liquidity or demand for additional funding. MFIs that rely on savings to fund lending activities or are regulated by local banking guidelines need to pay special attention to this ratio.
Portfolio to Assets = Gross Loan Portfolio Assets Trend: An increasing trend is positive. R6 Cost of Funds Ratio This ratio gi ves a co mbined interest rate on t he MFI’s average funding l iabilities, deposits and other borrowings (note that trade payables or mortgage payables are not included). The Cost of Funds Ratio is important to understand and monitor for several reasons. First and forem ost, the fact that an MFI carries funding costs is some indication of its credit- worthiness – either by investors or by savers. MFIs that mobilize savings are genera lly able to pay very low i nterest on deposits and thereby have access to cheap capital. Interest pa id to investors may vary greatly , depending on the context, the country, and the type of investment. Regardless of the sources and the rates, managers are clearly able to see their true Cost of Funds when the ratio is adjusted for market rates and influences. The significance of this ratio is in its com parison to the Yield on Portfolio ratio, which is fundamental to interest rate management. The remaining margin between the yield and the cost of funds is what the MFI has available for operational costs and the provision for loan losses. Monitoring these two ratios individually and together is important for the MFI’s financial health.
Cost of Funds = Financial Expense on Funding Liabilities (Average Deposits + Average Borrowings)
Trend: The Cost of Funds may indicate a level of maturity of the MFI. A decreasing Cost of
Funds ratio is generally positive. When Financial Expenses are adjusted to include free or subsidized funding, the ratio will show the actual financial cost of funds needed to fund or capitalise the MFI.
R7 Debt to Equity The Debt to Equity ratio ( also referr ed to as Debt/E quity ratio or the Leverag e ratio) is a common measure of an MFI’s capital strength or adequacy at a particular point in time. Equity is important because it is an indication of internal strength and the capacity to absorb som e stress and losses before creditors are a t risk. Equity is also i mportant because it is the base on which to leverage and attract debt fundin g – an d therefore it is used fre quently b y i nvestors and lenders. MFIs that offer savings are usually highly leveraged. Local banking regulations in most countries will place a limit or a restriction to a bank or MFI’s Debt/Equity ratio (e.g. 7:1 or 13:1) in order to protect savers’ deposits. Regulated MFIs and bank monitor this ratio very regularly.
MicroSave – Market-led solutions for financial services
MFI Basic Financial Management and Ratio Analysis for MFIs Section 3 - 31
Debt/Equity = Liabilities____ Equity
Trend: An increasing debt/equity ratio indicates the MFI’s capacity to attract debt funding
based on its capital strength of its own equity. Too low a ratio might indicate that the MFI is not maximizing its equity base. Too high a factor may be risky for investors, and may spell cash flow challenges during difficult times.
R8 Liquid Ratio The Liquid Ratio is one measurement of th e adequacy of cash to pay short-ter m liabilities to l enders, depositors and ot her creditors. This is im portant for both banks and non-regulated MFIs. These institutions need to ensure that they pay their salaries, bills and expenses on time. Failure to repay loans on time may limit access to funding in the future. The lack of funds to provide timely, repeat loans may seriously erode client confidence. The inability to repay client deposits on time will also threaten client trust and confidence, and could jeopardize the MFI significantly. Liquidity ratios vary, depending on banking requirements and risk tolerance. Central banks may require certain liquid ratios to be maintained, particularly in their role to maintain the public trust in the banking sector. A problem in one institution can be hazardous for everyone.
Liquid Ratio = Cash + Trade Investments_____ (Demand Deposits + short-term Time Deposits + Short-term Borrowings + Interest Payable on Funding Liabilities + Accounts Payable And other Short-term Liabilities)
Trend: No single ratio or trend provides the “correct” or “adequate” means to monitor cash
levels. Managers must have clear policies in place to ensure that cash is available when needed for all MFI operations and activities Banking requirements and risk tolerance will affect the ratio..
Tips for Managing for Asset/Liability Management: Interest rate management: The interest rate set by the MFI must generate enough revenue to
cover the cost of funds, operational costs and the provision for loan losses. The margin between the yield on portfolio and the cost of funds is the amount available for other operational expenses. Rates that are intentionally subsidized or unintentionally too low, do not sustain services in the long term for clients.
Asset management: Assets should be invested and put to their most productive means in order to produce the most revenue as possible.
Leverage: Finding the right balance between debt and equity funding is not always straightforward. Borrowing funds for growth and expansion may be recommended, provided that more revenue is generated than the cost and use of borrowing.
Liquidity Management: The MFI needs to manage its liquidity to ensure that it has sufficient funds on hand to meet any short-term obligations, including operational expenses, interest and principal payable.
Foreign Currency Management: Some MFI’s borrow in funds in foreign currency because local currency borrowings are unavailable. If the MFI also has assets in foreign currency, some of the risk of exchange rate fluctuations, particularly losses can be minimized. However, the risk can be significant in places where the local currency fluctuates highly.
MicroSave – Market-led solutions for financial services
MFI Basic Financial Management and Ratio Analysis for MFIs Section 3 - 32
Portfolio Quality R9 Portfolio at Risk The Portfolio at Ri sk ratio measures the potential for future losses based on the current perfo rmance of the portfolio. It is the m ost widel y accepted standard and ratio of portfolio performance in microfinance. It measures more than th e amount collected compared to the amount due (popularly referred to as the Repay ment Rate), but the risk t hat the entire amount outstanding on a late loan will not be repaid. It is important to include the balance of all loans with a payment overdue and not just the amount of principal that is overdue. The portfolio is the most important and prim ary as set of an MFI. Any decline in portfolio qualit y signals problems of one ki nd or another, and s hould illicit a strong management response. The ratio takes the Portfo lio at Risk over 30 days late and adds the Renegotiated Loans in the numerator. Loans delinquent for up to 30 days generally have high potential of being collected, with th e appropriate management approach. However, Renegotiated Loans are at already at risk, since they have already had repayment problems. Portfolio at Risk = Portfolio at Risk > 30 days + Renegotiated Loans______ Gross loan portfolio Trend: A decreasing Portfolio at Risk is positive.
R10 Write-Off Ratio The Write-Off Ratio , sometimes called the Loan Loss Ratio or the default rate, measures the actual amount of loans which were “written off” as unrecov erable during a given period of tim e, in relation to the loans outstanding. Naturally MFIs want to minimize their losses, but the nature of the financial services sector, and lending in particular, is that losses are a no rmal part of doing business. Many institutions resist writing off loans because of the belief that some of the loan may still be recuperated. Once a loan has been written off, collection efforts for this loan may continue if it m akes economic sense. Loan write-offs are si mply a prudent a pproach to financial management, not a legal acknowledgment that the borrower no longer is in debt to the institution. Write-offs pose a significa nt threat to the MFI, si nce the result in reducing the asset bas e and future earning potential. The ratio is affected by the institution's write-off policy – whether it is for Portfolio at Risk over 180 da ys, or 365 days. Continuing to maintain loans on the bo oks rather than write them off once it has been determined that they are uncollectible overstates the size of the portfolio. “A well-defined policy that establishes an Allowance for Loan Losses an d period ically declares loans non-recoverable through a write-off policy, saves an institution from declaring a large am ount non-recoverable all at once, and thereby drastically decreasing assets.” Write-off Ratio = _____Value of Loans Written Off_____
Average Gross Loan Portfolio Trend: A decreasing Write-off Ratio is positive.
R11 Risk Coverage Ratio The Risk Coverage Ratio measures the adequacy of the Allo wance for L oan Losses t o “cover” potential loan losses reported as Portfolio at Risk over 30 days. It is an indication of how well the MFI is prepared to absorb loan losses should all of the Portfolio at Risk over 30 days be uncollectible. Note
MicroSave – Market-led solutions for financial services
MFI Basic Financial Management and Ratio Analysis for MFIs Section 3 - 33 that although the Allowance for Loan Losses is re ported as a negative number on the balance sheet, it the ratio will be expressed as a positive percentage. One might think that a ratio of 10 0 percent might be the desired num ber. However, this might mean that the MFI’ s tolerance for risk is very low, perhaps because the MFI’ s history of collecting delinquent loans is very poor. The ideal number will likely vary amongst institutions. It is a function of the MFI’s policy for the Allowance and Provisions for Loan Losses, that takes into account its risk tolerance, and history of delinquency and collections management. It is also a function of portfolio quality. The Risk Coverage Ratio sh ould be lo oked at frequently, but i n conjunction with an annualised Write-Off ratio. Lookin g at the actual amount of write-offs – in current and in previous periods -- will provide some idea of whether the Risk Coverage Ratio is adequate. Risk Coverage Ratio = ______Allowance for Loan Losses______
Portfolio at Risk over 30 days
Trend: A fairly constant, stable ratio is desired. Sudden changes usually indicate a deterioration or improvement in portfolio quality or an excess or shortage in the Allowance for Loan Losses account.
Tips for Managing for Portfolio Quality: Loan recovery begins with providing services that clients value, through efficient and
effective loan administration. Loan recovery is possible through good, thorough loan assessment that looks at the
willingness and capacity of the client to repay. Effective loan recovery is strengthened through good management information systems that
provide relevant, timely and accurate information about the loan’s status. Immediate late loan follow up and effective delinquency management that uses incentives as
well as dis-incentives is critical for preventing chronic problems or high write-offs. The MFI needs to establish clear accounting policies to account for portfolio aging, the
provision for loan losses, and write-offs for loans that are considered uncollectible. The MFI should provide clear and transparent disclosure of financial information related to its
portfolio quality, its accounting policies for the portfolio, and actual performance for the reporting period.
"Delinquency can be likened to cancer, in the sense th at it can start sm all, build up and spread, the n destroy the body. A 2% loan loss is not half as good as a 4% loan loss. With a 2% loan loss, there are probably 6% of clients who are toug h customers. With 4% loan loss, about 12 - 1 5% of clients are tough customers." "If 15% of the clients are tough customers, they could start talking to one anoth er about how they are tough custo mers. This then has a "buildi ng effect" where many staff suddenl y fi nd themselves spending an i nordinate amount of time collecting from tough customers because they are talking t o one another. Thus, 4% is many times worse than 2% and the jump to 8% can be catastro phic. At 8%, the institution can be dead or fighting a losing battle to stay alive. And although the interest rate spread could cover this, it is not the issue. The issue is that most institutions do not want their staff to spend all of their time running around collecting bad loans." The New World of Microfinance “Microfinance Institutions Operating on the Frontier” Robert Christen, USAID Conference Proceedings Manila, Philippines
MicroSave – Market-led solutions for financial services
MFI Basic Financial Management and Ratio Analysis for MFIs Section 3 - 34
Efficiency and Productivity It is important to note that the efficiency ratios must be used carefully. The y are highly dependent on the loan methodology used, the num ber of product s and services offered, staffing structures, th e physical cont ext (rural or urban) and the maturity of the MFI. Efficiency r atios should also be examined in conjunction with Portfolio Quality ratios, since a quality portfolio shoul d not be sacrificed for high efficiencies. R12 Operating Expense Ratio The Operating Expense Ratio measure s the MFI ope rating expenses (not including the Cost of Funds or the Provis ion for Loan Losses) as c ompared to th e average l oan portfolio. There are n umerous efficiency indicators used in the financial services industry, usi ng a variety of other denom inators, including Average Performing Assets and Average Total Assets. The advantage of using the Average Gross Loan Portfolio is that th e Yield and the Cost of Funds ratios are a ll based on the sa me denominator. Once MFIs select the ratio and the denom inator that they wish to use, they should be consistent in using it. A decreasing Operating Expense Ratio is considered desirable since it will generally be an i ndication of increased efficiencies as the portfolio grows. If the portfolio rem ains relatively flat, changes and experiments in methodology or service delivery will quickly reveal through the ratio whether they are actually improving the MFI’s efficiency. However, an increase in average loan size will also create a decreasing trend, but not necessarily signal increased efficiencies.
Operating Expense Ratio to Average = Operating Expenses______ Gross Loan Portfolio Average Gross Loan Portfolio Trend: A decreasing Operating Expense Ratio is positive.
R13 Cost per Active Client This ratio measures the operating expenses (not including cost of funds or provision) that the MFI requires to serve a single active client. It is then also the amount of revenue that the MFI needs to generate from every single client in order to break-even. The ratio will also be affected by the methodology and the technologies used by the MFI. The largest operating expense in most MFIs is its labour costs. By examining the trends in the ratio’s numerator and denominator, and the ratio itself, one can determine whether a reduced Cost per Client is the result of reduced labour cost s or the more efficient use of lab our. Many MFIs compare their Cost per Active Client with ot her national or international MFIs. When doing so, it is useful to consider that different countries ha ve different national incomes, and that straight forward comparisons may not be that meaningful.
Cost per Client = Operating Expenses_____ Average Number of Active Clients Trend: A decreasing Cost per Client.
R14 Borrowers per Loan Officer This ratio re flects the productivit y of loan staff i n serving their client caseload. The h igher the caseload per officer, the more clients will be served, and the greater the efficiency gained. The ratio is useful when the MFI sets growth targe ts; it is easy to calculate a nd to m easure on a regula r basis. However, the ratio does have so me limitations, si nce it is also highl y reflective of the methodology
MicroSave – Market-led solutions for financial services
MFI Basic Financial Management and Ratio Analysis for MFIs Section 3 - 35 used – the l oan pro ducts (grou ps vs. individual lending) or t he geographical context (lo w density populations as in some rural area vs. an urban clie nt base). As a result, comparisons between MFIs become less helpful or meaningful. A final factor to consider is that there i s an optimal caseload that Loan Officers can carry before their portfolio quality begins to drop. Sacrificing quantity for quality is not the objective of managing for greater efficiencies. There are also operational issues that cause the ratios to plateau at optimal levels. Streamlining the methodology or introducing technological changes may be the only way in which to break the plateau. Borrowers per Loan Officers = ____Number of Active Borrowers____ Number of Loan Officers
Trend: An increasing ratio is positive.
. R15 Active Clients per Staff Member This ratio reflects the total number of active client s – savers and borrowers – tha t are served per MFI staff member. An increasing trend is desirable. Th e ratio does not differentiate between c redit or service st aff and adm inistrative staff. The sa me va riables and factors affe cting the previous ratio should be considered for the Active Clients pe r Staff Mem ber. A low ratio however does no t necessarily mean that staff is not wor king hard. There ar e many factors affe cting both service and administrative productivit y, not t o m ention paperw ork, technol ogy, rem ote service locations, etc. What is important to remember is to regularl y monitor this ratio, particularly in relation to t he MFI’s business plan. Active Clients per = __ Number of Active Clients______ Staff Member Number of Personnel Trend: An increasing ratio is positive. R 16 Client Turnover This ratio is intended to give MFI managers some indication of clients who leave the progra m during a particular period of time. It does not tell management why clients may leave. The ratio is not precise or perfect – i t does n ot provide information about clients who le ave for a whi le and then return at a later date. It does not provide i nformation a bout clients who m ay use a rem ittance service occasionally after no longer using lending services. The ratio is considered im portant because managers need so me level of client satisfaction with the MFI’s products and services. Th e general thinking is that cost of ret aining clients is relativ ely lower than the cost of recruiting and ini tiating new clients to the MFI. Therefore the lower the turn over, the higher perceived level of satisfaction of clients. Client Turnover = Number of Active Clients, Beginning of Period + Number of New Clients ___During Period – Number of Active Clients, End of Period_____ Average Number of Active Clients Trend: A decreasing ratio is positive.
MicroSave – Market-led solutions for financial services
MFI Basic Financial Management and Ratio Analysis for MFIs Section 3 - 36
MicroSave – Market-led solutions for financial services
R 17 Average Outstanding Loan Size For many, this ratio is so me indication of the MF I’s ability to reach as many lower-income and poor clients as possible. This is im portant to many donors and investors, but also to the MFI’s vision of reaching its targeted clientele. MFI managers who need to monitor this ratio regularly should do so in light of the Gross National Income per capita (pr ovided in external Macro-Econom ic Data) and the Cost per Client. The average incom e l evel of clie nts in the area served may also be less than the official Gross National In come per capita. From a fi nancial perspective, this ratio can b e used to project and plan portfolio growth as loan size is one of the drivers of profitability. Average Outstanding Loan Size = ____Gross Loan Portfolio____ Number of Loans Outstanding
Trend: This ratio may fluctuate for many reasons – seasonality, change in methodology, disbursements patterns and loan size. It is important to compare against the MFI’s business plan.
R 18 Average Loan Disbursed This ratio gives MFI managers some idea about th e MFI’s demand for loans, client profitabi lity and the capacity to increase i ncome. In creased loan siz es generally increases financial revenue for the MFI. The ch allenge is for managers to understand why loan sizes increase. Are clients’ businesses growing and able to absor b higher am ounts of debt ? Are clients diversifying t he loan proceeds to other activities? Are repe at loan size increases au tomatically expected – both clients and Loan Officers? This ratio should be monitored in conjunction with portfolio quality ratios, to ensure that the client still has the capacity to repay the loan, in spite of increased amounts of debt. Average Loan Disbursed = ____Value of Loans Disbursed_____ Number of Loans Disbursed Trend: This ratio may fluctuate for many reasons – seasonality, change in methodology,
disbursements patterns, increasing capacity of clients to handle debt, the growth of client businesses, high client retention, and automatic loan size increases, to name a few.
Tips for Managing for Efficiency and Productivity: Develop and fine-tune your products and services for your clients, and for the locations in
which you work. Take advantage of any technology that will decrease your operating and transaction costs – for
your institution and for your clients. Implement effective incentive systems for strong staff performance – your financial services
team and your support and administrative staff. Staff working together toward common goals will think “win / win” rather than compete against one another.
Continually monitor portfolio quality to ensure that efficiency is not compromised by increasing delinquency.
Probe the ratios carefully, ensuring that the trends in the numerator and the denominator alone are understood and analyzed as well. This will strengthen understanding and management for efficiency in operations.
Don’t jump to conclusions when analyzing and comparing efficiency ratios with other MFIs, particularly from other countries.
MFI Basic Financial Management and Ratio Analysis for MFIs Section 4 - 37
4. Basic Financial Ratio Analysis Financial managem ent helps the MFI t o evaluate performance, to plan and t o m ake decisions t o strengthen its operations. Financial ratio analysis – as presented and discussed in the previous section – is one of the most useful tools for MFI managers to evaluat e, explore an d measure th eir MFI’ s performance. A solid understanding of the fin ancial statements, their co mponents and their relationships is critical to solid analysis. . In si mple t erms, ratios are relatio nships between nu mbers. They are co mparative figures . Comparisons can be made with similar MFIs or comparisons can be made within the MFI itself over a period of time. Co mparisons within the MFI mark the “trends” or the path of progress and are useful when actual trends are com pared with trends pr ojected in the business plans. None in itself is complete but when several are used together, th ey pro vide a concise, useful, and q uantifiable description of the financial situation. If correctly utilized, they can provide the basic information upon which one can measure the financial “health” of the MFI. The key factors to consider in ratio analysis are: Institutional size Maturity of organisations Geographical coverage Single-purpose vs. multi-purpose institutions Methodology
Cautions in Ratio Analysis Financial ratio analysis does not REPLACE or EQUATE decisions or leadership in
managing the change proc ess that MFIs undergo to i mprove, grow and strengt hen operations.
Financial ratios do not predict the future – they help to understand the past and give guidanc e for
the future. A financial ratio should never be taken in isolation from other ratios – togeth er, they provide a
more complete picture. Comparative analy sis with other MFIs MAY or MAY NOT be u seful or help ful. Man y of the
ratios, particularly for eff iciency or pr oductivity, are highl y dependent on th e methodology, the context, and the maturity of the MFI.
Financial analysis is simple -- compare, compare and compare Comparing results with projections and targets Comparing results of the period with previous results and looking at the trends Comparing results with those of other comparable organisations The Microfinance Information Exchange (MIX) pr ovides o nline inform ation of over a thousand microfinance institutions i n the world. The MFIs ar e classified by region, country, by maturity, by legal structur e, and by size. The MIX also produces the MicroBanking Bullet in publications fro m time to time that make special comparison and analysis of selected MFIs, usually by region. This type of transparency and infor mation exchange prom otes healthy evaluation and a strong sense of where
MicroSave – Market-led solutions for financial services
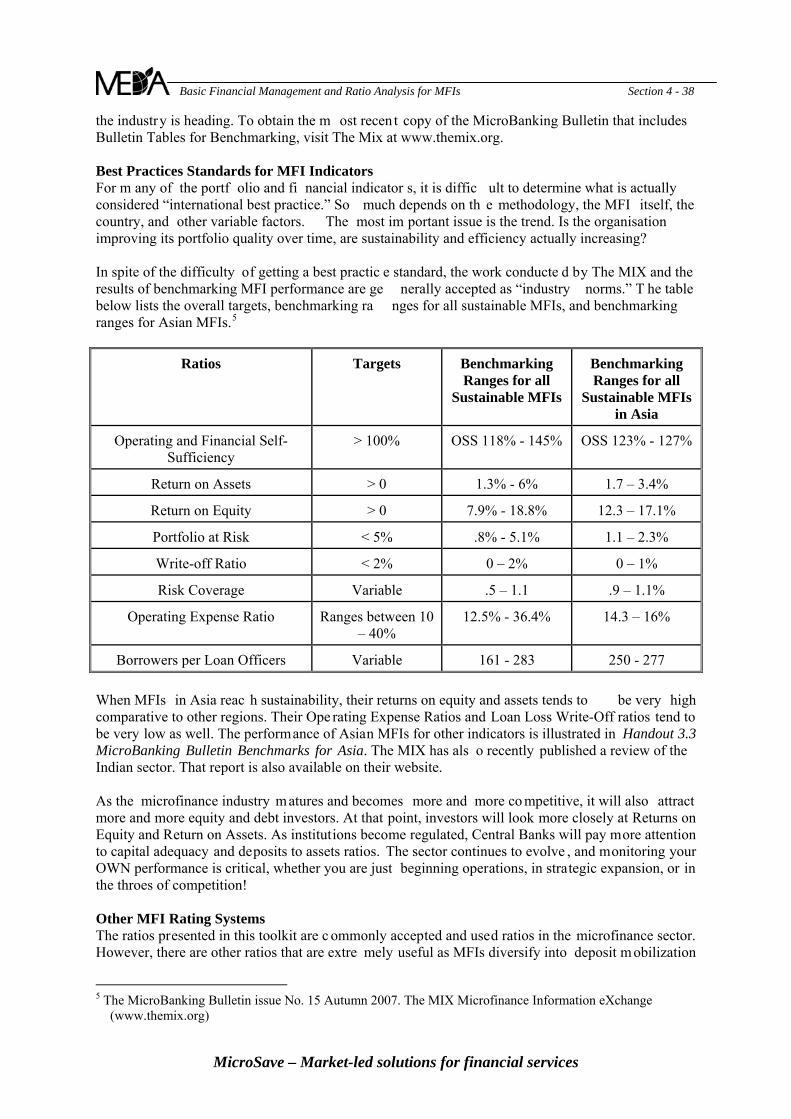
MFI Basic Financial Management and Ratio Analysis for MFIs Section 4 - 38 the industry is heading. To obtain the m ost recent copy of the MicroBanking Bulletin that includes Bulletin Tables for Benchmarking, visit The Mix at www.themix.org. Best Practices Standards for MFI Indicators For m any of the portf olio and fi nancial indicator s, it is diffic ult to determine what is actually considered “international best practice.” So much depends on th e methodology, the MFI itself, the country, and other variable factors. The most im portant issue is the trend. Is the organisation improving its portfolio quality over time, are sustainability and efficiency actually increasing? In spite of the difficulty of getting a best practic e standard, the work conducte d by The MIX and the results of benchmarking MFI performance are ge nerally accepted as “industry norms.” T he table below lists the overall targets, benchmarking ra nges for all sustainable MFIs, and benchmarking ranges for Asian MFIs.5
Ratios Targets Benchmarking Ranges for all
Sustainable MFIs
Benchmarking Ranges for all
Sustainable MFIs in Asia
Operating and Financial Self-Sufficiency
> 100% OSS 118% - 145% OSS 123% - 127%
Return on Assets > 0 1.3% - 6% 1.7 – 3.4%
Return on Equity > 0 7.9% - 18.8% 12.3 – 17.1%
Portfolio at Risk < 5% .8% - 5.1% 1.1 – 2.3%
Write-off Ratio < 2% 0 – 2% 0 – 1%
Risk Coverage Variable .5 – 1.1 .9 – 1.1%
Operating Expense Ratio Ranges between 10 – 40%
12.5% - 36.4% 14.3 – 16%
Borrowers per Loan Officers Variable 161 - 283 250 - 277 When MFIs in Asia reac h sustainability, their returns on equity and assets tends to be very high comparative to other regions. Their Ope rating Expense Ratios and Loan Loss Write-Off ratios tend to be very low as well. The performance of Asian MFIs for other indicators is illustrated in Handout 3.3 MicroBanking Bulletin Benchmarks for Asia. The MIX has als o recently published a review of the Indian sector. That report is also available on their website. As the microfinance industry matures and becomes more and more co mpetitive, it will also attract more and more equity and debt investors. At that point, investors will look more closely at Returns on Equity and Return on Assets. As institutions become regulated, Central Banks will pay more attention to capital adequacy and deposits to assets ratios. The sector continues to evolve , and monitoring your OWN performance is critical, whether you are just beginning operations, in strategic expansion, or in the throes of competition! Other MFI Rating Systems The ratios presented in this toolkit are c ommonly accepted and used ratios in the microfinance sector. However, there are other ratios that are extre mely useful as MFIs diversify into deposit mobilization
5 The MicroBanking Bulletin issue No. 15 Autumn 2007. The MIX Microfinance Information eXchange
(www.themix.org)
MicroSave – Market-led solutions for financial services
MFI Basic Financial Management and Ratio Analysis for MFIs Section 4 - 39 or become re gulated. Capital adequacy , savings to assets, and the debt service coverage rati o are all used by many institutions. Handout 4.1 CGAP Focus Note 22 – Resource Guide to Microfinance Assessments provides an overview of the different asse ssment a pproaches of five different organisations: ACCIO N, Planet Rating, the World Coun cil of Credit Unions (W OCCU), MicroRate, and M-Cril of India. These assessments are conducted for t he purposes of donor decisions , due di ligence for debt or equit y investors, or si mply the sector analy sis in a par ticular country. Most of the assessments incl ude the ratios discussed in this toolkit, and also look at additional ratios and analysis. Handout 4.2 CAMEL Rating Technical Note – ACCION prov ides an overview of ACCION’s approach and methodology. Handout 4.3 GIRAFE Rating Methodology – Planet Rating and Handout 4.4 PEARLS Rating - WOCCU illustrate their ratios and approaches. Micro-Credit Ratings International Ltd . of India has conducted analy tical reviews for the Indian Microfinance sector from time to time. These reviews have been published in 2003, 2005 and again in 2007 (in collaboration with The MIX). The written repor ts provide excellent ratio anal ysis of the key areas discussed in this toolkit. They are available at www.m-cril.com. Where to Go From Here This toolkit has provided an overview of accounting systems, discussed the f inancial state ments in details and pr esented the industr y standard perform ance ratios relevant for m easuring, reporting, and monitoring MFIs. The first step to take in moving f orward is to ensure that your MFI’ s accounting policies, accounting systems and Management Information Systems are adequate, well-managed, and produce timely and accurate reports. Without reliable and consistently prepared reports, ra tio analy sis is not reliable or useful. Ratio analy sis is generally co nducted monthly in MFIs, although som e only produce them on a quarterly basis. Ratio analysis can be simplified by using a spreadsheet tool called the SEEP FRAME available fre e of charge online at www.seepnetwork.org/frame. It ac companies the Fra mework document referenced to many t imes in this toolki t. I t facilitates reliable ratio analy sis, trend graphs and also prepares the C ash Flow Statement when key Balance Sheet, Income and Expense Statement and Portfolio Report data is entered. It is a good place to start!
MicroSave – Market-led solutions for financial services
MFI Basic Financial Management and Ratio Analysis for MFIs Section 4 - 40
MicroSave – Market-led solutions for financial services
Bibliography “Financial Risk Management Toolkit”. Women’s World Banking. www.swwb.org “India Microfinance Review 2007.” Micro-Credit Rati ngs International Ltd. and The Microfinance Information Exchange (MIX). “M-CRIL Microfinance Review 2005 – India” Micro-Credit Ratings International Ltd. 2006. “Measuring Perfor mance of Microfinance Institutions: A Framework for Reporting, Analy sis, and Monitoring.” Developed by the SEEP Network Fi nancial Services Working Group and Alternative Credit Technologies, LLC. 2005. “Microfinance Consensus Guidelin es: Definitions of Selected T erms, R atios and Adjustments for Microfinance.” Published by CGAP, The World Bank Group. September 2003. Nagarajan V. & Co. “Accounting Standards for Micro-Fi nance Institutions in India.” (Draft for discussion). SIDBI Foundation for Micro-Credit, 2005. Nagarajan V. & Co . “Accounting Guidelines for Micro-Finance Instituti ons in India.” (Draft for discussion). SIDBI Foundation for Micro-Credit, 2005.
Rosenberg, Richard, Patricia Mw angi, Robert Pe ck Christen, Moha med Nasr. “Microfinance Consensus Guidelines: Disclosure Guidelines for Fi nancial Reporting by Micr ofinance Institutions.” July 2003.