Financial Literacy, Social Perception and Strategic Default significant determinants of default,...
30
Financial Literacy, Social Perception and Strategic Default JEREMY BURKE AND KATA MIHALY WR-937 March 2012 This paper series made possible by the NIA funded RAND Center for the Study of Aging (P30AG012815) and the NICHD funded RAND Population Research Center (R24HD050906). WORKING P A P E R This product is part of the RAND Labor and Population working paper series. RAND working papers are intended to share researchers’ latest findings and to solicit informal peer review. They have been approved for circulation by RAND Labor and Population but have not been formally edited or peer reviewed. Unless otherwise indicated, working papers can be quoted and cited without permission of the author, provided the source is clearly referred to as a working paper. RAND’s publications do not necessarily reflect the opinions of its research clients and sponsors. is a registered trademark.
Transcript of Financial Literacy, Social Perception and Strategic Default significant determinants of default,...

Financial Literacy, Social Perception and Strategic Default JEREMY BURKE AND KATA MIHALY
WR-937
March 2012
This paper series made possible by the NIA funded RAND Center for the Study of Aging (P30AG012815) and the NICHD funded RAND Population Research Center (R24HD050906).
WORK ING P A P E R
This product is part of the RAND Labor and Population working paper series. RAND working papers are intended to share researchers’ latest findings and to solicit informal peer review. They have been approved for circulation by RAND Labor and Population but have not been formally edited or peer reviewed. Unless otherwise indicated, working papers can be quoted and cited without permission of the author, provided the source is clearly referred to as a working paper. RAND’s publications do not necessarily reflect the opinions of its research clients and sponsors.
is a registered trademark.

FINANCIAL LITERACY, SOCIAL PERCEPTION AND
STRATEGIC DEFAULT
Jeremy Burke∗
Kata Mihaly†
March 2012
Abstract
As a result of sustained housing market fragility, a growing number of borrowers are walkingaway from their underwater homes even though they have the ability to pay. Despite recentadvances, questions remain about what influences this decision. In this paper, we use surveydata to examine the role of social expectations, financial literacy and knowledge of defaultconsequences. We find that homeowners who believe that others are likely to strategically defaultin the future are more willing to walk away as they anticipate reduced social stigma. Financiallyliterate borrowers appear better able to calculate the benefits of strategically defaulting and aremore willing to walk away at high levels of shortfall. We also find evidence that those who betterunderstand the consequences of default, particularly that a default’s impact on one’s credit scoreweakens over time, have a higher willingness to walk away. Our results suggest that policiesthat help shape expectations about future strategic defaults may influence present foreclosures.
Keywords: Strategic Default, Foreclosure, Financial Literacy.
∗RAND Corporation, 1200 South Hayes Street Arlington, VA 22202; Phone: (703) 413-1100 x5328; Email:[email protected].
†RAND Corporation, 1200 South Hayes Street Arlington, VA 22202; Phone: (703) 413-1100 x5393; Email:[email protected].

1 Introduction
The recent financial crisis and associated collapse of the U.S. housing market has had a profoundimpact on homeowners. In 2010, a record 2.9 million U.S. properties received a foreclosure filing(a default notice, scheduled auction, or bank repossession), impacting 1 in every 45 U.S. housingunits.1 The record represented a 2% increase from 2009, a 23% increase from 2008, and an aston-ishing 123% increase in the level of foreclosure activity experienced in 2007.2
The rise in foreclosures was accompanied by a precipitous drop in housing prices, leaving manyhomeowners with a mortgage balance that exceeded the value of their house. Zillow estimates thatin the first quarter of 2011 more than 28% of single-family homeowners with a mortgage had nega-tive equity in their home.3 In several large metropolitan areas, this fraction exceeded 50%, reachingan astounding 68% in Phoenix, Arizona.4 Not only is negative equity pervasive, the amount of theshortfall is often significant. For example, in the first quarter of 2010 the average ratio of homeequity to home value in Modesto, California was -35%.5 Such extreme shortfalls in value can createa strong incentive for a borrower to default.
A “strategic default” occurs when a borrower has the financial ability to pay his mortgage, butchooses not to because of other considerations. Strategic defaults are difficult to identify empiricallybecause a defaulter’s motivations are unobservable, but several studies have estimated that theyaccount for a significant and growing fraction of recent foreclosures.6 Tiruppatur and Egan (2010)use borrower level data and define a default as strategic if a borrower is underwater on his mort-gage, but has other meaningful non-mortgage obligations on which he continues to make payments.Using this methodology, they estimate that strategic defaults rose from insignificant levels in 2007to approximately 12% of all defaults in February 2010. A study conducted by Wyman (2009) useda similar methodology and estimated that 19% of all defaults in the second quarter of 2009 werestrategic.7 Guiso et al. (2011) conduct a survey asking respondents about the number of peoplethey know to have defaulted and how many of those defaults they think were strategic. Taking aratio of the responses of the two questions, the authors estimate that strategic defaults increasedfrom 26% of all defaults in March 2009 to 35% in September 2010.
The rise in mortgage defaults generally, and strategic defaults specifically, has generated consid-erable scholarly attention. Bajari et al. (2008) find that liquidity constraints and declining houseprices are two important factors influencing subprime mortgage defaults. The authors estimatethat for homeowners with a 30 year fixed-rate motgage and no downpayment, a 20% decline inhome price makes the borrower 15.38% more likely to default than a comparable borrower witha stable house price. Elul et al. (2010) also find that liquidity constraints and negative equity
1http://www.realtytrac.com/content/foreclosure-market-report/record-29-million-us-properties-receive-foreclosure-filings-in-2010-despite-30-month-low-in-december-6309
2http://www.realtytrac.com/landing/2009-year-end-foreclosure-report.html?a=b&accnt=2334963http://zillow.mediaroom.com/index.php?s=159&item=2284Other examples include Atlanta, Georgia (56%); Riverside, California (51%); Tampa, Florida (60%); and Sacra-
mento, California (51%).5http://www.forbes.com/2010/05/06/foreclosure-home-equity-lifestyle-real-estate-unemployment-cities.html6Foote et al. (2008) examined the Massachusetts real estate market during the 1991 recession and estimated that
the only 6.4% of homeowners with negative equity lost their homes. The recent crisis, however, was both more severeand pervasive, creating a stronger incentive for underwater homeowners to default.
7The authors identified strategic defaulters as individuals who went straight from current to 180 days late on theirmortgage without being seriously delinquent on other debt obligations.
1

are significant determinants of default, with similarly sized marginal effects. Gerardi et al. (2007)find that the probability of mortgage default increases significantly when house prices are depreci-ating. Bhutta et al. (2010) estimate that while the median homeowner won’t walk away until heowes 62% more than his home is worth, once home equity reaches -50% half of defaults are strategic.
While considerable attention has been paid to the role of negative equity in the decision tostrategically default, recent work has begun to examine the role of non-pecuniary factors. White(2010a, 2010b) provides anecdotal evidence that emotions, including guilt and fairness, can be im-portant determinants. Towe and Lawley (2010) find that social interactions influence foreclosuredecisions; having a neighbor in foreclosure increases the likelihood of default by as much as 28%,possibly as a result of reduced social stigma. Guiso et al. (2011) use survey data and find thatsocial considerations, including morality and fairness, play an important role in the decision tostrategically default. The authors also find evidence of a social contagion effect; knowing someonewho has strategically defaulted in the past reduces the perceived probability of litigation, increas-ing one’s willingness to default. Seiler et al. (2012) also find that morality and peer networks playimportant roles; those who don’t believe strategic default is immoral and have a family member orclose friend that has defaulted are more likely to walk away.
In this paper we use survey data to measure the propensity to strategically default, and ex-amine how the decision to walk away varies based on demographic and social characteristics andnotions of morality, fairness, and guilt. Similar to Guiso et al. (2011), we pose a series of hypothet-ical situations in which homeowners are asked whether they would default if facing hypotheticalshortfalls of various levels.8 In contrast to previous work, we also examine how financial literacyand default perceptions impact the decision. Specifically, we examine how respondents’ expecta-tions about how often others are likely to default in the future influences their willingness to doso today. We also survey respondents’ knowledge about the consequences of default and examinehow their understanding influences their propensity to walk away. Our data come from a survey of1,200 homeowners in RAND’s nationally representative household survey, the American Life Panel.
We find that expectations about future strategic defaults have a small, but statistically signif-icant, impact. Those who believe that strategic defaults will be pervasive in the future are morelikely do declare a willingness to default today. However, once shortfalls reach extreme values,expectations become inframarginal as the size of the shortfall dominates. Further, we find thatexpectations about future defaults as a result of an inability to pay (non-strategic defaults) have noimpact on one’s propensity to default strategically, suggesting the increased willingness to defaultwhen strategic defaults are expected to be prevalent is driven by social considerations, such associal stigma, not price impacts.
Financial literacy is also an important predictor of default propensity. For relatively moderatelevels of shortfall, financially literate homeowners appear similar to their less literate peers. How-ever, once negative equity reaches 50%, financial literate homeowners are significantly more willingto walk away. Taken together, the results suggest that penalties to defaulting are highly salient,but those who are better able to calculate the benefits from defaulting are more likely to do so.
8While hypothetical questions are obviously an abstraction from real world decisions with actual pecuniary andsocial consequences, they allow us to elicit the expectations, social perceptions and personal experiences central toour analysis.
2

We find there is considerable confusion about the consequences of strategic default, and someevidence that respondents who know more about the outcomes are more willing to walk away. Inparticular, respondents who correctly assert that a default’s impact on one’s credit score weakensover time are more willing to declare an intention to walk away.
Similar to previous work, we find that morality, guilt and fairness all play important roles in thedecision. Those who would feel guilty or believe it is immoral to default are significantly less likelyto do so. In contrast, those who feel that banks have treated borrowers unfairly are significantlymore likely to express a willingness to walk away. As one might expect, we find that individualswho have checked their credit score recently (a proxy for its importance) are significantly less likelyto strategically default. Interestingly, homeowners who know their neighbors well are also lesswilling to walk away. This may be because they do not want to impose a negative externality onpeople they know well, but familiarity with one’s neighbors may also be correlated with housingsatisfaction more generally.
In contrast to previous work, we do not find that knowing someone who has strategically de-faulted significantly increases the probability one will do so, although the effect is positive. Thismay be because many of our respondents only know a casual acquaintance who has defaulted,rather than a family member or close friend (Seiler et al. (2012)). However, our estimate of howfrequently strategic default occurs is similar to that found in previous studies. Using the ratio ofstrategic defaults and total defaults our respondents were personally aware of (as constructed inGuiso et al. (2011)), we estimate that approximately 30% of defaults are strategic.
Our results provide further evidence that social considerations play an important role in thedecision to walk away. Our examination of expectations, however, has novel policy implications.Policies that help shape expectations about future strategic defaults may influence foreclosurestoday. For example, policies designed to stabilize future house prices may do so in part through asignalling effect, reducing underwater homeowners’ willingness to strategically default.
The following section presents a simple theoretical framework motivating our study. Section 3discusses our survey data, while Section 4 presents the results of our analysis. Section 5 concludes.
2 Theoretical Motivation
An underwater homeowner considering strategic default must weigh the costs and benefits of walk-ing away against those derived from remaining in the home. By defaulting, a homeowner ridshimself of an underwater asset, but may face financial and social penalties. Should the borrowercontinue to make mortgage payments, there is a possibility that his home value will appreciate toa point where strategic default is no longer attractive.
Consider a simple two period (present and future) framework in which borrowers face thistradeoff. Specifically, suppose there are two types of borrowers, high types and low types, wherefraction p of borrowers are high types.
θ =
{
θH w/ prob p
θL w/ prob 1− p
3

Low types are assumed to have suffered an adverse financial or liquidity shock (such as a sig-nificant medical expenses) rendering them unable to continue to meet their mortgage paymentobligations. Consequently, low types will default with probability 1. High types, on the otherhand, haven’t experienced such a shock and must decide whether to default on their mortgage,despite the ability to pay. Let φ denote the expected fraction of high-types who will default.
In the future (second period of our framework) a borrower faces the decision of whether torepay his remaining mortgage balance9, M2, or to default. If the borrower chooses not to default,he pays off his mortgage and is left with a house of value V2. If he defaults he neither pays themortgage nor has an asset of any value, but faces the costs of defaulting, CD. We decompose thecosts of defaulting into two components, financial and social.
CD = CF +CS(1− φ)
CF represents the financial costs of strategically defaulting, including the impact to one’s creditscore, while CS represents the social costs and is assumed to be proportional to the expectedfraction of consumers who choose to meet their debt obligations (an assumption we will investigateempirically). Thus, in the second period, a borrower will choose not to default if
V2 −M2 > −CD. (1)
Equation 1, though simple, reveals negative equity is a necessary condition for default. If a home-owner has positive equity, selling his home both avoids default and delivers a positive profit. How-ever, negative equity is not a sufficient condition. If the financial and social costs to strategicallydefaulting are substantial, a borrower may meet his mortgage obligation even if it exceeds the valueof his home.
In the first period, a borrower faces a slightly different decision. Should he chose to walkaway, he incurs the same costs of defaulting, CD. If he chooses not to default, he must meet hismonthly mortgage obligation, mpay, but may be in a position in which he would prefer to pay hisremaining mortgage balance in the next period. Suppose future housing values are subject to arandom percentage price shock w1 ∼ F (w) which is depressed by an amount proportional to thetotal fraction of foreclosures. Thus, let
V2 = V1(1 + w1 − γ(1− p+ pφ))
where 1− p+ pφ is the total proportion of strategic and non-strategic defaults. Let λ represent thefraction of a borrower’s monthly mortgage payment going to principal so that M2 = M1 − λmpay.A borrower will prefer to default in the first period if
−CD > −mpay + Prob(V2 −M2 > −CD)(V2 −M2) + (1− Prob(V2 −M2 > −CD))(−CD). (2)
Substituting for future values and rearranging yields
Prob(V2 −M2 > −CD) = Prob
(
w1 >M1 − λmpay − CF − CS(1− φ)
V1− 1 + γ(1− p+ pφ)
)
.
9Substantively, this can represent a situation in which a borrower faces a balloon payment or must sell his homefor exogenous reasons, such as a job relocation.
4

A homeowner will want to retain his home in the second period if the shock to housing prices issufficiently positive. The further one is underwater (the higher the ratio M1
V1), however, the less
likely this is to occur. Notice that an increase in the expected proportion of strategic defaults,φ, also decreases the probability a homeowner will prefer to retain his home in the future. Anincrease in strategic defaults both depresses house prices and reduces the social stigma associatedwith walking away.
Let w =M1−λmpay−CF−CS(1−φ)
V1− 1 + γ(1 − p + pφ). Rearranging Equation 2 and taking
expectations yields:
mpay > Prob(w1 > w)[E(V2|w1 > w)−M2 + CD]. (3)
A borrower will prefer to default today if the cost of making his monthly mortgage payment ex-ceeds the option value of remaining in his home. By waiting, a borrower may experience a positiveshock to housing prices. If the shock is sufficiently positive, the borrower will pay off his remainingmortgage balance in the second period, yielding a net financial position of V2 −M2, and avoid thefinancial and social costs of defaulting.
This simple theoretical framework makes a couple seemingly sensible predictions. First, thefurther a borrower is underwater (measured as the ratio of mortgage debt to house value) the morelikely he is to walk away. Second, borrowers who believe that strategic defaults will be pervasivein the future are more willing to default today. An increase in the expected amount of strategicdefault reduces both expected house price appreciation and social stigma. In the following sectionswe will test the framework’s predictions by empirically separating and examining the importanceof social and financial considerations.
3 Data
While mortgage defaults are easily observable in secondary data, it is difficult to determine whetherthose defaults were strategic. Strategic defaulters have strong financial and social incentives to hidetheir motivations. Further, even if one were able to identify which defaults were strategic, it is im-possible to determine how those decisions were shaped by personal experiences and beliefs withoutdirect contact.
Survey data, however, can be used to examine how expectations and social factors impact de-fault decisions. We presented respondents with hypothetical scenarios to determine if and whenthey are likely to walk away from an underwater mortgage. While hypothetical questions are ob-viously an abstraction from real world decisions with actual pecuniary and social consequences,they allow us to elicit the expectations, social perceptions and personal experiences central to ouranalysis. In addition, employing a survey methodology allows us to examine how behavior mightchange if negative equity became either more pervasive or more acute, providing insight into whichpolicies might be most effective in stabilizing a deteriorating housing market.
Data for this analysis come from a new survey in the American Life Panel (ALP). Maintainedby the RAND Corporation, the ALP is an Internet panel of approximately 5,000 respondents ages18 and older. To complete surveys, the majority of respondents in the panel use their own Internetaccess. For panel members without Internet access, RAND provides a Web TV or a laptop and
5

access to the Internet. This eliminates the bias found in many Internet survey panels which includeonly computer owners.
Respondents have been recruited to the ALP in a variety of ways. The first cohort was recruitedafter completing the Monthly Survey (MS) of Michigan’s Survey Research Center in 2006.10 Latercohorts of the ALP were recruited by inviting members of Stanford University and Abt ARBI’sNational Survey panel to join the sample.
ALP Panel members are requested to complete questionnaires about twice a month. Typicallyan interview will take no more than 30 minutes, and respondents are paid an incentive of about $20per thirty minutes of interviewing. Most respondents respond within one week and the majoritywithin three weeks.
Our survey, MS196, was released on June 30, 2011 and includes a sample of 1,471 respondents.Panel members were included in the survey if they indicated that they owned a home in one of tworecent surveys. The first question in our survey identified respondents who no longer own a homeand excluded them from the sample. Additionally, we excluded respondents who claimed not tobe primarily or jointly responsible for household financial decisions, resulting in a sample of 1,297respondents. These intentional restriction ensures that only respondents who are currently in aposition to make decisions related to homeownership answer the survey questions.
3.1 Demographic Characteristics
Upon joining the panel, respondents complete a demographic survey which includes questions onindividual characteristics, work history and household characteristics. This background informa-tion is updated with each questionnaire. Demographic characteristics include birthdate, gender,education, race, ethnicity, marital status, job status and income. Table 1 displays the summarystatistics for the demographic variables from the full sample and the analysis sample for the re-gressions.11 In the full sample, more than half of respondents are female, and there is a smallpercentage of minority respondents. Respondents in the ALP are generally more well educated andolder than the general population, and almost two-thirds earn more than the median U.S. income.Three-quarters of the sample is married, and 20% is either divorced, separated or widowed (nolonger married). 17% of respondents in the sample do not earn an income, either because they areunemployed and looking for work, disabled or a homemaker. Almost one-quarter of respondentsare retired, and a similar number have a child who attends a public school in the neighborhoodwhere the household resides. The majority of the sample live in the Midwest and South (excluded),34% and 31%, respectively.
3.2 Housing Characteristics
In our survey, we first consider background information on the respondent’s primary residence, in-cluding the type of unit they own, the purchase date and purchase price. Over 86% of respondents
10The MS produces the widely used Index of Consumer Expectations and is one of the leading consumer sentimentsurveys.
11The analysis sample excludes respondents who did not answer some of the questions captured by the dependentor control variables.
6

Table 1: Demographic Variable Summary Statistics
Full Sample Analysis Sample
Variable Mean S.D. Mean S.D.
Female 0.5641 0.4961 0.5596 0.4966
Black 0.0320 0.1762 0.0315 0.1746
Hispanic 0.0258 0.1585 0.0257 0.1582
Some College 0.3500 0.4772 0.3502 0.4772
College Degree 0.2773 0.4479 0.2815 0.4499
Professional Degree 0.2086 0.4065 0.2103 0.4077
Age 30 to 44 0.1437 0.3510 0.1432 0.3504
Age 45 to 59 0.4102 0.4921 0.4089 0.4918
Age 60 to 74 0.3531 0.4781 0.3551 0.4788
Age > 75 0.0680 0.2518 0.0687 0.2531
Inc > Median US 0.6484 0.4776 0.6515 0.4767
No Income 0.1734 0.3788 0.1714 0.3770
Retired 0.2406 0.4276 0.2401 0.4273
Married 0.7250 0.4467 0.7285 0.4449
No Longer Married 0.1992 0.3996 0.1978 0.3985
Kids in Pub School 0.2359 0.4247 0.2417 0.4283
North East 0.1484 0.3557 0.1465 0.3538
Midwest 0.3352 0.4722 0.3444 0.4754
West 0.1969 0.3978 0.1987 0.3992
Observations 1,280 1,208
7

live in single family homes, while 8% reside in townhomes or condominiums, and the remainderlive in mobile homes. A large portion of respondents, 45%, indicated they bought their home after2000, while 29% indicated they bought in the 1990s and 14% indicated they bought their homein the 1980s. The mean self-reported purchase price was $162,000, with a standard deviation of$211,000. The purchase price of homes increase significantly over time, with a low mean purchaseprice of $51,000 for homes bought in the 1950s, to a high of $274,000 for homes bought since 2010.
To understand the extent to which respondents experienced the housing market bubble throughthe evolution of their home values, we examined the (self reported) maximum value the house at-tained while it was owned by the respondent, when this value was reached, and the respondent’sbest guess for the current (mid 2011) value of the house. Figure 1 shows the purchase price andmaximum value of homes for respondents who purchased a home after late 1969 and whose homevalue was less than $500,000.12 There is a wide dispersion in purchase price, but the generalevolution of housing prices in the sample appears to mimic the population at large. Most of therespondents report their homes reached a maximum value between 2006 and 2008, the height ofthe housing market bubble.
Figure 1: Self-reported Purchase Price and Maximum Housing Value
010
020
030
040
050
0
Sel
f−R
epor
ted
Val
ue in
Tho
usan
ds o
f Dol
lars
Jan−1970 Jan−1980 Jan−1990 Jan−2000 Jan−2010
Purchase Price Maximum Value
Figure 2 displays changes to self reported home values, with three observations plotted perrespondent against a time axis: purchase price, maximum value and current value. The line con-necting the three values reveals the changes in self reported home values for each respondent. Itis evident that most respondents experienced a steep incline in the value of their homes, followedby a significant drop. The average increase in home values was over $142,000 or 88 percent of themean purchase price. From its maximum value, home values dropped an average of $57,200 or 28percent of current market value. The largest reported increases and eventual drops in home value
12These figures exclude 214 respondents whose homes were either more than $500,000 or purchased before November1969 for ease of display.
8

were experienced by homeowners who purchased their home in the 1970s.
Figure 2: Changes in Self-reported House Value
010
020
030
040
050
0
Sel
f−R
epor
ted
Val
ue in
Tho
usan
ds o
f Dol
lars
Jan−1970 Jan−1980 Jan−1990 Jan−2000 Jan−2010
Purchase Price Maximum Value Current Value
To get a better understanding of respondents’ current housing situation, we asked questionsabout the type and size of their mortgage, including how much was borrowed at the time of pur-chase, how much is currently owed, and their last monthly payment. The average mortgage sizewas $107,000 with a standard deviation of $130,000. At the time of the survey, 32% of respondentshad paid off their mortgage in its entirety. Of the remaining respondents, the average amount stillowed is $137,000. Average monthly payments for respondents who still owe money were $1,228.13
Very few respondents in our sample believe they are underwater. A total of 8.4% of homeownersin the full sample owe more than their home than they believe it is worth. For these borrowers,the average amount of the shortfall is $41,000, or 36% of the value of the home.
The outcomes of interest for this study are the respondents’ default decisions in a number ofhypothetical situations in which they were asked to assume their primary residence had negativeequity. Based on the theoretical framework, we presented negative equity as a shortfall measured asa percentage of the current house value. For example, we ask the respondent the following question:“If the value of your mortgage were to exceed the value of your house by 10 percent (i.e. you owed$(.1*$X) more on your mortgage than the value of your house), would you walk away from yourhouse (i.e. default on your mortgage) even if you could afford to make your monthly mortgagepayments?” In this question the $(.1*$X) term is replaced by a dollar amount corresponding toten percent of the current house value reported by the respondent in an earlier question. Eachrespondent was asked a series of strategic default questions where negative equity was either 10%,25%, 50%, or 75%.
13This calculation excludes 14 respondents who reported monthly mortgage payments greater than $20,000. In-cluding these respondents increases the average monthly payments to $2,947.
9

Table 2 summarizes the responses to this series of questions. Very few respondents (less than3%) would default at 10% negative equity, so we do not analyze this outcome any further. Ap-proximately 13% of respondents would default if negative equity reached 25%, one third default at50%, and 45% would default if negative equity reached 75%.
Table 2: Strategic Default with Negative Equity as % of House Value
Variable Mean Std. Dev. N
Underwater 10% of House Value 0.0298 0.1701 1208
Underwater 25% of House Value 0.1258 0.3319 1208
Underwater 50% of House Value 0.3289 0.4700 1204
Underwater 75% of House Value 0.4471 0.4974 1201
In addition to default decisions and demographic characteristics, we elicited a variety of personalcharacteristics and beliefs to serve as control variables in our analysis. They variables we employedare summarized in Table 3. First, we control for the type of mortgage held by the respondent. Asmentioned earlier, 32% of respondents have paid off their mortgage in full. Of the homeownerswho still owe money on their mortgage, the majority, 54% of the total sample, hold a fixed ratemortgage. Other mortgage types include ARM, IO, FHA, VA and “other”. We also control forwhether the home is underwater (the value of the home is less than what is owed on the mortgage),whether the house has been owned for more than 10 years14, and the self reported current valueof the house. Local foreclosure rates were obtained from RealtyTrac to control for external factorsthat affect home values. The mean zip code foreclosure rate is quite low at 2%, although a few zipcodes have foreclosure rates above 30%.15
We also control for state level variation in the ability of lenders to recoup more than the valueof the defaulter’s home. Non-recourse states are those in which borrowers are not financially re-sponsible for the difference between the amount owed on the mortgage and their house value atthe time of default. Following Ghent and Kudlyak (2009), we classify 12 states as non-recoursestates, comprising 26% of our sample.16 Many people are ignorant of the recourse rules in theirstate, so we also elicited respondents’ perceived probability defaulters will be sued. Specifically, weasked “(i)n your state of residence what do you expect are the chances that lenders will sue peoplewho default on their mortgage for the remainder of the money owed?”. We find that on averagerespondents believe there is a 40% chance that they will be sued if they default.
Previous research suggests morality, guilt, and fairness may have important impacts on a bor-rower’s willingness to default. 85% of respondents in our sample believe that it is morally wrongto default when a homeowner can afford to make mortgage payments, and 71% would feel guiltyif they strategically defaulted. 77% of respondents feel that banks have treated borrowers unfairly,and 84% believe that the government has been ineffective in helping borrowers who are underwater.
14More than 64% of respondents in our sample have owned their homes for more than 10 years.15In cases where the zip code level foreclosure rate was missing we used the county level foreclosure rate provided
by RealtyTrac.16These states are Alaska, Arizona, California, Connecticut, Florida, Idaho, Minnesota, North Carolina, North
Dakota, Texas, Utah, and Washington.
10
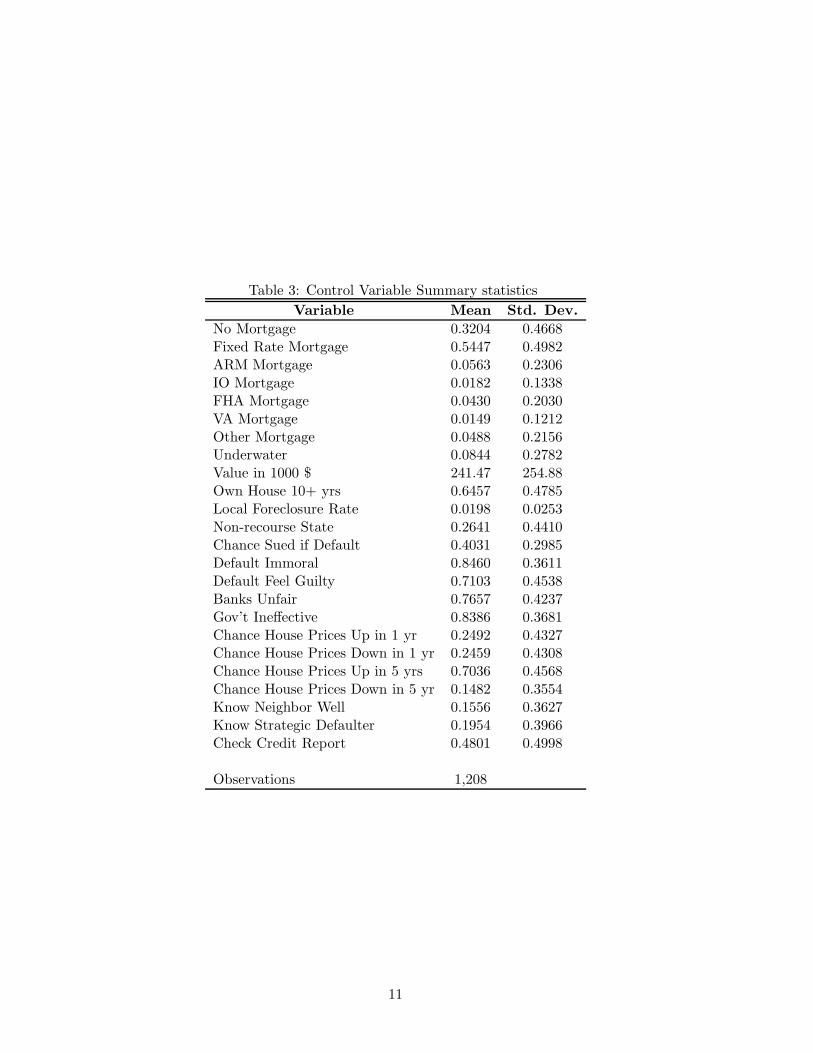
Table 3: Control Variable Summary statistics
Variable Mean Std. Dev.
No Mortgage 0.3204 0.4668Fixed Rate Mortgage 0.5447 0.4982ARM Mortgage 0.0563 0.2306IO Mortgage 0.0182 0.1338FHA Mortgage 0.0430 0.2030VA Mortgage 0.0149 0.1212Other Mortgage 0.0488 0.2156Underwater 0.0844 0.2782Value in 1000 $ 241.47 254.88Own House 10+ yrs 0.6457 0.4785Local Foreclosure Rate 0.0198 0.0253Non-recourse State 0.2641 0.4410Chance Sued if Default 0.4031 0.2985Default Immoral 0.8460 0.3611Default Feel Guilty 0.7103 0.4538Banks Unfair 0.7657 0.4237Gov’t Ineffective 0.8386 0.3681Chance House Prices Up in 1 yr 0.2492 0.4327Chance House Prices Down in 1 yr 0.2459 0.4308Chance House Prices Up in 5 yrs 0.7036 0.4568Chance House Prices Down in 5 yr 0.1482 0.3554Know Neighbor Well 0.1556 0.3627Know Strategic Defaulter 0.1954 0.3966Check Credit Report 0.4801 0.4998
Observations 1,208
11

We also control for expectations concerning the evolution of local housing prices. About one-quarter of respondents believe housing prices in their neighborhood will increase in the next year,and the same percentage believe they will decrease in the next year. Looking at a longer timehorizon, more than 70% of respondents believe housing prices will increase in their neighborhoodover the next 5 years, whereas 15% of respondents feel that housing prices will decrease in thattime period.
The next set of control variables account for other factors that may affect strategic default.16% of respondents know their neighbors well, and 20% say they know at least one person who hasstrategically defaulted. Finally, we include an indicator for whether the respondent has checkedhis/her credit report in the last year as a proxy for its importance – 48% of respondents indicatedthey recently checked their credit history.
3.3 Default Literacy
How much borrowers know about the consequences of default is likely to influence their willingnessto walk away. We measured respondents knowledge of a lender’s ability to pursue a deficiencyjudgment in their state of residence, how long before a default can be removed from a credit report,how a default’s impact varies over time, how a default impacts future borrowing opportunitiesand credit card limits, and whether a defaulter can be jailed. Specifically, the following series ofquestions and true/false statements was posed:
• “In your state of residence, can a lender sue someone who has defaulted on his/her mortgageto recover the difference between the house value and the amount owed on the mortgage?”
• “If you default on your mortgage, how long before you can remove the default from yourcredit report?”
(a) 1 year (b) 3 years (c) 5 years (d) 7 years (e) 10 years
(f) It can never be removed (g) Don’t know
• “While a default is on your credit report, does its impact on your credit score weaken overtime?”
• “If you default on your mortgage, it is impossible to get a mortgage for another house in thefuture.”
• “If you default on your mortgage, your current credit card limits may be reduced.”
• “If you default on your mortgage, you may go to jail.”
Based on the responses to these questions, we created an index measuring the number of ques-tions respondents answered correctly. Overall, there is considerable confusion regarding the con-sequences of strategic default. Approximately half the respondents answered 3 or less questionscorrectly and only 5% answered all six questions correctly.
While the default literacy index aggregates overall knowledge, it doesn’t necessarily correlatewith perceived negative outcomes. In some cases, answering a question correctly indicates that the
12

Table 4: Default Literacy
Questions Answered Fraction ofCorrectly Respondents
0 0.1%1 1.6%2 17.1%3 30.8%4 26.9%5 19.0%6 4.6%
respondent is aware of a potential negative outcome while in other cases a correct answer connotesknowledge that a particular penalty cannot be imposed. Therefore, we also examine the impactof answering each of the default literacy questions individually. Note that respondents who live ina nonrecourse state would need to know that they cannot be pursued for a deficiency judgmentin order to answer this question correctly. Conversely, respondents living in recourse states wouldneed to know that they can be sued. Table 5 summarizes the correct responses to the defaultliteracy questions.
Table 5: Default Literacy Questions Correct Summary Statistics
Variable Mean Std. Dev.
Lender Can Sue, Correct 0.1705 0.3763
Lender Can Not Sue, Correct 0.0273 0.1631
Overestimate Default On Credit Score 0.1755 0.3805
Underestimate Default One Credit Score 0.0513 0.2208
Default Weakens Over Time, Correct 0.6051 0.4890
New Mortgage Possible, Correct 0.8022 0.3985
Credit Limit Reduced, Correct 0.6175 0.4862
Default No Jail, Correct 0.9520 0.2139
Observations 1,208
3.4 Financial Literacy
It can be difficult to estimate the financial costs and benefits of strategically defaulting. Even if onewere perfectly aware of all possible consequences, determining how these consequences will impactlifetime wealth is challenging. On the benefits side, defaulting alleviates the requirement to devotea future stream of payments to an underwater asset. It may, however, be difficult evaluate thepresent value of this future stream of payments relative to the present shortfall in house value. Onthe costs side, defaulting often entails a higher cost of future borrowing. Determining how muchthis higher cost will reduce future wealth can be arduous.
13

To measure financial literacy, we posed the same series of questions asked in Lusardi and Mitchell(2006).17 Specifically, we asked the following:
• “Suppose you had $100 in a savings account and the interest rate was 2% per year. After 5years, how much do you think you would have in the account if you left the money to grow?(a) More than $102 (b) Exactly $102 (c) Less than $102 (d) Don’t know
• “Suppose you had $100 in a savings account and the interest rate is 20% per year and younever withdraw money or interest payments. After 5 years, how much would you have onthis account in total?”(a) More than $200 (b) Exactly $200 (c) Less than $200 (d) Don’t know
• “Imagine that the interest rate on your savings account was 1% per year and inflation was2% per year. After 1 year, would you be able to buy more than, exactly the same as, or lessthan today with the money in this account?”(a) More than today (b) Same as today (c) Less than today (d) Don’t know
• “Assume a friend inherits $10,000 today and his sibling inherits $10,000 but 3 years fromnow. Who is richer today because of the inheritance?”(a) My friend (b) His sibling (c) They are equally rich (d) Don’t know
• “Suppose that in the year 2012, your income has doubled and prices of all goods have doubledtoo. In 2012, will you be able to buy more, the same or less than today with your income?”(a) More than today (b) Same as today (c) Less than today (d) Don’t know
Our measure of financial literacy is a single dimensional index developed in Hung et al. (2009)based on the responses to these questions (called basic financial literacy or BF). This single di-mensional index uses models from item response theory to model the probability of answers asa function of the underlying trait the test item was intended to measure. It takes into accountmissing data that arises from survey non-response, item non-response and the ALP survey design.The index is a result of an estimation model that gives the optimal estimates of the underlyingunobserved value of the financial literacy concepts captured by the survey questions.18 The finan-cial literacy index has a mean of .2193 and a standard deviation of .6421 in our analysis sample.Similar to Hung et al. (2009), the financial literacy index is increasing in age and education status,and higher for men than women.
3.5 Social Perceptions
Previous research suggests that social factors may play a substantial role in the decision to strate-gically default (Guiso et al. (2011), Towe and Lawley (2010), Seiler et al. (2012)). Given thatforeclosures are highly visible, perceptions about others’ behavior may influence one’s willingnessto walk away. In particular, those who believe that underwater homeowners will default in highnumbers may be more willing to default themselves.
To measure our respondents’ beliefs regarding how pervasive strategic defaults have been in thepast and are likely to be in the future we asked the following: “In the past (next) 12 months, on a
17Many respondents in our sample were asked this series of questions in a previous survey. If these questions wereanswered previously, they were not re-asked in our survey
18For more details on how the index was calculated and the properties of the index, see Hung et al. (2009).
14

scale of 0 to 100, what percentage of homeowners in the US do you think have walked (will walk)away from their primary residence (i.e. default on their mortgage) even though they can afford tomake their monthly mortgage payments?” We also elicited their beliefs over the same time horizonabout the fraction of US homeowners that have lost (will lose) their homes because they could notafford to make payments.
Table 6 shows the summary statistics for these four variables. On the whole our respondentsbelieve things are likely to improve in the future, but are still quite pessimistic about the housingmarket generally. There is also considerable heterogeneity in beliefs as evidenced by the large stan-dard deviations.
Table 6: Social Perceptions Summary Statistics
Variable Mean Std. Dev.
Past Perceived Foreclosure Rate 0.3019 0.2290Past Perceived Strategic Default 0.1875 0.1588Future Perceived Foreclosure Rate 0.2553 0.2214Future Perceived Strategic Default 0.1415 0.1397
Observations 1,208
4 Results
We estimate the impacts of the control variables described in the previous section using linear prob-ability models.19 All estimations use Huber-White heteroscedasticity consistent standard errors.
Less than 3% of respondents indicated they would strategically default if they were 10% under-water. This provides too little variation to generate sufficiently reliable estimates of the independentvariables. As a result, we only present results for shortfalls of 25%, 50% and 75%, respectively.
4.1 Baseline Specification
Table 7 presents the results for our baseline specification. We find few differences in the decision tostrategically default based on demographic characteristics. At a shortfall of 25%, homeowners witha college degree are more likely to strategically default, while those with household incomes abovethe national median are less likely to walk away. However, neither variable has a significant impacton the decision to default at higher levels of shortfall. Age does not appear to play an importantrole when controlling for other characteristics. However, age is correlated with retirement statusand retirees are significantly less likely to walk away when shortfall becomes large. Retirees are 8and 12 percentage points less likely to walk away once shortfalls reach 50% and 75% respectively.
19Estimates from probit models are very similar and available from the authors upon request.
15

Interestingly, employment status does not have a statistically significant impact on the decisionto walk away. However, this result is not surprising. The control variable “Not Employed forIncome” includes respondents employed as homemakers and in other professions without monetaryreward. Many of these respondents are likely to have other sources of household income. Further,respondents were posed hypothetical situations in which they were asked to assume that they couldafford to continue making mortgage payments, rendering current employment status largely irrele-vant.
Table 7: Baseline Regression
Walk 25 Walk 50 Walk 75
Female 0.0121 -0.0247 -0.0477(0.0206) (0.0286) (0.0303)
Black 0.0931 0.1005 0.0325(0.0602) (0.0740) (0.0801)
Hispanic 0.0476 0.0690 0.0157(0.0658) (0.0756) (0.0779)
Some College 0.0197 0.0244 -0.0314(0.0284) (0.0405) (0.0434)
College Grad 0.0573* 0.0517 0.0288(0.0316) (0.0439) (0.0474)
Prof Grad 0.0296 -0.0224 0.0100(0.0335) (0.0480) (0.0523)
Income > US Median -0.0474* 0.0157 -0.0292(0.0247) (0.0329) (0.0344)
Not Employed for Income 0.0205 -0.0419 -0.0481(0.0279) (0.0378) (0.0395)
Retired -0.0205 -0.0770* -0.1189***(0.0292) (0.0396) (0.0417)
Age 30-44 -0.1095 -0.0878 -0.0054(0.0763) (0.0986) (0.0974)
Age 45-59 -0.1076 -0.0623 -0.0163(0.0755) (0.0986) (0.0956)
Age 60-74 -0.0660 0.0223 0.0992(0.0771) (0.1018) (0.0989)
Age > 75 -0.0664 0.0891 0.1663(0.0866) (0.1147) (0.1136)
Married 0.0108 0.0231 0.0420(0.0398) (0.0520) (0.0574)
No Longer Married 0.0078 0.0243 0.0141(0.0437) (0.0562) (0.0618)
Have School Age Kids 0.0123 0.0232 0.0191(0.0227) (0.0317) (0.0342)
Region NE 0.0394 0.1163*** 0.0840*(0.0310) (0.0437) (0.0458)
Continued on next page
16

Table 7 – continued from previous page
Walk 25 Walk 50 Walk 75
Region NW 0.0373 0.0579* 0.0270(0.0235) (0.0326) (0.0353)
Region W -0.0288 0.0536 0.0029(0.0318) (0.0439) (0.0475)
Non-Recourse State 0.0334 -0.0135 0.0003(0.0265) (0.0340) (0.0369)
Own > 10 Yrs 0.0111 -0.0390 -0.0378(0.0211) (0.0315) (0.0329)
Value in 100, 000 0.0032 0.0079 0.0075(0.0036) (0.0053) (0.0057)
Mort Fixed Rate -0.0473 -0.0348 0.0188(0.0362) (0.0651) (0.0698)
Mort ARM -0.0137 0.1065 0.0613(0.0468) (0.0776) (0.0782)
Mort IO -0.1627*** -0.1323 -0.1141(0.0400) (0.0974) (0.1054)
Mort FHA -0.1200** -0.0285 -0.0176(0.0473) (0.0787) (0.0856)
Mort VA -0.0797 -0.0179 0.0702(0.0612) (0.1112) (0.1200)
Mort Other -0.0999** -0.0001 0.0483(0.0446) (0.0714) (0.0796)
No Mortgage -0.0619 -0.0327 0.0214(0.0421) (0.0712) (0.0758)
Underwater -0.0589** -0.1156** -0.0345(0.0296) (0.0459) (0.0529)
Area Foreclosure Rate -0.1886 -0.5149 -1.2790**(0.3506) (0.5467) (0.5156)
Check Credit Report -0.0536*** -0.0545** -0.0597**(0.0188) (0.0264) (0.0280)
Chance Lender Sues -0.0158 0.0041 -0.0306(0.0312) (0.0429) (0.0460)
Know Strategic Defaulter 0.0148 0.0169 0.0450(0.0246) (0.0336) (0.0354)
Know Neighbor Very Well -0.0345 -0.0592* -0.1003***(0.0238) (0.0338) (0.0367)
Default Morally Wrong -0.0816** -0.1248*** -0.0802*(0.0385) (0.0444) (0.0430)
Feel Guilty if Default -0.1407*** -0.2872*** -0.2903***(0.0296) (0.0362) (0.0355)
Bank Treat Borrowers Unfair 0.0456** 0.0494 0.1061***(0.0200) (0.0311) (0.0335)
Gov’t Not Helping Borrowers -0.0263 -0.0184 -0.0676*(0.0254) (0.0352) (0.0375)
Continued on next page
17

Table 7 – continued from previous page
Walk 25 Walk 50 Walk 75
Housing Prices Increase Next 1 Year -0.0530** -0.0358 0.0007(0.0224) (0.0323) (0.0348)
Housing Prices Decrease Next 1 Year -0.0079 0.0358 0.0681*(0.0276) (0.0375) (0.0396)
Housing Prices Increase Next 5 Years 0.0460* 0.0462 0.0294(0.0278) (0.0386) (0.0413)
Housing Prices Decrease Next 5 Year 0.0051 0.0112 -0.0537(0.0315) (0.0479) (0.0525)
Constant 0.3985*** 0.6247*** 0.7108***(0.1170) (0.1554) (0.1581)
Observations 1,208 1,204 1,201R-squared 0.111 0.164 0.154
Respondents in the northeast are more likely to strategically default than those in the southonce the level of shortfall becomes large, but we find few other regional differences. There is alsolittle difference in default decisions based on mortgage type. Those who do not have a mortgageappear to be similarly willing to default as those who do. This is important for our inferencesgiven that a large fraction of our sample doesn’t owe any money on their home. Borrowers withan interest-only loan, an FHA loan, or a loan they’ve indicated as “other” are less likely to defaultat a shortfall of 25%. However, these impacts should be interpreted with caution. Less than twopercent of respondents indicated they have an interest-only loan and less than five percent claimedto have an FHA or “other” type loan.
Homeowners who have owned their home for 10 years or more are less likely to strategicallydefault when shortfall reaches 50%, but this effect is not statistically significant. Self reportedhome value also doesn’t significantly impact the propensity to walk away. This is not surprisinggiven that respondents were presented with shortfalls based upon their home values. Interestingly,a lender’s ability to pursue a deficiency judgement doesn’t appear to be an important determinant,largely because respondents are unaware of the laws in their respective states. Respondents wholive in high foreclosure areas are less likely to walk away, though the effect is only significant onceshortfall levels become extreme.
For moderate levels of shortfall, respondents who owe more on their home than it is worth areless likely to walk away than those with positive equity. This is likely a result of sample selection.Our survey only includes respondents who currently own their home. As a consequence, borrowerswho were underwater and defaulted are not included in our analysis. Those who are underwaterand still own their home are, by definition, less likely to walk away at the experienced level ofshortfall. The average amount of shortfall for our underwater borrowers is $40,400, or 36% of homevalue. Interestingly, if shortfall were to reach 75%, underwater borrowers in our sample would notbe significantly less likely to default than those with positive equity.
Unsurprisingly, respondents who are concerned about their credit report are significantly lesslikely to strategically default. Those who checked their credit report in the last year (a proxy for
18

its importance) are 5 percentage points less likely to walk away. Individuals who believe lendersare highly likely to sue to recover losses are no less likely to default, but there is considerableuncertainty regarding this probability.
Consistent with previous research, we find that guilt and morality play an important role inthe decision. Individuals who believe it is immoral to strategically default are 8 to 12 percentagepoints less likely to do so. Respondents who would feel guilty if they defaulted are also much lesslikely to walk away, between 14 and 29 percentage points. A sense of fairness also has an impact.Respondents who believe banks have treated borrowers unfairly are 5 to 11 percentage points morelikely to strategically default. People who believe the government has done a poor job helpingunderwater borrowers are less likely to walk away, though the effect is only statistically significantat a shortfall of 75%.
In contrast to previous work, we do not find that knowing someone who has strategically de-faulted significantly increases the probability one will do so, although the effect is positive. Thismay be because many of our respondents only know a casual acquaintance who has defaulted,rather than a family member or close friend (Seiler et al. (2012)). However, our estimate of howfrequently strategic default occurs is similar to that found in previous studies. Using the ratio ofstrategic defaults and total defaults our respondents were personally aware of (as constructed inGuiso et al. (2011)), we estimate that approximately 30% of defaults are strategic.20
Interestingly, we find that people who know their neighbors well are less likely to default, partic-ularly at higher levels of shortfall. Homeowners who have a close relationship with their neighborsmay be less willing to impose a negative externality upon them, but knowing neighbors well is alsolikely to be correlated with general housing satisfaction.
Short run house price expectations generally have the anticipated impact. Respondents whobelieve house prices will appreciate in the next year are less likely to walk away, though the affect issignificant only at a shortfall of 25%. In contrast, people who expect house prices to fall in the nextyear are more likely to strategically default, though the impact is only significant once shortfallreaches 75%. Longer term price expectations appear to be less important. Somewhat strangely,respondents who believe house prices will rise over the next five years are significantly more likelyto default at a shortfall of 25%. This affect, however, is no longer statistically significant once weintroduce additional economic and social controls.
4.2 Moral Prompting
Survey responses may vary based upon how a particular question is framed or how a sequence ofquestions is ordered. As noted in Guiso et al. (2011), survey participants who previously indicatedthey would be willing to walk away may be less likely to state that strategic default is immoral.While we expect this bias to be less of a concern in anonymous internet surveys than in telephonicinterviews, we randomized the order in which respondents were asked about their views regardingguilt and morality. One third of respondents were asked about guilt and morality prior to the
20In constructing this ratio we eliminated participants who claimed to know more than 100 people who haddefaulted. This eliminated three respondents who claimed to know 10,000, 200,000 and 200,000,000 defaulters,respectively.
19

hypothetical shortfall scenarios. Another third were asked the same questions after the hypothet-ical scenarios, but before being asked about bank behavior and the effectiveness of governmentintervention. The final third received the guilt and morality questions after both the hypotheticalscenarios and the questions about fairness.
We found no statistical differences in responses regarding morality or guilt based upon questionorder. The fraction of respondents who felt strategic default is morally wrong ranged from a highof 86% for those asked prior to the hypothetical scenarios to a low of 84% for those asked afterquestions about fairness. The fraction of respondents who indicated they would feel very guiltyif they defaulted ranged from a high of 88% for those asked after the hypothetical scenarios, butbefore questions about fairness, to a low of 87% for those asked after the questions about fairness.
However, question order did have a significant impact on the respondents’ willingness to strate-gically default. Those prompted to consider guilt and morality concerns prior to making a decisionregarding strategic default were significantly less likely to express a willingness to walk away. Acrossthe different shortfall levels, respondents asked about guilt and morality before the hypotheticalscenarios were 5.3 - 8.7 percentage points less likely to choose strategic default.
Table 8: Impact of Moral Prompting - Full Sample
% Walk 25 % Walk 50 % Walk 75
Unprompted 14.8% 35.9% 47.1%
Prompted 9.5% 27.2% 39.3%
Equal means p-value 0.0073 0.0017 0.0074
The impact survives the presence of additional controls, as can be seen in Table 9. Whenincluded in the baseline specification, moral prompting decreased the probability of strategic de-fault by 4.6 - 7.9 percentage points. This suggests that lenders attempts to appeal to underwaterborrowers’ sense of moral obligation and guilt may prove effective in preventing default (White(2010b)).
Table 9: Probability of Strategic Default - Impact of Moral Prompting
% Walk 25 % Walk 50 % Walk 75
Moral Prompting -0.0457** -0.0785*** -0.0657**(0.0182) (0.0257) (0.0280)
Demographic Characteristics Yes Yes YesHousing Characteristics Yes Yes YesOther Characteristics Yes Yes YesObservations 1,208 1,204 1,201R-squared 0.115 0.170 0.158
Note: Robust standard errors in parentheses: *** p<0.01, ** p<0.05, * p<0.1
20

4.3 Default Literacy
How much borrowers know about the consequences of default is likely to influence their willingnessto walk away. We find some evidence that respondents who know more about the ramifications aremore likely to default. Table 10 displays the regression results of the probability to strategicallydefault at the 3 shortfall levels as a function of the default literacy index. At shortfalls of 25%and 50%, answering one additional default literacy question correctly is associated with 1.3 and2.0 percentage point increases in the propensity to strategically default. At a shortfall of 75% theimpact is positive, though not significant.
Table 10: Probability of Strategic Default - Default Literacy Index
% Walk 25 % Walk 50 % Walk 75
Default Literacy Index 0.0132* 0.0205* 0.0112(0.0077) (0.0110) (0.0119)
Demographic Characteristics Yes Yes YesHousing Characteristics Yes Yes YesOther Characteristics Yes Yes YesMoral Prompting Yes Yes YesObservations 1,208 1,204 1,201R-squared 0.1173 0.1721 0.1581
Note: Robust standard errors in parentheses: *** p<0.01, ** p<0.05, * p<0.1
While those with more knowledge of the consequences of default appear more willing to walkaway, further investigation is required to determine what is driving this result. As described ear-lier, the default literacy index aggregates overall knowledge, but doesn’t necessarily correlate withperceived negative outcomes. In some instances, answering a question correctly indicates that therespondent is aware of a potential negative outcome while in other cases a correct answer connotesknowledge that a particular penalty cannot be imposed. To disentangle these effects, we examinedthe impacts of each question separately.
Respondents who live in a nonrecourse state and correctly surmise that they cannot be pursuedfor a deficiency judgment are more likely to walk away. Conversely, respondents that correctlyindicate that they can be sued are less likely to walk away. Neither effect, however, is statisticallysignificant.
Respondents who underestimate the time a default is required to remain on one’s credit reportare more likely to strategically default, though this impact is only significant at the 10% level whenshortfall reaches 75%. Those who overestimate this impact are less likely to walk away at a shortfallof 25%, but are more likely to walk away at shortfalls of 50% and 75%, though again the effect isonly significant at 75%. The latter effect is not altogether surprising. It is likely that respondentswho either over or underestimate the duration of the credit impact are less concerned about theircredit scores than those who know precisely how long a default must remain on one’s credit report.
Those who know that a default’s impact on one’s credit score weakens over time are 4-5 per-centage points more likely to walk away at shortfall levels of 50% or under. At a shortfall level of75%, the impact is positive though no longer significant.
21

Table 11: Probability of Strategic Default - Default Literacy Questions Correct
% Walk 25 % Walk 50 % Walk 75
Lender Can Sue, Correct -0.0015 -0.0193 -0.0545(0.0254) (0.0364) (0.0393)
Lender Can Not Sue, Correct 0.1080 0.0801 0.1021(0.0781) (0.0873) (0.0817)
Overestimate Default On Credit Score -0.0112 0.0222 0.0607*(0.0245) (0.0348) (0.0364)
Underestimate Default One Credit Score 0.0481 0.0412 0.0998*(0.0514) (0.0595) (0.0599)
Default Weakens Over Time, Correct 0.0424** 0.0475* 0.0264(0.0193) (0.0269) (0.0288)
New Mortgage Possible, Correct 0.0034 -0.0421 -0.0290(0.0231) (0.0323) (0.0335)
Credit Limit Reduced, Correct -0.0051 0.0683** 0.0691**(0.0205) (0.0271) (0.0294)
Default No Jail, Correct -0.0050 0.0318 0.0367(0.0418) (0.0592) (0.0665)
Demographic Characteristics Yes Yes YesHousing Characteristics Yes Yes YesOther Characteristics Yes Yes YesMoral Prompting Yes Yes YesObservations 1,208 1,204 1,201R-squared 0.1230 0.1820 0.1703
Note: Robust standard errors in parentheses: *** p<0.01, ** p<0.05, * p<0.1
22

We find little impact from knowledge regarding future mortgage borrowing opportunities andthe possibility of going to jail. This is in part due to little variation in answers. Over 80% respon-dents know that it may be possible to get another mortgage in the future after a default and over95% of respondents know that a mortgage default will not result in jail tine.
Somewhat strangely, we find that those who know that a defaulter’s credit card limits may bereduced are more likely to walk away and that this effect is significant at shortfalls of 50% and75%. It is possible that some respondents conflated default with bankruptcy and interpreted thequestion as a reduction in credit card balances rather than credit card limits. Recreating the defaultliteracy index omitting the response to this question yields similar, though slightly altered, results.Under the revised index, knowing more about the consequences of default is still associated with ahigher propensity to walk away at shortfalls of 25% and 50%, though the effect is no longer signifi-cant at 50%. At a shortfall of 75% the impact is now negative, but remains statistically insignificant.
While we find some evidence that those who know more about the consequences of default aremore likely to walk away (particularly those who know that a default’s impact on one’s credit scoreweakens over time), it is possible that some respondents have educated themselves about the con-sequences because they are considering strategically defaulting. However, the vast majority of oursample has positive equity, and as a result, little incentive to seek out this knowledge because theyare unlikely to default in the near future. Perhaps more problematically, there is some evidencethat respondents may not have understood some of the questions and that our index does a poorjob of measuring knowledge regarding the consequences of default.
Table 12: Probability of Strategic Default - Default Literacy Index Instrumental Variables
% Walk 25 % Walk 50 % Walk 75
Default Literacy Index 0.1228* 0.1871* 0.1426(0.0731) (0.1028) (0.1049)
Demographic Characteristics Yes Yes YesHousing Characteristics Yes Yes YesOther Characteristics Yes Yes YesMoral Prompting Yes Yes YesObservations 1,208 1,204 1,201R-squared 0.0001 0.0125 0.0693
Test of Endogeneity 0.1083 0.0791 0.1896First Stage F-test 17.008 16.892 17.263
Note: Robust standard errors in parentheses: *** p<0.01, ** p<0.05, * p<0.1The “Test of Endogeneity” reports the robust regression-based F-statistic forthe endogenous regressor. The “First Stage F-test” reports the F statistic forweak instruments.
To investigate the plausibility of reverse causality and measurement error, we instrumentedfor our default literacy index using news exposure. 56% of respondents indicated they had seen orheard a news story covering strategic default. As demonstrated in Table 12, news exposure explains
23

considerable variation in our default literacy index and is not a weak instrument. In addition, at ashortfall of 50%, there is evidence that an exogeneity assumption is violated. In our two stage leastsquares estimation, default literacy is still positive and significant at shortfalls of 25% and 50% andpositive and insignificant at 75%. However, our estimated effect sizes have increased dramatically,suggesting measurement error is a problem and that our OLS estimates have been attenuated.21
4.4 Financial Literacy
Individuals with high financial literacy may be better able to assess the financial costs, benefitsor both, leading to systematic differences in willingness to default. Many of the costs associatedwith defaulting are fixed22, while the benefits to defaulting increase directly with the size of theshortfall. Consequently, if those with high financial literacy have a different estimate of the costs ofdefaulting than their counterparts with low financial literacy (but similar estimates of the benefits),we’d expect to see similar sized differences between the two groups in their willingness to walk awayacross shortfall levels. Conversely, if highly financially literate individuals are better able to assessthe benefits of strategically defaulting, we’d expect to see the differences in default proclivitiesbetween the two groups to increase as the size of the shortfall increases.
Table 13: Probability of Strategic Default - Financial Literacy Index
% Walk 25 % Walk 50 % Walk 75
Financial Literacy Index -0.0069 0.0461** 0.0626**(0.0146) (0.0202) (0.0222)
Demographic Characteristics Yes Yes YesHousing Characteristics Yes Yes YesOther Characteristics Yes Yes YesMoral Prompting Yes Yes YesObservations 1,208 1,204 1,201R-squared 0.1155 0.1730 0.1628
Note: Robust standard errors in parentheses: *** p<0.01, ** p<0.05, * p<0.1
Table 13 presents the results of our estimation controlling for financial literacy. At a shortfallof 25%, there is no statistical difference between respondents on the basis of financial capability.However, once shortfall reaches 50%, more financially literate respondents are significantly morelikely to default than their less financially literate counterparts. In addition, the effect size increaseswith the size of the shortfall. A one unit increase in our financial literacy index increases the chanceof default by 4.6 percentage points at a shortfall of 50% and 6.3 percentage points at a shortfall of75%. Our results suggest that the costs of defaulting are highly salient, but those who are morefinancially literate are better able to calculate the benefits of walking away and are more likely todo so once the level of shortfall becomes large.23
21If reverse causality was a driving influencing behind our OLS results, we’d expect our two stage least squarescoefficients to be smaller in magnitude. If respondents who are more likely to walk away are also more likely toeducate themselves about the consequences of default, this would create a positive correlation between our defaultliteracy index and the error term.
22Guiso et al. (2011) estimate that the cost of defaulting increases less than proportionally with the size of theshortfall.
23We also ran regressions with both the default and financial literacy index included as regressors. The coefficients
24

4.5 Social Perception
Given that previous research has found that social factors may play an important role in the deci-sion to strategically default, it is plausible that mere expectations regarding others’ future behaviormight also influence the decision. Table 14 presents our results controlling for social expectations.
Table 14: Probability of Strategic Default - Social Expectation
% Walk 25 % Walk 50 % Walk 75
Past Perceived Foreclosure Rate -0.0669 -0.1471 -0.0299(0.0759) (0.1079) (0.1163)
Past Perceived Strategic Default -0.1294 -0.0604 -0.0482(0.1015) (0.1332) (0.1428)
Future Perceived Foreclosure Rate -0.0116 0.0511 0.0045(0.0793) (0.1079) (0.1143)
Future Perceived Strategic Default 0.2464* 0.3269** 0.2222(0.1280) (0.1432) (0.1503)
Financial Literacy Index -0.0076 0.0505** 0.0666***(0.0145) (0.0203) (0.0222)
Demographic Characteristics Yes Yes YesHousing Characteristics Yes Yes YesOther Characteristics Yes Yes YesMoral Prompting Yes Yes YesObservations 1,208 1,204 1,201R-squared 0.1212 0.1792 0.1649
Note: Robust standard errors in parentheses: *** p<0.01, ** p<0.05, * p<0.1
Incorporating social perceptions and expectations into our previous specifications, we find thatbeliefs about past strategic defaults and past and future foreclosures don’t significantly impactone’s willingness to walk away.24 Expectations about future strategic defaults, however, do appearto play a small but important role. At moderate levels of shortfall, respondents who believe thatstrategic defaults are likely to be prevalent in the future are more willing to walk away today. Ata shortfall of 25%, a one standard deviation increase in the perceived amount of future strategicdefaults is associated with a 3.4 percentage point increase in default propensity. At 50%, a onestandard deviation increase is associated with a 4.6 percentage point increase.25 Once the shortfallratio reaches 75% however, beliefs about others’ behavior become inframarginal.
and significance at all shortfall values remained the same for both indices in these regressions.24Given the heterogeneity in beliefs, we also examined specifications in which we excluded observations in the top
1% of any of the four sets of beliefs. The results are very similar and qualitatively unchanged after removing theseoutliers.
25Since questions about willingness to walk away and expectations regarding others’ behavior were asked in thesame survey, one might be concerned that those who claimed that strategic defaults are likely to be prevalent inthe future did so because they indicated they themselves would be willing to walk away. However, if this were alikely explanation for the result, one would expect the same effect would be present in beliefs regarding past strategicdefaults, but it is absent. Additionally, our survey was an anonymous internet survey asking participants to respondto hypothetical scenarios. It is unlikely respondents felt compelled to rationalize their decisions.
25

Recall that our theoretical framework suggests that there are two principal ways in which ex-pectations regarding future strategic defaults might impact current behavior: through social stigmaor price effects. Future non-strategic defaults, however, are expected to influence one’s willingnessto walk away exclusively through price impacts since an inability to pay doesn’t reflect a consciousdecision to default on one’s debt obligations. Since we don’t find evidence that expectations aboutfuture defaults as a result of an inability to pay impact one’s current willingness to walk away,our results suggest that those who expect strategic defaults to be prevalent in the future are morewilling to walk away today because of expected reductions in social stigma.
5 Conclusion
As a result of the financial crisis and associated collapse of the US housing market, millions ofAmericans now have a mortgage balance that exceeds the value of their home. A growing numberof these borrowers are simply choosing no longer to pay, despite having the financial resources to doso.26 Despite the marked increase in strategic defaults, there is relatively little research examiningthe factors that influence the decision.
In this paper, we have investigated how a homeowner’s willingness to strategically default isimpacted by social factors, including expectations regarding others’ behavior, financial literacy, andhis knowledge of the consequences of default. At moderate levels of shortfall, we find that home-owners who expect strategic defaults to be prevalent in the future are more likely to walk awaytoday. However, once the level of shortfall becomes extreme, social expectations become infra-marginal. We find no evidence that this increased propensity to default is attributable to expectedprice decreases, suggesting the increased willingness to default is driven by social considerations,like social stigma.
Financial literacy also significantly influences one’s willingness to strategically default. At rela-tively moderate levels of shortfall, financially literate borrowers appear similar to their less literatepeers. However, once shortfall reaches half a property’s value, financially literate borrowers aremore likely to walk away. Moreover, the difference in default propensity between financially liter-ate borrowers and their less literate counterparts increases with the size of the shortfall, suggestingthose who are more financially literate are better able to calculate the benefits from strategicallydefaulting.
Despite a large amount of confusion about the consequences of default, we find some evidencethat homeowners who know more about the ramifications are more willing to walk away. In par-ticular, those who know that a default’s impact on one’s credit score weakens over time are morelikely to default.
Our results provide further evidence that social considerations play an important role in thedecision to walk away. Our examination of expectations, however, has novel policy implications.Policies that help shape expectations about future strategic defaults may influence foreclosurestoday. For example, policies designed to stabilize house prices may do so in part through a signallingeffect, reducing underwater homeowners’ willingness to strategically default. While our results are
26http://bottomline.msnbc.msn.com/news/ 2011/12/21/9614305-as-home-prices-fall-more-borrowers-walk-away
26

intuitive and consistent with prior research, responses to hypothetical questions could, of course,differ from actions taken under similar conditions in the real world. Further research should beundertaken before any particular policy is enacted.
27

References
Bajari, P., C. Chu, and M. Park (2008): “An Empirical Model of Subprime Mortgage DefaultFrom 2000 to 2007,” NBER Working Paper No. 14625.
Bhutta, N., J. Dokko, and H. Shan (2010): “The depth of negative equity and mortgagedefault decisions,” Finance and Economics Discussion Series, 2010-35.
Elul, R., N. Souleles, S. Chomsisengphet, D. Glennon, and R. Hunt (2010): “What”Triggers” Mortgage Default?” The American Economic Review, 100, 490–494.
Foote, C., K. Gerardi, and P. Willen (2008): “Negative equity and foreclosure: Theory andevidence,” Journal of Urban Economics, 64, 234–245.
Gerardi, K., A. Shapiro, and P. Willen (2007): “Subprime outcomes: Risky mortgages,homeownership experiences, and foreclosures,” FRB of Boston Working Paper No. 07-15.
Ghent, A. and M. Kudlyak (2009): “Recourse and residential mortgage default: Theory andevidence from US states,” Federal Reserve Bank of Richmond Working Paper.
Guiso, L., P. Sapienza, and L. Zingales (2011): “The Determinants of Attitudes towardsStrategic Default on Mortgages,” Economics Working Papers, European University Institute.
Hung, A. A., E. Meijer, K. Mihaly, and J. K. Yoong (2009): “Building Up, Spending Down- Financial Literacy, Savings Management and Decumulation,” RAND Working Paper WR-712.
Seiler, M., V. Seiler, M. Lane, and D. Harrison (2012): “Fear, Shame, and Guilt: Economicand Behavioral Motivations for Strategic Default,” Real Estate Economics, forthcoming.
Tiruppatur, V., C. O. and J. Egan (2010): “ABS Market Insights: Understanding StrategicDefaults,” Morgan Stanley.
Towe, C. and C. Lawley (2010): “The Contagion Effect of Neighboring Foreclosures on OwnForeclosures,” .
White, B. (2010a): “Take This House and Shove It: The Emotional Drivers of Strategic Default,”Arizona Legal Studies, Discussion Paper No. 10-17.
——— (2010b): “Underwater and Not Walking Away: Shame, Fear and the Social Managementof the Housing Crisis,” Arizona Legal Studies, Discussion Paper No. 09-35.
Wyman, E. (2009): “Understanding Strategic Default in Mortgages Part I,” Experian-Oliver
Wyman Market Intelligence Report 2009 Topical Report Series.
28