FINANCIAL LITERACY AND RETIREMENT PLANNING IN THE REPUBLIC …
84
UNIVERSITY OF LJUBLJANA SCHOOL OF ECONOMICS AND BUSINESS MASTER’S THESIS FINANCIAL LITERACY AND RETIREMENT PLANNING IN THE REPUBLIC OF NORTH MACEDONIA Ljubljana, May 2021 SASHKO STOJANOVSKI
Transcript of FINANCIAL LITERACY AND RETIREMENT PLANNING IN THE REPUBLIC …
UNIVERSITY OF LJUBLJANA
SCHOOL OF ECONOMICS AND BUSINESS
MASTER’S THESIS
FINANCIAL LITERACY AND RETIREMENT PLANNING IN THE
REPUBLIC OF NORTH MACEDONIA
Ljubljana, May 2021 SASHKO STOJANOVSKI

AUTHORSHIP STATEMENT
The undersigned Sashko Stojanovski, a student at the University of Ljubljana, School of Economics and
Business, (hereafter: SEB LU), author of this written final work of studies with the title “Financial literacy and
retirement planning in the Republic of North Macedonia”, prepared under supervision of prof. dr. Igor
Lončarski.
DECLARE
1. this written final work of studies to be based on the results of my own research;
2. the printed form of this written final work of studies to be identical to its electronic form;
3. the text of this written final work of studies to be language-edited and technically in adherence with the
SEB LU’s Technical Guidelines for Written Works, which means that I cited and / or quoted works and
opinions of other authors in this written final work of studies in accordance with the SEB LU’s Technical
Guidelines for Written Works;
4. to be aware of the fact that plagiarism (in written or graphical form) is a criminal offence and can be
prosecuted in accordance with the Criminal Code of the Republic of Slovenia;
5. to be aware of the consequences a proven plagiarism charge based on the this written final work could
have for my status at the SEB LU in accordance with the relevant SEB LU Rules;
6. to have obtained all the necessary permits to use the data and works of other authors which are (in written
or graphical form) referred to in this written final work of studies and to have clearly marked them;
7. to have acted in accordance with ethical principles during the preparation of this written final work of
studies and to have, where necessary, obtained permission of the Ethics Committee;
8. my consent to use the electronic form of this written final work of studies for the detection of content
similarity with other written works, using similarity detection software that is connected with the SEB LU
Study Information System;
9. to transfer to the University of Ljubljana free of charge, non-exclusively, geographically and time-wise
unlimited the right of saving this written final work of studies in the electronic form, the right of its
reproduction, as well as the right of making this written final work of studies available to the public on the
World Wide Web via the Repository of the University of Ljubljana;
10. my consent to publication of my personal data that are included in this written final work of studies and in
this declaration, when this written final work of studies is published.
Ljubljana, May 19th, 2021 Author’s signature: ________________________

i
TABLE OF CONTENTS
INTRODUCTION ............................................................................................................... 1
1 LITERATURE REVIEW ............................................................................................ 3
1.1 Retirement planning ............................................................................................. 3
1.2 Defining financial literacy .................................................................................... 4
1.3 The importance of financial literacy ................................................................... 8
1.4 Measuring financial literacy ................................................................................ 9
1.5 Results from past measurements around the world ........................................ 11
1.6 Financial literacy and retirement planning ...................................................... 12
2 PENSION SYSTEM AND RETIREMENT SAVING IN THE REPUBLIC
OF NORTH MACEDONIA ...................................................................................... 13
2.1 General information about the Republic of North Macedonia ...................... 13
2.2 The economy of the Republic of North Macedonia ......................................... 14
2.3 Past research on financial literacy in the Republic of North Macedonia ...... 15
2.4 The pension system in the Republic of North Macedonia ............................... 17
2.5 Sustainability of the pension system in the Republic of North Macedonia ... 19
2.6 Saving and investment culture in the Republic of North Macedonia ............ 23
3 METHODOLOGY ..................................................................................................... 25
3.1 Sample .................................................................................................................. 25
3.2 Questionnaire ...................................................................................................... 30
4 RESEARCH AND FINDINGS ................................................................................. 30
4.1 Basic financial literacy in the Republic of North Macedonia ......................... 30
4.2 Cross country comparison of basic financial literacy ...................................... 33
4.3 Advanced financial literacy in the Republic of North Macedonia ................. 35
4.4 Cross country comparison of advanced financial literacy .............................. 38
4.5 Financial literacy in the Republic of North Macedonia by
demographic characteristics .............................................................................. 39
4.6 Financial literacy in the Republic of North Macedonia, self-assessment ...... 43
4.7 Retirement planning in the Republic of North Macedonia ............................. 44
4.8 Financial literacy indices .................................................................................... 47
4.9 Financial literacy and retirement planning in the Republic of

ii
North Macedonia ................................................................................................ 48
CONCLUSION .................................................................................................................. 54
REFERENCE LIST .......................................................................................................... 56
LIST OF FIGURES
Figure 1: Usage of the term financial literacy over time (frequency in 1 million words)..... 4
Figure 2: Concept of financial literacy .................................................................................. 7
Figure 3: Strategies for measuring financial literacy .......................................................... 10
Figure 4: Global financial literacy (% of adults who are financially literate) ..................... 11
Figure 5: Financial literacy score among G20 countries ..................................................... 12
Figure 6: Annual GDP growth rate of the Republic of North Macedonia .......................... 14
Figure 7: Unemployment rate in the Republic of North Macedonia ................................... 15
Figure 8: Share of financially literate adults among selected countries .............................. 16
Figure 9: Financial literacy score of selected countries ...................................................... 17
Figure 10: Pension sustainability index for the Republic of North Macedonia .................. 21
Figure 11: Support indicator of the pension system ............................................................ 22
Figure 12: Awareness of financial products (% of population) .......................................... 23
Figure 13: Participants in the voluntary pension funds by age ........................................... 24
Figure 14: Market share of investment funds ...................................................................... 25
Figure 15: Share of respondents by gender ......................................................................... 26
Figure 16: Share of respondents by age group .................................................................... 27
Figure 17: Share of respondents by highest level of completed education ......................... 28
Figure 18: Share of respondents by employment status ...................................................... 29
Figure 19: Share of respondents by average net monthly income ...................................... 30
Figure 20: Responses on basic financial literacy questions, % of total .............................. 31
Figure 21: Share of respondents by the number of correct answers ................................... 32
Figure 22: Share of correct answers per question, comparison between countries ............. 34
Figure 23: Basic financial literacy, comparison between countries .................................... 35
Figure 24: Responses on advanced financial literacy questions ......................................... 36
Figure 25: Number of correct answers to advanced financial literacy questions ................ 37
Figure 26: Share of correct answers per question, comparison between countries ............. 38
Figure 27: Comparison between selected sample for further analysis and total sample ..... 39
Figure 28: Self-assessment of financial literacy ................................................................. 43
Figure 29: Performance by self-assessment grades ............................................................. 44
Figure 30: Share of respondents by concern about finances after retirement ..................... 45
Figure 31: Share of respondents by 3rd pillar participation ................................................. 46
Figure 32: Share of respondents by their investments for retirement ................................. 47

iii
LIST OF TABLES
Table 1: Conceptual definitions of financial literacy ............................................................ 5
Table 2: Pension sustainability index in Macedonia- elements ........................................... 20
Table 3: Share of respondents by place of residence.......................................................... 28
Table 4: Analysis of variance by gender ............................................................................. 40
Table 5: Analysis of variance by age................................................................................... 41
Table 6: Analysis of variance by education......................................................................... 41
Table 7: Analysis of variance by finance education ............................................................ 42
Table 8: Analysis of variance by monthly income .............................................................. 43
Table 9: Factor loadings corresponding to categories of financial literacy questions......... 48
Table 10: Multivariate analysis of retirement planning....................................................... 49
Table 11: Multivariate analysis of participation in the voluntary pension funds ................ 51
Table 12: Multivariate analysis of investments for retirement ............................................ 53
LIST OF APPENDICES
Appendix 1: Povzetek (Summary in Slovene language) ....................................................... 1
Appendix 2: Questionnaire in English language ................................................................... 3
Appendix 3: Questionnaire in Macedonian language ............................................................ 8
LIST OF ABBREVIATIONS
CEA - Centre for Economic Analysis
EU - European Union
GFK - Growth for knowledge
OECD - Organisation for Economic Co-operation and Development
UNESCO - United Nations Educational, Scientific and Cultural Organization
USA - United States of America


1
INTRODUCTION
The first documented written language emerged in Mesopotamia between the year 6000 B.C.
and 5700 B.C. It is likely that since then, written language and literacy have been one of the
main building blocks for the development of the modern society. UNESCO has given few
different definitions on literacy. The first is a simple definition, where literacy is defined as
the ability to write and read simple sentences. This definition has been developed further to
the latest, more comprehensive definition published in 2005, where literacy is defined as the
ability to identify, understand, interpret, create, communicate, and compute, using printed
and written materials associated with various contexts. In addition, literacy helps individuals
to expand their knowledge enabling them to achieve their goals and realize their potential as
a fully functioning member of society (UNESCO, 2017).
In this modern society, people are making more and more decisions daily that have impact
on their financial wellbeing. Even small decisions can have negative effect on the financial
well-being on the long run if a person making those decisions makes a mistake due to
misinformation or lack of knowledge (Lynch, 2011). And the most important financial
decisions that an average person makes in his lifetime, financing the purchase of a home and
saving, investing, and planning for retirement, can have a severe impact on the
aforementioned well-being (Hung, Parker & Yoong, 2011).
Many authors believe that in order to make a good decision regarding these important aspects
in life, another type of literacy, financial literacy, is necessary. Similar to defining literacy,
where the UNESCO definition is only one of many, there is no consensus on the definition
of financial literacy as well. Hung, Parker & Yoong (2011, p. 12) offer a definition of
financial literacy that builds on previous research: “Financial literacy is knowledge of basic
economic and financial concepts, as well as the ability to use that knowledge and other
financial skills to manage financial resources effectively for a lifetime of financial well-
being.”
The importance of financial literacy is shown in many studies, for example, Hung, Parker &
Yoong (2011, p. 22) show with their research that people with low financial literacy are less
likely to make proper decisions and save for retirement. They also have higher debt and tend
to save less from their monthly income (Stango & Zinman, 2013) and they tend to pay higher
interest rates on their loans and bear higher transaction costs (Lusardi & Tufano, 2015). In
their research, Behrman, Mitchell, Soo & Bravo (2012, p. 303) show that financial literacy
is more important than schooling when it comes to wealth accumulation and investing for
retirement. This impact is significant enough that an investment in increasing the financial
literacy can yield a significant return.
While studies confirm that financial literacy is important, research conducted in measuring
it around the world shows that the global level of financial literacy is low. In a survey of
G20 countries conducted by OECD, people had an average score of 12.7 out of a maximum

2
of 21 points or just over 60% (OECD, 2017). In a paper, Klapper, Lusardi & Oudheusden
(2017) analyse the results of the survey conducted by Standard & Poor’s rating services.
They concluded that just one in three people on average is financially literate.
In the Republic of North Macedonia, almost 30% of households have difficulty either buying
food (12.4%) or are able to buy food but have difficulty buying clothes (17.2%). A
significant proportion of households, 44.2%, are unable to save regularly as their income is
only sufficient to cover their expenses. An alarming 66.2% have stated that they either have
no savings at all (31.1%) or that in a case where they would lose all household income, their
savings would last for one month or less (25.1%) (The alternative financial services
association of North Macedonia, 2019).
Previous research shows that financial literacy in the Republic of North Macedonia is lower
than in the rest of the countries in the region. In the above-mentioned study conducted by
Standard & Poor’s rating services, the Republic of North Macedonia has 21% of adults who
are financially literate. In comparison, Slovenia has 44% financially literate adults, Serbia
has 38%, Montenegro has 48%, Bulgaria has 35%, Croatia has 44%, Greece has 45% and
Albania has 14% (Klapper, Lusardi & Oudheusden, 2017). In another research, conducted
by Growth for Knowledge (GFK), a company specialized in research, on behalf of the
National Bank of the Republic of North Macedonia following OECD methodology, the
results are similar. Financial literacy among citizens in the Republic of North Macedonia is
lower than in all countries in the region, including Albania and well below the average of
G20 countries (GFK, 2018; OECD, 2017).
Considering that data in other countries have shown that financially literate people are more
likely to save and plan for retirement I decided to test whether this hypothesis is also valid
in the Republic of North Macedonia.
The main objective of this research is to assess the level of financial literacy among the
people living in the Republic of Macedonia and analyse how they compare to countries
where similar research has been conducted. In addition, the research aims to analyse whether
financial literacy has an impact on how people plan for their retirement and how prepared
they are when they reach this stage of life.
The research questions of my master thesis are:
- How financially literate are citizens of the Republic of North Macedonia?
- How (if at all) financial literacy affects the retirement planning in the Republic of
North Macedonia?
In the first section of my thesis, I provide more detailed information on the two main
concepts, financial literacy and retirement planning. I review the literature and examine the
relationship between the two. This helps me show why financial literacy is important and
3
the impact it has on retirement planning. In addition, I examine the methods used to measure
financial literacy and past data from measurements around the world. In the second section,
I provide a brief overview of the macroeconomic situation in North Macedonia. I also
explain the country's pension system and the savings and investment culture of the
population. I also provide an overview of previous measures of financial literacy in the
country. In the third section, I explain the data collection methodology and analyse the
sample. In the fourth section, I measure financial literacy in the country using the data
collected. I then create indices of financial literacy based on the measurements. I use these
indices in a multivariate analysis to assess whether the level of financial literacy has an
impact on the population's retirement planning. Finally, I discuss the results from the survey
and my measurements.
1 LITERATURE REVIEW
1.1 Retirement planning
Retirement planning is very important if one wishes to have a peaceful and stable retirement,
but still many people fail to plan for retirement and retire with significantly less wealth and
assets than those who do (Lusardi & Mitchell, 2011b, p. 523). A lot of the people lack the
necessary knowledge or training to be able to make the right decisions and without help they
make naive mistakes, especially in their asset allocation (Thaler & Benartzi, 2007, p. 23).
Furthermore, Benartzi & Thaler (2001, pp. 96-97) discover that when people choose among
different options to invest their wealth for retirement, they allocate it equally among all
options. Depending on the options available, people may end up with a portfolio that is too
conservative (mostly fixed income) or too risky (mostly equity). Many people fail to estimate
how much money they would need after retirement, leading them in serious financial trouble
after retirement (Lusardi & Mitchell, 2010, pp. 16-17).
Another factor to account for when planning for retirement is debt as it has a significant
impact on the financial well-being in retirement. Lusardi, Mitchell & Oggero (2018, pp. 24-
25) conclude that people nearing retirement are more in debt today compared to the past,
whether it is due to poor decisions or buying homes with higher prices. This also increases
the likelihood of financial problems in retirement.
McKenzie & Liersch (2011, p. 10) show in their research that people fail to estimate the
effect of the compound growth. When asked to provide an estimate of the amount saved by
monthly saving instalments over a long period of time with compound interest, the median
estimate was 90% lower than the correct value. Because of this they do not realize the
benefits of starting to save sooner than later. They found out that the lack of awareness has
a negative effect on the incentive of people to start saving earlier and that educating people
might give them the push they need.

4
Finally, many people fail to make changes to their retirement asset allocation. Thaler &
Sunstein (2008, pp. 34-35) in an explanation of the status quo bias refer to an example that
more than 50% of the college professors have made zero changes to their asset allocation.
Obviously, this is not ideal, since as one approaches retirement, it would be prudent to reduce
exposure to more volatile assets, such as stocks, thereby reducing the overall risk.
1.2 Defining financial literacy
Financial literacy is a relatively new concept. According to an estimate by Beal &
Delpachitra (2003) it has been around since the early 1990s. Thus, as mentioned before,
there is no unified definition for it. In fact, Huston (2010, p. 296) argues that not only is there
no universally accepted definition for financial literacy, but that the term is often used
interchangeably with financial education and financial knowledge.
According to Lee (2012) the first mention of the term and also, the first definition comes
from a report by Noctor, Stoney & Stradling (1992) written for the National Foundation for
Educational Research commissioned by NatWest Bank. Google Ngram Viewer (Google,
n.d.), a search engine that can track mentions of a particular word or phrase in published
books and articles over time, supports this claim. On Figure 1 we can clearly see the
beginning of the use of the term “financial literacy” in the early 1990s and then we can notice
three sharp increases. The first, after the dot-com bubble, at the beginning of the new
millennium, the next one after the Global financial crisis in 2007-08 and the most recent one
in the past couple of years.
Figure 1: Usage of the term financial literacy over time (frequency in 1 million words)
Source: Google Ngram viewer (n.d.).
There have been several financial crises, people have walked on the moon multiple times,
the internet was created, and many other scientific achievements before we started discussing
the financial literacy and the necessity for improving it. Therefore, as mentioned earlier,

5
many authors have given a definition of the concept according to their understanding and
beliefs.
In a comprehensive study on measuring financial literacy, Huston (2010) singles out eight
definitions of financial literacy. The definition provided by Noctor, Stoney & Stradling
(1992) is chronologically the first, adding merit to Lee’s (2012) claim that this is in fact the
first attempt to define the term financial literacy. The definition provided by Noctor, Stoney
& Stradling (1992, p. 4) for financial literacy is the following: “The ability to make informed
judgements and to take effective decisions regarding the use and management of money”.
Beal & Delpachitra (2003, p. 65) accept this definition in their research conducted to assess
the financial literacy among Australian university students.
Table 1: Conceptual definitions of financial literacy
Source Definition
Noctor, Stoney & Stradling (1992) “The ability to make informed judgements
and to take effective decisions regarding the
use and management of money” (p. 4)
Mason & Wilson, (2000) “An individual’s ability to obtain,
understand and evaluate the relevant
information necessary to make decisions
with an awareness of the likely financial
consequences” (p. 31)
Vitt et al. (2000) “Personal financial literacy is the ability to
read, analyse, manage, and communicate
about the personal financial conditions that
affect material well-being. It includes the
ability to discern financial choices, discuss
money and financial issues without (or
despite) discomfort, plan for the future, and
respond competently to life events that
affect every day financial decisions,
including events in the general economy.”
(p. 2)
Hilgert, Hogarth & Beverly (2003) Financial knowledge
Moore (2003) “Individuals are considered financially
literate if they are competent and can
demonstrate they have used knowledge they
have learned. Financial literacy cannot be
measured directly so proxies must be used.
Literacy is obtained through practical
experience and active integration of
knowledge. As people become more
literate, they become increasingly more
financially sophisticated and it is
conjectured that this may also mean that an
individual may be more competent.” (p. 29)
(table continues)

6
(continued)
Source Definition
National Council on Economic Education
(2005)
“Familiarity with basic economic
principles, knowledge about the U.S.
economy, and understanding of some key
economic terms” (p. 3)
Mandell (2007) “The ability to evaluate the new and
complex financial instruments and make
informed judgments in both choices of
instruments and extent of use that would be
in their own best long-run interests” (p. 163-
164)
ANZ Bank, (2008), drawn from Schagen
(1997)
“The ability to make informed judgements
and to take effective decisions regarding the
use and management of money.” (p. 1)
President’s Advisory Council on Financial
Literacy (2008)
“The ability to use knowledge and skills to
manage financial resources effectively for a
lifetime of financial well-being.” (p. 37)
Lusardi (2008; 2011) “Knowledge of basic financial concepts,
such as the working of interest
compounding, the difference between
nominal and real values, and the basics of
risk diversification.” (p. 2)
Remund (2010) “Financial literacy is a measure of the
degree to which one understands key
financial concepts and possesses the ability
and confidence to manage personal finances
through appropriate, short-term decision-
making and sound, long-range financial
planning, while mindful of life events and
changing economic conditions.” (p. 284)
Atkinson & Messy (2011) “Financial literacy is a combination of
awareness, knowledge, skill, attitude and
behaviour necessary to make sound
financial decisions and ultimately achieve
individual financial well-being”
Lusardi & Tufano (2015) “The ability to make simple decisions
regarding debt contracts, in particular how
one applies basic knowledge about interest
compounding, measured in the context of
everyday financial choices” (p.1) - this
definition is focused on debt literacy. Source: Hung, Parker & Yoong (2011); Pokrikyan (2016); Huston (2010).
While this definition is more focused on personal finances and managing personal finances,
Mason and Wilson (2000, p. 31) have a different focus and define financial literacy as the
ability to gather and understand relevant information necessary to make a decision and

7
awareness of the possible outcomes arising from it. As we can see in Table 1, Hilgert,
Hogarth & Beverly (2003) give the most basic definition of financial literacy, making no
distinction between financial literacy and financial knowledge. The National Council on
Economic Education (2005) and Lusardi (2008; 2011), also in a way define financial literacy
as financial knowledge, or familiarity with the economy and understanding of basic
economic principles. Other definitions become more complex and in addition to knowledge,
to be financially literate a person must be able to make sound short-term decisions, while
keeping the bigger picture, or long-term planning in mind (Atkinson & Messy, 2011;
Remund, 2010). A financially literate person has to understand and make the correct choices
regarding personal debt (Lusardi & Tufano, 2015). Most complex, or most demanding are
those that require a person to be able to use, or have already used, their knowledge and skills
to make appropriate decisions when faced with complex financial instruments (ANZ Bank,
2008; Mandell, 2007; Moore, 2003; President’s Advisory Council on Financial Literacy,
2008).
In addition to the definitions mentioned so far, Huston (2010, p. 307) provides a very
comprehensive definition of financial literacy, which is visualised in Figure 2. She agrees
that financial knowledge is an integral part, or the building block towards financial literacy,
however the two concepts are not equal. In addition to knowledge, a financially literate
person must have the ability to apply knowledge in practise and make calculated decisions
which will positively impact his/her financial well-being.
Figure 2: Concept of financial literacy
Source: Huston (2010, p. 307).

8
Hung, Parker & Yoong (2011, p. 10) combine the abovementioned definitions into one, their
definition is as follows: “knowledge of basic economic and financial concepts, as well as the
ability to use that knowledge and other financial skills to manage financial resources
effectively for a lifetime of financial well-being.”
1.3 The importance of financial literacy
In many aspects, financial literacy is important and necessary (Mandell, 2011 p. 2; Mason
& Wilson, 2000 p. 34),
People born between 1980 and 1990 are now between 30 and 40 years old and have lived
through not one, but three “once in a lifetime” financial crisis (dot com bubble, financial
crisis of 2007-08, COVID-19 recession). Recent developments in the stock market such as
the “war” between reddit traders and Wall Street (Platt & Smith, 2021) in the heavily shorted
stocks resemble the “Pump & Dump” strategy, that was popular in the dot com bubble
(Armstrong, 2021). These events are not likely to lead us into a new financial crisis just yet,
but the generation mentioned above will most likely live through another one of the “once
in a lifetime” crisis. Klapper, Lusardi & Panos (2012, pp. 28-29) in a research of the effects
of financial literacy on decision making conclude that people with higher level of financial
literacy tend to have more savings and are better prepared to deal with financial crisis.
Bucher-Koenen & Ziegelmeyer (2012), investigated whether financial literacy has an impact
on the amount of capital losses during financial crisis. Even though they found no evidence
that the financially illiterate people lose more capital, they found out that they are more likely
to sell when markets are down. van Rooij, Lusardi & Alessie (2011a, p. 465) show that
higher levels of education and wealth increase the likelihood of stock ownership, as does
age. This makes sense as older and more educated people have more disposable income to
put into savings. They also point out that financial literacy has an impact on the likelihood
of stock ownership. And this statement held through even after controlling for disposable
income and other demographic characteristics. Mouna & Jarboui (2015 pp. 816-817) in a
study of the Tunisian market provide sufficient evidence that financial literacy matters when
it comes to portfolio diversification. Individuals with higher financial literacy had more
diversified portfolios, this was also true for individuals who have been participating or
investing in the stock market for a longer period of time. On the other hand, Awais, Laber,
Rasheed & Khursheed (2016, p. 77) argue that people with higher financial literacy are less
risk averse and seek investments with higher expected returns.
All this leads to the conclusion that financial literacy is indeed important both in terms of
investing in the stock market and in dealing with financial crisis. Mandell (2011 pp. 2-3)
even believes that a lack of financial literacy may have a negative impact on the stock
market. For example, investors showing irrational behaviour. If we go back to a very recent
example mentioned above, the Reddit – Wall Street “war”, we can observe such irrational
behaviour. "Redditors" proudly post that they invest their entire life savings in just one
9
company and interestingly enough, they refuse to sell the shares even if they lose more than
50% of their investment in one day. Many of them had no investments before. We can
describe this with the term "irrational exuberance". The former chairman of FED first used
the term to describe market anomalies during a time of very high liquidity, similar to what
we have now (Duru, 2013 p. 45).
Financial literacy is not only important when the stock market is in question. Cumurovic &
Hyll (2016, p. 17) conclude that it has a positive impact on self-employment, due to number
of reasons, better understanding of risk and other financial concepts, and higher efficiency.
In his research, Kojo Oseifuah (2010, p. 177) concludes that young entrepreneurs have an
above average level of financial literacy. Shen, Lin, Tang & Hsiao (2016, pp. 61-62)
conclude that financially literate people are less likely to have a financial dispute. When they
do have, they are more eager to resolve the issue faster and peacefully rather than resorting
to violence.
1.4 Measuring financial literacy
As we have already noted, many authors have expressed their opinions on the definition of
financial literacy, ranging from equating it with financial knowledge to understanding
complex financial instruments and making appropriate decisions. Until a single definition
becomes accepted in the academic community, we will not have a single measure of financial
literacy. For example, if everyone had their own definition of how long a meter is, it would
be wrong to compare distances given by two different observers. If we extend the
comparison, given that countries around the world still use different measurement systems,
it is unlikely that we will reach a single definition of financial literacy. However, this does
not mean that we cannot try to measure it, and so far, there are several surveys that aim to
measure financial literacy.
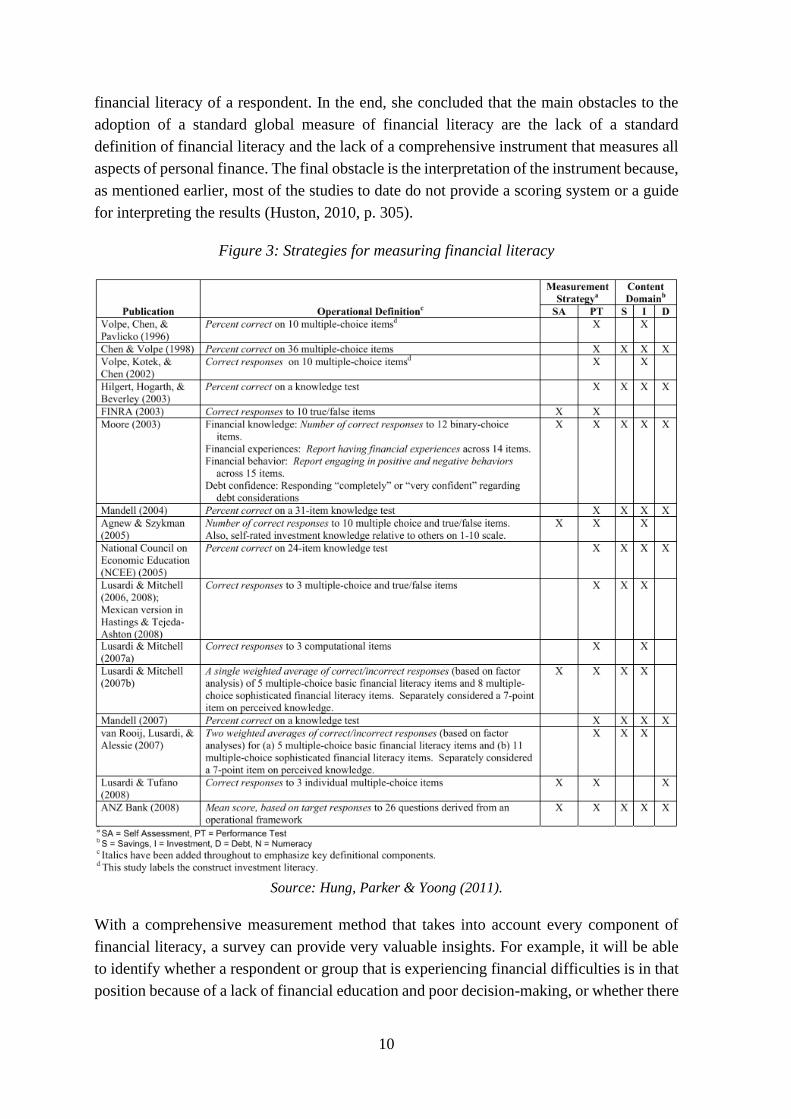
Hung, Parker & Yoong (2011) conducted a survey on the existing methods to measure
financial literacy. They identified 16 different strategies for measuring financial literacy,
which are shown in Figure 3. The number of questions in these surveys varies from 3
questions, the fewest, up to 36 questions. Mostly binary and multiple-choice questions are
used in all of the surveys. To determine the level of financial literacy, most surveys use a
percentage of correct answers out of the total score. Others check the number of correct
questions out of the total number of questions. Finally, two surveys use a weighted average
based on factor analysis.
Huston (2010) conducted an even more comprehensive study to determine what barriers
exist to creating a standardised measure of financial literacy. She analysed 71 different
studies. She found out that nearly three-quarters (72%) of the studies did not provide a
definition of financial literacy. Furthermore, she discovered that 47% of the studies equalled
financial knowledge to financial literacy. When analysing the results of the conducted
surveys, she noted that around 90% of them did not provide an estimate on the level of
10
financial literacy of a respondent. In the end, she concluded that the main obstacles to the
adoption of a standard global measure of financial literacy are the lack of a standard
definition of financial literacy and the lack of a comprehensive instrument that measures all
aspects of personal finance. The final obstacle is the interpretation of the instrument because,
as mentioned earlier, most of the studies to date do not provide a scoring system or a guide
for interpreting the results (Huston, 2010, p. 305).
Figure 3: Strategies for measuring financial literacy
Source: Hung, Parker & Yoong (2011).
With a comprehensive measurement method that takes into account every component of
financial literacy, a survey can provide very valuable insights. For example, it will be able
to identify whether a respondent or group that is experiencing financial difficulties is in that
position because of a lack of financial education and poor decision-making, or whether there

11
is some other reason. This can help address the real problem and add value in the long run
(Huston, 2010, p. 310).
1.5 Results from past measurements around the world
Probably the largest survey measuring financial literacy in the world was conducted by
Standard & Poor’s Rating Services. The survey to which more than 150 thousand people
responded, consisted of four questions, one for each, risk diversification, inflation,
numeracy, and compound interest. A person is considered financially literate if he or she
gave correct answers to three out of four questions. According to this criteria, two thirds of
the adults in the world are financially illiterate. As we can see in Figure 4, the number of
financially literate people varies across countries (Klapper, Lusardi & Oudheusden, 2017).
Figure 4: Global financial literacy (% of adults who are financially literate)
Source: Klapper, Lusardi & Oudheusden (2017).
Klapper, Lusardi & Oudheusden (2017, p. 9) conclude that richer countries, have on average
a higher number of people who are financially literate, however this seems to hold only for
the top half of the countries by GDP per capita. The difference in GDP per capita explains
up to 48% of the variation (Klapper & Lusardi, 2019, p. 11). Furthermore, they speculate
that the higher quality of education could be one of the reasons for the disparity.
Another cross-country research was conducted by the OECD in 2017 using a survey
designed by Kempson (2009) and eventually updated in 2018 (OECD, 2018). The research

12
was conducted among G20 countries, and financial literacy was measured as the number of
correct answers to 21 questions divided in three categories (Figure 5). Only four countries
had over two-thirds correct answers on average, France, Norway, participating as guest
country in the survey since it is not a G20 member, Canada and China (OECD, 2017, p.7).
Additionally, fewer than half, or around 48% gave correct answers to more than 70% of the
questions in the financial knowledge category. According to the methodology, the threshold
of 70% is a minimum score for a financially literate person.
Figure 5: Financial literacy score among G20 countries
Source: OECD (2017).
There are many other surveys of financial literacy, but most of them measure the financial
literacy of one country rather than investigating cross-country differences. Huston (2010, p.
297) identified 71 different measurements on 52 data sets.
1.6 Financial literacy and retirement planning
I have shown that high level of financial literacy has a positive impact on people’s daily
lives. Research suggests that financial literacy also has a positive impact on retirement
planning. Financially literate people are in fact better off when they reach this point in life
than people with low financial literacy, or financially illiterate people.
13
Clark, Lusardi & Mitchell (2017) conclude that people with higher level of financial literacy
are better prepared for retirement overall, they invest a higher percentage of their salary
towards retirement savings and are more likely to participate in the stock market. They also,
have higher accumulated wealth when they reach retirement (Lusardi, Michaud & Mitchell
2011, p. 28; Nolan & Doorley, 2019, p. 18).
Fornero & Monticone (2011, p. 560) investigate pension plan participation in Italy. They
conclude that higher financial literacy contributes to the probability of a person participating
in a pension fund. Lusardi & Mitchell (2011b, p. 523) reach to a similar conclusion in a
research done for the USA. Namely, financial illiteracy has a negative effect on the financial
wellbeing of people after they retire. They argue that increasing financial literacy of the
population, especially those with low income, is of utmost importance. This would in turn
help them to have a stable retirement. Similar to research in other countries, Boisclair,
Lusardi & Michaud (2015, p. 16), conclude that financial literacy in Canada has an impact
on retirement planning, as financially literate individuals are more likely to plan for their
retirement. In Switzerland, people with higher level of financial literacy are more likely to
participate in a voluntary pension fund or invest in the stock market (Brown & Graf, 2013,
p. 17). In a research in the Netherlands, van Rooij, Lusardi & Alessie (2011b, pp. 604-605)
conclude that many households do not plan for retirement, but even in this case, financial
literacy increases the probability to do so.
It seems that in every country where there has been a research on this topic, there is a pattern
that is consistent. Financial literacy has a positive impact on retirement planning and the
financial wellbeing after retirement, even if in some countries like Sweden (Almenberg &
Säve-Söderbergh, 2011, p. 17-18) the impact is lower.
2 PENSION SYSTEM AND RETIREMENT SAVING IN THE
REPUBLIC OF NORTH MACEDONIA
2.1 General information about the Republic of North Macedonia
The Republic of North Macedonia is a landlocked country located in the southern part of the
Balkan Peninsula. It is the only country to have separated from Yugoslavia without
bloodshed, in 1991. According to a report by Eurostat (2020), the country has a population
of about 2.1 million, however, there has been no census since 2002, so it is very likely that
the number of people living in the country is significantly lower (Hopkins, 2020). If vaccines
help slow down the global pandemic, the country will conduct last year's postponed census
in 2021. The official language of the country is Macedonian, while Albanian is the co-
official language in the country. The official currency of the country is the Macedonian
Denar (MKD), which was pegged to the Deutsch Mark after independence and now to the
Euro (Jovanovic & Petreski, 2012, pp. 598-599).

14
2.2 The economy of the Republic of North Macedonia
After independence in 1991, the Republic of North Macedonia began to introduce a system
of its own national economy. The country has introduced a system of open market economy.
In the last decade of the last century, i.e. in the 1990s, the Republic of North Macedonia
faced major economic problems. During the transition period and the establishment of new
socio-economic conditions, the country suffered from poor estimations and setbacks in the
introduction of the market economy. The period was accompanied by very high inflation
and a significant decline in GDP (Petrevski, 2005). In addition to this, the country faced
many difficulties from outside, mostly from neighbouring countries. First of all, it was the
Greek trade embargo due to the country’s official name and flag. It had a significant,
negative impact on the development of the country (Mitevski, Moussa, Tevdovski,
Zarotiadis 2020, p. 4). Eventually, more than 20 years later, it led to the new official name
of the country, Republic of North Macedonia. A few years after the embargo, two other
important events occurred that had an impact on the country’s economy, the military conflict
in Kosovo and the influx of refugees into the country and an internal military crisis in the
country in 2001 (Radovanovik-Angjelkovska, 2014, p. 72). Finally, the most recent blockage
comes from the eastern neighbours, Bulgaria, who vetoed the start of the negotiations with
the European Union in 2020 (Peel, Hopkins & Hindley 2020).
Figure 6: Annual GDP growth rate of the Republic of North Macedonia
Source: The World Bank (2020a).
In Figure 6 we see the decline in GDP in the years after the independence, as well as during
the internal conflict in 2001, the 2007-08 financial crisis (1 year lag) and the European debt
crisis in 2012. The country’s economy had the highest growth in 2007 at 6.5%. According
to the International Monetary Fund (2020), the Republic of North Macedonia had the sixth
-8%
-6%
-4%
-2%
0%
2%
4%
6%
8%
19
91
19
92
19
93
19
94
19
95
19
96
19
97
19
98
19
99
20
00
20
01
20
02
20
03
20
04
20
05
20
06
20
07
20
08
20
09
20
10
20
11
20
12
20
13
20
14
20
15
20
16
20
17
20
18
20
19
15
lowest GDP per capita in Europe in 2019. The only countries with lower GDP per capita
were neighbours Albania and Kosovo, fellow EU candidate from the Balkans, Bosnia and
Herzegovina and Eastern European countries, Ukraine and Moldova.
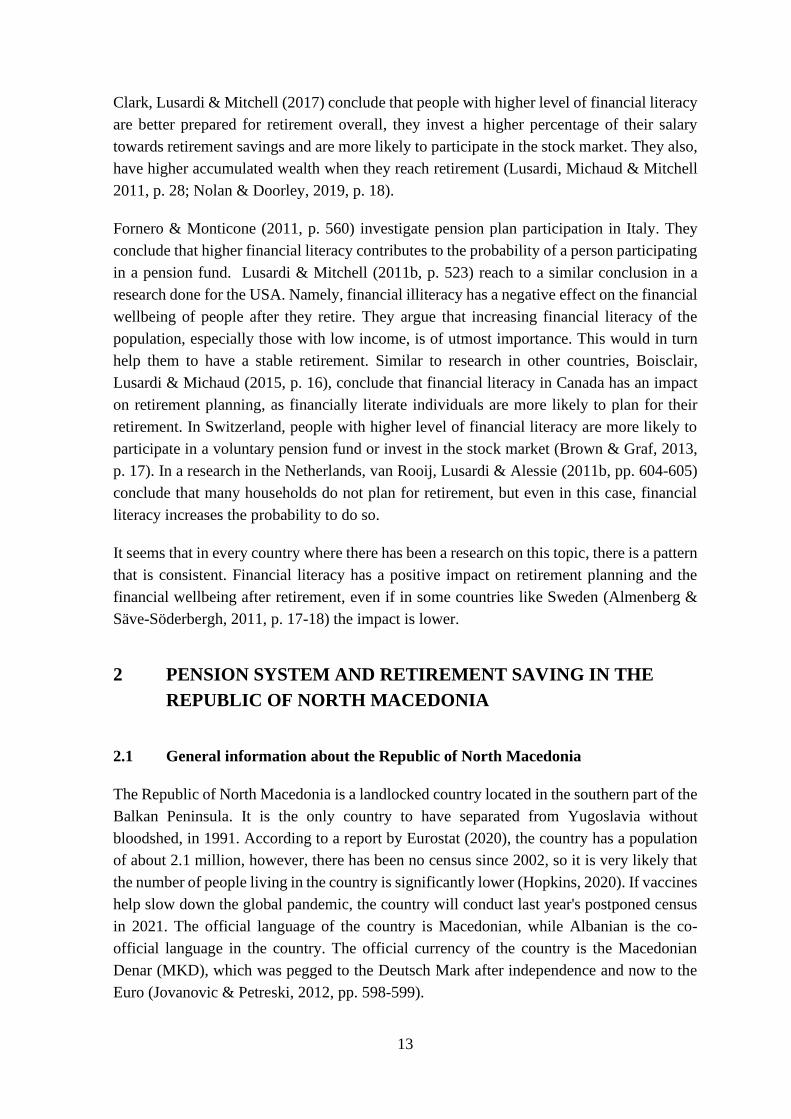
From the independence to the present day, the Republic of North Macedonia has had
consistently high unemployment rates, among the highest unemployment rates in Europe.
Since the peak in 2005, when the unemployment rate was 37.5%, we can observe a constant
downward trend, reaching a low of 16.4% in 2020 (The World Bank, 2020c).
Figure 7: Unemployment rate in the Republic of North Macedonia
Source: The World Bank (2020c).
2.3 Past research on financial literacy in the Republic of North Macedonia
The country has improved its overall adult literacy rate from 94% in 1994 to 98% in 2014,
which is the most recent data available (The World Bank, 2020b). Meanwhile, three separate
surveys have been conducted in the country to measure financial literacy and the results are
not so encouraging.
The Standard & Poor's Global Financial Literacy Survey showed alarming results worldwide
and a gap in financial literacy between developing and developed countries. In the case of
the Republic of North Macedonia, the gap is enormous when compared to the top performers
in the survey. People living in countries in Scandinavia perform best. In Denmark, Norway
and Sweden, 71% of the adult population is classified as financially literate, according to the
survey (Figure 8). Moreover, we can observe in the same graph that other developed
countries have above 50% of financially literate adults. None of the Balkan countries has
exceeded the 50% mark. Montenegro came close to this score with 48% of financially literate
adults. The EU members from the Balkans have above 40% financially literate adults, with
0%
5%
10%
15%
20%
25%
30%
35%
40%
19
91
19
92
19
93
19
94
19
95
19
96
19
97
19
98
19
99
20
00
20
01
20
02
20
03
20
04
20
05
20
06
20
07
20
08
20
09
20
10
20
11
20
12
20
13
20
14
20
15
20
16
20
17
20
18
20
19
20
20

16
the exception of Bulgaria which has 35%. North Macedonia has 21% of financially literate
adults, according to the survey. Neighbouring Kosovo and Albania are the only two countries
scoring lower in Europe. This shows a problem not only in the country but also in the region,
as Bulgaria and Tukey's results are not particularly impressive and Albania has the second
worst result with Afghanistan (14%), only one percentage point above the absolute worst
result of Yemen (Klapper, Lusardi & Oudheusden, 2017, pp. 23-25).
Figure 8: Share of financially literate adults among selected countries
Source: Klapper, Lusardi & Oudheusden (2017, p. 23-25).
The second survey to measure financial literacy in the country is the OeNB survey (Reiter
& Beckmann, 2018). The survey is based on three questions which measure knowledge of
interest rates, inflation and risk diversification (Lusardi & Mitchell, 2008). Score on the
survey is measured by number of correct answers.
Countries are ranked by the percentage of respondents who answered all three questions
correctly. In this ranking, the Republic of North Macedonia ranks 20th out of 25 countries
where the survey was conducted. The only lower scoring countries in Europe are, again
neighbouring Albania, another Western Balkan country, Bosnia and Herzegovina, Romania,
and Russia (Reiter & Beckmann, 2018, p. 44). Croatia and Serbia are ranked 18th and 19th
respectively. This is a similar pattern to the S&P survey and confirms a gap between
developed and developing countries, as well as a general problem, low level of financial
literacy in countries in the region.
A GFK (2018) survey based on the OECD methodology (explained in the first chapter) is
the third and most comprehensive measure of the level of financial literacy of the population
in the Republic of North Macedonia.
0%
10%
20%
30%
40%
50%
60%
70%
80%

17
Figure 9: Financial literacy score of selected countries
Source: GFK (2018, p. 26); Krstevska & Pavleska (2019, p. 5).
The country is at the bottom of the table based on the scores, as we can see in Figure 9,
which is consistent with previous surveys. Interestingly, Albania has a higher score, which
is on par with the G20 average. This contradicts the results of previous surveys. Croatia, on
the other hand, is just above the Republic North Macedonia, which is in line with the OeNB
survey. As the survey is based on the same methodology, it is comparable to the OECD G20
survey shown in Figure 5. Combining the data, Poland and Italy are the only European
countries with a lower score than the Republic of North Macedonia.
In all three surveys, the country has a consistently low score, however in a self-assessment
of financial literacy, only 8.2% of Macedonians gave themselves “somewhat low” and
11.6% “very low” scores (The alternative financial services association of North Macedonia,
2019).
2.4 The pension system in the Republic of North Macedonia
The Macedonian pension system was based on the principle of intergenerational solidarity,
where current contributions are used to finance current pensions (Uzunov, 2011, pp. 117-
120). In 2006, the system was reformed, and the principle of pension insurance was fully
introduced. In addition to the first, mandatory, pillar, two more, mandatory and voluntary
private pension pillars were added in 2008. As a result, today the structure of the pension
18
system in Macedonia consists of three pillars: the first pillar is mandatory and is still based
on the principle of intergenerational solidarity. The second is mandatory individually-
capitalized pension saving. The third pillar is similar to the second, but it is completely
voluntary. People can participate in only one of the mandatory pillars, while everyone can
participate in the third.
Compulsory pension and disability insurance based on generational solidarity (the first
pillar) is organized according to the principle of current financing (pay-as-you-go). This
means that current insured people pay for current retirees. This pillar operates on the
principle of defined pensions, which means that through it, pensions are provided according
to a predetermined formula that depends on the salary and the years of working experience
of the insured. This pillar ensures the realization of rights of the pension and disability
insurance in case of old age, disability, and death, which means that part of the old-age
pension is paid, then disability pension, family pension, as well as the lowest amount of
pension (Vuchev, 2009, p. 266).
The second, mandatory pillar for all people that have their first employment after the
beginning of the year 2003, differs drastically from the first pillar. Within the second pillar
each member has an individual account, on which all his assets are recorded, and which
enable connection and interdependence between the paid contributions and the future
pensions of the members. The pension is based on the accumulation of funds, monthly
mandatory payments, on individual accounts that are invested. The return on investment is
reduced by the operating fees set by the provider of the pension fund. The fees are regulated
by law. People with first employment before the year 2003, may also enter this pillar
voluntary. After reaching retirement age, the accumulated funds and returns are paid out as
monthly instalments (Uzunov, 2011, p. 118)
The third pillar, fully funded pension insurance of one’s own accord, is based on the
capitalization of assets according to the principle of defined contributions, but on a voluntary
basis. What is important for this pillar is that it can include all persons who want to have an
additional income stream after retirement in addition to the mandatory pension insurance. It
may also include all persons who are not covered by compulsory insurance (in the first and
second pillars), for example freelancers who do not participate in the mandatory pillars. In
addition, the third pillar enables the establishment and financing of professional pension
schemes. Each insured person can have a voluntary individual account in a voluntary pension
fund and a professional account in a voluntary pension fund. The funds are invested in
accordance with strictly defined legal requirements, which ensures the highest level of
protection for the interests of the insured and their assets. Members are regularly informed
about how and where their assets are invested, as well as about the return on investments
(Uzunov, 2011, p. 118).
19
The pension system of Northern Macedonia according to the Law on Pension and Disability
Insurance (Law on Pension and Disability Insurance, 1983) recognizes three types of
pensions:
• Old-age pension
• Family pension
• Disability pension
Today, the legal condition for receiving an old-age pension is that the person has reached
the age of 64 or 62 with at least 15 years of professional experience. In view of this, it is
necessary to emphasize that the government is currently considering some changes that
could increase the retirement age.
Only close relatives, a child, a spouse or a parent of a deceased person whom they supported
are entitled to a family pension. The amount of the pension is determined as a percentage of
the retirement or disability pension the member would have had at the time of death, as
follows: 70 percent for a family member, 10 percent for each additional dependent member,
but not more than 100 percent total.
Disability pension can be received as a result of an accident at work or occupational disease,
regardless of the length of retirement. It may also be received as a result of an accident
outside work or illness, provided that the person meets certain conditions relating to age and
years of service completed on the date the disability occurs. The amount of this pension is:
80 percent of the pension base if the disability was caused by an accident at work or an
occupational disease. The pension base depends on years of service and age if the invalidity
is caused by an accident outside work or an illness.
2.5 Sustainability of the pension system in the Republic of North Macedonia
Pension system reforms have been completed, but in Northern Macedonia, as in many other
Western European countries and in other countries around the world, there is a clear trend
towards an ageing population. This will most likely put a significant strain on the pension
system. According to the projections of United Nations, in 2050 the dependency of the adult
population (which includes people who have reached the age of 65) in Northern Macedonia
will be more than 45%. By comparison, in 2000, adult population dependency was only
about 15%. These major demographic changes indicate that a larger proportion of the
population will rely on the pension system in the future. As a result, the number of people
unable to meet all necessary living costs in old age will increase. Finance Think's research
provides data on the sustainability index of the pension system in the Republic of North
Macedonia (Petreski & Gacov, 2018).

20
Table 2: Pension sustainability index in Macedonia- elements
Sub-Index Weighting Indicators
Weighting of
indicators in the
subindex
Demographic
characteristics 0.3
Old-age dependency
ratio in 2010 0.200
Old-age dependency
ratio in 2050 0.400
Change 2010 - 2050 0.400
Pension system
design 0.35
Legal retirement age
for men 0.050
Effective retirement
age for men 0.075
Legal retirement age
for women 0.075
Effective retirement
age for women 0.075
Replacement rate 0.350
Coverage of
working age
population
0.350
Public finances 0.35
Pension
expenditures (% of
GDP)
0.333
Public debt (% of
GDP) 0.333
Transfers from the
central budget for
pensions (% of total
expenditures)
0.333
Source: Petreski & Gacov (2018, p. 15).
The index is constructed according to the methodology of the Allianz Pension
Sustainability Index (Allianz, 2020) and includes:
• selection of indicators,
• normalization,

21
• weighting and
• aggregation in one index.
The Allianz Index is published for 54 countries in the world, but not for North Macedonia.
The purpose of the index is to assess the trend of sustainability of the pension system in the
analysed period and to make a comparison with the pension systems of other countries.
Hence, this index will serve as a good comparison basis with the pension systems of other
countries. The index ranges from 1 to 10, where 1 indicates complete unsustainability and
10 indicates complete sustainability of the pension system (Petreski & Gacov, 2018). The
index is derived from three sub-indices (Table 2), based on demographic characteristics of
the country, the design of the pension system and the public finances of the country.
In the past two decades, the index of the pension system in Northern Macedonia has never
been higher than 5.60. Figure 10 shows the value of the index in the years from 2002 to
2016. The graph shows that the sustainability of the pension system improved from 2003 to
2008 according to the methodology of the Allianz Pension Sustainability Index, reaching the
highest value, 5.6 in 2008. After 2008, the index shows a significant decline. This decline is
caused by the increase in public spending on pension support as well as the increase in public
debt from one year to another. In 2016 the value of the index is just below 4.80 which is the
lowest measured value. According to the index, the pension system in the Republic of North
Macedonia has a low sustainability value, especially after the decline, similar to Greece and
Slovenia, and reforms of the system are necessary to improve sustainability (Petreski &
Gacov, 2018, pp. 15-16).
Figure 10: Pension sustainability index for the Republic of North Macedonia
Source: Petreski & Gacov (2018, p. 16).
The Centre for Economic Analysis (CEA) has conducted additional research on the
sustainability and conditions of the pension system. Compared to the previous research, this

22
research uses the support indicator and tries to analyse the available figures. The support
indicator indicates the ratio of the number of employees or insured persons compared to the
number of pensioners. In the case of North Macedonia, this indicator has increased
significantly from the lowest values recorded in the period between 2002 and 2006, but the
improvement has been slow, as shown in Figure 11. The slow pace can be attributed, on the
one hand, to the increase in the number of pensioners, a figure that is expected to rise in the
future as life expectancy increases, and, on the other hand, to the relatively moderate decline
in the unemployment rate in the country (Nikolov, Sukarov &Velkovska 2017, pp. 13-14).
Figure 11: Support indicator of the pension system
Source: Nikolov et al. (2017).
In contrast to the previous research, Nikolov, Sukarov, Velkovska (2017) conduct several
simulations to observe the level of sustainability of the pension system of the Republic of
North Macedonia in the long run. According to their simulations, the pension system is
sustainable in the long run (2030). After 2025-2026, the pension system starts to generate
surplus. The surplus is higher or lower depending on the projections of the variables used in
the authors' simulations. The most positive simulations are those that assume GDP growth
averaging 5% per year, indicating the need to find mechanisms to accelerate growth. The
pension system might be unsustainable without certain level of GDP growth.
It seems that different authors have different expectations about the future of the pension
system in the country. Given the uncertainty and the fact that disposable income decreases
after retirement, it would be wise for people to have an additional source of income after
retirement.

23
2.6 Saving and investment culture in the Republic of North Macedonia
Macedonians, as I mentioned earlier, do not have a habit of saving. In the above mentioned
survey conducted by The alternative financial services association of North Macedonia
(2019), only 21.7 % of the respondents answered that they save regularly. According to other
findings of the survey, more than half of the people (57%) have difficulty buying more
expensive items that are somewhat necessary for daily life (electronics, such as refrigerator
or a TV). A similar number of respondents (51%) have not used any financial services in the
last 3 years. According to the results of this survey, lack of, or low disposable income is the
main reason why very few people save regularly, with lack of knowledge or inclusion
coming at second place. Double digit unemployment rate and arguably low GDP growth
rate, at least for a developing country, will not be a catalyst for a change anytime soon.
GFK (2018) conducted a similar study to examine the level of awareness (i.e., whether they
have heard of the financial product) of the population with respect to selected financial
products. The results are presented in Figure 12. As we can see in the chart, most of the
population is familiar with basic products like loans, accounts, credit cards, etc. However,
less than 60% have heard of retirement products or stocks, only 45% have heard of bonds,
and less than a third have heard of mutual or trust funds.
Figure 12: Awareness of financial products (% of population)
Source: GFK (2018, p. 27).
The data from both surveys help explain why according to the Agency for Supervision of
Fully Funded Pension Insurance (2021) data, there are only 26 017 individual accounts in
the voluntary pension funds that form the third pillar of the pension system in the country,
at the end of 2020. This number is significantly less than 2% of the total population (note

24
that only people aged 15-70 can participate). On Figure 13 we can see a reasonably normal
distribution across age groups, with slightly more men than women participating. Out of the
26 thousand individual accounts almost 15 thousand are professional accounts, meaning that
employers have organized an additional pension insurance for their employees. This means
that only about 11 thousand people in the country, less than 1%, have thought of opening an
account and investing in the voluntary pension funds, to have an additional source of income
after retirement. Out of the total 26 thousand, individual accounts, only 835 were opened in
2020. An increase of 3.3% compared to the previous year. However, COVID -19 may have
had an impact here as many people were laid off or had their disposable income reduced.
Figure 13: Participants in the voluntary pension funds by age
Source: Agency for Supervision of Fully Funded Pension Insurance (2021, p. 35).
In addition to pension funds, there are 6 companies that offer an alternative investment
method, or investment funds in the Republic of North Macedonia. The amount of assets
under management in these funds is another confirmation of the low level of saving and
investing among the population in the country. According to the Securities and Exchange
Commission of the Republic North Macedonia, these funds had assets under management
of 145 million euros at the beginning of 2021. Of these KB audience manages more than
half in the 4 different funds they manage (Figure 14). Together with the second and third
largest funds in the country, WFP, and Generali respectively, they take 94% of the market
share. In comparison, NLB skladi, the largest asset manager in Slovenia, a more developed
country but comparable regarding size and population, has over 1 billion EUR assets under
management.

25
Figure 14: Market share of investment funds
Source: Securities and exchange commission of the Republic of North Macedonia (n.d).
3 METHODOLOGY
To answer the research questions and measure the level of financial literacy of citizens in
the Republic of North Macedonia I conduct a survey based on the questions used by van
Rooij, Lusardi & Alessie (2011b). Due to the circumstances in 2020, lockdowns,
recommendations to limit contact and similar measures enforced to stop the global spread of
COVID-19, I decided to conduct the survey online. I chose Google Forms, as the platform
to conduct the survey with. It is simple to use, mobile and user friendly, and there are
multiple formats supported to extract the final data once the survey is completed.
The Republic of North Macedonia has claimed to be the first country, other than countries
with significantly smaller territories (Vatican, Monaco, etc.), to have 95% of its population
covered by a wireless broadband network (Nairn, 2006). In 2005 USAID helped to achieve
this coverage and in the meantime, also reduced the cost of internet access by up to 75%. In
the beginning of 2020, the internet penetration in the Republic of Macedonia was 81%
(Kemp, 2020). Therefore, internet access would not be a problem to get a representative
sample of the population. However, I assumed that people aged 50 and older would be
underrepresented because they do not have the skills to participate in an internet survey. To
address this issue, I conducted additional telephone interviews.
3.1 Sample
Before distributing the questionnaire, I tested it to make sure that the questions were concise,
and all the possible answers were covered in the offered choices. The test was conducted
51%
26%
17%
5%
1% 0%
KB Publikum WFP Fund management Generali Ilirika Inovo Grawe

26
with 6 subjects, chosen to represent different age groups, level of education, gender and most
importantly both, people who had and had not studied or graduated in the field of economics.
I received valuable feedback regarding the questions and added options in couple of the
control questions accordingly. Compelling was the feedback I received from one of the
respondents in the testing phase, a person with a graduate degree in another field. He thinks
the questions designed for measuring financial literacy were not hard and he felt that he
should know the answers. However, his medical degree never provided him with the training
necessary to answer most of the questions correctly.
After the testing phase was complete, I decided to use the exponential non-discriminative
snowball sampling method to distribute the questionnaire. This is a method in which each
affiliate is asked to provide additional subjects or share the questionnaire forward to other
possible subjects (Goodman, 1961, p. 148). My goal was to collect at least 300 completed
questionnaires. I initially contacted approximately 150 subjects, of whom approximately 100
responded and confirmed that they had completed the questionnaire and provided additional
subjects or claimed to have forwarded the questionnaire themselves. Based on the feedback
and responses I received, I estimate that between 1200 and 1600 people, including 27
telephone surveys, were invited to complete the questionnaire. Of these, 746 completed and
returned the questionnaire in full.
Of these, 51.6% were female and 48.4% were male, which roughly corresponds to the actual
breakdown of the male and female population in the Republic of North Macedonia, 50.1%
male and 49.9% female (State Statistical Office, n.d.).
Figure 15: Share of respondents by gender
Source: Own work.
Most of respondents, just over one third of the total, were between 25 and 34 years old. The
second largest group or about one fifth of the respondents were between 35 and 44 years old.
The age groups 18-24 years, 45-54 years, and 55-64 years each had between 12% and 14%
Female Male

27
of the total respondent. This would sum up to about 100 respondents per group. This means
that each group is sufficiently represented in the sample. The remaining eight respondents
were 65 years or older and are already retired and therefore were not included in further
analysis. Along with them, another 4 respondents who are already retired but younger than
65 years were also excluded from the analysis. As it is evident in Figure 16, the sample is a
good representation of the population in the country.
Figure 16: Share of respondents by age group
Source: Own work.
More than half of the respondents live in the two largest cities in the country, Skopje, the
capital, and Bitola, the second largest city. The rest of the respondents are distributed among
few of the larger cities in the country, such as Kumanovo, Tetovo, Prilep, Ohrid, Shtip, and
almost 15% are from smaller towns and rural areas. Eight percent of the respondents are
currently living abroad. Similar to the already retired respondents, they are excluded from
further analysis. The sample is a good representation of the population. As shown in Table
3 only people living in the second largest city, Bitola are overrepresented.
Unfortunately, I could not find any relevant source regarding the educational level of the
population in the Republic of Macedonia. The State Statistical Office - Education and
Science Sector, provides annual data on the number of students enrolled in universities and
the number of students in primary and secondary schools. Due to limitations with the COVID
-19 pandemic and the snowball method used to maximize the number of respondents, about
70% of respondents have a university degree or higher education. Although there is no
official data, I can speculate that this is not an accurate representation of the population.
However, further analysis of the impact of financial literacy on retirement planning will take
this into account as education level is included as an independent variable.
0%
5%
10%
15%
20%
25%
30%
35%
40%
45%
18-24 25-34 35-44 45-54 55-65 66+
Sample Country

28
Table 3: Share of respondents by place of residence
Place of residence Number of respondents Share in sample Share in country
Bitola 253 34% 4%
Skopje 156 21% 25%
Other city or rural area 98 13% n.a
I live abroad 60 8% n.a
Kumanovo 48 6% 4%
Prilep 41 5% 3%
Ohrid 32 4% 2%
Shtip 31 4% 2%
Tetovo 27 4% 3%
Source: Own work.
Lusardi & Mitchell (2011, p. 5) had a similar problem in their research on the effect of
financial literacy on retirement planning, with the addition that most of their respondents
were high earners. They concluded that the general level of financial literacy among the
population will be overestimated. I agree with their conclusion, therefore my estimate of the
overall financial literacy in the Republic of North Macedonia will also be higher compared
to a more representative sample. The rest of the respondents, around 30% have completed
secondary school (around 28%) or lower (less than 1%).
Figure 17: Share of respondents by highest level of completed education
Source: Own work.
Bachelor's degree Secondary eduction
Master's degree PhD
Primary education or lower

29
Three factors contribute to the very low number of respondents who have completed less
than secondary school. First, secondary school is mandatory in the Republic of North
Macedonia (Law for Secondary School, 1995). Also, the survey was conducted online,
increasing the likelihood that a person with less than a secondary education would have
difficulty accessing and completing the survey. Finally, as mentioned earlier, due to the lack
of data, I would speculate that the majority of individuals living in the country with less than
a secondary education are either nearing retirement or have already retired.
Nearly three-quarters of the respondents are employed full time, while slightly less than 8%
are either part-time employees (3.2%) or freelancers (4.3%). The number of freelancers in
the country is increasing recently as more young adults either emigrate from the country or
choose to work remotely for a foreign company. More than 8% of the respondents are
unemployed, while in the country the number is 16.5% (State statistical office, 2020).
Finally, almost 9% of the respondents were students and about 1% were retired.
Figure 18: Share of respondents by employment status
Source: Own work.
Almost half of the respondents have an average monthly net income between 15 and 30
thousand MKD. This range is slightly above the minimum net salary and slightly above the
average net salary in the country. About 9% have a monthly net income of up to 15 thousand
MKD, which means they get by on the minimum salary or less than the minimum salary
(there are certain exceptions in the law that allow employers to pay lower than minimum
salary to employees). Almost 14% of respondents have no monthly income and are
dependent on other family members. One third of the respondents have a monthly net income
that is above the average salary in the country, out of them 14% earn more than 50 thousand
MKD per month.
Employed, full time Student Unemployed
Freelancer Employed, part time Retired

30
Figure 19: Share of respondents by average net monthly income
Source: Own work.
3.2 Questionnaire
To measure the financial literacy of the population in the Republic of North Macedonia I
used a set of questions that van Rooij, Lusardi & Alessie (2011b) compiled and used to
measure financial literacy in the Netherlands. The questions are divided into three sections,
first the demographic questions, in the second section are five financial literacy questions
and in the last section are the advanced financial literacy questions. The questions have been
adapted for use in the Republic of North Macedonia, for example currency, but the essence
of the questions has not been changed. To avoid bias, the questions were translated in
Macedonian language.
The questions in the same format as in the questionnaire can be found in Appendix 2, English
language and Appendix 3, Macedonian language.
4 RESEARCH AND FINDINGS
4.1 Basic financial literacy in the Republic of North Macedonia
Since the goal is to assess the financial literacy of people in the Republic of North Macedonia
and then examine whether it affects retirement planning, I have decided, as mentioned
earlier, to exclude people who are already retired and those living abroad from further
analysis. These exclusions reduce the sample size from 746 to 674, or 60 excluded
respondents who live abroad and 12 excluded respondents who are already retired.
I have no monthly income up to 15,000 MKD 15,001 - 30,000 MKD
30,001 - 50,000 MKD more than 50,001 MKD

31
The basic financial literacy of the population is determined by the responses to the second
section of the survey, i.e. questions 12 to 16. These questions focus on basic economic
concepts that people encounter in their daily lives, such as inflation and interest rates. Every
correct answer is marked with one point. The required threshold to consider a person
possesses basic financial literacy is four points, or four correct answers.
The first question in this section is a purely mathematical question to assess the numeracy
skills of the respondents. As we can see in Figure 20, only 71% of the respondents gave a
correct answer to this question. This means that almost one third of the respondents have
difficulties with calculating percentages.
The second question required respondents to consider compound interest. The percentage of
incorrect answers more than doubled compared to the numeracy question, from 18% to 39%.
Slightly less than half (49.5%) gave the correct answer. As shown in the previous chapter, a
significant proportion of the country's population do not save regularly or have sufficient
disposable income to do so. For this reason, they probably had neither the need nor the
opportunity to use an instrument where the concept of compound interest becomes practical.
The third question in the basic financial literacy section relates to inflation. About 57% of
the respondents gave a correct answer to this question. It is worth noting that if we include
only respondents aged 45 and older, the percentage of correct answers increases significantly
to 65%, while only 38% of adults younger than 25 answered correctly. This could be due to
the fact that older people experienced periods of high inflation in Yugoslavia and the early
years of North Macedonia's independence.
Figure 20: Responses on basic financial literacy questions, % of total
Source: Own work.
0%
10%
20%
30%
40%
50%
60%
70%
80%
Numeracy Interestcompounding
Inflation Time value ofmoney
Money illusion
Correct Don't know Incorrect
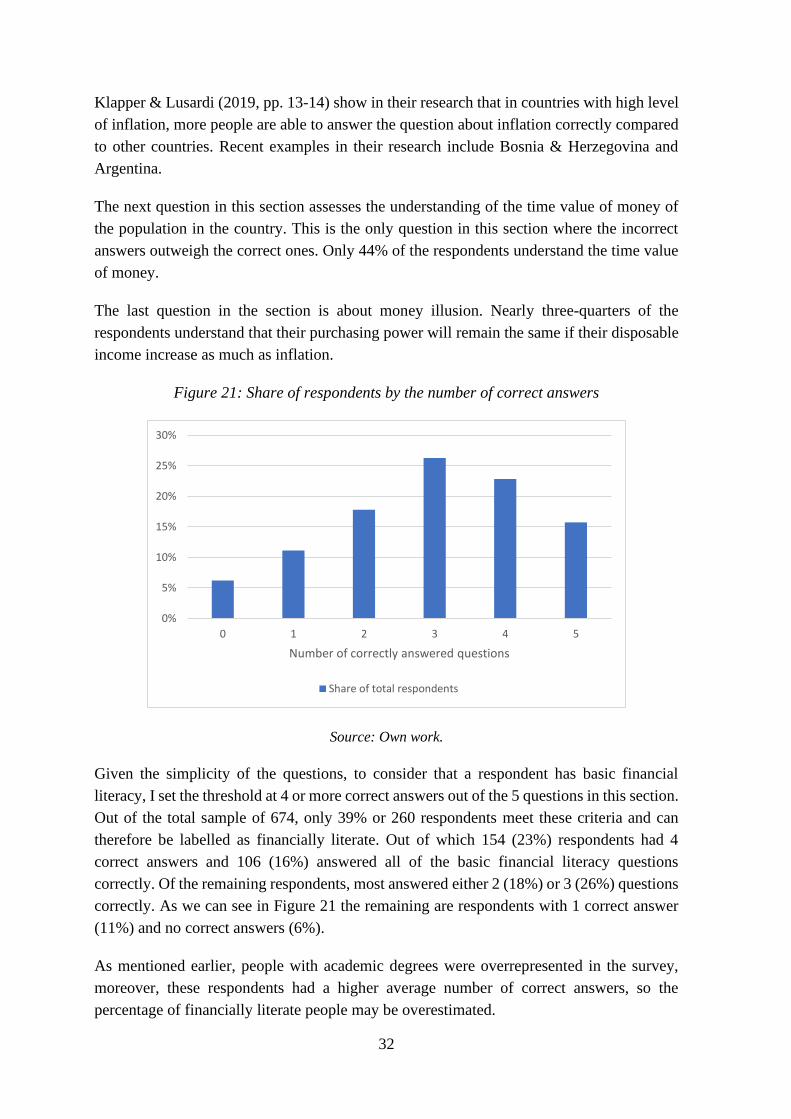
32
Klapper & Lusardi (2019, pp. 13-14) show in their research that in countries with high level
of inflation, more people are able to answer the question about inflation correctly compared
to other countries. Recent examples in their research include Bosnia & Herzegovina and
Argentina.
The next question in this section assesses the understanding of the time value of money of
the population in the country. This is the only question in this section where the incorrect
answers outweigh the correct ones. Only 44% of the respondents understand the time value
of money.
The last question in the section is about money illusion. Nearly three-quarters of the
respondents understand that their purchasing power will remain the same if their disposable
income increase as much as inflation.
Figure 21: Share of respondents by the number of correct answers
Source: Own work.
Given the simplicity of the questions, to consider that a respondent has basic financial
literacy, I set the threshold at 4 or more correct answers out of the 5 questions in this section.
Out of the total sample of 674, only 39% or 260 respondents meet these criteria and can
therefore be labelled as financially literate. Out of which 154 (23%) respondents had 4
correct answers and 106 (16%) answered all of the basic financial literacy questions
correctly. Of the remaining respondents, most answered either 2 (18%) or 3 (26%) questions
correctly. As we can see in Figure 21 the remaining are respondents with 1 correct answer
(11%) and no correct answers (6%).
As mentioned earlier, people with academic degrees were overrepresented in the survey,
moreover, these respondents had a higher average number of correct answers, so the
percentage of financially literate people may be overestimated.
0%
5%
10%
15%
20%
25%
30%
0 1 2 3 4 5
Number of correctly answered questions
Share of total respondents
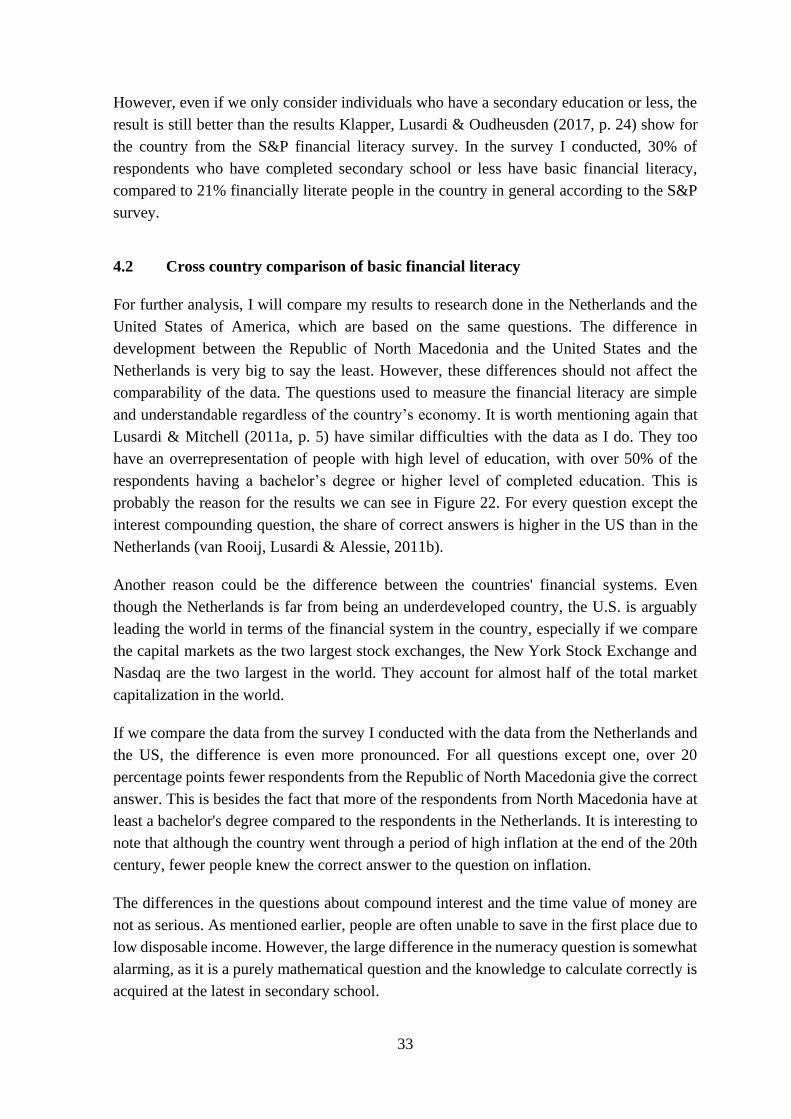
33
However, even if we only consider individuals who have a secondary education or less, the
result is still better than the results Klapper, Lusardi & Oudheusden (2017, p. 24) show for
the country from the S&P financial literacy survey. In the survey I conducted, 30% of
respondents who have completed secondary school or less have basic financial literacy,
compared to 21% financially literate people in the country in general according to the S&P
survey.
4.2 Cross country comparison of basic financial literacy
For further analysis, I will compare my results to research done in the Netherlands and the
United States of America, which are based on the same questions. The difference in
development between the Republic of North Macedonia and the United States and the
Netherlands is very big to say the least. However, these differences should not affect the
comparability of the data. The questions used to measure the financial literacy are simple
and understandable regardless of the country’s economy. It is worth mentioning again that
Lusardi & Mitchell (2011a, p. 5) have similar difficulties with the data as I do. They too
have an overrepresentation of people with high level of education, with over 50% of the
respondents having a bachelor’s degree or higher level of completed education. This is
probably the reason for the results we can see in Figure 22. For every question except the
interest compounding question, the share of correct answers is higher in the US than in the
Netherlands (van Rooij, Lusardi & Alessie, 2011b).
Another reason could be the difference between the countries' financial systems. Even
though the Netherlands is far from being an underdeveloped country, the U.S. is arguably
leading the world in terms of the financial system in the country, especially if we compare
the capital markets as the two largest stock exchanges, the New York Stock Exchange and
Nasdaq are the two largest in the world. They account for almost half of the total market
capitalization in the world.
If we compare the data from the survey I conducted with the data from the Netherlands and
the US, the difference is even more pronounced. For all questions except one, over 20
percentage points fewer respondents from the Republic of North Macedonia give the correct
answer. This is besides the fact that more of the respondents from North Macedonia have at
least a bachelor's degree compared to the respondents in the Netherlands. It is interesting to
note that although the country went through a period of high inflation at the end of the 20th
century, fewer people knew the correct answer to the question on inflation.
The differences in the questions about compound interest and the time value of money are
not as serious. As mentioned earlier, people are often unable to save in the first place due to
low disposable income. However, the large difference in the numeracy question is somewhat
alarming, as it is a purely mathematical question and the knowledge to calculate correctly is
acquired at the latest in secondary school.
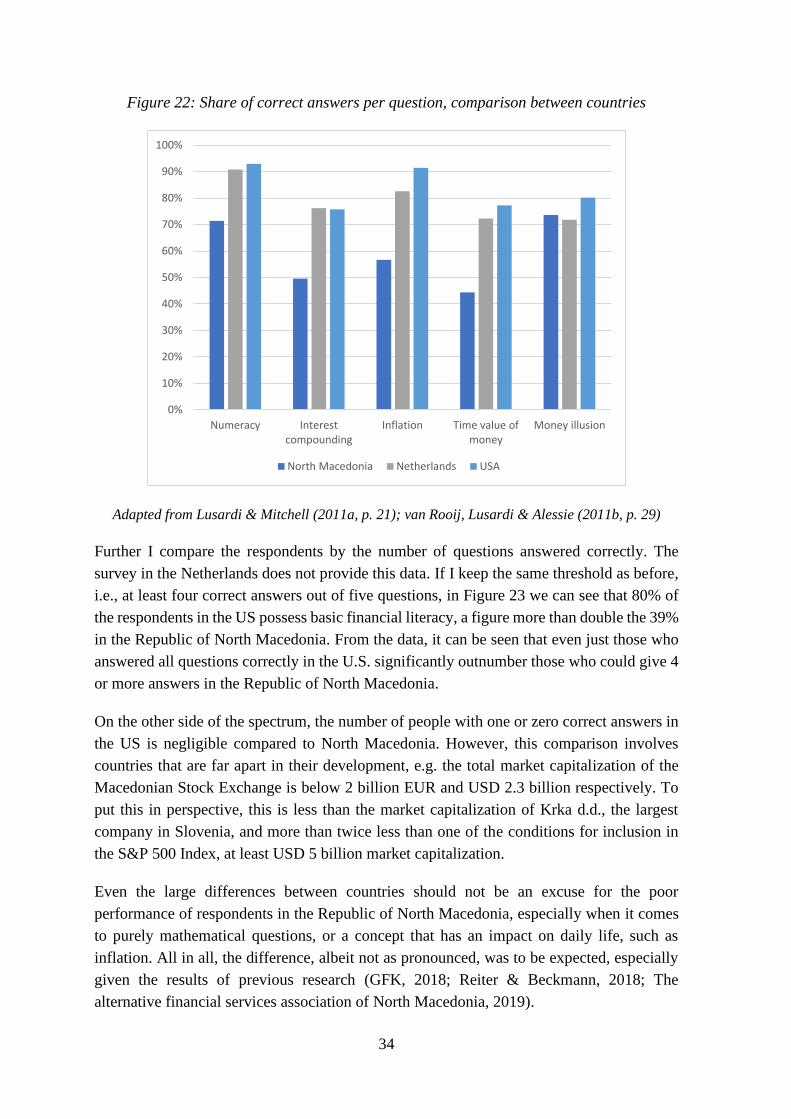
34
Figure 22: Share of correct answers per question, comparison between countries
Adapted from Lusardi & Mitchell (2011a, p. 21); van Rooij, Lusardi & Alessie (2011b, p. 29)
Further I compare the respondents by the number of questions answered correctly. The
survey in the Netherlands does not provide this data. If I keep the same threshold as before,
i.e., at least four correct answers out of five questions, in Figure 23 we can see that 80% of
the respondents in the US possess basic financial literacy, a figure more than double the 39%
in the Republic of North Macedonia. From the data, it can be seen that even just those who
answered all questions correctly in the U.S. significantly outnumber those who could give 4
or more answers in the Republic of North Macedonia.
On the other side of the spectrum, the number of people with one or zero correct answers in
the US is negligible compared to North Macedonia. However, this comparison involves
countries that are far apart in their development, e.g. the total market capitalization of the
Macedonian Stock Exchange is below 2 billion EUR and USD 2.3 billion respectively. To
put this in perspective, this is less than the market capitalization of Krka d.d., the largest
company in Slovenia, and more than twice less than one of the conditions for inclusion in
the S&P 500 Index, at least USD 5 billion market capitalization.
Even the large differences between countries should not be an excuse for the poor
performance of respondents in the Republic of North Macedonia, especially when it comes
to purely mathematical questions, or a concept that has an impact on daily life, such as
inflation. All in all, the difference, albeit not as pronounced, was to be expected, especially
given the results of previous research (GFK, 2018; Reiter & Beckmann, 2018; The
alternative financial services association of North Macedonia, 2019).
0%
10%
20%
30%
40%
50%
60%
70%
80%
90%
100%
Numeracy Interestcompounding
Inflation Time value ofmoney
Money illusion
North Macedonia Netherlands USA

35
Figure 23: Basic financial literacy, comparison between countries
Source: Own work.
4.3 Advanced financial literacy in the Republic of North Macedonia
To assess the advanced financial literacy in the country, I review the answers to the 10
questions from the third section of the survey. These questions have an increased level of
difficulty compared to the basic financial literacy questions. In the survey, these are the
questions numbered 17 to 26.
In Figure 24, we can see that only two of the ten questions had more than half of the
respondents answering correctly. About 61% of the respondents know the main function of
the stock market, which was the first question in this section. While three quarters of the
respondents (75%) understand that when they buy shares of a company, they are effectively
a partial owner of the company. This was the second question in this section and the one
most often answered correctly.
More than 40% of the respondents gave correct answers to two other questions in this
section. About 42% (5th question in this section) know that stocks usually provide the
highest returns over a long period of time. A similar number of respondents, 41% understand
that equity is riskier than debt, therefore also understand that stocks are riskier than bonds
(8th question in this section).
There are two questions in this section that relate to mutual funds. In the previous chapter, I
showed that the majority of people in the country generally do not have enough disposable
income to save regularly. Also, I showed that the mutual funds in the country are not very
large on a global scale. All of the mutual funds in the country combined have a total of 145
million EUR in assets under management.
0%
5%
10%
15%
20%
25%
30%
35%
40%
45%
50%
0 1 2 3 4 5
Number of correctly answered questions
North Macedonia USA
36
Figure 24: Responses on advanced financial literacy questions
Source: Own work.
Therefore, the results on these questions are somewhat as expected. About 32% of the
respondents could select the correct statement that mutual funds can invest in different assets
(3rd question in this section). Slightly more of the respondents (34%) understand that
investing in a mutual fund is less risky than investing in an individual company (9th question
0% 10% 20% 30% 40% 50% 60% 70% 80% 90% 100%
Which of the following statements describes themain function of the stock market?
Which of the following statements is correct? Ifsomebody buys the stock of firm B in the stock
market:
Which of the following statements is correct?
What happens if somebody buys a bond of firm B?
Considering a long time period (for example 10 or 20years), which asset normally gives the highest return?
When an investor spreads his money among differentassets, does the risk of losing money:
If you buy a 10-year bond, it means you cannot sell itafter 5 years without incurring a major penalty. True
or false?
Stocks are normally riskier than bonds. True or false?
Buying a company stock usually provides a saferreturn than a stock mutual fund. True or false?
If the interest rate falls, what should happen to bondprices?
Corrrect Don't know Incorrect

37
in this section). Another question on risk is the 6th question where 30% of the respondents
gave a correct answer while the rest of the respondents are not aware that spreading the
investments among multiple assets reduces the overall risk. The remaining three questions
in this section are all related to bonds. More than two-thirds of respondents, or 72%, do not
know that bonds are a debt instrument (4th question in this section). Even fewer know that
bonds can be traded and that it is not necessary to hold a bond to maturity (7th question in
this section). Finally, on the most complex question, the relationship between interest rates
and bond prices, only 14% of respondents answered correctly (10th question in this section).
There is a positive trend to be observed in the results. Respondents are aware of their lack
of knowledge on certain topics, so on most of the questions, “do not know" answers
predominate wrong answers. Some psychologists say that awareness is the first step to
change. The verbal feedback I received from respondents followed the same trend. For the
most part, respondents that gave oral feedback on the difficulty of the questions were aware
of the need to change and expressed an interest in learning more about the topics covered in
the survey and finance in general. However, a survey will definitely not solve the problem.
Country wide, planned actions, as well as economic growth and increase of the disposable
income of the population, are more likely to help in the future. If I use the same threshold as
the basic financial literacy assessment, 80% correct answers, then a respondent would have
to answer eight out of ten questions correctly. If I stick with this threshold, very few of the
respondents would be considered to possess advanced financial literacy. In fact, less than
6% of respondents meet this threshold, and only 5 out of 674 respondents answered all
questions correctly (Figure 25).
Figure 25: Number of correct answers to advanced financial literacy questions
Source: Own work.
Since the questions are significantly more challenging than the basic financial literacy
questions, lowering the threshold to 6 out of 10 correct answers would be fair. Slightly more
than a quarter of respondents achieved this score. However, to reach a higher level of
0%
2%
4%
6%
8%
10%
12%
14%
16%
18%
0 1 2 3 4 5 6 7 8 9 10
Number of correctly answered questions
Share of total respondents

38
financial literacy, a person must first have basic financial literacy. Only 16% of respondents
meet both conditions, i.e. at least four correct answers to the basic financial literacy questions
and at least six correct answers to the advanced financial literacy questions. We can assume
that they possess an advanced level of financial literacy and understand more than just the
basic concepts.
4.4 Cross country comparison of advanced financial literacy
Figure 26: Share of correct answers per question, comparison between countries
Adapted from Lusardi & Mitchell (2011a, p. 22); van Rooij, Lusardi & Alessie. (2011b, p. 30)
0% 10% 20% 30% 40% 50% 60% 70% 80% 90% 100%
Which of the following statements describes themain function of the stock market?
Which of the following statements is correct? Ifsomebody buys the stock of firm B in the stock
market:
Which of the following statements is correct?
What happens if somebody buys a bond of firm B?
Considering a long time period (for example 10 or20 years), which asset normally gives the highest
return?
When an investor spreads his money amongdifferent assets, does the risk of losing money:
If you buy a 10-year bond, it means you cannot sellit after 5 years without incurring a major penalty.
True or false?
Stocks are normally riskier than bonds. True orfalse?
Buying a company stock usually provides a saferreturn than a stock mutual fund. True or false?
If the interest rate falls, what should happen tobond prices?
North Macedonia Netherlands USA

39
In Figure 26, we can see that similar to the basic financial literacy questions, respondents
from North Macedonia are lagging behind on all but one question. The gap is even more
pronounced than for the financial literacy questions. For many of the questions, specifically
five out of seven for which data is available for both North Macedonia and the U.S., the
proportion of respondents with correct answers in the U.S. is at least twice the proportion of
correct answers in North Macedonia.
Data for the US is incomplete as this survey was conducted with fewer questions in this
section.
4.5 Financial literacy in the Republic of North Macedonia by demographic
characteristics
So far, I have shown that the financial literacy is low among the population in the country.
Before conducting further analysis, I examine the effects of the demographic characteristics
on the number of correctly answered questions. To determine whether the means in different
demographic categories are different and the difference is statistically significant I use one
way analysis of variance, or ANOVA.
Figure 27: Comparison between selected sample for further analysis and total sample
Source: Own work.
First, I examine the average scores of the total sample I use for the analysis and the excluded
respondents. For the 5 questions on basic financial literacy, the 674 respondents gave an
average of 2.96 correct answers, slightly less than 60%. As expected, the advanced financial
literacy questions were more difficult for respondents, giving an average of 3.79 correct
answers, or less than 40% of 10 questions. Before proceeding with the analysis, for
comparison as shown in Figure 27, I note that when I include respondents living abroad and
0
1
2
3
4
5
Sample without retired/living abroad Total sample
Basic financial literacy Advanced financial literacy

40
retired respondents, there is only a small increase in the number of correct basic financial
literacy questions, or 0.01 additional correct answers on average. For the advanced
questions, there is a slightly larger increase in the number of average correct answers, or an
increase from 3.79 to 3.85. However, 88% of the respondents who live abroad and 66% of
the respondents who are already retired have a university degree or higher level of education.
Therefore, the increase in average correct answers is logical.
The average number of correct answers varies by gender. Male respondents give a higher
average number of correct answers than female respondents. The difference is more
pronounced and statistically significant for the basic financial literacy questions, as can be
seen in Table 4. There does not appear to be a statistically significant difference between the
average correct answers by gender for the advanced financial literacy questions.
Table 4: Analysis of variance by gender
Basic financial literacy
Gender Mean Std. dev. Min. Max. Obs.
Female 2.81 1.37 0 5 354
Male 3.12 1.47 0 5 320
Advanced financial literacy
Gender Mean Std. dev. Min. Max. Obs.
Female 3.71 2.27 0 10 354
Male 3.88 2.30 0 10 320
p-value independent t- test basic financial literacy 0.002
p-value independent t- test advanced financial literacy 0.168 Source: Own work.
There is a difference between the average correct answers when we consider the age groups
of the respondents. There does not seem to be a pattern in these differences. Respondents
who are 55 years old or older appear to be outliers and have the fewest average correct
answers along with respondents aged 18-24. Respondents who are between 25 and 34 years
old are on the other side of the spectrum and have the most correct answers on average for
both basic and advanced financial literacy questions. The analysis of variance test shows
with 99% confidence that there is a statistically significant difference between the mean
scores of the age categories shown in Table 5.
Given the fact that the country gained independence in the late 20th century and began the
transition from communism to democracy, the results are not surprising. Complex banking
products were not available, people did not have access to capital markets, and most of the
companies were owned by the public sector. After gaining independence, the country faced
high unemployment rates and high inflation, while most people who were actually employed
had barely any disposable income left to save. As a result, most of the older adults living in
the country never had the incentive to improve their financial literacy.

41
Table 5: Analysis of variance by age
Basic financial literacy
Age Mean Std. dev. Min. Max. Obs.
18-24 2.61 1.42 0 5 89
25-34 3.21 1.28 0 5 239
35-44 2.59 1.43 0 5 152
45-54 3.12 1.40 0 5 95
55+ 3.07 1.60 0 5 99
Advanced financial literacy
Age Mean Std. dev. Min. Max. Obs.
18-24 3.56 2.19 0 10 89
25-34 4.30 2.46 0 10 239
35-44 3.24 2.11 0 8 152
45-54 3.78 2.11 0 8 95
55+ 3.64 2.12 0 10 99
p-value ANOVA basic financial literacy 0.000
p-value ANOVA advanced financial literacy 0.000 Source: Own work.
The level of education completed correlates positively with the number of average correct
answers. Respondents who have completed only primary education give the fewest correct
answers on average. The number of average correct answers for both basic and advanced
questions increases with each additional level of education completed.
Table 6: Analysis of variance by education
Basic financial literacy
Education Mean Std. dev. Min. Max. Obs.
Primary school 1.75 1.22 0 3 5
Secondary school 2.62 1.44 0 5 199
Bachelor's 3.09 1.39 0 5 330
Master's 3.10 1.40 0 5 112
PhD 3.39 1.42 0 5 28
Advanced financial literacy
Education Mean Std. dev. Min. Max. Obs.
Primary school 2.75 2.60 0 7 5
Secondary school 3.03 1.93 0 8 199
Bachelor's 4.04 2.26 0 10 330
Master's 4.44 2.54 0 10 112
PhD 3.75 2.44 0 10 28
p-value ANOVA basic financial literacy 0.000
p-value ANOVA advanced financial literacy 0.000 Source: Own work.
The only deviation from this trend is a decrease in the average number of correct answers on
the advanced financial literacy questions for respondents who have a doctorate degree

42
compared to respondents who have completed a master's degree. However, this can be
explained by the field of education. A higher proportion of respondents who have a master's
degree have a degree in economics than respondents who have a doctorate degree. The
analysis of variance confirms that the observed differences are statistically significant.
Respondents who had a finance class in high school gave more correct answers, on average,
than respondents who never had any education regarding finance in their lives. In addition,
respondents who took a workshop, online course, or seminar in finance gave more correct
answers on average than respondents who had a finance class in high school. This could be
because people have to take an action to enrol in an online course, for example. They may
have to pay an enrolment fee, so the incentive to learn could be higher. A finance class in
high school might have been mandatory and taken a long time ago, and respondents might
have had fewer motives to take something away from it, or the knowledge gained might have
been lost over time. Finally, as expected, individuals who have a college degree or are
currently studying economics or finance score the highest on average. The statistical analysis
proves once again that the difference between the categories is significant.
Table 7: Analysis of variance by finance education
Basic financial literacy
Finance education Mean Std. dev. Min. Max. Obs.
Never 2.74 1.47 0 5 271
In high school 2.85 1.35 0 5 178
Workshop/online course/ seminar 3.13 1.46 0 5 101
Degree or study economics 3.44 1.29 0 5 124
Advanced financial literacy
Finance education Mean Std. dev. Min. Max. Obs.
Never 2.95 1.96 0 9 271
In high school 3.58 1.99 0 9 178
Workshop/online course/ seminar 4.03 2.14 0 9 101
Degree or study economics 5.74 2.26 0 10 124
p-value ANOVA basic financial literacy 0.000
p-value ANOVA advanced financial literacy 0.000 Source: Own work.
Finally, when analysing the average scores by socio-demographic characteristics, I find that
there are significant differences when I divide the respondents by monthly income.
Respondents in categories with monthly income up to 30,000 MKD, which is approximately
the average monthly salary in the country, have similar scores. Respondents with salary
above the mentioned threshold have significantly better and above average scores. This
means that they have more correct answers on average and are therefore more likely to be
financially literate. The differences are statistically significant, as confirmed by the analysis
of variance.
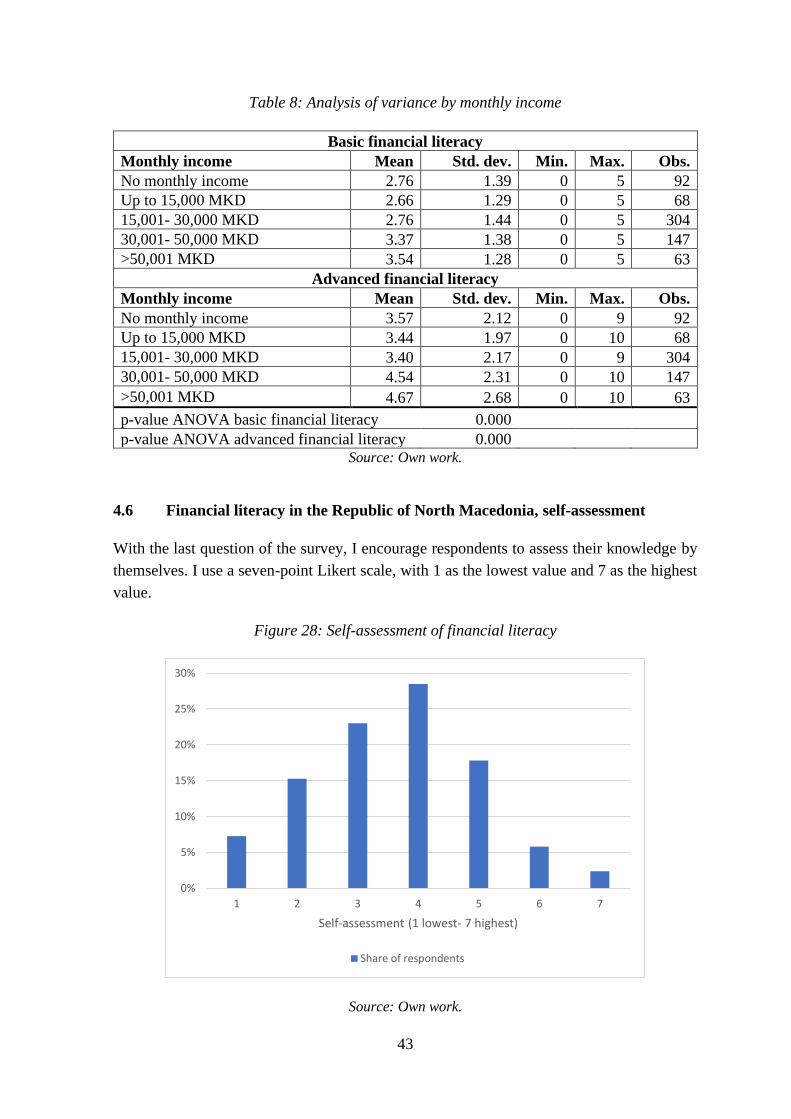
43
Table 8: Analysis of variance by monthly income
Basic financial literacy
Monthly income Mean Std. dev. Min. Max. Obs.
No monthly income 2.76 1.39 0 5 92
Up to 15,000 MKD 2.66 1.29 0 5 68
15,001- 30,000 MKD 2.76 1.44 0 5 304
30,001- 50,000 MKD 3.37 1.38 0 5 147
>50,001 MKD 3.54 1.28 0 5 63
Advanced financial literacy
Monthly income Mean Std. dev. Min. Max. Obs.
No monthly income 3.57 2.12 0 9 92
Up to 15,000 MKD 3.44 1.97 0 10 68
15,001- 30,000 MKD 3.40 2.17 0 9 304
30,001- 50,000 MKD 4.54 2.31 0 10 147
>50,001 MKD 4.67 2.68 0 10 63
p-value ANOVA basic financial literacy 0.000
p-value ANOVA advanced financial literacy 0.000 Source: Own work.
4.6 Financial literacy in the Republic of North Macedonia, self-assessment
With the last question of the survey, I encourage respondents to assess their knowledge by
themselves. I use a seven-point Likert scale, with 1 as the lowest value and 7 as the highest
value.
Figure 28: Self-assessment of financial literacy
Source: Own work.
0%
5%
10%
15%
20%
25%
30%
1 2 3 4 5 6 7
Self-assessment (1 lowest- 7 highest)
Share of respondents

44
Similar to the questions on advanced financial literacy, where the proportion of "do not
know" responses was significant, respondents seem to be aware of their knowledge or lack
of knowledge, so they were not overconfident in their self-assessment. The responses follow
a reasonably normal distribution, with a greater proportion of respondents assigning
themselves a lower grade.
When I compare the performance on the advanced financial literacy questions with the self-
assessed level of financial literacy in Figure 29, it is clear that, on average, respondents were
indeed unbiased. The majority of those who assigned themselves the lowest grades, 1 or 2,
had the lowest number of correct answers. Those who gave themselves more neutral grades,
between 3 and 5, mostly scored in the middle range or had between 3 and 5 correct answers.
And with each higher grade, the number of people who scored in the top third increased and
the number of people who scored in the bottom third decreased. Finally, most people who
assigned themselves the two highest grades, 6 or 7, had scores that belonged in the top third,
or 6+ correct answers.
Figure 29: Performance by self-assessment grades
Source: Own work.
4.7 Retirement planning in the Republic of North Macedonia
To determine respondents' views on retirement and whether or not they are preparing for it,
I use three questions in the first section of the survey that are similar to questions used in
previous research by various authors (Fornero & Monticone, 2011; Lusardi & Mitchell,
2011a; van Rooij, Lusardi & Alessie, 2011b; Boisclair, Lusardi & Michaud, 2015).
The first of these three questions focus on whether individuals have thought about their
finances after retirement. I use a four-point Likert scale to force individuals to make a choice
0
10
20
30
40
50
60
70
80
90
100
1 2 3 4 5 6 7
Self-assessment (1 lowest- 7 highest)
0-2 correct answers 3-5 correct answers 6+ correct answers
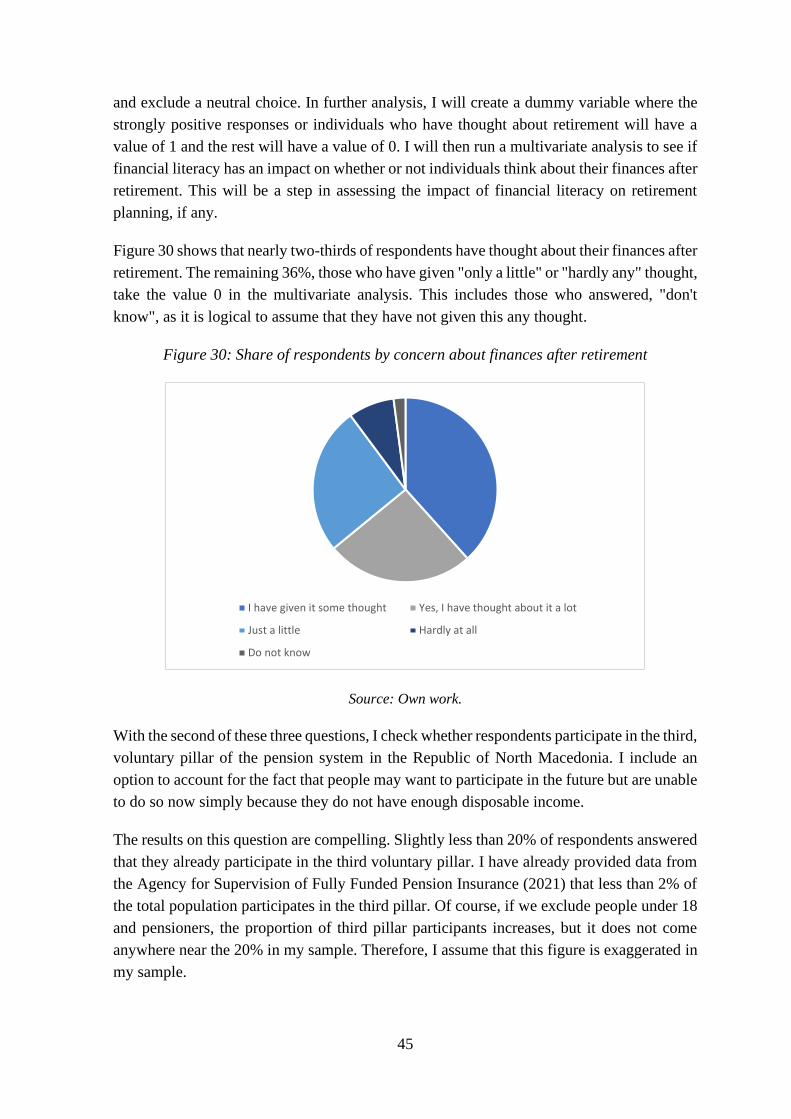
45
and exclude a neutral choice. In further analysis, I will create a dummy variable where the
strongly positive responses or individuals who have thought about retirement will have a
value of 1 and the rest will have a value of 0. I will then run a multivariate analysis to see if
financial literacy has an impact on whether or not individuals think about their finances after
retirement. This will be a step in assessing the impact of financial literacy on retirement
planning, if any.
Figure 30 shows that nearly two-thirds of respondents have thought about their finances after
retirement. The remaining 36%, those who have given "only a little" or "hardly any" thought,
take the value 0 in the multivariate analysis. This includes those who answered, "don't
know", as it is logical to assume that they have not given this any thought.
Figure 30: Share of respondents by concern about finances after retirement
Source: Own work.
With the second of these three questions, I check whether respondents participate in the third,
voluntary pillar of the pension system in the Republic of North Macedonia. I include an
option to account for the fact that people may want to participate in the future but are unable
to do so now simply because they do not have enough disposable income.
The results on this question are compelling. Slightly less than 20% of respondents answered
that they already participate in the third voluntary pillar. I have already provided data from
the Agency for Supervision of Fully Funded Pension Insurance (2021) that less than 2% of
the total population participates in the third pillar. Of course, if we exclude people under 18
and pensioners, the proportion of third pillar participants increases, but it does not come
anywhere near the 20% in my sample. Therefore, I assume that this figure is exaggerated in
my sample.
I have given it some thought Yes, I have thought about it a lot
Just a little Hardly at all
Do not know

46
A likely reason for the discrepancy could be that the respondents did not understand the
question correctly and assumed that it was one of the mandatory pension funds, first and
second pillar, in which every employee must participate. When I conducted the test, there
was no problem with the clarity of the question. Another reason could be lack of attention
or incomplete reading of the question. Finally, some respondents could give an incorrect
answer for any number of reasons. Most likely, the results are a result of a combination of
these reasons.
In addition to the 20% who answered that they already participate, 15% chose the option that
they will actually participate in the future. When conducting the multivariate analysis, they
are given a value of 1. The rest of the respondents take up a value of 0. This is the second
step in assessing the impact, if any, of financial literacy on retirement planning. However,
due to the problems with the data mentioned earlier, this may not be a true representation of
the current situation.
Figure 31: Share of respondents by 3rd pillar participation
Source: Own work.
The last question from this set of three questions is designed to check whether respondents
already have investments for retirement besides participation in the third, voluntary pillar. I
have again added an option for those who do not yet have the means to invest but plan to do
so in the future. Similar to third pillar participation, about 20% of respondents answered that
they have investments for retirement in the form of securities (stocks, bonds, mutual funds,
etc.) or real estate. Of this 20%, about one in four respondents also participate in the third
pillar. Another 48% stated that they plan to invest in the future. This is the third and final
step toward assessing the impact, if any, of financial literacy on retirement planning.
Yes No, but I plan to in the future No Do not know

47
Figure 32: Share of respondents by their investments for retirement
Source: Own work.
4.8 Financial literacy indices
Before conducting the multivariate analysis, I created indices of financial literacy. These
indices are used as independent variables in the analysis. To create the indices, I use the
same method as van Rooij, Lusardi & Alessie (2011a). First, I created dummy variables for
each of the questions used to assess respondents' financial literacy. The dummy variables
take the value 1 if the respondent answered the question correctly and 0 otherwise.
After converting the data, I conducted factor analysis on the newly created variables. I used
the iterated principal factor method. I used Stata version 13 for this and all other statistical
analysis hereafter.
I conducted three different factor analysis, first with the newly created dummy variables for
the five financial literacy questions. Second, with the dummy variables for the advanced
financial literacy questions. The last one with all of the newly created dummy variables, for
the basic and the advanced financial literacy questions. In all three cases, only one factor
was meaningful according to the Kaiser Criterion, or had an eigenvalue above 1 All of the
other factors in the analysis had eigenvalues well below 1. Therefore, I retained one factor
in all three cases. Since I retain only one factor, rotating the factor is not necessary. The
factor loadings are shown in Table 9. I used these factors to create three different indices
using Stata in the multivariate analysis. I name those indices “Basic financial literacy index”,
“Advanced financial literacy index” and “Combined index”.
I have other investments
I do not have other investments currently, but I will invest in the future
I think that the pension from the mandatory pension system will be enough
Do not know

48
Table 9: Factor loadings corresponding to categories of financial literacy questions
Factor loadings Basic Advanced Combined
Q1 0.6377
0.3331
Q2 0.5166
0.3109
Q3 0.4722
0.5365
Q4 0.3755
0.4405
Q5 0.2311
0.2644
Q6
0.4282 0.4536
Q7
0.3312 0.3924
Q8
0.5240 0.4769
Q9
0.5269 0.5308
Q10
0.1895 0.1916
Q11
0.5079 0.5018
Q12
0.2967 0.2781
Q13
0.5121 0.4571
Q14
0.6019 0.5375
Q15
0.2008 0.2060
Source: Own work.
4.9 Financial literacy and retirement planning in the Republic of North
Macedonia
Since the dependent variable in all three models is a binary variable, I use a probit model to
estimate the coefficients on the independent variables. I run two different regressions for
each of the three dependent variables, thinking about retirement, third pillar participation,
and investments for retirement. In the first regression, I use the two indices of basic and
advanced financial literacy as independent variables, and in the second regression, I use the
combined financial literacy index formed from all financial literacy questions, as explained
earlier. In addition to the financial literacy indices, I use independent variables for gender,
age, education, and income level to control for differences in demographic and
socioeconomic characteristics.
In Table 10, we can see that only age has a significant effect on how much, if at all, people
think about retirement. Individuals aged 35 to 44 are more likely to think about retirement,
and the probability increases with each step into a higher age category. The coefficients are
statistically significant and with 99% certainty different than 0. This makes perfect sense
because the closer people get to retirement, the more likely they are to think about retirement.
At a cut-off point of 0.5, the model predicts or correctly classifies slightly more than two-
thirds of the observations. However, the model is more likely to correctly classify
observations where the dependent variable has a value of 1. 91% of the time, while only a
quarter of the observations where the dependent variable has a value of 0 are correctly
classified.
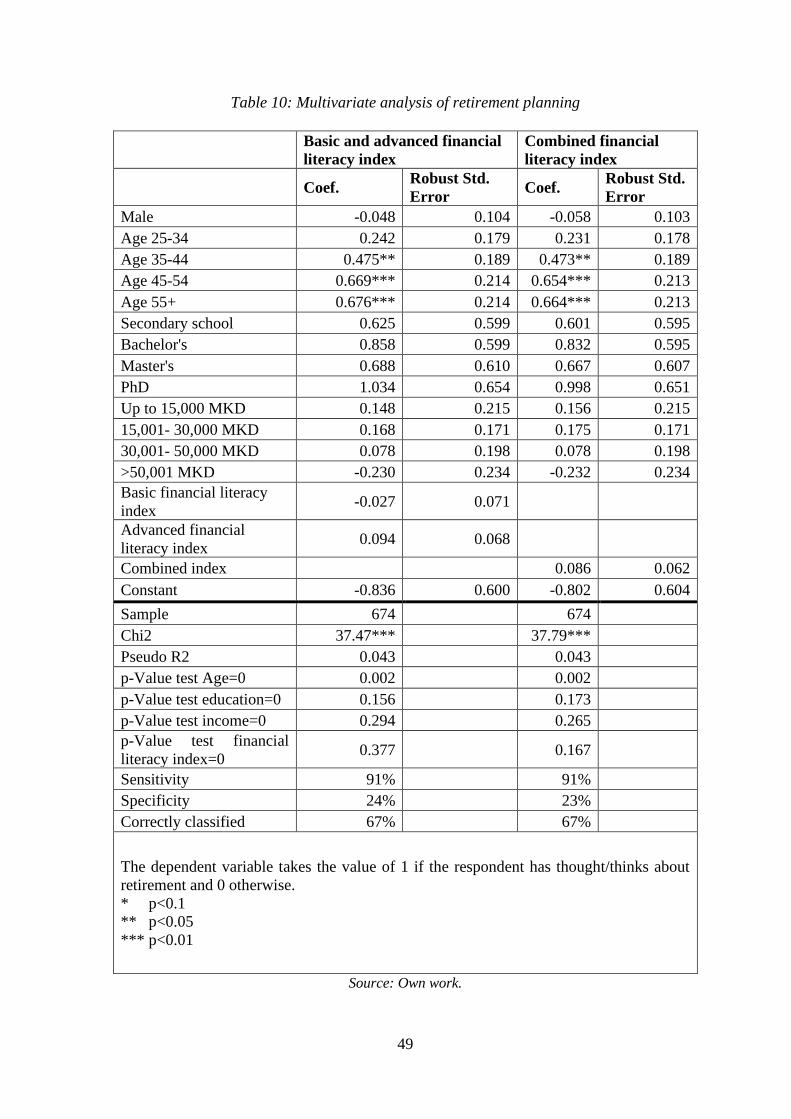
49
Table 10: Multivariate analysis of retirement planning
Basic and advanced financial
literacy index
Combined financial
literacy index
Coef. Robust Std.
Error Coef.
Robust Std.
Error
Male -0.048 0.104 -0.058 0.103
Age 25-34 0.242 0.179 0.231 0.178
Age 35-44 0.475** 0.189 0.473** 0.189
Age 45-54 0.669*** 0.214 0.654*** 0.213
Age 55+ 0.676*** 0.214 0.664*** 0.213
Secondary school 0.625 0.599 0.601 0.595
Bachelor's 0.858 0.599 0.832 0.595
Master's 0.688 0.610 0.667 0.607
PhD 1.034 0.654 0.998 0.651
Up to 15,000 MKD 0.148 0.215 0.156 0.215
15,001- 30,000 MKD 0.168 0.171 0.175 0.171
30,001- 50,000 MKD 0.078 0.198 0.078 0.198
>50,001 MKD -0.230 0.234 -0.232 0.234
Basic financial literacy
index -0.027 0.071
Advanced financial
literacy index 0.094 0.068
Combined index 0.086 0.062
Constant -0.836 0.600 -0.802 0.604
Sample 674 674
Chi2 37.47*** 37.79***
Pseudo R2 0.043 0.043
p-Value test Age=0 0.002 0.002
p-Value test education=0 0.156 0.173
p-Value test income=0 0.294 0.265
p-Value test financial
literacy index=0 0.377 0.167
Sensitivity 91% 91%
Specificity 24% 23%
Correctly classified 67% 67%
The dependent variable takes the value of 1 if the respondent has thought/thinks about
retirement and 0 otherwise.
* p<0.1
** p<0.05
*** p<0.01
Source: Own work.

50
In contrast to other research in the Netherlands, Switzerland, Sweden and the United States
(Almenberg & Säve-Söderbergh, 2011; Brown & Graf, 2013; Lusardi & Mitchell, 2011a;
van Rooij, Lusardi & Alessie 2011b), where financial literacy increases the likelihood that
people think about and plan for retirement, in my research, analysis show that financial
literacy does not have an impact on whether people think about retirement. To check whether
the problem is due to multicollinearity, I run an auxiliary regression. As I have previously
shown, all of the demographic variables have some effect on financial literacy. Therefore,
in this auxiliary regression, I take the combined financial literacy index as the dependent
variable. I use the demographic variables from the previous model as independent variables.
I store the residual and the constant from the results of the residual regression, and I name it
the "orthogonal index". This way, I can use only the variance in the index that is not
explained by the demographic independent variables. I then use the newly created
independent variable to assess the impact of financial literacy on retirement planning.
However, the independent variables in the auxiliary regression had low explanatory power
(R2= 0.132). For this reason, using the orthogonal index as an independent variable yields
almost identical results as using the combined financial literacy index.
Next, I analyse whether financial literacy has an impact on participation in the third
voluntary pillar of the pension fund. The dependent variable takes the value of 1 if a person
already participates or plans to participate in the future, and 0 otherwise. Again, note that
there is an overrepresentation of people who answered that they already participate in the
voluntary pension fund.
In Table 11 we see the results of the multivariate analysis. Age and monthly income are both
statistically significant and different from 0. Contrary to previous analysis, where an increase
in age increased the probability that individuals had thought about retirement, here
individuals over 55 are less likely to participate in the third pillar. This should not be
surprising, as these people have lived in a closed, socialist economy and have also lived
through the transition period. They are more likely to be conservative and most likely to
have doubts about the financial system. Since their first employment is before the reforms
of the pension system in the country, they are participants in the first pillar or the
intergenerational solidarity pillar, so they have a certain amount of guaranteed pension to
look forward to in retirement.
People who have an average monthly net income of up to MKD 30 thousand are more likely
to participate in the third pillar than those who have no monthly income. We can also claim
that for people who earn between 30 and 50 thousand MKD per month, but with 90%
certainty. Moreover, the effect is stronger for those who earn less. At mean values, ceteris
paribus, individuals earning up to MKD 15 thousand are 20% more likely to participate in
the third pillar than individuals with no monthly income. Individuals earning MKD 15 to 30
thousand are 17% more likely, and individuals earning MKD 30 to 50 thousand are 11%
more likely.
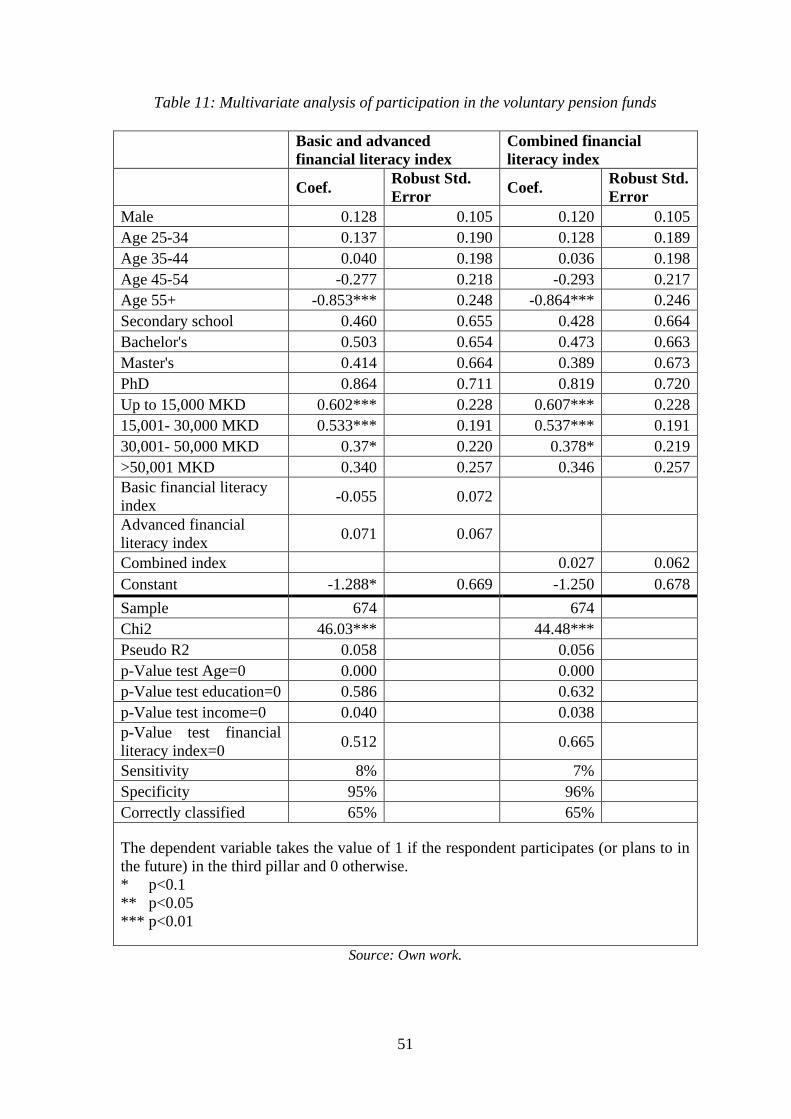
51
Table 11: Multivariate analysis of participation in the voluntary pension funds
Basic and advanced
financial literacy index
Combined financial
literacy index
Coef. Robust Std.
Error Coef.
Robust Std.
Error
Male 0.128 0.105 0.120 0.105
Age 25-34 0.137 0.190 0.128 0.189
Age 35-44 0.040 0.198 0.036 0.198
Age 45-54 -0.277 0.218 -0.293 0.217
Age 55+ -0.853*** 0.248 -0.864*** 0.246
Secondary school 0.460 0.655 0.428 0.664
Bachelor's 0.503 0.654 0.473 0.663
Master's 0.414 0.664 0.389 0.673
PhD 0.864 0.711 0.819 0.720
Up to 15,000 MKD 0.602*** 0.228 0.607*** 0.228
15,001- 30,000 MKD 0.533*** 0.191 0.537*** 0.191
30,001- 50,000 MKD 0.37* 0.220 0.378* 0.219
>50,001 MKD 0.340 0.257 0.346 0.257
Basic financial literacy
index -0.055 0.072
Advanced financial
literacy index 0.071 0.067
Combined index 0.027 0.062
Constant -1.288* 0.669 -1.250 0.678
Sample 674 674
Chi2 46.03*** 44.48***
Pseudo R2 0.058 0.056
p-Value test Age=0 0.000 0.000
p-Value test education=0 0.586 0.632
p-Value test income=0 0.040 0.038
p-Value test financial
literacy index=0 0.512 0.665
Sensitivity 8% 7%
Specificity 95% 96%
Correctly classified 65% 65%
The dependent variable takes the value of 1 if the respondent participates (or plans to in
the future) in the third pillar and 0 otherwise.
* p<0.1
** p<0.05
*** p<0.01
Source: Own work.

52
We can argue that as monthly income increases, the expected pension from the public
pension scheme also increases, so the need for an additional source of income after
retirement decreases. This reasoning could explain why, as income increases, the probability
a person participating or planning to participate decreases, although it is greater than for
those with no income.
There is no statistically significant difference in the probability of participation in the third
pillar between individuals earning more than 50 thousand MKD per month and those with
no income. The reason could be that top earners have enough disposable income to invest
themselves or already have other investments that would provide an additional income
stream after retirement.
Financial literacy has no measurable effect on participation in the voluntary third pillar of
retirement savings. This is in contrast to the results of a similar study in Italy, where financial
literacy increases the probability that an individual will participate in a voluntary pension
plan (Fornero & Monticone, 2011, p. 560).
The model generally classifies correctly when the dependent variable is 0 but has very low
classification accuracy when the dependent variable has the value 1. The data quality issue
mentioned above could be the reason for this problem.
For the final analysis, the dependent variable takes the value of 1 if the respondent has
investments for retirement, securities, or real estate, and if the respondent plans to invest in
the future. If the respondent has no intention to invest or does not consider it necessary, the
dependent variable takes the value 0. Age, income, and financial literacy have different but
statistically significant effects on the probability that a person has investments for retirement
or will invest in the future. Older people are less likely to have investments, most likely for
the same reasons, they are less likely to participate in the third pillar.
At mean values, ceteris paribus, people aged 45-54 are 16% less likely to invest for
retirement, while people aged 55 and older are 37% less likely to invest for retirement. While
age lowers the probability, a monthly net income of more than MKD 50,000, ceteris paribus,
increases the probability that a person has invested or will invest for retirement by 15%.
Last but not least, both basic and advanced financial literacy have a positive impact on the
probability of investing for retirement. At mean values, ceteris paribus, a 1-point increase in
the basic financial literacy index increases the probability of investing by 4.8%. The same
increase, ceteris paribus, in the advanced financial literacy index increases the probability of
investing by 6.6%.
These results are consistent with expectations, as high-income earners, after covering their
current expenses, have more disposable income to put into a savings account or use to invest
in various assets. And financially literate people are more likely to have the necessary skills
and knowledge to invest and manage their own portfolios, because as the survey results

53
show, a large proportion of respondents do not know the purpose of stocks or the stock
market, and an even larger proportion do not know the purpose of bonds.
Table 12: Multivariate analysis of investments for retirement
Basic and advanced financial
literacy index
Combined financial
literacy index
Coef. Robust Std.
Error Coef.
Robust Std.
Error
Male 0.076 0.109 0.080 0.108
Age 25-34 -0.157 0.196 -0.146 0.195
Age 35-44 -0.305 0.202 -0.294 0.202
Age 45-54 -0.498** 0.220 -0.483 0.219
Age 55+ -1.029*** 0.221 -1.024 0.220
Secondary school -0.210 0.471 -0.228 0.479
Bachelor's 0.032 0.470 0.024 0.478
Master's 0.357 0.490 0.339 0.498
PhD -0.237 0.531 -0.251 0.538
Up to 15,000 MKD -0.078 0.226 -0.881 0.226
15,001- 30,000 MKD 0.156 0.183 0.140 0.182
30,001- 50,000 MKD 0.117 0.210 0.102 0.210
>50,001 MKD 0.474* 0.267 0.464 0.266
Basic financial literacy
index 0.137* 0.073
Advanced financial
literacy index 0.189*** 0.071
Combined index 0.257** 0.067
Constant 0.688 0.488 0.700 0.495
Sample 674 674
Chi2 74.95*** 74.77***
Pseudo R2 0.095 0.095
p-Value test Age=0 0.000 0.000
p-Value test education=0 0.022 0.023
p-Value test income=0 0.076 0.081
p-Value test financial
literacy index=0 0.000 0.000
Sensitivity 93% 93%
Specificity 24% 24%
Correctly classified 71% 70%
The dependent variable takes the value of 1 if the respondent has (or plans to) investments
for retirement and 0 otherwise.
* p<0.1
** p<0.05
*** p<0.01
Source: Own work.

54
CONCLUSION
Financial literacy can make people's lives easier in a world where nowadays people make
financial decisions almost daily. If we take a step back and look at it from a different
perspective, when we retire, the financial situation that awaits us there will be the sum total
of all the decisions we have made up to that point. And most people are bad at making
decisions, we are guided by our own biases, make decisions based on irrationality instead of
facts. And it is not just ordinary people who suffer from bias, but even highly experienced
executives of large companies fail victim to their own biases. An example of this is the
widely known winner's curse in mergers and acquisitions, where usually the buyer overpays,
often because of executives' overconfidence and overestimation of potential synergies
(Shefrin, 2002, p. 237).
To get back to the ordinary people, a swipe of the credit card to buy for example a new pair
of sneakers that we do not actually need will not bankrupt us. But, when those kinds of
decisions outweigh the good, sound financial decisions, when the time for retirement comes,
not only can we retire without savings, but we can retire with accumulated debt also. Since
the pension will most likely be only a portion of the salary one received before retirement,
it would be quite a difficult situation to get out of. It does not mean that financially educated
people will make all the right decisions, but as I've have shown so far, they are more likely
to choose a better deal when taking a mortgage. They also, get through financial crisis better,
have higher earning potential, etc. So, when it comes time to retire, they are also better
prepared and less likely to have financial problems.
To address my research questions, I conducted a survey in the Republic of North Macedonia
based on questions used in previous studies conducted in different countries on the same
topic to measure financial literacy and its impact, if any, on retirement planning (van Rooij,
Lusardi & Alessie 2011b). The survey was primarily an online survey, with additional
telephone interviews. I used the exponential, non-discriminative snowball sampling method
to distribute the questionnaire and maximize the number of responses. I collected 746 fully
completed questionnaires, from which I excluded already retired persons and persons living
outside the country, and used the remaining 674 questionnaires for the analysis.
In the Republic of North Macedonia, the situation is pretty concerning. In relation to my first
research question, only 39% of people possess basic financial literacy. In my opinion, this is
a very low number, especially if we take into account that the questions in the set of five
basic financial literacy questions are relatively simple. A comparative analysis of the data
with results from the US and the Netherlands shows a significant gap with these developed
countries, which is consistent with the findings of Lusardi & Mitchell (2011c). The situation
is even bleaker when we assess how many individuals possess a more advanced level of
financial literacy. At first glance, it seems that about a quarter of the population reaches this
level, but if we add another logical condition that a person with advanced financial literacy
must first have basic financial literacy first, the number drops to only 16%. In general, men

55
in this country have better scores than women, as the data from my survey shows. This is
consistent with the findings of Bucher-Koenen et al. (2016, p. 22), which show that women
have significantly lower financial literacy scores than men, and with a study from India that
reaches the same conclusion (Agarwalla, Barua, Jacob & Varma, 2015).
One positive thing I can take from the survey is the awareness of the majority of respondents
about their shortcomings when it comes to their own knowledge, or their own financial
literacy. If the first step towards improvement is acceptance, then the outlook for the future
might be a positive one and improvement is in order. In addition to this, the National Bank
of the Republic of North Macedonia has already launched a campaign to increase financial
literacy in the country. People can sign up and attend free lectures. Lusardi et al. (2015, p.
20), show that videos, for example, are more effective in improving financial literacy
compared to written tools and materials. In the case of North Macedonia, the lectures will
certainly be more similar to videos than written tools. Further research has shown that
financial education is more effective in times of need than in random times. For example,
people deciding on mortgage financing are more likely to take something away from a
lecture on debt than those who have no need for a debt instrument at that time (Mandell,
2011 pp. 6-7). To sign up for the lectures from the National Bank people must have felt some
need to take up action. Therefore, if we follow Mandell's (2011) argument, then it is likely
that people who take action to sign up for the course will also acquire knowledge and use it
in the future.
The pension system of the Republic of North Macedonia is based on three pillars, the first
of which is based on generational solidarity and is mandatory, the second, also mandatory,
but individually capitalized pension savings. People who had their first employment before
2003 can choose which of the pillars they want to participate in, the rest automatically go to
the second pillar. The third pillar is a voluntary one, and according to official data, less than
2% of the population had an account at the end of 2020. From the sample, 64% of the people
have thought about retirement, while 35% already participate in the third voluntary pillar or
plan to do so in the future. Finally, 68% have already invested in securities or real estate for
retirement or stated that they would do so in the future.
I created financial literacy indices derived from performance on financial literacy questions.
I used these indices along with additional variables to account for differences in demographic
and socioeconomic characteristics and to conduct a multivariate analysis. The results of the
analysis show that the probability that people think about retirement increases as the age of
the respondents increases. This makes sense as retirement seems too distant for some of the
younger people to be part of their thoughts and concerns. While age increases the probability
that people have thought about retirement, it decreases the probability that they will
participate in the third pillar of the pension system. These people grew up and lived most of
their lives in a communist country and may have resistance and distrust of financial products
that are new and unfamiliar to them. Another reason could be that they are closer to
retirement and the marginal benefit of participating in a voluntary pension fund is lower

56
given the shorter time frame. Most likely, the reasons are similar as to why age reduces the
probability of additional investments in securities and or real estate for retirement.
Regarding the relationship between financial literacy and retirement planning in the
Republic of North Macedonia, according to my data and analysis, financial literacy is only
significant and increases the probability of a person having investments in securities or real
estate for retirement. Other studies I have examined, show that higher levels of financial
literacy increase the probability that people think about retirement or participate in a
voluntary pension fund (Almenberg & Säve-Söderbergh, 2011; Fornero & Monticone, 2011;
Lusardi & Mitchell, 2011a; van Rooij, Lusardi & Alessie, 2011a; van Rooij, Lusardi &
Alessie, 2011b).
I consider the limitations of my research to be the overrepresentation of those with a
university education or higher and the methodology used to collect the surveys. In further
research, an institution with more resources and a pandemic-free period can conduct broader
and more representative research to measure possible improvements. As possible research
in the future, I would suggest studying the effects of financial literacy on debt and decision
making. Another research topic I would suggest would be how to improve the overall level
of financial literacy in the country, as this is a challenge that needs to be addressed in the
coming years.
REFERENCE LIST
1. Agarwalla, S. K., Barua, S. K., Jacob, J., & Varma, J. R. (2015). Financial Literacy
among Working Young in Urban India. World Development, 67(2013), 101–109.
https://doi.org/10.1016/j.worlddev.2014.10.004
2. Agency for Supervision of Fully Funded Pension Insurance. (2021). Annual
statistical report 2020. Retrieved April 28, 2021 from http://mapas.mk/wp-
content/uploads/2021/02/Godishen-statistichki-izvestaj-2020_web.pdf
3. Allianz. (2020). Allianz Pension Report 2020 The Silver Swan. Retrieved April 28,
2021 from https://www.eulerhermes.com/en_global/news-insights/economic-
insights/allianz-global-pension-report-2020.html
4. Almenberg, J., & Säve-Söderbergh, J. (2011). Financial Literacy and Retirement
Planning in Sweden. SSRN Electronic Journal, 1–28.
https://doi.org/10.2139/ssrn.1809736
5. ANZ Bank. (2008). ANZ Survey of Adult Financial Literacy in Australia. October.
6. Armstrong, R. (2021, January 29). r/WallStreetBets throws down challenge to
regulators. Retrieved April 28, 2021 from https://www.ft.com/content/8a483767-
6b55-40a2-b8a6-1439a2f56084

57
7. Atkinson, A., & Messy, F.-A. (2011). Assessing Financial Literacy in 12 Countries.
Journal of Pension Economics and Finance, 10(04), 657–665.
8. Awais, M., Laber, M., Rasheed, N., & Khursheed, A. (2016). Impact of Financial
Literacy and Investment Experience on Risk Tolerance and Investment Decisions:
Empirical Evidence from Pakistan. International Journal of Economics and
Financial Issues. 6. 73-79.
9. Beal, D. J., & Delpachitra, S. B. (2003). Financial Literacy Among Australian
University Students. Economic Papers: A Journal of Applied Economics and Policy,
22(1), 65–78. https://doi.org/10.1111/j.1759-3441.2003.tb00337.x
10. Behrman, J. R., Mitchell, O. S., Soo, C. K., & Bravo, D. (2012). How financial
literacy affects household wealth accumulation. American Economic Review, 102(3),
300–304. https://doi.org/10.1257/aer.102.3.300
11. Benartzi, S., & Thaler, R. H. (2001). Naive diversification strategies in defined
contribution savings plans. Advances in Behavioral Finance, 91(1), 79–98.
12. Boisclair, D., Lusardi, A., & Michaud, P. C. (2015). Financial literacy and retirement
planning in Canada. Cambridge University Press, 1–20.
https://doi.org/10.1017/S1474747215000311
13. Brown, M., & Graf, R. (2013). Financial literacy and retirement planning in
Switzerland. Numeracy, 6(2), 1–21. https://doi.org/10.1017/S1474747217000270
14. Bucher-Koenen, T., Lusardi, A., Alessie, R., & Rooij, M. Van. (2016). How
financially literate are women? An overview and new insights. Forthcoming Journal
of Consumer Affairs, September 2012.
15. Bucher-Koenen, T., & Ziegelmeyer, M. H. (2012). Who Lost the Most? Financial
Literacy, Cognitive Abilities, and the Financial Crisis. SSRN Electronic Journal.
https://doi.org/10.2139/ssrn.1738368
16. Clark, R., Lusardi, A., & Mitchell, O. S. (2017). Employee Financial Literacy and
Retirement Plan Behavior: a Case Study. Economic Inquiry, 55(1), 248–259.
https://doi.org/10.1111/ecin.12389
17. Cumurovic, A., & Hyll, W. (2016). Financial Literacy and Self-employment. IWH
Discussion Papers, 11.
18. Duru, O. (2013). Irrational exuberance, overconfidence and short-termism :
Knowledge-`to-action asymmetry in shipping asset management. Asian Journal of
Shipping and Logistics, 29(1), 43–58. https://doi.org/10.1016/j.ajsl.2013.05.003

58
19. Eurostat. (2020). Basic figures on enlargement countries. Retrieved April 28, 2021
from https://doi.org/10.2785/109766
20. Fornero, E., & Monticone, C. (2011). Financial literacy and pension plan
participation in Italy. Journal of Pension Economics and Finance, 10(4), 547–564.
https://doi.org/10.1017/S1474747211000473
21. GFK. (2018). Adult Financial Literacy Competencies in Macedonia. Retrieved April
28, 2021 from https://www.nbrm.mk/content/Adult-Financial-Literacy-
Competencies-in-Macedonia-2017.pdf
22. Goodman, L. A. (1961). Snowball Sampling. The Annals of Mathematical Statistics,
32(1), 148–170.
23. Google. (n.d.). Google Books Ngram Viewer. Retrieved November 21, 2020 from
https://books.google.com/ngrams/graph?content=financial+literacy&year_start=19
90&year_end=2019&corpus=26&smoothing=0
24. Hilgert, M. A., Hogarth, J. M., & Beverly, S. G. (2003). Household Financial
Management: The Connection between Knowledge and Behavior. Federal Reserve
Bulletin, 89(7), 309–322.
25. Hopkins, V. (2020). North Macedonia grapples with demographic challenge.
Retrieved April 28, 2021 from https://www.ft.com/content/5dafc7e1-d233-48c4-
bd6b-90a2ed45a6e7
26. Hung, A., Parker, A. M., & Yoong, J. (2011). Defining and Measuring Financial
Literacy. SSRN Electronic Journal. https://doi.org/10.2139/ssrn.1498674
27. Huston, S. J. (2010). Measuring Financial Literacy. Journal of Consumer Affairs,
44(2), 296–316. https://doi.org/10.1111/j.1745-6606.2010.01170.x
28. International Monetary Fund. (2020). World Economic Outlook Database, October
2020. https://www.imf.org/en/Publications/WEO/weo-database/2020/October
29. Jovanovic, B., & Petreski, M. (2012). Monetary policy in a small open economy with
fixed exchange rate: The case of Macedonia. Economic Systems, 36(4), 594–608.
https://doi.org/10.1016/j.ecosys.2012.02.003
30. Kemp, S. (2020). Digital 2020: North Macedonia — DataReportal – Global Digital
Insights. https://datareportal.com/reports/digital-2020-north-macedonia
31. Kempson, E. (2009). Framework for the Development of Financial Literacy Baseline
Surveys: A First International Comparative Analysis. OECD Working Papers on
Finance, Insurance and Private Pensions, 1, 3–29.

59
https://doi.org/10.1787/5kmddpz7m9zq-en
32. Klapper, L., & Lusardi, A. (2019). Financial literacy and financial resilience:
Evidence from around the world. Financial Management, 1–26.
https://doi.org/10.1111/fima.12283
33. Klapper, L., Lusardi, A., & Panos, G. A. (2012). Financial Literacy and the Financial
Crisis. SSRN Electronic Journal. https://doi.org/10.2139/ssrn.2038765
34. Klapper, L., Lusardi, A., & van Oudheusden, P. (2017). Insights From the Standard
& Poor’S Ratings Services Global Financial Literacy Survey. Financial Literacy
around the World, 1–27.
35. Kojo Oseifuah, E. (2010). Financial literacy and youth entrepreneurship in South
Africa. African Journal of Economic and Management Studies, 1(2), 164–182.
https://doi.org/10.1108/20400701011073473
36. Krstevska, A., & Pavleska, K. (2019). Финансиската писменост како предуслов
за поголема финансиска инклузија и инклузивен развој: осврт на состојбите и
предизвиците во македонската економија. National Bank of the Republic of
North Macedonia.
37. Law for secondary school. (1995). Службен Весник. Retrieved April 28, 2021 from
http://www.sonk.org.mk/documents/Zakon za sredno obrazovanie.pdf
38. Lee, N. (2012). What is financial literacy , and does financial literacy education
achieve its objectives ? Evidence from banks , government agencies and financial
literacy educators in England. In the Proceedings of 2012 Academy of Financial
Services Annual Conference at San Antonio, USA E (Vol. 4).
39. Lusardi, A. (2008). Household saving behavior: The role of financial literacy,
information, and financial education programs (No. w13824; Issue Natl. Bur. Econ.
Res.). https://doi.org/10.3386/w13824
40. Lusardi, A. (2011). Financial Literacy: An Essential Tool for Informed Consumer
Choice? SSRN Electronic Journal. https://doi.org/10.2139/ssrn.1336389
41. Lusardi, A., Michaud, P.-C., & Mitchell, O. S. (2011). Optimal Financial Literacy
and Saving for Retirement. SSRN Electronic Journal, 5.
https://doi.org/10.2139/ssrn.1978960
42. Lusardi, A., & Mitchell, O. S. (2008). Planning and financial literacy: How do
women fare? American Economic Review, 98(2), 413–417.
https://doi.org/10.1257/aer.98.2.413

60
43. Lusardi, A., & Mitchell, O. S. (2010). Implications for Retirement Wellbeing of
Financial Literacy and Planning. SSRN Electronic Journal, October.
https://doi.org/10.2139/ssrn.1695146
44. Lusardi, A., & Mitchell, O. S. (2011a). Financial Literacy and Retirement Planning:
New Evidence from the Rand American Life Panel. SSRN Electronic Journal.
https://doi.org/10.2139/ssrn.1095869
45. Lusardi, A., & Mitchell, O. S. (2011b). Financial literacy and retirement planning in
the United States. Journal of Pension Economics and Finance, 10(4), 509–525.
https://doi.org/10.1017/S147474721100045X
46. Lusardi, A., & Mitchell, O. S. (2011c). Financial literacy around the world: An
overview. Journal of Pension Economics and Finance, 10(4), 497–508.
https://doi.org/10.1017/S1474747211000448
47. Lusardi, A., Mitchell, O. S., & Oggero, N. (2018). Debt and Financial Vulnerability
on the Verge of Retirement. Journal of Money, Credit, and Banking.
48. Lusardi, A., Samek, A., Kapteyn, A., Glinert, L., Hung, A., & Heinberg, A. (2015).
Visual Tools and Narratives : New Ways to Improve Financial Literacy. In National
Bureau of Economic Research (No. w20229).
49. Lusardi, A., & Tufano, P. (2015). Debt literacy, financial experiences, and
overindebtedness. Journal of Pension Economics and Finance, 14(4), 332–368.
https://doi.org/10.1017/S1474747215000232
50. Lynch, J. G. J. (2011). Introduction to the Journal of Marketing Research Special
Interdisciplinary Issue on Consumer Financial Decision Making. Journal of
Marketing Research, XLVIII, 1–18.
51. Mandell, L. (2007). Financial Literacy of High School Students. In Handbook of
consumer finance research. Springer, New York.
52. Mandell, L. (2011). Financial Literacy: If It’s so Important, Why isn’t It Improving?
SSRN Electronic Journal, April. https://doi.org/10.2139/ssrn.923557
53. Mason, C., & Wilson, R. (2000). Conceptualising financial literacy. Business School
Research Series, 7(1), 1–41.
54. McKenzie, C. R. M., & Liersch, M. J. (2011). Misunderstanding savings growth:
Implications for retirement savings behavior. Journal of Marketing Research,
48(SPEC. ISSUE), 1–13. https://doi.org/10.1509/jmkr.48.SPL.S1
55. Law on pension and disability insurance. (1983) Службен Весник. Retrieved April

61
28, 2021 from https://www.slvesnik.com.mk/Issues/7CB96ED1B115416AB32E1D
57C17B3DE3.pdf
56. Mitevski, V., Moussa, B., Tevdovski, D., & Zarotiadis, G. (2020). Unlocking
economic potential between Greece and North Macedonia (Laboratory for Black Sea
and Mediterranean Studies).
57. Moore, D. (2003). Survey of Financial Literacy in Washington State: Knowledge,
Behavior, Attitudes, and Experiences (Issue December 2003).
https://doi.org/10.13140/2.1.4729.4722
58. Mouna, A., & Jarboui, A. (2015). Financial literacy and portfolio diversification: an
observation from the Tunisian stock market. International Journal of Bank
Marketing, 33(6), 808–822. https://doi.org/10.1108/IJBM-03-2015-0032
59. Nairn, G. (2006). Broadband network is envy of the west. Retrieved April 28, 2021
from https://on.ft.com/3nHG8Ca
60. National Council on Economic Education. (2005). What American Teens & Adults
Know About Economics. 1–82.
61. NCEE. (2005). What American Teens & Adults Know About Economics. Director,
82.
62. Nikolov, M., Sukarov, M., & Velkovska, I. (2017). Одржливост на пензискиот
фонд во Република Македонија. 1–24.
63. Noctor, M., Stoney, S., & Stradling, R. (1992). Financial literacy: a discussion of
concepts and competences of financial literacy and opportunities for its introduction
into young people’s learning. National Foundation for Educational Research.
64. Nolan, A., & Doorley, K. (2019). Financial literacy and preparation for retirement.
Institute of Labor Economics, 1–45. https://doi.org/10.1007/s10272-016-0588-9
65. OECD. (2017). G20/OECD INFE report on adult financial literacy in G20 countries.
66. OECD. (2018). OECD/INFE Toolkit for Measuring Financial Literacy and
Financial Inclusion.
67. Peel, M., Hopkins, V., & Hindley, D. (2020, November 18). North Macedonia’s EU
odyssey hits rough seas again. Retrieved April 28, 2021 from
https://www.ft.com/content/11369e1b-6447-48b0-981c-aaf80a7438ab
68. Petreski, B., & Gacov, P. (2018). Sustainability of the pension system in Macedonia.
Finance Think, 1–37.

62
69. Petrevski, G. (2005). Macedonia: a decade of stabilisation policy. SEER-South-East
Europe Review for Labour and Social Affairs, 01, 97–115.
70. Platt, E., & Smith, C. (2021, January 26). Reddit traders wage battle against Wall
Street. Retrieved April 28, 2021 from https://www.ft.com/content/56e8b33a-d9b6-
4f74-998b-327ef54c4d5a
71. Pokrikyan, A. (2016). The Impact of Financial Literacy on the Financial Decisions
of Consumers in Low-Income Countries (Armenia Case). International Black Sea
University.
72. President’s Advisory Council on Financial Literacy. (2008). Annual Report to the
President.
73. Radovanovik-Angjelkovska, T. (2014). The Economical Reforms of The Republic
of Macedonia after The Independence. International Journal of Business and Social
Research, 4(7), 71–76. https://doi.org/10.18533/ijbsr.v4i7.561
74. Reiter, S., & Beckmann, E. (2018). How financially literate is CESEE ? Insights from
the OeNB Euro Survey. Oesterreichische Nationalbank Focus on European
Economic Integration, 3, 36–59.
75. Remund, D. L. (2010). Financial literacy explicated: The case for a clearer definition
in an increasingly complex economy. Journal of Consumer Affairs, 44(2), 276–295.
https://doi.org/10.1111/j.1745-6606.2010.01169.x
76. Schagen, S. (1997). The Evaluation of NatWest Face 2 Face with Finance. National
Foundation for Educational Research.
77. Securities and exchange commission of the Republic of North Macedonia. (n.d.).
Funds analytics. Retrieved February 24, 2021, from
https://www.sec.gov.mk/AnalitikaFondovi
78. Shefrin, H. (2002). Beyond greed and fear: understanding behavioral finance and the
psychology of investing. In Oxford university press.
https://doi.org/10.5860/choice.41-1676
79. Shen, C. H., Lin, S. J., Tang, D. P., & Hsiao, Y. J. (2016). The relationship between
financial disputes and financial literacy. Pacific Basin Finance Journal,
36(November 2009), 46–65. https://doi.org/10.1016/j.pacfin.2015.11.002
80. Stango, V., & Zinman, J. (2013). American Finance Association Exponential Growth
Bias and Household Finance. The Journal of Finance, 64(6), 2807–2849.
81. State statistical office. (2020). Labour market news release- Active Population in the

63
Republic of Macedonia, Results from the Labour Force Survey. Retrieved April 28,
2021 from https://www.stat.gov.mk/pdf/2020/2.1.20.34_mk.pdf
82. State Statistical Office. (n.d.). International women’s day. Retrieved April 28, 2021
from https://www.stat.gov.mk/Mart8_eng.aspx
83. Thaler, R. H., & Benartzi, S. (2007). The Behavioral Economics of Retirement
Savings Behavior. The AARP Public Policy Insitute, 2(January), 1–34.
84. Thaler, R. H., & Sunstein, C. R. (2008). NUDGE: Improving Decisions About
Health, Wealth, and Happiness. New Haven : Yale University Press.
85. The alternative financial services association of North Macedonia. (2019).
Истражување на финтек - индустријата и степенот на финансиска
писменост во Северна Македонија Содржина. Retrieved April 28, 2021 from
https://afd.mk/wp-content/uploads/2020/02/AFD_research-2019.pdf
86. The World Bank. (2020a). GDP growth (annual %) - North Macedonia | Data.
https://data.worldbank.org/indicator/NY.GDP.MKTP.KD.ZG?locations=MK&vie
w=chart
87. The World Bank. (2020b). Literacy rate, adult total (% of people ages 15 and above)
- North Macedonia Data. Retrieved April 28, 2021 from
https://data.worldbank.org/indicator/SE.ADT.LITR.ZS?locations=MK
88. The World Bank. (2020c). Unemployment, total (% of total labor force) (modeled
ILO estimate) - North Macedonia | Data.
https://data.worldbank.org/indicator/SL.UEM.TOTL.ZS?locations=MK
89. UNESCO. (2017). Reading the past, writing the future.
90. USAID. (n.d.). USAID MADE MACEDONIA THE FIRST WIRELESS COUNTRY.
Retrieved April 28, 2021 from https://www.usaid.gov/news-
information/videos/usaid-made-macedonia-first-wireless-country#:~:text=Back in
late 2005%2C USAID,wireless internet by 75 percent.
91. Uzunov, V. (2011). Socio-Economic Transformation and the Welfare System of the
Republic of Macedonia in the Period of Transition. Welfare States in Transition,
116–134.
92. Van Rooij, M., Lusardi, A., & Alessie, R. (2011a). FINANCIAL LITERACY AND
STOCK MARKET PARTICIPATION. Journal of Financial Economics, 101(2),
449–472.
93. Van Rooij, M., Lusardi, A., & Alessie, R. J. M. (2011b). Financial literacy and

64
retirement planning in the Netherlands. Journal of Economic Psychology, 32(4),
593–608. https://doi.org/10.1016/j.joep.2011.02.004
94. Vitt, L. a., Anderson, C., Kent, J., Lyter, D. M., Siegenthaler, J. K., & Ward, J.
(2000). Personal Finance and the Rush To Competence: Financial Literacy
Education in the U.S. Personal Finance, 1–234.
95. Vuchev, Z. (2009). Нееднаквости во опфатот и правата од пензискиот систем во
Република Македонија. Ревија За Социјална Политика, 624(3), 265–280.

APPENDICES


1
Appendix 1: Povzetek (Summary in Slovene language)
Lahko trdimo, da sta bila od pojave prvega dokumentiranega pisnega jezika, ki se je pojavil
v Mesopotamiji, in sicer med letoma 6000 in 5700 pred našim štetjem, pisni jezik in
pismenost ena izmed najbolj pomembnih gradbenih elementov v razvoju sodobne družbe. V
sedanji sodobni družbi ljudje vsak dan sprejemajo več in več odlocčitev, ki vplivajo na
njihovo finančno blagostanje. Celo majhne odločitve se lahko dolgoročno negativno
odražajo na finančno blagostanje če je oseba, ki sprejema te odločitve, naredila napako
zaradi pomanjkanja znanja ali zaradi pomanjkanja dovolj zanesljivih informacij. (Lynch
2011). Veliko avtorjev verjamejo, da je za dobro odločitev, ko govorimo o teh zelo
pomembhih aspektih življenja, potrebna drugačna vrsta pismenosti, in sicer finančna
pismenost. Podobno definiranju pismenosti, kjer je Uneskova definicija le ena izmed
mnogih, tudi o opredelitvi finančne pismenosti do zdaj ni bilo soglasja. Hung, Parker &
Yoong (2011, str. 12) ponujajo definicijo o finančni pismenosti, ki temelji na prejšnjih
raziskovalcih: “Finančna pismenost je poznavanje osnovnih ekonomskih in finančnih
konceptov ter sposobnost uporabe tega znanja in drugih finančnih veščin za čimboljšo in
učinkovitejšo upravljanje s finančnimi viri ter pridobitev finančne stabilnosti tekom celega
življenja.”
Medtem ko študije potrjujejo, da je finančna pismenost zelo pomembna, raziskave pokažejo,
da je svetovna raven finančne pismenosti precej nizka. V raziskavi držav G20, ki jo je izvedla
OECD, so imeli ljudje povprečno oceno 12,7 od največ 21 točk ali malo nad 60% (OECD,
2017). Klapper in sod. (2017) je opravil raziskavo na to temo v imenu bonitetnih služb
Standard & Poor's in ugotovil, da je le 1 od 3 ljudi v povprečju finančno pismen. Raziskave
iz preteklosti kažejo, da je finančna pismenost v Republiki S. Makedoniji nižja v primerjavi
z ostalimi državami iz regije. V zgoraj omenjeni študiji, ki so jo izvedle bonitetne službe
Standard & Poor's, ima Republika Severna Makedonija 21% finančno pismenih odraslih.
Glede na to, da so podatki iz drugih držav pokazali, da finančno pismeni ljudje bolj verjetno
varčujejo in načrtujejo upokojitev, sem se odločil preizkusiti ali ta hipoteza velja tudi v
Republiki Severni Makedoniji.
Glavni cilj te raziskave je oceniti raven finančne pismenosti ljudem, ki živijo v Republiki
Makedoniji, in analizirati, kako se obnašajo v primerjavi z državami, v katerih so bile
opravljene podobne raziskave Poleg tega bi rad raziskal ali finančna pismenost vpliva na to
kako ljudje načrtujejo upokojitev in kako pripravljeni so ko dosežejo to stopnjo življenja
Vprašanja mojega magistrskega dela so:
- Kako finančno pismeni so državljani Republike Severne Makedonije?
- Kako (če sploh) finančna pismenost vpliva na pokojninsko načrtovanje v Republiki
Severni Makedoniji?

2
Opravil sem anketo, ki je vsebovala 15 vprašanj, ki so mi pomagali izmeriti finančno
pismenost v Republiki Severni Makedoniji. Zbral sem 746 odgovorov in sem 674 uporabil
za nadaljnjo analizo. Po mojih raziskavah ima le 39% ljudi, ki živijo v severni Makedoniji,
osnovno finančno pismenost, le 16% pa naprednejšo raven finančne pismenosti. Poleg tega
sem naredil še multivariatno analizo in ugotovil, da finančna pismenost povečuje verjetnost,
da ljudje že imajo investicije v svojo upokojitev ali bodo investirali v prihodnosti.

3
Appendix 2: Questionnaire in English language
Section I: Demographic questions
1. Please enter your gender.
• Male
• Female
2. Please choose the category that contains your age.
• 18-24
• 25-34
• 35-44
• 45-54
• 55-65
3. Please enter the city you currently live in.
• Bitola
• Skopje
• Kumanovo
• Prilep
• Ohrid
• Tetovo
• Shtip
• Other city or rural area in the republic of North Macedonia
• I live abroad
4. What is the highest level of education you have completed?
• Primary education or lower
• Secondary education
• Bachelor’s or equivalent level
• Master’s or equivalent level
• Doctoral or equivalent level
5. Have you ever listened to a finance class or had any other finance education?
• Never
• I had a finance class in high school
• I have a degree (or study) economics (undergraduate/master/doctorate)
• I have had a workshop/online course/seminar or similar in finance
6. Please state your current employment status (multiple choice)
• Employed, full time
• Employed, part time
• Freelancer
• Unemployed
• Student
7. Please chose your monthly income category.
• I have no monthly income
• Up to 15,000 MKD
• 15,001 to 30,000 MKD
• 30,001 to 50,000 MKD

4
• Over 50,000 MKD
8. Have you ever thought about retirement and how much?
• Yes, I have thought about it a lot
• I have given it some thought
• Just a little
• Hardly at all
• Do not know
9. Do you participate in the third pillar of the pension system in the Republic of North
Macedonia (voluntary contributions)?
• Yes
• No, but I plan to in the future
• No
• Do not know
10. Do you have any other investments or plan to make other investments for
retirement (stocks, bonds, mutual funds, real estate etc.)?
• I have other investments
• I do not have other investments currently, but I will invest in the future
• I think that the pension from the mandatory pension system will be enough
• Do not know
11. Which of the following time periods is most important to you with regard to
planning expenditures and savings?
• The next couple of months
• The next year
• The next couple of years
• The next 5-10 years
• More than 10 years
Section II: Basic financial literacy questions
12. Suppose you had 1,000 MKD in a savings account and the interest rate was 2% per
year. After 5 years, how much do you think you would have in the account if you
left the money to grow?
• More than 1,020 MKD
• Exactly 1,020 MKD
• Less than 1,020 MKD
• Do not know
13. Suppose you had 1,000 MKD in a savings account and the interest rate is 20% per
year and you never withdraw money or interest payments. After 5 years, how much
would you have on this account in total?
• More than 2,000 MKD
• Exactly 2,000 MKD
• Less than 2,000 MKD
• Do not know

5
14. Imagine that the interest rate on your savings account was 1% per year and inflation
was 2% per year. After 1 year, how much would you be able to buy with the money
in this account?
• More than today
• Exactly the same
• Less than today
• Do not know
15. Assume Aleksandar inherits 100,000 MKD today and his brother, Stefan, inherits
100,000 MKD 3 years from now. Who is richer because of the inheritance?
• Aleksandar
• Stefan
• They are equally rich
• Do not know
16. Suppose that in 2021, your income will double. Prices of all goods will double too.
In 2021, how much will you be able to buy with your income?
• More than in 2020
• The same
• Less than in 2020
• Do not know
Section III: Advanced financial literacy questions
17. Which of the following statements describes the main function of the stock market?
• The stock market helps to predict stock earnings
• The stock market results in an increase in the price of stocks
• The stock market brings people who want to buy stocks together with those
who want to sell stocks
• None of the above
• Do not know
18. Which of the following statements is correct? If somebody buys the stock of firm B
in the stock market:
• He owns a part of firm B
• He has lent money to firm B
• He is liable for firm B’s debts
• None of the above
• Do not know
19. Which of the following statements is correct?
• Once one invests in a mutual fund, one cannot withdraw the money in the
first year

6
• Mutual funds can invest in several assets, for example invest in both stocks
and bonds
• Mutual funds pay a guaranteed rate of return which depends on their past
performance
• None of the above
• Do not know
20. What happens if somebody buys a bond of firm B?
• He owns a part of firm B
• He has lent money to firm B
• He is liable for firm B’s debts
• None of the above
• Do not know
21. Considering a long time period (for example 10 or 20 years), which asset normally
gives the highest return?
• Savings accounts
• Bonds
• Stocks
• Do not know
22. When an investor spreads his money among different assets, does the risk of losing
money:
• Increase
• Decrease
• Stay the same
• Do not know
23. If you buy a 10-year bond, it means you cannot sell it after 5 years without
incurring a major penalty. True or false?
• True
• False
• Do not know
24. Stocks are normally riskier than bonds. True or false?
• True
• False
• Do not know
25. Buying a company stock usually provides a safer return than a stock mutual fund.
True or false?
• True
• False
• Do not know

7
26. If the interest rate falls, what should happen to bond prices?
• Rise
• Fall
• Stay the same
• None of the above
• Do not know
27. How would you assess your own understanding of economics and finance (please
chose from a scale from 1 to 7 where 1 means very low, and 7 means very high)?

8
Appendix 3: Questionnaire in Macedonian language
Секција I: Општи прашања
1. Пол на испитаникот
• Машки
• Женски
2. Возраст
• 18-24
• 25-34
• 35-44
• 45-54
• 55-65
3. Одберете го градот во кој живеете.
• Битола
• Скопје
• Куманово
• Прилеп
• Охрид
• Тетово
• Штип
• Друг град или село во Република Северна Македонија
• Живеам надвор од државата
4. Највисок степен на завршено образование
• Основно образование или пониско
• Средно образование
• Високо образование
• Магистер
• Доктор на науки
5. Дали некогаш сте имале предмет во Вашето образование или сте
присуствувале на предавање за финансии??
• Никогаш
• Сум имал/а предавање за финансии во средно
• Сум имал/а курс/работилница/семинар или слично за финансии
• Имам диплома или студирам на економски факултет
(додипломски/постдипломски/докторски студии)
6. Ве молам внесете го Вашиот работен статус
• Вработен/а, полно работно време
• Вработен/а, пола работно време
• Хонорарец
• Невработен/а
• Студент
7. Ве молам, одберете во која категорија на месечни примања припаѓате:
• Немам месечни приходи
• До 15,000 денари
9
• 15,001 до 30,000 денари
• 30,001 до 50,000 денари
• Над 50,000 денари
8. Дали сте размислувале за Вашата финансиска состојба по пензионирањето?
• Да, често сум размислувал/а
• Да, сум размислувал/а
• Само малку
• Воопшто не сум размислувал
• Не знам
9. Дали учествувате во третиот столб (доброволна уплата) на пензискиот систем
на Р. Македонија?
• Да
• Не, но планирам во иднина
• Не
• Не знам
10. Дали имате некои други инвестиции или планирате да инвестирате во иднина
за да имате дополнителен приход по Вашето пензионирање (акции,
обврзници, недвижнини, инвестициски фондови)?
• Да имам дополнителни инвестиции
• Не, немам во моментот, меѓутоа планирам да инвестирам во иднина
• Не, мислам дека пензијата ќе ми биде доволен приход
• Не знам
11. Колку долг временски период е од најголема важност при планирањето на
Вашите трошоци и штедење?
• Наредните неколку месеци
• Наредната година
• Наредните неколку години
• Наредните 5-10 Години
• Повеќе од 10 години
Секција II: Основни прашања од областа на финансии
12. Претпоставете дека имате 1,000 денари на штедна сметка во банка и
каматната стапка е 2% на годишно ниво. Доколку воопшто не подигнете пари
од Вашата сметка, колку би имале на сметката по 5 години?
• Повеќе од 1,020 денари
• Точно 1,020 денари
• Помалку 1,020 денари
• Не знам
13. Претпоставете дека имате 1,000 денари на штедна сметка во банка и
каматната стапка е 20% на годишно ниво. Доколку воопшто не подигнете
пари од Вашата сметка, колку би имале на сметката по 5 години?
• Повеќе од 2,000 денари
• Точно 2,000 денари
• Помалку од 2,000 денари
10
• Не знам
14. Претпоставете дека каматната стапка на вашата штедна сметка во банка е 1%
на годишно ниво, а годишната инфлација е 2%. По една година, колку
производи ќе можете да купите со парите од Вашата сметка??
• Повеќе од денес
• Исто колку денес
• Помалку од денес
• Не знам
15. Претпоставете дека Александар денес добил наследство од 100,000 денари, а
неговиот брат Стефан ќе добие наследство од 100,000 денари по 3 години. Кој
е побогат поради добиеното наследството?
• Александар
• Стефан
• Никој, двајцата добија еднакво
• Не знам
16. Претпоставете дека Вашите примања во 2021 година ќе бидат двојно
поголеми од 2020 година. Цените на сите производи ќе бидат двојно
поголеми исто така. Колку производи ќе можете да купите со Вашите
примања во 2021 година?
• Повеќе од 2020
• Исто колку во 2020
• Помалку од 2020
• Не знам
Секција III: Поконкретни прашања од областа на финансии
17. Која од следните изјави најдобро ја опишува главната функција на берзата
(пазарот на акции)?
• Берзата помага да се предвиди очекуваниот профит од акциите
• Берзата ја зголемува цената на акциите
• Берзата е посредник помеѓу луѓето кои што сакаат да купат акции и
оние кои што сакаат да продадат акции
• Ниедно од горенаведените
• Не знам
18. Која од следните изјави е точна? Доколку купите акции од фирмата „Б“, Вие:
• Сте сопственик на дел од фирмата „Б“
• Позајмивте пари на фирмата „Б“
• Сте одговорни за долгот на фирмата „Б“
• Ниедно од горенаведените
• Не знам

11
19. Која од следните изјави е точна?
• Доколку инвестирате во инвестициски фонд, не можете да ги
повлечете парите во првата година
• Инвестициските фондови можат да инвестираат во различни хартии од
вредност, на пример акции и обврзници
• Инвестициските фондови плаќаат гарантирана стапка на добивка која
зависи од успехот во минатите години
• Ниедно од горенаведените
• Не знам
20. Која од следните изјави е точна? Доколку купите обврзници од фирмата „Б“
Вие:
• Сте сопственик на дел од фирмата „Б“
• Позајмивте пари на фирмата „Б“
• Сте одговорни за долгот на фирмата „Б“
• Ниедно од горенаведените
• Не знам
21. За инвестиции на долг рок (на пример, 10 или 20 години), кое од следните
средства би донело највисок профит:
• Штедна сметка во банка
• Обврзници
• Акции
• Не знам
22. Доколку инвестирате во повеќе различни средства (акции, обврзници и сл.)
Вашиот ризик од загуба:
• Се зголемува
• Се намалува
• Останува ист
• Не знам
23. Доколку купите 10 годишна обврзница - тоа значи дека не можете да ја
продадете по 5 години без да претрпите загуба?
• Точно
• Неточно
• Не знам
24. Акциите се најчесто поризични од обврзници. Точно или Неточно?
• Точно
• Неточно
• Не знам

12
25. Купување на акции од една компанија најчесто обезбедува посигурен профит
од инвестирање во инвестициски фонд. Точно или Неточно?
• Точно
• Неточно
• Не знам
26. Доколку пазарната каматна стапка се намали, што се случува со цените на
обврзниците?
• Ќе се зголемат
• Ќе се намалат
• Ќе останат исти
• Ниедно од горенаведените
• Не знам
27. Како би го оцениле Вашето знаење и разбирање за економија и финансии? Ве
молам, одберете на скала од 1 до 7 каде 1 означува најниско, а 7 означува
највисоко.


![Optimal Financial Literacy and Saving for Retirement...individualswithbusinessassets.10 [Figure1here] Ourevidence,consistentwithotherstudies(e.g. CampbellandViceira,2002),indicates](https://static.fdocuments.in/doc/165x107/61426953d9e4dc11f47f08c4/optimal-financial-literacy-and-saving-for-retirement-individualswithbusinessassets10.jpg)