Financial Lessons
38
SCHOOL OF SLAVONIC AND EAST EUROPEAN STUDIES SESS3005: Topics in Financial Management Week 1 Dr. Eugene Nivorozhkin
description
week one plus two
Transcript of Financial Lessons

SCHOOL OF SLAVONIC AND EAST EUROPEAN
STUDIES
SESS3005: Topics in Financial Management
Week 1
Dr. Eugene Nivorozhkin

Introduction:
Finance and the
Financial System
Bodie, Merton, and Cleeton
Chapters 1 & 2
2

What is Finance?
• Finance is the study of how people allocate scarce resources over
time.
• Distinct from other resource allocation decisions in that the cost and
benefits of financial decisions are:
i. spread out over time; and
ii. uncertain.
• The basic tenet: the existence of the financial system facilitate the
satisfaction of people’s consumption preferences.
• The financial system: set of markets and other institutions used for
financial contracting and the exchange of assets and risks:
– markets for stocks, bonds and other financial instruments;
– financial intermediaries (banks, insurance companies);
– financial service firms (advisory firms);
– regulatory bodies.
3

Financial Decisions: Assets and Liability
• An asset is anything that has economic value,
such as a bank account, a real estate or a share
in a business adventure.
• Asset allocation is the choice of investment.
• Liability is what you owe.
• Net worth= Asset –Liability
4

Financial Decisions: Households
• Consumption and saving –how much to spend
and how much to save?
• Investment–where to invest the savings?
• Financing–when and how to use other people’s
money?
• Risk-management–how much risk should one
take, and how to control it?
5

Financial Decisions: Firms
• Strategic planning–evaluation of costs and benefits over
time to see what business the firm wants to be in.
• To operate firms need capital.– Physical capital–buildings, machines, intermediate inputs.
– Financial capital–stocks, bonds, loans.
• Capital budgeting process–plan of acquisition of assets
and training of personnel to operate each investment
project.
• Capital structure decisions –feasible financing plan for the
firm as a whole.– Determines the claims(fixed payments to bond holders, residuals to share
holders) and control(shareholders).
6

Example of Role of Finance: Business
Organisation
• Sole proprietorship: owned by an individual or a
family, with unlimited liability, i.e. the proprietor’s
other personal assets can be seized to pay debts.
• Partnership: ≥2owners
– limited partners –don’t manage the business
– general partners–unlimited liability
• Corporation: legal entity distinct from owners.
7

Example of Role of Finance: Cont’d
• Advantages of Corporations
– Ownership can be transferred without disruption.
– Limited liability, i.e. owners are protected.
– Can appoint professional managers.
– Pooling of resources to achieve scale.
– Risk diversification for owners.
• But: may lead to conflict of interest.
– Managers should serve the best interests of the owners.
– But shareholders do not have the same info / expertise.
– Impractical when the number of shareholders is large.
8

Example of Role of Finance: Cont’d
1. Defining goal: Shareholder-Wealth Maximisation
– Profit-maximisation entails ambiguities: multi-period production /
uncertainty.
– Share price is well defined and unambiguous.
– With well-functioning capital markets,
• Shareholders can risk-diversify ⇒only the share value matters.
• The market studies in detail the impact of managers’ decision on the
firm’s value.
2. Market Discipline
– Owners do not have the expertise / information.
– Information is a public good –no incentive to gather info.
– Takeover bidders supply market discipline.
• Thus the existence of a well-functioning stock market facilitate
the separation of ownership / management.9

The Flow of Funds
• Funds flow from surplus
units to deficit units through
markets, intermediaries, or
both.
• Intermediaries are the firms
whose primary business is
to provide financial services
and financial products:
– bank (currentaccounts, loans,
CDs …)
– investment company (mutual
funds …)
– insurance company (life
insurance …) 10
Key Financial Functions I
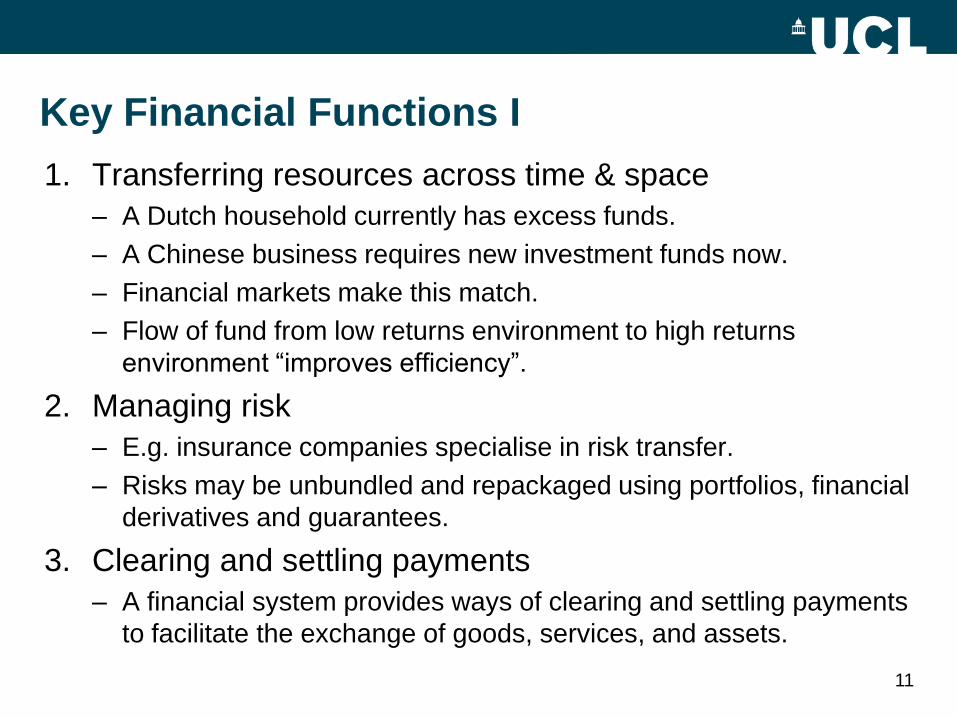
1. Transferring resources across time & space
– A Dutch household currently has excess funds.
– A Chinese business requires new investment funds now.
– Financial markets make this match.
– Flow of fund from low returns environment to high returns
environment “improves efficiency”.
2. Managing risk
– E.g. insurance companies specialise in risk transfer.
– Risks may be unbundled and repackaged using portfolios, financial
derivatives and guarantees.
3. Clearing and settling payments
– A financial system provides ways of clearing and settling payments
to facilitate the exchange of goods, services, and assets.
11

Key Financial Functions II
4. Pooling resources and dividing ownership in large assets
– T-bills have a minimum face value of $10,000. Solution: money
market mutual fund.
– Developing a promising technology would expose a single firm to
too much risk. Solution: joint venture.
5. Providing information
– Provides price information that helps coordinate decentralised
decision-making.
– Quoted prices may be used to estimate the value of similar non-
quoted securities.
– Option prices may be used to determine the market’s assessment
of a stock’s risk.
12
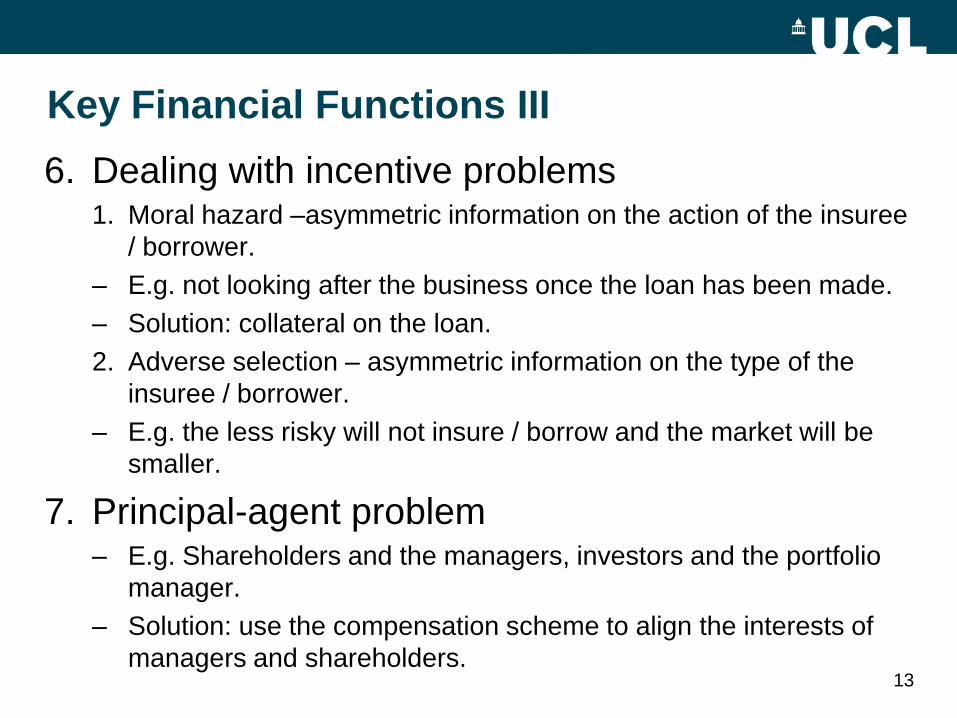
Key Financial Functions III
6. Dealing with incentive problems1. Moral hazard –asymmetric information on the action of the insuree
/ borrower.
– E.g. not looking after the business once the loan has been made.
– Solution: collateral on the loan.
2. Adverse selection – asymmetric information on the type of the
insuree / borrower.
– E.g. the less risky will not insure / borrow and the market will be
smaller.
7. Principal-agent problem– E.g. Shareholders and the managers, investors and the portfolio
manager.
– Solution: use the compensation scheme to align the interests of
managers and shareholders.13

Financial Markets
• By Basic Financial Assets:
– Debt: fixed income securities e.g. bonds, loans.
– Equity: common shares-residual claim on assets, with
limited liability.
– Derivatives: forwards, futures and options. Securities
that derive their value from other securities.
• By Maturity:
– Money Market• For short-term debt (less than one year).
– Capital Market• For long-term debt (more than one year) and equities.
14
Interest Rates
• The promised rates of return e.g. mortgage rate,
commercial loan rate.
• Depend upon:
1. Unit of account–the medium in which the payments
are denominated. Usually a currency, but may be a
commodity such as gold, silver, a standard “basket” of
goods and services.
2. Maturity–length of time to principal repayment.
3. Default risk – possibility of some portion of the interest
of the principal not being repaid.
15

Rates of Return on Risky Assets
• Many assets do not promise a rate of return
– Real estate
– Equity securities
– Works of art
• Return comes from:
• Any cash flows from the asset, such as dividends
• Capital gains
• Rate of return is calculated by,
16

Fundamental Determinates of Rates of Return
• Expected productivity of capital goods
• Capital goods productivity uncertainty
– Leads to positive risk premium.
• Time preferences of people
– The greater the preference for current consumption
over future, the higher the rate of interest.
• Risk aversion
– The greater the degree of risk aversion of the
population, the higher the risk premium required.
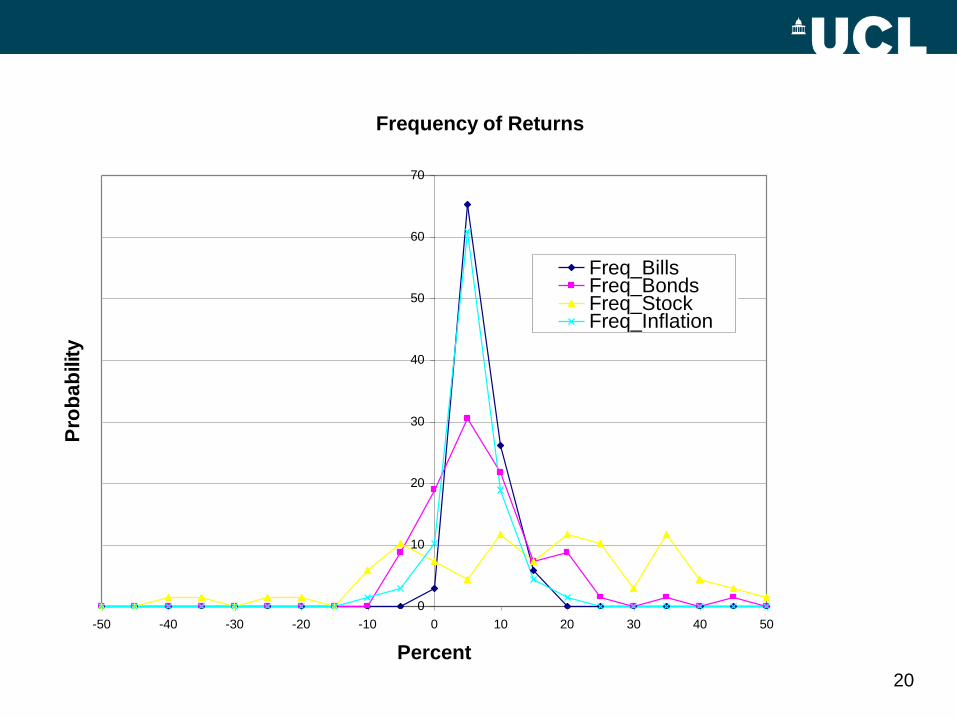
• The following graphs show the returns of selected
securities and inflation.17

18
Security Returns
-60.00
-40.00
-20.00
0.00
20.00
40.00
60.00
1925 1930 1935 1940 1945 1950 1955 1960 1965 1970 1975 1980 1985 1990 1995
Year
% R
etu
rn
Bills
Bonds
Stocks
Inflation
20
Frequency of Returns
0
10
20
30
40
50
60
70
-50 -40 -30 -20 -10 0 10 20 30 40 50
Percent
Pro
ba
bility
Freq_BillsFreq_BondsFreq_StockFreq_Inflation

Inflation and Real Interest Rates
• NominalPrices & Rates
– Prices and rates expressed in terms of currency.
• RealPrices & Rates
– Prices and rates in terms of purchasing power–unit of
account is the standardisedbasket of consumption
goods (c.f. CPI).
21

Financial Statements
Bodie, Merton, and Cleeton
Chapter 3
22
Financial Statements
• Financial Statements are:
• 1.Balance sheet
• 2.Income statement
• 3.Cash flow statement
• Functions are:
– Provide information to the owners & creditors of a firm about the
current status and past performance.
– Provide a convenient way for owners & creditors to set
performance targets (e.g. ROE) & to impose restrictions on the
managers of the firm.
– Provide a convenient templates for financial planning.
23

1. The Balance Sheet
• Summarises a firm’s assets, liabilities, and
owner’s equity at a point in time.
• Amounts measured at historical values and
historical exchange rates.
• Typically prepared according to GAAP (Generally
Accepted Accounting Principles or International
Financial Reporting Standards (IFRS).
• Exchange-listed companies must comply with the
adopted accounting rules.
24

GPC Balance Sheet on December 31
25

26
GPC Income Statement
for Year Ending 2xx1
Sales revenues 200.0
Cost of goods sold (110.0)
*Gross margin 90.0
Gen sell, & admin exp (30.0)
*Operating income 60.0
Interest expense (21.0)
*Taxable income 39.0
Income tax (15.6)
*Net income 23.4
Allocation to divs (10.0)
*Chg retained earn 13.4
Summarises the
profitability of a
company during a
time period.

3. The Cash-Flow Statement
• Show the cash that flowed into and from a firm in
during a time period.– Focuses attention on a firm’s cash situation
– Unlike the balance sheet and income statement, cash flow
statements are independent of accounting methods
• E.g. management’s judgment on how to value inventories, or how quickly to
depreciate tangible assets and amortise intangible assets.
• N.B. Working Capital Management:– Working capital= current assets (inventories + acc. rec.) –current
liabilities (accrued expenses + acc. payable).
– Many businesses that fail do so because of poor management of
working capital, not poor profitability.
– One aim is then to reduce the Cash Cycle Time= Inventory period
+ receivable period - payables period.27

GPC Cash Flow Statement, for the Year
ending Dec 31, 2xx1
28

29
GPC Balance Sheet at Dec 31, 2xx1
2xx0 2xx1 Change
Assets
Cash & mkt'ble secs 100.0 120.0 20.0
Receivables 50.0 60.0 10.0
Inventories 150.0 180.0 30.0
*Current assets 300.0 360.0 60.0
Pp&e 400.0 490.0 90.0
Acc depreciation (100.0) (130.0) (30.0)
*Net pp&e 300.0 360.0 60.0
**Total Assets 600.0 720.0 120.0
Liabilities & Equity
Accounts payable 60.0 72.0 12.0
Short-term debt 90.0 184.6 94.6
*Current liabilities 150.0 256.6 106.6
Long-term debt 150.0 150.0 -
**Total liabilities 300.0 406.6 106.6
Paid-in capital 200.0 200.0 -
Retained earnings 100.0 113.4 13.4
*Shareholders equ 300.0 313.4 13.4
Liab + Shareholder 600.0 720.0 120.0
GPC Income Statement
for Year Ending 2xx1
Sales revenues 200.0
Cost of goods sold (110.0)
*Gross margin 90.0
Gen sell, & admin exp (30.0)
*Operating income 60.0
Interest expense (21.0)
*Taxable income 39.0
Income tax (15.6)
*Net income 23.4
Allocation to divs (10.0)
*Chg retained earn 13.4
GPC Cash Flow Statement, for
the Year ending Dec 31, 2xx0
Net income 23.4
+ Depreciation 30.0
- Increase in acc rec (10.0)
- Increase in invent (30.0)
+ Increase in acc pay 12.0
*Total cash from operations 25.4
- Invest in new ppe (90.0)
*Cash flow invest' activities (90.0)
-Div paid (10.0)
+ Inc short-term debt 94.6
*Cash flow from financing 84.6
**Chng cash & mkt securities 20.0

4. Notes to Financial Statements
• Explains accounting methods used
– E.g. depreciation methods
• Details of assets and liabilities
– E.g. Expiration dates for debts
• Details of equity structure
– Conditions attached to ownership of shares
• Documents changes in operation
– Acquisitions and divestitures
• Documents off-balance-sheet items
– Derivatives, employee stock options
30
Market vs. Book Values
• The book values (the official accounting values of assets
and shareholders’ equity) do not equal the market values.
Why?
– The book value does not include all of a firm’s assets and
liabilities.
• Intangible assets such as patents and goodwill are included,
but brand loyalty, technological know-how, or a highly trained
loyal workforce are not valued.
• Some contingent liabilities such as law-suits are not routinely
disclosed, or only disclosed in the notes.
– The assets and liabilities on the balance sheet are valued at
original acquisition cost less depreciation.
• Assets of pension funds are now mark-to-marketed.
31

Accounting vs. Economic Measures of
Income
• Economist’s Measure of Net Income
– Net cash flow to shareholders plus change in market value of
existing shareholders equity.
• Accountant's Measure of Net Income
– Revenue less Expenses less Taxes
• Example: GPC
• Accounting net income was plus $23,400,000 in 2xx1
• But the total market value of the stock fell from
$200,000,000 to $187,200,000 from year 2xx0 to 2xx1.
The cash dividend to shareholders was $10,000,000. The
economic income in year 2xx1 was minus $2,800,000.
32

Returns to Shareholders vs. ROE
• The total shareholder return:
• Traditionally, corporate performance has been
measured by Return on Equity (ROE):
33
4.1200$
8.2$
Re
Million
Million
StartPrice
comeEconomicIn
StartPrice
ndsCashDivideStartPriceEndPriceturn

Analysis using Financial Ratios
• Despite the differences in accounting and financial
principles, the published accounts of a firm yield clues
about its financial condition.
• Five aspects of a firm’s performance:
– Profitability – measured w.r.t. sales (ROS), assets (ROA) or equity
base (ROE).
– Asset turnover – the firm’s ability to use its assets productively in
generating revenue (e.g. Sale / Assets = X times).
– Financial leverage – extent of debt and interest payment burdens.
– Liquidity – the firm’s ability to meet its short-term obligations.
– Market value – measures the relation between accounting
representation and the market value, e.g. price to earning (P/E).
• See p.85 Table 3.5 in BMC.
34

Financial Planning : Percent-of-Sales Method
• Financial planning is a dynamic process that follows a
cycle of making plans, implementing them, and revising
them in the light of actual results.
– Management forecasts the key external factors, including level of
economic activity, inflation, interest rates, and the competition’s
output and prices.
– Based on above, they forecast revenues, expenses, cash flows,
and implied need for external financing.
• Demonstrate using historical performance of GPC.
• Percent-of-sales method
– First examine which items in the income statement have
maintained a fixed ratio to sales.
• This enables us to decide which items should be forecast on projected
sales, and which need to be forecast on another basis.
35

36
GPC Financial Statements, Years xxx1 - xxx3(Nearest $ Million) (Percent of Year's Sales)
Year xxx0 xxx1 xxx2 xxx3 xxx1 xxx2 xxx3
Income Statement
Sales 200 240 288 100.0% 100.0% 100.0%
Cost of goods sold 110 132 158 55.0% 55.0% 55.0%
Gross margin 90 108 130 45.0% 45.0% 45.0%
Selling, general & admin. expenses 30 36 43 15.0% 15.0% 15.0%
EBIT 60 72 86 30.0% 30.0% 30.0%
Interest expenses 30 45 64 15.0% 18.8% 22.2%
Taxes 12 11 9 6.0% 4.5% 3.1%
Net income 18 16 13 9.0% 6.7% 4.7%
Dividends 5 5 4 2.7% 2.0% 1.4%
Change in shareholder's equity 13 11 9 6.3% 4.7% 3.3%
Balance SheetAssets:
Cash & equivalents 10 12 14 17 6.0% 6.0% 6.0%
Receivables 40 48 58 69 24.0% 24.0% 24.0%
Inventories 50 60 72 86 30.0% 30.0% 30.0%
Property, Plant & equipment 500 600 720 864 300.0% 300.0% 300.0%
Total Assets 600 720 864 1037 360.0% 360.0% 360.0%
Liabilities:
Payables 30 36 43 52 18.0% 18.0% 18.0%
Short-term debt 120 221 347 502 110.7% 144.6% 174.2%
Long-term debt 150 150 150 150 75.0% 62.5% 52.1%
Total Liabilities 300 407 540 704 203.7% 225.1% 244.3%
Shareholder's equity 300 313 324 333 156.3% 134.9% 115.7%

Percent-of-Sales Method: Cont’d
• The income statement may now be constructed
given the tax rate and the dividend pay-out ratio
(40% and 30%).
• The change in equity is added to the equity for
year xxx3, to give the new balance for year xxx4.
• “Total assets” is available, so the “Total liabilities”
may now be computed.
37

38

Percent-of-Sales Method: Cont’d
• Complete the balance sheet by recognising that
there are only two accounts that need to be
estimated: Short-term debt, and Long-term debt.
• The sum is then 904 (liabilities) – 62 (payables) =
$842 Million.
• Assuming no change in long-term debt then,
Short-term debt = 842 –150 = $692 million.
• Then in order to grow by 20%, the firm will need
an additional 692 -502 = $190 million in external
funding.
39