Financial Information Needs in Central Banks - CEMLA · Financial Information Needs in Central...
89
Restricted Financial Information Needs in Central Banks Bruno TISSOT Head of Statistics and Research Support, BIS Keynote speech CEMLA Meeting on Financial information needs for statistics, macro prudential regulation and supervision in central banks of Latin America and the Caribbean 15-16 May 2014, Mexico
Transcript of Financial Information Needs in Central Banks - CEMLA · Financial Information Needs in Central...

Restricted
Financial Information Needs in Central Banks
Bruno TISSOT Head of Statistics and Research Support, BIS Keynote speech CEMLA Meeting on Financial information needs for statistics, macro prudential regulation and supervision in central banks of Latin America and the Caribbean 15-16 May 2014, Mexico

Restricted 2
Outlines
l Financial Statistics – where do we stand 6 years after the crisis?
è I - Look at large banks… also in a granular way
è II - Look at financial markets globally: across countries… and sectors
è III - Have a financial stability-oriented, long-term perspective

Restricted 3
Financial Statistics – where do we stand 6 years after the crisis?
1. Still important information lessons to be taken 2. Implications for statisticians 3. The G20-endorsed data gap initiative (DGI) 4. BIS involvement in the DGI 5. Key opportunity to better address information needs 6. 3 key areas for central banks’ interest:
§ Banks § Financial markets § Financial stability orientation
Restricted 4
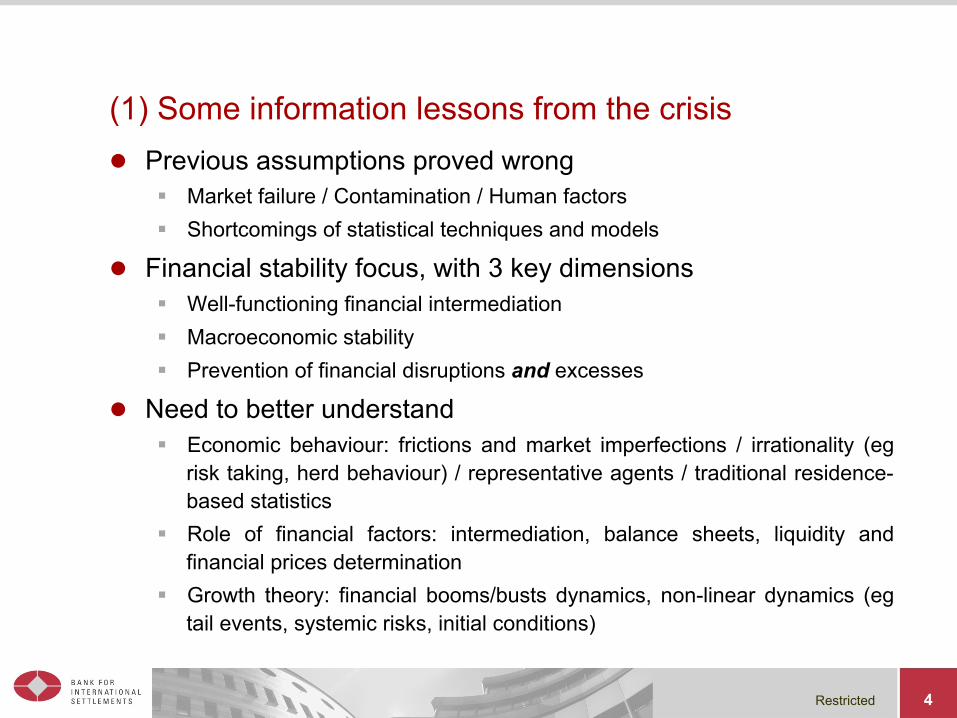
(1) Some information lessons from the crisis l Previous assumptions proved wrong
§ Market failure / Contamination / Human factors § Shortcomings of statistical techniques and models
l Financial stability focus, with 3 key dimensions § Well-functioning financial intermediation § Macroeconomic stability § Prevention of financial disruptions and excesses
l Need to better understand § Economic behaviour: frictions and market imperfections / irrationality (eg
risk taking, herd behaviour) / representative agents / traditional residence-based statistics
§ Role of financial factors: intermediation, balance sheets, liquidity and financial prices determination
§ Growth theory: financial booms/busts dynamics, non-linear dynamics (eg tail events, systemic risks, initial conditions)
Restricted 5
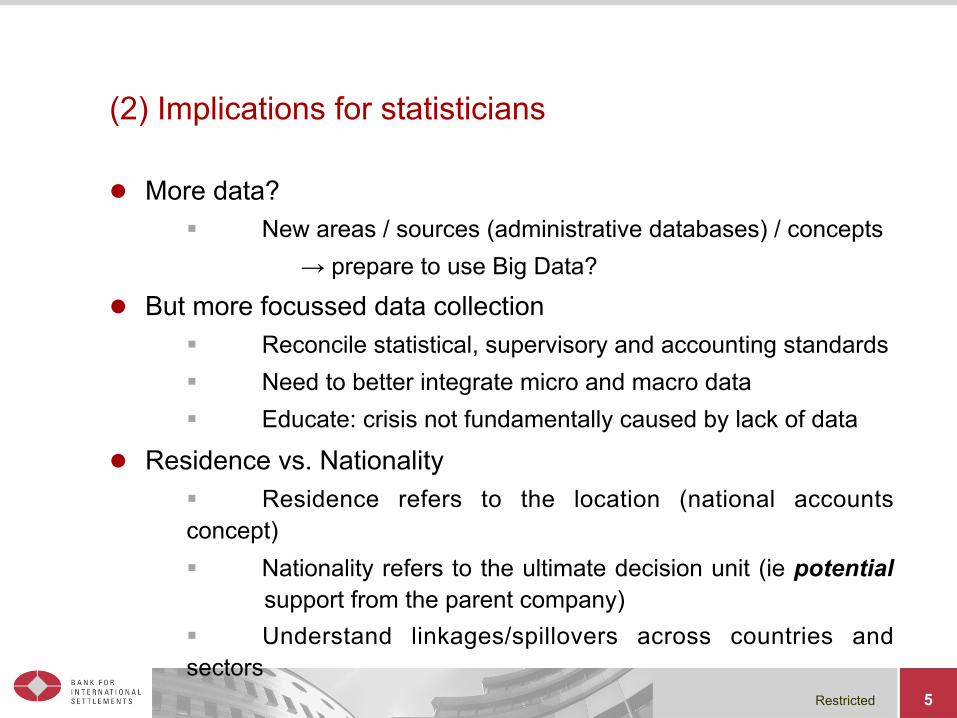
(2) Implications for statisticians
l More data? § New areas / sources (administrative databases) / concepts → prepare to use Big Data?
l But more focussed data collection § Reconcile statistical, supervisory and accounting standards § Need to better integrate micro and macro data § Educate: crisis not fundamentally caused by lack of data
l Residence vs. Nationality § Residence refers to the location (national accounts concept) § Nationality refers to the ultimate decision unit (ie potential support from the parent company) § Understand linkages/spillovers across countries and sectors

Restricted
(3) Data Gaps Initiative
l Initiative in 2009 of the FSB and IMF, at the request of the G20
l Coordination through InterAgency Group on Economic and Financial Statistics comprising main financial IOs
l Work pioneered by the BIS started before 2009 l BIS (and central banks) directly involved in around half of the
20 G20 recommendations
6

Restricted
(4) BIS involvement in G20 recommendations
l #4 Aggregate leverage and maturity mismatches (eg BIS’s funding risk indicators)
l #5 Credit default swaps: enhanced CDS statistics
l #7 BIS securities statistics revamped
l #8-9 Global Network Connections and Systemically Important Global Financial Institutions: BIS International Data Hub
l # 10 – 11 International Banking Statistics
l # 13 Cross-border exposures of Financial and Non-Financial Corporations reference guide
l #14 Inventory & navigation template on cross-border positions
l # 19 Real Estate Prices
7

Restricted
(5) Key opportunity to address information needs
l Indirect involvement of BIS & Basel-based committees in other recommendations
l Many recommendations interrelated
l Opportunity to coordinate and achieve international consistency in methodologies and definitions
l Identify new information needs: Shadow Banking, Legal Entity Identifier, derivatives
l Improving dissemination of statistics
l Follow up (guidance, implementation and monitoring)
8

Restricted
(6) 3 key areas for central banks:
I. Banks
II. Global financial markets
III. Financial stability orientation
9
Restricted 10
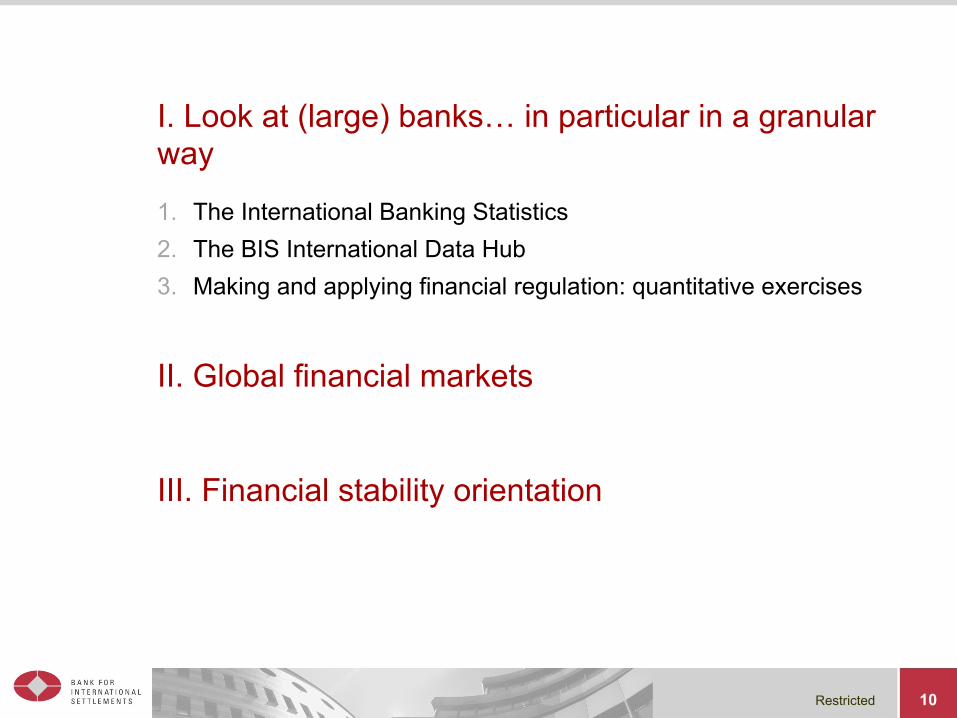
I. Look at (large) banks… in particular in a granular way
1. The International Banking Statistics 2. The BIS International Data Hub 3. Making and applying financial regulation: quantitative exercises
II. Global financial markets
III. Financial stability orientation

Restricted 11
(I.1) Monitoring banks: the International Banking Statistics (IBS)
l Balance sheet information § amounts outstanding at quarter-end
l With a country breakdown of (non-resident) counterparties § positions vis-à-vis >200 territories
l Reported by internationally active banks § banks that lend in foreign currency or to non-residents
l Worldwide § 31+ countries and financial centres
l Central banks’ cooperation under guidance from the Committee on the Global Financial System (CGFS)
l By residence / by nationality

Restricted 12
(I.1) IBS cont’d - History
l Introduced in 1964 / developed to analyse issues in international banking
ü 1960s international deposit (“euro-currency”) markets and focus on international banks’ assets and liabilities
ü 1970s recycling of petro$: interest in counterparty countries and offshore centres
ü 1980s debt crisis: attention to external debt statistics
ü 1990s Asian crisis: focus on country risk exposure and risk transfers
ü 2007-8 crisis: interest in banks’ funding and lending patterns

Restricted 13
(I.1) IBS cont’d - Locational dataset
l Look at financial flows through the international banking system
ü All banking offices in a reporting country (residency concept)
ü Banks’ claims & liabilities (inc. inter-office positions)
ü Banking offices identified by their nationality
l Two subsets of Locational Banking Statistics
ü Residence basis
ü Nationality basis

Restricted 14
ü International claims and liabilities of banks by residence, ie all banks vis-à-vis a particular country
ü Ex: * Assets placed by Turkish residents in banks that reside outside Turkey = Liabilities of foreign reporting banks vis-à-vis Turkey = 44
* External assets of foreign banks on Turkey residents = Liabilities owed by residents of Turkey to (BIS reporting) foreign banks = 188
(data at end Q3-2013 , bn USD)
(I.1) IBS cont’d - Locational by residence

Restricted 15
ü International claims and liabilities of banks by residence and nationality of ownership (ie all banks in a country are reported with a split by home country banks and individual nationality of foreign banks)
ü Ex: International positions of worldwide banks’ offices of US nationality (ie a US bank X located either in the US or in any reporting countries), assets: = 3,692 è of which:
* vis-à-vis related offices: 1,370 (ie office of US bank X in country A to another office of the same bank X in country B)
* vis-à-vis other banks: 909 * vis-à-vis non-banks: 1,376
(data at end Q3-2013, bn USD)
(I.1) IBS cont’d - Locational by nationality
Restricted 16
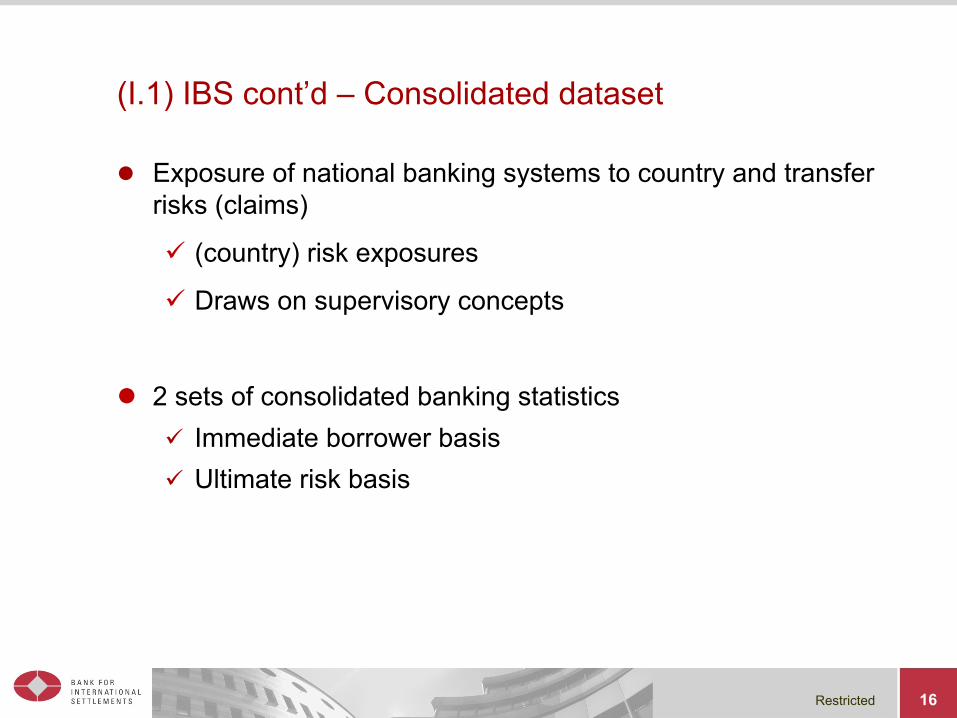
(I.1) IBS cont’d – Consolidated dataset
l Exposure of national banking systems to country and transfer risks (claims)
ü (country) risk exposures
ü Draws on supervisory concepts
l 2 sets of consolidated banking statistics ü Immediate borrower basis ü Ultimate risk basis

Restricted 17
(I.1) IBS cont’d – Consolidated on an Immediate Borrower (IB) basis
ü Foreign claims of the banks of one country nationality (among 31), consolidated worldwide
ü Ex: Total foreign claims vis-à-vis China (IB basis): 1,003 è of which: Local currency positions with local residents: 197 Total international claims: 806
+ Net risk transfers to China: 44 = Total foreign claims vis-à-vis China on an UR basis: 1,048
(data at end Q3-2013 , bn USD)
Restricted 18
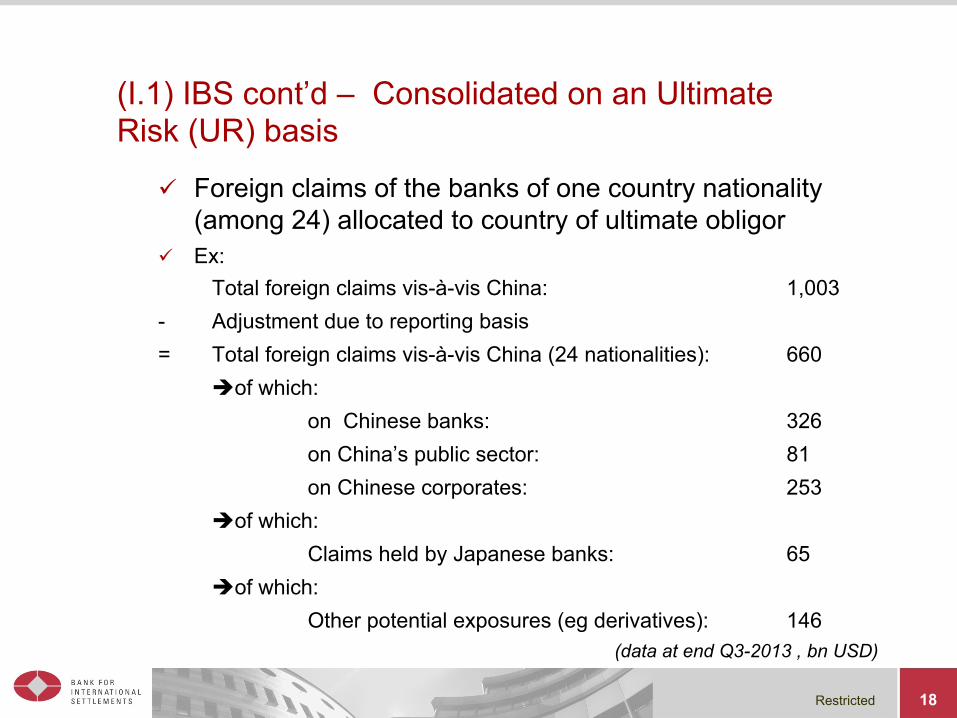
(I.1) IBS cont’d – Consolidated on an Ultimate Risk (UR) basis
ü Foreign claims of the banks of one country nationality (among 24) allocated to country of ultimate obligor
ü Ex: Total foreign claims vis-à-vis China: 1,003
- Adjustment due to reporting basis = Total foreign claims vis-à-vis China (24 nationalities): 660
èof which: on Chinese banks: 326 on China’s public sector: 81 on Chinese corporates: 253 èof which: Claims held by Japanese banks: 65 èof which: Other potential exposures (eg derivatives): 146
(data at end Q3-2013 , bn USD)

Restricted 19
(I.1) IBS cont’d – Country coverage
l G20 ü New reporters: Indonesia (2012, locational), Korea (2013,
consolidated), Argentina (2014, locational), Russia (test data) ü Preparatory work by Saudi Arabia and China
l Financial centres ü “Offshore centres” recognised as banking sectors dealing primarily
with non-residents and/or in foreign currency on a scale out of proportion to the size of the host economy
ü Already 12 reporting countries (only 3 for consolidated) ü Counterparties: vis-à-vis public data for 22 offshore centres
l Coverage declining since 2002, eg from about 95% to 90% of estimated global interbank activity
Restricted 20
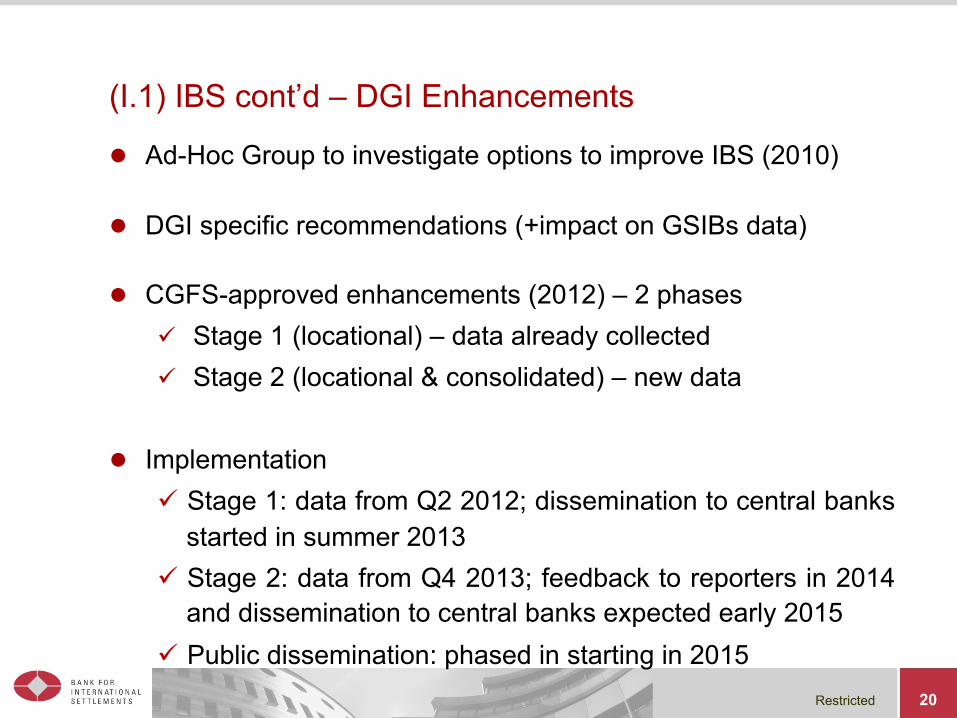
(I.1) IBS cont’d – DGI Enhancements
l Ad-Hoc Group to investigate options to improve IBS (2010)
l DGI specific recommendations (+impact on GSIBs data)
l CGFS-approved enhancements (2012) – 2 phases ü Stage 1 (locational) – data already collected ü Stage 2 (locational & consolidated) – new data
l Implementation ü Stage 1: data from Q2 2012; dissemination to central banks
started in summer 2013 ü Stage 2: data from Q4 2013; feedback to reporters in 2014
and dissemination to central banks expected early 2015 ü Public dissemination: phased in starting in 2015

Restricted 21
(I.1) IBS cont’d – Enhancements – Stage 1 (locational)
l Full financial balance sheet: ü More complete data ü Refined FX breakdown ü Local currency positions against residents
l New counterparty-country dimension: ü Crossing nationality of the reporter / location of the reporter /
location of the counterparty ü Ex: liabilities of German banks that reside in the UK vis-à-vis
counterparties located in Japan (before: vis-à-vis counterparties in all other countries combined)

Restricted 22
(I.1) IBS cont’d – Enhancements – Stage 2 (locational & consolidated)
l Country credit risk (CBS): ü Exposures to residents of the country where the bank is
headquarted ü Size of bank’s total balance sheet
l International bank credit: ü More granular counterparty-sector (eg banks’ exposure to the non-
bank financial sector) – CBS/LBS ü Breakdown by type of banking office (domestic banks, branches,
subsidiaries) – LBS l Banks’ funding patterns
ü Breakdown by instruments (eg deposits, debt securities, equity) – CBS
ü Basic maturity split for debt securities – LBS

Restricted 23
Locational residence Locational nationality
Consolidated Immediate Risk Consolidated Ultimate Risk
Reporting countries 44 43 31 24
Business reported Financial assets & liabilities (inc. derivatives)
Financial assets Total assets & liabilities, capital
Risk transfers
Financial assets Other potential
exposures
Bank type
All reporting banks, Bank types (eg
branches)
n.a.
All reporting banks
Domestic banks
Domestic banks
Bank nationality n.a. ≥43 ≥31 ≥24
Type of position Cross-border Local
Total International (cross-border& FX local)
Local in LC
Total Cross-border,
Local in all currencies
Currency Local, USD, EUR, JPY, GBP, CHF, others optional
For local in LC positions: >160 n.a.
Maturity For debt securities For international claims
n.a.
Instrument Loans & deposits Debts securities
Other
For liabilities
(debt securities)
Assets: claims, total, RWA Liabilities: deposits, debt securities,
derivatives, others Capital: total equity, Tier1
Other potential exposures:
derivatives, credit commitments,
guarantees
Counterparty country (inc. reporting country)
>200 ≥76 >200
Counterparty sector Banks (inc. related offices, CBs) Non-bank financial institutions
Non-financial sector (split)
Official sector Banks (excl. CBs)
Non-bank private sector (split)
(I.1) IBS cont’d – a bird eye's view

Restricted
(I.1) IBS cont’d – examples of analytical benefits l Credit exposures of national banking systems
ü Scaled against measures of total balance sheet, equity ü Analysis of banks‘ sources and uses of all major currencies
l Refined sector breakdown ü Tracking the supply of credit to various types of counterparty ü Non-bank financial sector (shadow banking system)
l Full geography of banks‘ international activities ü Analyse transmission of shocks across countries through
nationality of banking systems ü Differences in lending/funding behaviour by bank types ü Funding currency mismatches ü Banks’ aggregate funding by broad instrument type
24

Restricted 25
(I.1) IBS cont’d – Challenges with the new data
l New, expanded templates ü Data Structure Definitions ü Massive increase in amount of data ü New IT applications
l Quality issues ü Granularity ü Confidentiality issues, potentially constraining analytical
benefits and dissemination outside central banks ü Long transition period: many breaks in series
l Research issues ü Analysing big, complex data ü Educating (a variety of) users ü Making use of the new data for policy work

Restricted 26
(I.1) IBS cont’d – Further avenues considered
l Bank consolidation ü Rules left to discretion eg national supervisory practices ü CGFS recommendation for “best practice” definition / BCBS work? ü Parent country of a reporting bank: location of the bank’s group-level
supervisor («home» supervisor)? ü Link with DGI recommendation #13?
l Ultimate risk exposures ü Potential enhancements to IBS ultimate risk data? ü Alternative measures of country risk exposures?
l Comparability of IBS derivatives data ü Across countries (eg inclusion of derivatives in financial instruments,
netting of reported CDS sold under “guarantees”)? ü Consistency with OTC derivatives statistics?

Restricted 27
(I.2) The BIS International Data Hub (IDH) – Purpose
l Collect data on almost 30 G-SIBs to assess § Interlinkages among largest banks § Concentration of these institutions to sectors and markets
l Data § Weekly, monthly and quarterly individual data submissions § Accuracy, confidentiality, completeness and timeliness § Coordinate on banks’ compliance with reporting guidelines
l Analytics § Aggregate reports § Development of analytical tools and metrics
l BIS Secretariat reports to the Hub Governance Group (HGG) § Evolution of previous collection exercises by senior supervisorss

Restricted 28
(I.2) IDH cont’d – Data collection in 3 phases
l Phase I - 2013 § I-I data: “Institution-to-institution” data
Ø Exposures of G-SIBs to their major counterparties (bilateral data) § I-A data: “Institution-to-aggregate” data
Ø Concentration of G-SIBs to sectors and markets Ø Individual bank data underlying the BIS consolidated banking statistics Ø CGFS Stage 2 enhancements to be reported to the Hub
l Phase II – 2014: I-I Funding template § G-SIBs I-I liabilities, largest funding providers (bank & non-banks) § Funding structure (eg use of wholesale funding)
l Phase III – 2015: Expanded I-A templates § Consolidated balance sheet by country / sector / instrument /
currency / maturity § Pilot project with the industry

Restricted 29
(I.3) Quantitative Impact Studies (QIS): making financial regulation
l Major new financial regulation initiatives for banks § Context: a new regulatory framework that factors in crisis’ lessons § QIS have become a central element of the Basel Committee work § Governor Ingves: Where to next? Priorities and themes for the Basel
Committee, 12 March 2013
l QIS support for well-informed policymaking § Underpinning BCBS initiatives is a framework for the collection and
analysis of data to assess the quantitative impact of a particular policy § Lessons-learned, ongoing policy development process so as to adapt to:
ü the functioning of regulation; ü new identified areas of weakness; ü unintended consequences; ü business incentives related to the adoption of reforms.

Restricted 30
(I.3) QIS cont’d – Policy-driven study cycle
l Data collection process § Technical setup of template § Data collection § Data quality checks
l Template process • Initiated by work groups • Definition of content
l Data analysis • Analysis of data • Preparation of report • Refined regulation

Restricted 31
(I.3) QIS cont’d – applying financial regulation
l QIS as a tool for regulation monitoring on an ongoing basis and… § Evolving nature of the banking industry § Helps to clarify local implementation of global rules § Basel III monitoring reports
→ QIS to ensure effective implementation
l … for selecting entities of special interest § Indicator-based measurement approach for defining G-SIBs § Refinement of the methodology § Regular review of the (public) list § Confidentiality issues and public disclosure

Restricted 32
(I.3) QIS cont’d – assessing regulatory interactions
§ Different regulatory requirements introduced in parallel (eg capital, leverage, liquidity)
§ QIS help to assess the impact of one requirement on the other field of the regulatory reform
§ Ex: how will banks’ leverage ratio evolve if they raise capital to meet the new capital ratios?

Restricted 33
(I.3) QIS cont’d – Organisation
l Micro data § Submissions of individual banks to national supervisors, confidential § Basel III monitoring: 227 banks (consolidated) by broad panels, on a semi-
annual basis § Importance of the distribution of the results § No assumptions (forecasts) on future profits nor on behavioural responses
(eg potential management responses to mitigate impact of regulation)
l Calculations § Compares current ratios (eg capital, leverage, liquidity) to the new
regulation (eg higher requirements, definition changes) § Creates a composite bank at a total sample level § Helps assess the direct impact of the new standards and related shortfalls

Restricted 34
(I.3) QIS cont’d – (micro) data collection exercises
Data templates
Submission to national supervisory agencies
Upload to BIS Reports
Database at the BIS
institution 1
institution 2 …
institution N Data mapping
Feedback on regulation, FAQs

Restricted 35
→ Main findings for largest international banks (Group 1): Ø Under full Basel III, CET1 capital (highest form of loss absorbing capital)
would decline from 11.0 to 9.5% compared to the situation as of 30/06/13 Ø Aggregate shortfall (sum across banks for which a shortfall is observed
compared to the minimum requirements): 3.3 bn €
(I.3) QIS cont’d – Example of assessments
Restricted
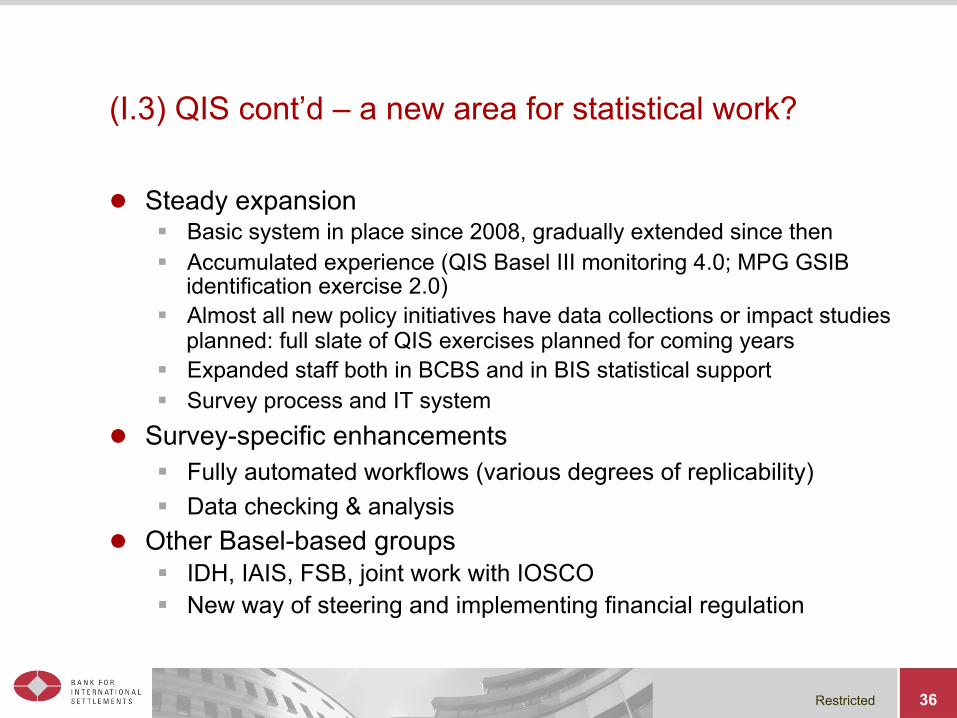
(I.3) QIS cont’d – a new area for statistical work?
l Steady expansion § Basic system in place since 2008, gradually extended since then § Accumulated experience (QIS Basel III monitoring 4.0; MPG GSIB
identification exercise 2.0) § Almost all new policy initiatives have data collections or impact studies
planned: full slate of QIS exercises planned for coming years § Expanded staff both in BCBS and in BIS statistical support § Survey process and IT system
l Survey-specific enhancements § Fully automated workflows (various degrees of replicability) § Data checking & analysis
l Other Basel-based groups § IDH, IAIS, FSB, joint work with IOSCO § New way of steering and implementing financial regulation
36

Restricted 37
I. Banks II. Look at financial markets globally: across countries… and sectors
1. Assessing global liquidity 2. Shadow banks 3. Debt securities 4. Derivatives
III. Financial stability orientation
Restricted
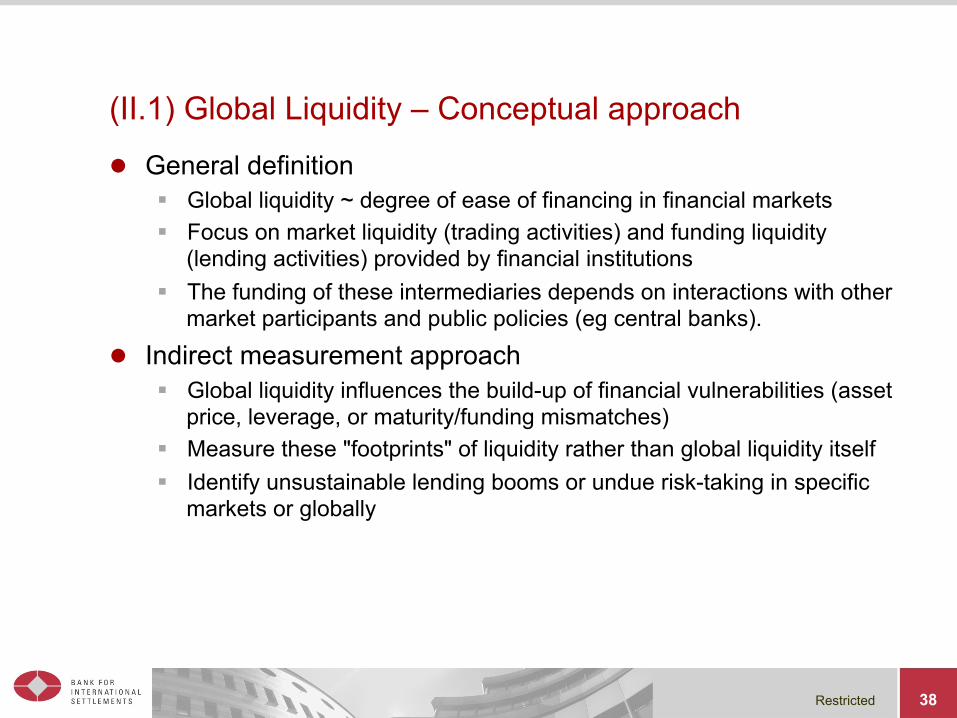
(II.1) Global Liquidity – Conceptual approach
l General definition § Global liquidity ~ degree of ease of financing in financial markets § Focus on market liquidity (trading activities) and funding liquidity
(lending activities) provided by financial institutions § The funding of these intermediaries depends on interactions with other
market participants and public policies (eg central banks).
l Indirect measurement approach § Global liquidity influences the build-up of financial vulnerabilities (asset
price, leverage, or maturity/funding mismatches) § Measure these "footprints" of liquidity rather than global liquidity itself § Identify unsustainable lending booms or undue risk-taking in specific
markets or globally
38

Restricted 39
(II.1) Global Liquidity cont’d – role of international credit
Ø International component of credit is often the marginal source of financing in the run-up to crises
Ø Flows are relatively small but can amplify domestic trends
Ø They are highly correlated with financial booms and busts

Restricted
(II.1) Global Liquidity cont’d – Indicators for assessing liquidity l Focus on private credit
§ Key indicator showing how far the ease of financing can lead to the build-up of exposures
§ Primarily provided by banks § Comprises both a domestic and an international element § International component in IBS statistics: cross-border lending to
non-residents or lending in foreign currency l Capturing additional aspects of global liquidity
§ Financing conditions in key markets § Incentives for position-taking across market segments § Indicators of risk appetite (a major driver of leverage and investors’
willingness to provide funding) § Flexible approach because is the information content of these
indicators changes over time
40

Restricted 41
(II.1) Global Liquidity cont’d – Bond market credit and bank lending to non-residents Global credit in US dollars and euro
growth in $&€ bond market credit to non-residents strong…
… compared to domestic credit…
… and to bank lending to non-residents esp. €-based…
… but stocks of exposures are still high

Restricted 42
(II.1) Global Liquidity cont’d – domestic and cross-border bank credit to non-banks
Domestic bank credit to non-banks continue to grow except in Europe…
…while growth in cross border credit to non banks has fallen in most regions…
…except Asia (build up of vulnerabilities?)

Restricted 43
(II.1) Global Liquidity cont’d – assessment to be completed by a variety of other indicators

Restricted 44
(II.2) Shadow banks l FSB Global Shadow Banking Monitoring Report 2013
§ Shadow banking system: credit intermediation involving entities and activities outside the regular banking system
§ Data: 25 jurisdictions, covering 80% of global GDP § Offshore centres not captured
l Policy importance of the expansion of credit provided by the non-bank sector § Monitoring broad financial intermediation § Linkages: transmission of stress in one sector to the other § Potential systemic risks: maturity/liquidity transformation, imperfect
credit risk transfer, leverage § Influence of regulatory arbitrage

Restricted 45
(II.2) Shadow banks cont’d – Methodology l “Macro-mapping”
§ Conservative estimate based on national Flow of Funds (FoF, balance sheet data) for all non-bank financial intermediation
§ Primary focus on “Other Financial Intermediaries” (OFIs) § FoF statistics on an entity residence basis
l “Narrowing down”: use of more granular data to filter out: § Assets related to self-securitisation (retained securitisation); or § with no direct relation to credit intermediation (eg “pure” equity
investment funds); or § already prudentially consolidated into banking groups (eg finance
company that is a subsidiary of a banking group for which capital buffers are set on a consolidated basis)

Restricted 46
(II.2) Shadow banks cont’d – Approach
Measuring the shadow banking system
Simplified conceptual image
1 Bank-‐like systemic risks include maturity transformation, liquidity transformation, imperfect risk transfer, and leverage .
Source: Financial Stability Board, Global shadow banking monitoring report, 2013.

Restricted 47
(II.2) Shadow banks cont’d – Main findings l Conservative “macro mapping” estimates
§ OFIs’ proxy of the shadow banking system: $71 trillion (+5 trillion from 2012)
§ 24% of total financial assets (about half of banking system assets) § 117% of GDP
Assets of non-‐bank financial intermediaries
20 jurisdictions and euro area
Per cent USD trillion
Source: Financial Stability Board, Global shadow banking monitoring report, 2013.

Restricted 48
(II.2) Shadow banks cont’d – Main findings
l Geographic distribution § Largest non-bank financial systems are in advanced economies
Size of non-‐bank financial intermediaries
As a percentage of GDP, by jurisdiction
AR = Argentina; AU = Australia; BR = Brazil; CA = Canada; CH = Switzerland; CN = China; CL = Chile; DE = Germany; ES = Spain; FR = France; HK = Hong Kong ; ID = Indonesia; IN = India; IT = Italy; JP = Japan; KR = Korea; MX = Mexico; NL = Netherlands; RU = Russia; SA = Saudi Arabia; SG = Singapore; TR = Turkey; UK = United Kingdom; US = United States; XM = Euro area; ZA = South Africa.
1 Note that ‘banks’ refer to the broader category of ‘deposit-‐taking institutions’. 2 20 jurisdictions and euro area.
Source: Financial Stability Board, Global shadow banking monitoring report, 2013.

Restricted 49
(II.2) Shadow banks cont’d – Main findings
l Geographic distribution § Most rapid increases are in EMEs: 4 with growth rates above 20%
Annual g rowth of non-‐bank financial intermediaries
By jurisdiction, in per cent
AR = Argentina; AU = Australia; BR = Brazil; CA = Canada; CH = Switzerland; CN = China; CL = Chile; DE = Germany; ES = Spain; FR = France; HK = Hong Kong ; ID = Indonesia; IN = India; IT = Italy; JP = Japan; KR = Korea; MX = Mexico; NL = Netherlands; RU = Russia; SA = Saudi Arabia; SG = Singapore; TR = Turkey; UK = United Kingdom; US = United States; XM = Euro area; ZA = South Africa.
1 Weighted average of 20 jurisdictions and euro area.
Source: Financial Stability Board, Global shadow banking monitoring report, 2013.

Restricted 50
(II.2) Shadow banks cont’d – Main findings l Composition
§ Largest sector (35%): other investment funds (eg equity, fixed income) § Main others: broker dealers, structured finance vehicles, finance
companies and money market funds § Hedge funds underestimated (limited granular FoF data, offshore centres)
Sub-‐sectors of non-‐bank financial intermediaries
25 jurisdictions, at end-‐2012
Decomposition by sub-‐sector1 Other investment funds by type
1 Adding the results published in the 2013 IOSCO Hedge Fund Survey Report and the number reported by participating jurisdiction s in the FSB exercise would increase the share of hedge funds to 3%.
Source: Financial Stability Board, Global shadow banking monitoring report, 2013.
Other investment funds, 35%
Broker-‐dealers12%
Str. financevehicles, 8%
Finance cos8%
MMFs6%
Other trust cos2%
Real estate investment
funds/trusts, 1%
Hedge funds 0.2%
US financial holding cos, 7%
Dutch special financing
institutions, 5%
US fundingcorps, 4%
Others (identified)
2%
Others (unidentified)
9%
Equity44%
Bond34%
Not equityor bond15%
Other7%

Restricted 51
(II.2) Shadow banks cont’d – Narrowing down exercise
l 20 jurisdictions reported granular data § For this sample OFIs’ assets revised down from $55 to 35 trillion § 2012/13 growth revised from +6% to +3% § Half of the correction due to prudential consolidation impact
Narrowing down shadow banking
20 jurisdictions1; at end-‐2012
USD trillion
1 20 jurisdictions reported more g ranular data for narrowing down.
Source: Financial Stability Board, Global shadow banking monitoring report, 2013.

Restricted 52
(II.2) Shadow banks cont’d – Looking at interconnections
l Direct linkages when shadow banking entities : § form part of the bank intermediation chain § are directly owned by banks § benefit directly from bank support (explicit or implicit) § or have funding interdependence with banks (eg holding of each other’s
assets such as debt securities)
l Indirect linkages § Investment in similar assets § Exposure to common counterparties èThese connections can create contagion channels, and can be amplified through feedback loops

Restricted 53
(II.2) Shadow banks cont’d – Going forward l Data enhancements
§ FoFs; Risk factor data (eg maturity transformation)
l Compiling measures of interconnectedness § Direct measure of credit exposure and funding dependence § Methodology based on aggregate balance sheet exposure between banks
and shadow banking entities (eg assets and liabilities of banks to OFIs) A risk analysis framework of interconnectedness between banks and shadow banking entities
Source: Financial Stability Board, Global shadow banking monitoring report, 2013.
BANK OFI
a (Assets of bank to OFI)a (Assets of bank to OFI)
Bank assets = BABank assets = BA OFI assets = OAOFI assets = OA
aBAaBA
Credit risk for bank
Credit risk for bank
bBAbBA
aOAaOA
bOAbOA
Funding risk for bank
Funding risk for bank
Funding risk for OFI
Funding risk for OFI
Credit risk for OFI
Credit risk for OFI
High-‐ level risk measures:High-‐ level risk measures:
b (Liabilities of bank to OFI)b (Liabilities of bank to OFI)

Restricted 54
(II.3) Debt securities – BIS data collection
l International debt securities (BIS data) § Security-by-security database, very flexible § Multiple breakdowns: instrument, currency, maturity bands,
interest rate, rating, guarantees § Gross issues, net issues, repayments, outstanding amounts – face
value § Information by residence and nationality (ie residency of the
controlling parent) § Information on holders?
l Domestic debt securities national and public data § Cooperation between BIS and national authorities (eg central
banks) § Available breakdowns: original maturity, sector, currencies
l Total debt securities (national data) § DGI Recommendation #7

Restricted 55
(II.3) Debt securities cont’d – new definition of international securities l The BIS has revised its debt securities statistics to enhance
their comparability across different markets l Old definition: debt securities targeted at international investors
- Securities issued in a foreign market - Securities issued in a local market, if they are either:
ü denominated in a foreign currency; or ü underwritten by at least one foreign bank
l New definition: debt securities issued in a foreign market (ie outside the market where the borrower resides)

Restricted 56
(II.3) Debt securities cont’d – identifying international issues l 4 criteria
- Currency of denomination; but growing local currency issuance offshore
- Primary market - Secondary market - Governing law
l BIS Practice - Bonds issued in local market are typically issued in local
currency under the local law - Focus on the primary market - 3 elements for identifying the market of issue:
→ registration domain / listing place / governing law - For 50% of the IDS all these 3 characteristics point to a market
different from the market of the residence (and for 35% at least one characteristic does)

Restricted
(II.3) Debt securities cont’d – Reporting template (all markets)
TotalOf which Central bank
Of which Deposit-taking corporations
Total
Of which Central
government
All interest rates
Fixed interest rateVariable interest rateAll interest rates
Fixed interest rateVariable interest rateAll interest rates
All issuers
Short term at original maturity
Long term at original maturity
All maturities
General Non-financial
corporations
Residents
Non-residents
Memo item: Long term at original maturity, with a remaining maturity up to and including one year
Memo item: Securitisation debt securities
Financial corporations

Restricted 58
(II.3) Debt securities cont’d – shift from bank lending to bond markets: the “second phase of global liquidity”?
External financing flows (US$bn)
Restricted 59
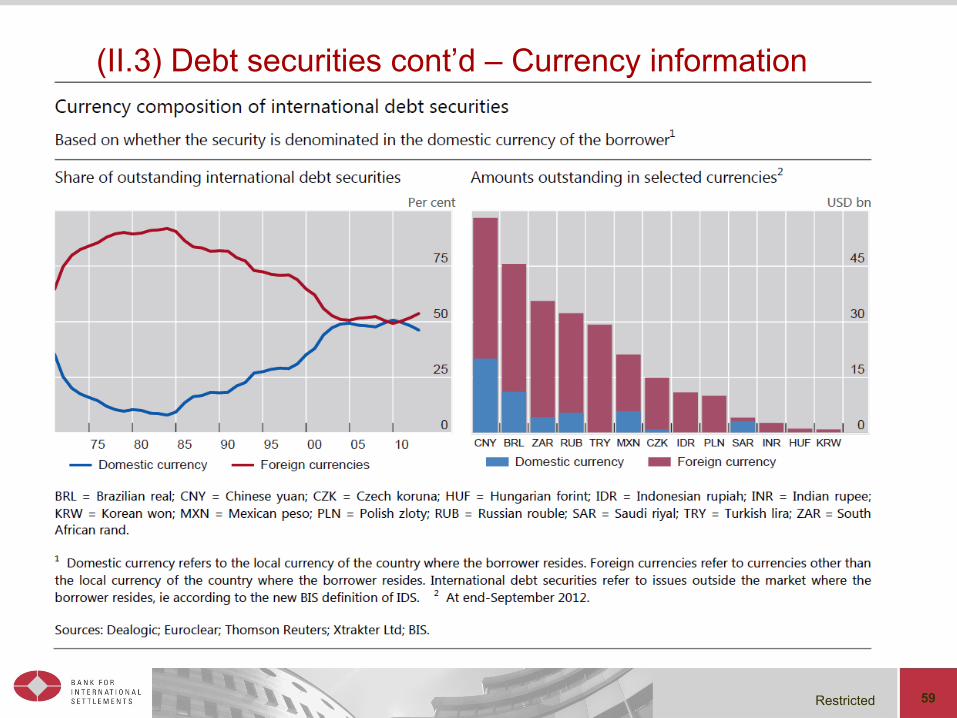
(II.3) Debt securities cont’d – Currency information
Restricted
l Introduction of the euro: borrowers in the euro area able to switch from foreign currency to domestic currency funding.
l Large EMEs (eg Brazil, China, Russia) able to issue abroad in their own currency
l Bonds denominated in EME currencies are increasingly being issued by non-residents as well
(II.3) Debt securities cont’d – increase in the share of domestic currency IDS

Restricted
(II.3) Debt securities cont’d – by residence and nationality (use of foreign affiliates to raise funds abroad)
61

Restricted 62
(II.3) Debt securities cont’d – EME use of affiliates to raise funds abroad

Restricted
(II.4) Derivatives reporting by the BIS
l The BIS compiles 2 major sets of statistics on derivatives: § Notional amounts outstanding and gross market values of
OTC derivatives (semi-annual & triennial), globally consolidated basis
§ turnover of OTC derivatives (triennial), sales desks basis
l Relevant for financial stability analysis at a global level l Focus of regulation (CCPs) l Allows monitoring of particular market segments
63

Restricted
(II.4) Derivatives cont’d – The semi-annual OTC derivatives survey
l Comprehensive and internationally consistent information on largest markets (13 reporting countries)
l Data on notional amounts outstanding & gross market values for: § forwards, swaps & FX options, interest rate, equity,
commodity derivatives § credit default swaps (CDS), by sector and rating, and with
granular information on CDS counterparties (eg CCPs, SPVs, Hedge Funds)
§ plus information on market concentration
64
Restricted 65
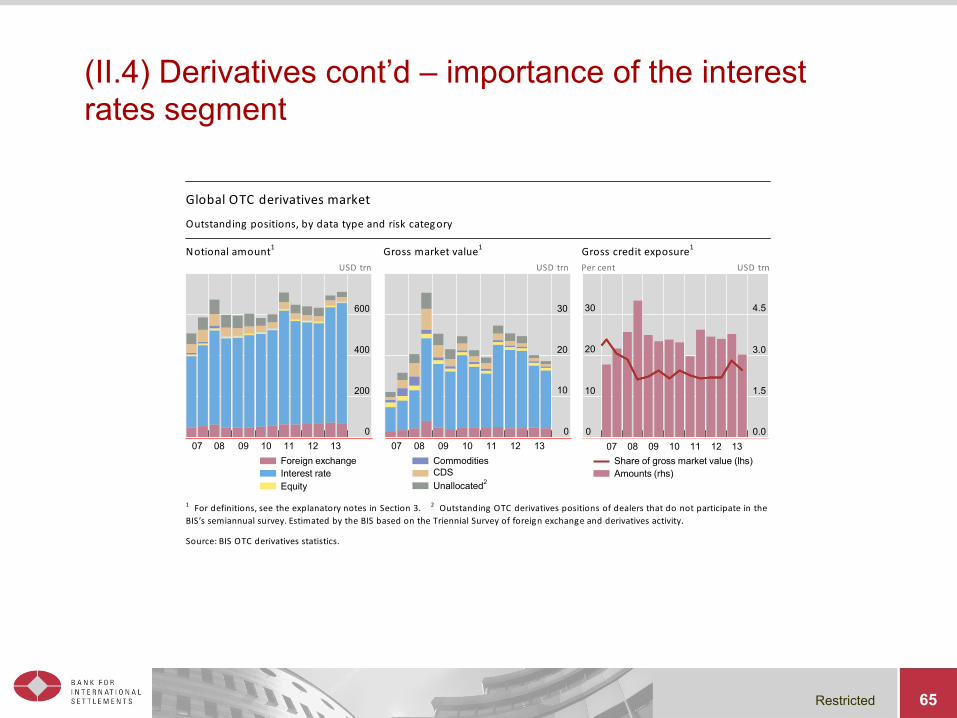
(II.4) Derivatives cont’d – importance of the interest rates segment
Global OTC derivatives market
Outstanding positions, by data type and risk category Notional amount1 Gross market value1 Gross credit exposure1
USD trn USD trn Per cent USD trn
600 30 30 4.5
400 20 20 3.0
200 10 10 1.5
0 07 08 09 10 11 12 13
0 07 08 09 10 11 12 13
0 07 08 09 10 11 12 13
0.0
Foreign exchange Interest rate Equity
Commodities CDS Unallocated2
Share of gross market value (lhs) Amounts (rhs)
1 For definitions, see the explanatory notes in Section 3. 2 Outstanding OTC derivatives positions of dealers that do not participate in the BIS’s semiannual survey. Estimated by the BIS based on the Triennial Survey of foreign exchange and derivatives activity.
Source: BIS OTC derivatives statistics.

Restricted 66
(II.4) Derivatives cont’d – CDS decline in activity and impact of central clearing
Credit default swaps Outstanding positions Impact of netting Notional amounts with CCPs Per cent USD trn Per cent USD trn Per cent USD trn
20 60 30
1.6 40
6.0
15 45 25 1.2 30 4.5
10 30 20 0.8 20 3.0
5 15 15 0.4 10 1.5
0 0 10 07 08 09 10 11 12 13
2011 2012 2013
0.0 0 2010 2011 2012 2013
0.0
Lhs: Gross market value / notional Lhs: Net / gross market values Lhs: CCPs / total Rhs: Single-name notional
Multi-name notional Rhs: Gross market values
Net market values Rhs: Single-name notional
Multi-name notional Source: BIS OTC derivatives statistics.

Restricted
(II.4) Derivatives cont’d – The Triennial Central Bank Survey
l Most comprehensive source of information on the size and structure of: § global foreign exchange § OTC derivatives markets.
l Increase market transparency and helps policy makers and to better monitor: § patterns of activity § exposures in the global financial system
l Breakdowns by § instrument / counterparty / currency / trading relationships
§ execution method for FX
67

Restricted
(II.4) Derivatives cont’d – The Triennial Central Bank Survey
68
Daily global FX turnover ………... by counterparty USD trln
Daily Global FX turnover moved up $5.3 trillion in 2013 (pick-up of +35% since 2010)
Financial institutions (other than dealers) are the main drivers of turnover growth; inter-dealer share remained constant and trading with non-financial customers contracted
Restricted
(II.4) Derivatives cont’d – The Triennial Central Bank Survey
69
…. and by other financial institutions
USD trln
New breakdowns allow to “zoom in” who is behind on the trading activity of OFIs
Surge in Yen turnover by more than 60%, while the share of the Euro in global FX trading fell to 33% Rising importance of EM currencies (eg renminbi and Pesos)
Shifts in the currency composition of FX trading
CLS bank settlement volumes for USD/JPY, USD bn

Restricted 70
(II.4) Derivatives cont’d – FX market turnover shares for currencies and pairs

Restricted 71
I. Banks II. Global financial markets
1. Long-term series: eg property prices 2. Credit aggregates and the financial cycle 3. From residency to nationality
III. Have a financial stability, long-term perspective

Restricted 72
(III.1) Residential property price statistics l BIS database
§ 54 countries, 300 series § First comprehensive dataset § Only nominal series reported by central banks
l History § 1989: BIS starts collecting data § 2009: DGI Recommendation 19 § 2010: First publication on the BIS website
l Factors limiting user-friendliness § No binding methodological standards § Lack of homogeneity across countries

Restricted 73
III.1. Property prices cont’d – Evolutions in real terms
Restricted 74
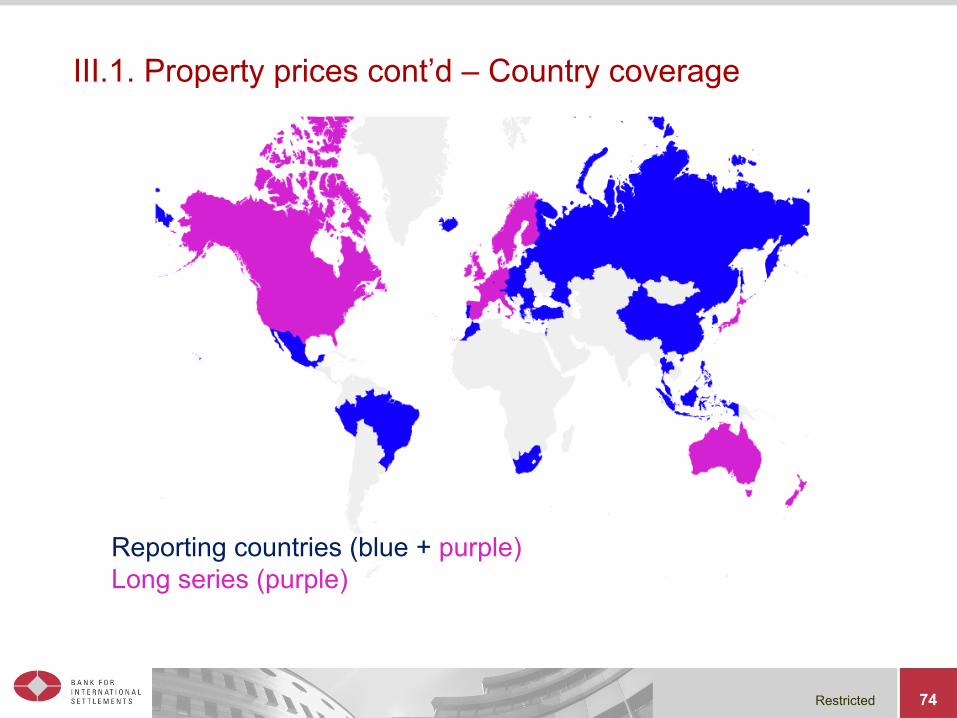
III.1. Property prices cont’d – Country coverage
Reporting countries (blue + purple) Long series (purple)
Restricted 75
(III.1) Property prices cont’d – Long series
l Key financial stability indicator § Analyse cycles in residential property markets § Behaviour of property prices around banking crises
l Dataset § 18 countries, § Start date: 1970 or 1971 § Sources: central banks, national statistical offices, commercial and
academic research institutes, academic studies § Temporal disaggregation for earlier years if quarterly data is not available
(Chow-Lin with series on construction cost or rental component of CPI)
Restricted 76
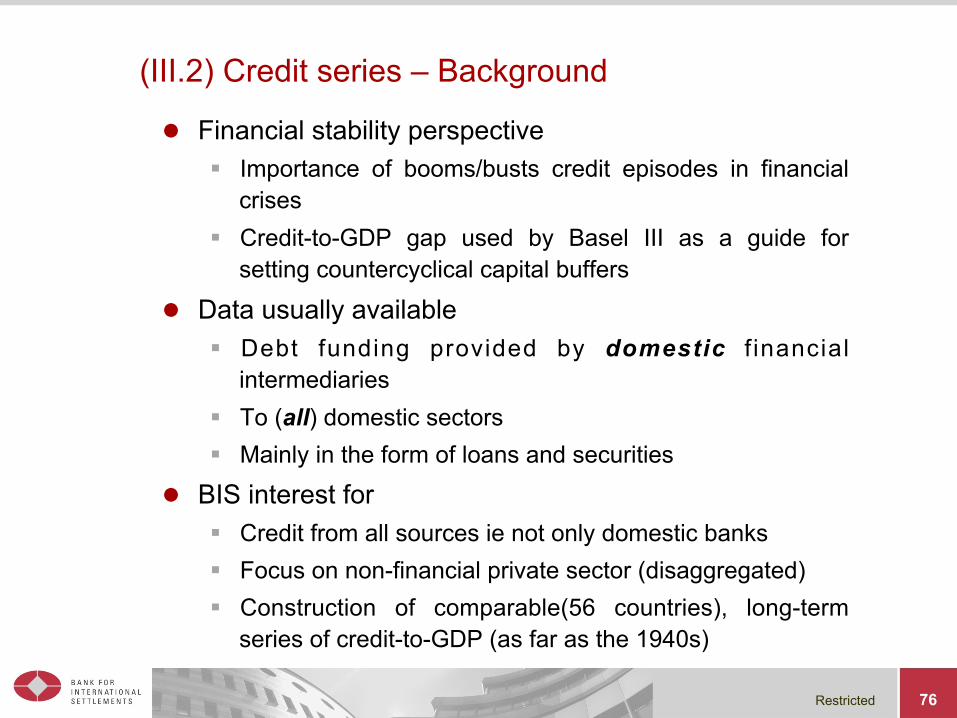
(III.2) Credit series – Background
l Financial stability perspective § Importance of booms/busts credit episodes in financial
crises § Credit-to-GDP gap used by Basel III as a guide for
setting countercyclical capital buffers
l Data usually available § Debt funding provided by domestic f inancial
intermediaries § To (all) domestic sectors § Mainly in the form of loans and securities
l BIS interest for § Credit from all sources ie not only domestic banks § Focus on non-financial private sector (disaggregated) § Construction of comparable(56 countries), long-term
series of credit-to-GDP (as far as the 1940s)
Restricted 77
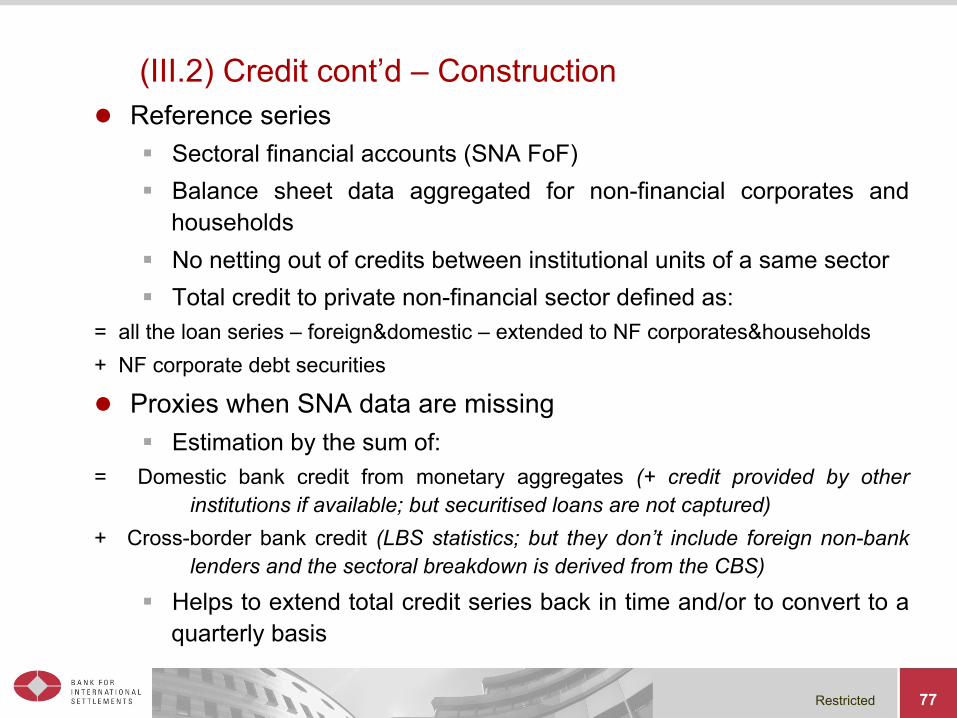
(III.2) Credit cont’d – Construction l Reference series
§ Sectoral financial accounts (SNA FoF) § Balance sheet data aggregated for non-financial corporates and
households § No netting out of credits between institutional units of a same sector § Total credit to private non-financial sector defined as:
= all the loan series – foreign&domestic – extended to NF corporates&households + NF corporate debt securities
l Proxies when SNA data are missing § Estimation by the sum of:
= Domestic bank credit from monetary aggregates (+ credit provided by other institutions if available; but securitised loans are not captured)
+ Cross-border bank credit (LBS statistics; but they don’t include foreign non-bank lenders and the sectoral breakdown is derived from the CBS)
§ Helps to extend total credit series back in time and/or to convert to a quarterly basis

Restricted 78
(III.2) Credit cont’d – 3 new types of long series
l Benchmark 1 § Credit from banks (“ ODCs ” - depository corporations other
than central banks) to the non-financial sector § ie “Bank credit to non-banks”
l Benchmark 2 § Credit from ODCs to the non-financial non-government
sector § ie “Bank credit to private sector”
l Benchmark 3 § Credit from all sectors to the non-financial non-government
sector § ie “All credits extended to private sector”

Restricted 79
Creditors / Lenders Borrowers
CB ODCs OFCs GOVT PNFCs ONFCs HH & NPISH
ROW
Central bank (CB) Other depository corporations (ODCs) Other financial corporations (OFCs) Government Public nonfinancial corporations (PNFCs) Other nonfinancial corporations (ONFCs) Households and Non-profit institutions
serving households (NPISH)
Rest of the world (ROW)
Benchmark 1 series Benchmark 2 series Benchmark 3 series
(III.2) Credit cont’d – Sector-to-Sector matrix

Restricted 80
Benchmark 1
Year
Benchmark 2
Benchmark 3
B1: Credit by banks to non-financial sector
(III.2) Credit cont’d – comparison of the 3 benchmarks B3: Credit from all sources to private non-financial sector
B2: Credit by banks to private non-financial sector
IFS Domestic claims: Depository corporations (including central bank) claims on non-depository sector (including other financial corporations)
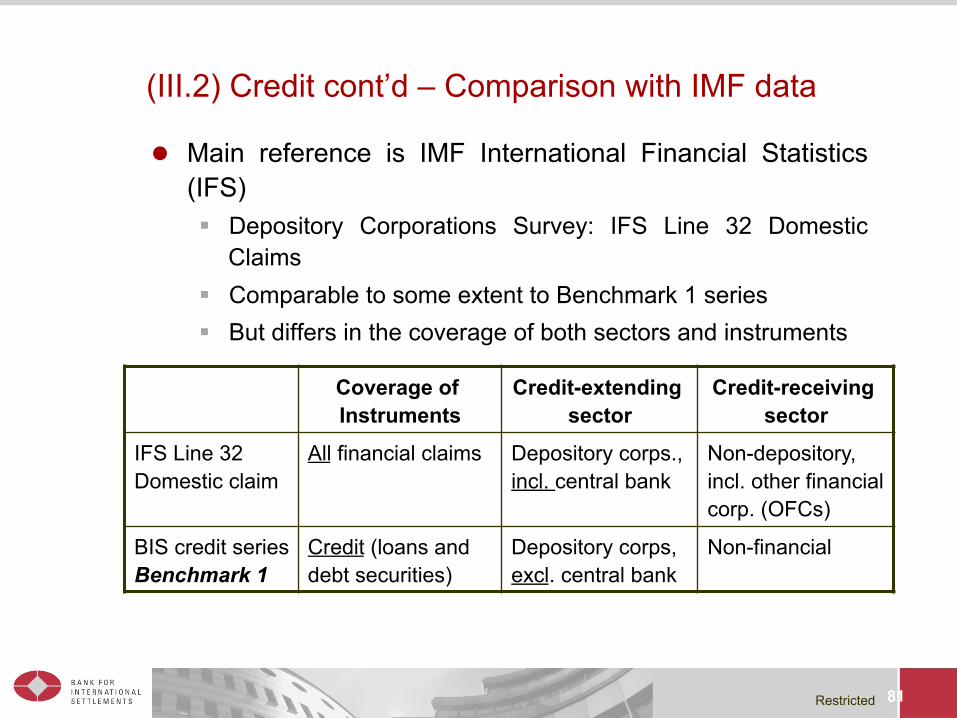
Restricted 81
l Main reference is IMF International Financial Statistics (IFS) § Depository Corporations Survey: IFS Line 32 Domestic
Claims § Comparable to some extent to Benchmark 1 series § But differs in the coverage of both sectors and instruments
Coverage of Instruments
Credit-extending sector
Credit-receiving sector
IFS Line 32 Domestic claim
All financial claims Depository corps., incl. central bank
Non-depository, incl. other financial corp. (OFCs)
BIS credit series Benchmark 1
Credit (loans and debt securities)
Depository corps, excl. central bank
Non-financial
(III.2) Credit cont’d – Comparison with IMF data
Restricted 82
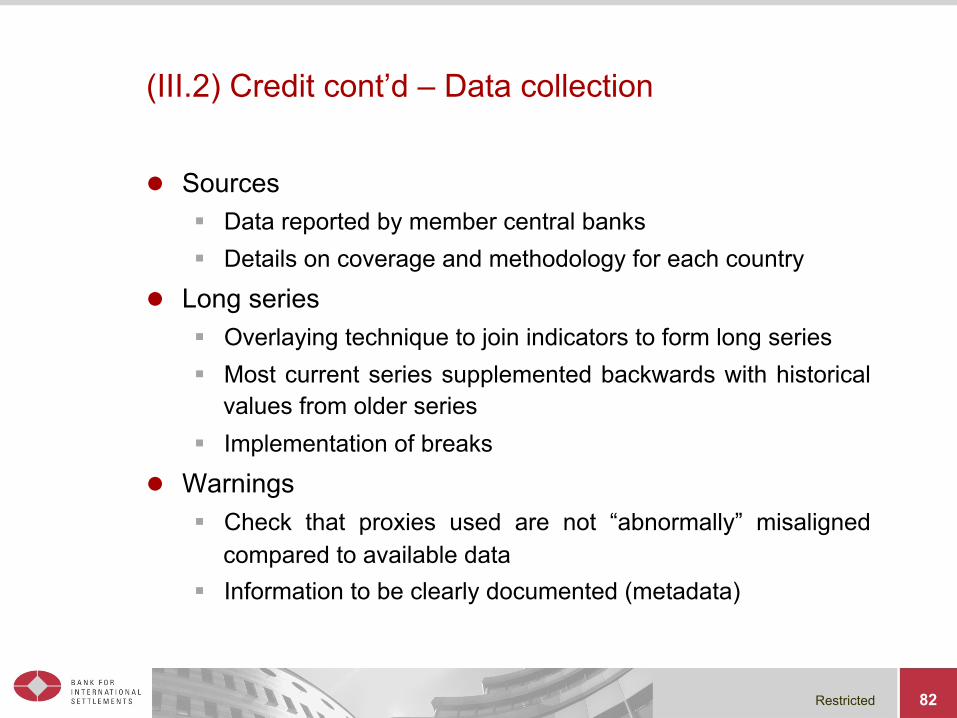
l Sources § Data reported by member central banks § Details on coverage and methodology for each country
l Long series § Overlaying technique to join indicators to form long series § Most current series supplemented backwards with historical
values from older series § Implementation of breaks
l Warnings § Check that proxies used are not “abnormally” misaligned
compared to available data § Information to be clearly documented (metadata)
(III.2) Credit cont’d – Data collection

Restricted 83
Millions of euro
Year
S1 Historical series, discontinued
S2 Current series
(III.2) Credit cont’d – Example of discontinuity
Restricted 84
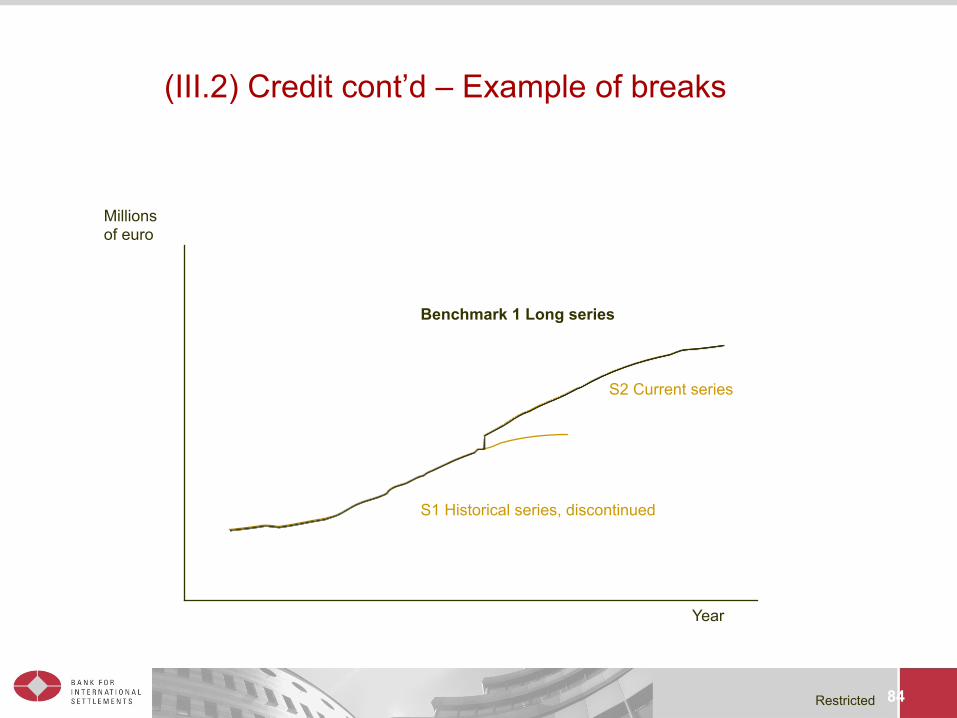
(III.2) Credit cont’d – Example of breaks
Millions of euro
Year
S1 Historical series, discontinued
S2 Current series
Benchmark 1 Long series

Restricted 85
(III.2) Credit cont’d – Examples of analysis – Financial cycles
• Financial variables display pronounced “financial cycles”
• These have greater amplitude and duration than business cycles
• Analyses on credit can be complemented by looking at asset price gap (eg property prices) and debt service ratios
The financial and business cycles in the United States
0.6
0.4
0.2
0.0
–0.2
–0.4
–0.6
72 75 78 81 84 87 90 93 96 99 02 05 08 11 Financial cycle1 Business cycle2 NBER recessions
1 The line traces the financial cycle measured as the average of the medium-‐term cycle in the component series using frequency-‐based filters. 2 The line traces the GDP cycle identified by the traditional shorter-‐term frequency filter used to measure the business cycle.
Source: Drehmann et al (2012).

Restricted 86
(III.2) Credit cont’d – Examples of analysis – credit-to-GDP ratios
Credit to the private sector stabilising in advanced economies, but still rising in many emerging markets

Restricted 87
(III.3) Consolidation – residence and nationality l Different concepts
§ National income accounts § Global groups § Domestic decisions taken by foreign entities / Foreign decisions by
domestic entities
l BIS financial statistics § Mixed concepts (IBS, IDS) § The move towards consolidated supervision
l Consolidation § Variety of concepts § Diverging practices § Across borders and/or sectors (the perimeter of regulation)

Restricted 88

Restricted
Concluding remarks
l Ongoing initiatives will result in more and better data, micro and macro § More breakdowns § More consistent data across datasets and countries § Higher frequency, better timeliness
l Challenges related to the massive increase in amount of data § Complexity § Resources § Confidentiality § Policy use § Communication
89