
Financial Inclusion for Financial...
27
Policy Research Working Paper 6577 Financial Inclusion for Financial Stability Access to Bank Deposits and the Growth of Deposits in the Global Financial Crisis Rui Han Martin Melecky e World Bank Development Economics Office of the Senior Vice President and Chief Economist August 2013 Background Paper to the 2014 World Development Report WPS6577 Public Disclosure Authorized Public Disclosure Authorized Public Disclosure Authorized Public Disclosure Authorized Public Disclosure Authorized Public Disclosure Authorized Public Disclosure Authorized Public Disclosure Authorized
Transcript of Financial Inclusion for Financial...

Policy Research Working Paper 6577
Financial Inclusion for Financial Stability
Access to Bank Deposits and the Growth of Deposits in the Global Financial Crisis
Rui HanMartin Melecky
The World BankDevelopment EconomicsOffice of the Senior Vice President and Chief EconomistAugust 2013
Background Paper to the 2014 World Development Report
WPS6577P
ublic
Dis
clos
ure
Aut
horiz
edP
ublic
Dis
clos
ure
Aut
horiz
edP
ublic
Dis
clos
ure
Aut
horiz
edP
ublic
Dis
clos
ure
Aut
horiz
edP
ublic
Dis
clos
ure
Aut
horiz
edP
ublic
Dis
clos
ure
Aut
horiz
edP
ublic
Dis
clos
ure
Aut
horiz
edP
ublic
Dis
clos
ure
Aut
horiz
ed
Produced by the Research Support Team
Abstract
The Policy Research Working Paper Series disseminates the findings of work in progress to encourage the exchange of ideas about development issues. An objective of the series is to get the findings out quickly, even if the presentations are less than fully polished. The papers carry the names of the authors and should be cited accordingly. The findings, interpretations, and conclusions expressed in this paper are entirely those of the authors. They do not necessarily represent the views of the International Bank for Reconstruction and Development/World Bank and its affiliated organizations, or those of the Executive Directors of the World Bank or the governments they represent.
Policy Research Working Paper 6577
In crisis times, depositors get anxious, can run on banks, and withdraw their deposits. Correlated withdrawals of bank deposits could be mitigated if bank deposits are more diversified, that is, held by more individuals. This paper examines the link between the broader access to bank deposits prior to the 2008 crisis and the dynamics of bank deposit growth during the crisis, while controlling for relevant covariates. Employing proxies
This paper—prepared as a background paper to the World Bank’s World Development Report 2014: Risk and Opportunity: Managing Risk for Development—is a product of the Development Economics Vice Presidency. The views expressed in this paper are those of the authors and do not reflect the views of the World Bank or its affiliated organizations. Policy Research Working Papers are also posted on the Web at http://econ.worldbank.org. The authors may be contacted at [email protected] and [email protected].
for access to deposits and the use of bank deposits, the authors find that greater access to bank deposits can make the deposit funding base of banks more resilient in times of financial stress. Policy efforts to enhance financial stability should thus not only focus on macroprudential regulation, but also recognize the positive effect of broader access to bank deposits on financial stability.
Financial Inclusion for Financial Stability:
Access to Bank Deposits and the Growth of Deposits
in the Global Financial Crisis*
Rui Han
World Bank
Martin Melecky#
World Bank
Abstract
In crisis times, depositors get anxious, can run on banks, and withdraw their deposits. Correlated withdrawals of bank deposits could be mitigated if bank deposits are more diversified, that is, held by more individuals. This paper examines the link between the broader access to bank deposits prior to the 2008 crisis and the dynamics of bank deposit growth during the crisis, while controlling for relevant covariates. Employing proxies for access to deposits and the use of bank deposits, the authors find that greater access to bank deposits can make the deposit funding base of banks more resilient in times of financial stress. Policy efforts to enhance financial stability should thus not only focus on macroprudential regulation, but also recognize the positive effect of broader access to bank deposits on financial stability.
Keywords: Access to Deposits, Bank Deposit Withdrawals, Banking Sector Resilience, Global Financial Crisis.
JEL Classification: G21, G01, G28, G32.
* We thank Thorsten Beck, Inci Otker-Robe, Johannes Breckenfelder, and the participants of the IFABS 5th Conference on "The Search for Financial Stability: Models, Policies and Prospects", and the 2013 International Risk Management Conference on “Enduring Financial Stability: Contemporary Challenges in Risk Management and Corporate Governance” for helpful comments and suggestions on earlier drafts of the paper. The views expressed in this paper are those of the authors and do not reflect the views of the World Bank or its affiliated organizations. # corresponding author, email: [email protected].
2
1. Introduction
Private decisions in finance confront tradeoffs, most notably that of risk and return. Policy decision making in the area of financial development is faced with similar tradeoffs, notably that between financial development and financial stability. 1 However, not only tradeoffs exist in financial policy making. While prudential limits exist in extending access to credit, because not everyone is creditworthy or can handle credit responsibly—as we have learned most recently from the global financial crisis—a prudential limit may not exist for advancing access to deposits or insurance (Cull et al., 2012). Hence, synergies can also be found and exploited. Financial policy reforms may thus focus on synergies first, i.e. advancing financial development and improving financial sector resilience at the same time. We study one such possible synergy in this paper; namely, the positive effect that greater financial inclusion in deposits can have on greater reliability of bank deposit funding in times of stress.
From 2006 to 2009, growth of bank deposits dropped by over 12 percentage points globally. The most affected by the 2008 global crisis were upper middle income countries that experienced a drop of 15 percentage points on average. Individual countries such as Azerbaijan, Botswana, Iceland, and Montenegro switched from deposit growth of 58 percent, 31 percent, 57 percent, and 94 percent in 2007 to deposit declines (or a complete stop in deposit growth) of -2 percent, 1 percent, -1 percent, -8 percent in 2009, respectively.
In times of financial stress or crises, depositors get anxious, can run on banks, and withdraw their deposits (Diamond and Dybvig, 1983; Shin, 2009). Large depositors are usually the first ones to run (Huang and Ratnovski, 2011). By the law of large numbers, correlated deposit withdrawals could be mitigated if bank deposits are more diversified. Greater diversification of deposits could be achieved by enabling a broader access to and use of bank deposits, i.e. involving a greater share of adult population in the use of bank deposits (financial inclusion). Based on this assumption, broader financial inclusion in bank deposits could significantly improve resilience of banking sector funding and thus overall financial stability (Cull et al., 2012).
This paper investigates the implications of a broader access to deposits for the dynamics of bank deposits during the global financial crisis. Namely, we analyze whether access to bank deposits by a larger share of a country’s population can help explain differences in the drop of deposit growth over 2007-2010 across our sample of 95 countries. We also separately estimate the differences in the relationship between the drop in deposit growth and access to deposits for low-income (LIC), middle-income (MIC), and high-income (HIC) countries. The employed proxies for access to and use of deposits are based on Honohan (2008) and Demirguc-Kunt and 1 See for example the IMF-World Bank conference on Financial Deepening, Macro-Stability, and Growth in Developing Countries: http://www.imf.org/external/np/seminars/eng/2012/spr/. Also, see Buncic and Melecky (2013) discuss equilibrium provision of credit to the real economy—that is not too much not too little credit—or Beck and De Jonghe (2013) who discuss the potential tradeoff between diversification of individual banks and diversity of banking systems.

3
Klapper (2012). In the regression analysis, we condition on relevant control variables including GNI per capita, growth in aggregate output, the population size, inflation, occurrence of a banking crisis, existence of explicit deposit insurance, a banking sector stability indicator, the banking sector liquidity position, banking sector concentration, the deposits to GDP ratio, the loan to deposit ratio, and capital account openness. We address the problem of potential endogeneity by the timing of the explanatory variables before or by 2008. When using the measure of financial inclusion in deposits of Demirguc-Kunt and Klapper (2012), we estimate the regression by the general method of moments (GMM), instrumenting the measure by the deposit access proxy of Honohan (2008). Moreover, we use robust regressions to gauge the impact of outliers on the estimation results.
Figure 1: Broader Access to Bank Deposits Can Aid Financial Stability—Especially in Middle-Income Countries
Source: Authors’ calculation based on data from IMF, Honohan (2008), Laeven and Valencia (2012), FinStats, Global Financial Development Database and WDI. Note: The figure depicts the vulnerability of bank deposit base of 59 middle-income countries conditional on per capita income, growth in aggregate output, bank z-score, loan to deposit ratio, occurrence of banking crisis, and implemented explicit deposit insurance. The Honohan (2008) composite measure of access to financial services is used as a proxy for access to bank deposits.
AGO ALB
ARG
ARM
AZE
BGR
BIH
BLR BOL
BRA
BWA
CHN CMR
COG
DOM
DZA
EGY
GAB
GEO
GHA
GTM
GUY
HND
IDN
IND JOR KAZ
LBY
LKA
LSO
LTU MAR
MDA
MEX
MKD MNG
MUS
MYS
NAM
NGA
NIC
PAK
PAN
PER
PHL
PRY
ROM
RUS
SLV
SWZ
SYR
THA TUN
TUR
UKR URY
YEM ZAF
ZMB
y = -0.40*x Marginal R² = 0.12
-80
-70
-60
-50
-40
-30
-20
-10
0
10
20
0 10 20 30 40 50 60 70 80
y =m
axim
um d
eclin
e in
ban
k de
posi
ts, 2
007
- 201
0
x =access to bank deposits, 2005

4
We find that a broader access to and use of bank deposits can significantly mitigate bank deposit withdrawals or growth slowdowns in times of financial stress (Figure 1). While this finding holds for the entire sample of HICs, MICs, and LICs, it could be particularly strong in MICs, where a large share of population still lacks access to bank deposits, trust in banks is yet to be firmly established, and the integration in global financial flows is growing. In addition to the access and use of deposits, bank stability—measured by the aggregate z-score, and the dummy for the occurrence of banking crises are the most significant explanatory variables in our regressions. The results hold even when accounting for the possible leverage effects of outliers.
The main message is that countries should recognize that policies to promote a broader use of bank deposits could improve resilience of bank funding. Such policies can thus enhance overall financial stability and complement the mainstream macroprudential policies to foster stability of the financial system.
Our paper responds to an existing gap in the empirical literature linking greater access to deposits with greater financial (banking sector) stability. While the literature postulates that an inclusive financial sector will have a more diversified, stable retail deposit base that can increase systemic stability, empirical research confirming existence of such a relationship, especially at the level of the financial system, is largely absent in the literature (GPFI, 2012; Cull et al., 2012; Prasad, 2010).
At the individual and household level, savings support stability and, given their very large numbers, small savers potentially contribute to stability at the financial system level (Cull et al., 2012). Low income savers tend to maintain steady financial behavior through the business cycle. Hence, during crises, deposits from low income clients typically act as a continued source of funds even when other sources of bank financing dry up or become difficult to roll over. Small customers thus provide big opportunities to mobilize stable deposits (Khan, 2011). Greater financial inclusion, including access to savings, can also enhance financial stability indirectly, by providing individuals, households, and small firms with greater access to financial risk-managing tools. This greater access can enhance resilience and stability of the real economy and thus also the financial system that serves it (GPFI, 2012; Cull et al., 2012; Khan, 2011).
At the bank level, focusing on retail deposit generation can produce a more diversified and stable funding base that is less sensitive to changes in market interest rates and a bank’s financial condition. In stress times, insured depositors have proven to be a bank’s most reliable funding source and, therefore, play an integral role in mitigating liquidity risk (OCC, 2012). The global crisis demonstrated that stable retail sources of funding, in contrast with reliance on borrowed funds, can greatly enhance the soundness and resilience of financial institutions and reduce volatility of earnings (Khan, 2011). Diversified funding base of financial institutions has played a role in cushioning the impact of a global credit (wholesale funding) crunch on domestic financial intermediation (Hannig and Jansen, 2010).

5
At the country level, financial inclusion can boost efficiency of financial intermediation, through intermediation of greater amounts of domestic savings, and thus improve soundness of investment financing and investment cycles. Provided that quality financial infrastructure and competent supervision are implemented, such improvement will, in turn, produce both greater economic and financial stability (Prasad, 2010; Cull et al., 2012).
The paper proceeds as follows. Section two discusses some stylized facts. Section three explains the employed regression model and estimation approaches. Section four describes the data used for estimation of the regression model. Section five discusses the baseline regression results for the entire sample of 95 countries, along with a robustness analysis using the robust regression approach, and an alternative access to deposit proxy together with a GMM estimator. Section six presents and discusses differences in the model’s estimates across HICs, MICs, and LICs, and reports related robustness tests. Section seven concludes and offers some policy implications.
2. Some Stylized Facts
In this section, we preview some stylized facts about the main variables of interest, i.e. bank deposit growth around the 2008 global financial crisis and access to bank deposits before the crisis. The preview motivates some choices that we make for our regression analysis, and further illustrates the extent of heterogeneity in deposit growth and access to deposits across country income groups.
Figure 2: Global Growth of Bank Deposits During 2005-2010
Source: Authors’ calculation based on deposits data from IMF’s FAS database. Note: This figure displays the year on year percentage growth rate of outstanding deposits of commercial banks in national currency calculated for 173 countries.
Consider the global growth in bank deposits first. Figure 2 shows that the median growth in bank deposit across countries dropped significantly from 2007 to 2009 by about 9 percentage
0
5
10
15
20
25
30
35
2005 2006 2007 2008 2009 2010
1st quartile median 3rd quartile

6
points, and then recovered slightly in 2010. The drop in deposit growth was much more apparent among the countries with high growth of deposits prior to the 2008 crisis (13 percentage points; the 3rd quartile) than for countries with lower pre-crisis deposit growth (9 percentage points; the 1st quartile). In addition, some countries, such as Azerbaijan, Botswana, Iceland, Moldova, and Montenegro transitioned from the 75th percentile of countries with the fastest growing deposits to the 25th percentile of countries with the slowest growing (dropping) deposits, generally experiencing deposit withdrawals in 2009 and thus much larger declines in deposit growth than other countries (60 p.p., 31 p.p., 59 p.p., 45 p.p., and 102 p.p., respectively).
The timing of the peak and trough of deposit growth around the 2008 financial crisis varies notably across countries. While the global average suggests that the peak of global deposit growth was in 2007, and the trough of global deposit growth was in 2009, there is a significant heterogeneity across countries regarding the year in which the peak and trough actually occurred. Figure 3 shows that although 67 countries experienced the peak of deposit growth in 2007, 55 countries experienced the peak in 2006, and 43 experienced it in 2008. Similarly, 2009 was the year of the lowest deposit growth for 83 countries, but other 52 countries experienced the lowest growth only in 2010. These observations lead us to concur that we need to allow for a country specific timing in calculation of the drop in deposit growth experienced by a given country around the 2008 global crisis. This variable will be our first main variable of interest and also our dependent variable in the regression analysis, later in the paper.
Figure 3: Histogram of the Timing of the Peak (left) and Trough (right) in Deposit Growth in Individual Countries
Source: Authors’ calculation based on deposits data from IMF’s FAS database.
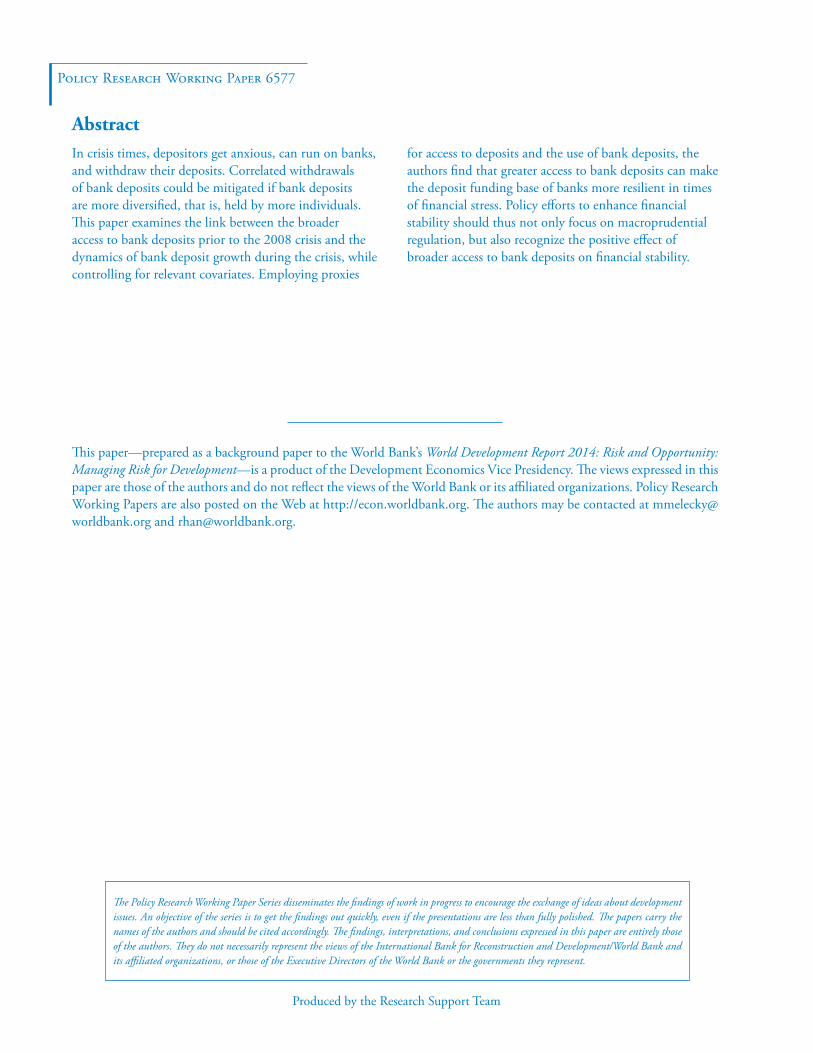
An interesting stylized fact to inspect at this point is the maximum drop in deposit growth across countries that have experienced and those that have not experienced a banking crisis around 2008. Figure 4 shows the calculated drops in deposit growth for different country groups (the details of this calculation are provided in section 4). When looking across all countries (the
01020304050607080
2006 2007 2008 2009
Number of countries with MAXIMUM deposit growth in a given year
01020304050607080
2007 2008 2009 2010
Number of countries with MINIMUM deposit growth in a given year
7
“ALL” column), there is no apparent difference in the maximum drop in deposit growth across crisis and non-crisis countries. The picture, however, becomes much more heterogeneous when countries are grouped by income level.
First, there are no LICs that have experienced banking crises during 2006-2010. Second, there is a large difference in the maximum drop in deposit growth between crisis and non-crisis countries in the MIC group—non-crisis countries experienced, on average, a 19 percentage point drop in deposit growth, while crisis countries experienced a 53 percentage point drop. Third, there is no significant difference in the maximum drop in deposit growth between crisis and non-crisis countries in the HIC group. Interestingly, the data show a higher maximum drop in deposit growth for non-crisis HICs compared with crisis HICs, by about 5 percentage points. Our conjecture is that people in richer countries diversify their saving portfolio much more than in lower income countries, allocating their savings also in investment securities. When the 2008 crisis hit, the uncertainty about future returns and general risk aversion mounted. Hence, people in HICs, especially those living through a crisis, might have liquidated their investment in securities and used bank deposits as a safe haven instrument propped by public deposit insurance. Overall, the maximum drop in deposit growth was the strongest in crisis affected MICs, and was very heterogeneous across HICs, MICs and LICs.
Figure 4: The Drop in Deposit Growth in Crisis and Non-Crisis Countries
Source: Authors’ calculation based on data from IMF and Laeven&Valencia (2012). Note: None of the LICs in authors’ sample experienced banking crises between 2006 and 2010.
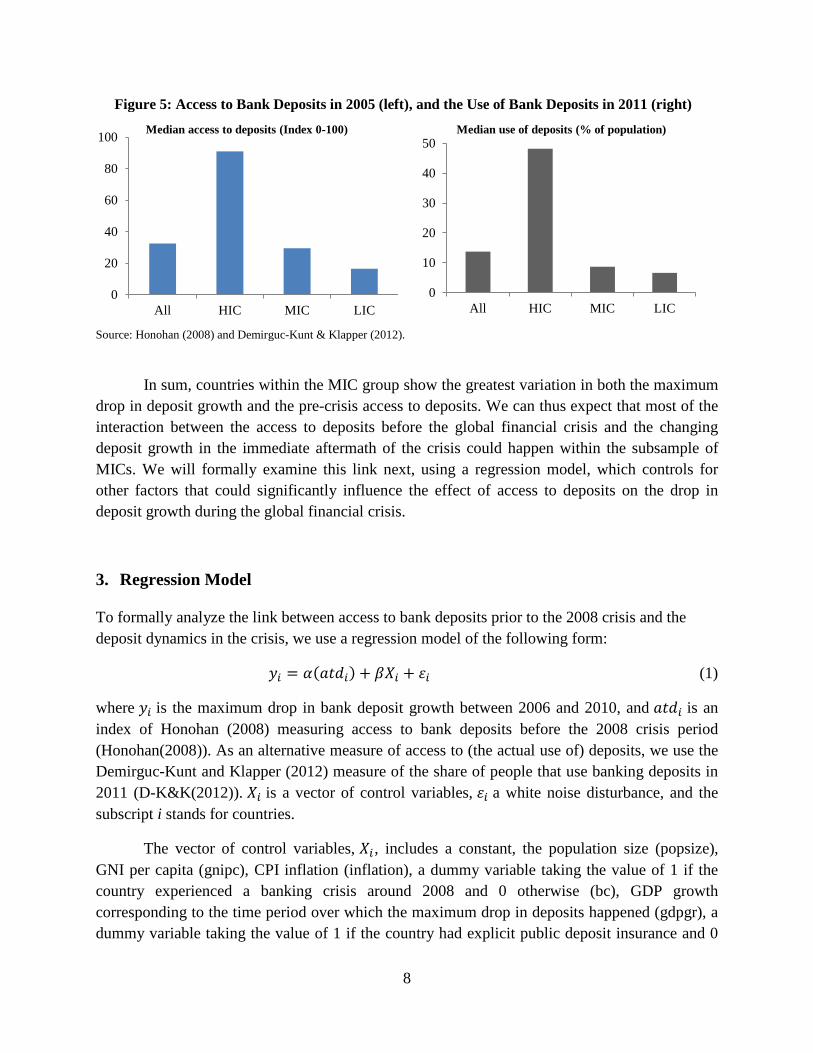
Consider the access to bank deposits prior to the 2008 crisis next. Figure 5 (left panel)
plots the median access to deposits using Honohan (2008) index for all countries and their income groups. Similarly, Figure 5 (right panel) plots the use of deposits measure of Klapper and Demirguc-Kunt (2012). Both measures show a similar pattern with generally low access to or use of deposits worldwide (the “ALL” column). Although people in HICs enjoy relatively high access to bank deposits, people in MICs and LICs face much greater challenge in accessing or using bank deposits (see also Allen et al., 2012).
0
10
20
30
40
50
60
All HIC-OECD MIC LIC
Median of the maximum drop in deposits growth (%)
Crisis countriesNon-crisis countriesAll countries
8
Figure 5: Access to Bank Deposits in 2005 (left), and the Use of Bank Deposits in 2011 (right)
Source: Honohan (2008) and Demirguc-Kunt & Klapper (2012).
In sum, countries within the MIC group show the greatest variation in both the maximum drop in deposit growth and the pre-crisis access to deposits. We can thus expect that most of the interaction between the access to deposits before the global financial crisis and the changing deposit growth in the immediate aftermath of the crisis could happen within the subsample of MICs. We will formally examine this link next, using a regression model, which controls for other factors that could significantly influence the effect of access to deposits on the drop in deposit growth during the global financial crisis.
3. Regression Model
To formally analyze the link between access to bank deposits prior to the 2008 crisis and the deposit dynamics in the crisis, we use a regression model of the following form:
𝑦𝑖 = 𝛼(𝑎𝑡𝑑𝑖) + 𝛽𝑋𝑖 + 𝜀𝑖 (1)
where 𝑦𝑖 is the maximum drop in bank deposit growth between 2006 and 2010, and 𝑎𝑡𝑑𝑖 is an index of Honohan (2008) measuring access to bank deposits before the 2008 crisis period (Honohan(2008)). As an alternative measure of access to (the actual use of) deposits, we use the Demirguc-Kunt and Klapper (2012) measure of the share of people that use banking deposits in 2011 (D-K&K(2012)). 𝑋𝑖 is a vector of control variables, 𝜀𝑖 a white noise disturbance, and the subscript i stands for countries.
The vector of control variables, 𝑋𝑖 , includes a constant, the population size (popsize), GNI per capita (gnipc), CPI inflation (inflation), a dummy variable taking the value of 1 if the country experienced a banking crisis around 2008 and 0 otherwise (bc), GDP growth corresponding to the time period over which the maximum drop in deposits happened (gdpgr), a dummy variable taking the value of 1 if the country had explicit public deposit insurance and 0
0
20
40
60
80
100
All HIC MIC LIC
Median access to deposits (Index 0-100)
0
10
20
30
40
50
All HIC MIC LIC
Median use of deposits (% of population)
9
otherwise (depins), the aggregate z-score for the banking sector as a measure of financial stability (z-score), the ratio of liquid assets to deposits and short term funding as a measure of the banking sector liquidity position (liquidity), and the share of the three largest banks’ assets in the total banking sector assets as a measure of banking sector concentration (concen); deposits to GDP (depgdp), loan to deposit ratio (loantodeposit), and capital account openness (kaopen). We discuss the expected effects of the control variables next, before explaining how the issue of possible endogeneity of some control variables was handled, as well as the estimation methods employed.
We expect that countries with larger population could be more prone to herd behavior because it simply takes more people to converge on the same idea and timing of deposit withdrawals. Richer countries (with higher GNI per capita) will have more savings per person so that deposit withdrawals by the same number of people will be relatively higher in richer countries. Countries that experienced a banking crisis around 2008 could have experienced larger deposit withdrawals because of possible contagion-like effects and self-fulfilling run on banks. The slowdown in deposit growth could have been particularly stronger in countries that have experienced a slowdown in GDP growth or an increase in inflation over the same period. If a country has explicit deposit insurance it is less likely, ceteris paribus, to experience panicky withdrawals of deposits, especially those of smaller size that are fully insured.
Banking sectors with higher z-scores are perceived by depositors as more stable and should experience relatively smaller deposit withdrawals. Similarly, banking sectors with a stronger liquidity position have a large capacity to meet deposit withdrawal demand of a given size, and should thus be more credible and less prone to deposit withdrawals. More concentrated banking systems could be more prone to deposit withdrawals due to possibly greater interconnectedness and thus greater worries of depositors about transmission of problems from one bank to another and subsequently to the whole system. Banking systems with higher levels of deposits per GDP are susceptible, centeris paribus, to greater deposit withdrawals simply because they have greater risk exposure in the regard.
Banks with greater loan to deposit ratios can be considered, from the view point of depositors, better monitored and safer than banks with very low loan to deposit ratios because of the covenants and the resulting external monitoring that credit financing of banks entails. Note that the financing position of banks with high loan to deposit ratios can still be more vulnerable overall, as informed creditors are typically the first to run. However, here we analyze the reliability (stickiness) of bank deposit funding not the entire financing of the bank. Finally, countries with greater capital account openness are more integrated in global finance which can protect them against (diversify away) domestic shocks, but also exposes them to foreign shocks, including negative spillovers of crises in the region or capital sending countries.
We handle the possible endogeneity of explanatory variables by dating most of them prior to the crisis and running an ordinary least square (OLS) regression with robust standard
10
errors. In addition, we test the robustness of our baseline results to outliers by running robust regression estimation that proportionally underweights the information from leverage points (outliners) in the regression estimation. Further, since our alternative measure of access to deposits based on Demirguc-Kunt and Klapper (2012) is dated by 2011, and because GDP growth could also suffer an endogeneity problem, we estimate the regression model by GMM in addition. In this case, we use the Honohan (2008) index based on data from 2005 as an instrument for the 2011 Demirguc-Kunt and Klapper’s index, and the log of GDP at the peak of deposit growth prior to the crisis as an instrument for GDP growth during the period when the maximum drop of deposit growth occurred in each country. We have used the rule of thumb of Stock, Wright and Yogo (2002) and Stock and Yogo (2005) to check that our instruments are relevant and our GMM regression does not suffer from the weak instrument problem.
4. Data Description
This paper examines the relationship between access to deposits and the stability of bank deposits during the 2008 global financial crisis. We thus focus on analyzing the dynamics of bank deposit growth between 2006-2010, which covers both pre-crisis years and post-crisis years. We calculate year on year growth rate on bank deposits for 173 countries using data on outstanding deposits of commercial banks from IMF’s Financial Access Survey (FAS) database. We choose this indicator over other measures of total deposits to ensure maximum cross sectional coverage (number of countries covered) and best consistency across countries. We observed that it is rarely the case that the year on year deposit growth rate remained stable and many countries experienced more than one peak or more than one trough during the period that we examine. In order to capture the potential impact of the 2008 crisis, we define maximum drop in deposit growth in the following manner: first, we document the minimum deposit growth a country experienced between 2007 and 2010 and mark the year when it occurred; then we find the maximum deposit growth the country had experienced before this year. The difference between this maximum deposit growth and the minimum deposit growth then constitutes the maximum drop in deposit growth—our cross-country dependent variable.
We use the composite indicator of access to financial services constructed by Honohan (2008) as a proxy for access to deposits. The actual use of deposits in each country is approximated by the indicator “percentage of adult population who saved at a formal financial institution in the past year” from the Global Financial Inclusion Database (Demirguc-Kunt and Klapper (2012)). 2 Detailed descriptions of variables, data sources, and data availability are listed in Table A1.
2 Earlier attempts at measuring access to bank deposits include Beck, Demirguc-Kunt, and Martinez Peria (2007). We do not use this measure as it is available for a much smaller number of countries and because it is highly correlated with deposits over GDP, which we use as a control, and that would introduce a serious multi-colinearity problem.

11
We use indicators of growth in aggregate output, income per capita, inflation, and population to control for the economic growth during the global crisis period, for the difference in economic development, for the change in price level, and for the difference in the country size. The nominal GDP (henceforth GDP in short), GNI per capita, inflation and total population data were obtained from World Bank’s WDI database and all three variables other than inflation were log transformed. To control for the impact of GDP growth on deposit growth, we calculate the GDP growth over the period during which the deposit growth declined most in each country.
We included indicators for deposit insurance, bank stability, bank liquidity, banking concentration, deposits to GDP ratio, loan to deposit ratio, and capital account openness to capture the cross sectional variation in financial sector structure, development, and openness. Deposit insurance is a dummy variable indicating existence of an explicit deposit insurance scheme as documented in Demirguc-Kunt, Karacaovali, and Laeven (2005). We use banking system z-score as the indicator for financial stability and the ratio of liquid assets to deposits and short-term funding as the indicator for bank liquidity. The data on both indicators were obtained from World Bank’s Global Financial Development Database. Capital account openness is measured by Chinn-Ito financial openness index (Chinn and Ito, 2006). Banking concentration is approximated by total assets of a country’s three largest banks as a share of assets of all commercial banks. The data for bank concentration, loan to deposit ratio and deposits to GDP ratio were obtained from World Bank’s FinStats database. Summary statistics of all variables are provided in Table A3 and pairwise correlations of variables are shown in Table A2.
Given concerns that small island countries could have very different macroeconomic and institutional characteristics compared to other countries of the same income-group, we removed such countries from our sample.3 Our sample is further reduced to 95 countries for regression estimation due to data availability on banking sector indicators.
5. Baseline Estimation Results
This section discusses the baseline estimation results presented in Table 1. Namely, Table 1 shows both the full model estimation results and the parsimonious estimation results based on adjusted R-squared maximization. Further, the columns labeled OLS show the OLS estimation results, the columns labeled Robust show the robust regression estimates, and the GMM(1) column shows the GMM estimation of the model where gdpgr is treated as possibly endogenous variable and instrumented by the log of GDP at the peak of the deposit growth cycle prior around 2008. In addition to GMM(1), GMM(2) uses D-K&K(2012) measure of access to deposits from 2011, which we instrument by Honohan(2008)—the pre-crisis measure of access to deposits.
3 The actual impact of excluding small island countries from the sample on the sample size used in the regression analysis is negligible since many of such countries do not have banking sector data available.
12
The estimation results show, consistently over all estimation methods and using the two different measures of access to deposits, that greater financial inclusion in the use of bank deposits can help enhance banking sector stability by mitigating the vulnerability of bank deposit base. Namely, the estimated coefficient on the Honohan(2008) and D-K&K(2012) variables indicate that a 10 percent increase in the share of people that have access to or actively use bank deposits can mitigate the deposit growth declines (or deposit withdrawal rates) by three to four percentage points. Recall that, on average, the maximum drop in deposit growth worldwide was 20 percent, and in MICs that have experienced a banking crisis around 2008, the drop averaged around 50 percent (Figure 4). Also, note that the explanatory power of the regressions is satisfactory, with adjusted R-squared between 0.2 and 0.3. The conditioning set of variables thus adequately tests the relevance of variables measuring access to bank deposits in explaining declines in deposit growth in the period of the 2008 global financial crisis.
The most important conditioning variables that consistently appear to be significant in explaining the deposit growth declines around 2008 are the level of economic development (gnipc), the experience of a banking crisis (bc), and the aggregate stability of the banking system (z-score). Namely, more developed countries suffered greater confidence shock and withdrawal of deposits during the 2008 crisis than less developed counties, which could contrast with experience from previous banking crises. Further, the occurrence of a banking crisis around 2008 added about 10 percentage points to deposit growth slowdown, on average, in our sample countries. A higher z-score, the measure of banking sector stability, significantly reduces the drop in deposit growth. Similarly, countries with explicit public deposit insurance have experienced consistently lower declines in deposit growth during the 2008 crisis period. In addition, countries that have mobilized more deposits in relation to their GDP could suffer smaller deposit slowdowns during crises. The evidence on the effect, however, is not robust across different estimation methods. Overall, the coefficients on all significant control variables thus bear the expected sign.
When we inspect the estimation results with the view to possible country heterogeneity, the results seem to indicate that the relationship between access to deposits and the stability of bank deposit funding could vary across country groups at a different stage of economic development (see also section 2). Our hypothesis is that middle-income countries could benefit from a greater synergy between improving access to deposits together with improvements in banking sector stability (the deposit funding base of banks); that is financial inclusion and stability going in the same direction. This is because LICs face huge financial inclusion gaps and can mobilize much less savings from households that are often consumption-constrained. Moreover, LICs are not as well integrated in global finance to import large amounts of foreign savings, and to be subject to cross-border shocks, including those to depositor confidence. In contrast, access to bank deposits in high-income countries approaches 90–100 percent, and high-income countries focus mainly on fostering financial stability, with only marginal gains from

13
further improving access to deposits. We thus investigate the relationship between access to deposits and bank funding stability separately for countries in different income groups next.
6. Income-Group Splits
Our sample of countries includes 21 HICs, 59MICs, and 15 LICs when we estimate the baseline regression. To investigate whether, and how, the positive impact of access to bank deposits on stability of bank deposit funding varies across different levels of development, we run separate regressions for three subsamples of high, middle, and low income countries in our sample. Note that the high income subsample combines HICs and upper-MICs, the middle income sample contains only MICs, and the low income sample includes a mixture of lower-MICs and LICs. We use overlapping subsamples because of small degrees of freedom for LICs and HICs and to make sure that the three subsamples are balanced in size. 4 Because the subsamples are considerably smaller than the total sample employed in the main regression, we use bootstrapped standard errors to conduct inference for the estimated coefficients of subsample regressions. Bootstrapped standard errors are more attentive to the possible challenges posed by small sample estimation by using the empirical distribution of residuals rather than the assumed empirical one.
Table 2 presents the estimation results for high (column A), middle (column B), and low (column C) income countries focusing on the parsimonious regression results. The estimation methods and approaches explained in Table 1 were analogously applied to the subsamples of high, middle, and low income countries. The parsimonious regressions were again obtained by maximizing the adjusted R-squared.
6.1. High Income Subsample (HIsub)
For the subsample of high income (HIsub) countries (Table 2, column A), the parsimonious regression explains around 50 percent of the variation in the dependent variable, which is almost twice as high explanatory power as that of the full regression for all countries. The access to deposit variables are significant at 10 percent level for all regressions including Honohan(2008) and when we use D-K&K(2012), with both coefficient estimates slightly lower than those for the full sample of countries (Table 1). When using D-K&K(2012), we also observe that, not only is the coefficient estimated more precisely than that of Honohan(2008), but its magnitude is about twice as large. This could point to greater ability of the demand side data to measure financial inclusion in deposits that is relevant for stability of bank deposit funding. A 10 percent increase in access to bank deposits can thus mitigate declines in deposit growth during times of financial 4 We have also run regressions merging HICs and LICs into one subs-sample to verify some of our findings and conjectures. Because of its diversity, this merged subsample was only used to illustrate the contrasting environment of MICs that are becoming financially developed and integrated with the rest of the world, but at the same time the trust in banks is being still tested and access to deposits needs further improvements. These estimation results concur with our hypothesis that MICs can benefit most from the synergetic effect that reforms to support financial inclusion in deposits can have on banking sector stability. The results are available upon request.

14
stress by two to six percentage points in HIsub countries. Recall that, on average, HICs faced a decline in deposit growth of about 17 percentage points during the 2008 crisis (Figure 4). The most important control variables include the level of economic development (gnipc), macroeconomic stability (inflation), explicit deposit insurance (depins), banking sector stability (z-score).
Namely, more developed countries seem to have experienced a greater drop in deposit grown during the 2008 crisis consistently with the baseline results for the full sample. In contrast to the baseline result, macro-financial stability, as measured by the level of inflation, seems to have played an important role in mitigating declines in bank deposit growth. As we will see later, inflation, and thus macro-financial stability, was not a significant mitigating factor for MICs and LICs. It seems that inflation differentiates better the macro-financial conditions across HICs and upper-MICs, while the banking crisis dummy takes over this role for MICs and LICs. Further, explicit deposit insurance is consistently significant at the 10 percent level, suggesting that it can reduce declines in bank deposit growth by 8 to 16 percentage points. As we will see later this effect is larger than for MICs and also for LICs where it does not have a significant impact on propping bank deposit growth. Banking sector stability (z-score) is consistently the most significant variable of the regression for HIsub substantially mitigating the possibility of deposit withdrawals and reversals in deposit growth. In addition, greater exposure to external financing (loantodeposit) reduces declines in deposit growth, although it is not significant at common levels across all estimation methods. We will return to the economic interpretation of this effect when discussing the results for MICs for which this effect is more important.
6.2. Middle Income Subsample (MIsub)
For MIsub (Table 2, column B), the parsimonious regression can explain around 50 percent of the variation in the dependent variable, with some indication that the fit of the regression could be even better than for HIsub when accounting for outliers (see the “Robust” column). It could thus appear that our model may be best fitted to MICs in which case the explanatory power of the variables on access to deposits could be also more tested. Concerning our main variable of interest, both access to deposit variables, Honohan(2008) and D-K&K(2012), are consistently significant with a coefficient magnitude similar to coefficient estimates from the baseline regression; reemphasizing possibly higher relevance of our model to MICs. Interestingly, the coefficient magnitude of D-K&K(2012) is notably higher than the coefficient magnitude of Honohan(2008). Assuming that D-K&K(2012) measures the actual use of bank deposits whereas Honohan(2008) measures only access to deposits, the results could indicate that, in MICs, the actual use of deposits can deliver a more beneficial effect on the resilience of bank deposit funding in times of financial stress, compared with just access to deposits and their potential use by people. A 10 percent increase in access to bank deposits can thus reduce declines in deposit growth during times of financial stress by three to seven percentage points in MICs. Recall that, on average, MICs faced declines in deposit growth of about 20 percentage points during the 2008

15
crisis, and MICs experiencing a banking crisis around 2008 faced average declines in deposit growth in excess of 50 percentage points (Figure 4).
In the regression for MICs, the most significant control variables are the banking crisis dummy and the z-score, followed by the dummy for explicit deposit insurance and GNI per capita. Similarly as in the regression for all countries, a banking crisis can shatter confidence in the banking system, shrink available resources of existing depositors, and thus intensify the drop in deposit growth (deposit withdrawals). The estimated add-on effect of about 35 percentage points is roughly three times higher than the estimate for all countries. The aggregate stability of the banking sector, as approximated by the z-score, is a significant mitigant of deposit withdrawals in MICs; more so than in the regression for all countries, and similarly as for HIsub. The presence of explicit deposit insurance can also play a significant mitigating role in regards to deposit growth declines (withdrawals), similarly as in the baseline and the HIsub regressions. Moreover, countries with higher GNI per capita may experience larger declines in deposit growth, perhaps because of the larger average size of bank deposits in relatively richer countries.
In addition, the loan to deposit ratio (loantodeposit) which approximates reliance of the banking sector on external (wholesale) funding could mitigate declines in deposit growth, although this estimate could be driven by outliers (note the insignificance of this variable in the “Robust” column). Recall that we are not modeling declines in overall bank funding in which case external funding could add to the vulnerability of bank funding, as observed e.g. in some Eastern European countries during the 2008 crisis which led to the Vienna Initiative.5 We model the declines in bank deposit growth in which case the presence of external funding could play a different role. Namely, external and whole sale funding has a number of covenants, notably prudential ones, to which a bank needs to adhere to secure and roll over such funding. Fulfillment of these covenants is being continuously monitored by the wholesale (external) lenders using private information that might not be available even to the supervisor (unless explicitly requested). Bank depositors can thus have a higher confidence in a banking system where external (wholesale) funding complements traditional deposit funding. This result, however, needs to be further investigated in future research given its low robustness.
6.3. Low Income Subsample (LIsub)
For LIsub (Table 2, column C), the regression can explain 20 to 50 percent of the variation in the dependent variable, with the robust regression providing the best fit and thus pointing to the significant role of outliers in this subsample. While three out of the four estimation methods indicate that access to finance could add to the explanatory power of the regression, the coefficient estimates are, in general, not significant at common levels. The most important conditioning variables are the banking crisis dummy and GNI per capita. It seems that because of the low integration of lower-MICs and LICs in global finance the deposit growth largely continued in these countries throughout the crisis period without major indirect spillovers from 5 http://vienna-initiative.com/vienna-initiative-part-1/; Berglof and Nagy (2009).

16
other counties, unless a country in this sample experienced an outright banking crisis (such as Mongolia, Nigeria, and Ukraine). Note that no LIC in our sample experienced a banking crisis around 2008. Interestingly, banking sector stability (the z-score) is generally not significant in explaining declines in deposit growth in LIsub countries. This result could arise because banks in LIsub countries have typically large z-scores and capital buffers, to the extent that the buffers can be judged inefficient. In turn, the cross-country variation in z-scores may not necessarily reflect a banking sector’s concern about hedging unexpected losses. In addition, the leeway of banks to smooth profits, for instance because of different provisioning rules or accounting standards that tend to be looser in LICs, could further blur the role of z-scores in measuring the ability of banks to absorb unexpected losses.
In sum, this section established that the positive influence of greater access to and the use of deposits on the stability of bank deposit growth (and thus stability of bank deposit funding) during the 2008 global financial crisis is stronger in MICs compared with HICs and with LICs. In LICs this positive influence may not be significant. For HICs and LICs, further research on bigger data samples is needed to obtain more reliable inference.
7. Conclusion
This paper examined the effect of access to bank deposits on the stability of deposit growth during the 2008 global financial crisis using a cross-sectional regression model for 95 countries. It found that, on average, greater access to bank deposits or their actual use by a country’s population can enhance resilience of the deposit funding base of the banking sector in times of financial stress. Specifically, the estimated coefficient on the variables measuring access to deposits indicate that a 10 percent increase in the share of people that have access to bank deposits can mitigate the deposit growth drops (or deposit withdrawal rates) by about three to eight percentage points. The enhanced resilience of bank funding can then support overall financial stability of the banking sector and the entire financial system. We also found that this effect is likely much stronger in middle-income countries, which could face greater shocks to depositor confidence due to still developing trust in the banking sector and already high integration in global finance. For high-income and low-income countries more research is needed to obtain more reliable conclusions with the help of bigger or richer datasets.
Our findings have important policy implications. Policy makers face tradeoffs when deciding whether to focus on reforms to promote financial development (financial inclusion, innovation, competition, etc.) or whether to focus on further improvements in financial stability (microprudential, macroprudential, business conduct supervision, etc.). However, synergies between promoting financial development and financial stability can also exist as shown in this paper. We recommend that policy makers focus first on taking advantage of such synergies in their framework for financial sector policy. This framework is typically formulated in a national financial sector strategy which sets the development goals in finance, in view of systemic risk

17
associated with achieving these goals and the risk preference of the country government. Namely, we argue that involving more people in the use of bank deposits could be beneficial for people, economic development, and stability of the financial system alike.
Countries should strive to promote a broader use of bank deposits not only to aid economic development and poverty alleviation but also to complement the mainstream macroprudential policies to enhance financial stability. Again, these policy efforts, their synergetic effects, and the plan for their implementation, including the resulting responsibilities of different government agencies, should be clearly described in the national financial sector strategy. With proper regulation and oversight in place, initiatives such as Kenya’s M-PESA and M-KESHO projects (Demombynes and Thegeya, 2012) or South Africa’s Mzansi accounts (Bankable Frontier Associates, 2009) could serve as good examples of promoting a broader use of bank accounts (deposits) and enhancing the reliability of bank deposit funding at the same time.
Our analysis is subject to some caveats that could be addressed in future research. An important mitigating factor of deposit withdrawals that addresses the informational asymmetry between banks and depositors is microprudential supervision. We have considered a proxy of the quality of microprudential supervision following (Anginer, Demirguc-Kunt, and Zhu, 2012) in our baseline estimation. But including this variable reduced our sample by one third and the variable was not significant. A better proxy of microprudential supervision available for more countries could be employed in future research. Further, we have not explicitly modeled the negative confidence shocks from crises in the adjacent region or similar countries, even though we have controlled for capital account openness. Finally, the wave of crises after 2008 triggered various policy responses, including injections of public capital in banks, increases in the limits for public deposit insurance, and blanket deposit guarantees. The data on relevant policy interventions are not readily available for a sufficient number of countries to our knowledge. The data could be collected as part of future research to control for relevant policy responses, many of which have been endogenous to deposit growth and will have to be appropriately instrumented.

18
References
Allen, Franklin, Asli Demirguc-Kunt, Leora Klapper and María Soledad Martínez Pería. 2012. “The Foundations of Financial Inclusion: Understanding Ownership and Use of Formal Accounts.” Policy Research Working Paper 6290, World Bank, Washington, DC.
Anginer, Deniz, Asli Demirguc-Kunt, and Min Zhu. 2012. “How Does Bank Competition Affect Systemic Stability?” Policy Research Working Paper 5981, World Bank, Washington, DC.
Bankable Frontier Associates. 2009. “The Mzansi Bank Account Initiative in South Africa.” Report commissioned by FinMark Trust. Bankable Frontier Associates, Somerville, MA.
Beck, Thorsten, Asli Demirguc-Kunt, and Maria Soledad Martinez Peria. 2007. “Reaching Out: Access to and Use of Banking Services across Countries.” Journal of Financial Economics 85 (1): 234–66.
Beck, Thorsten, and Olivier De Jonghe. 2013. “Lending Concentration, and Its Implications for Systemic Risk and Public Policy.” Background paper for the World Development Report 2014.
Berglof, Erik, and Piroska M. Nagy. 2009. “Coordinated Policy Response to the Financial Crisis in Emerging Europe.” Presentation at an Informal Seminar of Home and Host Authorities, EBRD, Vienna, Austria, January 23.
Buncic, Daniel, and Martin Melecky. 2013. “Equilibrium Credit: The Reference Point for Macroprudential Supervisors.” Policy Research Working Paper 6358, World Bank, Washington, DC.
Chinn, Menzie D. and Hiro Ito (2006). “What Matters for Financial Development? Capital Controls, Institutions, and Interactions.” Journal of Development Economics 81 (1): 163–92.
Cull, Robert, Asli Demirguc-Kunt and Timothy Lyman. 2012. “Financial Inclusion and Stability: What Does Research Show?” CGAP Brief 71305, CGAP, Washington, DC.
Demirguc-Kunt, Asli and Leora Klapper. 2012. “Measuring Financial Inclusion: The Global Findex Database.” Policy Research Working Paper 6025, World Bank, Washington, DC.
Demirguc-Kunt, Asli, Baybars Karacaovali and Luc A. Laeven. 2005. “Deposit Insurance Around the World: A Comprehensive Database.” Policy Research Working paper 3628, World Bank, Washington, DC.

19
Demombynes, Gabriel and Aaron Thegeya. 2012. “Kenya's Mobile Revolution and the Promise of Mobile Savings.” Policy Research Working Paper 5988. World Bank, Washington, DC.
Diamond, Douglas W. and Philip H. Dybvig. 1983. “Bank Runs, Deposit Insurance, and Liquidity.” Journal of Political Economy 91(3): 401–19.
Global Partnership for Financial Inclusion (GPFI). 2012. “Financial Inclusion – A Pathway to Financial Stability? Understanding the Linkages.” Issues paper presented at GPFI 1st Annual Conference on Standard-Setting Bodies and Financial Inclusion: Promoting Financial Inclusion through Proportionate Standards and Guidance, Basel, October 29.
Hannig, Alfred, and Stefan Jansen. 2010. “Financial Inclusion and Financial Stability: Current Policy Issues.” ADBI Working Paper 259, Asian Development Bank Institute, Tokyo, Japan.
Honohan, Patrick. 2008. “Cross-Country Variation in Household Access to Financial Services.” Journal of Banking & Finance 32 (11): 2493–500.
Huang, Rocco, and Lev Ratnovski. 2011. “The Dark Side of Bank Wholesale Funding.” Journal of Financial Intermediation 20: 248–263.
Khan, Shri H. R. 2011. “Financial Inclusion and Financial Stablity: Are They Two Sides of the Same Coin?” Speech at BANCON 2011 organized by the Indian Bankers Association and Indian Overseas Bank, Chennai, India, November 4.
Laeven, Luc and Fabian Valencia. 2012. “Systemic Banking Crises Database: An Update.” IMF Working Paper WP/12/163, IMF, Washington, DC.
Office of the Comptroller of the Currency (OCC). 2012. Comptroller’s Handbook: Liquidity.Washington, DC: OCC.
Prasad, Eswar S. 2010. “Financial Sector Regulation and Reforms in Emerging Markets: An Overview.” NBER Working Paper 16428, Cambridge, MA.
Shin, Hyun Song. 2009. “Reflections on Northern Rock: the Bank Run that Heralded the Global Financial Crisis.” The Journal of Economic Perspectives 23(1): 101–20.
Stock, James H. and Motohiro Yogo. 2005. “Testing for Weak Instruments in Linear IV Regression," in James H.Stock and Donald W. K. Andrews, eds., Identification and Inference for Econometric Models: Essays in Honor of Thomas J Rothenberg, New York: Cambridge University Press.

20
Stock, James H., Wright, Jonathan H., Motohiro Yogo. 2002. “A Survey of Weak Instruments and Weak Identification in Generalized Method of Moments.” Journal Of Business and Economic Statistics, 20, 518–29.
21
Tables and Figures in the Main Text
Table 1: Baseline Estimation Results
Robust standard errors in parentheses *** p<0.01, ** p<0.05, * p<0.1 Note: GMM(1): endogenous variable gdpgr instrumented by log of gdp at the peak of deposit growth; GMM(2): endogenous variables gdpgr and D-K&K(2012) instrumented by log of gdp at the peak of deposit growth and Honohan(2008) respectively.
OLS Robust GMM(1) GMM(2) OLS Robust GMM(1) GMM(2)
Honohan(2008) -0.296** -0.316** -0.320** -0.346** -0.395*** -0.322*(0.145) (0.126) (0.134) (0.146) (0.102) (0.170)
D-K&K(2012) -0.764** -0.847**(0.337) (0.400)
gnipc 8.233** 6.813*** 8.671** 6.851* 7.735*** 6.007*** 7.550*** 4.709(3.860) (2.365) (3.611) (3.686) (2.908) (1.891) (2.832) (2.992)
popsize -1.215 -1.088 -1.456 -1.289(1.430) (1.422) (1.369) (1.307)
inflation 0.214 0.313 0.327 0.738(0.531) (0.300) (0.481) (0.498)
bc 11.37** 8.259 11.14** 10.39* 10.72* 9.395** 10.49** 11.50*(5.555) (5.477) (5.202) (5.928) (5.528) (4.602) (5.308) (6.437)
gdpgr 11.81 16.38** -1.170 5.902 21.23*** 13.90 11.54(8.715) (7.654) (13.22) (13.48) (6.714) (47.07) (47.29)
depins -8.179* -3.133 -8.816** -7.359 -11.92** -11.39** -10.03**(4.585) (4.149) (4.415) (4.716) (4.671) (4.547) (5.103)
zscore -0.359* -0.351** -0.373* -0.507** -0.362* -0.425*** -0.368** -0.573***(0.206) (0.166) (0.191) (0.209) (0.184) (0.142) (0.183) (0.166)
liquidity 0.0361 0.0701 0.00410 0.0930(0.116) (0.101) (0.115) (0.123)
concen -0.00633 -0.121 -0.0164 0.131 0.197*(0.126) (0.105) (0.119) (0.119) (0.119)
kaopen -2.111 -1.257 -2.180 -1.951(1.525) (1.187) (1.431) (1.540)
loantodeposit -0.0419 0.0359 -0.0350 -0.0497(0.0702) (0.0529) (0.0648) (0.0624)
depgdp -0.136 -0.0379 -0.129 0.0247 -0.162** -0.157**(0.0921) (0.0708) (0.0817) (0.104) (0.0791) (0.0781)
Constant 6.166 2.070 9.747 0.124 -4.789 -9.285 -6.531 1.347(33.25) (32.66) (31.80) (34.53) (18.58) (12.55) (19.75) (18.96)
Observations 95 95 95 89 95 95 95 89R-squared 0.298 0.343 0.283 0.309 0.260 0.304 0.274 0.265Adjusted R-squared 0.185 0.238 0.168 0.189 0.210 0.265 0.215 0.202
Full Models Parsimonious Models
Explanatory Variables Dependent Variable: Maximum Drop in Deposit Growth 2006-2010

21
Table 2: Parsimonious Models by Income-Group Splits
Dependent Variable: Maximum Drop in Deposit Growth 2006-2010 ( A ) HICs and UMICs ( B ) UMICs and LMICs ( C ) LMICs and LICs
Bootstrapped standard errors in parentheses *** p<0.01, ** p<0.05, * p<0.1 Note: GMM(1): endogenous variable gdpgr instrumented by log of gdp at the peak of deposit growth; GMM(2): endogenous variables gdpgr and D-K&K(2012) instrumented by log of gdp at the peak of deposit growth and Honohan(2008) respectively.
Explanatory Variables OLS Robust GMM(1) GMM(2)
Honohan (2008) -0.259* -0.233* -0.227*(0.151) (0.132) (0.131)
D-K&K (2012) -0.570*(0.333)
gnipc 10.24*** 10.03** 9.060** 6.812(3.990) (3.874) (3.647) (5.494)
popsize -2.356 -0.612(1.532) (1.798)
inflation 2.071** 1.988*** 2.164*(0.909) (0.550) (1.297)
bc
gdpgr -6.880 21.53**(13.665) (10.98)
depins -14.98* -7.954* -13.52 -16.82**(8.903) (4.544) (9.500) (8.531)
zscore -0.719*** -0.587*** -0.723*** -0.742***(0.210) (0.138) (0.240) (0.204)
liquidity
concen 0.311*(0.181)
loantodeposit -0.0824* -0.0972* -0.0898(0.049) (0.0537) (0.0631)
Constant -37.63 -45.45 10.42 -11.73(33.12) (31.76) (53.139) (63.31)
Observations 51 51 51 48R-squared 0.460 0.513 0.469 0.567Adjusted R-squared 0.386 0.447 0.368 0.492
OLS Robust GMM(1) GMM(2)
-0.397*** -0.310*** -0.307**(0.148) (0.110) (0.149)
-0.733*(0.409)
11.46*** 5.705** 8.952** 5.184(4.200) (2.367) (4.039) (3.590)
-2.587* -2.370(1.538) (1.841)
35.02*** 31.29*** 37.49*** 38.84***(7.837) (5.250) (12.508) (13.384)15.50* 22.98*** 3.918 8.338(8.347) (5.935) (18.835) (20.231)
-11.77*** -3.372 -9.899** -9.275*(4.332) (3.027) (4.528) (5.603)
-0.735*** -0.690*** -0.726*** -0.729***(0.204) (0.143) (0.206) (0.240)
0.202(0.173)
-0.122* -0.121* -0.120(0.068) (0.069) (0.073)-25.25 -4.363 35.50 47.57(28.89) (18.06) (43.612) (37.14)
59 59 59 560.443 0.651 0.458 0.4930.367 0.611 0.371 0.393
OLS Robust GMM(1) GMM(2)
-0.425* -0.335(0.231) (0.323)
-1.566(1.785)
5.376 7.163 2.128(5.124) (6.042) (8.289)
1.010 -0.144(2.357) (2.891)
-0.407*(0.232)
27.70*** 29.37*** 28.92** 39.77**(4.699) (7.715) (11.78) (19.49)
-5.263 7.755(42.35) (34.67)-10.13*(5.565)
-0.613**(0.234)
0.328(0.298)
0.156***(0.0504)
-4.447 20.49*** -31.13 15.04(33.376) (6.947) (62.44) (97.27)
44 44 44 410.183 0.560 0.224 0.2630.122 0.515 0.0977 0.133
22
Appendix
Table A1: Description of Variables
Variable name Description Source Countries Available
drop Maximum yoy deposit growth minus minimum yoy deposit growth 2006-2010, provided that the maximum growth occurred before the minimum growth.
Authors' calculation using Commercial Banks - Outstanding Deposits data from IMF FAS
173
Honohan (2008) Honohan (2008) composite measure of access to financial services. Honohan 2008 159
D-K&K (2012) Percent of adult population saving at a financial institution in 2011. Demirguc-Kunt and Klapper 2012 148
gnipc Log transformed GNI per capita in 2008. World Development Indicator 2013 192
popsize Log transformed total population in 2008. World Development Indicator 2013 214
inflation Inflation in 2008 as measured by the consumer price index . World Development Indicator 2013 178
bc Systemic banking crisis experience 2006-2010 (0, 1 dummy variable). Laeven & Valencia 2012 162
depins Explicit deposit insurance schemes as of 2003 (0, 1 dummy variable). Demirguc-Kunt, Karacaovali, and Laeven 2005 178
gdpgr GDP growth over the period matching deposit growth drop. Author calculation using GDP data from WDI 2013 167
zscore Z-score of a country's banking system in 2008. Global Financial Development Database 2012 178
liquidity Liquid assets to deposits and short-term funding in 2008. Global Financial Development Database 2012 168
concen Three-bank-concentration ratio of a country's banking system in 2008. FinStats 2013 145
kaopen The 2008 Chinn-Ito index measuring a country's degree of capital account openness Chinn and Ito 2006, index updated in 2013 177
loantodeposit Private credit by deposit money banks as a share of domestic demand, time and saving deposits in deposit money banks in 2008.
FinStats 2013 167
depgdp Domestic demand, time and savings deposits in deposit money banks to GDP in 2008. FinStats 2013 174

23
Table A2: Pairwise Correlation of Variables
* p<0.05
drop Honohan (2008) D-K&K (2012) gnipc popsize inflation bc gdpgr depins zscore liquidity concen kaopen loantodeposit depgdpdrop 1Honohan (2008) -0.2149* 1D-K&K (2012) -0.2783* 0.8078* 1gnipc -0.0649 0.8511* 0.6491* 1popsize -0.1887 0.106 0.1244 -0.0169 1inflation 0.1639 -0.5304* -0.4511* -0.5867* 0.0289 1bc 0.0066 0.6298* 0.4924* 0.5717* 0.1561 -0.2158* 1gdpgr 0.1889 -0.2031* -0.2364* -0.1553 -0.1269 0.2953* -0.1173 1depins -0.2249* 0.4463* 0.3033* 0.4812* 0.2867* -0.3146* 0.3785* -0.1462 1zscore -0.2301* 0.0298 0.0256 0.0782 0.0149 -0.0808 -0.1084 0.008 -0.0385 1liquidity 0.1444 -0.002 0.1165 0.0635 -0.0356 -0.0785 0.0988 -0.2461* -0.1536 -0.2352* 1concen 0.0718 0.032 0.1487 0.0317 -0.5052* 0.0032 -0.0292 -0.0585 -0.3228* 0.0801 0.3464* 1kaopen -0.1969 0.4692* 0.4079* 0.4864* -0.1841 -0.2672* 0.3143* -0.1025 0.3555* -0.0102 0.0619 0.103 1loantodeposit -0.0094 0.3826* 0.2025 0.4462* -0.0763 -0.0708 0.4930* 0.1081 0.3399* -0.0077 -0.2616* -0.1203 0.2906* 1depgdp -0.3079* 0.7295* 0.7020* 0.6276* 0.2041* -0.4665* 0.4625* -0.1633 0.2770* 0.2363* -0.0139 0.0499 0.3859* 0.1648 1

24
Table A3: Summary Statistics of Variables Variable name Observations Mean Standard Deviation Minimum Maximum
drop 95 24.94 20.71 1.08 99.27 Honohan (2008) 95 42.07 28.63 5 100 D-K&K (2012) 89 17.86 16.11 0.69 63.58 gnipc 95 8.29 1.46 5.25 10.99 popsize 95 16.52 1.51 13.53 21.00 inflation 95 10.26 6.89 2.37 44.39 bc 95 0.21 0.41 0 1 gdpgr 95 0.14 0.22 -0.33 1.11 depins 95 0.59 0.49 0 1 zscore 95 18.22 10.34 4.25 53.8 liquidity 95 38.49 19.27 11.49 119.06 concen 95 66.80 19.51 28.9 100 kaopen 95 0.78 1.61 -1.86 2.46 loantodeposit 95 95.49 39.26 23.82 197.41 depgdp 95 52.38 35.72 10.61 172.85