Financial Incentives to Increase Utilization of ...
71
Policy Research Working Paper 9793 Financial Incentives to Increase Utilization of Reproductive, Maternal, and Child Health Services in Low- and Middle-Income Countries A Systematic Review and Meta-Analysis Sven Neelsen Damien de Walque Jed Friedman Adam Wagstaff Development Economics Development Research Group October 2021 Public Disclosure Authorized Public Disclosure Authorized Public Disclosure Authorized Public Disclosure Authorized
Transcript of Financial Incentives to Increase Utilization of ...

Policy Research Working Paper 9793
Financial Incentives to Increase Utilization of Reproductive, Maternal, and Child Health
Services in Low- and Middle-Income Countries
A Systematic Review and Meta-Analysis
Sven NeelsenDamien de Walque
Jed FriedmanAdam Wagstaff
Development Economics Development Research GroupOctober 2021
Pub
lic D
iscl
osur
e A
utho
rized
Pub
lic D
iscl
osur
e A
utho
rized
Pub
lic D
iscl
osur
e A
utho
rized
Pub
lic D
iscl
osur
e A
utho
rized
Produced by the Research Support Team
Abstract
The Policy Research Working Paper Series disseminates the findings of work in progress to encourage the exchange of ideas about development issues. An objective of the series is to get the findings out quickly, even if the presentations are less than fully polished. The papers carry the names of the authors and should be cited accordingly. The findings, interpretations, and conclusions expressed in this paper are entirely those of the authors. They do not necessarily represent the views of the International Bank for Reconstruction and Development/World Bank and its affiliated organizations, or those of the Executive Directors of the World Bank or the governments they represent.
Policy Research Working Paper 9793
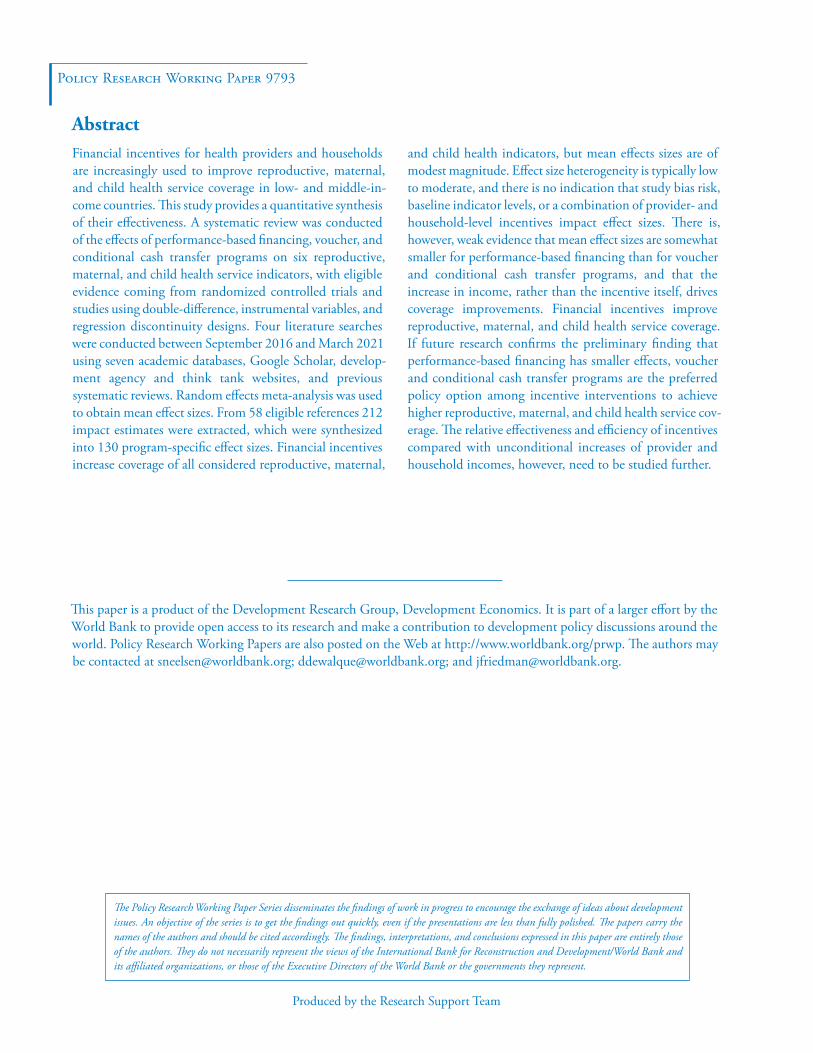
Financial incentives for health providers and households are increasingly used to improve reproductive, maternal, and child health service coverage in low- and middle-in-come countries. This study provides a quantitative synthesis of their effectiveness. A systematic review was conducted of the effects of performance-based financing, voucher, and conditional cash transfer programs on six reproductive, maternal, and child health service indicators, with eligible evidence coming from randomized controlled trials and studies using double-difference, instrumental variables, and regression discontinuity designs. Four literature searches were conducted between September 2016 and March 2021 using seven academic databases, Google Scholar, develop-ment agency and think tank websites, and previous systematic reviews. Random effects meta-analysis was used to obtain mean effect sizes. From 58 eligible references 212 impact estimates were extracted, which were synthesized into 130 program-specific effect sizes. Financial incentives increase coverage of all considered reproductive, maternal,
and child health indicators, but mean effects sizes are of modest magnitude. Effect size heterogeneity is typically low to moderate, and there is no indication that study bias risk, baseline indicator levels, or a combination of provider- and household-level incentives impact effect sizes. There is, however, weak evidence that mean effect sizes are somewhat smaller for performance-based financing than for voucher and conditional cash transfer programs, and that the increase in income, rather than the incentive itself, drives coverage improvements. Financial incentives improve reproductive, maternal, and child health service coverage. If future research confirms the preliminary finding that performance-based financing has smaller effects, voucher and conditional cash transfer programs are the preferred policy option among incentive interventions to achieve higher reproductive, maternal, and child health service cov-erage. The relative effectiveness and efficiency of incentives compared with unconditional increases of provider and household incomes, however, need to be studied further.
This paper is a product of the Development Research Group, Development Economics. It is part of a larger effort by the World Bank to provide open access to its research and make a contribution to development policy discussions around the world. Policy Research Working Papers are also posted on the Web at http://www.worldbank.org/prwp. The authors may be contacted at [email protected]; [email protected]; and [email protected].
Financial Incentives to Increase Utilization of Reproductive, Maternal, and Child Health
Services in Low- and Middle-Income Countries: A Systematic Review and Meta-Analysis
Sven Neelsena, Damien de Walqueb, Jed Friedmanb, Adam Wagstaffb
aHealth, Nutrition, and Population Unit, The World Bank, Washington DC, USA bDevelopment Research Group, The World Bank, Washington DC, USA
[email protected]; [email protected]; [email protected]
JEL Codes: I15, I12, I11
Keywords: Financial Incentives; Performance-Based Financing; Conditional Cash Transfers; Vouchers; Reproductive, Maternal and Child Health, Systematic Review; Meta-Analysis
Acknowledgments
This research was funded through the Health Results Innovation Trust Fund (HRITF) and the
Knowledge for Change Program (KCP). We are grateful to Amanda Kerr, Peijing Li, Paula Mian,
Jie Ren Gesabel Villar, and Shabab Wahid for providing outstanding research assistance. The
funding sources had no involvement in the conduct of the research and the preparation of the
manuscript. We also thank participants in the Fourth Global Symposium on Health Systems
Research in Vancouver 2016, the iHEA World Congress 2017 in Boston, the Joep Lange Institute
Mini-Symposium on Combining Expertise to Improve Healthcare 2017, the iHEA World Congress
2019 in Basel, and several internal seminars at the World Bank for their valuable comments. The
findings, interpretations, and conclusions expressed in this paper are entirely those of the authors.
They do not necessarily represent the views of the World Bank and its affiliated organizations, or
those of the Executive Directors of the World Bank or the governments they represent.

1
Introduction
Aiming to increase the coverage and quality of health care services, many health systems are
shifting their health financing strategy away from exclusively low-powered incentives such as
salaries and budgets towards higher-powered incentives involving a mix of salaries/budgets and
bonuses linked to performance. This push toward performance-based financing (PBF) or
performance-related pay (P4P) has proceeded apace despite a relative lack of generalized
evidence on its impacts, especially in low- and middle-income countries (LMICs). There is also a
growing use of health service vouchers, which introduce incentives on both the demand and
supply sides by entitling users to free or highly subsidized care while guaranteeing providers
reimbursement for services rendered, and of conditional cash transfers (CCTs), which focus on
the demand side and financially reward households for compliance with health and other service
utilization requirements. These disparate financing approaches, categorized in Figure 1, have the
common aim to increase health service uptake by lowering the price, relative to income, of
accessing or providing care.
A burgeoning evaluative literature has explored the effectiveness of individual financial
incentive interventions on health service coverage, and an increasing number of reviews are
available that synthesize this growing evidence base. For PBF, the most recent comprehensive
such review, for which literature searches were conducted in 2018, finds the evidence on
reproductive, maternal and child health (RMCH) service coverage to be inconsistent and of low
overall certainty.1 By comparison, the latest reviews of voucher and CCT programs – for which
literature searches date back five years or longer – find more consistent positive impacts, in
particular on family planning (vouchers) and maternity care, whereas effects on childhood
vaccination were inconclusive.2-5 With the exception of a small number of reviews of CCT
programs,6-9 which form a literature that emerged earlier than that on PBF, and one review of
voucher impacts on family planning,10 the existing reviews are narrative in nature. Due to this
absence of quantitative syntheses, the average magnitude and heterogeneity of effect sizes of
financial incentive interventions, which form important parameters for policy decisions, remain
unknown to date. Harnessing a substantial number of new studies – for instance, there is now
evidence from PBF interventions in five countries which were not yet included in the previous
most recent systematic review – we attempt to address this knowledge gap. Specifically, we

2
provide the first meta-analysis of financial incentive impacts on RMCH service coverage across
PBF, voucher, and CCT programs, and estimate mean effect sizes for each intervention type
separately. Moreover, while subgroup comparisons remain challenging given statistical power
limitations, we also undertake a first quantitative analysis of possible sources of effect size
heterogeneity, investigating, for instance, the role of baseline service coverage levels as well as
whether programs that combine supply- with demand-side incentives are associated with larger
effects on RMCH service coverage.
Methods
Search strategy and selection criteria
We conduct a systematic review and meta-analysis of the impacts of health financing
interventions on RMCH service utilization in low- and middle-income countries (LMICs). A
study protocol was published on the PROSPERO website in November 2016
(https://www.crd.york.ac.uk/PROSPERO/display_record.php?RecordID=49272).
We use the following criteria to identify relevant studies. In terms of publication format, we
include studies in English that were published either in peer-reviewed scientific journals, as part
of a working papers series, in books (with ISBN numbers), as doctoral dissertations, or official
research or project reports. This excludes unofficial draft reports, conference abstracts,
comments, op-eds, media briefings, and bachelor’s or master’s theses.
Regarding interventions, we include those taking place in countries classified as low- or middle-
income by the World Bank in at least one year in the 1987-2019 period and falling into one of
three categories of financial incentivization: PBF of providers of primary or secondary care that
reward RMCH service provision, vouchers which give beneficiaries free or subsidized access to
RMCH services for which providers are reimbursed on a fee-for-service basis, and CCTs
designed to financially reward enrollees for compliance with RMCH service use conditions.
Because they are based on a different theory of change, this review will not consider
interventions which affect the monetary price of providing or using MCH services only
indirectly or implicitly. On the supply-side, omitted interventions include health worker training,
provider performance tournaments, and the introduction of mobile health units or health worker
home visits. On the demand side, we exclude interventions like information campaigns,
3
unconditional cash transfers and conditional cash transfer schemes which do not condition on
MCH service use or employ soft conditions or co-responsibilities.
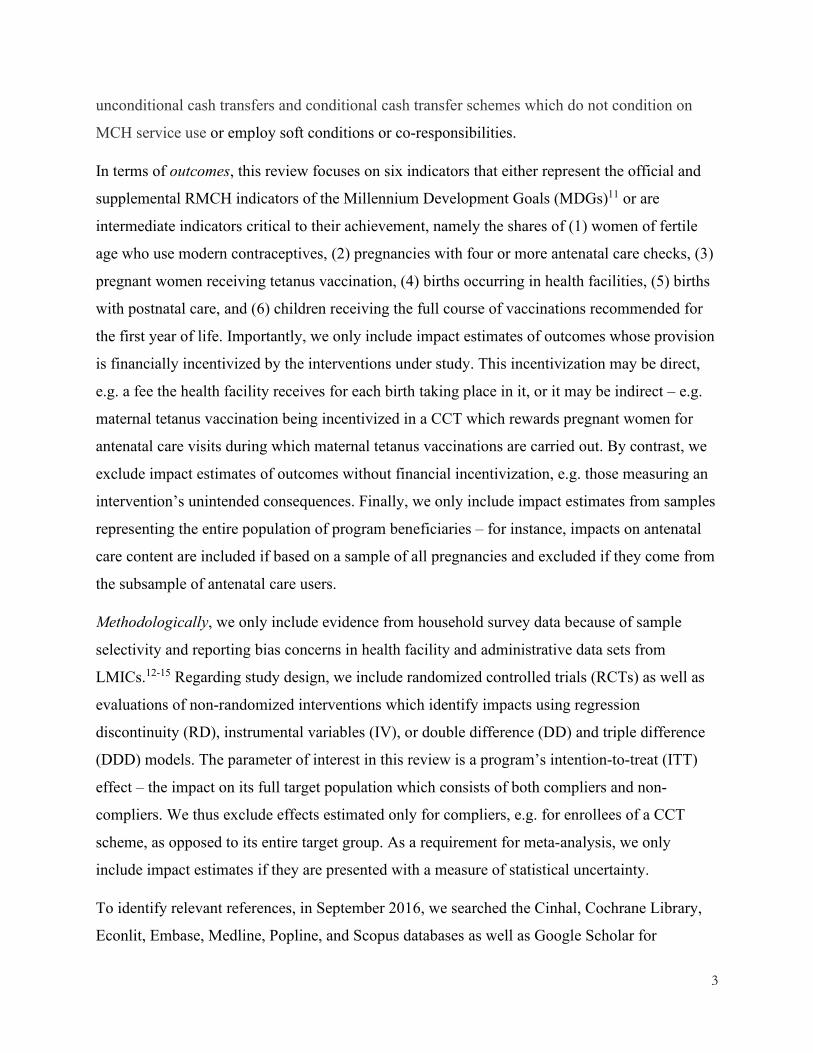
In terms of outcomes, this review focuses on six indicators that either represent the official and
supplemental RMCH indicators of the Millennium Development Goals (MDGs)11 or are
intermediate indicators critical to their achievement, namely the shares of (1) women of fertile
age who use modern contraceptives, (2) pregnancies with four or more antenatal care checks, (3)
pregnant women receiving tetanus vaccination, (4) births occurring in health facilities, (5) births
with postnatal care, and (6) children receiving the full course of vaccinations recommended for
the first year of life. Importantly, we only include impact estimates of outcomes whose provision
is financially incentivized by the interventions under study. This incentivization may be direct,
e.g. a fee the health facility receives for each birth taking place in it, or it may be indirect – e.g.
maternal tetanus vaccination being incentivized in a CCT which rewards pregnant women for
antenatal care visits during which maternal tetanus vaccinations are carried out. By contrast, we
exclude impact estimates of outcomes without financial incentivization, e.g. those measuring an
intervention’s unintended consequences. Finally, we only include impact estimates from samples
representing the entire population of program beneficiaries – for instance, impacts on antenatal
care content are included if based on a sample of all pregnancies and excluded if they come from
the subsample of antenatal care users.
Methodologically, we only include evidence from household survey data because of sample
selectivity and reporting bias concerns in health facility and administrative data sets from
LMICs.12-15 Regarding study design, we include randomized controlled trials (RCTs) as well as
evaluations of non-randomized interventions which identify impacts using regression
discontinuity (RD), instrumental variables (IV), or double difference (DD) and triple difference
(DDD) models. The parameter of interest in this review is a program’s intention-to-treat (ITT)
effect – the impact on its full target population which consists of both compliers and non-
compliers. We thus exclude effects estimated only for compliers, e.g. for enrollees of a CCT
scheme, as opposed to its entire target group. As a requirement for meta-analysis, we only
include impact estimates if they are presented with a measure of statistical uncertainty.
To identify relevant references, in September 2016, we searched the Cinhal, Cochrane Library,
Econlit, Embase, Medline, Popline, and Scopus databases as well as Google Scholar for

4
references in English published from January 1, 1987. Appendix 2 provides our Medline search
strings as an example. We also searched think tank and development agency websites, and
previous systematic reviews identified in our scientific database searches or via the Cochrane
Library, the EPPI-center, and the 3ie systematic review repository. Finally, we posted calls for
relevant references on social media and in blogs. We repeated our search using the same sources
in August 2017, September 2018, October 2019, and March 2021.
SN carried out the electronic database searches and SN and a graduate research assistant (RA)
both independently searched websites and previous reviews. All identified references were
subsequently title-abstract screened in a mutually blinded process by SN and the RA, and
screening decision conflicts were resolved by DDW, JF, and AW. All studies deemed eligible in
the title-abstract screening were then full-text scanned by two RAs – again mutually blinded –
for compliance with the review’s inclusion criteria. Full-text scanning conflicts were resolved by
SN.
After reviewing all references deemed eligible after the full-text scan, we applied an additional
selection criterion not stipulated in the PROSPERO protocol by excluding evidence from a few
reports which use continuous treatment variables (e.g. the population share of program
beneficiaries). Impact estimates from such reports are not comparable to those from binary
treatment variables which are used by a great majority of the studies we identified.
Data analysis
Data extraction
For data extraction, as for eligibility screening, we used an independent, mutually blinded
process with two reviewers and subsequent resolution of coding conflicts by a third reviewer.
Qualitative data on program features and context were extracted by two RAs. Quantitative data –
impact estimates, measures of statistical uncertainty, sample size, and the type of econometric
model – were extracted by SN and an RA. When multiple impact estimates for the same
indicator were available for a program, we took the following approach: (1) In the case of
multiple impact estimates in the same report (e.g. across different statistical models or model
specifications) we extracted authors’ preferred impact estimates if these were identified by the
authors explicitly or through mention in the abstract. If no preferred estimates were identified,

5
we extracted all available impact estimates; (2) In the case of multiple impact estimates across
different versions of a report (e.g. a working paper and a journal article), we extracted the impact
estimates from the latest version; (3) In the case of multiple impact estimates across different
reports of the same program, we extracted the impact estimates from each available report.
Effect size standardization and aggregation
Because this review shows effect sizes in percentage points, we convert impact estimates
reported in other units – log odds ratios, odds ratios or risk ratios – to percentage points using
formulas16 we provide in Appendix 3. The appendix also describes how we obtain 95%
confidence intervals and standard errors from other reported measures of statistical uncertainty.
After obtaining percentage point effect sizes for all impact estimates, we aggregate to a single
effect size per indicator and program if needed – like in the case of the multiple estimates of the
impact of Rwanda’s P4P scheme on facility delivery. Following Borenstein et al.,17 the
aggregation method depends on the overlap of the samples from which the impact estimates were
obtained: If they come from independent, non-overlapping samples, we aggregate using random
effects meta-analysis; If there is partial or full sample overlap, we aggregate by forming the
unweighted means of the impact estimates and standard errors. Additional details of the
aggregation method are provided in Appendix 4.
Mean effect size computation
The financial incentive interventions in this review do not only take one of three forms, but also
differ by implementation context, e.g. country and start year, by design features like their scope
(pilot vs at-scale), the intensity of incentives relative to baseline financing, whether they include
a complementary supply or demand side component, as well as by the methods they were
evaluated with (Tables 1 and 2). Because of this heterogeneity, we estimate overall financial
incentive and PBF, voucher and CCT mean effect sizes and confidence intervals using random
effects models which take into account the possibility that differences between impact estimates
across financial incentive interventions may not only result from sampling error but also genuine
difference in program effectiveness.17
The usefulness of such mean effect sizes computation depends not on the number of included
studies but on the degree of heterogeneity in outcome and intervention designs between them –

6
in fact, if outcomes and interventions are similar enough, meta-analysis is feasible as soon as two
studies are available.18,16,19 As we discuss further below, while outcome variable definitions are
very similar across the studies in our review, differences in intervention design and contexts can
be substantial even within the three intervention types. While cognizant of this limitation, we
deem a quantitative synthesis of individual studies useful and timely, as financial incentive
interventions as a whole, and each of our three intervention groups individually, have well
defined common characteristics (Figure 1). Because of these commonalities, policy discussions
often feature ‘financial incentives in health’, PBF, vouchers, and CCT programs as intervention
groups. Obtaining mean effect sizes through meta-analysis of all available evidence is therefore
preferable over the ad-hoc, implicit aggregation of often selective study results, which is
frequently undertaken in its absence.
Effect size heterogeneity
To assess the degree of ‘true’ effect size heterogeneity across financial incentive interventions
and within intervention groups, we report I2-statistics and their p-values. The I2- statistic
represents the share of the variation around mean effect size that is explained by genuine
differences in program-specific effect sizes (‘between-study variance’), as opposed to mere
sampling error (‘within-study variance’).17 Following Cochrane collaboration guidelines, we
consider I2-statistics of 0-40, 40-60, and 60+ percent to indicate low, moderate, and substantial
heterogeneity, respectively.17 To further investigate the distribution of effect sizes around their
meta-analytical mean, our forest plots include their prediction intervals as horizontal lines on
both sides of the diamonds that show the mean effect size confidence intervals. Prediction
intervals form an important policy parameter, as they show the estimated range that 95 percent of
program effect sizes – and therefore future interventions’ impacts – fall into.20 They are distinct
from the confidence intervals which, by contrast, show the estimated 95 percent range of the
effect size means.
Subgroup analysis
Our analysis includes estimating differences between the mean effect sizes of different
subgroups of financial incentive interventions. The most important such subgroup analysis
investigates mean effect size differences between the PBF, voucher, and CCT intervention
groups. The intervention-group-specific mean effect size point estimates in our forest plots
7
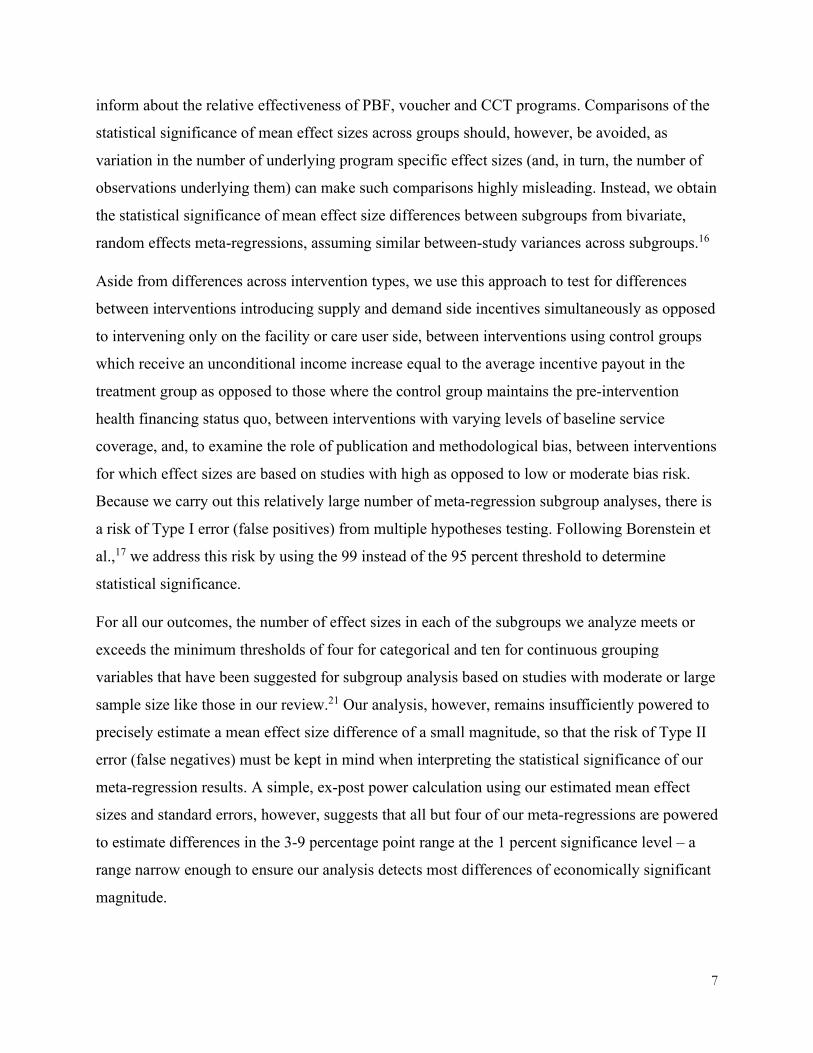
inform about the relative effectiveness of PBF, voucher and CCT programs. Comparisons of the
statistical significance of mean effect sizes across groups should, however, be avoided, as
variation in the number of underlying program specific effect sizes (and, in turn, the number of
observations underlying them) can make such comparisons highly misleading. Instead, we obtain
the statistical significance of mean effect size differences between subgroups from bivariate,
random effects meta-regressions, assuming similar between-study variances across subgroups.16
Aside from differences across intervention types, we use this approach to test for differences
between interventions introducing supply and demand side incentives simultaneously as opposed
to intervening only on the facility or care user side, between interventions using control groups
which receive an unconditional income increase equal to the average incentive payout in the
treatment group as opposed to those where the control group maintains the pre-intervention
health financing status quo, between interventions with varying levels of baseline service
coverage, and, to examine the role of publication and methodological bias, between interventions
for which effect sizes are based on studies with high as opposed to low or moderate bias risk.
Because we carry out this relatively large number of meta-regression subgroup analyses, there is
a risk of Type I error (false positives) from multiple hypotheses testing. Following Borenstein et
al.,17 we address this risk by using the 99 instead of the 95 percent threshold to determine
statistical significance.
For all our outcomes, the number of effect sizes in each of the subgroups we analyze meets or
exceeds the minimum thresholds of four for categorical and ten for continuous grouping
variables that have been suggested for subgroup analysis based on studies with moderate or large
sample size like those in our review.21 Our analysis, however, remains insufficiently powered to
precisely estimate a mean effect size difference of a small magnitude, so that the risk of Type II
error (false negatives) must be kept in mind when interpreting the statistical significance of our
meta-regression results. A simple, ex-post power calculation using our estimated mean effect
sizes and standard errors, however, suggests that all but four of our meta-regressions are powered
to estimate differences in the 3-9 percentage point range at the 1 percent significance level – a
range narrow enough to ensure our analysis detects most differences of economically significant
magnitude.

8
Our meta-regression, like all other quantitative analyses in this review, are conducted with Stata
version 16.0, primarily relying on the metan and metareg commands.
Risk of bias assessment
We grade studies as having low, medium and high risk of bias with a tool developed for reviews
in social science22 based on suggestions by the Cochrane Effective Practice Organisation of
Care,23 the Coalition for Evidence-Based Policy,24 and the Cochrane Handbook for Systematic
Reviews of Interventions16 which classifies studies into high, medium or low bias risk groups.
The tool is presented in Appendix 5, and the bias assessment results for each included study is
shown in Table 1, alongside information on the studies’ evaluation design.
Results
Search and data extraction results
The PRISMA chart shown in Figure 2 depicts the results of our search and eligibility screening
process. In the initial 2016 search round, we extracted a total of 6,289 references. After de-
duplication, title-abstract screening identified 470 potentially eligible references, of which 30
proved compliant with our inclusion criteria after full-text screening. Reasons for exclusion
varied across interventions but methodological grounds such as the use of non-compliant
identification strategies or the lack of statistical uncertainty estimates were common across all. In
repeated searches in 2017, 2018, and 2019, and 2021, we found 28 additional references meeting
our inclusion criteria, bringing the total number of included references to 58, with 24 reporting
on PBF programs, one on vouchers and PBF, eight on vouchers alone, and 25 on CCT programs
alone. From the 58 references, we extracted a total of 212 impact estimates across our six
outcomes of interest. When aggregating to the program level, there are 130 program-specific
effect sizes, with 75 effect sizes from 22 PBF programs, 31 effect sizes from ten voucher
programs, and 34 from 20 CCT programs (for studies with multiple treatment arms we consider
as separate programs treatment arms which differ in terms of having status quo as opposed to
income equalized control groups, or in terms of introducing complementary demand- or supply-
side financial incentives). Appendix 6 provides a breakdown of references, impact estimates, and
program-specific effect sizes per outcome.
Study characteristics

9
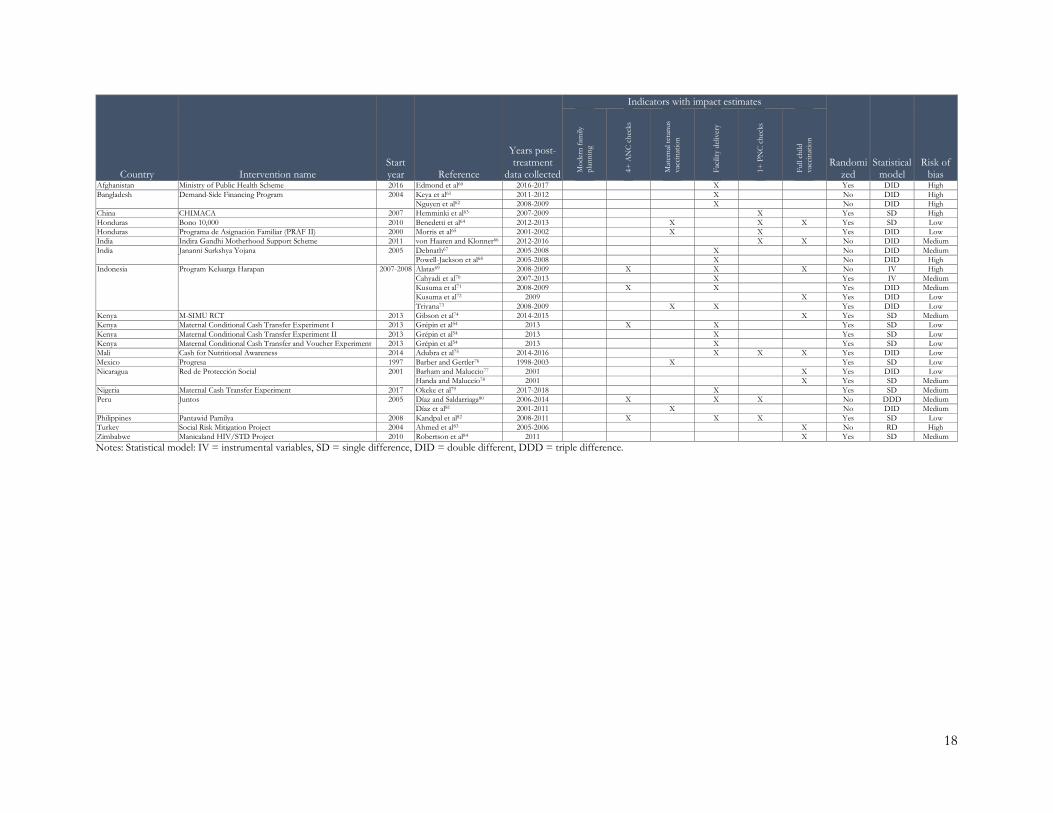
Tables 1 and 2 summarize key characteristics of the 52 programs and their evaluations in our
review. Study designs, program characteristics, and implementation contexts vary both across
and within the three intervention groups. About 55 percent of the studies in our review have
randomized designs, which are most common for CCT programs, and only three studies rely on
IV and RDD models to identify program impacts. Due to our strict methodological inclusion
criteria, the share of studies with high bias risk is only 19 percent, while we classify 53 percent
of studies as low bias risk.
In terms of implementation context, 82 percent of PBF programs in our review are in Sub-
Saharan Africa, compared to 40 percent of voucher and 35 percent of CCT programs. The
distribution is more balanced regarding country income groups, where 55 percent of PBF, 70
percent of voucher, and 50 percent of CCT programs are in low-income countries. With a
median first implementation year of 2011, PBF programs are somewhat younger than vouchers
and CCT schemes where the median year is 2009.
Regarding program characteristics, most programs were in various stages of piloting during
evaluation, with only two PBF programs (Burundi’s PBF and Rwanda’s P4P scheme) and four
CCT programs (India’s JSY, Mexico’s Progresa, Peru’s Juntos and Turkey’s Social Risk
Mitigation programs) having nationwide or near nationwide scope. A small number of programs
(India’s JSY, Kenya’s M-SIMU CCT pilot, and the Suraj and Chakwal vouchers in Pakistan)
incentivize only a single health service, while the other programs typically target a broad range
of family planning and maternal and child health indicators. Information on the magnitude of
incentives relative to baseline facility, health worker, or household incomes is often lacking or
difficult to compare across programs, but where available indicates substantial variation. In the
Tajik PBF pilot, for instance, incentive payments amount to 70 percent of base health worker
salaries – more than twice the rate as in the Afghanistan PBF pilot. Three PBF, five CCT, and,
by definition, all ten voucher programs combine demand and supply side financial incentives
instead of incentivizing either the supply or demand side alone. Finally, in five PBF schemes and
one CCT, control observations, instead of remaining untreated, received lump sum payments
equivalent to the average size of the treatment group incentive. For these programs, the estimated
effect sizes identify the impact of the incentive alone, instead of the combined impact of
incentives and increased financial means, as is the case for all other effect sizes in this review.

10
We use relatively narrow service coverage variable definitions to identify effect sizes eligible for
our review in order to minimize the risk of outcome variable heterogeneity as a confounding
factor. Nevertheless, variation in – and uncertainty about – coverage variable definitions remains
(Table 3). For instance, reports estimating impacts on modern family planning sometimes do not
list the specific contraceptive types they include, and among studies with explicit reporting of
contraceptive types, some differences, e.g. whether condoms are included, can exist. However,
examining the robustness of overall and subgroup specific mean effect sizes to the omission of
studies with diverging indicator definitions in Appendix 7, we do not find meaningful differences
from the main estimates reported.
Mean effect sizes
Modern family planning
The forest plot for modern family planning in Figure 3 shows a statistically significant mean
effect size of 3.7 percentage points and a moderate level of effect size heterogeneity (I2 = 48.2
percent) across 16 financial incentive interventions. The PBF mean effect size amounts to a
statistically significant 2.4 percentage points, with low heterogeneity across underlying program
specific effect sizes. Consequently, the prediction interval indicates that at least 95 percent of
PBF programs will yield positive impacts on modern family planning. For the four voucher
programs, the mean effect size is 6.2 percentage points, but it is statistically indistinguishable
from zero and unevenly distributed across underlying programs with an I2-statistic of 77 percent
indicating substantial effect size heterogeneity. The difference in mean effect sizes between PBF
and voucher schemes we obtain through random effects meta-regression is sizable, but its p-
value lies above the 1 percent significance threshold we use in order to account for Type I error
(Table 4). Moreover, the large discrepancy in effect size heterogeneity between PBF and
voucher programs limits the reliability of comparisons of effect sizes across the two intervention
types.
Four or more antenatal care checks
We estimate a small but statistically significant mean effect size of financial incentives on
pregnant women completing four or more antenatal care checks of 1.4 percentage points (Figure
4). Breaking programs down by intervention type, the mean effect size for PBF is close to zero,

11
with low heterogeneity across PBF schemes. The voucher mean effect size amounts to a non-
significant 2.7 percentage points and the CCT effect size is a significant 4.4 percentage points.
Like for PBF programs, the degree of heterogeneity in underlying effect sizes is low for both
intervention types. Using meta-regression, we find the difference between the relatively large
CCT and near zero PBF mean effect sizes to be statistically significant (Table 4). Neither for all
interventions combined, nor for a specific intervention type does the prediction interval exclude
zero.
Maternal tetanus vaccination
The overall mean effect size of financial incentives on maternal tetanus vaccination is a
significant 2.7 percentage points, with a moderate-to-substantial degree of heterogeneity in
underlying program specific effect sizes (Figure 5). For PBF programs, the mean effect size is 3
percentage points, with a p-value just above the 5 percent level and moderate heterogeneity. For
CCTs, the mean effect size is similar, at 2.4 percentage points, but there is substantial
heterogeneity that is driven by significant negative impact of Indonesia’s Program Keluarga
Harapan which contrasts with the positive effect sizes of the four other CCT programs. The
small difference in mean effect size magnitude between PBF and CCT programs is not
statistically significant (Table 4).
Facility delivery
For facility deliveries, the overall mean effect size of financial incentive interventions is a
statistically significant 5.3 percentage points, with moderate heterogeneity across programs
(Figure 6). All intervention-group specific mean effect sizes are statistically significant as well,
with the PBF mean effect size being smallest, at 4.4 percentage points, followed by the voucher
mean effect size of 6.4 percentage points, and the CCT mean effect size that amounts to 7.3
percentage points. Unlike for PBF and CCT programs, which show moderate heterogeneity
levels, heterogeneity for the voucher mean effect size is low, and its prediction interval is the
only one in the significantly positive range. The mean effect size differences across intervention
types, while somewhat substantive in magnitude, are not statistically significant (Table 4).
Postnatal care checks

12
The mean effect size across all financial incentives interventions for postnatal care checks is a
modest but statistically significant 2.7 percentage points (Figure 7). A low degree effect size
heterogeneity across programs is mirrored in intervention type specific mean effect sizes of
similar magnitude – a non-significant 2.2 percentage points for PBF, 3.2 percentage points – and
significant – for vouchers, and 3.1 percentage points and not significant for CCTs. None of the
small differences in effect size magnitudes are statistically significant (Table 4). Intervention-
group specific effect size heterogeneity is low for PBF and vouchers and moderate for CCTs.
Full childhood vaccination
The overall mean effects size across financial incentive interventions amounts to a statistically
significant 4.4 percentage points, with a low-to-moderate degree of underlying effect size
heterogeneity (Figure 8). For PBF schemes, the mean effect size is a significant 3.9 percentage
points, with low effect size heterogeneity, and for CCTs it is a significant 5 percentage points
with low heterogeneity and a prediction interval above zero. The small difference in mean effect
size between PBF and CCT schemes is not statistically significant (Table 4).
Subgroup analysis
Combining supply and demand side incentives
To test the hypothesis that complementarities exist between demand- and supply-side
interventions, we examine if effect sizes of schemes which combine supply- and demand-side
financial incentives are larger than those of schemes which only incentivize either the demand-
or the supply-side. The meta-regression results in column 1 of Table 5 provide little evidence for
such systematic complementarities. In no case do we find statistically significant differences
between combined and single-side interventions, and meaningful differences in effect size
magnitudes arise for just two service coverage outcomes: Modern family planning is the only
indicator where the mean effect size of the four voucher and one PBF scheme which incentivize
both the supply- and demand-side is substantively larger, at 4.3 percentage points, than for
single-side interventions. By contrast, for maternal tetanus vaccination, the mean effect size
across single-side interventions is, somewhat counterintuitively, 6.6 percentage points larger than
that across the combined supply- and demand-side interventions.
Control groups with budget equalization

13
Column 2 of Table 5 tests whether interventions where the control group receives an income
increase equivalent to the mean incentive payout in the treatment group – i.e. an unconditional
cash transfer in case of demand-side programs and a block grant in case of supply-side programs
– have smaller effects than interventions where the control group continues to operate under the
financial status quo. Meaningfully smaller mean effect sizes among programs with control group
income equalization would indicate that the provision of additional funds, perhaps more so than
the incentive itself, contributes to the positive impacts of financial incentive interventions on
maternal and child health service coverage. Only one of the mean effect size differences we
estimate is significant at the 1 percent level, but for five of the six outcomes, the relationship is
negative, and for four, the differences are larger than minus two percentage points, which is
substantive compared to the modest mean effect sizes we find above.
Baseline outcome values
Table 5 column 3 shows the association of effect sizes with baseline outcome values, as a
measure for pre-intervention health system effectiveness in reaching mothers and children with
health services – a possible proxy for country income levels and overall implementation context.
Contrasting hypotheses for this regressor predict differing impacts. A negative relationship
would result if, for instance, low baseline outcome levels indicated low capacity to successfully
implement financial incentives. A positive relationship would, by contrast, arise, if, for example,
a low baseline outcome level indicated larger populations within reach of marginal changes in
financial incentives. Our meta-regressions, however, find no meaningful relationships between
baseline outcome levels and program effect sizes, indicating that neither effect is relevant or that
the two hypothesized effects cancel each other out: None of the coefficients are statistically
significant and the largest – estimated for 4+ antenatal care checks – indicates that a ten
percentage point difference in baseline outcomes is associated with a mere 0.7 percentage point
higher financial incentive effect.
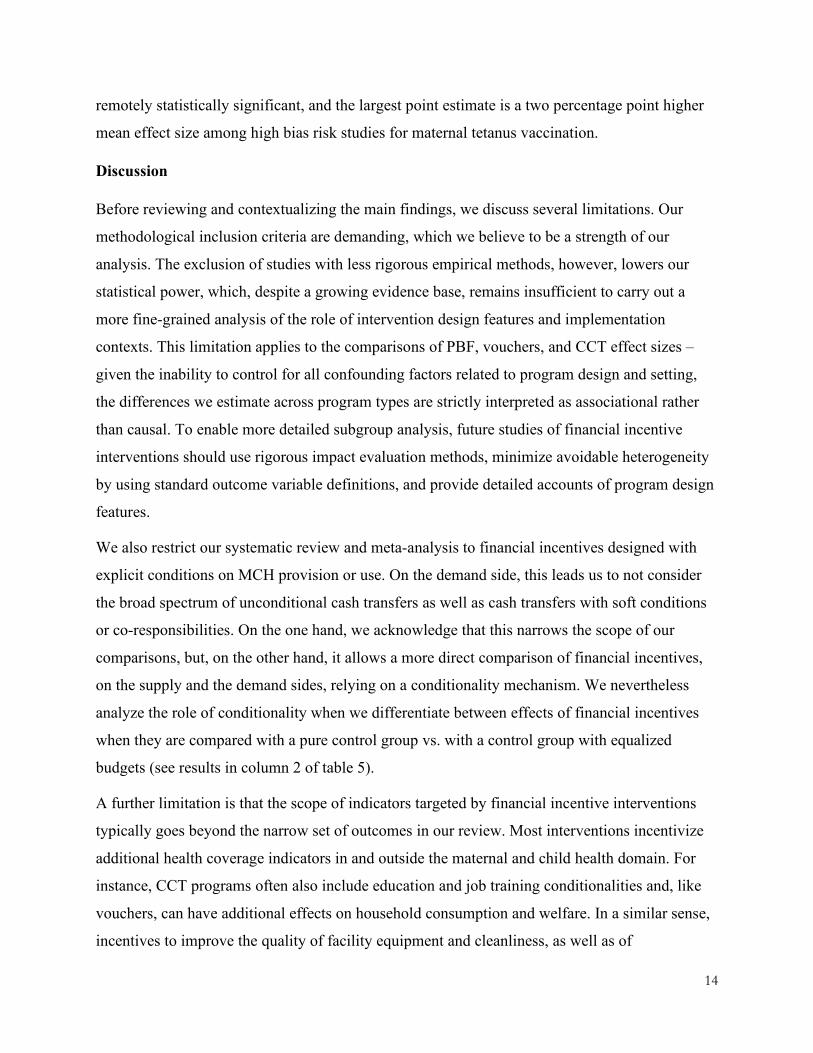
Risk of bias
To investigate possible impacts of study bias on our results, we regress program effect sizes on a
dummy variable indicating if we classified the underlying evidence as having high, as opposed to
medium or low, bias risk. Results in column 4 of Table 5 indicate no systematic relationship of
study bias risk with the magnitude of effect sizes, as none of the estimated coefficients is
14
remotely statistically significant, and the largest point estimate is a two percentage point higher
mean effect size among high bias risk studies for maternal tetanus vaccination.
Discussion
Before reviewing and contextualizing the main findings, we discuss several limitations. Our
methodological inclusion criteria are demanding, which we believe to be a strength of our
analysis. The exclusion of studies with less rigorous empirical methods, however, lowers our
statistical power, which, despite a growing evidence base, remains insufficient to carry out a
more fine-grained analysis of the role of intervention design features and implementation
contexts. This limitation applies to the comparisons of PBF, vouchers, and CCT effect sizes –
given the inability to control for all confounding factors related to program design and setting,
the differences we estimate across program types are strictly interpreted as associational rather
than causal. To enable more detailed subgroup analysis, future studies of financial incentive
interventions should use rigorous impact evaluation methods, minimize avoidable heterogeneity
by using standard outcome variable definitions, and provide detailed accounts of program design
features.
We also restrict our systematic review and meta-analysis to financial incentives designed with
explicit conditions on MCH provision or use. On the demand side, this leads us to not consider
the broad spectrum of unconditional cash transfers as well as cash transfers with soft conditions
or co-responsibilities. On the one hand, we acknowledge that this narrows the scope of our
comparisons, but, on the other hand, it allows a more direct comparison of financial incentives,
on the supply and the demand sides, relying on a conditionality mechanism. We nevertheless
analyze the role of conditionality when we differentiate between effects of financial incentives
when they are compared with a pure control group vs. with a control group with equalized
budgets (see results in column 2 of table 5).
A further limitation is that the scope of indicators targeted by financial incentive interventions
typically goes beyond the narrow set of outcomes in our review. Most interventions incentivize
additional health coverage indicators in and outside the maternal and child health domain. For
instance, CCT programs often also include education and job training conditionalities and, like
vouchers, can have additional effects on household consumption and welfare. In a similar sense,
incentives to improve the quality of facility equipment and cleanliness, as well as of

15
administrative processes, are almost always built into PBF programs, whose impacts on
transparency, provider accountability, and data usage are often hoped to have a transformational
effect on health systems as a whole.25,26 For these reasons, the evidence in this review warrants
conclusions only about the effects of financial incentives on the six included indicators, and not
about the overall (cost-) effectiveness of specific programs or entire intervention types.
With these caveats in mind, a number of insights emerge from our analysis. While on average,
financial incentives increase coverage of all included maternal and child health service
indicators, mean effect sizes are of modest magnitude, with the largest for facility delivery and
full childhood vaccination where they amount to about five percentage points. We find effect
size heterogeneity across financial incentive programs to be low to moderate for all indicators
except maternal tetanus vaccination. Despite this finding, due to the still limited evidence base,
mean effect size prediction intervals indicate less than 95 percent certainty for a positive impact
of future programs for all indicators other than postnatal care – policy makers hence still face
substantial uncertainty in deciding on interventions to improve service coverage.
The low to moderate levels of effect size heterogeneity across financial incentive interventions is
mirrored in typically small differences in mean effect sizes across PBF, voucher, and CCT
programs. Our analysis is not sufficiently powered to precisely determine the magnitude of these
differences, but the totality of our results suggests that PBF is slightly less effective in improving
maternal and child health coverage than voucher and CCT schemes. The one exception where
the PBF mean effect point estimate is larger than that of vouchers and CCTs is maternal tetanus
vaccination, a plausible result, as indicators with a strong content-of-care dimension like
maternal tetanus vaccination are under more direct control of providers incentivized with PBF. In
contrast, the five other coverage indicators are likely more easily influenced with demand-side
incentivization, as they mainly depend on patient care-seeking decisions.
Testing for other possible drivers of effect size heterogeneity across financial incentive
programs, we neither find systematic evidence for complementarities between supply- and
demand-side incentives, nor for an influence of baseline indicator levels. However, there is some
indication that income equalization in the control group substantively diminishes the impact of
financial incentives schemes, suggesting that unconditional increases in health care provider and
household incomes can lead to similar health service coverage increases as incentive

16
interventions – a finding in line with the conclusions of a recent narrative review by Diaconu et
al.1 This conclusion, similar to the result of smaller mean service coverage effects of PBF than of
voucher and CCT programs, requires confirmation through future, better-powered meta-analysis.

17
Tables Table 1: Characteristics of included reports
Country Intervention name Start year Reference
Years post-treatment
data collected
Indicators with impact estimates
Randomized
Statistical model
Risk of bias M
oder
n fa
mily
pl
anni
ng
4+ A
NC
che
cks
Mat
erna
l tet
anus
va
ccin
atio
n
Faci
lity
deliv
ery
1+ P
NC
che
cks
Full
child
va
ccin
atio
n
Performance-Based Financing Afghanistan System Enhancement for Health Action in Transition 2010 Engineer et al27 2010-2012 X X Yes SD Medium Burkina Faso Reproductive Health Project I 2013 De Allegri et al28 2015-2017 X X X X X X No DID High Burkina Faso Reproductive Health Project II 2013 De Allegri et al28 2015-2017 X X X X X X No DID High Burundi PBF Scheme 2006 Bonfrer et al29 2007-2010 X X X No DID High
Bonfrer et al30 2006-2011 X X X No DID Medium Gage and Bauhoff31 2006-2017 X X No DID Medium Rudasingwa et al32 2007-2008 X X No DID High
Cambodia Contracting-in 2004 Van de Poel et al33 2004-2010 X X No DID Medium Cambodia Government Scheme 2004 Van de Poel et al33 2004-2010 X X No DID Medium Cameroon Health Sector Support Investment Project I 2012 de Walque et al34 2013-2015 X X X Yes DID Low Cameroon Health Sector Support Investment Project II 2012 de Walque et al34 2013-2015 X X X Yes DID Low Congo, Dem. Rep. Health Sector Rehabilitation and Support Project 2010 Huillery and Seban35 2011-2012 X Yes SD Medium Congo, Rep. Health Sector Services Development Project 2012 Zeng et al36 2012-2014 X X X No DID Medium Gambia, The Maternal and Child Nutrition and Health Results Project 2014 Ferguson et al37 2014-2016 X Yes DID Medium Lesotho Health System Performance Enhancement Project 2016 Gage and Bauhoff31 2016-2018 X X No DID Medium Nigeria State Health Investment Project I 2014 Kandpal et al38 2015-2017 X X X X No DID Medium Nigeria State Health Investment Project II 2014 Kandpal et al38 2015-2017 X X X X No DID Medium Rwanda P4P scheme 2006 Basinga et al39 2006-2008 X X X No DID Medium
Gertler and Vermeersch40 2006-2008 X X No DID Medium Lannes et al41 2006-2008 X X X No DID Medium Okeke and Chari42 2000-2008 X X No DID Medium Priedeman Skiles et al43 2006-2008 X X X No DID Medium Sherry et al44 2006-2008 X X X X X No DID Medium
Rwanda Community Living Standards Grant 2009 Shapira et al45 2010-2014 X X Yes SD Low Senegal Health and Nutrition Financing Project 2012 Gage and Bauhoff31 2012-2017 X X No DID Medium Tajikistan Health Services Improvement Project 2015 Ahmed et al46 2015-2018 X X X Yes DID Medium Tanzania Pwani Pilot 2011 Binyaruka et al47 2012-2013 X X X No DID Medium Zambia Zambia Health Services Improvement Project I 2012 Gage and Bauhoff31a 2012-2018 X X Yes DID Low
World Bank48 2012-2015 X X X X X Yes DID Low Zeng et al49 2012-2015 X X Yes DID Low
Zambia Zambia Health Services Improvement Project II 2012 World Bank48 2012-2015 X X X X X Yes DID Low Zeng et al49 2012-2015 X X Yes DID Low
Zimbabwe Health Sector Development Support Project 2011 Gage and Bauhoff31 2012-2015 X X No DID Medium World Bank50 2012-2014 X X X X X No DID Medium
Vouchers Cambodia Reproductive Health Voucher 2010 Bajracharya et al51 2012-2013 X No DID Medium Cambodia Targeted Maternal and Child Health Voucher 2007 Van de Poel et al52 2007-2010 X X No DID Medium Cambodia Universal Maternal and Child Health Voucher 2008 Van de Poel et al52 2008-2010 X X No DID Medium Kenya Reproductive Health Voucher 2006 Dennis et al53 2010-2013 X X X No DID Medium Kenya Maternal Voucher Experiment 2013 Grépin et al54 2013 X X Yes SD Low Pakistan Jhang Maternal Health Voucher 2010 Agha55 2010-2011 X X No DID High Pakistan Marie Stopes Chakwal Voucher 2012 Ali et al56 2015 X Yes DID Medium Pakistan Suraj 2008 Azmat et al57 2013 X No DID High Tanzania Helping Poor Pregnant Women Access Better Health Care 2010 Kuwawenaruwa et al58 2013-2014 X X X X No DID Medium Uganda HealthyBaby 2008 Obare et al59 2010-2011 X X X No DID High
Conditional Cash Transfers
18
Country Intervention name Start year Reference
Years post-treatment
data collected
Indicators with impact estimates
Randomized
Statistical model
Risk of bias M
oder
n fa
mily
pl
anni
ng
4+ A
NC
che
cks
Mat
erna
l tet
anus
va
ccin
atio
n
Faci
lity
deliv
ery
1+ P
NC
che
cks
Full
child
va
ccin
atio
n
Afghanistan Ministry of Public Health Scheme 2016 Edmond et al60 2016-2017 X Yes DID High Bangladesh Demand-Side Financing Program 2004 Keya et al61 2011-2012 X No DID High
Nguyen et al62 2008-2009 X No DID High China CHIMACA 2007 Hemminki et al63 2007-2009 X Yes SD High Honduras Bono 10,000 2010 Benedetti et al64 2012-2013 X X X Yes SD Low Honduras Programa de Asignación Familiar (PRAF II) 2000 Morris et al65 2001-2002 X X Yes DID Low India Indira Gandhi Motherhood Support Scheme 2011 von Haaren and Klonner66 2012-2016 X X No DID Medium India Jananni Surkshya Yojana 2005 Debnath67 2005-2008 X No DID Medium
Powell-Jackson et al68 2005-2008 X No DID High Indonesia Program Keluarga Harapan 2007-2008 Alatas69 2008-2009 X X X No IV High
Cahyadi et al70 2007-2013 X Yes IV Medium Kusuma et al71 2008-2009 X X Yes DID Medium Kusuma et al72 2009 X Yes DID Low Triyana73 2008-2009 X X Yes DID Low
Kenya M-SIMU RCT 2013 Gibson et al74 2014-2015 X Yes SD Medium Kenya Maternal Conditional Cash Transfer Experiment I 2013 Grépin et al54 2013 X X Yes SD Low Kenya Maternal Conditional Cash Transfer Experiment II 2013 Grépin et al54 2013 X Yes SD Low Kenya Maternal Conditional Cash Transfer and Voucher Experiment 2013 Grépin et al54 2013 X Yes SD Low Mali Cash for Nutritional Awareness 2014 Adubra et al75 2014-2016 X X X Yes DID Low Mexico Progresa 1997 Barber and Gertler76 1998-2003 X Yes SD Low Nicaragua Red de Protección Social 2001 Barham and Maluccio77 2001 X Yes DID Low
Handa and Maluccio78 2001 X Yes SD Medium Nigeria Maternal Cash Transfer Experiment 2017 Okeke et al79 2017-2018 X Yes SD Medium Peru Juntos 2005 Díaz and Saldarriaga80 2006-2014 X X X No DDD Medium
Díaz et al81 2001-2011 X No DID Medium Philippines Pantawid Pamilya 2008 Kandpal et al82 2008-2011 X X X Yes SD Low Turkey Social Risk Mitigation Project 2004 Ahmed et al83 2005-2006 X No RD High Zimbabwe Manicaland HIV/STD Project 2010 Robertson et al84 2011 X Yes SD Medium Notes: Statistical model: IV = instrumental variables, SD = single difference, DID = double different, DDD = triple difference.

19
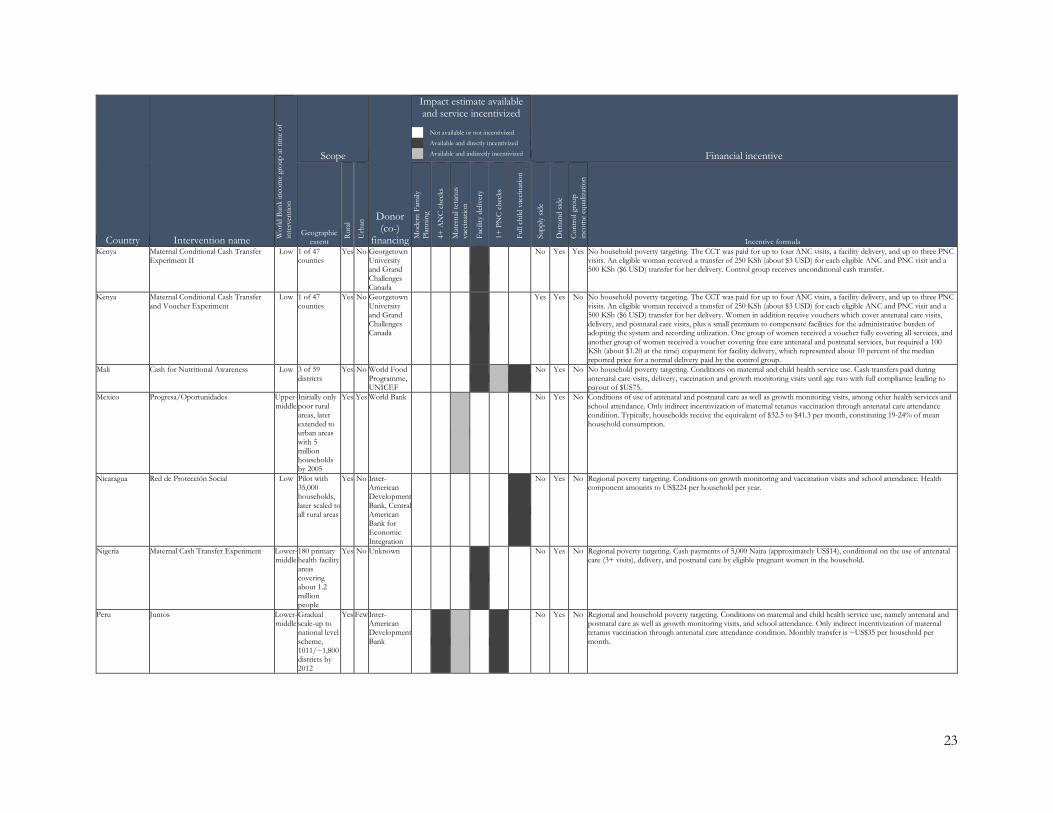
Table 2: Characteristics of included programs
Country Intervention name Wor
ld B
ank
inco
me
grou
p at
tim
e of
in
terv
entio
n
Scope
Donor (co-)
financing
Impact estimate available and service incentivized
Not available or not incentivized
Available and directly incentivized
Available and indirectly incentivized Financial incentive
Geographic extent
Rura
l
Urb
an
Mod
ern
Fam
ily
Plan
ning
4+ A
NC
che
cks
Mat
erna
l tet
anus
va
ccin
atio
n
Faci
lity
deliv
ery
1+ P
NC
che
cks
Full
child
vac
cina
tion
Supp
ly si
de
Dem
and
side
Con
trol
gro
up
inco
me
equa
lizat
ion
Incentive formula
Performance-Based Financing
Afghanistan System Enhancement for Health Action in Transition
Low 11 of 34 provinces
Yes Yes World Bank
Yes No No Quarterly incentive payments directly to healthcare workers on a case-basis and annual payments according to equity of service delivery, facility quality scorecards and uptake of contraceptives in the catchment area. Salary bonuses component amounts to 6-28% of base salaries.
Burkina Faso Reproductive Health Project I Low 15 of 351 departments
Yes Yes World Bank Yes No No Monthly incentive payments on a case-basis and additional quarterly quality payments if facility achieves quality score of at least 50% of maximum score. Facilities with full autonomy regarding use of bonuses.
Burkina Faso Reproductive Health Project II Low 15 of 351 departments
Yes Yes World Bank
Yes Yes No Monthly incentive payments on a case-basis and additional quarterly quality payments if facility achieves quality score of at least 50% of maximum score. Facilities with full autonomy regarding use of bonuses. Three type of demand-side co-interventions, namely user fee waivers for the poor, user fee waivers and additional financial incentives for healthcare workers to provide care to them, and community-based health insurance with waived premiums for the poor.
Burundi PBF Scheme Low Nationwide Yes Yes Cordaid
Yes No No Nationwide scheme. Quarterly incentive payments on a case-basis which are multiplied by a factor between 1 and 1.25 according to results of check of facility conditions and process quality. Incentive can amount to up to 40% of base budgets. 50% of incentive payment can be used for salary bonuses
Cambodia Contracting-in Low 11 of 81 districts
Yes Yes Yes, but specific donor information not available
Yes No No NGO contracted to design and manage performance incentive payments in government facilities, but without autonomy over staffing and procurement decisions. Nature of incentive payments at discretion of NGO, leading to heterogeneity.
Cambodia Government scheme Low 8 of 81 districts
Yes Yes Belgian Technical Cooperation
Yes No No Government operated scheme supported by NGO. Case-based payments and bonuses for reaching quantitative targets
and for abstention from illegitimate practices.
Cameroon Health Sector Support Investment Project I
Lower-middle
26 of 189 health districts
Yes Yes World Bank
Yes No No Monthly incentive payments on a case-basis subject to 25% reduction if excessive reporting errors detected during monthly verification. Case-based payments are increased by a factor between 1 and 1.3 according to results of check of facility conditions and process quality. Additional adjustments for facilities with large structural deficiencies. Facility management committee determines use of funds. Control group without budget equalization.
Cameroon Health Sector Support Investment Project II
Lower-middle
26 of 189 health districts
Yes Yes World Bank
Yes No Yes Monthly incentive payments on a case-basis subject to 25% reduction if excessive reporting errors detected during monthly verification. Case-based payments are increased by a factor between 1 and 1.3 according to results of check of facility conditions and process quality. Additional adjustments for facilities with large structural deficiencies. Facility management committee determines use of funds. Control group with budget equalization.
Congo, Dem. Rep.
Health Sector Rehabilitation and Support Project
Low 1 of 26 districts
Yes Yes World Bank
Yes No Yes Monthly incentive payments on a case-basis subject to reduction if reporting errors detected during monthly verification. No adjustment for quality. Facility with autonomy on how to use funds. Control group with budget equalization.
Congo, Rep. Health Sector Services Development Project
Lower-middle
2 of 12 departments, home to 30% of population
Yes Yes World Bank
Yes No No Quarterly incentive payments on a case-basis which are multiplied by a factor between 1 and 1.5 according to results of check of facility conditions and process quality and user satisfaction. Additional bonuses for facilities situated in remote areas, those with very poor catchment area populations, and those of very poor structural quality. Quality bonus not paid out if at least 10% of reported services cannot be verified. Facility determines what share of incentive payment is used for salary bonus.
Gambia, The Maternal and Child Nutrition and Health Results Project
Low 3 of 5 regions, home to one third of the population
Yes Yes World Bank
Yes Yes No Quarterly incentive payments on a case-basis which are multiplied by a factor between 1 and 2 according to results of check of facility conditions. 40% of incentive payment can be used for salary bonuses. As co-intervention, women invited to enroll in CCT scheme rewarding timeliness of first and completion of 4 ANC visits.
Lesotho Health System Performance Enhancement Project
Lower-middle
6 of 10 districts
Yes Yes World Bank Yes No No Quarterly incentive payments on a case-basis which are multiplied by a factor between 1 and 1.25 according to results of check of facility conditions and process quality. 50% of incentive payment can be used for salary bonuses.

20
Country Intervention name Wor
ld B
ank
inco
me
grou
p at
tim
e of
in
terv
entio
n
Scope
Donor (co-)
financing
Impact estimate available and service incentivized
Not available or not incentivized
Available and directly incentivized
Available and indirectly incentivized Financial incentive
Geographic extent
Rura
l
Urb
an
Mod
ern
Fam
ily
Plan
ning
4+ A
NC
che
cks
Mat
erna
l tet
anus
va
ccin
atio
n
Faci
lity
deliv
ery
1+ P
NC
che
cks
Full
child
vac
cina
tion
Supp
ly si
de
Dem
and
side
Con
trol
gro
up
inco
me
equa
lizat
ion
Incentive formula Nigeria State Health Investment Project I Lower-
middle 3 of 36 states covering about 400,000 pregnant women and 1.8 million children
Yes Yes World Bank
Yes No No Quarterly incentive payments on a case-basis which are multiplied by a factor between 1 and 1.25 according to results of check of facility conditions and process quality. 50% of incentive payment can be used for salary bonuses. Control groups with and without budget equalization.
Nigeria State Health Investment Project II Lower-middle
3 of 36 states covering about 400,000 pregnant women and 1.8 million children
Yes Yes World Bank
Yes No Yes Quarterly incentive payments on a case-basis which are multiplied by a factor between 1 and 1.25 according to results of check of facility conditions and process quality. 50% of incentive payment can be used for salary bonuses. Control groups with and with budget equalization.
Rwanda Community Living Standards Grant Low 50 of 416 sectors in districts covered by Rwanda P4P
Yes No World Bank
Yes No Yes Quarterly incentive payments to community health workers who provide promotional and referral services according to service utilization in the community, namely growth monitoring of children 6–59 months old, antenatal care provided to women in the first 4 months of their pregnancy, in-facility deliveries, and family planning consultations. No direct incentivization of achieving 4+ ANC visits beyond the incentive for commencing ANC early. 70% of performance bonus invested into the community health worker cooperatives’ income-generating activities, rest is salary bonus. Control group with budget equalization.
Rwanda P4P Scheme Low All rural districts
Yes No Several, incl. Belgian Technical Cooperation, PEFPAR, and World Bank
Yes No Yes Quarterly incentive payments on a case-basis which are multiplied by a factor between 0 and 1 according to results of check of facility conditions and process quality. Facility autonomy in use of funds, on average 77% used for salary bonuses, resulting in 38% salary increase. Similar use of additional funds in control group which receives budget equalization.
Senegal Health and Nutrition Financing Project Lower-middle
6 of 14 regions
Yes Yes World Bank
Yes Yes No Quarterly incentive payments on a case-basis which are multiplied by a factor between 1 and 1.25 according to results of check of facility conditions and process quality. 75% of incentive payment can be used for salary bonuses. As co-intervention, pregnant women receive vouchers for 4 ANC visits and skilled delivery.
Tajikistan Health Services Improvement Project Low 7 of 58 districts
Yes No World Bank
Yes No No Quarterly incentive payments on a case-basis which are multiplied by a factor between 1 and 2 according to results of check of facility conditions and process quality. Facilities with a quality score of less than 55% of the maximum receive no quality bonus. 70% of incentive payment can be used for salary bonuses
Tanzania Pwani pilot Low 1 of 30 states Yes No Gov’t of Norway
Yes No No Half-yearly incentive payments based on achievement of at least 75% of service delivery targets. Minimum of 75% of bonus payments are distributed among health workers, which amounts to up to 10% of base salaries. Direct incentivization of malaria and HIV treatment during pregnancy but no direct incentivization of antenatal care visits.
Zambia Health Services Improvement Project I Lower-middle
11 of 117 districts
Yes No World Bank
Yes No No Quarterly incentive payments on a case-basis which are multiplied by a factor between 1 and 1.5 according to results of check of facility conditions and process quality. Facilities with a quality score of less than 61% of the maximum receive no quality bonus. Up to 60% of incentive payments can be used for salary bonuses. Control group without budget equalization.
Zambia Health Services Improvement Project II Lower-middle
11 of 117 districts
Yes No World Bank
Yes No Yes Quarterly incentive payments on a case-basis which are multiplied by a factor between 1 and 1.5 according to results of check of facility conditions and process quality. Facilities with a quality score of less than 61% of the maximum receive no quality bonus. Up to 60% of incentive payments can be used for salary bonuses. Control group with budget equalization.

21
Country Intervention name Wor
ld B
ank
inco
me
grou
p at
tim
e of
in
terv
entio
n
Scope
Donor (co-)
financing
Impact estimate available and service incentivized
Not available or not incentivized
Available and directly incentivized
Available and indirectly incentivized Financial incentive
Geographic extent
Rura
l
Urb
an
Mod
ern
Fam
ily
Plan
ning
4+ A
NC
che
cks
Mat
erna
l tet
anus
va
ccin
atio
n
Faci
lity
deliv
ery
1+ P
NC
che
cks
Full
child
vac
cina
tion
Supp
ly si
de
Dem
and
side
Con
trol
gro
up
inco
me
equa
lizat
ion
Incentive formula Zimbabwe Health Sector Development Support
Project Low 16 of 62
districts, home to about 3.5 million people
Yes No World Bank
Yes No No Quarterly incentive payments on a case-basis which are multiplied by a factor between 1 and 1.3 according to facility remoteness and by a factor between 1 and 1.25 according to results of check of facility conditions and process quality. Facilities with a quality score of less than 51% of the maximum receive no quality bonus. Up to 25% of incentive payments can be used for salary bonuses.
Vouchers
Cambodia Reproductive Health Voucher Low 9 of 77 health districts
Yes Yes KfW
Yes Yes No Household poverty targeting. Vouchers cover family planning and maternal and child health services, incl. transportation. Vouchers distributed free of charge.
Cambodia Targeted Maternal and Child Health Voucher
Low 8 of 77 health districts
Yes Yes Unknown
Yes Yes No Household poverty targeting. Vouchers cover maternal and child health services, incl. transport. Vouchers distributed free of charge.
Cambodia Universal Maternal and Child Health Voucher
Low 14 of 77 health districts
Yes Yes Unknown
Yes Yes No No poverty targeting. Vouchers cover maternal and child health services, incl. transport. Vouchers distributed free of charge.
Kenya Maternal Voucher Experiment Low 1 of 47 counties
Yes No Georgetown University and Grand Challenges Canada
Yes Yes No Vouchers cover antenatal care visits, delivery, and postnatal care visits, plus a small premium to compensate facilities for the administrative burden of adopting the system and recording utilization. One group of women received a voucher fully covering all services, and another group of women received a voucher covering free care antenatal and postnatal services, but required a 100 KSh (about $1.20 at the time) copayment for facility delivery, which represented about 10 percent of the median reported price for a normal delivery paid by the control group.
Kenya Reproductive Health Voucher Low 4 of 47 counties, about 100,000 vouchers sold
Yes Yes KfW
Yes Yes No Household poverty targeting. Voucher covers family planning and maternal and child health services including 4 antenatal care visits, facility delivery and postnatal care. Maternal and child health voucher sold for $US2.50 and family planning voucher for $US1.25.
Pakistan Jhang Maternal Health Voucher Lower-middle
1 of 150 districts, about 4,000 vouchers sold
Yes No Unknown
Yes Yes No Household poverty targeting. Voucher covers family planning visit, 3 antenatal care visits, facility delivery and a postnatal care visits, as well as transportation. Vouchers sold for $US1.25.
Pakistan Marie Stopes Chakwal Voucher Lower-middle
1 of 150 districts, about 7,000 vouchers distributed
Yes Yes Marie Stopes
Yes Yes No Household poverty targeting. Voucher covers family planning services. Vouchers are free of charge.
Pakistan Suraj Lower-middle
3 of 150 districts
Yes Yes Marie Stopes Yes Yes No Household poverty targeting. Voucher covers family planning services. Vouchers are free of charge.
Tanzania Helping Poor Pregnant Women Access Better Health Care
Low 2 of 31 regions, about 120,000 women
Yes Yes KfW
Yes Yes No First household poverty targeting, later regional. Nominally an insurance scheme but effectively and planned as a voucher that covers maternal and child health services. Vouchers are free of charge.
Uganda HealthyBaby Low 20 of 130 districts
Yes Yes KfW Yes Yes No Household poverty targeting. Voucher covers maternal and child health services. Voucher sold for $US1.5.
Conditional Cash Transfers

22
Country Intervention name Wor
ld B
ank
inco
me
grou
p at
tim
e of
in
terv
entio
n
Scope
Donor (co-)
financing
Impact estimate available and service incentivized
Not available or not incentivized
Available and directly incentivized
Available and indirectly incentivized Financial incentive
Geographic extent
Rura
l
Urb
an
Mod
ern
Fam
ily
Plan
ning
4+ A
NC
che
cks
Mat
erna
l tet
anus
va
ccin
atio
n
Faci
lity
deliv
ery
1+ P
NC
che
cks
Full
child
vac
cina
tion
Supp
ly si
de
Dem
and
side
Con
trol
gro
up
inco
me
equa
lizat
ion
Incentive formula Afghanistan Ministry of Public Health Scheme Low 6 of 399
districts Yes No UNICEF Yes Yes No No poverty targeting. Conditions on facility delivery with women delivering in facility receive 1,000 Afghani (13$US)
and community health workers 300 Afghani (4$US) for bringing them to facility. No incentivization of postnatal care. Bangladesh Demand-Side Financing Program Low 46 of 492
sub-districts Yes No Yes, pooled
donor funding
Yes Yes No Regional and household poverty targeting. Freely available vouchers cover family planning and maternity service costs, women can receive routine and emergency transport reimbursement of 500 Taka (7.5$US) and conditional on use of skilled birth attendance women receive in kind (worth 500 Taka/7.5$US) and cash (2,000 Taka/30$US) benefit for skilled birth attendance. Facilities reimbursed if they deliver package of services covered by voucher.
China CHIMACA Lower-middle
3 of 1,355 counties
Yes No No No Yes No Regional poverty targeting. Conditions on use of antenatal and postnatal care. Maximum transfer of 20 RMB (3$US) per pregnancy.
Honduras Bono 10,000 Lower-middle
666 of about 3,7000 villages
Yes No World Bank, Inter-American Development Bank, Central American Bank for Economic Integration
No Yes No Regional poverty targeting. Health conditions include registration with health clinic, and presentation for antenatal and postnatal care, and growth monitoring visits. Maternal tetanus vaccination and childhood vaccinations not directly incentivized but part of incentivized antenatal care and growth monitoring visits. Problems with enforcement of conditionalities reported. Health component is 500$US per household per year in three installments.
Honduras Programa de Asignación Familiar (PRAF II)
Lower-middle
6 of 298 municipalities
Yes No Inter-American Development Bank
No Yes No Regional poverty targeting. Health conditions include antenatal and postnatal care as well as growth monitoring visits. No direct incentivization of maternal tetanus vaccination but part of incentivized antenatal care visits. Problems with enforcement of conditionalities reported. Health component is 40$US per child or pregnant woman per year.
India Indira Gandhi Motherhood Support Scheme/Pradhan Mantri Matritva Vandana Yojana
Lower-middle
52 of 640 districts
Yes Yes No
Yes Yes No No poverty targeting. Conditions on using any antenatal care, maternal tetanus vaccination, postnatal care, child vaccinations, collection of nutritional supplements, and completion of growth checks and counseling sessions. Total payout to women was initially 4,000 Rp. (65$US), later raised to 6,000 Rp (98$US). Health workers in primary care centers receive incentive of between 100 and 200 Rp (1.6-3.2$US) per completed case.
India Jananni Surkshya Yojana Low Gradual nationwide rollout, estimated to cover 36% of pregnancies in the country in 2009/10
Yes Yes No
Yes Yes No Regional and household level poverty targeting depending on state. Conditions on public or accredited private facility delivery. Cash transfer varies by state between 11$US and 31$US. Social health workers are offered a cash payment of between $4 and $13 for each delivery.
Indonesia Program Keluarga Harapan Lower-middle
362 of about 75,000 sub-districts
Yes Yes World Bank
No Yes No Household poverty targeting. Conditions on maternal and child health service use and school attendance. Indirect incentivization of maternal tetanus vaccination through conditioning on antenatal care use. Quarterly cash transfers vary by household composition between US$60 and US$220.
Kenya M-SIMU RCT Low 2 of 70 districts, 1,062 caregivers of young children
Yes No Bill and Melinda Gates Foundation
No Yes No No household poverty targeting. Conditions on timely vaccinations visits. Cash transfer per timely vaccination varies by treatment arm between $US 0.88 and $US2.35.
Kenya Maternal Conditional Cash Transfer Experiment I
Low 1 of 47 counties
Yes No Georgetown University and Grand Challenges Canada
No Yes No No household poverty targeting. The CCT was paid for up to four ANC visits, a facility delivery, and up to three PNC visits. An eligible woman received a transfer of 250 KSh (about $3 USD) for each eligible ANC and PNC visit and a 500 KSh ($6 USD) transfer for her delivery.
23
Country Intervention name Wor
ld B
ank
inco
me
grou
p at
tim
e of
in
terv
entio
n
Scope
Donor (co-)
financing
Impact estimate available and service incentivized
Not available or not incentivized
Available and directly incentivized
Available and indirectly incentivized Financial incentive
Geographic extent
Rura
l
Urb
an
Mod
ern
Fam
ily
Plan
ning
4+ A
NC
che
cks
Mat
erna
l tet
anus
va
ccin
atio
n
Faci
lity
deliv
ery
1+ P
NC
che
cks
Full
child
vac
cina
tion
Supp
ly si
de
Dem
and
side
Con
trol
gro
up
inco
me
equa
lizat
ion
Incentive formula Kenya Maternal Conditional Cash Transfer
Experiment II Low 1 of 47
counties Yes No Georgetown
University and Grand Challenges Canada
No Yes Yes No household poverty targeting. The CCT was paid for up to four ANC visits, a facility delivery, and up to three PNC visits. An eligible woman received a transfer of 250 KSh (about $3 USD) for each eligible ANC and PNC visit and a 500 KSh ($6 USD) transfer for her delivery. Control group receives unconditional cash transfer.
Kenya Maternal Conditional Cash Transfer and Voucher Experiment
Low 1 of 47 counties
Yes No Georgetown University and Grand Challenges Canada
Yes Yes No No household poverty targeting. The CCT was paid for up to four ANC visits, a facility delivery, and up to three PNC visits. An eligible woman received a transfer of 250 KSh (about $3 USD) for each eligible ANC and PNC visit and a 500 KSh ($6 USD) transfer for her delivery. Women in addition receive vouchers which cover antenatal care visits, delivery, and postnatal care visits, plus a small premium to compensate facilities for the administrative burden of adopting the system and recording utilization. One group of women received a voucher fully covering all services, and another group of women received a voucher covering free care antenatal and postnatal services, but required a 100 KSh (about $1.20 at the time) copayment for facility delivery, which represented about 10 percent of the median reported price for a normal delivery paid by the control group.
Mali Cash for Nutritional Awareness Low 3 of 59 districts
Yes No World Food Programme, UNICEF
No Yes No No household poverty targeting. Conditions on maternal and child health service use. Cash transfers paid during
antenatal care visits, delivery, vaccination and growth monitoring visits until age two with full compliance leading to payout of $US75.
Mexico Progresa/Oportunidades Upper-middle
Initially only poor rural areas, later extended to urban areas with 5 million households by 2005
Yes Yes World Bank
No Yes No Conditions of use of antenatal and postnatal care as well as growth monitoring visits, among other health services and school attendance. Only indirect incentivization of maternal tetanus vaccination through antenatal care attendance condition. Typically, households receive the equivalent of $32.5 to $41.3 per month, constituting 19-24% of mean household consumption.
Nicaragua Red de Protección Social Low Pilot with 35,000 households, later scaled to all rural areas
Yes No Inter-American Development Bank, Central American Bank for Economic Integration
No Yes No Regional poverty targeting. Conditions on growth monitoring and vaccination visits and school attendance. Health component amounts to US$224 per household per year.
Nigeria Maternal Cash Transfer Experiment Lower-middle
180 primary health facility areas covering about 1.2 million people
Yes No Unknown
No Yes No Regional poverty targeting. Cash payments of 5,000 Naira (approximately US$14), conditional on the use of antenatal care (3+ visits), delivery, and postnatal care by eligible pregnant women in the household.
Peru Juntos Lower-middle
Gradual scale-up to national level scheme, 1011/~1,800 districts by 2012
Yes Few Inter-American Development Bank
No Yes No Regional and household poverty targeting. Conditions on maternal and child health service use, namely antenatal and postnatal care as well as growth monitoring visits, and school attendance. Only indirect incentivization of maternal tetanus vaccination through antenatal care attendance condition. Monthly transfer is ~US$35 per household per month.
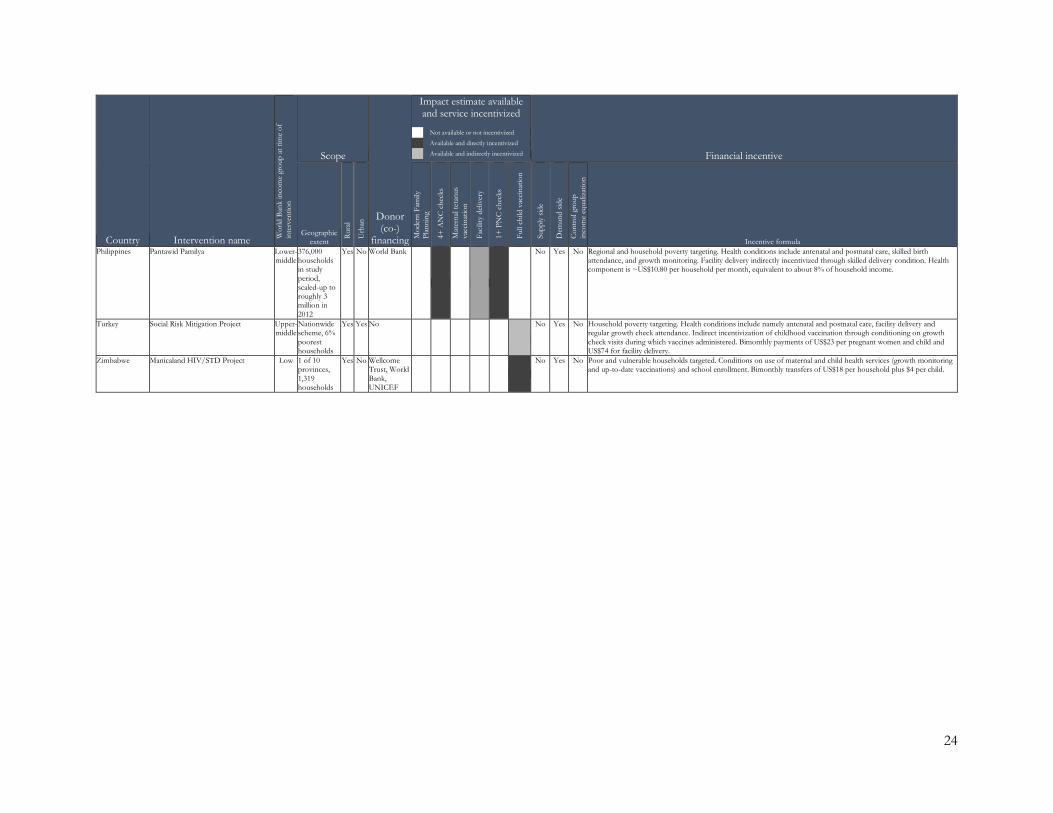
24
Country Intervention name Wor
ld B
ank
inco
me
grou
p at
tim
e of
in
terv
entio
n
Scope
Donor (co-)
financing
Impact estimate available and service incentivized
Not available or not incentivized
Available and directly incentivized
Available and indirectly incentivized Financial incentive
Geographic extent
Rura
l
Urb
an
Mod
ern
Fam
ily
Plan
ning
4+ A
NC
che
cks
Mat
erna
l tet
anus
va
ccin
atio
n
Faci
lity
deliv
ery
1+ P
NC
che
cks
Full
child
vac
cina
tion
Supp
ly si
de
Dem
and
side
Con
trol
gro
up
inco
me
equa
lizat
ion
Incentive formula Philippines Pantawid Pamilya Lower-
middle 376,000 households in study period, scaled-up to roughly 3 million in 2012
Yes No World Bank
No Yes No Regional and household poverty targeting. Health conditions include antenatal and postnatal care, skilled birth attendance, and growth monitoring. Facility delivery indirectly incentivized through skilled delivery condition. Health component is ~US$10.80 per household per month, equivalent to about 8% of household income.
Turkey Social Risk Mitigation Project Upper-middle
Nationwide scheme, 6% poorest households
Yes Yes No
No Yes No Household poverty targeting. Health conditions include namely antenatal and postnatal care, facility delivery and regular growth check attendance. Indirect incentivization of childhood vaccination through conditioning on growth check visits during which vaccines administered. Bimonthly payments of US$23 per pregnant women and child and US$74 for facility delivery.
Zimbabwe Manicaland HIV/STD Project Low 1 of 10 provinces, 1,319 households
Yes No Wellcome Trust, World Bank, UNICEF
No Yes No Poor and vulnerable households targeted. Conditions on use of maternal and child health services (growth monitoring and up-to-date vaccinations) and school enrollment. Bimonthly transfers of US$18 per household plus $4 per child.

25
Table 3: Health Service Coverage Indicators
Indicator Main definition Divergences from main definition
# of original impact
estimates
# of program-specific
effect sizes
Modern family planning
Women of fertile age currently using modern contraceptives
Studies often do not list the contraceptives included in their definition of modern contraceptives. Where specified, they typically include condoms, diaphragms, foams and jellies, intrauterine devices, injectables, implants, and female and male sterilization. In five cases, the specified lists exclude condoms, and male and female sterilization. In one case, instead of currently, the recall period for the indicator is ever, and in one case it is the last twelve months.
21 16
4+ antenatal care checks
Woman received at least four antenatal care checks during her last pregnancy
None 31 22
Maternal tetanus vaccination
Woman received at least one tetanus vaccination during her last pregnancy
In most cases, the requirement is that the woman received one tetanus vaccination during pregnancy. In six cases, it the indicator requires two tetanus vaccinations and in another three cases, it requires that the woman received all appropriate tetanus vaccinations.
21 14
Facility delivery Women giving birth at formal health facility
In six cases, only public facilities are included and in another five cases, the indicator is explicitly limited to deliveries in health facilities where a skilled provider was present.
63 35
1+ postnatal care checks
Mother received at least one postnatal care check
The timing of the postnatal care checks is typically unspecified, as is the type of healthcare workers carrying out the check and whether or not the check takes place in a facility or the mother’s home. The timing is specified in 16 cases – in eight of them it is 14 days or less, and in eight it is 42 days or more. In six cases, the indicator is explicitly limited to postnatal care provided by skilled health workers, and in ten cases it is explicitly limited to postnatal care provided in health facilities.
35 21
Full childhood vaccination
Children received BCG, Polio3, DTP3/ Pentavalent3, and measles vaccinations
In three cases fewer vaccinations that in the main definition are included and in 16 cases the indicator includes additional country-specific vaccinations like yellow-fever or HBV. Sampled children are typically age 12-23 months of age, but in 13 cases, children older than one are included. In six cases, the indicator is based on information from vaccination cards only.
41 22

26
Table 4: Comparison of mean effect sizes between performance-based financing, voucher and conditional cash transfer programs
(1) (2) (3) PBF vs vouchers PBF vs CCT Vouchers vs CCT
Modern family planning -5.41 (0.022) - - N 16
4+ antenatal care checks -2.84 (0.162) -4.61 (0.000) -1.76 (0.443) N 18 18 8
Maternal tetanus vaccination - 0.73 (0.797) - N 14
Facility delivery -2.40 (0.258) -2.67 (0.199) -0.05 (0.983) N 25 28 17
1+ postnatal care checks -0.97 (0.657) -0.61 (0.779) 0.23 (0.907) N 14 15 13
Full child vaccination - -1.42 (0.478) - N 22
Notes: Table shows results from bivariate random effects meta-regressions. Coefficients are the percentage point differences in mean effect sizes between the first and second-mentioned group in the column title. p-values of the differences shown in parentheses.
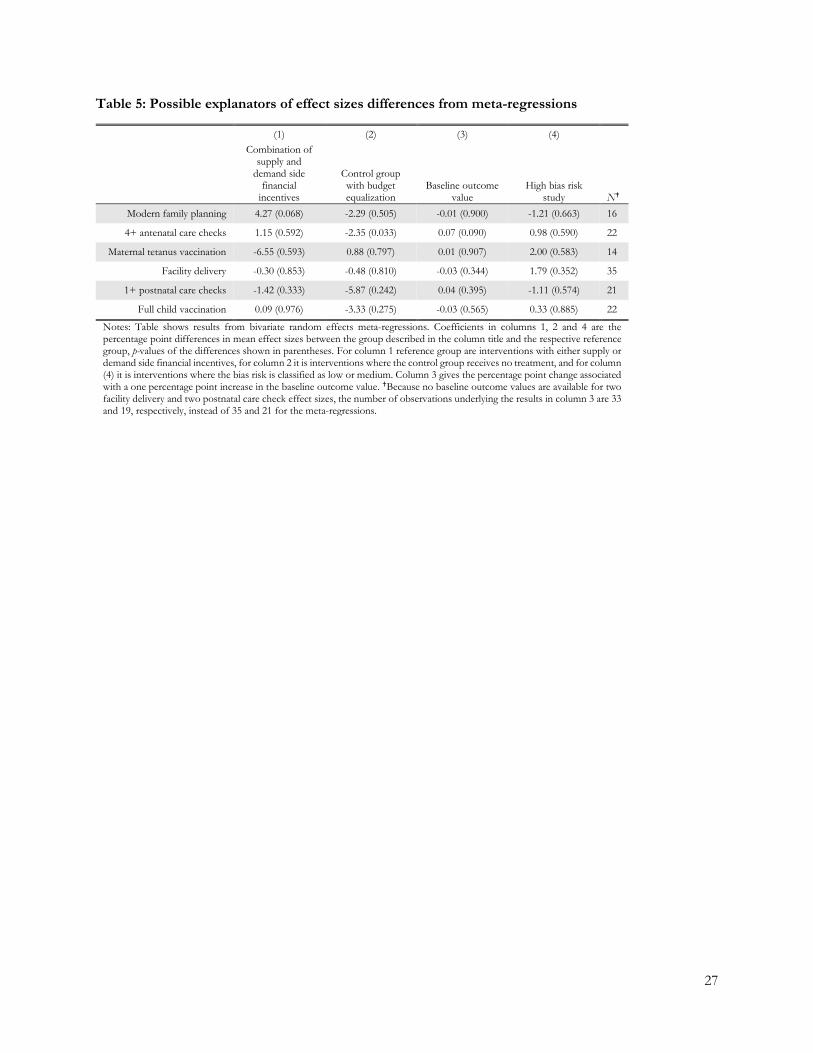
27
Table 5: Possible explanators of effect sizes differences from meta-regressions
(1) (2) (3) (4)
Combination of supply and
demand side financial
incentives
Control group with budget equalization
Baseline outcome value
High bias risk
study N Modern family planning 4.27 (0.068) -2.29 (0.505) -0.01 (0.900) -1.21 (0.663) 16
4+ antenatal care checks 1.15 (0.592) -2.35 (0.033) 0.07 (0.090) 0.98 (0.590) 22
Maternal tetanus vaccination -6.55 (0.593) 0.88 (0.797) 0.01 (0.907) 2.00 (0.583) 14
Facility delivery -0.30 (0.853) -0.48 (0.810) -0.03 (0.344) 1.79 (0.352) 35
1+ postnatal care checks -1.42 (0.333) -5.87 (0.242) 0.04 (0.395) -1.11 (0.574) 21
Full child vaccination 0.09 (0.976) -3.33 (0.275) -0.03 (0.565) 0.33 (0.885) 22
Notes: Table shows results from bivariate random effects meta-regressions. Coefficients in columns 1, 2 and 4 are the percentage point differences in mean effect sizes between the group described in the column title and the respective reference group, p-values of the differences shown in parentheses. For column 1 reference group are interventions with either supply or demand side financial incentives, for column 2 it is interventions where the control group receives no treatment, and for column (4) it is interventions where the bias risk is classified as low or medium. Column 3 gives the percentage point change associated with a one percentage point increase in the baseline outcome value. Because no baseline outcome values are available for two facility delivery and two postnatal care check effect sizes, the number of observations underlying the results in column 3 are 33 and 19, respectively, instead of 35 and 21 for the meta-regressions.
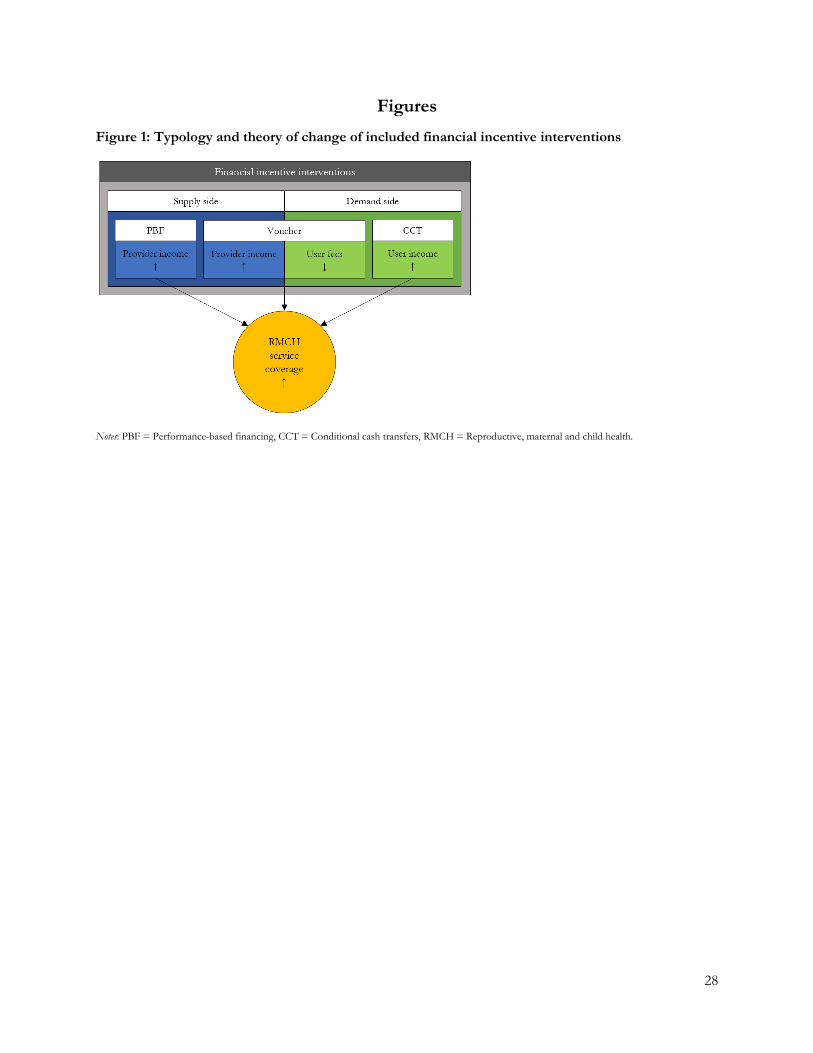
28
Figures Figure 1: Typology and theory of change of included financial incentive interventions
Notes: PBF = Performance-based financing, CCT = Conditional cash transfers, RMCH = Reproductive, maternal and child health.

29
Figure 2: PRISMA chart
PBF Vouchers CCT TOTAL
2016
References identified 2,267 1,583 2,439 6,289 Academic databases 825 334 964 2,123 Google Scholar 944 898 800 2,642 Literature reviews 484 345 649 1,478 Other intervention searches 9 4 13 26 Think tank & donor websites 1 1 6 8 Happenstance discovery 1 0 4 5 Social media calls 2 1 1 4 Search for latest official version 1 0 2 3
Duplicates removed 624 474 967 2,065 Title-abstract screened 1,643 1,109 1,472 4,224
Non-compliers 1,505 1,038 1,211 3,754
Full-text screened 138 71 261 470 Excluded 128 66 246 440
Missing full text 8 5 4 17 Duplicates 6 3 22 31 Publication format 13 7 34 54 No impact evaluation 30 10 23 63 Not low- or middle-income country 3 0 0 3 Intervention 18 13 45 76 Outcome 7 1 56 61 Method 34 20 37 91
Identification 20 13 24 57 Standard errors 6 5 0 11 Population level estimates 8 2 3 13 Dummy treatment variable 0 0 6 6 Intention-to-treat 0 0 4 4
No official version available 6 1 10 17 Later official versions available 3 4 15 22 Duplicates across interventions 0 2 0 2
Compliers 10 5 15 30 2017-2021 Search update compliers 14 4 11 28
2016
-202
1
Total included references 24 9 26 58 Impact estimates 129 23 60 212 Program-specific effect sizes 75 21 34 130
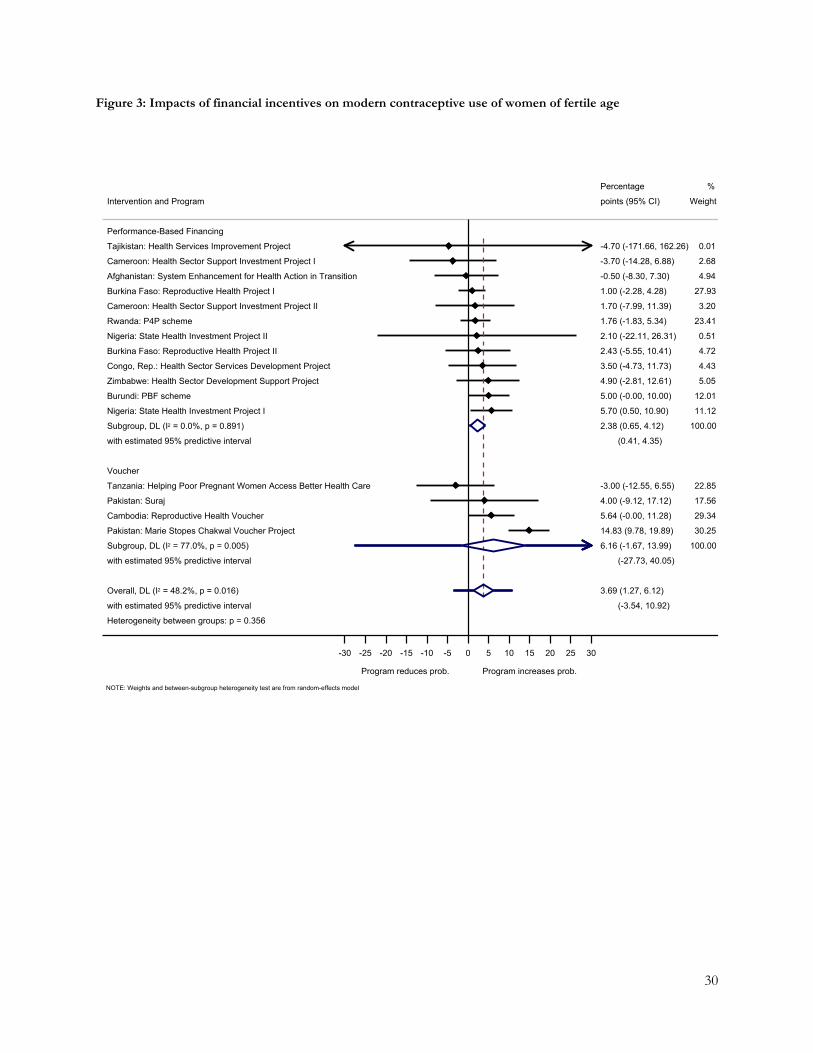
30
Figure 3: Impacts of financial incentives on modern contraceptive use of women of fertile age
Heterogeneity between groups: p = 0.356
with estimated 95% predictive interval
Overall, DL (I2 = 48.2%, p = 0.016)
with estimated 95% predictive interval
Subgroup, DL (I2 = 77.0%, p = 0.005)
Pakistan: Marie Stopes Chakwal Voucher Project
Cambodia: Reproductive Health Voucher
Pakistan: Suraj
Tanzania: Helping Poor Pregnant Women Access Better Health Care
Voucher
with estimated 95% predictive interval
Subgroup, DL (I2 = 0.0%, p = 0.891)
Nigeria: State Health Investment Project I
Burundi: PBF scheme
Zimbabwe: Health Sector Development Support Project
Congo, Rep.: Health Sector Services Development Project
Burkina Faso: Reproductive Health Project II
Nigeria: State Health Investment Project II
Rwanda: P4P scheme
Cameroon: Health Sector Support Investment Project II
Burkina Faso: Reproductive Health Project I
Afghanistan: System Enhancement for Health Action in Transition
Cameroon: Health Sector Support Investment Project I
Tajikistan: Health Services Improvement Project
Performance-Based Financing
Intervention and Program
(-3.54, 10.92)
3.69 (1.27, 6.12)
(-27.73, 40.05)
6.16 (-1.67, 13.99)
14.83 (9.78, 19.89)
5.64 (-0.00, 11.28)
4.00 (-9.12, 17.12)
-3.00 (-12.55, 6.55)
(0.41, 4.35)
2.38 (0.65, 4.12)
5.70 (0.50, 10.90)
5.00 (-0.00, 10.00)
4.90 (-2.81, 12.61)
3.50 (-4.73, 11.73)
2.43 (-5.55, 10.41)
2.10 (-22.11, 26.31)
1.76 (-1.83, 5.34)
1.70 (-7.99, 11.39)
1.00 (-2.28, 4.28)
-0.50 (-8.30, 7.30)
-3.70 (-14.28, 6.88)
-4.70 (-171.66, 162.26)
points (95% CI)
Percentage
100.00
30.25
29.34
17.56
22.85
100.00
11.12
12.01
5.05
4.43
4.72
0.51
23.41
3.20
27.93
4.94
2.68
0.01
Weight
%
Program reduces prob. Program increases prob.
-30 -25 -20 -15 -10 -5 0 5 10 15 20 25 30
NOTE: Weights and between-subgroup heterogeneity test are from random-effects model
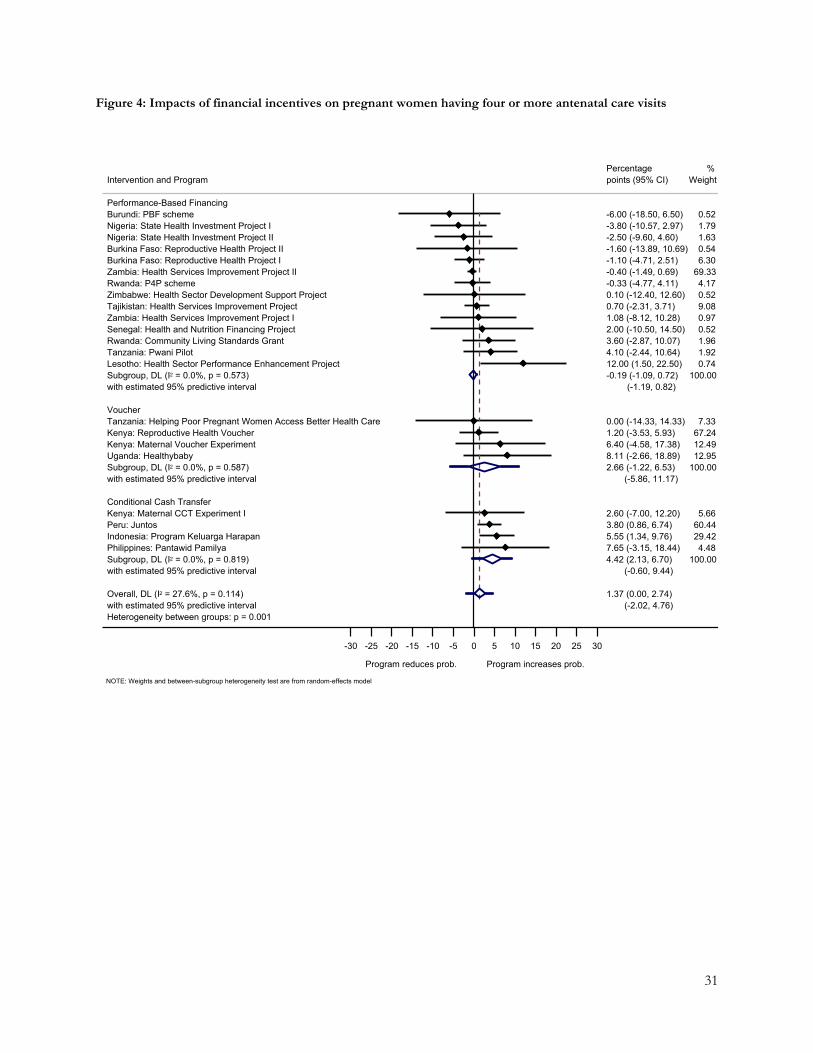
31
Figure 4: Impacts of financial incentives on pregnant women having four or more antenatal care visits
Heterogeneity between groups: p = 0.001with estimated 95% predictive intervalOverall, DL (I2 = 27.6%, p = 0.114)
with estimated 95% predictive intervalSubgroup, DL (I2 = 0.0%, p = 0.819)Philippines: Pantawid PamilyaIndonesia: Program Keluarga HarapanPeru: JuntosKenya: Maternal CCT Experiment IConditional Cash Transfer
with estimated 95% predictive intervalSubgroup, DL (I2 = 0.0%, p = 0.587)Uganda: HealthybabyKenya: Maternal Voucher ExperimentKenya: Reproductive Health VoucherTanzania: Helping Poor Pregnant Women Access Better Health CareVoucher
with estimated 95% predictive intervalSubgroup, DL (I2 = 0.0%, p = 0.573)Lesotho: Health Sector Performance Enhancement ProjectTanzania: Pwani PilotRwanda: Community Living Standards GrantSenegal: Health and Nutrition Financing Project Zambia: Health Services Improvement Project ITajikistan: Health Services Improvement ProjectZimbabwe: Health Sector Development Support ProjectRwanda: P4P schemeZambia: Health Services Improvement Project IIBurkina Faso: Reproductive Health Project IBurkina Faso: Reproductive Health Project IINigeria: State Health Investment Project IINigeria: State Health Investment Project IBurundi: PBF schemePerformance-Based Financing
Intervention and Program
(-2.02, 4.76)1.37 (0.00, 2.74)
(-0.60, 9.44)4.42 (2.13, 6.70)7.65 (-3.15, 18.44)5.55 (1.34, 9.76)3.80 (0.86, 6.74)2.60 (-7.00, 12.20)
(-5.86, 11.17)2.66 (-1.22, 6.53)8.11 (-2.66, 18.89)6.40 (-4.58, 17.38)1.20 (-3.53, 5.93)0.00 (-14.33, 14.33)
(-1.19, 0.82)-0.19 (-1.09, 0.72)12.00 (1.50, 22.50)4.10 (-2.44, 10.64)3.60 (-2.87, 10.07)2.00 (-10.50, 14.50)1.08 (-8.12, 10.28)0.70 (-2.31, 3.71)0.10 (-12.40, 12.60)-0.33 (-4.77, 4.11)-0.40 (-1.49, 0.69)-1.10 (-4.71, 2.51)-1.60 (-13.89, 10.69)-2.50 (-9.60, 4.60)-3.80 (-10.57, 2.97)-6.00 (-18.50, 6.50)
points (95% CI)Percentage
100.004.48
29.4260.445.66
100.0012.9512.4967.247.33
100.000.741.921.960.520.979.080.524.17
69.336.300.541.631.790.52
Weight%
Program reduces prob. Program increases prob.
-30 -25 -20 -15 -10 -5 0 5 10 15 20 25 30
NOTE: Weights and between-subgroup heterogeneity test are from random-effects model

32
Figure 5: Impacts of financial incentives on pregnant women being vaccinated against tetanus
Heterogeneity between groups: p = 0.826
with estimated 95% predictive interval
Overall, DL (I2 = 62.7%, p = 0.001)
with estimated 95% predictive interval
Subgroup, DL (I2 = 75.4%, p = 0.003)
Honduras: Programa de Asignacion Familiar (PRAF II)
Honduras: Bono 10,000
Peru: Juntos
Mexico: Progresa
Indonesia: Program Keluarga Harapan
Conditional Cash Transfer
with estimated 95% predictive interval
Subgroup, DL (I2 = 50.5%, p = 0.040)
Burundi: PBF scheme
Zimbabwe: Health Sector Development Support Project
Zambia: Health Services Improvement Project II
Rwanda: P4P scheme
Cameroon: Health Sector Support Investment Project I
Cameroon: Health Sector Support Investment Project II
Burkina Faso: Reproductive Health Project I
Burkina Faso: Reproductive Health Project II
Zambia: Health Services Improvement Project I
Performance-Based Financing
Intervention and Program
(-6.12, 11.51)
2.69 (0.03, 5.36)
(-14.49, 19.25)
2.38 (-2.55, 7.31)
6.15 (-7.90, 20.20)
5.20 (-0.88, 11.28)
5.00 (0.10, 9.90)
3.70 (-0.84, 8.24)
-4.70 (-8.23, -1.17)
(-5.57, 11.65)
3.04 (-0.09, 6.17)
9.80 (4.95, 14.65)
7.50 (-0.19, 15.19)
6.00 (-1.62, 13.62)
2.67 (-4.55, 9.89)
2.30 (-2.21, 6.81)
2.10 (-2.48, 6.68)
-2.50 (-10.70, 5.70)
-3.77 (-26.39, 18.86)
-3.90 (-10.31, 2.51)
points (95% CI)
Percentage
100.00
8.65
20.16
22.58
23.32
25.29
100.00
15.20
9.79
9.89
10.53
15.99
15.81
9.07
1.78
11.95
Weight
%
Program reduces prob. Program increases prob.
-30 -25 -20 -15 -10 -5 0 5 10 15 20 25 30
NOTE: Weights and between-subgroup heterogeneity test are from random-effects model
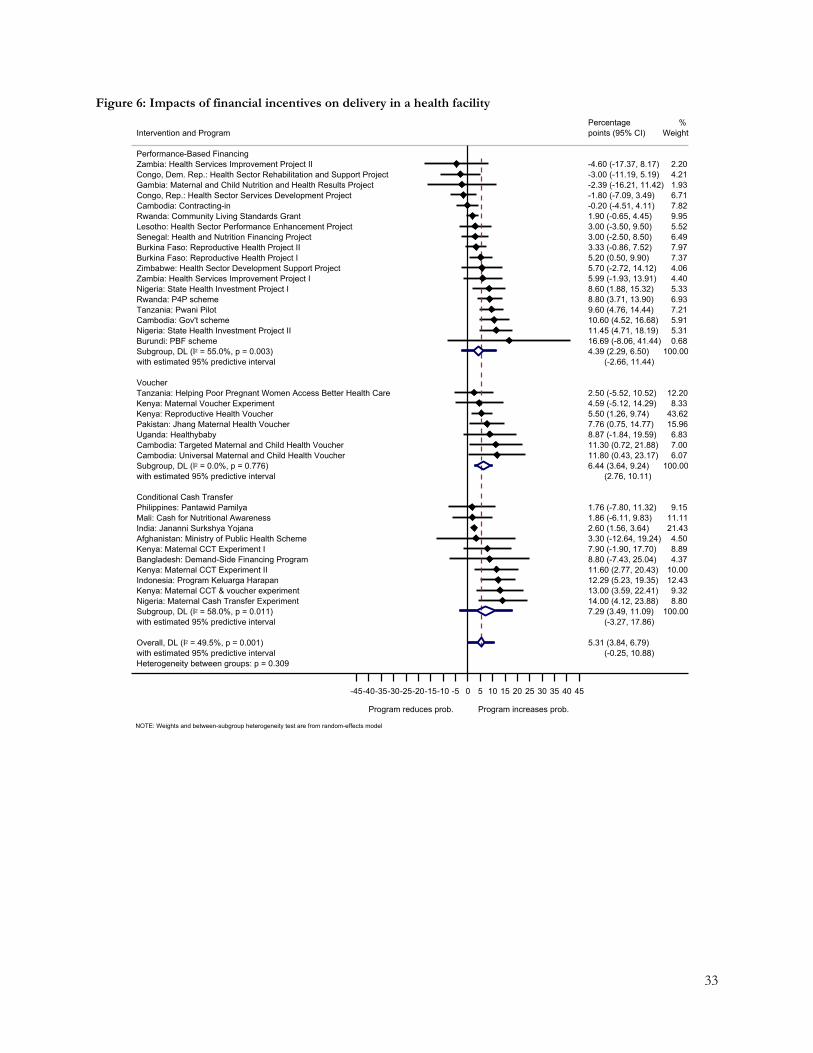
33
Figure 6: Impacts of financial incentives on delivery in a health facility
Heterogeneity between groups: p = 0.309with estimated 95% predictive intervalOverall, DL (I2 = 49.5%, p = 0.001)
with estimated 95% predictive intervalSubgroup, DL (I2 = 58.0%, p = 0.011)Nigeria: Maternal Cash Transfer ExperimentKenya: Maternal CCT & voucher experimentIndonesia: Program Keluarga HarapanKenya: Maternal CCT Experiment IIBangladesh: Demand-Side Financing ProgramKenya: Maternal CCT Experiment IAfghanistan: Ministry of Public Health SchemeIndia: Jananni Surkshya YojanaMali: Cash for Nutritional AwarenessPhilippines: Pantawid PamilyaConditional Cash Transfer
with estimated 95% predictive intervalSubgroup, DL (I2 = 0.0%, p = 0.776)Cambodia: Universal Maternal and Child Health VoucherCambodia: Targeted Maternal and Child Health VoucherUganda: HealthybabyPakistan: Jhang Maternal Health VoucherKenya: Reproductive Health VoucherKenya: Maternal Voucher ExperimentTanzania: Helping Poor Pregnant Women Access Better Health CareVoucher
with estimated 95% predictive intervalSubgroup, DL (I2 = 55.0%, p = 0.003)Burundi: PBF schemeNigeria: State Health Investment Project IICambodia: Gov't schemeTanzania: Pwani PilotRwanda: P4P schemeNigeria: State Health Investment Project IZambia: Health Services Improvement Project IZimbabwe: Health Sector Development Support ProjectBurkina Faso: Reproductive Health Project IBurkina Faso: Reproductive Health Project IISenegal: Health and Nutrition Financing Project Lesotho: Health Sector Performance Enhancement ProjectRwanda: Community Living Standards GrantCambodia: Contracting-inCongo, Rep.: Health Sector Services Development ProjectGambia: Maternal and Child Nutrition and Health Results ProjectCongo, Dem. Rep.: Health Sector Rehabilitation and Support ProjectZambia: Health Services Improvement Project IIPerformance-Based Financing
Intervention and Program
(-0.25, 10.88)5.31 (3.84, 6.79)
(-3.27, 17.86)7.29 (3.49, 11.09)14.00 (4.12, 23.88)13.00 (3.59, 22.41)12.29 (5.23, 19.35)11.60 (2.77, 20.43)8.80 (-7.43, 25.04)7.90 (-1.90, 17.70)3.30 (-12.64, 19.24)2.60 (1.56, 3.64)1.86 (-6.11, 9.83)1.76 (-7.80, 11.32)
(2.76, 10.11)6.44 (3.64, 9.24)11.80 (0.43, 23.17)11.30 (0.72, 21.88)8.87 (-1.84, 19.59)7.76 (0.75, 14.77)5.50 (1.26, 9.74)4.59 (-5.12, 14.29)2.50 (-5.52, 10.52)
(-2.66, 11.44)4.39 (2.29, 6.50)16.69 (-8.06, 41.44)11.45 (4.71, 18.19)10.60 (4.52, 16.68)9.60 (4.76, 14.44)8.80 (3.71, 13.90)8.60 (1.88, 15.32)5.99 (-1.93, 13.91)5.70 (-2.72, 14.12)5.20 (0.50, 9.90)3.33 (-0.86, 7.52)3.00 (-2.50, 8.50)3.00 (-3.50, 9.50)1.90 (-0.65, 4.45)-0.20 (-4.51, 4.11)-1.80 (-7.09, 3.49)-2.39 (-16.21, 11.42)-3.00 (-11.19, 5.19)-4.60 (-17.37, 8.17)
points (95% CI)Percentage
100.008.809.32
12.4310.004.378.894.50
21.4311.119.15
100.006.077.006.83
15.9643.628.33
12.20
100.000.685.315.917.216.935.334.404.067.377.976.495.529.957.826.711.934.212.20
Weight%
Program reduces prob. Program increases prob.
-45-40-35-30-25-20-15-10 -5 0 5 10 15 20 25 30 35 40 45
NOTE: Weights and between-subgroup heterogeneity test are from random-effects model

34
Figure 7: Impacts of financial incentives on receiving postnatal care
Heterogeneity between groups: p = 0.897with estimated 95% predictive intervalOverall, DL (I2 = 0.0%, p = 0.670)
with estimated 95% predictive intervalSubgroup, DL (I2 = 44.2%, p = 0.096)Philippines: Pantawid PamilyaHonduras: Bono 10,000Peru: JuntosMali: Cash for Nutritional AwarenessIndia: Indira Gandhi Motherhood Support SchemeChina: CHIMACAHonduras: Programa de Asignacion Familiar (PRAF II)Conditional Cash Transfer
with estimated 95% predictive intervalSubgroup, DL (I2 = 0.0%, p = 0.824)Cambodia: Targeted Maternal and Child Health VoucherCambodia: Universal Maternal and Child Health VoucherKenya: Reproductive Health VoucherUganda: HealthybabyPakistan: Jhang Maternal Health VoucherTanzania: Helping Poor Pregnant Women Access Better Health CareVoucher
with estimated 95% predictive intervalSubgroup, DL (I2 = 0.0%, p = 0.826)Zambia: Health Services Improvement Project IZimbabwe: Health Sector Development Support ProjectCongo, Rep.: Health Sector Services Development ProjectBurkina Faso: Reproductive Health Project IIBurkina Faso: Reproductive Health Project IAfghanistan: System Enhancement for Health Action in TransitionTanzania: Pwani PilotZambia: Health Services Improvement Project IIPerformance-Based Financing
Intervention and Program
(1.19, 4.20)2.70 (1.28, 4.11)
(-5.04, 11.21)3.09 (-0.17, 6.34)10.22 (3.35, 17.08)6.10 (-3.50, 15.70)4.78 (0.90, 8.65)1.73 (-9.75, 13.21)0.97 (-1.68, 3.62)-0.48 (-11.48, 10.53)-5.65 (-15.82, 4.52)
(-0.54, 6.88)3.17 (0.55, 5.79)7.40 (-4.75, 19.55)4.70 (-0.98, 10.38)3.80 (-0.50, 8.10)2.26 (-8.95, 13.48)1.54 (-3.50, 6.57)-3.00 (-15.61, 9.61)
(-2.00, 6.40)2.20 (-1.16, 5.57)9.25 (-3.01, 21.51)8.12 (-8.69, 24.93)4.20 (-3.84, 12.24)3.43 (-7.82, 14.69)2.40 (-5.47, 10.27)0.90 (-69.46, 71.26)0.20 (-5.79, 6.19)-3.05 (-12.78, 6.68)
points (95% CI)Percentage
100.0014.148.83
24.776.64
30.457.118.07
100.004.65
21.2737.235.46
27.074.32
100.007.534.00
17.528.93
18.270.23
31.5711.96
Weight%
Program reduces prob. Program increases prob.
-30 -25 -20 -15 -10 -5 0 5 10 15 20 25 30
NOTE: Weights and between-subgroup heterogeneity test are from random-effects model
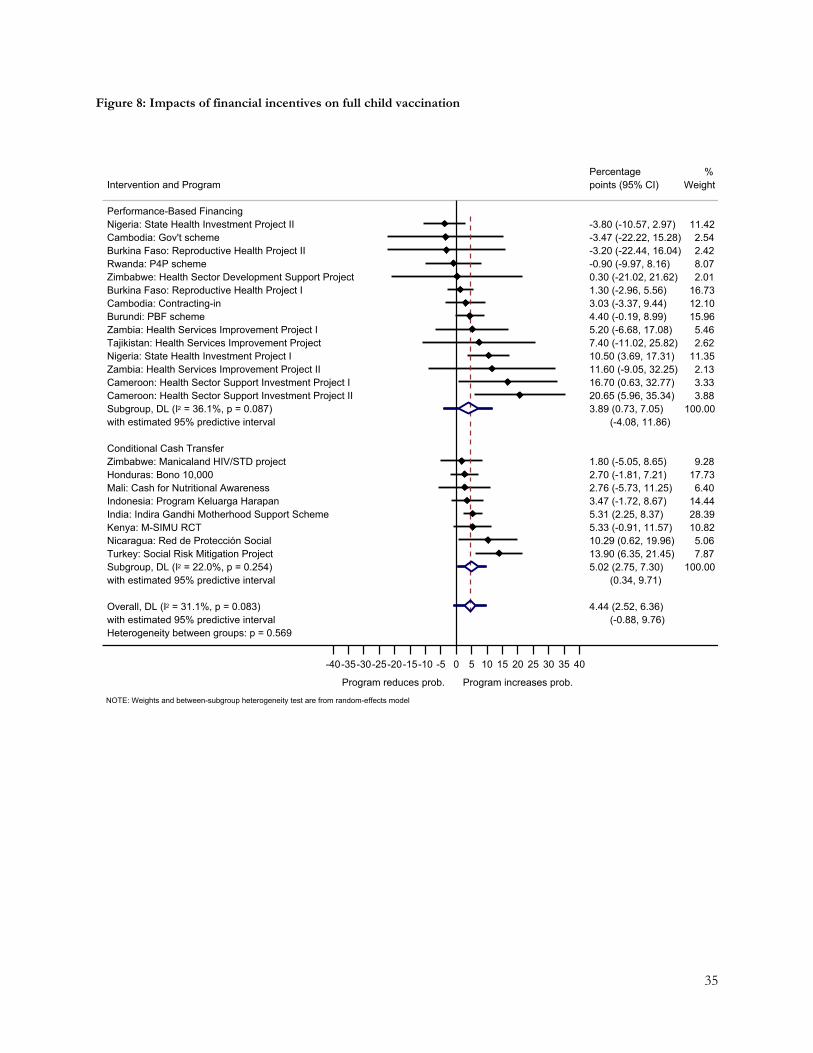
35
Figure 8: Impacts of financial incentives on full child vaccination
Heterogeneity between groups: p = 0.569with estimated 95% predictive intervalOverall, DL (I2 = 31.1%, p = 0.083)
with estimated 95% predictive intervalSubgroup, DL (I2 = 22.0%, p = 0.254)Turkey: Social Risk Mitigation ProjectNicaragua: Red de Proteccion SocialKenya: M-SIMU RCTIndia: Indira Gandhi Motherhood Support SchemeIndonesia: Program Keluarga HarapanMali: Cash for Nutritional AwarenessHonduras: Bono 10,000Zimbabwe: Manicaland HIV/STD projectConditional Cash Transfer
with estimated 95% predictive intervalSubgroup, DL (I2 = 36.1%, p = 0.087)Cameroon: Health Sector Support Investment Project IICameroon: Health Sector Support Investment Project IZambia: Health Services Improvement Project IINigeria: State Health Investment Project ITajikistan: Health Services Improvement ProjectZambia: Health Services Improvement Project IBurundi: PBF schemeCambodia: Contracting-inBurkina Faso: Reproductive Health Project IZimbabwe: Health Sector Development Support ProjectRwanda: P4P schemeBurkina Faso: Reproductive Health Project IICambodia: Gov't schemeNigeria: State Health Investment Project IIPerformance-Based Financing
Intervention and Program
(-0.88, 9.76)4.44 (2.52, 6.36)
(0.34, 9.71)5.02 (2.75, 7.30)13.90 (6.35, 21.45)10.29 (0.62, 19.96)5.33 (-0.91, 11.57)5.31 (2.25, 8.37)3.47 (-1.72, 8.67)2.76 (-5.73, 11.25)2.70 (-1.81, 7.21)1.80 (-5.05, 8.65)
(-4.08, 11.86)3.89 (0.73, 7.05)20.65 (5.96, 35.34)16.70 (0.63, 32.77)11.60 (-9.05, 32.25)10.50 (3.69, 17.31)7.40 (-11.02, 25.82)5.20 (-6.68, 17.08)4.40 (-0.19, 8.99)3.03 (-3.37, 9.44)1.30 (-2.96, 5.56)0.30 (-21.02, 21.62)-0.90 (-9.97, 8.16)-3.20 (-22.44, 16.04)-3.47 (-22.22, 15.28)-3.80 (-10.57, 2.97)
points (95% CI)Percentage
100.007.875.06
10.8228.3914.446.40
17.739.28
100.003.883.332.13
11.352.625.46
15.9612.1016.732.018.072.422.54
11.42
Weight%
Program reduces prob. Program increases prob.
-40-35-30-25-20-15-10 -5 0 5 10 15 20 25 30 35 40
NOTE: Weights and between-subgroup heterogeneity test are from random-effects model
36
References
1. Diaconu K, Falconer J, Verbel A, Fretheim A, Witter S. Paying for performance to improve the delivery of health interventions in low‐ and middle‐income countries. Cochrane Database Syst Rev 2021; (5). 2. Bellows B, Bulaya C, Inambwae S, Lissner CL, Ali M, Bajracharya A. Family Planning Vouchers in Low and Middle Income Countries: A Systematic Review. Studies in Family Planning 2016; 47(4): 357-70. 3. Cruz RCDS, Moura LBAD, Soares Neto JJ. Conditional cash transfers and the creation of equal opportunities of health for children in low and middle-income countries: A literature review. Int J Equity Health 2017; 16(1). 4. Hunter B, Harrison S, Portela A, Bick D. The effects of cash transfers and vouchers on the use and quality of maternity care services: A systematic review: journals.plos.org; 2017. 5. Taaffe J, Longosz A, Wilson D. The impact of cash transfers on livelihoods, education, health and HIV–what's the evidence? Dev Policy Rev 2017. 6. Gaarder MM, Glassman A, Todd JE. Conditional cash transfers and health: unpacking the causal chain. J Dev Effect 2010; 2(1): 6-50. 7. Bassani DG, Arora P, Wazny K, Gaffey MF, Lenters L, Bhutta ZA. Financial incentives and coverage of child health interventions: a systematic review and meta-analysis. BMC Public Health 2013; 13(3): 1-13. 8. Glassman A, Duran D, Fleisher L, et al. Impact of conditional cash transfers on maternal and newborn health. J Health Popul Nutr 2013; 31(4 Suppl 2): 48-66. 9. Oyo-Ita A, Wiysonge CS, Oringanje C, Nwachukwu CE, Oduwole O, Meremikwu MM. Interventions for improving coverage of childhood immunisation in low- and middle-income countries. Cochrane Database Syst Rev 2016; 2016(7). 10. Belaid L, Dumont A, Chaillet N, Zertal A, De Brouwere V. Effectiveness of demand generation interventions on use of modern contraceptives in low-and middle-income countries. Trop Med Int Health 2016; 21(10): 1240-54. 11. Wagstaff A, Claeson M. Rising to the challenges: the millennium development goals for health. Washington, DC: World Bank; 2004. 12. Chiba Y, Oguttu MA, Nakayama T. Quantitative and qualitative verification of data quality in the childbirth registers of two rural district hospitals in Western Kenya. Midwifery 2012; 28(3): 329-39. 13. Hahn D, Wanjala P, Marx M. Where is information quality lost at clinical level? A mixed-method study on information systems and data quality in three urban Kenyan ANC clinics. Glob Health Action 2013; 6(1): 21424. 14. Sharma A, Rana SK, Prinja S, Kumar R. Quality of Health Management Information System for Maternal & Child Health Care in Haryana State, India. PLoS One 2016; 11(2): e0148449-e. 15. O'Hagan R, Marx MA, Finnegan KE, et al. National assessment of data quality and associated systems-level factors in Malawi. Glob Hea Sci Pra 2017; 5(3): 367-81. 16. Higgins J, Green S, editors. Cochrane handbook for systematic reviews of interventions version 5.1.0 [updated March 2011]: The Cochrane Collaboration; 2011. 17. Borenstein M, Hedges L, Higgins J. Introduction to meta-analysis. Chichester, UK: John Wiley & Sons, Ltd.; 2009. 18. Valentine JC, Pigott TD, Rothstein HR. How Many Studies Do You Need?: A Primer on Statistical Power for Meta-Analysis. Journal of Educational and Behavioral Statistics 2010; 35(2): 215-47. 19. Ryan R. Cochrane Consumers and Communication Review Group.‘Cochrane Consumers and Communication Group: meta-analysis ‘. 2016. 20. IntHout J, Ioannidis JPA, Rovers MM, Goeman JJ. Plea for routinely presenting prediction intervals in meta-analysis. BMJ Open 2016; 6(7): e010247. 21. Fu R, Gartlehner G, Grant M, et al. Conducting quantitative synthesis when comparing medical interventions: AHRQ and the Effective Health Care Program. J Clin Epidemiol 2011; 64(11): 1187-97. 22. Vaessen J, Rivas A, Duvendack M, et al. The effects of microcredit on women's control over household spending in developing countries: A systematic review and meta‐analysis. Campbell Sys Rev 2014; 10(1): 1-205. 23. Cochrane Effective Practice Organisation of Care. Suggested risk of bias criteria for EPOC reviews. 2017. https://epoc.cochrane.org/resources/epoc-resources-review-authors (accessed 10/30 2020). 24. Coalition for Evidence-Based Policy. Checklist For Reviewing a Randomized Controlled Trial of a Social Program or Project, To Assess Whether It Produced Valid Evidence, 2010. 25. Friedman J, Scheffler R. Pay for performance in health systems: theory, evidence and case studies. World Scientific Handbook of Global Health Economics and Public Policy: Volume 3: Health System Characteristics and Performance 2016: 295-332. 26. Ma-Nitu SM, Tembey L, Bigirimana E, et al. Towards constructive rethinking of PBF: perspectives of implementers in sub-Saharan Africa. BMJ Glob Health 2018; 3(5): e001036.

37
27. Engineer CY, Dale E, Agarwal A, et al. Effectiveness of a pay-for-performance intervention to improve maternal and child health services in Afghanistan: a cluster-randomized trial. Int J Epidemiol 2016; 45(2): 451-9. 28. De Allegri M, Lohmann J, Hillebrecht M. Results-based financing for health impact evaluation in Burkina Faso: Results report. Institute of Public Health, Heidelberg University; 2018. 29. Bonfrer I, Soeters R, Van de Poel E, et al. Introduction Of Performance-Based Financing In Burundi Was Associated With Improvements In Care And Quality. Health Aff (Millwood) 2014; 33(12): 2179-87. 30. Bonfrer I, Van de Poel E, Van Doorslaer E. The effects of performance incentives on the utilization and quality of maternal and child care in Burundi. Soc Sci Med 2014; 123: 96-104. 31. Gage A, Bauhoff S. The effects of performance-based financing on neonatal health outcomes in Burundi, Lesotho, Senegal, Zambia and Zimbabwe. Health Policy Plan 2021. 32. Rudasingwa M, Soeters R, Basenya O. The effect of performance-based financing on maternal healthcare use in Burundi: a two-wave pooled cross-sectional analysis. Glob Health Action 2017; 10(1): 1327241. 33. Van de Poel E, Flores G, Ir P, O'Donnell O. Impact of Performance-Based Financing in a Low-Resource Setting: A Decade of Experience in Cambodia. Health Econ 2016; 25(6): 688-705. 34. de Walque D, Robyn PJ, Saidou H, Sorgho G, Steenland M. Looking into the Performance-Based Financing Black Box: Evidence from an Impact Evaluation in the Health Sector in Cameroon. Policy Research Working Paper No 8162. Washington, DC: The World Bank; 2017. 35. Huillery E, Seban J. Money for Nothing? The Effect of Financial Incentives on Motivation and Performances in the Health Sector. 2017. 36. Zeng W, Shepard DS, Rusatira JdD, Blaakman AP, Nsitou BM. Evaluation of Results-Based Financing in the Republic of the Congo: A Comparison Group Pre-post Study. Health Policy Plan 2018; 33(3): 392-400. 37. Ferguson L, Hasan R, Boudreaux C, Thomas H, Jallow M, Fink G. Results-based financing to increase uptake of skilled delivery services in The Gambia: using the 'three delays' model to interpret midline evaluation findings. BMC Pregnancy Childbirth 2020; 20(1): 712. 38. Kandpal E, Loevinsohn BP, Vermeersch CM, et al. Impact evaluation of Nigeria State Health Investment Project. Washington, DC: The World Bank; 2018. 39. Basinga P, Gertler PJ, Binagwaho A, Soucat AL, Sturdy J, Vermeersch CM. Effect on maternal and child health services in Rwanda of payment to primary health-care providers for performance: An impact evaluation. Lancet 2011; 377(9775): 1421-8. 40. Gertler P, Vermeersch C. Using Performance Incentives to Improve Medical Care Productivity and Health Outcomes. National Bureau of Economic Research, Inc, NBER Working Papers: 19046; 2013. 41. Lannes L, Meessen B, Soucat A, Basinga P. Can performance-based financing help reaching the poor with maternal and child health services? The experience of rural Rwanda. International Journal of Health Planning and Management 2016; 31(3): 309-48. 42. Okeke EN, Chari AV. Can institutional deliveries reduce newborn mortality? Evidence from Rwanda. Santa Monica, CA: RAND Corporation; 2015. 43. Priedeman Skiles M, Curtis SL, Basinga P, Angeles G. An equity analysis of performance-based financing in Rwanda: Are services reaching the poorest women? Health Policy Plan 2013; 28(8): 825-37. 44. Sherry TB, Bauhoff S, Mohanan M. Multitasking and Heterogeneous Treatment Effects in Pay-for-Performance in Health Care: Evidence from Rwanda. Am J Health Econ 2017. 45. Shapira G, Kalisa I, Condo J, et al. Going beyond incentivizing formal health providers: Evidence from the Rwanda Community Performance-Based Financing program. Health Econ 2018; 27(12): 2087-106. 46. Ahmed T, Arur A, de Walque D, Shapira G. Incentivizing Quantity and Quality of Care: Evidence from an Impact Evaluation of Performance-Based Financing in the Health Sector in Tajikistan. Policy Research Working Paper No 8951. Washington, DC: The World Bank; 2019. 47. Binyaruka P, Patouillard E, Powell-Jackson T, Greco G, Maestad O, Borghi J. Effect of paying for performance on utilisation, quality, and user costs of health services in Tanzania: A controlled before and after study. PLoS One 2015; 10(8). 48. World Bank. Impact Evaluation of Zambia’s Health Results Based Financing Pilot Project. Washington, DC: The World Bank, 2016. 49. Zeng W, Shepard DS, Nguyen H, et al. Cost-effectiveness of results-based financing, Zambia: a cluster randomized trial. Bull World Health Organ 2018; 96(11): 760‐71. 50. World Bank. Rewarding Provider Performance to Improve Quality and Coverage of Maternal and Child Health Outcomes. Washington, DC: The World Bank, 2016. 51. Bajracharya A, Veasnakiry L, Rathavy T, Bellows B. Increasing Uptake of Long-Acting Reversible Contraceptives in Cambodia Through a Voucher Program: Evidence From a Difference-in-Differences Analysis. Glob Hea Sci Pra 2016; 4 Suppl 2: S109-21.

38
52. Van de Poel E, Flores G, Ir P, O'Donnell O, Van Doorslaer E. Can vouchers deliver? An evaluation of subsidies for maternal health care in Cambodia. Bull World Health Organ 2014; 92(5): 331-9. 53. Dennis ML, Abuya T, Campbell OMR, et al. Evaluating the impact of a maternal health voucher programme on service use before and after the introduction of free maternity services in Kenya: A quasi-experimental study. BMJ Glob Health 2018; 3(2). 54. Grépin KA, Habyarimana J, Jack W. Cash on delivery: Results of a randomized experiment to promote maternal health care in Kenya. J Health Econ 2019; 65: 15-30. 55. Agha S. Changes in the proportion of facility-based deliveries and related maternal health services among the poor in rural Jhang, Pakistan: Results from a demand-side financing intervention. Int J Equity Health 2011; 10. 56. Ali M, Azmat SK, Hamza HB, Rahman MM, Hameed W. Are family planning vouchers effective in increasing use, improving equity and reaching the underserved? An evaluation of a voucher program in Pakistan. BMC Health Serv Res 2019; 19(1): N.PAG-N.PAG. 57. Azmat SK, Hameed W, Hamza HB, et al. Engaging with community-based public and private mid-level providers for promoting the use of modern contraceptive methods in rural Pakistan: results from two innovative birth spacing interventions. Reprod Health 2016; 13: 25. 58. Kuwawenaruwa A, Ramsey K, Binyaruka P, Baraka J, Manzi F, Borghi J. Implementation and effectiveness of free health insurance for the poor pregnant women in Tanzania: A mixed methods evaluation. Soc Sci Med 2019; 225: 17-25. 59. Obare F, Okwero P, Villegas L, Mills S, Bellows B. Increased coverage of maternal health services among the poor in western Uganda in an output-based aid voucher scheme. Policy Research Working Paper 7709. Washington, DC: The World Bank; 2016. 60. Edmond KM, Foshanji AI, Naziri M, et al. Conditional cash transfers to improve use of health facilities by mothers and newborns in conflict affected countries, a prospective population based intervention study from Afghanistan. BMC Pregnancy Childbirth 2019; 19(1). 61. Keya KT, Bellows B, Rob U, Warren C. Improving Access to Delivery Care and Reducing the Equity Gap Through Voucher Program in Bangladesh: Evidence From Difference-in-Differences Analysis. Int Q Community Health Educ 2018; 38(2): 137-45. 62. Nguyen HTH, Hatt L, Islam M, et al. Encouraging maternal health service utilization: An evaluation of the Bangladesh voucher program. Soc Sci Med 2012; 74(7): 989-96. 63. Hemminki E, Long Q, Zhang W-H, et al. Impact of financial and educational interventions on maternity care: results of cluster randomized trials in rural China, CHIMACA. Matern Child Health J 2013; 17(2): 208-21. 64. Benedetti F, Ibarrarán P, McEwan PJ. Do education and health conditions matter in a large cash transfer? Evidence from a honduran experiment. Econ Devel Cult Change 2016; 64(4): 759-93. 65. Morris SS, Flores R, Olinto P, Medina JM. Monetary incentives in primary health care and effects on use and coverage of preventive health care interventions in rural Honduras: cluster randomised trial. Lancet 2004; 364(9450): 2030-7. 66. von Haaren P, Klonner S. Maternal cash for better child health? The impacts of India’s IGMSY/PMMVY maternity benefit scheme. 2020. 67. Debnath S. Improving Maternal Health with Incentives to Mothers vs. Health Workers: Evidence from India: University of Virigina; 2013. 68. Powell-Jackson T, Mazumdar S, Mills A. Financial Incentives in Health: New Evidence from India's Janani Suraksha Yojana. J Health Econ 2015; 43: 154-69. 69. Alatas V. Program Keluarga Harapan: Impact Evaluation of Indonesia’s Pilot Household Conditional Cash Transfer Program. Washington, DC: The World Bank; 2011. 70. Cahyadi N, Hanna R, Olken BA, Prima RA, Satriawan E, Syamsulhakim E. Cumulative Impacts of Conditional Cash Transfer Programs: Experimental Evidence from Indonesia. National Bureau of Economic Research, Inc, NBER Working Papers: 24670; 2018. 71. Kusuma D, Cohen J, McConnell M, Berman P. Can cash transfers improve determinants of maternal mortality? Evidence from the household and community programs in Indonesia. Soc Sci Med 2016; 163: 10-20. 72. Kusuma D, Thabrany H, Hidayat B, McConnell M, Berman P, Cohen J. New Evidence on the Impact of Large-Scale Conditional Cash Transfers on Child Vaccination Rates: The Case of a Clustered-Randomized Trial in Indonesia. World Devel 2017; 98: 497-505. 73. Triyana M. The effects of household and community-based interventions: Evidence from Indonesia. Chicago, IL: The University of Chicago; 2013. 74. Gibson DG, Ochieng B, Kagucia EW, et al. Mobile phone-delivered reminders and incentives to improve childhood immunisation coverage and timeliness in Kenya (M-SIMU): a cluster randomised controlled trial. Lancet Glob Health 2017; 5(4): e428-e38.

39
75. Adubra L, Le Port A, Kameli Y, et al. Conditional cash transfer and/or lipid-based nutrient supplement targeting the first 1000 d of life increased attendance at preventive care services but did not improve linear growth in young children in rural Mali: results of a cluster-randomized controlled trial. Am J Clin Nutr 2019; 110(6): 1476-90. 76. Barber SL, Gertler PJ. Empowering women: how Mexico's conditional cash transfer programme raised prenatal care quality and birth weight. J Dev Effect 2010; 2(1): 51-73. 77. Barham T, Maluccio JA. Eradicating Diseases: The Effect of Conditional Cash Transfers on Vaccination Coverage in Rural Nicaragua. J Health Econ 2009; 28(3): 611-21. 78. Handa S, Maluccio JA. Matching the Gold Standard: Comparing Experimental and Nonexperimental Evaluation Techniques for a Geographically Targeted Program. Econ Devel Cult Change 2010; 58(3): 415-47. 79. Okeke EN, Wagner Z, Abubakar IS. Maternal Cash Transfers Led To Increases In Facility Deliveries And Improved Quality Of Delivery Care In Nigeria. Health Aff (Millwood) 2020; 39(6): 1051-9. 80. Díaz J, Saldarriaga V. Promoting prenatal health care in poor rural areas through conditional cash transfers: evidence from JUNTOS in Peru. Avances de Investigación 25. Lima, Peru: GRADE; 2017. 81. Díaz JJ, Saldarriaga V, Díaz J-J. Encouraging use of prenatal care through conditional cash transfers: Evidence from JUNTOS in Peru. Health Econ 2019; 28(9): 1099-113. 82. Kandpal E, Alderman H, Friedman J, Filmer D, Onishi J, Avalos J. A Conditional Cash Transfer Program in the Philippines Reduces Severe Stunting. The Journal of nutrition 2016; 149(9): 1793-800. 83. Ahmed A, Gilligan D, Kudat A, Colasan R, Tatlidil H, Ozbilgin B. Interim impact evaluation of the conditional cash transfer program in Turkey: A quantitative assessment. Washington, DC: International Food Policy Research Institute; 2006. 84. Robertson L, Mushati P, Eaton JW, et al. Effects of unconditional and conditional cash transfers on child health and development in Zimbabwe: a cluster-randomised trial. Lancet 2013; 381(9874): 1283-92.

40
Appendix 1 – Previous systematic reviews Table A1.1: Previous systematic reviews of financial incentives and family planning
Reference Search year Intervention Meta-analysis PBF Vouchers CCT Meyer et al (2011)1 2010 +
Bellows et al (2011)2 2010 + Witter and Somanathan (2012)3 2010 + –
Bellows et al (2013)4 2012 + Brody et al (2013)5 2010 +
Eva et al (2015)6 2013 + Belaid et al (2016)7 2015 +
Bellows et al (2016)8 2016 + Blacklock et al (2016)9 2016 –
Khan et al (2016)10 2016 – Diaconu et al (2021)11 2018 –
Notes: (+) indicates improvement and (–) no improvement or inconclusive evidence.
Table A1.2: Previous systematic reviews of financial incentives and maternal care
Reference Search year Intervention Meta-analysis PBF Vouchers CCT Gaarder et al (2010)12 N/A +
Meyer et al (2011)1 2010 + Morgan et al (2011)13 N/A + + +
Ranganathan and Lagarde (2012)14 N/A + Witter et al (2012)15 2009 +
Witter and Somanathan (2012)3 2010 + + Bellows et al (2013)4 2012 +
Brody et al (2013)5 2010 + Eichler et al (2013)16 2012 +
Glassman et al (2013)17 N/A + Gopalan et al (2014)18 2012 +
Murray et al (2014)19 2012 + + Owusu-Addo and Cross (2014)20 2013 +
Eva et al (2015)6 2013 + Bastagli et al (2016)21 2015 +
Das et al (2016)22 2014 – Tanner et al (2016)23 2013 + Taaffe et al (2017)24 N/A +
Hunter et al (2017)25 2015 + + Garcia-Prado (2019)26 N/A + +
James et al (2020)27 2019 – Diaconu et al (2021)11 2018 +
Notes: (+) indicates improvement and (–) no improvement or inconclusive evidence.
Table A1.3: Previous systematic reviews of financial incentives and childhood vaccination
Reference Search year Intervention Meta-analysis PBF Vouchers CCT Gaarder et al (2010)12 N/A –
Ranganathan and Lagarde (2012)14 N/A – Bassani et al (2013)28 2012 – –
Owusu-Addo and Cross (2014)20 2013 + Oyo-Ita et al (2016)29 2016 –
Taaffe et al (2017)24 N/A – Cruz et al (2017)30 2016 +
James et al (2020)27 2019 – Diaconu et al (2021)11 2018 –
Notes: (+) indicates improvement and (–) no improvement or inconclusive evidence.
References
41
1. Meyer C, Bellows N, Campbell M, Potts M. The Impact of Vouchers on the Use and Quality of Health Goods and Services in Developing Countries. A Systematic Review 2011. 2. Bellows NM, Bellows BW, Warren C. Systematic Review: The Use of Vouchers for Reproductive Health Services in Developing Countries: Systematic Review. Trop Med Int Health 2011; 16(1): 84-96. 3. Witter S, Somanathan A. Demand-Side Financing for Sexual and Reproductive Health Services in Low and Middle-Income Countries: A Review of the Evidence: The World Bank; 2012. 4. Bellows BW, Conlon CM, Higgs ES, et al. A Taxonomy and Results from a Comprehensive Review of 28 Maternal Health Voucher Programmes. J Health Popul Nutr 2013; 31(4 Suppl 2): S106-S28. 5. Brody CM, Bellows N, Campbell M, Potts M. The Impact of Vouchers on the Use and Quality of Health Care in Developing Countries: A Systematic Review. Global public health 2013; 8(4): 363-88. 6. Eva G, Quinn A, Ngo TD. Vouchers for Family Planning and Sexual and Reproductive Health Services: A Review of Voucher Programs Involving Marie Stopes International among 11 Asian and African Countries. International Journal of Gynecology and Obstetrics 2015; 130: E15-E20. 7. Belaid L, Dumont A, Chaillet N, Zertal A, De Brouwere V. Effectiveness of Demand Generation Interventions on Use of Modern Contraceptives in Low-and Middle-Income Countries. Trop Med Int Health 2016; 21(10): 1240-54. 8. Bellows B, Bulaya C, Inambwae S, Lissner CL, Ali M, Bajracharya A. Family Planning Vouchers in Low and Middle Income Countries: A Systematic Review. Studies in Family Planning 2016; 47(4): 357-70. 9. Blacklock C, MacPepple E, Kunutsor S, Witter S. Paying for Performance to Improve the Delivery and Uptake of Family Planning in Low and Middle Income Countries: A Systematic Review. Studies in Family Planning 2016; 47(4): 309-24. 10. Khan ME, Hazra A, Kant A, Ali M. Conditional and Unconditional Cash Transfers to Improve Use of Contraception in Low and Middle Income Countries: A Systematic Review. Studies in Family Planning 2016; 47(4): 371-83. 11. Diaconu K, Falconer J, Verbel A, Fretheim A, Witter S. Paying for Performance to Improve the Delivery of Health Interventions in Low‐ and Middle‐Income Countries. Cochrane Database Syst Rev 2021; (5). 12. Gaarder MM, Glassman A, Todd JE. Conditional Cash Transfers and Health: Unpacking the Causal Chain. J Dev Effect 2010; 2(1): 6-50. 13. Morgan L, Beith A, Eichler R. Performance-Based Incentives for Maternal Health: Taking Stock of Current Programs and Future Potentials. Health Systems 20/20 project. Bethesda, MD: Abt Associates; 2011. 14. Ranganathan M, Lagarde M. Promoting Healthy Behaviours and Improving Health Outcomes in Low and Middle Income Countries: A Review of the Impact of Conditional Cash Transfer Programmes. Prev Med 2012; 55 Suppl: S95-S105. 15. Witter S, Fretheim A, Kessy FL, Lindahl AK. Paying for Performance to Improve the Delivery of Health Interventions in Low- and Middle-Income Countries. Cochrane Database Syst Rev 2012; 2: CD007899. 16. Eichler R, Agarwal K, Askew I, Iriarte E, Morgan L, Watson J. Performance-Based Incentives to Improve Health Status of Mothers and Newborns: What Does the Evidence Show? J Health Popul Nutr 2013; 31(4 Suppl 2): S36-S47. 17. Glassman A, Duran D, Fleisher L, et al. Impact of Conditional Cash Transfers on Maternal and Newborn Health. J Health Popul Nutr 2013; 31(4 Suppl 2): 48-66. 18. Gopalan SS, Mutasa R, Friedman J, Das A. Health Sector Demand-Side Financial Incentives in Low- and Middle-Income Countries: A Systematic Review on Demand- and Supply-Side Effects. Soc Sci Med 2014; 100: 72-83. 19. Murray SF, Hunter BM, Bisht R, Ensor T, Bick D. Effects of Demand-Side Financing on Utilisation, Experiences and Outcomes of Maternity Care in Low-and Middle-Income Countries: A Systematic Review. BMC Pregnancy Childbirth 2014; 14(1): 30. 20. Owusu-Addo E, Cross R. The Impact of Conditional Cash Transfers on Child Health in Low-and Middle-Income Countries: A Systematic Review. Int J Public Health 2014; 59(4): 609-18. 21. Bastagli F, Hagen-Zanker J, Harman L, et al. Cash Transfers: What Does the Evidence Say. A rigorous review of programme impact and the role of design and implementation features London, UK: Overseas Development Institute; 2016. 22. Das A, Gopalan SS, Chandramohan D. Effect of Pay for Performance to Improve Quality of Maternal and Child Care in Low- and Middle-Income Countries: A Systematic Review. BMC Public Health 2016; 16: 321. 23. Tanner J, Aguilar Rivera AM, Candland TL, et al. Delivering the Millennium Development Goals to Reduce Maternal and Child Mortality: A Systematic Review of Impact Evaluation Evidence: The World Bank, 2016. 24. Taaffe J, Longosz A, Wilson D. The Impact of Cash Transfers on Livelihoods, Education, Health and Hiv–What's the Evidence? Dev Policy Rev 2017. 25. Hunter B, Harrison S, Portela A, Bick D. The Effects of Cash Transfers and Vouchers on the Use and Quality of Maternity Care Services: A Systematic Review: journals.plos.org; 2017.

42
26. Garcia-Prado A. Changing Behavioral Patterns Related to Maternity and Childbirth in Rural and Poor Populations: A Critical Review. World Bank Res Observer 2019; 34(1): 95-118. 27. James N, Lawson K, Acharya Y. Evidence on Result-Based Financing in Maternal and Child Health in Low- and Middle-Income Countries: A Systematic Review. Global Health Research and Policy 2020; 5(1): 31. 28. Bassani DG, Arora P, Wazny K, Gaffey MF, Lenters L, Bhutta ZA. Financial Incentives and Coverage of Child Health Interventions: A Systematic Review and Meta-Analysis. BMC Public Health 2013; 13(3): 1-13. 29. Oyo-Ita A, Wiysonge CS, Oringanje C, Nwachukwu CE, Oduwole O, Meremikwu MM. Interventions for Improving Coverage of Childhood Immunisation in Low- and Middle-Income Countries. Cochrane Database Syst Rev 2016; 2016(7). 30. Cruz RCDS, Moura LBAD, Soares Neto JJ. Conditional Cash Transfers and the Creation of Equal Opportunities of Health for Children in Low and Middle-Income Countries: A Literature Review. Int J Equity Health 2017; 16(1).

43
Appendix 2 – Example search strings for Medline search 1. PERFORMANCE-BASED FINANCING
(((supply OR provider* OR clinic* OR center* OR centre* OR facility OR facilities OR hospital* OR post OR posts OR worker* OR personnel OR staff OR doctor* OR physician* OR nurse* OR midwi*) ADJ5 incentiv*) OR ((perform* OR quality) ADJ5 (purchas* OR reimburs* OR pay OR paying OR payment* OR financing OR incentiv* OR bonus* OR reward* OR contracts OR contract OR contracting OR budget*)) OR ("value based" ADJ5 (purchas* OR reimburs* OR pay OR paying OR payment* OR financing OR incentiv* OR bonus* OR reward* OR contracts OR contract OR contracting OR budget*)) OR ("output based" ADJ5 (purchas* OR reimburs* OR pay OR paying OR payment* OR financing OR incentiv* OR bonus* OR reward* OR contracts OR contract OR contracting OR budget*)) OR ("out put based" ADJ5 (purchas* OR reimburs* OR pay OR paying OR payment* OR financing OR incentiv* OR bonus* OR reward* OR contracts OR contract OR contracting OR budget*)) OR ("results based" ADJ5 (purchas* OR reimburs* OR pay OR paying OR payment* OR financing OR incentiv* OR bonus* OR reward* OR contracts OR contract OR contracting OR budget*)) OR ("result based" ADJ5 (purchas* OR reimburs* OR pay OR paying OR payment* OR financing OR incentiv* OR bonus* OR reward* OR contracts OR contract OR contracting OR budget*))).ab,ti.
AND
("controlled trial" OR randomization OR randomisation OR randomized OR randomised OR (random* ADJ4 (treat* OR intervention* OR allocat* OR assign*)) OR "nonrandomised controlled" OR "nonrandomized controlled" OR "rct" OR experiment OR experiments OR experimental OR quasiexperiment* OR (instrument* ADJ4 variable*) OR "stepped wedge" OR "regression discontinuity" OR discontinuous OR discontinuity OR "difference in difference" OR "differences in differences" OR "difference in differences" OR "double difference" OR "double differences" OR "triple difference" OR "triple differences" OR "controlled before after" OR "controlled before and after" OR ((stagger* OR gradual*) ADJ4 (implement* OR roll*)) OR exogen* OR "fixed effect" OR "fixed effects" OR ((longitudinal OR panel) ADJ5 (model* OR technique* OR method* OR estimator* OR approach))).ab,ti.
AND
(("third world" OR "developing world" OR LMIC OR "third world" OR ("less developed" ADJ1 countr*) OR ("least developed" ADJ1 countr*) OR ("low income" ADJ1 countr*) OR ("lower income" ADJ1 countr*) OR ("middle income" ADJ1 countr*) OR ((developing OR underdeveloped OR poor) ADJ1 countr*) OR Afghan* OR Albani* OR Algeri* OR Samoa* OR Angola* OR Antigua OR Barbuda OR Argentin* OR Armeni* OR Arub* OR Azerbai* OR Bahrain* OR Bangladesh* OR Barbad* OR Belarus* OR Beliz* OR Benin* OR Bhutan* OR Bolivia* OR Bosnia* OR Botswan* OR Brazil* OR Bulgaria* OR Burkin* OR Burundi* OR Verdian OR "Cape Verde" OR "Cabo Verde" OR Cambodia* OR Cameroon* OR "Central African Republic" OR Chad* OR Chile* OR Chinese OR China OR Colombia* OR Comoros OR Comoran* OR Comorian* OR Congo* OR "Costa Rica" OR "Costa Rican" OR (Cote ADJ1 Ivoire) OR "Ivory Coast" OR Ivorian OR Croatia* OR Cuba* OR Cypr* OR Czech* OR Djibout* OR Dominica* OR Ecuador* OR Egypt* OR Salvador* OR Eritrea* OR Estonia* OR Ethiopia* OR Fiji* OR Gabon* OR Gambia* OR Georgia* OR Ghan* OR Gibralta* OR Greece OR Greek* OR Grenada* OR Guam OR Guatemal* OR Guinea* OR Guyana* OR Haiti* OR Hondur* OR Hungar* OR India OR Indian OR Indonesia* OR Iran* OR Iraq* OR Jamaica* OR Jordan OR Kazakh* OR Kenya* OR Kiribati* OR Korea* OR Kosovo* OR Kyrgyz* OR Lao* OR Latvia* OR Leban* OR Lesoth* OR Liberia* OR Libya* OR Lithuania* OR Macao* OR Macedonia* OR Madagascar* OR Malawi* OR Malaysia* OR Maldiv* OR Mali OR Malian OR Malta* OR "Marshall Islands" OR "Marshall Islanders" OR Mauritania* OR Mauriti* OR Mexic* OR Micronesia* OR Moldov* OR Mongolia* OR Montenegr* OR Morocc* OR Mozambi* OR Myanmar* OR Burmese OR Burma OR Namibia* OR Nepal* OR Caledonia* OR Nicaragua* OR Niger* OR "Mariana Islands" OR "Mariana Islanders" OR Oman OR Omani OR Pakistan* OR Palau* OR Panam* OR Paraguay* OR Peru* OR Philippin* OR Poland OR Polish OR Portug* OR "Puerto Rico" OR "Puerto Rican" OR Rican* OR Romania* OR Russia* OR Soviet OR USSR OR Rwanda* OR Samoa* OR "Sao Tome" OR "Saudi Arabia" OR "Saudi Arabian" OR Senegal* OR Serb* OR Seychelles OR "Sierra Leone" OR "Sierra Leonean" OR Slovakia* OR Slovenia* OR "Solomon Islands" OR "Solomon Islanders" OR Somalia* OR "South Africa" OR "South African" OR "Sri Lanka" OR Lankan OR Kitts OR Lucia* OR Vincent OR Sudan* OR Suriname* OR Swaziland* OR Syria* OR Tajik* OR Tanzania* OR Thai* OR Timor OR Togo* OR Tonga* OR Trinidad* OR Tunisia* OR Turkey OR Turkish OR Turkmeni* OR Tuval* OR Uganda* OR Ukrain* OR Urugua* OR Uzbek* OR Vanuatu* OR Venezuel* OR Vietnam* OR Palestin* OR Yemen* OR Zambia* OR Zimbabwe* OR Mayott* OR Antilles OR Yugoslavia* OR Gaza OR "West Bank")).ab,ti.
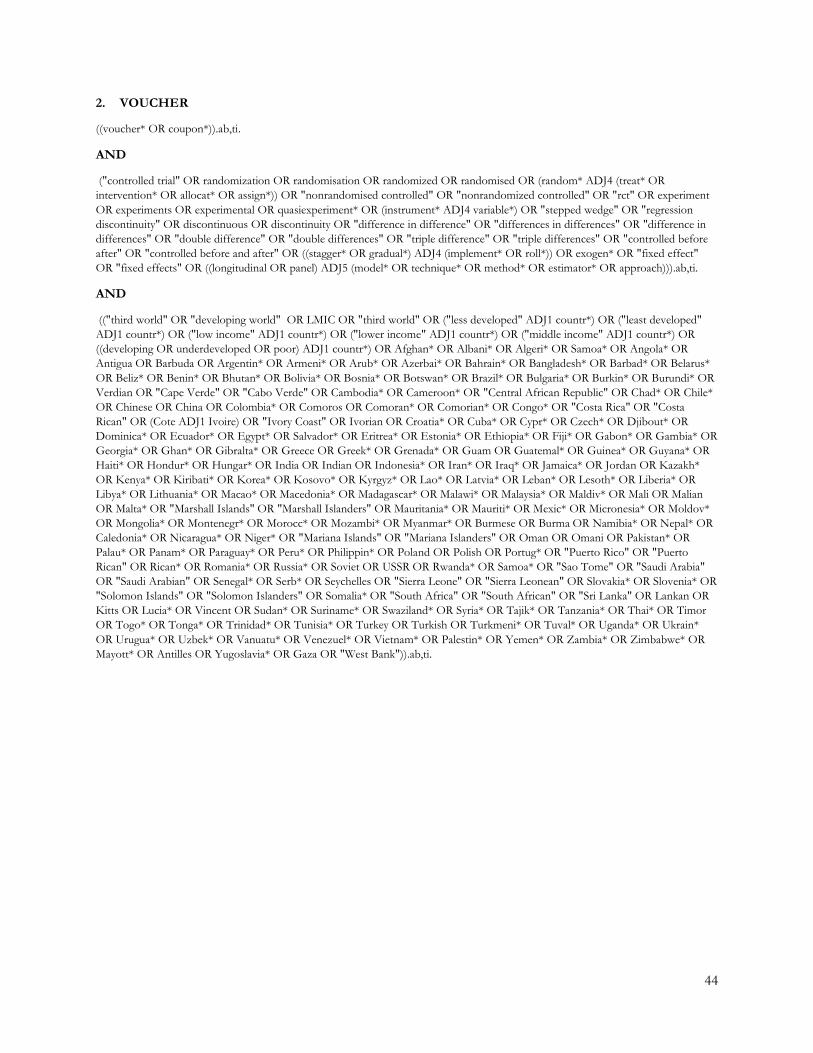
44
2. VOUCHER
((voucher* OR coupon*)).ab,ti.
AND
("controlled trial" OR randomization OR randomisation OR randomized OR randomised OR (random* ADJ4 (treat* OR intervention* OR allocat* OR assign*)) OR "nonrandomised controlled" OR "nonrandomized controlled" OR "rct" OR experiment OR experiments OR experimental OR quasiexperiment* OR (instrument* ADJ4 variable*) OR "stepped wedge" OR "regression discontinuity" OR discontinuous OR discontinuity OR "difference in difference" OR "differences in differences" OR "difference in differences" OR "double difference" OR "double differences" OR "triple difference" OR "triple differences" OR "controlled before after" OR "controlled before and after" OR ((stagger* OR gradual*) ADJ4 (implement* OR roll*)) OR exogen* OR "fixed effect" OR "fixed effects" OR ((longitudinal OR panel) ADJ5 (model* OR technique* OR method* OR estimator* OR approach))).ab,ti.
AND
(("third world" OR "developing world" OR LMIC OR "third world" OR ("less developed" ADJ1 countr*) OR ("least developed" ADJ1 countr*) OR ("low income" ADJ1 countr*) OR ("lower income" ADJ1 countr*) OR ("middle income" ADJ1 countr*) OR ((developing OR underdeveloped OR poor) ADJ1 countr*) OR Afghan* OR Albani* OR Algeri* OR Samoa* OR Angola* OR Antigua OR Barbuda OR Argentin* OR Armeni* OR Arub* OR Azerbai* OR Bahrain* OR Bangladesh* OR Barbad* OR Belarus* OR Beliz* OR Benin* OR Bhutan* OR Bolivia* OR Bosnia* OR Botswan* OR Brazil* OR Bulgaria* OR Burkin* OR Burundi* OR Verdian OR "Cape Verde" OR "Cabo Verde" OR Cambodia* OR Cameroon* OR "Central African Republic" OR Chad* OR Chile* OR Chinese OR China OR Colombia* OR Comoros OR Comoran* OR Comorian* OR Congo* OR "Costa Rica" OR "Costa Rican" OR (Cote ADJ1 Ivoire) OR "Ivory Coast" OR Ivorian OR Croatia* OR Cuba* OR Cypr* OR Czech* OR Djibout* OR Dominica* OR Ecuador* OR Egypt* OR Salvador* OR Eritrea* OR Estonia* OR Ethiopia* OR Fiji* OR Gabon* OR Gambia* OR Georgia* OR Ghan* OR Gibralta* OR Greece OR Greek* OR Grenada* OR Guam OR Guatemal* OR Guinea* OR Guyana* OR Haiti* OR Hondur* OR Hungar* OR India OR Indian OR Indonesia* OR Iran* OR Iraq* OR Jamaica* OR Jordan OR Kazakh* OR Kenya* OR Kiribati* OR Korea* OR Kosovo* OR Kyrgyz* OR Lao* OR Latvia* OR Leban* OR Lesoth* OR Liberia* OR Libya* OR Lithuania* OR Macao* OR Macedonia* OR Madagascar* OR Malawi* OR Malaysia* OR Maldiv* OR Mali OR Malian OR Malta* OR "Marshall Islands" OR "Marshall Islanders" OR Mauritania* OR Mauriti* OR Mexic* OR Micronesia* OR Moldov* OR Mongolia* OR Montenegr* OR Morocc* OR Mozambi* OR Myanmar* OR Burmese OR Burma OR Namibia* OR Nepal* OR Caledonia* OR Nicaragua* OR Niger* OR "Mariana Islands" OR "Mariana Islanders" OR Oman OR Omani OR Pakistan* OR Palau* OR Panam* OR Paraguay* OR Peru* OR Philippin* OR Poland OR Polish OR Portug* OR "Puerto Rico" OR "Puerto Rican" OR Rican* OR Romania* OR Russia* OR Soviet OR USSR OR Rwanda* OR Samoa* OR "Sao Tome" OR "Saudi Arabia" OR "Saudi Arabian" OR Senegal* OR Serb* OR Seychelles OR "Sierra Leone" OR "Sierra Leonean" OR Slovakia* OR Slovenia* OR "Solomon Islands" OR "Solomon Islanders" OR Somalia* OR "South Africa" OR "South African" OR "Sri Lanka" OR Lankan OR Kitts OR Lucia* OR Vincent OR Sudan* OR Suriname* OR Swaziland* OR Syria* OR Tajik* OR Tanzania* OR Thai* OR Timor OR Togo* OR Tonga* OR Trinidad* OR Tunisia* OR Turkey OR Turkish OR Turkmeni* OR Tuval* OR Uganda* OR Ukrain* OR Urugua* OR Uzbek* OR Vanuatu* OR Venezuel* OR Vietnam* OR Palestin* OR Yemen* OR Zambia* OR Zimbabwe* OR Mayott* OR Antilles OR Yugoslavia* OR Gaza OR "West Bank")).ab,ti.
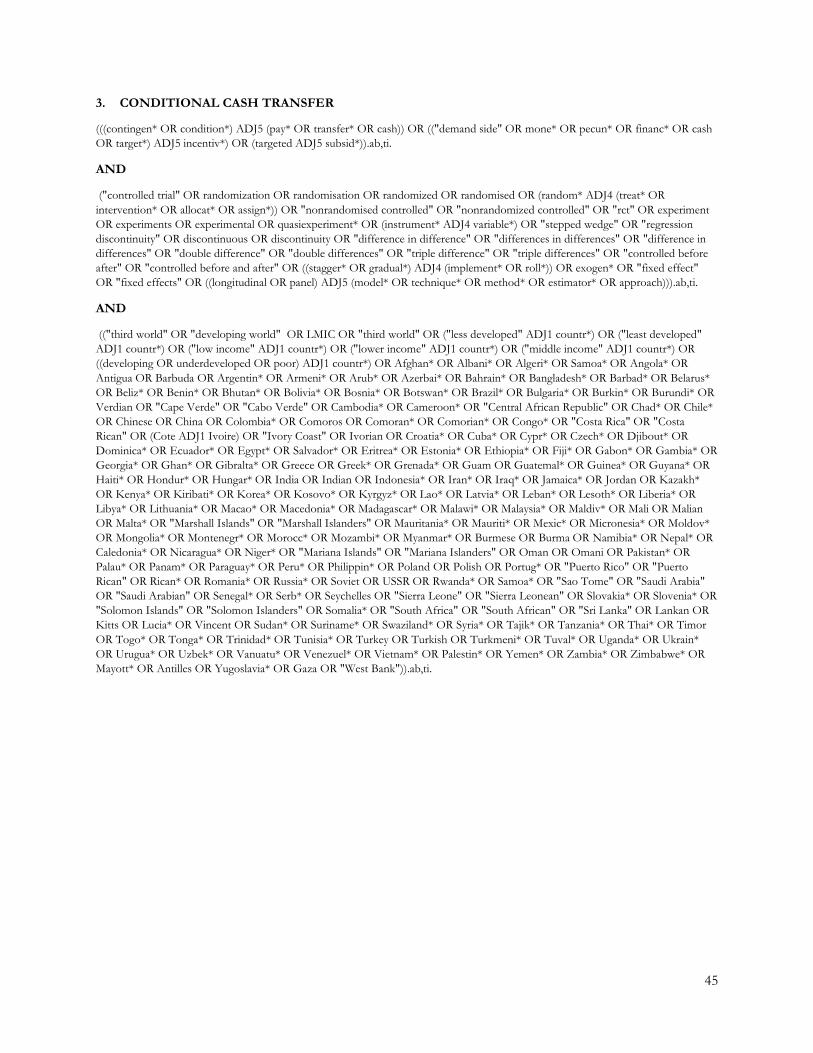
45
3. CONDITIONAL CASH TRANSFER
(((contingen* OR condition*) ADJ5 (pay* OR transfer* OR cash)) OR (("demand side" OR mone* OR pecun* OR financ* OR cash OR target*) ADJ5 incentiv*) OR (targeted ADJ5 subsid*)).ab,ti.
AND
("controlled trial" OR randomization OR randomisation OR randomized OR randomised OR (random* ADJ4 (treat* OR intervention* OR allocat* OR assign*)) OR "nonrandomised controlled" OR "nonrandomized controlled" OR "rct" OR experiment OR experiments OR experimental OR quasiexperiment* OR (instrument* ADJ4 variable*) OR "stepped wedge" OR "regression discontinuity" OR discontinuous OR discontinuity OR "difference in difference" OR "differences in differences" OR "difference in differences" OR "double difference" OR "double differences" OR "triple difference" OR "triple differences" OR "controlled before after" OR "controlled before and after" OR ((stagger* OR gradual*) ADJ4 (implement* OR roll*)) OR exogen* OR "fixed effect" OR "fixed effects" OR ((longitudinal OR panel) ADJ5 (model* OR technique* OR method* OR estimator* OR approach))).ab,ti.
AND
(("third world" OR "developing world" OR LMIC OR "third world" OR ("less developed" ADJ1 countr*) OR ("least developed" ADJ1 countr*) OR ("low income" ADJ1 countr*) OR ("lower income" ADJ1 countr*) OR ("middle income" ADJ1 countr*) OR ((developing OR underdeveloped OR poor) ADJ1 countr*) OR Afghan* OR Albani* OR Algeri* OR Samoa* OR Angola* OR Antigua OR Barbuda OR Argentin* OR Armeni* OR Arub* OR Azerbai* OR Bahrain* OR Bangladesh* OR Barbad* OR Belarus* OR Beliz* OR Benin* OR Bhutan* OR Bolivia* OR Bosnia* OR Botswan* OR Brazil* OR Bulgaria* OR Burkin* OR Burundi* OR Verdian OR "Cape Verde" OR "Cabo Verde" OR Cambodia* OR Cameroon* OR "Central African Republic" OR Chad* OR Chile* OR Chinese OR China OR Colombia* OR Comoros OR Comoran* OR Comorian* OR Congo* OR "Costa Rica" OR "Costa Rican" OR (Cote ADJ1 Ivoire) OR "Ivory Coast" OR Ivorian OR Croatia* OR Cuba* OR Cypr* OR Czech* OR Djibout* OR Dominica* OR Ecuador* OR Egypt* OR Salvador* OR Eritrea* OR Estonia* OR Ethiopia* OR Fiji* OR Gabon* OR Gambia* OR Georgia* OR Ghan* OR Gibralta* OR Greece OR Greek* OR Grenada* OR Guam OR Guatemal* OR Guinea* OR Guyana* OR Haiti* OR Hondur* OR Hungar* OR India OR Indian OR Indonesia* OR Iran* OR Iraq* OR Jamaica* OR Jordan OR Kazakh* OR Kenya* OR Kiribati* OR Korea* OR Kosovo* OR Kyrgyz* OR Lao* OR Latvia* OR Leban* OR Lesoth* OR Liberia* OR Libya* OR Lithuania* OR Macao* OR Macedonia* OR Madagascar* OR Malawi* OR Malaysia* OR Maldiv* OR Mali OR Malian OR Malta* OR "Marshall Islands" OR "Marshall Islanders" OR Mauritania* OR Mauriti* OR Mexic* OR Micronesia* OR Moldov* OR Mongolia* OR Montenegr* OR Morocc* OR Mozambi* OR Myanmar* OR Burmese OR Burma OR Namibia* OR Nepal* OR Caledonia* OR Nicaragua* OR Niger* OR "Mariana Islands" OR "Mariana Islanders" OR Oman OR Omani OR Pakistan* OR Palau* OR Panam* OR Paraguay* OR Peru* OR Philippin* OR Poland OR Polish OR Portug* OR "Puerto Rico" OR "Puerto Rican" OR Rican* OR Romania* OR Russia* OR Soviet OR USSR OR Rwanda* OR Samoa* OR "Sao Tome" OR "Saudi Arabia" OR "Saudi Arabian" OR Senegal* OR Serb* OR Seychelles OR "Sierra Leone" OR "Sierra Leonean" OR Slovakia* OR Slovenia* OR "Solomon Islands" OR "Solomon Islanders" OR Somalia* OR "South Africa" OR "South African" OR "Sri Lanka" OR Lankan OR Kitts OR Lucia* OR Vincent OR Sudan* OR Suriname* OR Swaziland* OR Syria* OR Tajik* OR Tanzania* OR Thai* OR Timor OR Togo* OR Tonga* OR Trinidad* OR Tunisia* OR Turkey OR Turkish OR Turkmeni* OR Tuval* OR Uganda* OR Ukrain* OR Urugua* OR Uzbek* OR Vanuatu* OR Venezuel* OR Vietnam* OR Palestin* OR Yemen* OR Zambia* OR Zimbabwe* OR Mayott* OR Antilles OR Yugoslavia* OR Gaza OR "West Bank")).ab,ti.

46
Appendix 3: Mathematical formulas to convert reported impact estimates into percentage point ES and to convert measures of statistical
uncertainty to t-values To obtain standardized effect sizes and corresponding standard errors for meta-analysis, we take the following steps:
(1) For impact estimates for which no t-values are available, we obtain them from whichever measure of statistical uncertainty is available for using the following set of formulas derived from the Cochrane Handbook for Systematic Reviews of Interventions1, version 5.1.0., chapters 7.7.7.2 and 7.7.7.3:
Reported statistic Formula Standard error (SE) 𝑡𝑡𝑀𝑀𝑀𝑀 =
𝛽𝛽𝑆𝑆𝑆𝑆
For odds ratios and risk ratios, the formula is
𝑡𝑡𝑀𝑀𝑀𝑀 =ln (𝛽𝛽)
ln (𝑆𝑆𝑆𝑆)
If 𝛽𝛽 = 0 we use 𝛽𝛽 = 0.001 instead.
p-value Using that for degrees of freedom > 30, the t-distribution can be approximated by the inverse normal distribution, we obtain values of the two-tailed t distribution using
𝑡𝑡𝑀𝑀𝑀𝑀 = 𝑖𝑖𝑖𝑖𝑖𝑖𝑖𝑖𝑖𝑖𝑖𝑖𝑖𝑖𝑖𝑖𝑖𝑖 �𝑝𝑝𝑖𝑖𝑖𝑖𝑖𝑖𝑣𝑣𝑣𝑣2� .
For p-values reported as 0.000 we assume 𝑝𝑝𝑖𝑖𝑖𝑖𝑖𝑖𝑣𝑣𝑣𝑣 = 0.0001
Confidence Interval (CI)
All reported CIs are at 95% level, hence
𝑡𝑡𝑀𝑀𝑀𝑀 = 𝛽𝛽×3.92
𝐶𝐶𝐶𝐶𝑣𝑣𝑝𝑝𝑝𝑝𝑣𝑣𝑖𝑖−𝐶𝐶𝐶𝐶𝑖𝑖𝑖𝑖𝑙𝑙𝑣𝑣𝑖𝑖 .
For ORs and RRs the corresponding formula is
𝑡𝑡𝑀𝑀𝑀𝑀 = ln (𝛽𝛽)×3.92
ln (𝐶𝐶𝐶𝐶𝑣𝑣𝑝𝑝𝑝𝑝𝑣𝑣𝑖𝑖)−ln (𝐶𝐶𝐶𝐶𝑖𝑖𝑖𝑖𝑙𝑙𝑣𝑣𝑖𝑖).
P-value thresholds We first approximate the p-value by
𝑝𝑝𝑖𝑖𝑖𝑖𝑖𝑖𝑣𝑣𝑣𝑣_𝑖𝑖𝑝𝑝𝑝𝑝 = 𝑝𝑝𝑖𝑖𝑖𝑖𝑖𝑖𝑣𝑣𝑣𝑣_𝐿𝐿𝐿𝐿 +𝑝𝑝𝑖𝑖𝑖𝑖𝑖𝑖𝑣𝑣𝑣𝑣_𝑈𝑈𝐿𝐿−𝑝𝑝𝑖𝑖𝑖𝑖𝑖𝑖𝑣𝑣𝑣𝑣_𝐿𝐿𝐿𝐿
2,
where 𝑝𝑝𝑖𝑖𝑖𝑖𝑖𝑖𝑣𝑣𝑣𝑣_𝐿𝐿𝐿𝐿 and 𝑝𝑝𝑖𝑖𝑖𝑖𝑖𝑖𝑣𝑣𝑣𝑣_𝑈𝑈𝐿𝐿 are the reported lower and upper p-value thresholds, e.g. 0.01 <𝑝𝑝𝑣𝑣𝑣𝑣𝑣𝑣𝑣𝑣𝑣𝑣 ≤ 0.05. If no upper threshold is specified (e.g. 𝑝𝑝𝑖𝑖𝑖𝑖𝑖𝑖𝑣𝑣𝑣𝑣 > 0.1) we assume 𝑝𝑝𝑖𝑖𝑖𝑖𝑖𝑖𝑣𝑣𝑣𝑣_𝑈𝑈𝐿𝐿 = 1
and if no lower threshold is specified (e.g. 𝑝𝑝𝑖𝑖𝑖𝑖𝑖𝑖𝑣𝑣𝑣𝑣 < 0.01) we assume 𝑝𝑝𝑖𝑖𝑖𝑖𝑖𝑖𝑣𝑣𝑣𝑣_𝐿𝐿𝐿𝐿 =𝑝𝑝𝑖𝑖𝑖𝑖𝑖𝑖𝑣𝑣𝑣𝑣
10.
Once we have obtained 𝑝𝑝𝑖𝑖𝑖𝑖𝑖𝑖𝑣𝑣𝑣𝑣_𝑖𝑖𝑝𝑝𝑝𝑝 we compute the t-statistic using the formula for p-values described above.
(2) We subsequently convert impact estimates for binary indicator variables that are expressed in odds ratios, log odds ratios, and risk ratios into percentage point effect sizes using the following set of formulas:
Reported impact estimate Formula to obtain percentage point effect size (PPES)
Odds Ratio and Log Odds Ratio
The odds ratio (OR) is defined as
𝑂𝑂𝑂𝑂 = 𝑝𝑝1×(1−𝑝𝑝0)𝑝𝑝0×(1−𝑝𝑝1)

47
where 𝑝𝑝1 is the probability of an event under treatment and 𝑝𝑝0 the probability of an event without treatment. Isolating 𝑝𝑝1 leads to
𝑝𝑝1 =𝑂𝑂𝑂𝑂×𝑝𝑝0
1−𝑝𝑝0(1−𝑂𝑂𝑂𝑂) .
Then, obtain 𝑝𝑝1 by plugging in the reported OR and the reference mean (baseline treatment group mean for DiD-models, control group mean in other models) for 𝑝𝑝0.
The PPES 𝛽𝛽𝑀𝑀𝑀𝑀 is computed as the differences between the probability of an event under treatment and no treatment
𝛽𝛽𝑀𝑀𝑀𝑀 = 𝑝𝑝1 − 𝑝𝑝0 .
If reported impact estimate is log odds ratio, replace 𝑂𝑂𝑂𝑂 with exp(𝑂𝑂𝑂𝑂) in above formulas.
Risk Ratio
The risk ratio (RR) is defined as 𝑂𝑂𝑂𝑂 = 𝑝𝑝1
𝑝𝑝0 .
Isolating 𝑝𝑝1 leads to 𝑝𝑝1 = 𝑂𝑂𝑂𝑂 × 𝑝𝑝0 .
The PPES 𝛽𝛽𝑀𝑀𝑀𝑀 is computed as the differences between the probability of an event under treatment and no treatment
𝛽𝛽𝑀𝑀𝑀𝑀 = 𝑝𝑝1 − 𝑝𝑝0 .
Impact estimates that are already expressed in terms of percentage points enter our meta-analysis without prior conversion.
(3) Finally, we obtain meta-analysis standard errors 𝑆𝑆𝑆𝑆𝑀𝑀𝑀𝑀 by
𝑆𝑆𝑆𝑆𝑀𝑀𝑀𝑀 = �𝛽𝛽𝑀𝑀𝑀𝑀𝑡𝑡𝑀𝑀𝑀𝑀�.
References
1. Higgins J, Green S, editors. Cochrane Handbook for Systematic Reviews of Interventions Version 5.1.0 [Updated March 2011]: The Cochrane Collaboration; 2011.
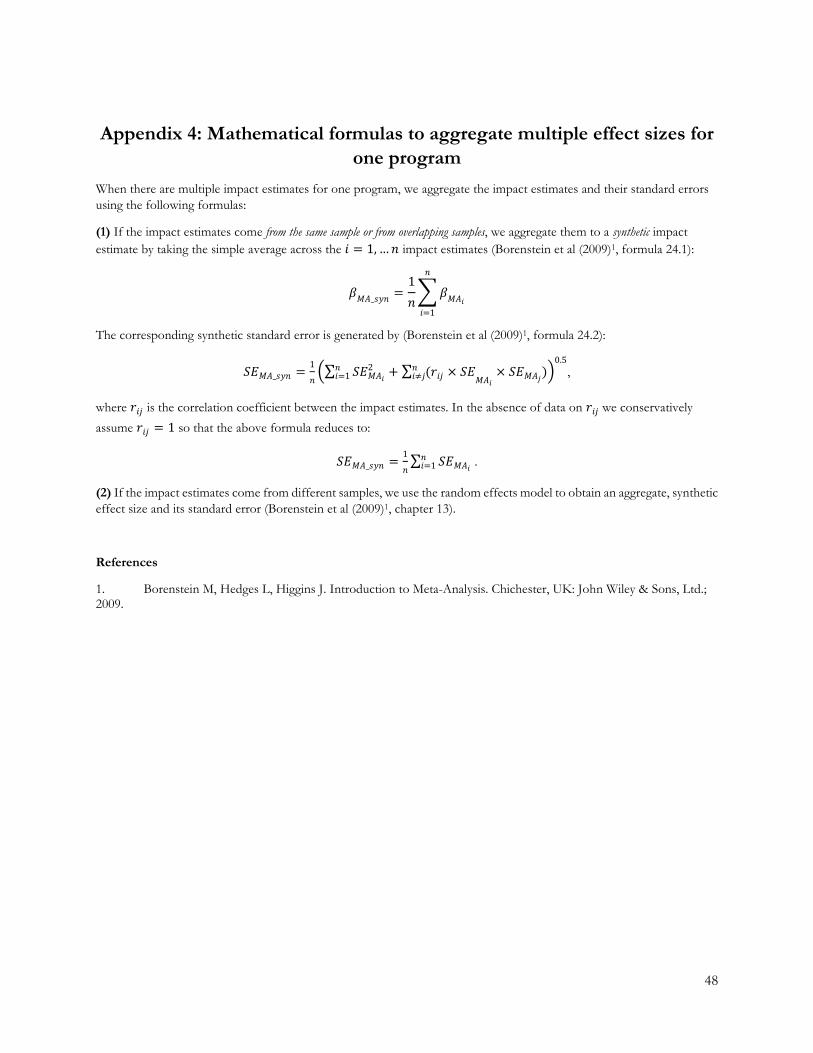
48
Appendix 4: Mathematical formulas to aggregate multiple effect sizes for one program
When there are multiple impact estimates for one program, we aggregate the impact estimates and their standard errors using the following formulas:
(1) If the impact estimates come from the same sample or from overlapping samples, we aggregate them to a synthetic impact estimate by taking the simple average across the 𝑖𝑖 = 1, … 𝑖𝑖 impact estimates (Borenstein et al (2009)1, formula 24.1):
𝛽𝛽𝑀𝑀𝑀𝑀_𝑠𝑠𝑠𝑠𝑖𝑖 =1𝑖𝑖�𝛽𝛽𝑀𝑀𝑀𝑀𝑖𝑖
𝑖𝑖
𝑖𝑖=1
The corresponding synthetic standard error is generated by (Borenstein et al (2009)1, formula 24.2):
𝑆𝑆𝑆𝑆𝑀𝑀𝑀𝑀_𝑠𝑠𝑠𝑠𝑖𝑖 = 1
𝑖𝑖�∑ 𝑆𝑆𝑆𝑆𝑀𝑀𝑀𝑀𝑖𝑖
2𝑖𝑖𝑖𝑖=1 + ∑ (𝑖𝑖𝑖𝑖𝑖𝑖 × 𝑆𝑆𝑆𝑆
𝑀𝑀𝑀𝑀𝑖𝑖× 𝑆𝑆𝑆𝑆𝑀𝑀𝑀𝑀𝑖𝑖
𝑖𝑖𝑖𝑖≠𝑖𝑖 )�
0.5,
where 𝑖𝑖𝑖𝑖𝑖𝑖 is the correlation coefficient between the impact estimates. In the absence of data on 𝑖𝑖𝑖𝑖𝑖𝑖 we conservatively assume 𝑖𝑖𝑖𝑖𝑖𝑖 = 1 so that the above formula reduces to:
𝑆𝑆𝑆𝑆𝑀𝑀𝑀𝑀_𝑠𝑠𝑠𝑠𝑖𝑖 = 1
𝑖𝑖∑ 𝑆𝑆𝑆𝑆𝑀𝑀𝑀𝑀𝑖𝑖𝑖𝑖𝑖𝑖=1 .
(2) If the impact estimates come from different samples, we use the random effects model to obtain an aggregate, synthetic effect size and its standard error (Borenstein et al (2009)1, chapter 13).
References
1. Borenstein M, Hedges L, Higgins J. Introduction to Meta-Analysis. Chichester, UK: John Wiley & Sons, Ltd.; 2009.

49
Appendix 5: Risk of bias assessment tool We consider a study to have low bias risk if it is a randomized controlled trial which does not score “no” for any of the below criteria listed below and does not score “unclear” for more than one criterion.
We consider a study to have medium bias risk if
• it is a randomized controlled trial which does not score “no” for more than one criterion listed below and does not score “unclear” for more than two criteria.
• treatment is assigned non-randomly and if the study does not score “no” for any criterion listed below and does not score “unclear” for more than one criterion.
We consider a study to have high bias risk if
• it is a randomized controlled trial which does scores “no” for more than one criterion listed below or scores “unclear” for more than two criteria.
• treatment is assigned non-randomly and if the study scores “no” for any criterion listed below or scores “unclear” for more than one criterion.
1. Selection Bias and Confounding
1.1. Randomized Controlled Trial (RCT) Designs
Criteria: code 1 if study complies with criterion, score 2 if it does not, code 3 if compliance is unclear
1. A random component in the sequence generation process is described (e.g. referring to a random number table)1;
2. The unit of allocation was at group level (geographical/ social/ institutional unit) and allocation was performed on all units at the start of the study; OR the unit of allocation was by beneficiary or group and there was some form of centralized allocation mechanism such as an on-site computer system or sealed opaque envelopes were used;
3. The unit of allocation is based on a sufficiently large sample size to equate groups on average;
4. The baseline characteristics of the study and control/comparisons are reported and overall similar based on t-test or ANOVA for equality of means across groups;
IF compliance with above points 1, 2 or 3 of this section is unclear or violated or if above point 4 is violated – i.e. when the randomization process was compromised or if there are large differences in baseline group means – AND IF the study addresses these issues using DID or IV methods, fill in the corresponding selection bias and confounding sections in the coding sheet. Afterwards continue with point 5 of this section.
5. The attrition rates (losses to follow up) are sufficiently low (<15%) and similar in treatment and control OR the study assesses that loss to follow up units are random draws from the sample (e.g. by examining correlation with determinants of indicators, in both treatment and comparison groups);
6. Problems with cross-overs and dropouts are dealt with using intention-to-treat analysis;
7. IF treatment is assigned by cluster, authors appropriately control for external cluster-level factors that might confound the impact of the program (e.g. weather, infrastructure, community fixed effects, etc.) through multivariate analysis (code -99 if treatment assignment is not by cluster).
1.2. Regression Discontinuity (RD) Designs
Criteria: code 1 if study complies with criterion, score 2 if it does not, code 3 if compliance is unclear
1 If a quasi-randomized assignment approach is used (e.g. alphabetical order), you must be sure that the process truly generates groupings equivalent to random assignment, to score “Yes” on this criterion. In order to assess the validity of the quasi-randomization process, the most important aspect is whether the assignment process might generate a correlation between participation status and other factors (e.g. gender, socio-economic status) determining indicators; you may consider covariate balance in determining this (see point 4).

50
1. Allocation is made based on a pre-determined discontinuity on a continuous variable (regression discontinuity design) and blinded to participants; OR it is not blinded but participants reasonably cannot affect the assignment variable in response to knowledge of the participation decision rule;
2. The sample size immediately at both sides of the cut-off point is sufficiently large to equate groups on average;
3. The interval for selection of treatment and control group is reasonably small; OR authors have weighted the matches on their distance to the cut-off point;
4. The mean of the covariates of the individuals immediately at both sides of the cut-off point (selected sample of participants and non-participants) are reported and overall similar based on t-test or ANOVA for equality of means;
IF compliance with above points 1, 2 or 3 of this section is unclear or violated or if above point 4 is violated – i.e. when the randomization process was compromised or if there are large differences in group means – AND IF the study addresses these issues using DID or IV methods, fill in the corresponding selection bias and confounding sections in the coding sheet. Afterwards continue with point 5 of this section.
5. IF treatment is assigned by cluster, authors appropriately control for external cluster-level factors that might confound the impact of the program (e.g. weather, infrastructure, community fixed effects, etc.) through multivariate analysis (code -99 if treatment assignment is not by cluster).
1.3. Difference-in-Difference (DID) designs (with non-random treatment assignment)
Criteria: code 1 if study complies with criterion, score 2 if it does not, code 3 if compliance is unclear
1. A comprehensive set of time-variant characteristics affecting participation and indicators are accounted for through covariate adjustment or by showing through statistical testing that mean characteristics are equal across groups; OR Treatment and comparisons are matched2 based on a comprehensive set of baseline characteristics explaining participation and indicators;
2. The attrition rate is sufficiently low (<15%) and similar in treatment and control; OR the study assesses that drop-outs are random draws from the sample (e.g. by examining correlation with determinants of indicators, in both treatment and comparison groups);
1.4. Instrumental Variable (IV) designs
Criteria: code 1 if study complies with criterion, score 2 if it does not, code 3 if compliance is unclear
1. The study convincingly assesses qualitatively why the instrument is exogenous (both externally as well as why the variable should not enter by itself in the indicator equation), i.e. that it only affects the indicator via participation such as in a ‘natural experiment’ or random allocation3.
2. The instrumenting equation is significant at the level of F≥10 (or if an F test is not reported, the authors report and assess whether the R-squared (goodness of fit) of the participation equation is sufficient for appropriate identification);
3. The identifying instruments are individually significant (p≤0.01); OR if a Heckman model is used, the identifiers are reported and significant (p≤0.05);
4. For generalized IV estimation, IF at least two instruments are used, the authors report on an over-identifying test and the test is significant (p≤0.05 is required to reject the null hypothesis) (code -99 if only 1 instrument is used);
5. The study includes relevant controls for confounding, and none of the controls is likely affected by participation.
2 The matching procedure is appropriate if (1) matching is either on baseline characteristics, time-invariant characteristics, or time-variant characteristics which cannot be affected by participation in the program; (2) the variables used to match are relevant (e.g. demographic and socio-economic factors) to explain both participation and the indicator (so that there can be no evident differences across groups in variables that might explain indicators); (3) with the exception of Kernel matching, the means of the individual covariates are equated for treatment and comparison groups after matching. 3 If the instrument is the random assignment of the treatment, the reviewer should also assess the quality and success of the randomization procedure.

51
6. IF treatment is assigned by cluster, authors appropriately control for external cluster-level factors that might confound the impact of the program (e.g. weather, infrastructure, community fixed effects, etc.) through multivariate analysis (code -99 if treatment assignment is not by cluster).
2. Hawthorne and John Henry effects: was the process of being observed causing motivation bias?
Criteria: code 1 if study complies with criterion, score 2 if it does not, code 3 if compliance is unclear
1a. For data collected in the context of a particular intervention trial (randomized or non-randomized assignment), the authors state explicitly that the process of monitoring the intervention and indicator measurement is blinded, or argue convincingly why it is not likely that being monitored in ways that could affect the performance of participants in treatment and comparison groups in different ways;
OR if
1b. The study is based on data collected in the context of a survey, and not associated with a particular intervention trial, or data are collected in the context of a retrospective (ex post) evaluation.
3. Spill-overs and contamination: was the study adequately protected from spillover and contamination?
Criteria: code 1 if study complies with criterion, score 2 if it does not, code 3 if compliance is unclear 1. The intervention is unlikely to spill-over to comparisons (e.g. participants and non-participants are geographically
and/or socially separated from one another and general equilibrium effects are unlikely)
AND
2. Treatment and comparisons are isolated from other interventions which might explain changes in indicators.
4. Selective indicator reporting: was the study free from indicator reporting bias?
Criteria: code 1 if study complies with criterion, score 2 if it does not, code 3 if compliance is unclear
Score “1 - YES” if there is no evidence that indicators were selectively reported (e.g. all relevant indicators in the methods section are reported in the results section).
Score “2 - NO” if some important indicators are subsequently omitted from the results or the significance and magnitude of important indicators was not assessed.
Score “3 - UNCLEAR” otherwise
5. Selective analysis reporting: was the study free from analysis reporting bias?
Criteria: code 1 if study complies with criterion, score 2 if it does not, code 3 if compliance is unclear
Score “1 - YES” if authors use ‘common’ methods4 of estimation and the study does not suggest the existence of biased exploratory research methods5, for instance:
• For DID with PSM, score “yes” if (a) for failure to match over 10% of participants, sensitivity analysis is used to re-estimate results using different matching methods (kernel matching techniques); (b) for matching with replacement, there is not any observation in the control group that is matched with a large number of observations in the treatment group; (c) authors report the results of Rosenbaum test for hidden bias which suggest that the results are not sensitive to the existence of hidden bias.
4 ‘Common methods’ refers to the use of the most credible method of analysis to address attribution given the data available. 5 A comprehensive assessment of the existence of ‘data mining’ is not feasible particularly in quasi-experimental designs where most studies do not have protocols and replication seems the only possible mechanism to examine rigorously the existence of data mining.
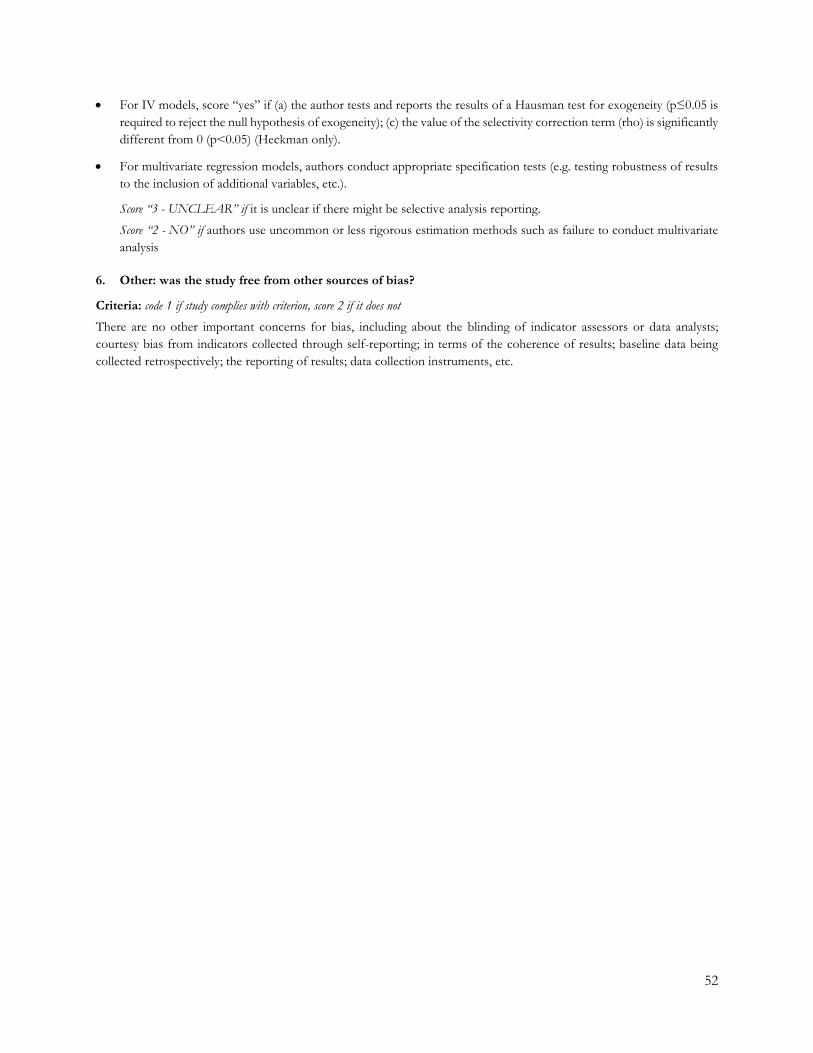
52
• For IV models, score “yes” if (a) the author tests and reports the results of a Hausman test for exogeneity (p≤0.05 is required to reject the null hypothesis of exogeneity); (c) the value of the selectivity correction term (rho) is significantly different from 0 (p<0.05) (Heckman only).
• For multivariate regression models, authors conduct appropriate specification tests (e.g. testing robustness of results to the inclusion of additional variables, etc.).
Score “3 - UNCLEAR” if it is unclear if there might be selective analysis reporting.
Score “2 - NO” if authors use uncommon or less rigorous estimation methods such as failure to conduct multivariate analysis
6. Other: was the study free from other sources of bias?
Criteria: code 1 if study complies with criterion, score 2 if it does not
There are no other important concerns for bias, including about the blinding of indicator assessors or data analysts; courtesy bias from indicators collected through self-reporting; in terms of the coherence of results; baseline data being collected retrospectively; the reporting of results; data collection instruments, etc.
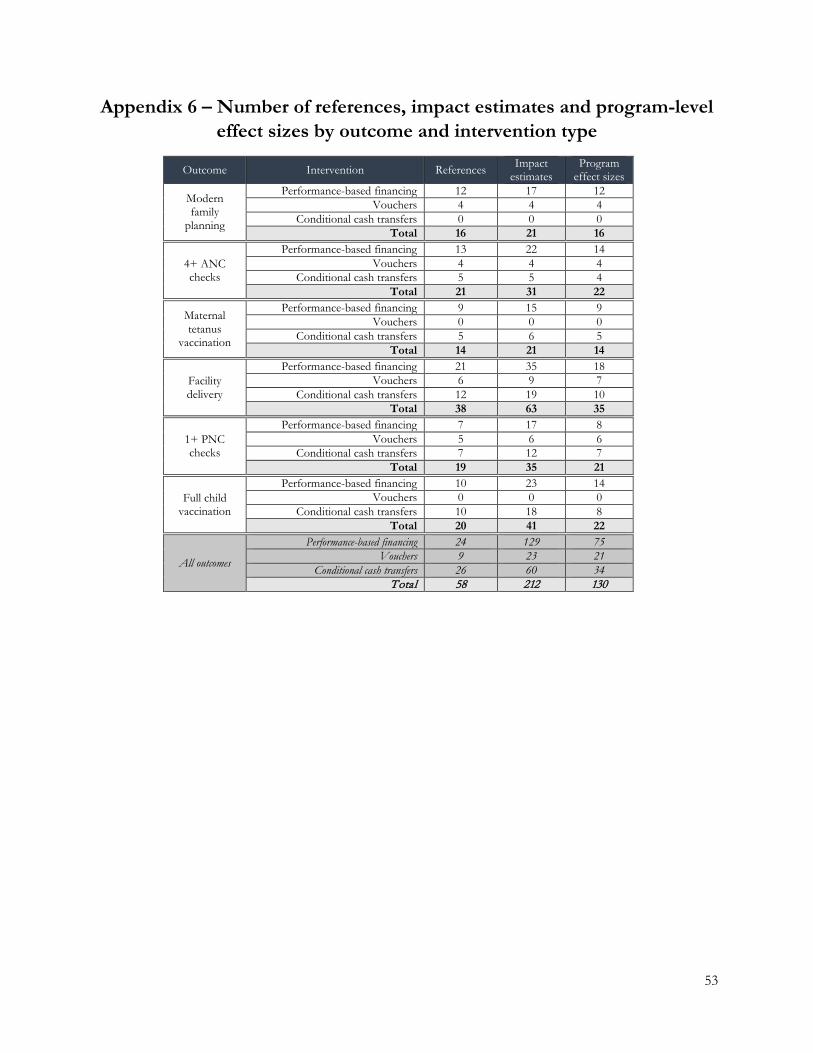
53
Appendix 6 – Number of references, impact estimates and program-level effect sizes by outcome and intervention type
Outcome Intervention References Impact
estimates Program
effect sizes Modern
family planning
Performance-based financing 12 17 12 Vouchers 4 4 4 Conditional cash transfers 0 0 0 Total 16 21 16
4+ ANC checks
Performance-based financing 13 22 14 Vouchers 4 4 4 Conditional cash transfers 5 5 4 Total 21 31 22 Maternal
tetanus vaccination
Performance-based financing 9 15 9 Vouchers 0 0 0 Conditional cash transfers 5 6 5 Total 14 21 14
Facility delivery
Performance-based financing 21 35 18 Vouchers 6 9 7 Conditional cash transfers 12 19 10 Total 38 63 35
1+ PNC checks
Performance-based financing 7 17 8 Vouchers 5 6 6 Conditional cash transfers 7 12 7 Total 19 35 21
Full child vaccination
Performance-based financing 10 23 14 Vouchers 0 0 0 Conditional cash transfers 10 18 8 Total 20 41 22
All outcomes
Performance-based financing 24 129 75 Vouchers 9 23 21 Conditional cash transfers 26 60 34 Total 58 212 130

54
Appendix 7: Variation in outcome variable definitions and their impacts on mean effect sizes
For modern family planning, the definitory differences described Table 3, and, in detail, in Table A7.1 do not drive the observed differences in mean effect sizes between PBF and voucher programs shown in Figure 3. Omission of effect sizes from five reports which exclude condoms and female and male sterilization and of the effect sizes from two reports which use a different reference period for the use of modern contraceptives than ‘current’ leaves the magnitude and significance of the results in Figure 3 unchanged (Appendix Figures A7.1 and A7.2).
For maternal tetanus vaccination, the overall and subgroup results in Figure 4 appear not to be driven by differences in the definition of maternal tetanus vaccination (Appendix Table A7.2), as omission of effects sizes from reports where tetanus vaccination is defined as having received two or the required number of doses – as opposed to one dose – does not lead to substantives absolute changes in mean effect sizes (Appendix Figure A7.3).
For facility deliveries, omission of effect sizes from reports with somewhat diverging definitions of facility deliveries (Appendix Table A7.3), namely limitation to deliveries in public health facilities (Appendix Figure A7.4) and to facility deliveries where a skilled health worker is present (Appendix Figure A7.5), has only minimal effects on the magnitudes and statistical significance of the overall and subgroup specific mean effect sizes in Figure 6.
For postnatal care checks, the overall and subgroup results in Figure 7 are unlikely to be driven by differences in definitions of postnatal care utilization (Appendix Table A7.4), as the omission of effect sizes from reports which use reference periods for postnatal care which are 42 or longer (Appendix Figure A7.6) and effect sizes which require presence of skilled providers (Appendix Figure A7.7) have only small effects on mean effect size estimates, and lead to only a small, and expected, loss in precision.
Full childhood vaccination
Variations in the definition of childhood vaccinations (Appendix Table A7.5) appear not to drive these results shown in Figure 8. Meta-regressions on indicators of the vaccination definition requiring vaccination data to come from a vaccination card (coefficient 0.07 percentage points, p-value 0.980), of vaccinations beyond BCG, Polio3, DTP3 and measles being required (coefficient -0.9 percentage points, p-value 0.669), or of children older than two years being included (coefficient 1.3 percentage points, p-value 0.505) indicate no significant role of these definitory variations. Because the majority of reports on CCTs – and none on PBF programs – uses definitions that include children older than two, we also investigate the robustness of our main results to the exclusion of effect sizes from reports whose childhood vaccination definitions include older children. While this leads to a loss of statistical significance of the CCT effect, the mean effect size remains largely unchanged (Appendix Figure A7.8).
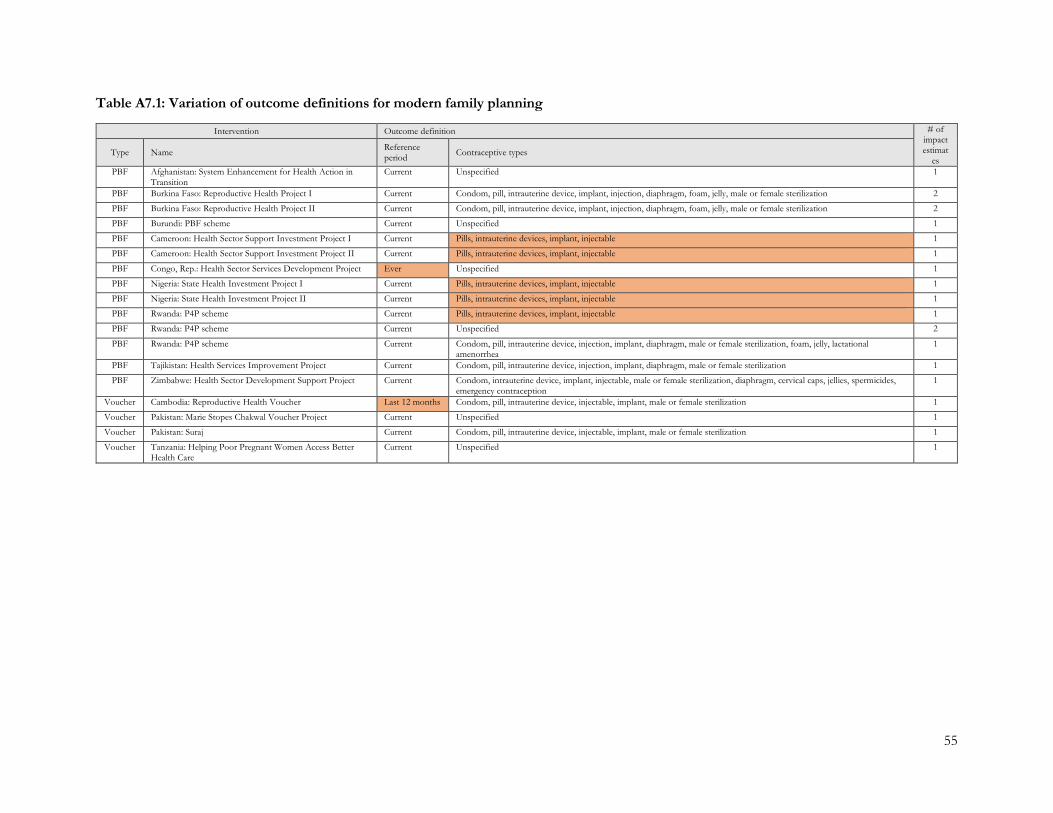
55
Table A7.1: Variation of outcome definitions for modern family planning
Intervention Outcome definition # of impact estimat
es Type Name Reference
period Contraceptive types
PBF Afghanistan: System Enhancement for Health Action in Transition
Current Unspecified 1
PBF Burkina Faso: Reproductive Health Project I Current Condom, pill, intrauterine device, implant, injection, diaphragm, foam, jelly, male or female sterilization 2
PBF Burkina Faso: Reproductive Health Project II Current Condom, pill, intrauterine device, implant, injection, diaphragm, foam, jelly, male or female sterilization 2
PBF Burundi: PBF scheme Current Unspecified 1
PBF Cameroon: Health Sector Support Investment Project I Current Pills, intrauterine devices, implant, injectable 1
PBF Cameroon: Health Sector Support Investment Project II Current Pills, intrauterine devices, implant, injectable 1
PBF Congo, Rep.: Health Sector Services Development Project Ever Unspecified 1
PBF Nigeria: State Health Investment Project I Current Pills, intrauterine devices, implant, injectable 1
PBF Nigeria: State Health Investment Project II Current Pills, intrauterine devices, implant, injectable 1
PBF Rwanda: P4P scheme Current Pills, intrauterine devices, implant, injectable 1
PBF Rwanda: P4P scheme Current Unspecified 2
PBF Rwanda: P4P scheme Current Condom, pill, intrauterine device, injection, implant, diaphragm, male or female sterilization, foam, jelly, lactational amenorrhea
1
PBF Tajikistan: Health Services Improvement Project Current Condom, pill, intrauterine device, injection, implant, diaphragm, male or female sterilization 1
PBF Zimbabwe: Health Sector Development Support Project Current Condom, intrauterine device, implant, injectable, male or female sterilization, diaphragm, cervical caps, jellies, spermicides, emergency contraception
1
Voucher Cambodia: Reproductive Health Voucher Last 12 months Condom, pill, intrauterine device, injectable, implant, male or female sterilization 1
Voucher Pakistan: Marie Stopes Chakwal Voucher Project Current Unspecified 1
Voucher Pakistan: Suraj Current Condom, pill, intrauterine device, injectable, implant, male or female sterilization 1
Voucher Tanzania: Helping Poor Pregnant Women Access Better Health Care
Current Unspecified 1
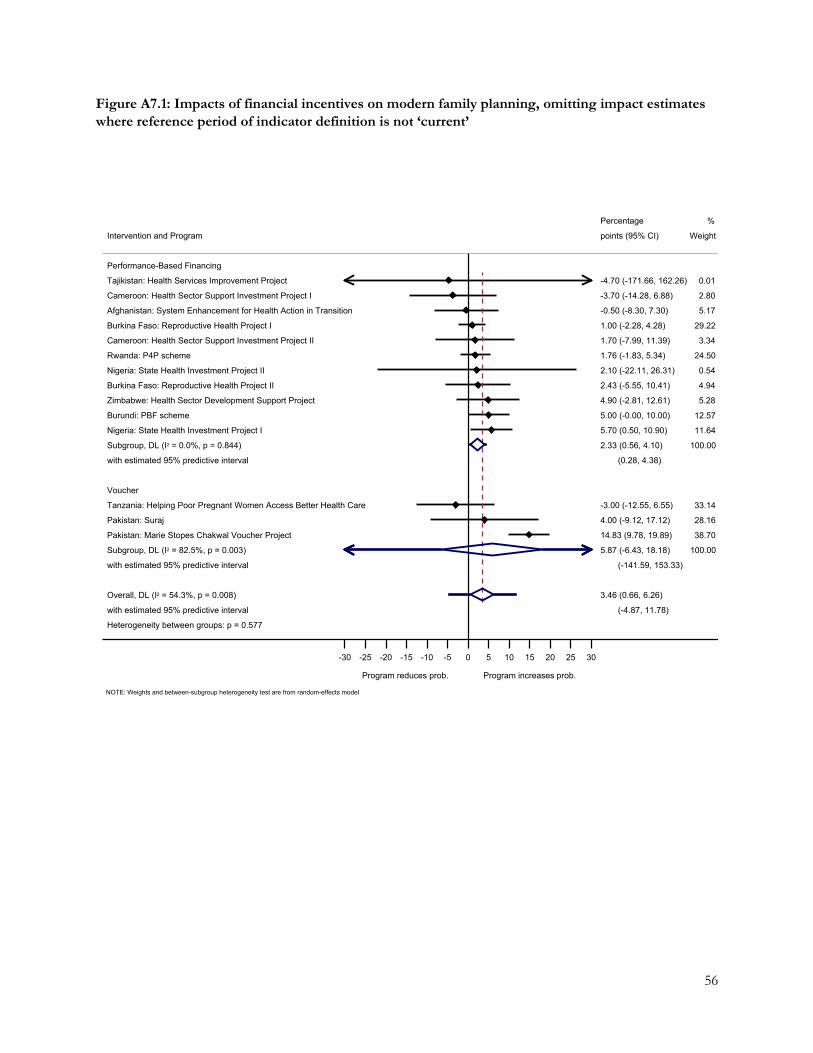
56
Figure A7.1: Impacts of financial incentives on modern family planning, omitting impact estimates where reference period of indicator definition is not ‘current’
Heterogeneity between groups: p = 0.577
with estimated 95% predictive interval
Overall, DL (I2 = 54.3%, p = 0.008)
with estimated 95% predictive interval
Subgroup, DL (I2 = 82.5%, p = 0.003)
Pakistan: Marie Stopes Chakwal Voucher Project
Pakistan: Suraj
Tanzania: Helping Poor Pregnant Women Access Better Health Care
Voucher
with estimated 95% predictive interval
Subgroup, DL (I2 = 0.0%, p = 0.844)
Nigeria: State Health Investment Project I
Burundi: PBF scheme
Zimbabwe: Health Sector Development Support Project
Burkina Faso: Reproductive Health Project II
Nigeria: State Health Investment Project II
Rwanda: P4P scheme
Cameroon: Health Sector Support Investment Project II
Burkina Faso: Reproductive Health Project I
Afghanistan: System Enhancement for Health Action in Transition
Cameroon: Health Sector Support Investment Project I
Tajikistan: Health Services Improvement Project
Performance-Based Financing
Intervention and Program
(-4.87, 11.78)
3.46 (0.66, 6.26)
(-141.59, 153.33)
5.87 (-6.43, 18.18)
14.83 (9.78, 19.89)
4.00 (-9.12, 17.12)
-3.00 (-12.55, 6.55)
(0.28, 4.38)
2.33 (0.56, 4.10)
5.70 (0.50, 10.90)
5.00 (-0.00, 10.00)
4.90 (-2.81, 12.61)
2.43 (-5.55, 10.41)
2.10 (-22.11, 26.31)
1.76 (-1.83, 5.34)
1.70 (-7.99, 11.39)
1.00 (-2.28, 4.28)
-0.50 (-8.30, 7.30)
-3.70 (-14.28, 6.88)
-4.70 (-171.66, 162.26)
points (95% CI)
Percentage
100.00
38.70
28.16
33.14
100.00
11.64
12.57
5.28
4.94
0.54
24.50
3.34
29.22
5.17
2.80
0.01
Weight
%
Program reduces prob. Program increases prob.
-30 -25 -20 -15 -10 -5 0 5 10 15 20 25 30
NOTE: Weights and between-subgroup heterogeneity test are from random-effects model
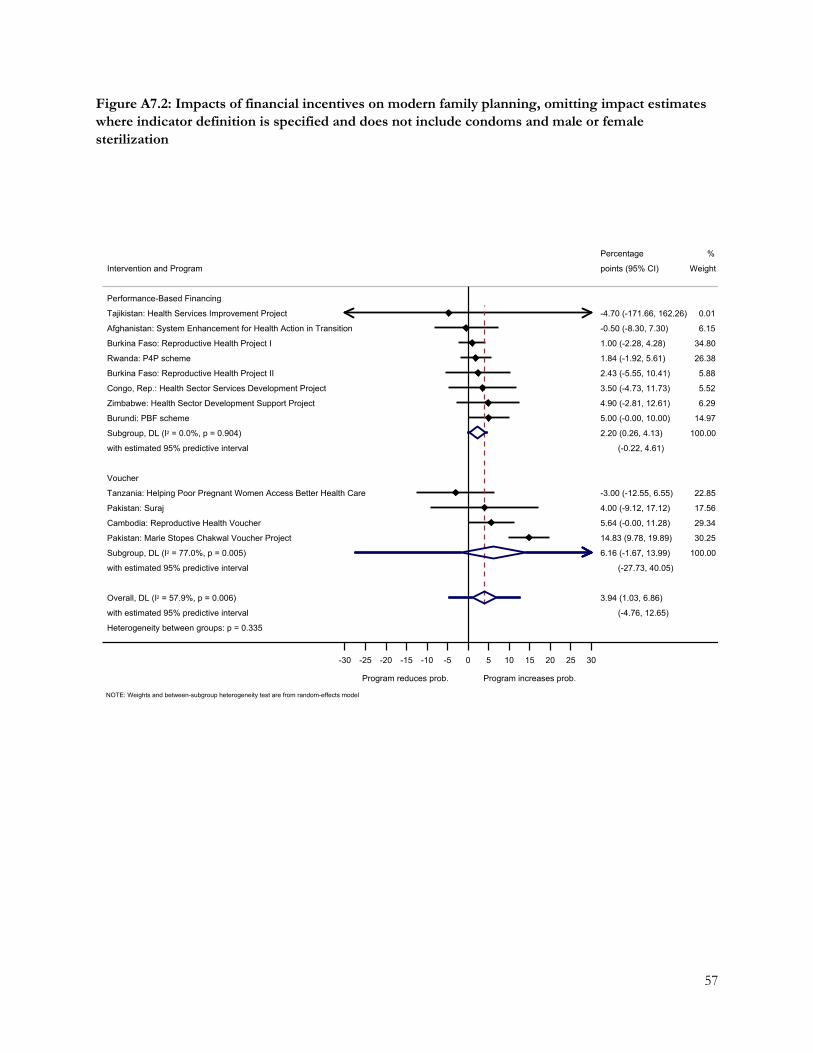
57
Figure A7.2: Impacts of financial incentives on modern family planning, omitting impact estimates where indicator definition is specified and does not include condoms and male or female sterilization
Heterogeneity between groups: p = 0.335
with estimated 95% predictive interval
Overall, DL (I2 = 57.9%, p = 0.006)
with estimated 95% predictive interval
Subgroup, DL (I2 = 77.0%, p = 0.005)
Pakistan: Marie Stopes Chakwal Voucher Project
Cambodia: Reproductive Health Voucher
Pakistan: Suraj
Tanzania: Helping Poor Pregnant Women Access Better Health Care
Voucher
with estimated 95% predictive interval
Subgroup, DL (I2 = 0.0%, p = 0.904)
Burundi: PBF scheme
Zimbabwe: Health Sector Development Support Project
Congo, Rep.: Health Sector Services Development Project
Burkina Faso: Reproductive Health Project II
Rwanda: P4P scheme
Burkina Faso: Reproductive Health Project I
Afghanistan: System Enhancement for Health Action in Transition
Tajikistan: Health Services Improvement Project
Performance-Based Financing
Intervention and Program
(-4.76, 12.65)
3.94 (1.03, 6.86)
(-27.73, 40.05)
6.16 (-1.67, 13.99)
14.83 (9.78, 19.89)
5.64 (-0.00, 11.28)
4.00 (-9.12, 17.12)
-3.00 (-12.55, 6.55)
(-0.22, 4.61)
2.20 (0.26, 4.13)
5.00 (-0.00, 10.00)
4.90 (-2.81, 12.61)
3.50 (-4.73, 11.73)
2.43 (-5.55, 10.41)
1.84 (-1.92, 5.61)
1.00 (-2.28, 4.28)
-0.50 (-8.30, 7.30)
-4.70 (-171.66, 162.26)
points (95% CI)
Percentage
100.00
30.25
29.34
17.56
22.85
100.00
14.97
6.29
5.52
5.88
26.38
34.80
6.15
0.01
Weight
%
Program reduces prob. Program increases prob.
-30 -25 -20 -15 -10 -5 0 5 10 15 20 25 30
NOTE: Weights and between-subgroup heterogeneity test are from random-effects model

58
Table A7.2: Variation of outcome definitions for maternal tetanus vaccination
Intervention Outcome definition # of impac
t estimates
Type Name Minimum doses Comment
PBF Burkina Faso: Reproductive Health Project I 2 2
PBF Burkina Faso: Reproductive Health Project II 2 2
PBF Burundi: PBF scheme 1 1
PBF Burundi: PBF scheme All required
Not specified 1
PBF Burundi: PBF scheme 2 1
PBF Burundi: PBF scheme 1 1
PBF Cameroon: Health Sector Support Investment Project I
1 1
PBF Cameroon: Health Sector Support Investment Project II
1 1
PBF Rwanda: P4P scheme 1 1
PBF Rwanda: P4P scheme 2 1
PBF Zambia: Health Services Improvement Project I 1 1
PBF Zambia: Health Services Improvement Project II 1 1
PBF Zimbabwe: Health Sector Development Support Project
1 1
CCT Honduras: Bono 10,000 1 1
CCT Honduras: Programa de Asignación Familiar (PRAF II)
All required
A woman is considered to have received all required vaccinations if (1) two doses of tetanus toxoid were given during the last pregnancy, (2) one dose was given during the last pregnancy plus at least two during previous pregnancies, or (3) the woman had previously received a total of five or more doses.
2
CCT Indonesia: Program Keluarga Harapan 1 1
CCT Mexico: Progresa 1 1
CCT Peru: Juntos 1 1
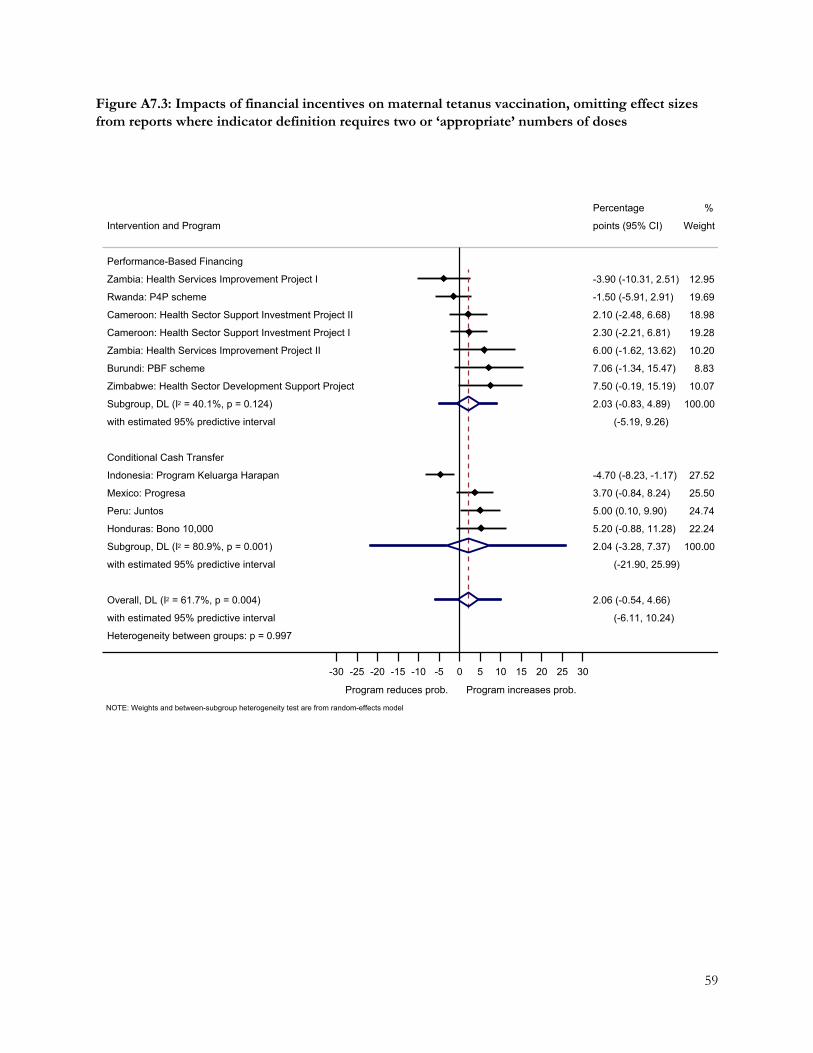
59
Figure A7.3: Impacts of financial incentives on maternal tetanus vaccination, omitting effect sizes from reports where indicator definition requires two or ‘appropriate’ numbers of doses
Heterogeneity between groups: p = 0.997
with estimated 95% predictive interval
Overall, DL (I2 = 61.7%, p = 0.004)
with estimated 95% predictive interval
Subgroup, DL (I2 = 80.9%, p = 0.001)
Honduras: Bono 10,000
Peru: Juntos
Mexico: Progresa
Indonesia: Program Keluarga Harapan
Conditional Cash Transfer
with estimated 95% predictive interval
Subgroup, DL (I2 = 40.1%, p = 0.124)
Zimbabwe: Health Sector Development Support Project
Burundi: PBF scheme
Zambia: Health Services Improvement Project II
Cameroon: Health Sector Support Investment Project I
Cameroon: Health Sector Support Investment Project II
Rwanda: P4P scheme
Zambia: Health Services Improvement Project I
Performance-Based Financing
Intervention and Program
(-6.11, 10.24)
2.06 (-0.54, 4.66)
(-21.90, 25.99)
2.04 (-3.28, 7.37)
5.20 (-0.88, 11.28)
5.00 (0.10, 9.90)
3.70 (-0.84, 8.24)
-4.70 (-8.23, -1.17)
(-5.19, 9.26)
2.03 (-0.83, 4.89)
7.50 (-0.19, 15.19)
7.06 (-1.34, 15.47)
6.00 (-1.62, 13.62)
2.30 (-2.21, 6.81)
2.10 (-2.48, 6.68)
-1.50 (-5.91, 2.91)
-3.90 (-10.31, 2.51)
points (95% CI)
Percentage
100.00
22.24
24.74
25.50
27.52
100.00
10.07
8.83
10.20
19.28
18.98
19.69
12.95
Weight
%
Program reduces prob. Program increases prob.
-30 -25 -20 -15 -10 -5 0 5 10 15 20 25 30
NOTE: Weights and between-subgroup heterogeneity test are from random-effects model
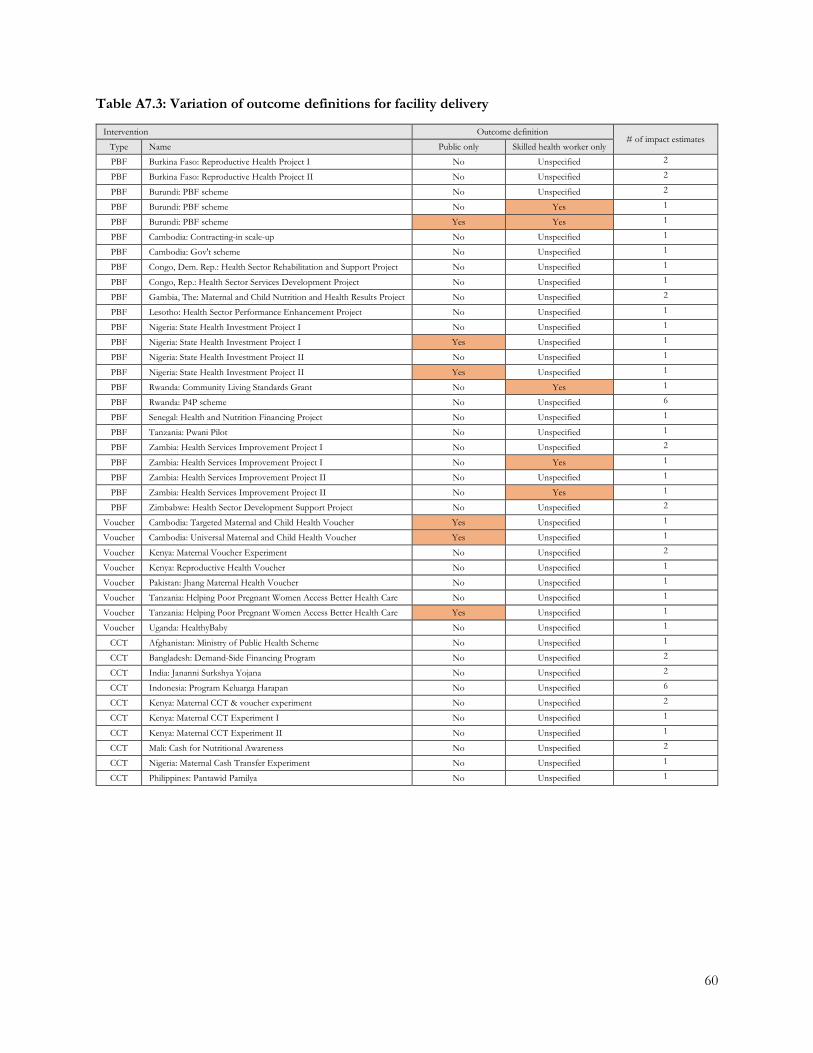
60
Table A7.3: Variation of outcome definitions for facility delivery
Intervention Outcome definition # of impact estimates
Type Name Public only Skilled health worker only
PBF Burkina Faso: Reproductive Health Project I No Unspecified 2
PBF Burkina Faso: Reproductive Health Project II No Unspecified 2
PBF Burundi: PBF scheme No Unspecified 2
PBF Burundi: PBF scheme No Yes 1
PBF Burundi: PBF scheme Yes Yes 1
PBF Cambodia: Contracting-in scale-up No Unspecified 1
PBF Cambodia: Gov't scheme No Unspecified 1
PBF Congo, Dem. Rep.: Health Sector Rehabilitation and Support Project No Unspecified 1
PBF Congo, Rep.: Health Sector Services Development Project No Unspecified 1
PBF Gambia, The: Maternal and Child Nutrition and Health Results Project No Unspecified 2
PBF Lesotho: Health Sector Performance Enhancement Project No Unspecified 1
PBF Nigeria: State Health Investment Project I No Unspecified 1
PBF Nigeria: State Health Investment Project I Yes Unspecified 1
PBF Nigeria: State Health Investment Project II No Unspecified 1
PBF Nigeria: State Health Investment Project II Yes Unspecified 1
PBF Rwanda: Community Living Standards Grant No Yes 1
PBF Rwanda: P4P scheme No Unspecified 6
PBF Senegal: Health and Nutrition Financing Project No Unspecified 1
PBF Tanzania: Pwani Pilot No Unspecified 1
PBF Zambia: Health Services Improvement Project I No Unspecified 2
PBF Zambia: Health Services Improvement Project I No Yes 1
PBF Zambia: Health Services Improvement Project II No Unspecified 1
PBF Zambia: Health Services Improvement Project II No Yes 1
PBF Zimbabwe: Health Sector Development Support Project No Unspecified 2
Voucher Cambodia: Targeted Maternal and Child Health Voucher Yes Unspecified 1
Voucher Cambodia: Universal Maternal and Child Health Voucher Yes Unspecified 1
Voucher Kenya: Maternal Voucher Experiment No Unspecified 2
Voucher Kenya: Reproductive Health Voucher No Unspecified 1
Voucher Pakistan: Jhang Maternal Health Voucher No Unspecified 1
Voucher Tanzania: Helping Poor Pregnant Women Access Better Health Care No Unspecified 1
Voucher Tanzania: Helping Poor Pregnant Women Access Better Health Care Yes Unspecified 1
Voucher Uganda: HealthyBaby No Unspecified 1
CCT Afghanistan: Ministry of Public Health Scheme No Unspecified 1
CCT Bangladesh: Demand-Side Financing Program No Unspecified 2
CCT India: Jananni Surkshya Yojana No Unspecified 2
CCT Indonesia: Program Keluarga Harapan No Unspecified 6
CCT Kenya: Maternal CCT & voucher experiment No Unspecified 2
CCT Kenya: Maternal CCT Experiment I No Unspecified 1
CCT Kenya: Maternal CCT Experiment II No Unspecified 1
CCT Mali: Cash for Nutritional Awareness No Unspecified 2
CCT Nigeria: Maternal Cash Transfer Experiment No Unspecified 1
CCT Philippines: Pantawid Pamilya No Unspecified 1
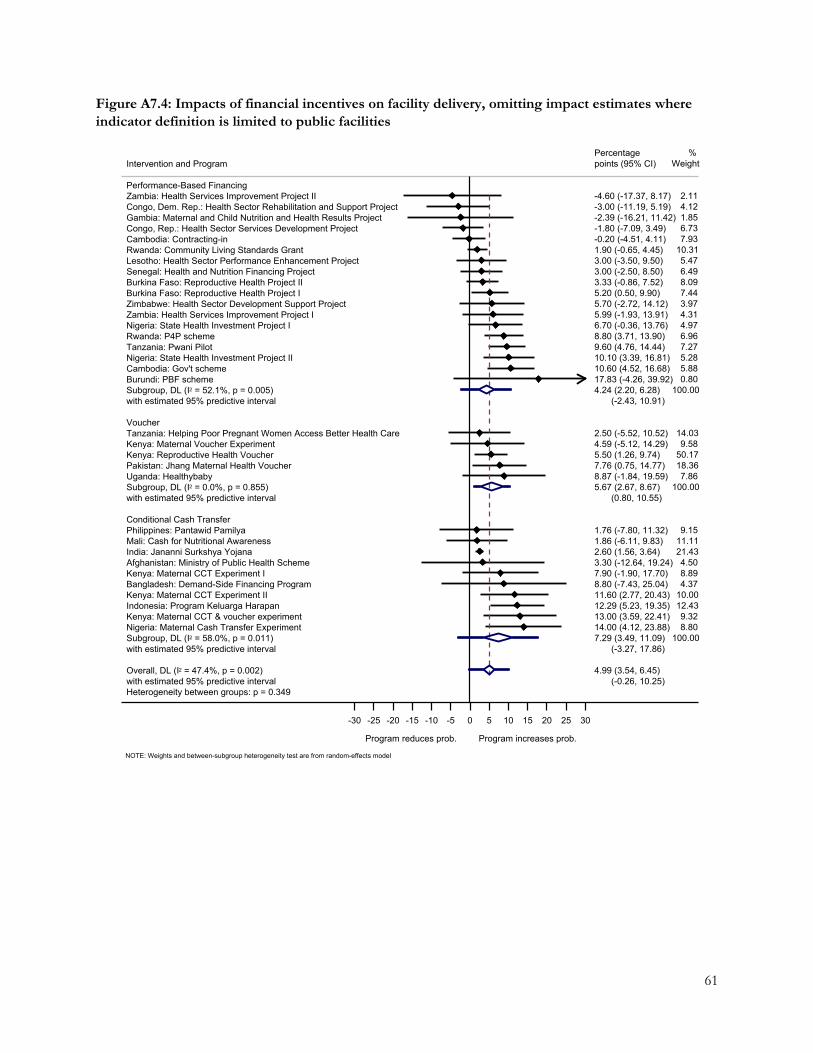
61
Figure A7.4: Impacts of financial incentives on facility delivery, omitting impact estimates where indicator definition is limited to public facilities
Heterogeneity between groups: p = 0.349with estimated 95% predictive intervalOverall, DL (I2 = 47.4%, p = 0.002)
with estimated 95% predictive intervalSubgroup, DL (I2 = 58.0%, p = 0.011)Nigeria: Maternal Cash Transfer ExperimentKenya: Maternal CCT & voucher experimentIndonesia: Program Keluarga HarapanKenya: Maternal CCT Experiment IIBangladesh: Demand-Side Financing ProgramKenya: Maternal CCT Experiment IAfghanistan: Ministry of Public Health SchemeIndia: Jananni Surkshya YojanaMali: Cash for Nutritional AwarenessPhilippines: Pantawid PamilyaConditional Cash Transfer
with estimated 95% predictive intervalSubgroup, DL (I2 = 0.0%, p = 0.855)Uganda: HealthybabyPakistan: Jhang Maternal Health VoucherKenya: Reproductive Health VoucherKenya: Maternal Voucher ExperimentTanzania: Helping Poor Pregnant Women Access Better Health CareVoucher
with estimated 95% predictive intervalSubgroup, DL (I2 = 52.1%, p = 0.005)Burundi: PBF schemeCambodia: Gov't schemeNigeria: State Health Investment Project IITanzania: Pwani PilotRwanda: P4P schemeNigeria: State Health Investment Project IZambia: Health Services Improvement Project IZimbabwe: Health Sector Development Support ProjectBurkina Faso: Reproductive Health Project IBurkina Faso: Reproductive Health Project IISenegal: Health and Nutrition Financing Project Lesotho: Health Sector Performance Enhancement ProjectRwanda: Community Living Standards GrantCambodia: Contracting-inCongo, Rep.: Health Sector Services Development ProjectGambia: Maternal and Child Nutrition and Health Results ProjectCongo, Dem. Rep.: Health Sector Rehabilitation and Support ProjectZambia: Health Services Improvement Project IIPerformance-Based Financing
Intervention and Program
(-0.26, 10.25)4.99 (3.54, 6.45)
(-3.27, 17.86)7.29 (3.49, 11.09)14.00 (4.12, 23.88)13.00 (3.59, 22.41)12.29 (5.23, 19.35)11.60 (2.77, 20.43)8.80 (-7.43, 25.04)7.90 (-1.90, 17.70)3.30 (-12.64, 19.24)2.60 (1.56, 3.64)1.86 (-6.11, 9.83)1.76 (-7.80, 11.32)
(0.80, 10.55)5.67 (2.67, 8.67)8.87 (-1.84, 19.59)7.76 (0.75, 14.77)5.50 (1.26, 9.74)4.59 (-5.12, 14.29)2.50 (-5.52, 10.52)
(-2.43, 10.91)4.24 (2.20, 6.28)17.83 (-4.26, 39.92)10.60 (4.52, 16.68)10.10 (3.39, 16.81)9.60 (4.76, 14.44)8.80 (3.71, 13.90)6.70 (-0.36, 13.76)5.99 (-1.93, 13.91)5.70 (-2.72, 14.12)5.20 (0.50, 9.90)3.33 (-0.86, 7.52)3.00 (-2.50, 8.50)3.00 (-3.50, 9.50)1.90 (-0.65, 4.45)-0.20 (-4.51, 4.11)-1.80 (-7.09, 3.49)-2.39 (-16.21, 11.42)-3.00 (-11.19, 5.19)-4.60 (-17.37, 8.17)
points (95% CI)Percentage
100.008.809.32
12.4310.004.378.894.50
21.4311.119.15
100.007.86
18.3650.179.58
14.03
100.000.805.885.287.276.964.974.313.977.448.096.495.47
10.317.936.731.854.122.11
Weight%
Program reduces prob. Program increases prob.
-30 -25 -20 -15 -10 -5 0 5 10 15 20 25 30
NOTE: Weights and between-subgroup heterogeneity test are from random-effects model
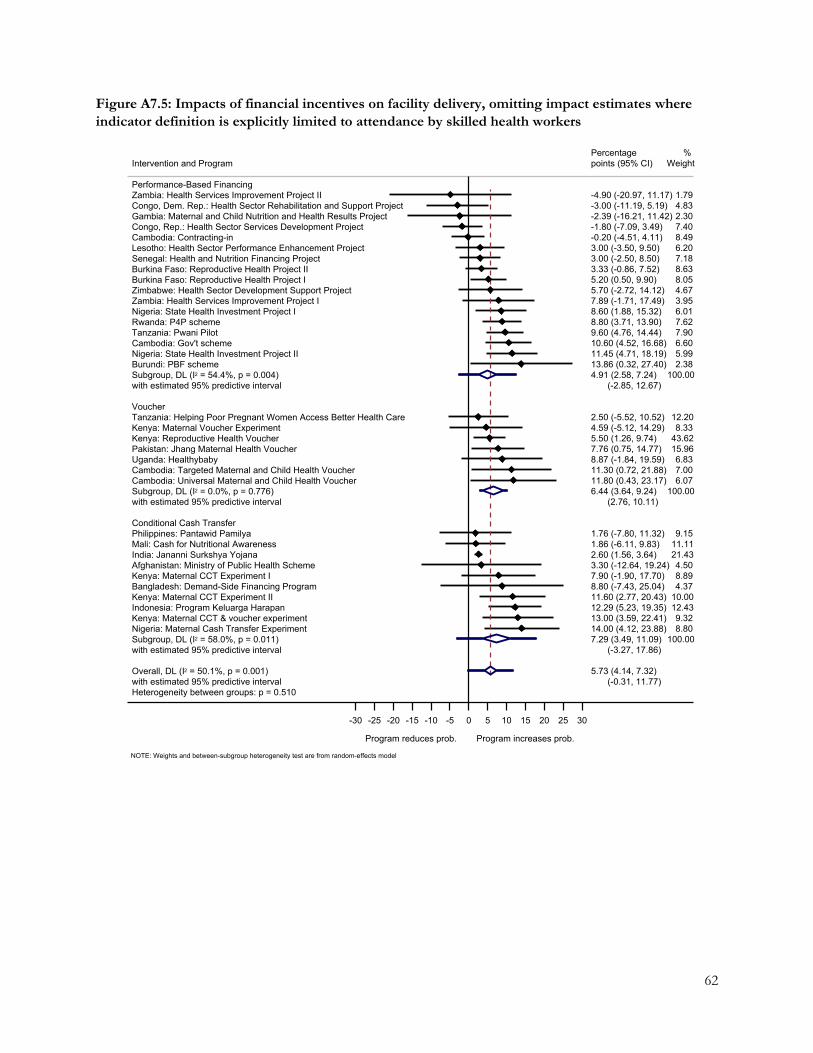
62
Figure A7.5: Impacts of financial incentives on facility delivery, omitting impact estimates where indicator definition is explicitly limited to attendance by skilled health workers
Heterogeneity between groups: p = 0.510with estimated 95% predictive intervalOverall, DL (I2 = 50.1%, p = 0.001)
with estimated 95% predictive intervalSubgroup, DL (I2 = 58.0%, p = 0.011)Nigeria: Maternal Cash Transfer ExperimentKenya: Maternal CCT & voucher experimentIndonesia: Program Keluarga HarapanKenya: Maternal CCT Experiment IIBangladesh: Demand-Side Financing ProgramKenya: Maternal CCT Experiment IAfghanistan: Ministry of Public Health SchemeIndia: Jananni Surkshya YojanaMali: Cash for Nutritional AwarenessPhilippines: Pantawid PamilyaConditional Cash Transfer
with estimated 95% predictive intervalSubgroup, DL (I2 = 0.0%, p = 0.776)Cambodia: Universal Maternal and Child Health VoucherCambodia: Targeted Maternal and Child Health VoucherUganda: HealthybabyPakistan: Jhang Maternal Health VoucherKenya: Reproductive Health VoucherKenya: Maternal Voucher ExperimentTanzania: Helping Poor Pregnant Women Access Better Health CareVoucher
with estimated 95% predictive intervalSubgroup, DL (I2 = 54.4%, p = 0.004)Burundi: PBF schemeNigeria: State Health Investment Project IICambodia: Gov't schemeTanzania: Pwani PilotRwanda: P4P schemeNigeria: State Health Investment Project IZambia: Health Services Improvement Project IZimbabwe: Health Sector Development Support ProjectBurkina Faso: Reproductive Health Project IBurkina Faso: Reproductive Health Project IISenegal: Health and Nutrition Financing Project Lesotho: Health Sector Performance Enhancement ProjectCambodia: Contracting-inCongo, Rep.: Health Sector Services Development ProjectGambia: Maternal and Child Nutrition and Health Results ProjectCongo, Dem. Rep.: Health Sector Rehabilitation and Support ProjectZambia: Health Services Improvement Project IIPerformance-Based Financing
Intervention and Program
(-0.31, 11.77)5.73 (4.14, 7.32)
(-3.27, 17.86)7.29 (3.49, 11.09)14.00 (4.12, 23.88)13.00 (3.59, 22.41)12.29 (5.23, 19.35)11.60 (2.77, 20.43)8.80 (-7.43, 25.04)7.90 (-1.90, 17.70)3.30 (-12.64, 19.24)2.60 (1.56, 3.64)1.86 (-6.11, 9.83)1.76 (-7.80, 11.32)
(2.76, 10.11)6.44 (3.64, 9.24)11.80 (0.43, 23.17)11.30 (0.72, 21.88)8.87 (-1.84, 19.59)7.76 (0.75, 14.77)5.50 (1.26, 9.74)4.59 (-5.12, 14.29)2.50 (-5.52, 10.52)
(-2.85, 12.67)4.91 (2.58, 7.24)13.86 (0.32, 27.40)11.45 (4.71, 18.19)10.60 (4.52, 16.68)9.60 (4.76, 14.44)8.80 (3.71, 13.90)8.60 (1.88, 15.32)7.89 (-1.71, 17.49)5.70 (-2.72, 14.12)5.20 (0.50, 9.90)3.33 (-0.86, 7.52)3.00 (-2.50, 8.50)3.00 (-3.50, 9.50)-0.20 (-4.51, 4.11)-1.80 (-7.09, 3.49)-2.39 (-16.21, 11.42)-3.00 (-11.19, 5.19)-4.90 (-20.97, 11.17)
points (95% CI)Percentage
100.008.809.32
12.4310.004.378.894.50
21.4311.119.15
100.006.077.006.83
15.9643.628.33
12.20
100.002.385.996.607.907.626.013.954.678.058.637.186.208.497.402.304.831.79
Weight%
Program reduces prob. Program increases prob.
-30 -25 -20 -15 -10 -5 0 5 10 15 20 25 30
NOTE: Weights and between-subgroup heterogeneity test are from random-effects model
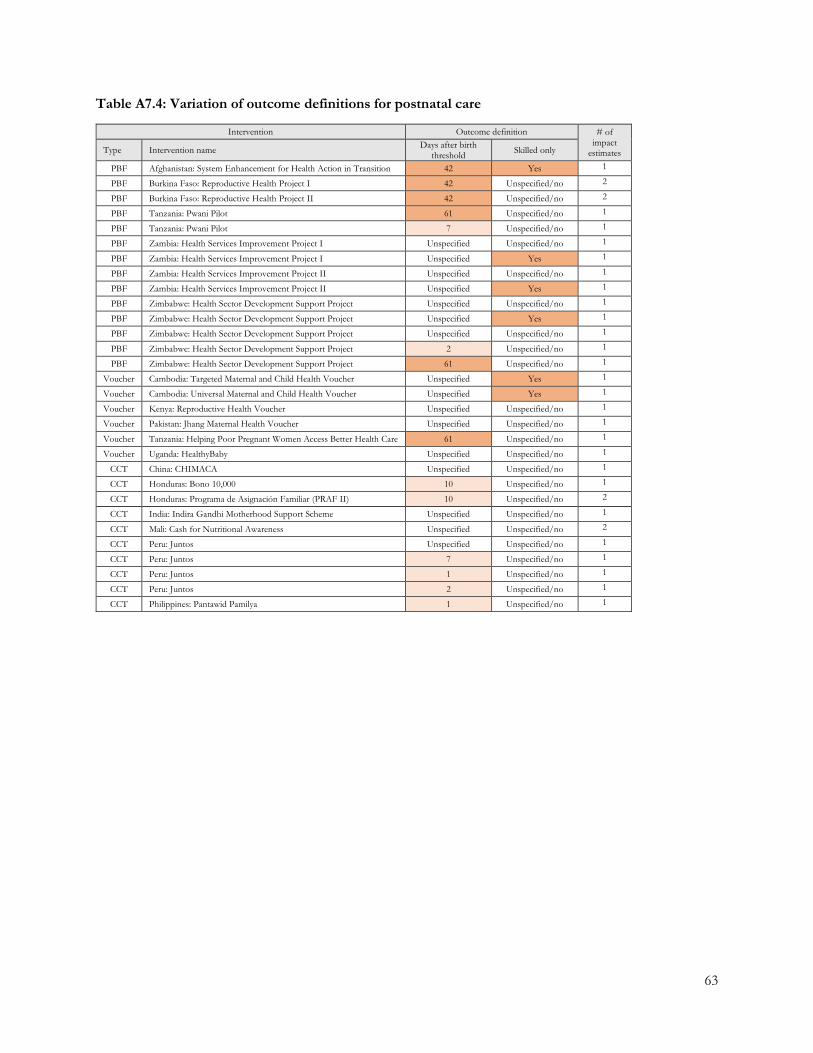
63
Table A7.4: Variation of outcome definitions for postnatal care
Intervention Outcome definition # of impact
estimates Type Intervention name Days after birth threshold Skilled only
PBF Afghanistan: System Enhancement for Health Action in Transition 42 Yes 1
PBF Burkina Faso: Reproductive Health Project I 42 Unspecified/no 2
PBF Burkina Faso: Reproductive Health Project II 42 Unspecified/no 2
PBF Tanzania: Pwani Pilot 61 Unspecified/no 1
PBF Tanzania: Pwani Pilot 7 Unspecified/no 1
PBF Zambia: Health Services Improvement Project I Unspecified Unspecified/no 1
PBF Zambia: Health Services Improvement Project I Unspecified Yes 1
PBF Zambia: Health Services Improvement Project II Unspecified Unspecified/no 1
PBF Zambia: Health Services Improvement Project II Unspecified Yes 1
PBF Zimbabwe: Health Sector Development Support Project Unspecified Unspecified/no 1
PBF Zimbabwe: Health Sector Development Support Project Unspecified Yes 1
PBF Zimbabwe: Health Sector Development Support Project Unspecified Unspecified/no 1
PBF Zimbabwe: Health Sector Development Support Project 2 Unspecified/no 1
PBF Zimbabwe: Health Sector Development Support Project 61 Unspecified/no 1
Voucher Cambodia: Targeted Maternal and Child Health Voucher Unspecified Yes 1
Voucher Cambodia: Universal Maternal and Child Health Voucher Unspecified Yes 1
Voucher Kenya: Reproductive Health Voucher Unspecified Unspecified/no 1
Voucher Pakistan: Jhang Maternal Health Voucher Unspecified Unspecified/no 1
Voucher Tanzania: Helping Poor Pregnant Women Access Better Health Care 61 Unspecified/no 1
Voucher Uganda: HealthyBaby Unspecified Unspecified/no 1
CCT China: CHIMACA Unspecified Unspecified/no 1
CCT Honduras: Bono 10,000 10 Unspecified/no 1
CCT Honduras: Programa de Asignación Familiar (PRAF II) 10 Unspecified/no 2
CCT India: Indira Gandhi Motherhood Support Scheme Unspecified Unspecified/no 1
CCT Mali: Cash for Nutritional Awareness Unspecified Unspecified/no 2
CCT Peru: Juntos Unspecified Unspecified/no 1
CCT Peru: Juntos 7 Unspecified/no 1
CCT Peru: Juntos 1 Unspecified/no 1
CCT Peru: Juntos 2 Unspecified/no 1
CCT Philippines: Pantawid Pamilya 1 Unspecified/no 1

64
Figure A7.6: Impacts of financial incentives on receiving postnatal care, omitting impact estimates where reference period is specified and longer than two weeks
Heterogeneity between groups: p = 0.760with estimated 95% predictive intervalOverall, DL (I2 = 17.7%, p = 0.238)
with estimated 95% predictive intervalSubgroup, DL (I2 = 48.9%, p = 0.057)Philippines: Pantawid PamilyaPeru: JuntosHonduras: Bono 10,000Peru: JuntosMali: Cash for Nutritional AwarenessIndia: Indira Gandhi Motherhood Support SchemeChina: CHIMACAHonduras: Programa de Asignacion Familiar (PRAF II)Conditional Cash Transfer
with estimated 95% predictive intervalSubgroup, DL (I2 = 0.0%, p = 0.876)Cambodia: Targeted Maternal and Child Health VoucherCambodia: Universal Maternal and Child Health VoucherKenya: Reproductive Health VoucherUganda: HealthybabyPakistan: Jhang Maternal Health VoucherVoucher
with estimated 95% predictive intervalSubgroup, DL (I2 = 20.0%, p = 0.283)Zimbabwe: Health Sector Development Support ProjectZambia: Health Services Improvement Project ICongo, Rep.: Health Sector Services Development ProjectTanzania: Pwani PilotZambia: Health Services Improvement Project IIZimbabwe: Health Sector Development Support ProjectPerformance-Based Financing
Intervention and Program
(-0.25, 6.76)3.26 (1.63, 4.88)
(-3.71, 11.02)3.66 (0.79, 6.52)10.22 (3.35, 17.08)6.30 (2.77, 9.83)6.10 (-3.50, 15.70)4.27 (0.28, 8.25)1.73 (-9.75, 13.21)0.97 (-1.68, 3.62)-0.48 (-11.48, 10.53)-5.65 (-15.82, 4.52)
(-0.90, 7.80)3.45 (0.77, 6.13)7.40 (-4.75, 19.55)4.70 (-0.98, 10.38)3.80 (-0.50, 8.10)2.26 (-8.95, 13.48)1.54 (-3.50, 6.57)
(-7.51, 11.00)1.74 (-2.66, 6.14)12.03 (-5.84, 29.91)9.25 (-3.01, 21.51)4.20 (-3.84, 12.24)1.30 (-4.47, 7.07)-3.05 (-12.78, 6.68)-7.80 (-20.35, 4.75)
points (95% CI)Percentage
100.0011.1521.056.92
19.355.19
24.465.576.32
100.004.86
22.2338.915.71
28.29
100.005.64
11.1422.0034.1216.4010.70
Weight%
Program reduces prob. Program increases prob.
-30 -25 -20 -15 -10 -5 0 5 10 15 20 25 30
NOTE: Weights and between-subgroup heterogeneity test are from random-effects model

65
Figure A7.7: Impacts of financial incentives on receiving postnatal care, omitting effect sizes from reports where definition is limited to postnatal care received from skilled providers
Heterogeneity between groups: p = 0.945
with estimated 95% predictive interval
Overall, DL (I2 = 0.0%, p = 0.521)
with estimated 95% predictive interval
Subgroup, DL (I2 = 44.2%, p = 0.096)
Philippines: Pantawid Pamilya
Honduras: Bono 10,000
Peru: Juntos
Mali: Cash for Nutritional Awareness
India: Indira Gandhi Motherhood Support Scheme
China: CHIMACA
Honduras: Programa de Asignacion Familiar (PRAF II)
Conditional Cash Transfer
with estimated 95% predictive interval
Subgroup, DL (I2 = 0.0%, p = 0.747)
Kenya: Reproductive Health Voucher
Uganda: Healthybaby
Pakistan: Jhang Maternal Health Voucher
Tanzania: Helping Poor Pregnant Women Access Better Health Care
Voucher
with estimated 95% predictive interval
Subgroup, DL (I2 = 0.0%, p = 0.683)
Zambia: Health Services Improvement Project I
Zimbabwe: Health Sector Development Support Project
Congo, Rep.: Health Sector Services Development Project
Burkina Faso: Reproductive Health Project II
Burkina Faso: Reproductive Health Project I
Tanzania: Pwani Pilot
Zambia: Health Services Improvement Project II
Performance-Based Financing
Intervention and Program
(1.10, 4.26)
2.68 (1.22, 4.14)
(-5.04, 11.21)
3.09 (-0.17, 6.34)
10.22 (3.35, 17.08)
6.10 (-3.50, 15.70)
4.78 (0.90, 8.65)
1.73 (-9.75, 13.21)
0.97 (-1.68, 3.62)
-0.48 (-11.48, 10.53)
-5.65 (-15.82, 4.52)
(-4.22, 9.15)
2.46 (-0.58, 5.51)
3.80 (-0.50, 8.10)
2.26 (-8.95, 13.48)
1.54 (-3.50, 6.57)
-3.00 (-15.61, 9.61)
(-1.15, 7.46)
3.15 (-0.13, 6.43)
8.20 (0.79, 15.61)
6.90 (-9.75, 23.55)
4.20 (-3.84, 12.24)
3.43 (-7.82, 14.69)
2.40 (-5.47, 10.27)
0.20 (-5.79, 6.19)
-5.10 (-21.82, 11.62)
points (95% CI)
Percentage
100.00
14.14
8.83
24.77
6.64
30.45
7.11
8.07
100.00
50.25
7.37
36.54
5.83
100.00
19.64
3.89
16.68
8.50
17.39
30.05
3.85
Weight
%
Program reduces prob. Program increases prob.
-30 -25 -20 -15 -10 -5 0 5 10 15 20 25 30
NOTE: Weights and between-subgroup heterogeneity test are from random-effects model
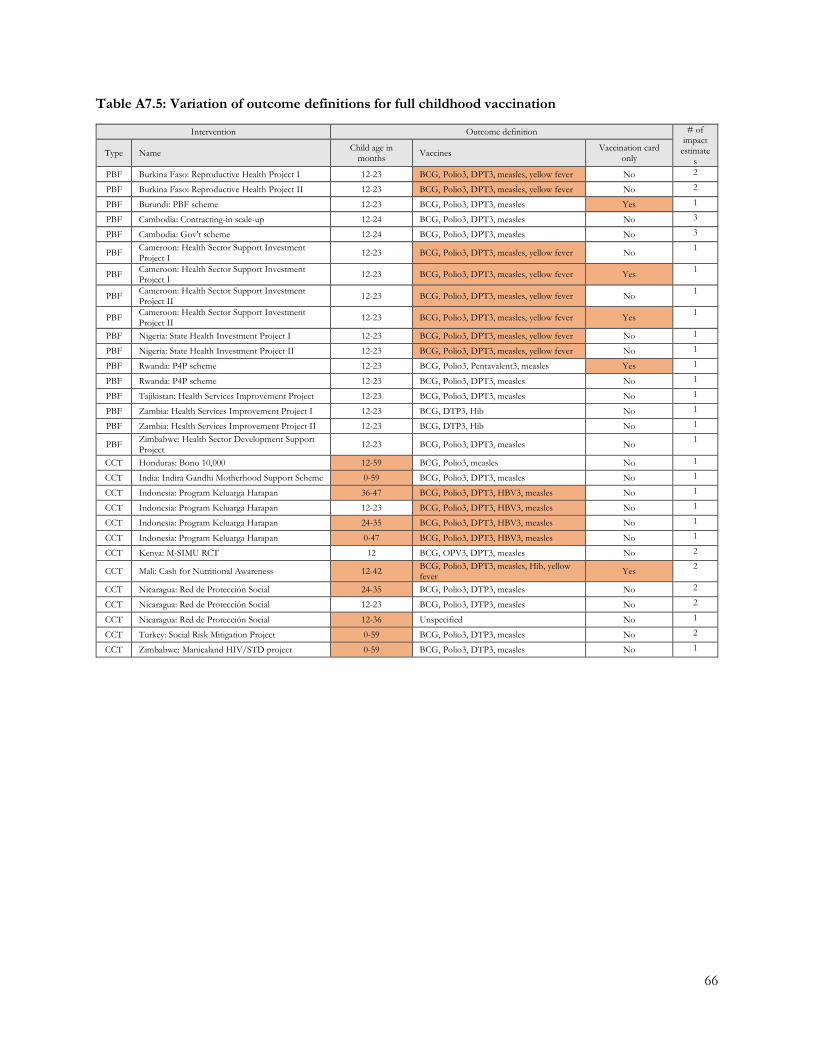
66
Table A7.5: Variation of outcome definitions for full childhood vaccination
Intervention Outcome definition # of impact
estimates
Type Name Child age in months Vaccines Vaccination card
only
PBF Burkina Faso: Reproductive Health Project I 12-23 BCG, Polio3, DPT3, measles, yellow fever No 2
PBF Burkina Faso: Reproductive Health Project II 12-23 BCG, Polio3, DPT3, measles, yellow fever No 2
PBF Burundi: PBF scheme 12-23 BCG, Polio3, DPT3, measles Yes 1
PBF Cambodia: Contracting-in scale-up 12-24 BCG, Polio3, DPT3, measles No 3
PBF Cambodia: Gov't scheme 12-24 BCG, Polio3, DPT3, measles No 3
PBF Cameroon: Health Sector Support Investment Project I 12-23 BCG, Polio3, DPT3, measles, yellow fever No 1
PBF Cameroon: Health Sector Support Investment Project I 12-23 BCG, Polio3, DPT3, measles, yellow fever Yes 1
PBF Cameroon: Health Sector Support Investment Project II 12-23 BCG, Polio3, DPT3, measles, yellow fever No 1
PBF Cameroon: Health Sector Support Investment Project II 12-23 BCG, Polio3, DPT3, measles, yellow fever Yes 1
PBF Nigeria: State Health Investment Project I 12-23 BCG, Polio3, DPT3, measles, yellow fever No 1
PBF Nigeria: State Health Investment Project II 12-23 BCG, Polio3, DPT3, measles, yellow fever No 1
PBF Rwanda: P4P scheme 12-23 BCG, Polio3, Pentavalent3, measles Yes 1
PBF Rwanda: P4P scheme 12-23 BCG, Polio3, DPT3, measles No 1
PBF Tajikistan: Health Services Improvement Project 12-23 BCG, Polio3, DPT3, measles No 1
PBF Zambia: Health Services Improvement Project I 12-23 BCG, DTP3, Hib No 1
PBF Zambia: Health Services Improvement Project II 12-23 BCG, DTP3, Hib No 1
PBF Zimbabwe: Health Sector Development Support Project 12-23 BCG, Polio3, DPT3, measles No 1
CCT Honduras: Bono 10,000 12-59 BCG, Polio3, measles No 1
CCT India: Indira Gandhi Motherhood Support Scheme 0-59 BCG, Polio3, DPT3, measles No 1
CCT Indonesia: Program Keluarga Harapan 36-47 BCG, Polio3, DPT3, HBV3, measles No 1
CCT Indonesia: Program Keluarga Harapan 12-23 BCG, Polio3, DPT3, HBV3, measles No 1
CCT Indonesia: Program Keluarga Harapan 24-35 BCG, Polio3, DPT3, HBV3, measles No 1
CCT Indonesia: Program Keluarga Harapan 0-47 BCG, Polio3, DPT3, HBV3, measles No 1
CCT Kenya: M-SIMU RCT 12 BCG, OPV3, DPT3, measles No 2
CCT Mali: Cash for Nutritional Awareness 12-42 BCG, Polio3, DPT3, measles, Hib, yellow fever Yes 2
CCT Nicaragua: Red de Protección Social 24-35 BCG, Polio3, DTP3, measles No 2
CCT Nicaragua: Red de Protección Social 12-23 BCG, Polio3, DTP3, measles No 2
CCT Nicaragua: Red de Protección Social 12-36 Unspecified No 1
CCT Turkey: Social Risk Mitigation Project 0-59 BCG, Polio3, DTP3, measles No 2
CCT Zimbabwe: Manicaland HIV/STD project 0-59 BCG, Polio3, DTP3, measles No 1
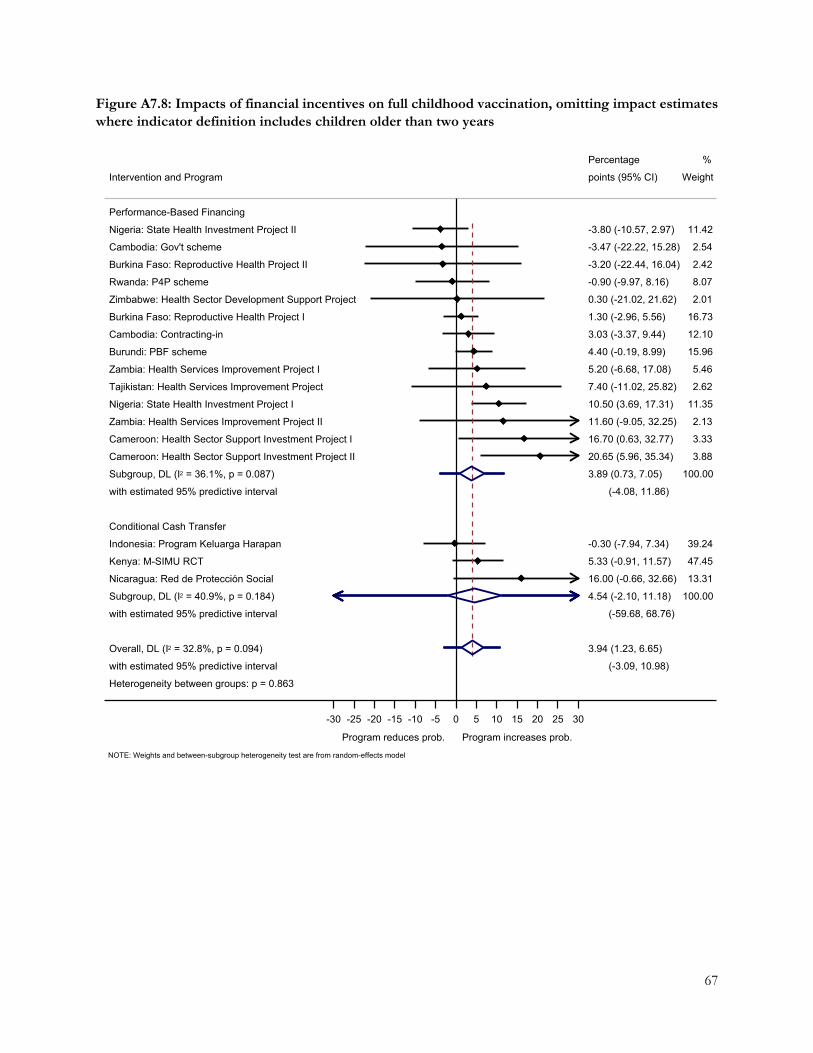
67
Figure A7.8: Impacts of financial incentives on full childhood vaccination, omitting impact estimates where indicator definition includes children older than two years
Heterogeneity between groups: p = 0.863
with estimated 95% predictive interval
Overall, DL (I2 = 32.8%, p = 0.094)
with estimated 95% predictive interval
Subgroup, DL (I2 = 40.9%, p = 0.184)
Nicaragua: Red de Proteccion Social
Kenya: M-SIMU RCT
Indonesia: Program Keluarga Harapan
Conditional Cash Transfer
with estimated 95% predictive interval
Subgroup, DL (I2 = 36.1%, p = 0.087)
Cameroon: Health Sector Support Investment Project II
Cameroon: Health Sector Support Investment Project I
Zambia: Health Services Improvement Project II
Nigeria: State Health Investment Project I
Tajikistan: Health Services Improvement Project
Zambia: Health Services Improvement Project I
Burundi: PBF scheme
Cambodia: Contracting-in
Burkina Faso: Reproductive Health Project I
Zimbabwe: Health Sector Development Support Project
Rwanda: P4P scheme
Burkina Faso: Reproductive Health Project II
Cambodia: Gov't scheme
Nigeria: State Health Investment Project II
Performance-Based Financing
Intervention and Program
(-3.09, 10.98)
3.94 (1.23, 6.65)
(-59.68, 68.76)
4.54 (-2.10, 11.18)
16.00 (-0.66, 32.66)
5.33 (-0.91, 11.57)
-0.30 (-7.94, 7.34)
(-4.08, 11.86)
3.89 (0.73, 7.05)
20.65 (5.96, 35.34)
16.70 (0.63, 32.77)
11.60 (-9.05, 32.25)
10.50 (3.69, 17.31)
7.40 (-11.02, 25.82)
5.20 (-6.68, 17.08)
4.40 (-0.19, 8.99)
3.03 (-3.37, 9.44)
1.30 (-2.96, 5.56)
0.30 (-21.02, 21.62)
-0.90 (-9.97, 8.16)
-3.20 (-22.44, 16.04)
-3.47 (-22.22, 15.28)
-3.80 (-10.57, 2.97)
points (95% CI)
Percentage
100.00
13.31
47.45
39.24
100.00
3.88
3.33
2.13
11.35
2.62
5.46
15.96
12.10
16.73
2.01
8.07
2.42
2.54
11.42
Weight
%
Program reduces prob. Program increases prob.
-30 -25 -20 -15 -10 -5 0 5 10 15 20 25 30
NOTE: Weights and between-subgroup heterogeneity test are from random-effects model