
Financial Forecast Overview and Financial Baseline · Web viewThe EIA Report only reflects data for...
81
Financial Forecast Overview & Financial Baseline Costs Required to Continue Providing the Current Level of Service
Transcript of Financial Forecast Overview and Financial Baseline · Web viewThe EIA Report only reflects data for...

Financial Forecast Overview & Financial Baseline
Costs Required to ContinueProviding the Current Level of Service
Prepared for the City Light Review PanelOriginally issued January 2011
Updated January 2012

Seattle City LightFinancial Forecast Overview & Financial Baseline
Table of Contents
Introduction and Executive Summary............................................................................................................21 Industry Context, Cost Drivers & Uncertainty......................................................................................42 Financial Forecast Assumptions..........................................................................................................14
2.1 Capital Program and Deferred O&M...........................................................................................172.2 Debt Service.................................................................................................................................222.3 Non-Power Operating & Maintenance Costs (O & M)...............................................................242.4 Miscellaneous Revenue................................................................................................................262.5 Rate Discounts, Uncollectibles, Taxes and Franchise Payments.................................................282.6 Power Contract Costs and Revenues............................................................................................282.7 Net Wholesale Energy Revenue...................................................................................................302.8 Net Power Marketing Revenues...................................................................................................332.9 Retail Revenue.............................................................................................................................34
3 Key O&M Assumptions (By Expense Type).......................................................................................363.1 Labor and Benefits.......................................................................................................................363.2 Services........................................................................................................................................393.3 City Services, Payments & Rentals..............................................................................................403.4 Maintenance.................................................................................................................................423.5 Supplies & Materials....................................................................................................................433.6 Permits, Injury and Environmental Claims..................................................................................443.7 CIP Overhead and Other Reductions...........................................................................................45
4 Financial Baseline Rate Projection......................................................................................................465 Overall Conclusions.............................................................................................................................51
________________________________Seattle City Light Discussion Document-Not An Official Plan 1

Introduction and Executive Summary
This document was prepared as a part of the 2010-12 strategic planning efforts. The paper describes a baseline cost projection for maintaining status quo City Light operations for 2013-2018. It is not a worst case, or a best case, scenario. The baseline represents the minimum level of near term responsible investments necessary to maintain operations and meet customer demand over the six year forecast period without significantly increasing operating risk. This projection is used as the reference case for the strategic plan.
The strengths, weaknesses, opportunities and challenges (SWOC) exercise1 conducted as part of the strategic planning process recognizes that City Light is well-positioned in certain areas, and has issues to address in others. As an example, with respect to overall cost control, City Light has closely reviewed and controlled spending in the past three years, and Management believes that the baseline spending contemplated in this plan is that which is prudent and necessary to serve customers. However, benchmarking survey results have indicated that opportunities for improvement exist in certain areas. The successes of past and current process improvement efforts remind us that we will always have continued work to do. The benefits from efficiency improvement programs and other significant program changes are not included in this forecast, but the opportunities available from such changes will be addressed through initiatives in the strategic plan. The key finding of this paper is that to maintain our current level of service and programs, rate increases averaging about 4% per year will be required for years 2013-2018. The primary drivers of these increases are:
Several points are important to consider regarding this baseline financial forecast:
It should not be considered a target of where the utility needs to be positioned to best serve customers over this period. In the strategic planning process, we discuss with the Review Panel and City Policymakers numerous strategic initiatives to address the challenges and opportunities the Utility faces in the coming years.
The financial baseline should also not be taken as an indication that no improvement opportunities exist. The results of the baseline rate projection compel us to look for opportunities to reduce costs. Management is confident that there are opportunities to improve efficiency and effectiveness through programs that may require changes in policies and practice. The draft strategic plan contains proposed initiatives to address such opportunities.
1 The full SWOC assessment can be found at www.seattle.gov/light/strategic-plan/docs/challenges.pdf
________________________________Seattle City Light Discussion Document-Not An Official Plan
Rate Driver % of total change in revenue requirement in 2018 vs. 2012
(a) Debt Service (Costs from Funding Capital Program) 52%(b) Non-Power O&M, Taxes and Other 30%(c) Power Costs and Change in Wholesale Revenue 18% Total 100%
2

Actual rate changes for years 2013-2018 may vary to some degree from the figures shown in this document due to:
(1) Inherent uncertainty in cost projections several years out. For example, the baseline provides funding to meet currently known legal and regulatory requirements, but such requirements are subject to change.
(2) The inclusion of strategic initiatives (that may affect costs up or down) as part of the adopted strategic plan for this period.
(3) Financial policy action that may be taken regarding the level of net wholesale revenue to assume when base rates are set, and the extent to which the Rate Stabilization Account (RSA) and rate surcharges will be used to make up shortfalls.
The paper contains five sections:
Section 1 provides an overview of industry cost pressures and trends. City Light’s costs over the past decade for major electric utility spending categories such as production, distribution, transmission and administrative/general expenses have increased at rates comparable to the electric utility industry as a whole. Costs in the future are likely to be impacted by many of the same drivers, such as needed maintenance for reliability and to modernize the grid, environmental regulations, energy price volatility, slackened demand for power due to the sluggish economy and increased conservation, and the need to address an aging workforce.
Section 2 introduces our current key financial modeling elements and their assumptions. To develop this financial baseline, City Light examined historical expenditures, the 2011-2012 budget, the Adopted 2012-2017 CIP, the load forecast, power market forecast, and the underlying drivers and assumptions in all these. The controllable versus non-controllable nature of various expenses, and the volatility and uncertainty around several elements of the utility’s revenue requirement (such as net wholesale revenue) are key issues confronted in this section. In compiling the projection, we revisited assumptions made previously, and made changes where appropriate.
Section 3 provides further detail about the key Operation & Maintenance (O&M) assumptions by expense type. The O&M forecast for 2013-2018 is based on the 2011-2012 Adopted Budget and refined assumptions of growth rates for major components of O&M spending that range from CPI to 8%.
Section 4 provides the results of the baseline projection, and discusses rate drivers.
Section 5 discusses the overall conclusion of the financial baseline exercise.
________________________________Seattle City Light Discussion Document-Not An Official Plan 3

1 Industry Context, Cost Drivers & Uncertainty
Before discussing the specifics of City Light’s cost drivers, we believe it is worthwhile to provide some background information on key electric utility industry concerns and their relevance to City Light.
Several studies are available that discuss electric utility rate pressures in recent years and the top concerns of industry leaders at present. Many of the articles are 4-5 years old and were written to explain a significant increase in rates in 2006-2007. These studies stressed increasing fuel costs (natural gas, oil) and investments to comply with environmental regulation as the main drivers for the rising expenditures among the utilities analyzed. The intervening financial crisis and recession have markedly changed the industry landscape. Post-crisis literature lists green power investments (conservation, energy-efficiency, renewable energy) and Smart Grid costs as the main expenditures that will drive electric utility costs up, along with the additional stress of stagnant or declining demand.
Industry Concerns Pre-Financial Crisis2
Demand for more power and greater reliability will require additional generation, transmission, and distribution investments.
Substantial increases in the costs of building utility infrastructure projects (raw material costs, etc.). Investment and operating costs to comply with known and still uncertain regulatory and
environmental mandates. O&M cost increases (non-fuel) as opportunities for efficiency (e.g., administrative) are exhausted. Swiftly rising fuel and purchased power costs.
Industry Concerns Post-Financial Crisis3 (discussed further below)A. Financial consequences of implementation of improvements/maintenance for reliability, Smart
Grid and cyber security initiatives.B. Cost increases driven by new environmental regulations affecting air, water and hazardous waste. C. Energy price volatility.D. Slackened demand for power due to the sluggish economy and increased conservation.E. Aging workforce.
Consulting firm Black & Veatch published a 2011 Electric Utility Industry Survey which had 700 utility industry participants that included investor-owned utilities (IOUs), public utilities, state and regional power agencies, federal power marketing agencies, merchant and non-regulated generators, consulting firms and other industry representatives.4 Figure 1.1 breaks down survey participants by agency type.
21 Compiled from the following: Rising Utility Construction Costs: Sources and Impacts, 2007 http://www.edisonfoundation.net/Rising_Utility_Construction_Costs.pdf;
Financial Challenges of Rising Utility Costs and Capital Investment Needs, 2006 http://www.brattle.com/_documents/UploadLibrary/Upload398.pdf ; Why Are Electricity Prices Increasing? An Industry-Wide Perspective 2006 http://www.brattle.com/_documents/UploadLibrary/ArticleReport2414.pdfhttp://www.bv.com/energysurvey/
3 Compiled from the following: Utility Financial Performance: Warning Signs Ahead , 2009 http://www.elp.com/index/display/article-display/9451989687/articles/electric-light-power/volume-87/issue- 5/sections/utility-financial.html; 2011 Electric Utility Industry Survey Results, http://www.bv.com/energysurvey/
4 Summary and full survey can be accessed online at http://www.bv.com/energysurvey/ ________________________________
Seattle City Light Discussion Document-Not An Official Plan 4

Almost half of the participants were from IOUs. Municipal utilities accounted for 18.5% of the respondents.
Figure 1.1 Black and Veatch 2011 Survey Participants by Agency Type
Source: Black and Veatch
Participants rated industry issues on a scale from 1 to 5 where 1 is non-important and 5 is very important. Figure 1.2 shows that the top ten concerns for the energy industry participants are: aging infrastructure, reliability, regulation, technology, and the environment. Figure 1.3 shows top ten concerns by IOUs and public utilities. For public utilities, the top five concerns are: reliability, regulation, aging infrastructure, technology, and aging work force.
Figure 1.2 Energy Industry Top 10 Concerns
________________________________Seattle City Light Discussion Document-Not An Official Plan 5

Source: Black and Veatch
Figure 1.3 Top 10 Concerns for IOUs and Public Utilities
Source: Black and Veatch
A. Reliability, Smart Grid and Cyber SecurityThe number one concern cited by public power participants in the Black & Veatch 2011 Electric Utility Industry Survey is reliability. An electric utility is required to have a supply of power available that is sufficient to exceed the highest point of demand. In an economic downturn, when access to capital is constrained, utilities are focusing on making do with what they have to continue meeting the cyclical demands of their customers as opposed to building new baseload generation.
For City Light, the issue of reliability relates more to the condition of our delivery infrastructure assets. Due to recent shortfalls in revenues, we have deferred maintenance on our aged infrastructure. As
________________________________Seattle City Light Discussion Document-Not An Official Plan 6

technological advancements in generation, transmission, and distribution evolve, it is expected that City Light will phase in “Smart” technology by default over the long run. City Light also is required to ensure that information and communication assets are secure from increased cyber security threats.
B. Cost Increases Driven by New Environmental Regulations: Green Power InvestmentsUncertainty surrounding climate legislation hampers utilities’ plans to move forward with major capital programs that are intended to meet current or future demand and/or replace generation assets that are beyond their service life. Compounding concerns are escalating prices for all generation fuels and legislative limitations on wider use of certain fuels (natural gas and petroleum). Finally, ambitious, heavily financed capital expansion could pressure inflation in materials, labor and borrowing costs.
City Light is better positioned than most in this area due to our clean generation sources and carbon neutrality. Rates will be pressured by the cost of compliance with I-937 (requiring increasing procurement of renewable power). Strategic considerations include whether to meet the requirements with renewable energy credits (RECs) or acquiring/constructing qualifying generation.
C. Energy Price VolatilityBetween 2002 and 2008, natural gas prices rose by over 300 percent. Then, in 2009, the price of natural gas fell to roughly half the 2008 level. In 2009, annual average natural gas wellhead prices reached their lowest level in seven years. Increased supply due to the availability of shale gas, coupled with mild winter temperatures and higher production and storage levels, and significant expansions of pipeline capacity worked to put downward pressure on natural gas prices. Each year, the Energy Information Association (“EIA”) produces an annual energy outlook. In an early preview of its domestic energy resources and consumption projections through 2035, the EIA says that “technically recoverable” shale gas resources have doubled in a year’s time “reflecting additional information that has become available with more drilling activity in new and existing shale plays.”5 If economic conditions remain stagnant and production levels stay high, prices could remain low for years to come. City Light’s wholesale revenues have shrunk in recent years due to falling energy prices, so enduring low gas prices are a concern and a contributor to the rate pressure City Light faces. The Rate Stabilization Account (“RSA”) helps reduce the impact of energy price volatility on the Utility’s finances, though reduced wholesale revenues ultimately have to be recovered through higher retail rates.
D. Uncertain DemandUtilities face increasing demands to spend more money on basic infrastructure, energy efficiency, Smart Grid and cyber security. However, their sales – as a result of the very programs they are paying to implement – are declining or flat. This point has also been raised in another paper titled “Return of the Energy Services Model: How Energy Efficiency, Climate Change, and Smart Grid Will Transform American Utilities” written by Peter Fox-Penner from the Brattle Group. Fox-Penner writes that investments in energy-efficiency, to decarbonize power generation, and Smart Grid will require charging current customers more and more for their gradually declining levels of use.
Utilities are worried about the expected ratcheting down of sales growth. About 70% of Black and Veatch 2011 survey respondents expect long-term load growth after recovery from the Great Recession to be less than 1.5 percent per year (see Figure 1.4). This compares with an average of 2.5 percent to 3 percent per year from 2002 through 2008, and even higher growth rates in earlier decades. City Light’s load is fairly stable since our service territory is well established. However, the financial impact of conservation and
5 Energy Metro Desk, December 20, 2010, Volume 2, Issue 24________________________________
Seattle City Light Discussion Document-Not An Official Plan 7

other initiatives will certainly affect City Light customers, given the widening gap between wholesale and retail energy prices. The most recent load forecast predicts that City Light’s retail load will grow at an average of 0.8% per year from 2011 to 2030.
Figure 1.4 Over the next five years, what do you expect the
average annual energy growth to be for your system?
Source: Black and Veatch
Another demand issue that was brought up in the Black and Veatch 2011 survey was the load from electric vehicles. Figure 1.5 shows that the survey participants expect electric vehicle load to account for 8% of total load by 2025.
Figure 1.5Approximately what proportion of your annual load (energy) do you expect electric vehicles to
represent by the end of 2012, 2015, 2020 and 2025?
________________________________Seattle City Light Discussion Document-Not An Official Plan 8

Source: Black and Veatch
E. Aging Work ForceThe aging work force is an important issue that will need to be addressed in the near future as current workers retire and utilities must hire replacements, which in turn will require additional job training and other monetary incentives to attract and retain quality employees. In the Black & Veatch survey, the aging workforce was listed as the #5 concern by public utilities. This is an area of concern for City Light as well; over 50% of the workforce is eligible for retirement within 5 years, and retirements have already increased significantly from past years. The pace of retirements depends on economic conditions. The economic recovery from the most recent recession has been extremely slow, which has had an impact on the number and timing of retirements. Some people who planned to retire are postponing their retirement dates. As the economy picks up, SCL expects the number of retirements to go up.
Discussion of Cost TrendsThe Electric Power Annual 2010 Report prepared by the Energy Information Agency (EIA) summarizes electric power industry statistics at the national level. This report includes O&M expense statistics for major U.S. IOUs for the period 1999-2010, shown below in Figure 1.6. The EIA Report only reflects data for IOUs because EIA stopped collecting this type of data from public utilities in 2004. Thus, there is no data for major U.S. public power utilities past 2003.
Figure 1.6 below shows that production, transmission, distribution, and administrative and general expenses (A&G) have been increasing industry-wide over the last decade. Data shown in Figure 1.6 are a sum of expenses for the major U.S. IOUs. City Light’s costs are also charted using a smaller but proportional scale on these same charts. As shown in Figure 1.6, expenses by IOUs for production, transmission and distribution took a dip after the 2008 recession but increased during 2010. At the same time A&G expenditures have been consistently increasing over the last decade. The general trend in expenditures by SCL follows the industry-wide trend. However, Figure 1.6 illustrates that SCL has been spending less in all four categories since 2008 recession. Information about year-by-year changes in SCL costs are discussed in Section 3 of this document.
________________________________Seattle City Light Discussion Document-Not An Official Plan 9

Figure 1.6Selected Expenses for Major U.S. Investor-Owned Utilities, 1999-2010 (in $ millions)6
Production Expenses ($ Millions)
0
5
10
15
20
25
30
35
1999 2000 2001 2002 2003 2004 2005 2006 2007 2008 2009 2010
SCL
0
20,000
40,000
60,000
80,000
100,000
120,000
140,000
160,000
IOUs
Production - SCL Production - IOUs
Transmission Expenses ($ Millions)
0
2
4
6
8
10
1999 2000 2001 2002 2003 2004 2005 2006 2007 2008 2009 2010
SCL
0
1,000
2,000
3,000
4,000
5,000
6,000
7,000
8,000
IOUs
Transmission - SCL Transmission - IOUs
Distribution Expenses ($ Millions)
0
10
20
30
40
50
60
70
1999 2000 2001 2002 2003 2004 2005 2006 2007 2008 2009 2010
SCL
0
500
1,000
1,500
2,000
2,500
3,000
3,500
4,000
4,500IO
Us
Distribution - SCL Distribution - IOUs
A&G Expenses ($ Millions)
0
10
20
30
40
50
60
70
1999 2000 2001 2002 2003 2004 2005 2006 2007 2008 2009 2010
SCL
0
2,000
4,000
6,000
8,000
10,000
12,000
14,000
16,000
18,000
IOUs
A&G - SCL A&G - IOUs
Figure 1.7 shows a composite of all of these major expense categories (from Figure 1.6), compared against inflation. To make comparison of the expenditures easier, we set values for each category at 1 in 1999.
Figure 1.7Selected Expenses for Major U.S. Investor-Owned Utilities and CPI, 1999-2010
6 Figure 1.6 shows selected expense statistics for major U.S. Investor-Owned Utilities (IOUs) for the period 1999-2010. The EIA Report only reflects data for IOUs because EIA stopped collecting this type of data from public utilities in 2004. Thus, there are no data for major U.S. public power utilities past 2003. The full report can be accessed at http://www.eia.gov/electricity/annual/.
________________________________Seattle City Light Discussion Document-Not An Official Plan 10

0.5
1
1.5
2
2.5
3
1999 2000 2001 2002 2003 2004 2005 2006 2007 2008 2009 2010
1999
=1
ProductionTransmissionDistributionAdministrative and GeneralCPI
Nationwide Rate Increases: History and Projections7
Pace Global, an energy consulting firm, provides, in the figures below, three comparisons of Seattle City Light’s average retail electric rates at the national, regional (WECC) and state level (WA & OR).8 Each comparison shows the aggregate of investor owned utilities and public utilities, including municipal-owned utilities and utility cooperatives, and separates investor owned utilities from publicly owned.
Figure 1.8 (a) compares Seattle City Light’s historical (2006-2011) and projected (2012-2018) rates to the national average and projection. The projection was developed using the EIA November 2011 Short-Term Energy Outlook Forecast, which projects the national average retail rate for electricity to be $0.1004 and $0.1013 per kWh in 2011 and 2012, respectively. Discussions with EIA staff revealed that the EIA 2011 Annual Energy Outlook and the EIA Short-Term Energy Outlook do not include the potential impacts of pending legislation and prospective EPA rules on environmental issues. To determine the potential impact of expected environmental legislation including the final Cross-State Air Pollution Rule (CSAPR), Utility Boiler Maximum Available Control Technology (MACT), the Coal Combustion and Residuals Rule, and the Cooling Water Intake Structure Rule, Pace Global reviewed cost projections developed by private industry coalitions, including U.S. Congressional testimony. These cost projections indicate a range of approximately $20 to $25 billion per year between 2012 and 2015 for capital expenditures and compliance costs related to the EPA rules for air quality, coal combustion residuals, cooling water intakes, and greenhouse gases. Using this information, Pace Global developed a revised projection for national retail electric rates for 2012 to 2018 by estimating the projected cost impacts on average retail electric rates. It should be noted that the EPA continues to modify the implementation rules and schedule of CSAPR, which can impact the future rates.
Figure 1.8Seattle City Light Historical (2006-2011) and Projected (2012-2018)
7 Information is based on the analysis performed by Pace Global for Seattle City Light.8 The American Public Power Association issued a comparison report of 2010 electric retail rates by state and type of utility (public, private, coops). Their report for 2010 provides the same data as the report by the Pace Global.
________________________________Seattle City Light Discussion Document-Not An Official Plan 11

Retail Rates Comparison with National Average
0.00
2.00
4.00
6.00
8.00
10.00
12.00
14.00
2006 2008 2010 2012 2014 2016 2018
¢/kW
h
SCL HistoricalSCL ForecastEIA 2011 Annual Energy OutlookNational Forecast Revised
Figure 1.8 demonstrates that Seattle City Light’s historical average rates have been significantly lower than the national average. Despite the projected increase from approximately $0.07/kWh in 2012 to $0.09/kWh by 2018 (assuming adoption of the strategic plan with proposed initiatives), Seattle City Light’s rates retain a significant cost advantage throughout the 6-year planning horizon compared to the national projection.
Figure 1.9Average Retail Electric RateSeattle City Light vs. WECC
0.00
2.00
4.00
6.00
8.00
10.00
12.00
2006 2007 2008 2009 2010 2011
¢/kW
h
SCLWECC AverageWECC IOU Average WECC Muni & Coop Average
Figure 1.9 compares Seattle City Light’s historical rates to the rates in WECC (the Western Electricity Coordinating Council). Similar to the national comparison, the analysis shows that Seattle City Light’s historical rates compare favorably to the region.
Figure 1.10 shows Seattle City Light’s rates in comparison to the utilities in Washington and Oregon. This analysis shows that Seattle City Light’s rates are lower than other utilities in the Pacific Northwest, but the advantage is smaller than that of the WECC or national comparison. This is explained by the similar reliance on low-cost hydropower across the Pacific Northwest.
________________________________Seattle City Light Discussion Document-Not An Official Plan 12

Figure 1.10Average Retail Electric Rate
Seattle City Light vs. Pacific Northwest (OR/WA)
Average Retail Electric Rate Seattle City Light vs Pacific Northwest (OR/WA)
2006 - 2011
0.00
2.00
4.00
6.00
8.00
10.00
12.00
2006 2007 2008 2009 2010 2011
¢/kW
h
SCLPacific NW(OR+WA) AveragePacific NW(OR+WA) IOU AveragePacific NW(OR+WA) Muni & Coop Average
A recent article published by SNL Financial, “US utilities risk customer wrath from anticipated electric bill increases,” postulates higher electric rate increases in the future due to new environmental regulations (e.g., Cross-State Air Pollution Rule and utility MACT rule), cyber security and grid modernization, together with a possible customer backlash.9 The prediction is that electric rate increases across the U.S. will double in the future and be around 5.5% per year. Utilities for which coal is the main fuel source will have higher rate increases to cover costs of complying with the existing and new environmental requirements.
Pending rate cases demonstrate that the trend of higher retail electric rates is likely to continue, with increases of up to 27% proposed to regulators. The average request pending before regulators is for a 9.6% increase in retail electric rates. Based on the historical average of rate case results since 2007, utilities may ultimately be granted 92% of their request, which translates to roughly an 8.9% increase.
Customers’ dissatisfaction about electric rates depends on how much of their monthly income goes to pay for electricity; the higher the share, the higher the probability of complaints.. The SNL article notes that decisions regarding environmental and other policies made by utilities, regulators and legislators must take customer reaction into account, especially in light of the current sluggish economic growth in the U.S., and seek constructive solutions to keep rates low for consumers, including deferring or modifying rules and regulations that have significant capital requirements.
9 The article is based on the report published by Oliver Wyman energy consulting firm.________________________________
Seattle City Light Discussion Document-Not An Official Plan 13

2 Financial Forecast Assumptions
The City Light financial forecast is based on detailed projections of major revenue and expense categories that determine the Utility’s annual revenue requirement and the resulting rates. The starting point for the projection is City Light’s 2012 budget. The 2012 budget incorporates significant financial discipline that results from significant reductions in the preceding four years. Since 2008, staffing has been reduced by 71 positions, or 4%, from 1,881 to 1,810 (and by 13% since 1991). Controllable O&M has been reduced by $81 million--an average of about $20 million, or 10%, per year. Continuing budget decreases have occurred in areas such as travel, training, consulting, overtime, public outreach, and communication. Budget cuts also include lower cost of living adjustments for staff, no increases in management salaries from 2009 to 2011, and changes in work practices. Employee identification of business improvements in 2010 saved $5.6 million. In the same year, non-represented and Local 17 represented employees volunteered for furloughs resulting in a labor cost reduction of almost 4%.
The financial baseline assumes the same overall of level of services to customers as is provided by the 2012 budget, with the same programs, reliability and response times, including:
Power Supply and Environment Production and purchase of 10 billion kilowatt-hours of clean electricity each year to power all the
homes and businesses (nearly 400,000 customers) in Seattle, Shoreline, Lake Forest Park, Burien, SeaTac, Tukwila and other small parts of King County.
Operation and maintenance of Boundary, Skagit, Cedar Falls and Tolt dams. Environmental and wildlife habitat mitigation required by the new Boundary plant license. Meeting load growth with conservation and renewable power resources, including compliance
with state law (I-937) on acquisition of renewable power resources. A conservation program that saves 14 aMW per year. Greenhouse gas neutrality (entering our 7th year), hazardous waste/Superfund cleanup, water
quality testing, and hundreds of acres of land, fish and wildlife habitat restoration.
Reliability Reliability equal to no more than one outage per year per customer, with a duration of about 70
minutes per customer. Operation and maintenance of 14 large substations and almost 3,000 miles of transmission and
distribution lines. Maintenance of a highly reliable network system that serves customers in high density areas—
downtown, First Hill and University District. 500+ miles of annual tree trimming along power lines, a major contributor to keeping reliability at
a high level. Inspection and treatment of City Light’s 108,000 poles and annual replacement of 2,000 poles. 90% completion rate for streetlight repair response within 10 working days of a reported outage,
as well as replacement of about 15,000 streetlight lamps per year with energy-efficient LEDs.
________________________________Seattle City Light Discussion Document-Not An Official Plan 14

A new work and asset management program to assess and prioritize work on City Light’s most critical assets.
An apprenticeship program that hires and trains 10-20 new apprentices per year. An outage management system that provides customers critical information during outage events.
Customer Service A customer metering and billing system, including an e-billing option, that provides monthly or
bi-monthly bills to all customers. New service connections completed within 40-60 days.
Infrastructure and Support A wide variety of capital projects that maintain and upgrade City Light’s power production,
transmission, and distribution systems. Maintenance of a utility-wide information technology infrastructure and about 125 software
applications, including Web site enhancements, with funding for several key system replacement in the areas of: a customer care and billing, energy management, inventory management, and budgeting.
Staffing of 1,810 authorized positions to perform necessary work in distribution, transmission, generation, conservation, customer service and administration.
Continued compliance with complex federal regulatory requirements regarding system reliability and critical asset protection.
As stated earlier, the baseline represents the minimum level of near-term responsible investments necessary to maintain operations and meet customer demand over the six-year forecast period without significantly increasing operating risk. Accordingly, the costs incorporated are a “status quo” approach to operations, and reflect the cost of continuing business as usual.
The table below outlines the major categories of spending and revenue sources that are included in the revenue requirement, which determines customer rates. The categories are ordered such that areas with the greatest potential to change the rate trajectory are discussed first. Each of these categories will be discussed in detail later in this section; the column at the left denotes the sub-section for each category.
________________________________Seattle City Light Discussion Document-Not An Official Plan 15

Table 2.1Components of Revenue Requirement ($M)
Section Element
2012 Expenses
$M
2012Revenue
$M
Impact on Rates and Rate Increases from
2013-2018Volatility
Capital Spending and Debt Service
2.1Capital Program (CIP) and Deferred O&M
Indirect(Debt
Service)52%
High - Large impact on rates, but indirectly and lagged- via debt service
2.2 Debt Service(Coverage) $312 Large
Medium – Interest rates are an uncertain component, but bond issues are determined by operational decisions.
Non-Power O&M, Taxes and Other
2.3 Non-Power O & M $216 Large
30%
Medium – Some volatile components (city allocations, pensions, healthcare) but changes are driven primarily by program decisions, not uncertain factors.
2.4 Miscellaneous Revenue $39 Small High—Property sales and one-time payments
can be large and are difficult to predict.
2.5Rate Discounts, Uncollectibles, Taxes & Other
$48 Small Low – Follows rates.
Power Costs
2.6Net Power Contracts Expense
$255 Large
18%
Medium— Most contract terms are known, but some costs (such as BPA) have long-term uncertainty.
2.7 Net Wholesale Energy Revenue $102 Med/
High
High – Hydroelectric generation volumes and market prices are major unknowns. The Rate Stabilization Account buffers this.
2.8Net Power Marketing Revenues
$9 SmallMedium – Small source of revenue, but could swing by $5-$10 M depending on market opportunity.
2.9 Retail Revenue $681 naLow—% volatility is small, but because of the sheer size of this category, the overall impact of small changes can be nontrivial.
Total $831 $831
Data for the table and chart above is based on the 2012 retail revenue requirement.
Figure 2.1 illustrates the relative magnitude of revenue and expense components. Every utility, including City Light, has a unique profile of revenue and expense sources. Wholesale revenue is a larger component of revenue for City Light than for most utilities because of City Light’s low cost hydro generation
________________________________Seattle City Light Discussion Document-Not An Official Plan 16

resources and net surplus position, though it’s relative size has shrunk in recent years because of falling market prices. However, it is a smaller percentage of total revenue compared to very hydro-centric public utilities such as Chelan PUD with a relatively small customer base. On the expense side, debt service is a growing expense component since SCL’s debt load is increasing; the reasons for this are discussed in Section 2.1 and 2.2 of this document.
Figure 2.1Composition of Expenses and Revenues - 2012 ($M)Make Up of Expenses and Revenues
Retail Revenue
Debt Service
O & M
Net Power Contracts
Wholesale Revenue, Net
Power Marketing Revenues,
Net
Miscellaneous Revenue
$-
$100
$200
$300
$400
$500
$600
$700
$800
$900
Expenses Revenues
$M
Miscellaneous Expense
Labor
Non-Labor
Make Up of Expenses and Revenues
Retail Revenue
Debt Service
O & M
Net Power Contracts
Wholesale Revenue, Net
Power Marketing Revenues,
Net
Miscellaneous Revenue
$-
$100
$200
$300
$400
$500
$600
$700
$800
$900
Expenses Revenues
$M
Miscellaneous Expense
Make Up of Expenses and Revenues
Retail Revenue
Debt Service
O & M
Net Power Contracts
Wholesale Revenue, Net
Power Marketing Revenues,
Net
Miscellaneous Revenue
$-
$100
$200
$300
$400
$500
$600
$700
$800
$900
Expenses Revenues
$M
Miscellaneous Expense
Labor
Non-Labor
Key Points: Major determinants of rates are:
o Debt service and coverage (paying bondholders for borrowed funds for past capital spending, and the additional collection for debt service coverage that funds current year capital expenditures)
o Power costso O&M
Labor costs are a relatively small portion of the overall revenue requirement (about 14-15%, or about 20% with benefits), which is the inverse of most other City Departments, where labor costs are about 85% of their total budgets.
Most items on the “Expense” side of Figure 2.1 above are relatively (non-power O&M) or entirely (Debt Service) fixed, while Net Wholesale Revenue is highly variable (though the implementation of the Rate Stabilization Account will allow the Utility to depend on a budgeted amount of Net Wholesale Revenue).
2.1 Capital Program and Deferred O&MThe Utility develops and submits for City Council approval a Six-Year Capital Improvement Plan (CIP) that is rolled forward one year at a time as part of the annual budget process. The Six-Year CIP is updated based on input from capital project managers and reviewed by SCL Officers. Figure 2.2 shows the annual cash requirements that are used in the rate forecast.10
10 Typically, cash dollars lag budget dollars somewhat, as budget dollars can be encumbered and carried forward to future years. To make multi-year comparisons more understandable, amounts are presented in constant dollars. A discussion of the impact of inflation and spending trends can be found later in the section.
________________________________Seattle City Light Discussion Document-Not An Official Plan 17

As part of the financial baseline exercise described in this document, SCL Officers reviewed and adjusted the Six-Year CIP to ensure that the current level of service would be maintained. This involved removing some projects which could reasonably be deferred, while supplementing the budget in out years to ensure appropriate maintenance of facilities.
This spending category also includes Deferred O&M, which may be funded with debt like CIP. Deferred O&M is comprised of Conservation, Toxic Cleanup, High Ross costs, project license costs for Skagit and Boundary environmental mitigation, and Endangered Species Act mitigation. Some deferred O&M spending is related to relatively non-controllable costs associated with the licensing of generation facilities and federally mandated cleanup of Superfund sites. Conservation costs are more controllable, and are based on a forecast provided by the Conservation Division. The forecast reflects the expenditures necessary to comply with I-937, and as a result, expenditures in 2013-16 are higher than in the current 5-year Conservation Plan that runs through 2012.
This category also includes Contributions in Aid of Construction (CIAC), capital grants and miscellaneous funding for deferred O&M projects, which are offsets to spending. These are any payments received from outside sources to help pay for capital projects. CIAC sources are customers and private organizations that represent them, while grant sources are public entities such as federal, State and local government agencies. Forecasted grant funds are currently from a single source, Sound Transit. In addition, City Light anticipates receiving federal funding for Conservation from the Bonneville Power Administration.
The total six-year capital program of $1,618 million, including $1,238 million from the baseline CIP and $380 million from the Deferred O&M forecast. The baseline CIP is from the Six-Year CIP Plan for 2012-2017, plus a preliminary estimate for 2018 developed as part of the CIP process.
Table 2.2 Strategic Plan Baseline Six-Year Capital Program (Constant 2011 $ in Millions)
2013 2014 2015 2016 2017 2018 TotalCustomer Focused Customer and Billing 6.8 8.0 1.0 0.0 0.0 0.0 15.9
Customer Other 0.1 0.1 0.1 0.1 0.1 0.1 0.3Local Jurisdictions 13.2 10.0 8.9 4.3 4.0 4.0 44.5Service Connections 33.8 33.0 33.0 33.0 32.9 33.1 198.8Transportation Relocations 34.7 22.3 25.3 10.3 21.4 25.1 139.1
Finance and Technology Finance and IT Systems 9.2 9.4 9.1 5.5 5.6 5.6 44.3Power Supply & Environmental Affairs Boundary 52.9 47.4 36.9 47.2 29.1 34.9 248.3
Cedar Falls - Tolt 3.7 3.0 2.2 2.4 2.4 2.4 16.2Fleets and Facilities 13.4 13.6 10.0 9.9 8.5 8.5 64.0Power Supply Other 5.0 5.1 3.8 2.8 1.7 1.7 20.1Programmatic Conservation 38.2 38.3 40.0 40.0 40.0 40.0 236.3Skagit 8.2 16.6 20.7 19.1 20.0 20.0 104.7Toxic Cleanup 12.5 6.3 4.3 1.6 1.6 4.2 30.5
Transmission and Distribution Distribution Other 8.7 5.1 4.7 4.1 3.6 2.9 29.1Network 12.0 11.5 13.1 13.1 13.1 11.1 74.0Radial 33.3 37.1 34.0 35.3 35.6 33.2 208.6Substations 24.4 18.0 22.5 21.8 20.9 20.2 127.9Transmission 2.5 2.5 2.5 2.5 2.5 2.5 15.0
Grand Total 312.6 287.4 272.1 253.1 243.0 249.4 1,617.7
Table 2.3 contains high level descriptions of critical capital projects that are funded under the 6-year financial baseline and projects that are not funded. Note that the list of non-funded projects provided here
________________________________
Seattle City Light Discussion Document-Not An Official Plan 18

is far from comprehensive; these and other new capital initiatives will be discussed in greater detail in the Strategic Plan.
Table 2.3CIP Critical Project Descriptions and Projected Spending
Key Capital Programs Included in Financial Baseline Cost 2013-2018($M)
Addresses SWOC Issues11:
Alaskan Way Viaduct utility relocations $84.2 Aging infrastructure
Replace obsolete customer information system, automate manual processes and provide easier rate design and implementation. $15.9
Customer communication, Lagging technology
Substation automation (pilot program and complete program) $21.5 Aging infrastructure Recurring infrastructure replacement (e.g., poles, cable, transformer replacements) and customer connection continued at 2012 budget levels: $606.5 Aging infrastructure
o Infrastructure - General $139.2
o Infrastructure - Cable Injection $30.1
o Infrastructure - Connections $218.5
o Infrastructure - Network $74.0
o Infrastructure - Poles $38.5
o Infrastructure - Substations $106.3 Mobile Workforce Technology Implementation (enables real time dispatch for planned and emergency work) $4.0 Lagging technology
Distribution Automation (enhanced outage restoration) $5.6 Aging infrastructure Completion of projects currently underway: Aging infrastructure
oMercer Corridor West Relocation $5.6
oWork and Asset Management System $1.6 Boundary Rebuilds for Units 55, 56, 53, 54, 51 and Diablo Rebuilds for Units 32 and 31 $53.1 Aging infrastructure
Miscellaneous generation projects* $302.4 Aging infrastructure
Equipment and vehicle replacement program $45.0 Aging infrastructure
Conservation programs (includes deferred O&M) $238.6 I-937 costs
Boundary – Transfer Blocks 151-156 Rock Damage Mitigation $14.8
Skagit Housing - demolition and upgrades $4.0 Aging infrastructure
Skagit Sewer - Ecology mandated, decommission treatment facilities $3.3 Regulatory requirements
Skagit energy conservation - retrofits for remaining buildings only $0.0 Aging infrastructure
Anticipated Capital Project NOT Included in the Financial Baseline Cost 2013-2018($M)
Automated Metering Infrastructure (AMI) $90-$130
11 The full SWOC assessment can be found at www.seattle.gov/light/strategic-plan/docs/challenges.pdf________________________________
Seattle City Light Discussion Document-Not An Official Plan 19

Key Capital Programs Included in Financial Baseline Cost 2013-2018($M)
Addresses SWOC Issues:
Puget Sound Area transmission congestion mitigation projects $15-$25
North Downtown Substation $45-$65
North Downtown Network $50-75
Electrification of transportation Unknown
Feeder energy efficiency work $50-$85 Previously-unidentified replacements and refurbishments discovered via new asset management program. TBD/~$25
*Includes: Ross Rock Slide Area Improvements, headgate hoist room upgrades, electrical systems upgrades and minor improvement projects at Boundary, special work at Plants and Shops, access road and forebay paving, overflow dike improvements, continuation of Oil Containment Improvements, completion of Gen 20 Support Facility Rebuild, FERC mandated Ross Dam - AC/DC Distribution System Upgrade, and minor improvement programs at Skagit.
Long Term Perspective and Change Analysis
City Light’s CIP spending is projected to be higher in the period ahead than in preceding years. Comparing average annual CIP for the period from 2004-10 ($144 million) vs. 2011-18 ($252 million) shows an increase of 75% or $108 million per year. Of that, 28% relates to inflation, and the balance of 47% represents real growth in spending. Major drivers of the increase include:
1. Relocation of City Light transmission and distribution facilities required by the Alaskan Way Viaduct replacement and Mercer Corridor realignment.
2. Equipment and facilities rehabilitation and improvements at Boundary, including Generator Rebuilds, Runner Replacements, Rockfall Mitigation, and relicensing.
3. Distribution system renewals including substation automation and transformer replacement, wood pole replacement, cable injection, and replacement of sodium vapor streetlights with LED lights.
A chart showing historical CIP spending, proposed spending in future years, and proposed spending with adjustments for the three major drivers just noted follows. With adjustments for the three significant factors not present in previous years, the spending levels are comparable to the past twenty years. Additionally, it should be noted that the period following the 2000/01 energy crisis saw the Utility restrict capital spending to an unsustainable level in response to severe funding shortfalls and rate pressures.
Figure 2.2
________________________________Seattle City Light Discussion Document-Not An Official Plan 20

Historical and Proposed CIP with and without Major DriversCIP Expenditures & Proposed -- Constant 2011 $s
0
50
100
150
200
250
300
1992
1993
1994
1995
1996
1997
1998
1999
2000
2001
2002
2003
2004
2005
2006
2007
2008
2009
2010
2011
2012
2013
2014
2015
2016
2017
2018
$s in
Ms
CIP
6yr Avg
w/o AWV Mercer
w/o Bound Gen Runn Rock Lic
w/o Dist Renewal
An overview of the increase in average annual spending in the years ahead versus much of the past decade is contained in the table below. The categories containing the three major drivers are highlighted.
________________________________Seattle City Light Discussion Document-Not An Official Plan 21

Table 2.42011-2018 Changes in Average Annual CIP Spending
In thousands of 2011 constant dollars
Explanation 2004-2010
2011-2018
$ Change
% Change
INCREASES1. Power Supply: Boundary Generator Rewinds, Turbine Runners,
Transformers, Boundary Rockfall. $4,530 $25,055 $20,526 453%2. Finance and IT Systems Replacement of Energy Management
System, Inventory, and Budget Systems 3,091 7,489 4,399 142%3. Customer Focused:
Transportation Relocations Primarily Alaskan Way Viaduct, Mercer Corridor Relocations. 11,968 28,669 16,701 140%
4. Customer Focused: Other 254 484 230 90%5. Power Supply: Cedar Falls -
Tolt Penstock Stabilization
1,470 2,463 993 68%6. T&D: Substations Transformer Replacement, Substation
Automation 13,834 21,562 7,728 56%7. Power Supply: Fleets and
Facilities Vehicle Replacement (deferred), Spokane Street Exit, Workplace Improvements 7,694 11,756 4,062 53%
8. Customer Focused: Local Jurisdictions
Shoreline, LED Streetlights7,546 10,084 2,537 34%
9. T&D: Radial Wood Pole Replacement Program, Cable Injection Program 29,299 37,921 8,621 29%
10. Customer Focused: Customer and Billing
Replacement of CCSS1,701 2,112 412 24%
11. Customer Focused: Service Connections
Electronic Meters28,398 34,207 5,809 20%
12. Power Supply: Skagit Diablo Generator Rebuilds 14,498 16,723 2,225 15%13. T&D: Transmission 2,513 2,866 352 14%DECREASES14. T&D: Network 16,180 12,777 (3,403) -21%15. Power Supply: Other 4,507 3,616 (892) -20%16. T&D: Distribution Other 7,595 7,019 (577) -8%Total CIP 152,552 224,800 72,248 47%
2.2 Debt ServiceThe capital program impacts rates through the debt service on bonds issued to pay for the capital projects. Debt service is calculated for all bonds outstanding and projected for the future. For existing bonds, principal and interest is based on actual bond parameters. For future years, the model assumes debt is issued whenever the operating cash balance falls below $50 million, and the size of the forecasted bond issue is determined by the capital spending requirements for the subsequent 12 months. Therefore, the model assumes fairly frequent bond issues, about one each year.
Table 2.5 shows total debt service, as well as debt service coverage. Because SCL financial policy calls for sufficient revenue to cover debt service 1.8 times, one dollar in debt service impacts the revenue requirement by 1.8 dollars. Therefore, the coverage requirement is the amount that is indicative of the magnitude of rate impact.
Table 2.5________________________________
Seattle City Light Discussion Document-Not An Official Plan 22

Debt Service and Coverage Requirements ($M)$M 2009* 2010* 2011 2012 2013 2014 2015 2016 2017 2018Debt Service $144.9 $118.4 $142.1 $172.8 $177.9 $196.6 $211.3 $222.0 $226.5 $235.5 Coverage at 1.8x $260.8 $213.1 $255.7 $311.1 $320.3 $353.9 $380.4 $399.6 $407.6 $423.9 2009 and 2010 reflect actuals, not revenue requirement. 2010 debt service was substantially lower than expected due to refunding savings.
It is assumed that future bonds will be issued with a 25 year term (consistent with past practice), with a 5% interest rate, which approximates the historical interest rate on debt already issued. Actual interest rates on bonds issues may vary from this.
Figure 2.3Debt Service by Bond Series ($M)
0
50
100
150
200
250
2009 2010 2011 2012 2013 2014 2015 2016 2017 2018
$M
Refunding Savings2010 and 2011
Forecasted Bonds2013-
Planned 2012 Bond$200 M
New Money 2011Bond
Refunding 2011Bond
New Money 2010Bond
Refunding 2010Bond
Bonds Issued 1997-2008
Total Debt Service
Total Debt Serviceon Existing Debt
Figure 2.3 shows that total debt service is rising in the future. There are several reasons for this apart from increased capital spending. First, low wholesale revenues in 2009 and 2010 meant that a larger portion than normal (77%) of capital requirements for these years was financed via bond proceeds. This increased borrowing in 2010 and 2011 over expected levels, resulting in increasing debt service beginning in 2012. Second, the 2010 financial policy change from 2.0 to 1.8 times coverage means that going forward, City Light will finance a larger portion of CIP with debt than when the 2.0 debt service coverage standard was in place. . A lower coverage ratio translates to lower retail rates in the short run, and less cash from operations to fund CIP. However, increasing debt service will increase rates in the long run. Lastly, a large amount of debt was refinanced in 2010 to take advantage of low market rates. The $57 M in refunding savings were front loaded into 2010 and 2011 to provide cash for initial funding of the RSA, offsetting the rising debt service due to new debt until 2012-13.
Debt service and coverage needs are a major driver of rate increases in the coming years. This category accounts for 52% of the rate increases for 2013-2018.
Despite this, City Light’s debt burden will continue to be prudent and manageable. City Light’s debt to capitalization continues to gradually decline in the coming years, despite an increase in the absolute dollar
________________________________Seattle City Light Discussion Document-Not An Official Plan 23

value of debt. The pace of this decline in debt to capitalization is governed by the size of the capital spending program, and how that capital program is funded—the mix of customer collections and additional bond issuances. The financial policy of 1.8 times debt service results in taking on more debt over time than the previous financial policy of 2.0 times debt service coverage. The excess above 1.0 times is used to finance the capital program. The higher the excess, the less additional debt the Utility takes on. As a result, the times coverage financial policy governs the trajectory of how much debt the utility takes on, and also governs the slope of how rates will change over time.
Figure 2.4Impact of Debt Service Coverage Policy on Key Financial Measures
Revenue Requirement
$600
$700
$800
$900
$1,000
2010 2011 2012 2013 2014 2015 2016 2017 2018
$M
2.0x1.8x
Debt to Capitalization
45%
50%
55%
60%
65%
2010 2011 2012 2013 2014 2015 2016 2017 2018
$M
2.0x1.8x
Key Points: In addition to increased spending in the current 6-year CIP versus the comparable past period, debt
service is rising because of: (1) higher debt issues in recent years due to low wholesale revenue; (2) the financial policy change from 2.0x to 1.8x; and (3) bond refunding savings temporarily reducing debt service in 2010-2011.
Despite rising debt service, City Light’s debt to capitalization ratio is still projected to decrease. The 2010 bond refinancing saved rate payers $57 M. Reducing projected capital spending would reduce the amount of new debt City Light would need
to issue. Reducing the capital spending budget by $75 million annually reduces the amount of necessary rate increases by about 1% per year.
2.3 Non-Power Operating & Maintenance Costs (O & M)Sections 2.3, 2.4, and 2.5 discuss non-power O&M, miscellaneous revenues, and miscellaneous uncontrollable expenses such as taxes. Grouped together, these three categories account for 30% of the increase in rates from 2012-2018.
Table 2.6Non-Power O&M and Other Miscellaneous Revenues and Costs
________________________________Seattle City Light Discussion Document-Not An Official Plan 24

as Driver for Change in Revenue Requirement from 2012 to 2018
Rate Driver ReferenceSection
Change in revenue requirement in 2018 vs.
2012 ($M)
% of total change in revenue requirement
Non-power O&M due to inflation 2.3 $53.1 25%Miscellaneous revenues 2.4 -$4.2 -2%Taxes and other costs 2.5 $15.2 7%Total Change from 2012 to 2018 $64.1 30%
Non-power O&M in aggregate has grown historically at a fairly steady rate, and the forecasted baseline trajectory is slightly lower than the historical rate of increase. This is illustrated in Figure 2.5, which shows actuals through 2010 and forecast values for 2011-2018. From 2002-2009, O&M increased annually at 6% on average, while for 2013-2018 the annual rate of growth is assumed to be somewhat lower, at 3%.
Figure 2.5O&M Historical and Forecast
$-
$50
$100
$150
$200
$250
$300
$350
2002
2003
2004
2005
2006
2007
2008
2009
2010
2011
2012
2013
2014
2015
2016
2017
2018
$M
2010 Revenue Requirement
Actuals and Forecast
6% Growth 3 % Growth
O&M for 2011 and 2012 reflect the Adopted Budget, which included approximately $4.5 million in continuing cuts from 2010, new funding for restored programs originally cut in 2010, and some new programs. The 2011-12 Budget included:
Restored programs including generation facility maintenance, tree trimming, and funding conservation back to the 5-Year Conservation Plan level.
New funding for work and asset management, increased software and IT costs, and higher payments to other City Departments for services and pensions.
To help smooth rate increases across the two years, approximately $5 million in 2012 A&G expenses were frontloaded into 2011. This helps to explain the large increase in 2011 vs. 2010.
Budget changes for ongoing expenses were continued into 2013-2018 using inflation factors discussed later in this section. Increases in non-power O&M account for about $53 M in increased revenue requirement between 2012 and 2018, as shown in Table 2.6. The vast majority of this change comes from inflation. The policy decision to defer future environmental superfund cleanup expenses also accounts for
________________________________Seattle City Light Discussion Document-Not An Official Plan 25

a small portion of this change; around $3 million of direct O&M is forecast for superfund cleanup in 2012 and none is assumed in the future (since it will all be deferred).
Figure 2.7 shows non-power O&M and its various components. Non-power O&M only makes up 26% of total (2012) expenditures, with debt service and power costs making up the remainder. The bar chart in Figure 2.6 shows the components of non-power O&M by budget expense type. The budget includes labor overhead and other costs that are ultimately capitalized and excluded from O&M; therefore, they are deducted from the O&M forecast, as shown in the striped bar at the bottom of the O&M breakout.
Figure 2.6Non-Power O&M by Category – 2012
Non-Power O&M26%
Power Contracts and Misc Expense
37%
Debt Service Coverage37%
Labor 15%
Benefits 7%
Maintenance 2%
Supplies 1%
Services 5%
City Services 4%
Permits and Toxic Cleanup 2%
Capitilized Overheads and Other Adjustments -10%
Assumptions for inflators for various components of O&M are discussed in detail in Section 3.12 Some components are assumed to grow at the overall inflation rate (CPI), or at a rate slightly higher than inflation. Others, such as medical benefits and field supplies, are expected to grow at rates higher than inflation. Note that though the O&M costs are forecast as specific dollar amounts, they are not a budget but merely point estimates representing a considerable range of cost uncertainty. Table 2.7 summarizes the inflators used for various O&M components.
Table 2.7Growth Assumptions for O&M Categories
12 O & M costs are forecast in the Utility’s financial model in six categories: production, transmission, distribution, non-programmatic conservation, customer accounting and administration. These categories are based on FERC accounting codes to aid in tracking with accounting actuals and are not affected by any reorganizations that the utility and other organizations periodically undertake. To assist in aligning spending with Officers’ budget control areas, the Strategic Plan O&M baseline was developed using Budget categories, not FERC accounting categories. This section will discuss O&M in terms of Budget categories, but because of the data conversion issue just noted, O&M spending is aggregated into a single line in some of the charts used in this document and in the Utility’s financial forecast model.
________________________________Seattle City Light Discussion Document-Not An Official Plan 26

Section O&M Category 2013-2018 Growth Rate3.1 Labor CPI+1%3.1 Labor Benefits (medical, pension, etc.) 5.6%3.1 Benefits - Business Units CPI3.2 Services CPI3.3 City Services, Payments & Rentals CPI3.4 Maintenance CPI+1%3.4 Maintenance – Data Processing (IT) 3%3.5 Supplies & Materials CPI3.5 Operating Supplies & Inventory (Field Supplies) 8%3.6 Toxic Clean Up Direct Forecast3.6 Permits 5%3.7 CIP Overhead and Other Reductions na
CPI ForecastCity Light's inflation forecast is updated annually. Typically City Light uses the official City forecast for the next year or two, to align with City Budget assumptions. For out years, inflation is based on local economist Dick Conway's forecast for the Puget Sound Region (this forecast is commonly used throughout the Seattle area).
Table 2.8Inflation Forecast
2012 2013 2014 2015 2016 2017 2018% Change in CPI 1.74% 2.01% 2.07% 2.13% 2.21% 2.37% 2.35%
Key Points: In total, non-power O&M changes from 2013 to 2018 drive about 25% of the change in the
revenue requirement for City Light, as illustrated in the Table 2.6.
2.4 Miscellaneous RevenueCity Light realizes relatively small amounts of revenue from sources other than retail energy sales and wholesale energy sales. These miscellaneous revenues are shown in Table 2.9 and are estimated based on the best information available. These include: sales of property, investment income, suburban undergrounding payments, operating fees and grants, distribution capacity charges, retail green power programs, and power factor charges.
Table 2.9Miscellaneous Revenue ($M)
________________________________Seattle City Light Discussion Document-Not An Official Plan 27

2009 2010 2011 2012 2013 2014 2015 2016 2017 2018Sale of Property $1.0 $0.1 $2.5 $2.3 $1.1 $1.1 $1.2 $1.2 $1.2 $1.2 Investment Income $4.1 $3.8 $4.5 $10.7 $7.1 $8.9 $11.7 $13.1 $13.6 $13.4 Suburban Undergrounding $0.3 $0.4 $0.7 $0.9 $1.1 $1.3 $1.4 $1.5 $1.5 $1.6 Operating Fees and Grants $1.7 $3.0 $0.3 $0.1 $0.0 $0.0 $0.0 $0.0 $0.0 $0.0 Distribution Capacity Charge $1.6 $0.2 $0.2 $0.2 $0.2 $0.2 $0.2 $0.2 $0.2 $0.2 Green Power Programs $1.4 $1.3 $2.5 $3.1 $2.8 $2.9 $1.8 $1.8 $1.9 $1.9 Power Factor Charges $2.6 $2.5 $2.7 $2.7 $2.6 $2.6 $3.0 $3.0 $3.1 $3.2 Other Revenue (Expense) $21.3 $24.0 $21.2 $21.6 $22.1 $22.7 $23.2 $23.7 $24.3 $24.9 RSA Surcharge $0.0 $18.4 $0.0 $0.0 $14.0 $11.1 $1.1 $0.0 $0.0 $0.0 Cash Transfers from (to) RSA $0.0 ($54.3) ($22.0) ($2.9) ($14.0) ($12.1) ($3.8) ($3.2) ($3.3) ($3.4) Total $33.9 ($0.7) $12.6 $38.8 $37.2 $38.8 $39.7 $41.4 $42.5 $43.0
The timing of property sales is uncertain since the Utility has a large portfolio of surplus land, a single sale could be worth millions of dollars, and the property disposition process is lengthy. Property sales are generically assumed at about $1 million per year in out-years. The baseline estimate of revenues from land sales is conservative, and does not include a potential $30 million property sale (8th & Roy St.) that City Light’s Real Estate Division is tentatively projecting for 2014. A sale of this size would substantially reduce the revenue requirement for that year.
Miscellaneous revenue sources (shown in the Other Revenue (Expense) line in Table 2.9) are indexed to simple indicators such as inflation or number of accounts. These include: late payment fees, damages to property, property rental income, transmission attachments and cell sites, pole attachments, account change fees, and a placeholder for additional retail revenue received from reduced current diversion.
Revenue from and transfers to the RSA are also included in Miscellaneous Revenue. Transfers include interest earned, as well as the one-time transfers to initially fund the account in 2010 and 2011. RSA surcharges are projected for years where the forecasted net wholesale revenue deviates from the RSA baseline. This is discussed further in Section 2.7 and in Section 4.
Key Points: Miscellaneous revenues are projected to increase slightly over the 2013-2018 period, reducing the
revenue requirement by around 2%. An expedited process to sell surplus properties could generate revenue to reduce pressure on rates.
The current property disposition process is lengthy, reducing revenue opportunities that could potentially reduce pressure on rates.
For 2010, City Light identified numerous opportunities to increase miscellaneous revenues, and these increases have been incorporated into the forecast.
2.5 Rate Discounts, Uncollectibles, Taxes and Franchise PaymentsThere are a number of costs that tend to increase steadily with rates. Discounts for rate assistance for low income customers, uncollectible revenue, and State and City Taxes are all modeled as a percentage of revenues. Payments to Suburban Franchises are determined by long term agreements with the various franchise areas. In the table below summarizes these costs; in total they account for roughly 7% of the
________________________________Seattle City Light Discussion Document-Not An Official Plan 28

increase in the revenue requirement over the 2013-2018 period. Note City Taxes are shown, but are separate from other costs. City Taxes are not part of the debt service coverage calculation and therefore are not a direct driver of the revenue requirement.
Table 2.10Taxes, Rate Discounts and Uncollectibles ($M)
2009 2010 2011 2012 2013 2014 2015 2016 2017 2018Rate Discounts $5.4 $6.4 $6.8 $7.2 $7.2 $7.7 $8.2 $8.5 $8.9 $9.2Uncollectible Revenue $5.3 $8.0 $5.9 $6.2 $6.3 $6.7 $7.1 $7.4 $7.7 $8.0State Taxes and Franchise Payments $28.6 $31.7 $32.9 $34.4 $37.2 $39.5 $41.0 $41.9 $43.9 $45.7Total $39.2 $46.2 $45.6 $47.8 $50.7 $54.0 $56.3 $57.8 $60.5 $63.0 City Taxes $33.7 $38.7 $40.7 $42.8 $44.2 $47.2 $49.0 $51.1 $53.9 $56.2
2.6 Power Contract Costs and RevenuesCity Light serves customer energy demand through a variety of power supply sources. The three primary sources of supply are the Skagit Project and Boundary generating facilities, and a long term Bonneville Power Administration (BPA) power supply agreement. City Light’s BPA agreement is comprised of both a fixed (Block) amount of power supply and a variable (Slice) component. As illustrated in Figure 2.8, these three sources make up over 90% of City Light’s power supply portfolio. Figure 2.8 also illustrates that City Light has an anticipated surplus of power under normal water conditions.
Excess or surplus power from City Light’s power supply portfolio is sold into the wholesale power market. The actual amount of power produced by hydro resources is very uncertain. Figure 2.8 reflects average water assumptions, so actual generation amounts could be greater or less than the amounts shown.
________________________________Seattle City Light Discussion Document-Not An Official Plan 29

Figure 2.7Generation Resources (aMW)
-
200
400
600
800
1,000
1,200
1,400
1,600
aMW
Renewables 43 49 53 55 60 60 60 60 58 57
Contracts & Small Hydro 62 76 68 72 72 72 72 73 89 87
Skagit 246 261 281 279 279 279 279 280 279 280
Boundary 412 357 435 438 440 439 439 439 438 439
BPA Block 238 237 240 253 278 278 278 279 278 278 BPA Slice 379 360 404 296 290 296 290 296 289 296
Load 1,167 1,141 1,161 1,178 1,175 1,183 1,191 1,199 1,207 1,214
Surplus 213 200 320 216 244 242 228 226 225 224
2009 2010 2011 2012 2013 2014 2015 2016 2017 2018
Table 2.11 summarizes costs for contracted generation resources, and revenues from long-term power delivery contracts. These resources supplement City Light’s owned resources, such as Skagit and Boundary. The generation output from owned resources are shown in Figure 2.8, but the bulk of the costs associated with operating these resources are considered non-power O&M (labor, materials) or CIP, and are not found in this section.
Table 2.11Power Contract Costs and Revenues ($M)
2009 2010 2011 2012 2013 2014 2015 2016 2017 2018Revenues BPA Credits $16.8 $11.9 $11.3 $9.4 $9.0 $9.1 $9.2 $9.3 $9.4 $9.5 Priest Rapids $5.4 $6.4 $8.2 $9.5 $5.2 $5.5 $5.9 $6.3 $6.7 $7.0 Boundary-Rel. Sales $1.7 $1.6 $1.7 $1.7 $1.7 $1.7 $1.8 $1.8 $1.9 $1.9 Total $23.9 $19.8 $21.2 $20.6 $15.9 $16.4 $16.9 $17.4 $17.9 $18.4 Costs Bonneville $164.6 $169.3 $165.9 $152.9 $158.6 $162.3 $165.0 $169.4 $172.1 $177.0 Small Hydro $25.4 $32.5 $26.3 $36.0 $25.7 $25.8 $26.2 $26.6 $35.3 $36.4 Renewables $20.0 $23.9 $27.0 $30.6 $34.6 $34.9 $35.2 $35.5 $34.6 $33.3 Planned Renewables $0.0 $0.0 $1.8 $3.7 $1.9 $1.9 $2.0 $2.0 $2.1 $2.1 Wheeling & Fees $46.6 $43.1 $51.9 $51.8 $50.6 $51.9 $52.5 $54.0 $54.7 $56.3 Total $218.5 $268.9 $272.9 $275.0 $271.4 $276.8 $280.8 $287.5 $298.8 $305.2
Key Points:________________________________
Seattle City Light Discussion Document-Not An Official Plan 30

Since the 2000-2001 Energy Crisis, City Light’s strategy is to be long on power—i.e., to have more power available through generation and guaranteed power contracts than needed to meet system load in typical years. This is intended to protect customers from exposure to high wholesale prices if the Utility experiences a poor water year.
Long-term power purchase contracts make up a little more than half of City Light’s resources. The majority of City Light’s long-term purchased power comes from BPA Block and Slice
contracts. Less power is being received from the new BPA contract that started in October 2011. BPA rates are subject to change every two years and are likely to increase at or above the rate of
inflation through the study period. BPA power cost changes are automatically passed through to City Light customers and are assumed to grow with inflation.
City Light evaluates future resource needs through the Integrated Resource Plan (IRP). The IRP is based on an estimate of power generation that City Light can meet with 95% certainty.
Given City Light’s current generation capacity and existing power contracts, the IRP anticipates meeting load growth primarily through energy conservation efforts over the next 10 years.
Conservation is a “virtual power plant”, a cost-effective means to meet load growth when compared to the cost of acquiring new sources of energy. City Light began focusing on conservation in the 1970’s in response to the OPEC energy crisis and to avoid costly investment in nuclear projects (WPSS).
City Light will need to continue conservation efforts to meet IRP goals and offset future load growth.
Transmission costs are likely to increase to address regional transmission constraints and decrease the risk to deliver power from the congested Puget Sound Area Northern Intertie (PSANI).
New green energy resources (“Planned Renewables” line in Table 2.11 above) acquired to comply with I-937 will carry a premium over typical market costs, and will be more costly than City Light’s current resources. To meet I-937 requirements at least cost, City Light plans to primarily purchase renewable energy credit (REC) purchases rather than actual green resources.
It is a policy of City Light to be a net-zero emitter of GHG. City Light purchases carbon offsets to balance the non-hydro portion of City Light’s power portfolio (i.e., the portion of BPA’s power that is not hydro) and utility operations (vehicles and other). The cost of this program is projected to be approximately $1M per year.
2.7 Net Wholesale Energy Revenue Since City Light’s power generation is based on river flows, maintaining sufficient generation assets to meet load even under drought conditions means that most of the time City Light will generate more power than it needs. This excess power is sold on the wholesale market, and City Light receives a substantial amount of revenue from surplus energy sales.
Net Wholesale Revenue and the RSA Baseline The amount of net wholesale energy revenue that City Light depends on when setting rates is specified by the RSA Ordinance adopted by the Council in 2010. The amount to be assumed is specified as the average of net wholesale revenue for the years 2002 to the present, unless otherwise adjusted by Council. For 2011-2012, our rates were set using this approach, and Council made certain reductions to better align the figure with our current forecast of wholesale revenues in those years. However, there is a gap between our current outlook and the amount of net wholesale revenue assumed in the rate calculations in the coming years. The difference between the RSA baseline and City Light’s current forecast (which is lower) would be withdrawn from the RSA and would likely result in temporary rate surcharges to replenish the
________________________________Seattle City Light Discussion Document-Not An Official Plan 31

RSA. For 2013 and future years, to the baseline assumes the approach specified in the RSA Ordinance—that base rates will be established using the average of realized net wholesale energy sales from 2002 forward to the latest available year. The results, compared with current market-based forecasts, are shown in the Table 2.12.
Table 2.1213
Net Wholesale Revenue Actuals and RSA Baseline Assumptions(Bold values indicate actuals or Council Adopted figures)
Actual and Forecasted Net
Wholesale RevenueRSA
Baseline
Forecast minus RSA
Baseline2002 $89.6
2003 $113.42004 $113.62005 $87.42006 $140.12007 $137.32008 $134.42009 $68.22010 $54.22011 $109.4 $96.8 $12.6 2012 $59.4 $102.1 -$42.72013 $79.8 $104.8 -$25.02014 $83.8 $100.6 -$16.82015 $85.2 $98.9 -$13.72016 $89.9 $97.7 -$7.82017 $98.4 $96.8 $1.62018 $107.0 $96.4 $10.6
Wholesale Energy Sales - Forecast AssumptionsWholesale energy sales revenue is determined by volumes and prices. Wholesale sales volumes were down sharply in 2009-10. As shown in Figure 2.9 (below), 2011 hydro generation was above normal due to cold and wet conditions. Expected total net wholesale sales volumes drop in 2012 due to reductions in City Light’s BPA long term power sale agreement. The figure below shows only expected volumes; the actual amounts can vary with regional precipitation and resulting stream flow conditions.
In addition to sales volume uncertainty, wholesale energy prices are extremely volatile and unpredictable. Long-term wholesale power prices are driven primarily by changes in natural gas prices. Figure 2.9 shows actual natural gas prices for the period 2008 through 2010, and projected prices for 2011 through 2018. Predicting changes in energy markets continues to be one of the significant challenges facing City Light.
Figure 2.8Wholesale Market Price and Surplus Volume Assumptions
13 2011-2018 forecast of net wholesale revenue is from the 2011_08_26 financial planning model run.________________________________
Seattle City Light Discussion Document-Not An Official Plan 32

$-
$1.00
$2.00
$3.00
$4.00
$5.00
$6.00
$7.00
$8.00
$9.00
$/M
Mbt
u
0
100
200
300
400
500
600
aMW
Sur
plus
Natural Gas PriceSurplus Sales
Natural Gas Price $8.11 $3.74 $4.10 $4.07 $4.46 $4.94 $5.17 $5.42 $5.68 $5.95 $6.21
Surplus Sales 288 213 202 518 248 251 253 244 247 257 267
2008 2009 2010 2011 2012 2013 2014 2015 2016 2017 2018
Adopting a More Conservative View of Wholesale Energy SalesSetting the wholesale revenue baseline for the RSA and rate setting is an important issue. Consistently setting the baseline too high will lead to ongoing RSA surcharges and risk of draining the RSA. An approach for moving toward a more conservative assumption for setting net wholesale revenue expectations is an initiative proposed in the draft Strategic Plan.
Rate Stabilization Account (RSA)In 2009 and 2010, City Light’s finances were greatly stressed due to large shortfalls in net wholesale revenues. In response, the RSA was established and funded and became effective on January 1, 2011, to help absorb variances in net wholesale revenue. It is a new financial forecast component. The financial planning model compares the forecast of net wholesale revenue against the RSA baseline, withdrawing cash from the RSA when actual wholesale revenue is less than the baseline, and depositing cash when the actual is greater than the baseline. If the RSA balance drops below specified levels ($90 million, $80 million and $70 million), increasing rate surcharges take effect in order to refill the RSA. The RSA surcharges that would come about are not changes in base rates, but are temporary surcharges only that range from 1.5% to 4.5%. The advent of the RSA reduces financial risk for City Light, but if wholesale revenues fall below expectations either because of several bad hydro years, price stagnation, or overly optimistic forecasting, customers would be faced with ongoing surcharges.
Key Points: Hydroelectric generation and energy demand vary significantly between years, seasonally and
over the course of a day. To balance out these peaks (power shaping), City Light makes short-term energy trades (from less than 24 months out in advance to the hourly spot market).
City Light tries to maximize financial return on its resources and manage dam operations in response to fluctuations in energy prices.
Increasing federal oversight since the 2000-2001 Energy Crisis is leading to increased regulatory requirements for transmission grid reliability and energy marketing activities. City Light anticipates significant on-going efforts to ensure compliance with NERC standards.
________________________________Seattle City Light Discussion Document-Not An Official Plan 33

Surplus power is sold on the wholesale market. Income from net wholesale revenue is assumed in City Light’s budget and is used to reduce retail rates.
Net wholesale revenue depends on both the amount of water available for City Light’s own generation to provide surplus, and the price of energy on the wholesale market, which are both outside the control of City Light. Energy prices are closely tied to natural gas prices.
The combination of low water and low prices in 2009-2010 resulted in $180 million less net wholesale revenue than anticipated over the two years. This required both spending cuts throughout the utility and rate increases.
The RSA legislation specifies that the baseline net wholesale revenue is to be calculated as the average of the net wholesale revenues since 2002 through the last year for which there is complete information, absent further adjustment by the Council.
The $100 million RSA was set up to buffer future fluctuations in net wholesale revenue and manage the risk associated with it. City Light is allowed to draw from the RSA when net wholesale revenue is less than budgeted. Temporary surcharges will be applied to retail rates when the RSA balance falls below a certain level and will be lifted when the RSA is replenished. The RSA helps address volatility from net wholesale revenue, but does not entirely solve the problem, especially if the net wholesale revenue baseline assumed when setting rates is too high.
2.8 Net Power Marketing RevenuesIn addition to the Net Wholesale Energy Revenues described above, City Light receives additional wholesale revenues through its power marketing efforts. These revenues are distinct from wholesale energy revenue because they are (mostly) the result of Power Management’s optimization of its underlying power and transmission portfolio. As shown in Table 2.13 below, forecast revenues from power marketing activities are expected to fall substantially starting in 2012. This is due to changes in City Light’s long term BPA supply agreement that reduce the amount of energy purchased from BPA, the need for City Light to use increasing amounts of energy to meet its retail load obligations, and reductions in Renewable Energy Credit (REC) revenues, since RECs will be needed to meet I-937 targets.
Table 2.13Power Marketing Revenues by Product ($M)
2009 2010 2011 2012 2013 2014 2015 2016 2017 2018Capacity and Reserve Sales $4.9 $5.1 $4.9 $2.5 $1.0 $1.0 $1.0 $1.0 $1.0 $1.0 Transmission Sales $1.8 $3.0 $2.6 $2.6 $4.4 $4.4 $4.1 $3.9 $3.9 $4.7 Other transactions $8.4 $6.0 $8.1 $3.5 $2.4 $2.9 $1.7 $1.7 $1.8 $1.8 Total $15.2 $14.1 $15.6 $8.6 $7.8 $8.4 $6.8 $6.7 $6.7 $7.6
Key Points: Currently City Light has surplus RECs. As I-937 requirements increase, the utility will no longer
be a net seller of RECs. Lower capacity and reserve sales are expected in the future due to a decreased market for these
products.
The three power related components discussed in sections 2.6, 2.7 and 2.8 are collectively a significant driver of the need for the change in customer rates from 2012 to 2018, as illustrated in the table below.
Table 2.14________________________________
Seattle City Light Discussion Document-Not An Official Plan 34

Power Related Costs and Revenues as Driver for Change in Revenue Requirement from 2012 to 2018
Rate Driver ReferenceSection
Change in revenue requirement in 2018
vs. 2012 ($M)
% of total change in revenue
requirement Increase in Power Contract Costs (Net of Revenues) 2.6 $32.4 15%Decrease in Net Wholesale Revenue 2.7 $5.7 3%Decrease in Power Marketing Revenues 2.6 $1.0 0%Total Change in Revenue Requirement caused by Power Related Costs $39.2 18%
2.9 Retail RevenueSales revenues from City Light retail customers provide approximately 80% (over $700 million annually) of the total revenue necessary to run the Utility’s daily operations with the balance of operating revenue supplied from net wholesale energy sales and miscellaneous sources.
Retail revenue is calculated based on a retail load forecast that separates demand by customer rate class. For the years which have Council-approved rates (through 2012), retail revenue is the product of the adopted rates and demand. For future years, retail revenue is determined by the calculated revenue requirement. (The revenue requirement is the total cost to operate the utility, less non-retail revenue.)
System LoadCity Light’s historical and projected total retail customer load is shown in the Figure 2.10 for the period 1983 through 2029. Based on the May 2011 official long term load growth forecast, City Light’s long term growth rate is expected to be modest, at less than 1% per year. As illustrated in Figure 2.10, most if not all of the load growth is expected to occur within the commercial sector. The effects of the recent recession and slow economic recovery can especially be seen in the industrial and residential sector. This forecast is updated annually based on customer information and economic assumptions. The load forecast assumes conservation levels as forecasted in the 5-Year Conservation Plan, and does not assume additional conservation or load reductions from rate design changes or any other initiatives.
Figure 2.9
________________________________Seattle City Light Discussion Document-Not An Official Plan 35

Load Forecast by Customer Class (GWh)
0
2000
4000
6000
8000
10000
12000
14000
1983
1985
1987
1989
1991
1993
1995
1997
1999
2001
2003
2005
2007
2009
2011
2013
2015
2017
2019
2021
2023
2025
2027
2029
Gig
awat
t-Hou
rs
System LoadCommercialResidentialIndustrial
Key Points: Load is expected to grow slowly at < 1% per year (0.8% on average) due to economic conditions,
Seattle’s aggressive conservation efforts, and the relatively mature market that the utility serves. Load can change at rates outside of these bounds if a larger customer leaves or enters City Light’s
service territory, or if the Seattle economy grows faster or slower than the forecast assumed here.
________________________________Seattle City Light Discussion Document-Not An Official Plan 36

3 Key O&M Assumptions (By Expense Type)
This section provides additional detail about the significant components of the SCL O&M budget, including discussion of historical cost trends, and a forecasted growth rate for years 2013-2018, for which budgets have not yet been adopted.
3.1 Labor and BenefitsO&M labor and benefit costs represent only approximately 15% of City Light’s overall revenue requirement as shown in Section 2 (labor costs are about 13%, and benefit costs about 6%, prior to assigning a portion of these costs to the capital improvement program, as described in Section 3.7). Non-power O&M costs comprise about one-quarter of the Utility’s annual revenue requirement, and labor and benefit costs represent about 61% of those costs (again prior to assignment of a portion of those costs to the CIP).
Labor unions represent 89% of the Utility’s workforce. The agreements with the unions specify cost of living adjustments (“COLA”) typically based on 100% of CPI for the next 1-3 years. The labor agreements are negotiated by the City. Overall labor costs are the product of the number of staff (headcount) times the unit costs. HeadcountHistorically, FTEs have declined since their high of 2,077 in 1992, reaching a low of 1,734 in 2005. Staffing increased to 1,882 in 2008 due to the addition of skilled trade positions to hire for the apprenticeship program to replace the high number of attritions, and several prominent programs including Asset Management and Conservation. Headcount was reduced in the 2010 and 2011 budgets as part of an effort to mitigate rate increases in those years. The baseline assumes that FTEs remain constant at the 2011 level of 1,811 employees. The budget assumes a position vacancy rate of approximately 4%.
Labor CostsLabor costs are assumed to increase at the rate of inflation, plus 1%. This assumption is based on approximate historical trend for SCL wage rates observed from 2000 to 2008. Labor costs related to most staff classifications have tracked the CPI, but labor costs for certain classifications (Lineworkers, Power Marketers, IT Professionals, and Strategic Advisors) increased at rates slightly above CPI. SCL’s experience in labor costs for certain categories increasing above the rate of inflation is consistent with broader industry experience, as shown by Figure 3.1. SCL competes with other utilities for staff in many classifications.
________________________________Seattle City Light Discussion Document-Not An Official Plan 37
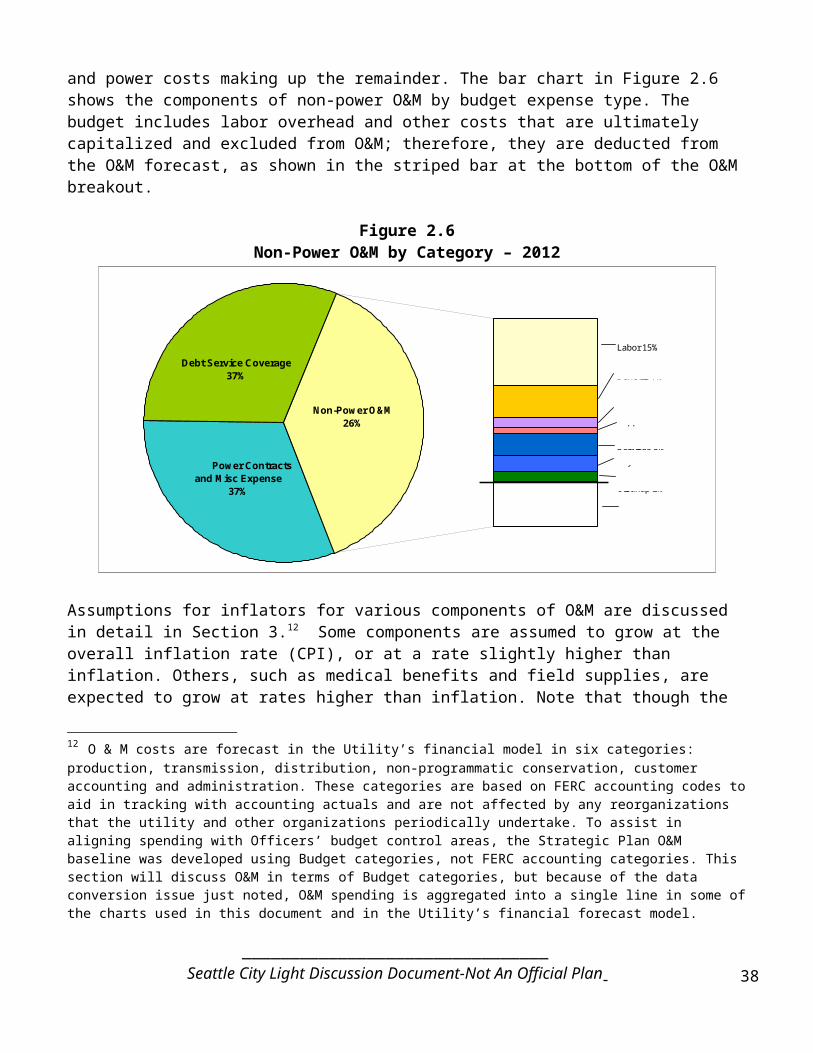
Figure 3.1 National Average Labor Costs Index14 vs. City Light Labor Costs
100
110
120
130
140
150
160
170
1991 1992 1993 1994 1995 1996 1997 1998 1999 2000 2001 2002 2003 2004 2005 2006 2007
Year
Inde
x (1
991=
100)
Labor for Heavy Construction and Reinforced ConcreteCommon LaborCraft LaborGDP DeflatorCity Light Labor Costs
Composite labor costs experienced and projected are shown in Figure 3.2.
Figure 3.2 Labor O&M Historical and Forecast ($M)
$60
$80
$100
$120
$140
$160
2005 2006 2007 2008 2009 2010 2011 2012 2013 2014 2015 2016 2017 2018
Mill
ion
Dol
lars
2005 - 2009 Spending 2010 - 2012 Budget 2013 - 2018 Forecast
Explanation of significant changes:
14 Source: http://www.edisonfoundation.net/Rising_Utility_Construction_Costs.pdf
________________________________Seattle City Light Discussion Document-Not An Official Plan 38
Percent of Total 2012 Expenses
13%

Increases from 2005 to 2009 resulted from more effectively recruiting and filling vacant budgeted positions. The improvements in City Light’s hiring processes decreased the actual vacancy rate from 11.6% to 8.8%.
Increases from 2007 to 2009 resulted from increased hiring for the apprenticeship program, Conservation and Asset Management Program.
Decreases from 2009 to 2010 resulted from hiring freeze, COLA freeze, and furloughs for some employees.
Risks and Unknowns related to this spending category include: Attrition in key utility workforce segments due to retirements and other factors could lower labor
costs. Demand for skilled trades people outstrips supply, increasing wages. Increases in staffing may be necessary to comply with future federal/state regulations. The
following areas have required additional resources in the past, and additional requirements could be forthcoming: (1) NERC Compliance (plants and power operations); (2) FERC - Increase in Fees and Regulations; (3) I-937 - State mandated Renewable Energy requirements; (4) Carbon Legislation/Cap and Trade.
Miscellaneous Benefits This category includes special clothing, meals, and incentive payments specific to business units. These are a small portion of O&M (<$1 million per year) and are assumed to grow with inflation.
Labor Benefits Labor benefits include pensions, social security (FICA), Medicare costs, industrial insurance, unemployment compensation, medical-dental-vision insurance, the employee assistance program, long-term disability insurance, life insurance and death benefits. The table below includes the cost categories that account for 99% of labor benefits costs of about $50 million per year. It is clear that these benefits have not increased at a steady rate, but instead increase or decrease abruptly. Some of the change is due to number of staff, while the rest is due to underlying cost changes. Just under half of the total labor benefits are in the medical-dental-vision insurance category. The average annual compound growth rate for all labor benefits costs is 5.6% over 2008-2012. A weighted average yields a slightly higher value of 7%, reflecting the recent large increase in retirement fund contribution rates due to the underperformance of City investments. As an added check, the City Budget Office independently calculated a rate of 5.7% for the 2013-16 period, which is very close to City Light’s assumption.
________________________________Seattle City Light Discussion Document-Not An Official Plan 39

Figure 3.3 Labor Benefits O&M Historical and Forecast ($M)
$0
$10
$20
$30
$40
$50
$60
$70
$80
2005 2006 2007 2008 2009 2010 2011 2012 2013 2014 2015 2016 2017 2018
Mill
ion
Dol
lars
2005 - 2009 Spending 2010 - 2012 Budget 2013 - 2018 Forecast
Explanation of significant changes: The increase from 2005 to 2009 resulted from an increased number of filled positions that are paid
labor benefits. Changes from 2008 to 2010 are due to increased workers compensation costs and medical/dental
cost increases. Investment returns for the City’s pension plan were adversely affected by the 2008/2009 recession,
necessitating an increase in the City’s contribution rates from 8.03% of payroll in 2010 to 10.03% of payroll by 2012.
Risks and Unknowns related to this spending category include: Pension costs depend on uncertain investment returns. Additional increases are possible. The effect of healthcare reform on medical costs incurred by the Utility under the City’s
healthcare plans is uncertain, but rising costs are likely. Results of labor negotiations could increase costs and offsetting productivity improvements would
be needed to offset increased expenses.
3.2 ServicesServices include various engineering, architectural, data processing and professional services contracts, as well as training and travel expenses, and comprise approximately 5% of the 2012 Non-Power O&M budget. Services are assumed to grow with inflation (CPI).
Historically, spending in this category has grown at approximately 1.2% annually from 2005-2009, as illustrated in Figure 3.4:
________________________________Seattle City Light Discussion Document-Not An Official Plan 40
Percent of Total 2012 Expenses
6%

Figure 3.4 O&M Services Historical and Forecast ($M)
$0
$10
$20
$30
$40
$50
$60
2005 2006 2007 2008 2009 2010 2011 2012 2013 2014 2015 2016 2017 2018
Mill
on D
olla
rs
2005 - 2009 Spending 2010 - 2012 Budget 2013 - 2018 Forecast
Explanation of significant changes: Increases from 2007 to 2010 resulted from the addition of specific programs that required
significant service contracting. These programs include Asset Management and Outage Management, which required contractors to provide software-specific implementation services (knowledge not resident within the utility). The increase in the conservation program reflects payments for customer energy efficiency improvements.
Risks and Unknowns related to this spending category include: The level of travel/training was reduced to an unsustainable level during 2009/10, and not restored
in the 2011/12 budget. Additional spending in both areas is likely warranted and may be necessary. For example, federal or state issues might arise that directly impact the utility, and this could require additional travel to lobby for the utility's interests.
The cost of new IT system implementation and maintenance costs could increase at a rate greater than inflation.
3.3 City Services, Payments & Rentals This category includes the lease cost for the Seattle Municipal Tower (SMT), payments to SPU for the Call Center, Department of Information Technology (DoIT) costs, and other City Cost Allocations, totaling approximately 4% of the 2012 Non-Power O&M budget. SCL pays City Cost Allocations for a variety of services based on an allocation methodology or the direct cost of the services. City Payments and Rentals are assumed to grow at the rate of inflation (CPI).
________________________________Seattle City Light Discussion Document-Not An Official Plan 41
Percent of Total 2012 Expenses
4%

Historically, spending in this category has increased on average by about 1.3% per year during 2005-2009, as illustrated in Figure 3.5:
Figure 3.5O&M City Services, Payments and Rentals
Historical and Forecast ($M)
$20
$22
$24
$26
$28
$30
$32
$34
$36
2005 2006 2007 2008 2009 2010 2011 2012 2013 2014 2015 2016 2017 2018
Mill
ion
Dol
lars
2005 - 2009 Spending 2010 - 2012 Budget 2013 - 2018 Forecast
Explanation of significant changes: The increase from 2006 to 2007 resulted from space rent increases for the Seattle Municipal
Tower (leased from the City). Increases in 2009 are due to City IT cost increases (updates to Microsoft Office and Exchange
email migration) and City vehicle maintenance cost increases. Decreases in 2010 and 2011 due to spending reductions across the City.
Risks and Unknowns related to this spending category include: Changes in the methodology that the City Budget Office uses for allocated costs for shared
services. Significant new expenditures or upgrades in shared services. For example, all City Departments
use a common general ledger system, called “Summit.” An upgrade of this system will be required in the next several years, with a charge to SCL of $2M-$3M anticipated.
Vehicle and equipment maintenance: City Light is dependent on vehicle and equipment maintenance performed by the Fleets and Facilities Department. City Light is billed for completed work. To some degree the timing and costs of these repairs is out of City Light's control. More work is needed in this area in order to manage and control future costs.
________________________________Seattle City Light Discussion Document-Not An Official Plan 42
Percent of Total 2012 Expenses
3%

3.4 MaintenanceThe maintenance category includes costs paid to vendors for tree trimming, facility maintenance, IT equipment maintenance and distribution system maintenance outside costs. It comprises 2% of total 2012 budgeted Non-Power O&M spending.
General maintenance is assumed to grow at CPI plus 1% to reflect contracted labor costs growing at a rate 1% higher than inflation. Maintenance for IT is assumed to grow at 3%, which is based on the observed historical rate.
Historically, spending in this category has increased on average by about 12.8% per year during 2005-2009.
Figure 3.5O&M Maintenance Historical and Forecast ($M)
$0
$5
$10
$15
$20
$25
$30
2005 2006 2007 2008 2009 2010 2011 2012 2013 2014 2015 2016 2017 2018
Mill
ion
Dol
lars
2005 - 2009 Spending 2010 - 2012 Budget 2013 - 2018 Forecast
Explanation of significant changes: Increases from 2005 to 2008 are a result of increased spending for powerline clearance. Decreases from 2009 to 2010 are a result of budget reductions to the powerline clearance budget
and power production facility maintenance budget. These reductions were not sustainable and restored in 2011.
O&M maintenance for power production increased approximately $3.2M from 2010 to 2011. A 2010-11 addition of $1.8M resulted from an increased allocation for City vehicle maintenance
and repair. Vegetation management costs for transmission lines increased by $1.0M from 2010 to 2011. Increases in 2011 IT system maintenance and the reshaping of IT costs to constrain the 2012 rate
increase resulted in approximately $5.5M in added costs to 2011. This includes significant increases in Oracle and Microsoft product maintenance costs.
Risks and Unknowns related to this spending category include:
________________________________Seattle City Light Discussion Document-Not An Official Plan 43
Percent of Total 2012 Expenses
2%

Risks of additional maintenance costs for aging distribution infrastucture will be identified as a result of Asset Management work.
Major IT system costs may increase faster than inflation (such as CCSS - Customer Billing System replacement).
3.5 Supplies & Materials Supplies and Materials includes costs for IT equipment and software, fuel costs, and inventory materials for distribution and generation systems. General supplies and materials, including the first two components noted above, are 1% of the O&M budget for 2012, and are assumed to grow with inflation.
Field Supplies and Inventory were 3% of O&M costs in 2011, and are assumed to grow at 8% per year, a conservative estimate that reflects rising costs of copper and steel--two commodities used extensively in electrical equipment. An analysis of Producer Price Indices for copper from the Bureau of Labor and Statistics for the period July 2002-October 2010 showed prices to be highly variable, with price index changes from October of one year to October of the next year ranging from -2% to +76%. The change between October 2009 and October 2010 was +19%. An analysis of the same price indices for cold rolled steel also showed extreme variability, with price index changes from October of one year to October of the next year ranging between -15% to +42%. The change between October 2009 and October 2010 was +10.4%. Over a recent 12-month period, City Light negotiated a generator rewind contract, which will be carried out using large quantities of both copper and steel; during the negotiation period, the price increased by $1 million over an initial price of $15 million, or 6.7%.
Figure 3.6O&M Supplies and Materials Historical and Forecast ($M)
$0
$5
$10
$15
$20
2005 2006 2007 2008 2009 2010 2011 2012 2013 2014 2015 2016 2017 2018
Mill
ion
Dol
lars
2005 - 2009 Spending 2010 - 2012 Budget 2013 - 2018 Forecast
Explanation of significant changes: Increases from 2005 to 2008 resulted from increased operating supply costs for inventory
purchases and IT equipment cost increases.
________________________________Seattle City Light Discussion Document-Not An Official Plan 44
Percent of Total 2012 Expenses
1%

Decreases from 2008 to 2009 are a result of reduced purchases of supplies and materials. Maintenance work was temporarily deferred to achieve O&M savings targets for 2009.
Risks and Unknowns related to this spending category include: A rebounding economy and/or increased inflation could drive up commodity costs.
3.6 Permits, Injury and Environmental Claims Claims include payments for costs associated with environmental cleanup, employee injury claims, and customer claim costs. Permits include taxes and fees such as payments to FERC15. Workers compensation injury claims are not included in this category and are budgeted with industrial insurance pooled costs in the benefits category. For 2013–2018, permit costs are assumed to grow at 5% per year [?]. Environmental cleanup costs do not escalate like other O&M costs; instead, they are projected directly based on work completed and known obligations.
However, both FERC fees and environmental cleanup fees are not considered part of non-power O&M in the financial forecast. FERC fees are considered purchased power and environmental cleanup costs are now being treated as deferred O&M, which was a recent policy change that was made as part of the Strategic Plan Baseline. Both of these expenses are removed from the O&M budget as part of the other reductions described in Section 3.7
Historically, spending in this category has grown at approximately 64.8% annually from 2005-2009, as illustrated in Figure 3.7:
Figure 3.7O&M Permits, Injury & Damage Claims Historical and Forecast ($M)
$0
$2
$4
$6
$8
$10
$12
$14
$16
$18
$20
$22
$24
$26
2005 2006 2007 2008 2009 2010 2011 2012 2013 2014 2015 2016 2017 2018
Mill
ion
Dol
lars
2005 - 2009 Spending 2010 - 2012 Budget 2013 - 2018 Forecast
15 FERC fees are initially discussed in Section 2.4 since they are forecast as part of power costs (not O&M) but are also discussed along with other permit costs in this section because this is how they are budgeted.
________________________________Seattle City Light Discussion Document-Not An Official Plan 45
Percent of Total 2012 Expenses
2%

Explanation of significant changes: Increases from 2006 to 2007 resulted from a legal settlement for employee damage claims. The increase from 2008 to 2009 resulted from increased environmental claim costs for the
Duwamish cleanup and increased FERC fees.
Risks and Unknowns related to this spending category include: Allocation between years of existing/known cleanup costs is uncertain and total Duwamish
cleanup costs could change. City Light could experience upward pressure on meeting existing or new environmental
compliance cleanup requirements and regulations. There is a potential for large employee or customer damage claims that have not been anticipated.
City Light has emphasized creating a culture of employee safety and established Grass Roots Safety Teams in 2005 to reduce work related injuries.
3.7 CIP Overhead and Other Reductions As mentioned earlier in Section 2.3, the O&M Budget actually includes some labor, benefits, and supplies and materials costs that are ultimately categorized as part of CIP or deferred O&M. The forecast includes an estimate for these overheads associated with CIP and deducts them from the budgeted O&M, which is shown in Table 3.1 below.
There are also several costs that are included in the O&M budget but are actually categorized as power costs or deferred O&M in the forecast, specifically Water for Power (FERC) fees and environmental cleanup costs. These costs are removed from the O&M forecast (inflated 2012 level) and included in other areas of the financial forecast. There are also costs that are part of the power budget that are categorized as O&M in the financial forecast. These include some transmission costs and also Renewable Energy Credits. The amounts of these adjustments are shown in the Table 3.1.
Table 3.1CIP Overhead and Other O&M Reductions ($M)
2012 2013 2014 2015 2016 2017 2018Reductions to O&M Budget
Capitalized Overheads -65.2 -66.8 -68.8 -71.0 -73.3 -76.0 -79.0Budgeted FERC Fees -8.1 -8.5 -8.9 -9.4 -9.9 -10.4 -10.9Environmental Clean Up -7.8 -8.5 -9.4 -10.3 -11.4 -12.5 -13.8
Additions to O&M BudgetAC Intertie Costs 0.7 0.8 0.8 0.8 0.8 0.8 0.9Renewable Energy Credits 1.5 2.5 3.0 2.3 3.6 5.1 6.7
Total Capitalized Overheads and Other Reductions -78.8 -80.6 -83.4 -87.7 -90.1 -93.0 -96.1
________________________________Seattle City Light Discussion Document-Not An Official Plan 46

4 Financial Baseline Rate Projection
This section applies and summarizes the information and assumptions discussed earlier to lay out the resulting expectation of the cost to ratepayers to maintain existing levels of service during 2012-18. It should be noted that these projections contain uncertainty and accordingly should be viewed as primarily illustrating a likely mid-range point estimate of a range of possible costs. The baseline forecasted six-year average rate increase is 4.1% per year for 2013 to 2018. The primary cost drivers, in order of magnitude are: (a) increased debt service costs; (b) increases in O&M spending, taxes and other; and (c) increased net power costs. Figure 4.1 below shows changes in the overall revenue requirement from the 2012 level, and the various colors illustrate what costs are causing the pressure on the revenue requirement.
Figure 4.1Rate Drivers ($M)
(Does Not Include Forecasted RSA Surcharge)
2012 Revenue Requirement
O&M InflationTaxes and Other
Power Costs (includes wholesale revenue)
$400
$500
$600
$700
$800
$900
$1,000
2012 2013 2014 2015 2016 2017 2018
Rev
enue
Req
uire
men
t ($M
)
Rate IncreasesDebt Service Costs
3.6% 4.9%
6.8% 2.2%
3.5% 3.5%
30%
18%
52%
(A) Debt Service Increased costs associated with debt service (and, by extension, capital spending) are the primary driver for the rate increases in the next six years. This shift is caused by several factors. The first factor is the obvious one: that capital spending is projected to be higher than in previous years. As discussed in Section 2.1, City Light is undertaking several major capital efforts including relocation of facilities due to the
________________________________Seattle City Light Discussion Document-Not An Official Plan
Rate Driver % of total change in revenue requirement in 2018 vs. 2012
(a) Debt Service (Costs from funding Capital Program) 52%(b) Non-Power O&M, Taxes and Other 30%(c) Power Costs and Change in Wholesale Revenue 18% Total 100%
47
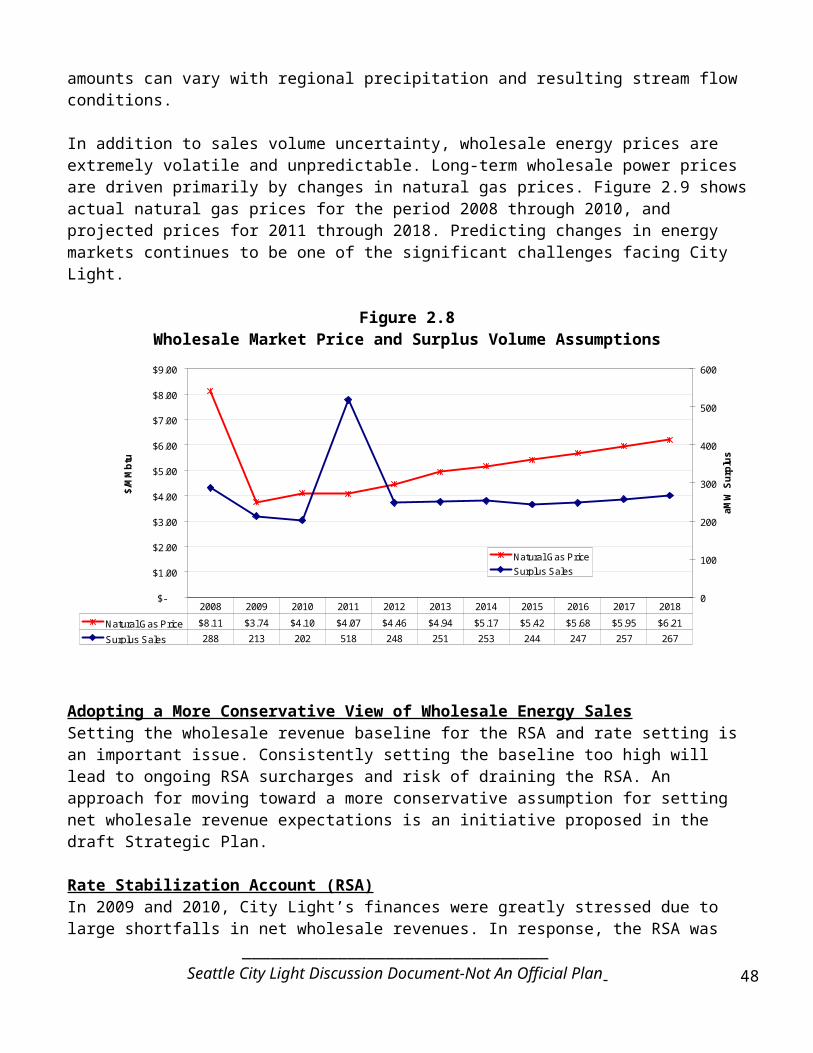
Alaskan Viaduct relocation, Boundary dam improvements and relicensing, and much-needed distribution system renewal.
The second reason for the increase in debt service is the lagged effect of recent years’ revenue shortfalls. In 2009 and 2010, $180 million16 in wholesale revenue shortfalls led to maintenance deferrals and greater debt financing of CIP. A portion of this deficit was offset by debt refinancing and reducing expenditures, though many of the reductions were deferrals of maintenance and other projects, serving only to delay the financial impact. The rest of the shortfall was addressed by financing a much larger portion of capital requirements via bond proceeds than planned (77%). Figure 4.2 below shows that this was a noticeable departure from financing patterns in previous years.
Figure 4.2CIP and Deferred O&M Funded with Cash from Operations ($M)
$-
$50
$100
$150
$200
$250
$300
$350
$400
2004 2005 2006 2007 2008 2009 2010 2011 2012 2013 2014 2015 2016
$Mill
ions
Deferred O&M
Capital Projects
Paid by Cash from Operations (or Contributions)
Thirdly, a financial policy change has also increased the rate at which City Light issues bonds. The City Council approved a 13.8% rate increase for 2010, which increased expected retail revenues by about $75 million. Council also at that time reduced the financial policy for debt service coverage from 2.0x to 1.8x. Lowering coverage targets reduced near term rate pressure. However, the long term effect of this policy change is that the amount of capital that is funded with operating dollars each year is reduced, increasing debt service and therefore rates in the longer term. Going forward, City Light’s policy is to fund approximately 60% of CIP with debt, and the financial baseline projects issuing approximately $200 million in bonds each year on average.
The immediate effect of the revenue shortfalls and policy changes on rates was offset in part by savings from a large bond refinancing in 2010. The interest cost savings were front loaded into 2010 and 2011 to
16 For 2009, rates assumed net wholesale revenues of $178 million, leaving a $110 million revenue gap between the assumed amount and the $68 million actually realized. The wholesale revenue ultimately included in the Adopted Budget was $142.2 million. There was no explicit requirement at the time for the net wholesale revenue used to set rates to match the budget, and so while the rates met financial policy targets, the Adopted Budget did not. New financial policies have since addressed this problematic loophole. For 2010, net wholesale revenues actuals were approximately $70 million below the amount assumed in the revenue requirement, totaling $180 million for the 2 years.
________________________________Seattle City Light Discussion Document-Not An Official Plan 48

provide seed funds for the new RSA, offsetting increased debt service from the new debt until 2012. (This is illustrated in Figure 2.4 in Section 2.2.)
(B) O&M CostsFigure 4.1 shows that O&M, taxes and other expenses account for 30% of the increase in revenue requirements. Increased non-power O&M costs account for 25%, which is due to inflation of costs for maintaining the same level of services as in 2012. O&M increases from 2013-2018 are driven by the factors outlined in Section 3 of this document, which notes that some cost elements, such as material costs and health care costs, are anticipated to increase at a rate higher than inflation.
Some have inquired about whether rate increases could be avoided by reducing City Light costs. Figure 4.3 (which is another version of Figure 4.1 with different category groupings) shows the challenges involved in such an undertaking. The hatched area depicts all O&M costs that might be considered “controllable,” about $200 million that consists of labor, benefits, rents, materials, and city services. Controllable O&M represents only a fraction of total City Light costs; thus, maintaining flat rates in the face of rising power cost and capital pressures would require cutting around 50% of controllable O&M by 2015, and 80% of that budget by 2018. Cost control remains a key priority for City Light--our process improvement initiatives and implementing improvements from lessons learned from benchmarking studies will help us ensure we are as efficient as we can be. However, Figure 4.3 illustrates that any O&M efficiencies that arise from these initiatives will not be sufficient to offset the need for rate adjustments over this period.
Figure 4.3O&M Cuts Needed for Flat Rates ($M)
All Non-Power O&M
$-
$100
$200
$300
$400
$500
$600
$700
$800
$900
$1,000
2012 2013 2014 2015 2016 2017 2018
Rev
enue
Req
uire
men
t ($M
)
Non-Power O&MIncreasing Debt Service CostIncreasing Power Cost (Includes NWR)Increasing Taxes and Other Costs2012 Net Power Costs, Debt Svc, Taxes, etc.Cut O&M to Get Flat RateRate Increase
Rate Increases
2012 Total Revenue Requirement
Power Cost, Debt Service, etc. at the Adopted 2012 Level
3.6% 4.9%
6.8% 2.2%
3.5% 3.5%
80% of
Total O&M
Since increased debt service is a significant driver for the rate increases over this period, efforts can also appropriately focus on ensuring that capital spending is limited to necessary and appropriate projects. Constraining efforts in this direction is the need to maintain an aging infrastructure, significant non-utility related interagency project work that must occur during this period, and the need to make investments in technology to improve utility efficiency over the longer term.
________________________________Seattle City Light Discussion Document-Not An Official Plan 49

(C) Power Costs and Change in Net Wholesale RevenueIn Figure 4.1, “Power Costs” includes power contract costs, renewable acquisitions to meet I-937, and offsetting wholesale sales, contract, and power marketing revenues. Power costs are projected to increase rates by 18% over the coming six years. The majority of this increased cost is coming from inflationary pressures from power contracts, largely BPA. Decreased planning levels of net wholesale revenue (RSA Baseline) and slightly lower power marketing revenues also contribute to the upward rate pressure.
RSA, Net Wholesale Revenue, and RatesThe rate increases shown in Figures 4.1 and 4.3 do not include RSA surcharges. As mentioned earlier, the net wholesale revenue assumed for rate setting purposes is equivalent to the RSA baseline. For future years, wholesale revenue (RSA baseline) is set using the approach specified in the RSA Ordinance—it is the average of realized net wholesale energy sales from 2002 to present. This approach yields net wholesale revenue that is up to $40 million higher for some years than the forecast of net wholesale revenue produced by City Light staff. In other words, the rates in the strategic plan baseline are lower than they would be if SCL’s internal wholesale revenue forecast was used. If base rates are set as shown in this baseline, but wholesale revenues are actually lower like the forecast predicts, the RSA account balance will be eroded and rate surcharges will be implemented. Figure 4.4 shows revenue forecast to be collected via the RSA surcharge as an addition to base rate revenue.17 The rate increases shown in black are the expected annual increases to base rates. The rate increases shown in red are the expected annual increase to effective rates (base rates plus expected RSA surcharges).
Figure 4.4Forecasted Retail Revenue Including Forecasted RSA Surcharges
$500
$550
$600
$650
$700
$750
$800
$850
$900
$950
2012 2013 2014 2015 2016 2017 2018
Rev
enue
Col
lect
ed fr
om R
atep
ayer
s ($
M)
Revenue Collected from Expected RSA Surcharge
Revenue Collected from Base Rates
Base Rate Increase
Rate Increase Including Anticipated RSA Surcharge
3.6%
4.9%
6.7%
2.2%
3.5%
3.5%
4.3%
7.1%
3.9%
3.1%
2.8%2.1%
Percent Change to Average Retail Rates
As an alternative, base rates could be increased to eliminate this reliance on the RSA to fund the gap between the amount of net wholesale revenue specified by the RSA Ordinance and the Utility’s current outlook. City Light will identify solutions to this issue as part of the strategic plan process. 17 These are expected RSA surcharges based on City Light’s forecast dated 2011_09_02. They are for illustrative purposes only. RSA surcharges are very uncertain and will vary with changing expectations about net wholesale revenue and other RSA activity.
________________________________Seattle City Light Discussion Document-Not An Official Plan 50

Impact on the Average Residential CustomerFigure 4.5 shows a monthly bill for a typical residential customer that uses about 700 kWh a month. Given the rate increases and projected RSA surcharges in the financial baseline forecast described above, a typical residential customer’s monthly bill increases by about $5 with each year (on average).
Figure 4.5Monthly Bill for Average Residential Customer
$0
$10
$20
$30
$40
$50
$60
$70
$80
RSA Surcharge $1.48 $0.00 $0.68 $1.88 $2.21 $1.71 $1.42 $1.01 $0.10
Base Rate Increase $6.29 $3.25 $1.25 $1.23 $3.78 $2.94 $2.28 $2.29 $2.33
Bill at Prior Year Rate $44.01 $50.30 $53.55 $54.80 $56.03 $59.81 $62.75 $65.03 $67.32
Total Bill $51.78 $53.55 $55.49 $57.91 $62.02 $64.46 $66.45 $68.33 $69.74
2010 2011 2012 2013 2014 2015 2016 2017 2018
________________________________Seattle City Light Discussion Document-Not An Official Plan 51

5 Overall ConclusionsSCL’s revenue requirement and rates for providing today’s level of service are projected to increase in the coming years, even prior to consideration of prudent strategic priorities and initiatives. Points for consideration include:
1. Some elements of the drivers for the rate increases are generally controllable, while others are not.
Relatively more controllable: Program additions (generally excluded from this baseline projection) Number of staff / how work is performed Size and timing of future capital improvement budgets
Relatively less controllable or not controllable: Labor cost changes Net wholesale energy prices and volumes Costs related to meeting regulatory requirements Interest rates on newly issued debt Upcoming debt service changes for capital dollars already spent
2. All spending is reflected in rates, either sooner or later, but financial policies determine timing. Two examples include: Debt financing spreads capital costs across a number of years, but adds interest cost. At different
times in the history of the Utility, financial policies have varied reflecting either more or less willingness to pay costs upfront or to defer them to future years. How much capital is debt financed is primarily determined by debt service coverage targets.
The net wholesale revenue assumption affects rate levels, but revenue shortfalls are collected in some form, eventually. An aggressive net wholesale revenue assumption will yield a lower base rate initially, but if actual revenues fall short, either higher debt (leading to higher debt service and higher future rates) or RSA surcharges will make up the difference.
Financial policy decisions such as those described above have long term impacts. The utility most recently revised its financial policies in the spring of 2010 and our finances are currently evolving as response to this change.
3. City Light Rates, over the past 20 year period, have grown at a rate comparable to inflation, though at times have led or lagged the overall inflation. This is illustrated in Figure 5.1.
________________________________Seattle City Light Discussion Document-Not An Official Plan 52

Figure 5.1City Light Retail Rates and CPI ($M)
City Light Retail Rates and CPI1990- 2012
$-
$10.00
$20.00
$30.00
$40.00
$50.00
$60.00
$70.00
$80.00
1990 1992 1994 1996 1998 2000 2002 2004 2006 2008 2010 2012
Year
$/M
Wh
15.0
65.0
115.0
165.0
215.0
265.0
CPI
Average Revenue per MWh before Discounts
Seattle CPI-W (1982-84=100)
The same may be true over a future period of similar duration, though costs in the next several years are likely to increase at rates ahead of inflation (inflation is projected at about 2% annually).
SCL rates will increase, but will be less volatile and grow at a lower rate than experienced by certain other essential services or commodities, some of which have grown consistently at rates significantly higher than inflation over an extended period, or have exhibited significant volatility (natural gas).
Figure 5.218
Comparison of Electricity and Other Consumer Price Trends 1970-2005
18 Source: EIA Annual Energy Review 2004, EIA Monthly Energy Review March 2006, and US Bureau of Labor Statistics. http://www.brattle.com/_documents/UploadLibrary/ArticleReport2414.pdf
________________________________Seattle City Light Discussion Document-Not An Official Plan 53

At the local level, SCL rates have increased at lower rates than other utility services, as illustrated by Figure 5.3:
Figure 5.3SCL Rates vs. SPU rates and Other Household Bills
0.8
1.2
1.6
2.0
2.4
2.8
3.2
3.6
4.0
4.4
4.8
5.2
2000 2001 2002 2003 2004 2005 2006 2007 2008 2009 2010 2011 2012 2013 2014 2015
Inde
x 20
00 =
1
SCLSPU-WaterSPU-Solid WasteSPU-SewerSPU-DrainageComcast CablePSE - Gas
SCL
Notes: 1. 2011-2015 Data is estimated except for SCL and SPU-Water.2. Data for PSE - Gas only available through 2009.3. Data for Comcast Cable is available only through 2009.4. Estimates for SPU do not include King County wastewater and drainage rates
4. Because SCL rates are low, percentage changes in our rates are less impactful to customers than the same percentage change for the customers of utilities whose rates are significantly higher than SCL’s.
5. SCL rates are and are likely to remain among the lowest nationwide and in the region.
________________________________Seattle City Light Discussion Document-Not An Official Plan 54

Figure 5.4City Light Retail Rates Compared with
Other Large Cities and Neighboring Utilities
CityAvg System Rate
(cents/kwh)
* Publicly Owned
Local UtilityAvg System Rate
(cents/kwh)1. Tacoma* 5.60
Avista 7.704.3. Snohomish* 7.56
5. Portland General 8.876. Puget Sound Energy 9.69
Rates are average for calendar year 2010
2. Seattle* 6.471. Seattle* 6.65**2. Indianapolis 6.833. San Antonio* 7.464. Charlotte 7.515. Memphis* 8.586. Austin* 8.747. Nashville* 8.958. Denver 9.119. Columbus 9.15
10. El Paso 9.75U.S. Average 9.88
11. Jacksonville* 10.0812. Detroit 10.2813. Milwaukee 10.4014. Las Vegas 10.6215. Phoenix 10.63
CityAvg System Rate
(cents/kwh)
* Publicly Owned* Publicly Owned
Local UtilityAvg System Rate
(cents/kwh)1. Tacoma* 5.601. Tacoma* 5.60
Avista 7.704. Avista 7.704.3. Snohomish* 7.563. Snohomish* 7.56
5. Portland General 8.875. Portland General 8.876. Puget Sound Energy 9.696. Puget Sound Energy 9.69
Rates are average for calendar year 2010
2. Seattle* 6.472. Seattle* 6.471. Seattle* 6.65**1. Seattle* 6.65**2. Indianapolis 6.832. Indianapolis 6.833. San Antonio* 7.463. San Antonio* 7.464. Charlotte 7.514. Charlotte 7.515. Memphis* 8.585. Memphis* 8.586. Austin* 8.746. Austin* 8.747. Nashville* 8.957. Nashville* 8.958. Denver 9.118. Denver 9.119. Columbus 9.159. Columbus 9.15
10. El Paso 9.7510. El Paso 9.75U.S. Average 9.88U.S. Average 9.88
11. Jacksonville* 10.0811. Jacksonville* 10.0812. Detroit 10.2812. Detroit 10.2813. Milwaukee 10.4013. Milwaukee 10.4014. Las Vegas 10.6214. Las Vegas 10.6215. Phoenix 10.6315. Phoenix 10.63
6. As noted in Section 1, there are trends and cost drivers that the entire electric utility industry is facing. SCL will be subject to many of them, but will be relatively immune to others (e.g., greenhouse gas limitations). We believe that SCL is better positioned than many (if not most) electric utilities to respond to factors that will put upward pressure on electric utility rates. Our clean and renewable power supply will not require the costs of carbon mitigation that may be significant for other electric utilities.
7. While the financial baseline represents a projection of costs for maintaining the current level of service, this should not be taken as an indication that no improvement opportunities exist. The results of the baseline rate projection compel us to look for opportunities to reduce costs. Management is confident that there are numerous opportunities to improve efficiency and effectiveness through programs that may require changes in policies and practice. The draft strategic plan documents such initiatives.
________________________________Seattle City Light Discussion Document-Not An Official Plan 55