Financial Crimes Enforcement Network · Financial Crimes Enforcement Network Mortgage Loan Fraud An...
54
Mortgage Loan Fraud Financial Crimes Enforcement Network
Transcript of Financial Crimes Enforcement Network · Financial Crimes Enforcement Network Mortgage Loan Fraud An...

�Mortgage Loan Fraud
Financial Crimes Enforcement Network
� Mortgage Loan Fraud
Financial Crimes Enforcement Network

�Mortgage Loan Fraud
Financial Crimes Enforcement Network
Mortgage Loan Fraud
An Update of Trends based Upon an Analysis of Suspicious Activity Reports
April 2008

�� Mortgage Loan Fraud
Financial Crimes Enforcement Network

���Mortgage Loan Fraud
Financial Crimes Enforcement Network
Introduction 1
ExecutiveSummary 3
Vulnerabilities Identified 5
Filings on Mortgage Brokers 5
Appraisal Fraud 5
Vulnerabilities in Specified Mortgage Products 6
Trend for Suspected Fraud in Cash-Out Refinance Loans 6
Trend for Suspected Fraud in Stated Income/ Low or No Document Loans 7
Home Equity Lines of Credit 8
FraudulentActivitiesandRedFlags 9
Overview of Fraudulent Activities 9
Commonly Reported Variations of Mortgage Fraud 12
Elaborate Mortgage Fraud Schemes 14
ProtectiveMeasures 19
Effective Fraud Detection Measures Used by Filers 19
Other Protective Measures 20
Trends and Patterns in Total SARs Reporting MortgageLoanFraud 21
Characterizations of Suspicious Activity 24
Primary Federal Regulators 26
Top Filing Institutions 27
Fraud Locations 27
Individual Taxpayer Identification Number (ITIN) 34
Table of Contents

�v Mortgage Loan Fraud
Financial Crimes Enforcement Network
Findings Observed from Sampled Narratives 37
Types of Fraud 37
Loan Types 40
Early Payment Default 41
Stated Income/Low Document or No Document Loans 43
Fraud Detection 43
SecuritiesandFuturesIndustries(SAR-SFs) 45
Conclusion 47

�Mortgage Loan Fraud
Financial Crimes Enforcement Network
Introduction
F ollowing a large increase in depository institution Suspicious Activity Report (SAR) filings on mortgage loan fraud, the Financial Crimes Enforcement Net-work (FinCEN) issued a report in November 2006 describing trends and pat-
terns shown in SARs reporting suspected mortgage loan fraud filed between April 1, 1996 and March 31, 2006.1 FinCEN has continued to monitor these reports. This analysis updates the previous report by reviewing SARs filed between April 2006 and March 2007.
“Mortgage Loan Fraud: An Industry Assessment based upon Suspicious Activity Report Analysis,” see http://www.fincen.gov/MortgageLoanFraud.pdf.
1.
� Mortgage Loan Fraud
Financial Crimes Enforcement Network

�Mortgage Loan Fraud
Financial Crimes Enforcement Network
Executive Summary
I n calendar year 2006, financial institutions filed 37,313 SARs citing suspected mortgage loan fraud, a 44% increase from the preceding year, compared to a 7% overall increase of depository institution SAR filings. One reason for this in-
crease may be that lenders are increasingly identifying suspected fraud prior to loan approval and reporting this activity. Suspected fraud was detected prior to loan disbursements in 31% of the mortgage loan fraud SARs filed between April 1, 2006 and March 31, 2007, compared to 21% during the preceding ten years.
Total SAR filings in 2006 on suspected mortgage loan fraud, when divided by the subject’s state address,2 showed the greatest increases in Illinois (75.80%), California (71.29%), Florida (53.04%), Michigan (51.50%), and Arizona (48.73%).3
Mortgage brokers initiated the loans reported on 58% of the SARs sampled for this report. SAR reporting includes examples of brokers acting both as active partici-pants in the reported fraudulent activity, and as intermediaries that did not verify information submitted on the loan application.
An increase in the number of subjects does not directly correlate into increased transactions. Since real estate transactions involve multiple parties, SARs frequently list multiple subjects in a single report. Some increases in reported subjects result from filers completing SARs more accurately or more thoroughly. Similarly, as some SARs indicate multiple subjects living in two or more states, these particular SARs may be included in multiple state totals. Consequently, total state filings, when listed by the subject’s state, do not match the total number of SARs filers completed during the reviewed period.These percentages represent the increase in SAR filings between 2005 and 2006. In this report, when percentages are in parenthesis, they are taken from a statistically representative sample unless noted otherwise, as here. Also, as many SARs contain multiple categories, such as subjects and activity types, some statistical tables and information contained in this report may exceed 100 percent.
2.
3.

� Mortgage Loan Fraud
Financial Crimes Enforcement Network
Reports of suspected identity fraud and identity theft4 associated with mortgage loan fraud continued to increase for the period reviewed. Reports of suspected identity theft in conjunction with mortgage loan fraud increased 95.62% over the previous study. Cases of suspected identity fraud were predominantly associated with fraud for housing.5 Victims of identity theft have had their properties encum-bered with loans or property titles fraudulently transferred, effectively having their homes stolen.
Filers specified that loans were subprime in 79 SARs (0.19%) for the reviewed period. Without this specification, it is not possible to determine whether mortgages described in the remaining SARs were subprime loans.
For the purpose of this report, identity fraud was defined as the unauthorized use of a social security number issued to another individual or use of an invented social security number for the purpose of obtaining credit. Because the perpetrator used his/her true personal identifiers (i.e., name, address, and date of birth), there was no apparent attempt to steal another person’s identity. Identity theft involved an attempt to obtain credit using another person’s identity. The distinction made between identity fraud and identity theft is intended solely for the purpose of this report, and is not intended to establish legal definitions of these terms.Mortgage loan fraud can be divided into two broad categories: fraud for housing and fraud for profit. Fraud for housing generally involves material misrepresentation or omission of information with the intent to deceive or mislead a lender into extending credit that would likely not be offered if the true facts were known. Fraud for housing is generally committed by home buyers attempting to purchase homes for their personal use. In contrast, the motivation behind fraud for profit is money. Fraud for profit involves the same misuse of information with the intent to deceive or mislead the lender into extending credit that the lender would likely not have offered if the true facts were known, but the perpetrators of the fraud abscond with the proceeds of the loan, with little or no intention to purchase or actually occupy the house. Suspicious activity reporting confirms that fraud for profit is often committed with the complicity of industry insiders such as mortgage brokers, real estate agents, property appraisers, and settlement agents (attorneys and title examiners).
4.
5.
Sources for this Report
Filing trends and patterns were identified based on data fields contained by all Suspicious Activity Reports (SARs) filed, where filers indicated mortgage loan fraud as a suspected activity.
Additional filing trends and patterns were identified based on a statistically representative sample of SARs, where filers indicated mortgage loan fraud as a suspected activity.
•
•

�Mortgage Loan Fraud
Financial Crimes Enforcement Network
Vulnerabilities Identified
Filings on Mortgage Brokers
A growing number of SARs report that mortgage brokers initiated the fraudulent loan applications. Filers are increasingly listing mortgage brokers as subjects in these SARs.
Figure 1 depicts a three year growth trend for total mortgage fraud comparing SAR filings and those reporting mortgage brokers as subjects. SARs reporting mortgage brokers as subjects comprise over one quarter of the total mortgage loan fraud SARs filed for the period between April 1, 2006 and March 31, 2007.
Figure 1
Appraisal Fraud
Reports of fraudulent appraisals continue to increase in SARs reporting mortgage loan fraud. Filers of nearly 13% of the narratives sampled for this report suspected appraisers as participants in the reported fraud. This represents an increase of two percentage points from the 11% reported in the 2006 FinCEN Mortgage Loan Fraud
Comparison of Growth of Total Mortgage Loan Fraud SARs And Growth of SARs Indicating Mortgage Broker
As the Occupation of the Subject
0%20%40%60%80%
100%120%
Apr 04 - Mar 05 Apr 05 - Mar 06 Apr 06 - Mar 07
Mortgage Brokers Total Mortgage Loan Fraud SARs
7,55119,841 28,174 40,7813,598 10,272

� Mortgage Loan Fraud
Financial Crimes Enforcement Network
report. All fraudulent flipping6 and nearly all other organized fraud schemes that were reviewed relied on fraudulent appraisals. A small number of sampled nar-ratives reported the fraud was conducted through the theft of licensed appraisers’ identity and license information. The increase in reporting of appraisal fraud and theft of licensed appraiser information underscores the value of independent verifi-cation of appraisal documentation.
Vulnerabilities in Specified Mortgage Products
Although many SAR narratives did not identify the mortgage product involved in suspected mortgage loan fraud activities, some associated trends and vulnerabilities were deduced from those narratives that did specify the mortgage product. A small number of narratives specified that loans were subprime.7
Trend for Suspected Fraud in Cash-Out Refinance Loans
Filers identified “cash-out refinance loans”8 in 3.35% of the SARs reporting sus-pected mortgage loan fraud filed between April 1, 2006 and March 31, 2007. Over the past six years, the study revealed a significant growth in the number of deposi-tory institution SARs reporting suspected fraud in these loan products. There was a nearly 53% increase in suspected fraud in these loans between 2005 and 2006.
Property Flips: Property is purchased, falsely appraised at a higher value, and then quickly sold. What makes property flipping illegal is that the appraisal information is fraudulent. The schemes typically involve fraudulent appraisals, doctored loan documents, and inflation of the buyer’s income.For the period April 1, 2006 through March 31, 2007, 79 SAR narratives (0.19% of total filings) specified suspected fraudulent loans were subprime. Other SAR narratives do not provide sufficient details to make this determination.A cash-out refinance loan is a refinanced loan granted for an amount greater than what the borrower owes on the prior loan. The additional amount of the refinance is funded by existing equity.
6.
7.
8.

�Mortgage Loan Fraud
Financial Crimes Enforcement Network
Figure 2 depicts this trend and projects the number for 2007.9
Figure 2
Trend for Suspected Fraud in Stated Income/ Low or No Document Loans
Filers specified that the mortgage product was a stated income, low or no document loan in 1.55% (633) of all SARs filed for suspected mortgage loan fraud between April 1, 2006 and March 31, 2007.10 This represented nearly a 69% increase in loans thus specified from the previous one year period (375).
In the smaller sample reviewed, sixty-nine (3.9%) narratives specified the mort-gage product was a stated income or a low or no document loan. Filers reported the suspected fraud was detected prior to loan financing on 18.84% of the reports for these mortgage products. In comparison to other loans identified in the sample, filers reported that they detected the suspected fraud prior to loan funding in 33.52% of full document purchase loans.
Fraud Reported in Cash-out Refinance Loans
130205
316
638
975
1,482
0200400600800
1,0001,2001,4001,600
2002 2003 2004 2005 2006 2007Estimated
No.
ofSA
Rs
Projection is based on increases observed in comparisons of 1st quarters 2006 and 2007.“A ‘No Doc’ loan is one in which extensive documentation of income, credit history, deposits, etc., is not required because of the size of the downpayment, usually 25% or more. Theoretically, the value of the collateral will protect the lender.” FDIC, Risk Management Manual of Examination Policies, Section 9.1 - Bank Fraud and Insider Abuse, http://www.fdic.gov/regulations/safety/manual/section9-1.html.
9.10.

� Mortgage Loan Fraud
Financial Crimes Enforcement Network
Figure 3 provides a three year reporting trend for these mortgage products.
Figure 3
Home Equity Lines of Credit
Filers identified suspected fraud in home equity lines of credit on 1,492 (3.66%) of the SARs reporting mortgage loan fraud that were filed between April 1, 2006 and March 31, 2007. Over 61% of the suspected fraudulent home equity loans identified in the sampled narratives were classified as fraud for profit.
Specified Stated Income/Low or No DocumentLoans
235
375
633
0100200300400500600700
4/04 - 3/05 4/05 - 3/06 4/06 - 3/07
No.o
fSAR
s

�Mortgage Loan Fraud
Financial Crimes Enforcement Network
Fraudulent Activities and Red Flags
Overview of Fraudulent Activities
A sample of 1,769 depository institution SAR narratives was reviewed to identify additional trends and patterns reported in those narratives. The sampled SARs were reviewed to determine the types of activity and participants reported in the narratives.
Figure 4 provides the types of suspected fraudulent activities identified in the narratives.11
FIGURE 4
ACTIVITIES REPORTED IN SAMPLED SAR NARRATIVES
Activity No. of SARs% of Sampled
SARs
Misrepresentation of income/assets/debts 761 43.02%
Forged/fraudulent documents 496 28.04%
Occupancy fraud 255 14.41%
Appraisal fraud 232 13.11%
ID fraud 180 10.18%
Straw buyers 100 5.65%
ID theft 61 3.45%
Flipping 48 2.71%
In this chart, percentages may exceed 100 percent, as many SAR narratives include descriptions of multiple fraudulent activities.
11.

�0 Mortgage Loan Fraud
Financial Crimes Enforcement Network
Figure 5 provides a comparison of activity type by fraud type,12 i.e. fraud for profit or fraud for housing.13
FIGURE 5
REPORTED FRAUDULENT ACTIVITY BY TYPE OF FRAUD
Type of Activity
Fraud For
ProfitProfit %
of ActivityFraud For Housing
Housing % of
Activity
Misrepresentation of income/assets/debts
239 31.41% 519 68.20%
Forged/fraudulent documents 97 19.56% 395 79.64%
Occupancy Fraud 241 94.51% 14 5.49%
Appraisal Fraud 140 60.34% 77 33.19%
Straw buyers 83 83.00% 15 15.00%
ID Fraud 6 3.33% 174 96.67%
ID Theft 61 100.00% 0 0.00%
Flipping 48 100.00% 0 0.00%
Figure 6 provides a comparison of the reported activities and participants reviewed in the sample.14
Not all SAR narratives provide sufficient details to determine if the activity appears to be fraud for housing or fraud for profit. Consequently, totals in Figure 5 are sometimes lower than totals in Figure 4. For a fuller discussion of fraud for profit and fraud for housing, see page 37.Most of these SARs include multiple subjects; totals do not reflect SAR volume (see Table 4 for SAR totals).
12.
13.14.

��Mortgage Loan Fraud
Financial Crimes Enforcement NetworkFI
GU
RE 6
REP
OR
TED
FR
AU
DU
LEN
T A
CTI
VITY
BY
PAR
TIC
IPA
NT
Part
icip
ant
Mis
repr
esen
tatio
n of
inco
me/
as
sets
/deb
ts
Forg
ed/
frau
dule
nt
docu
men
tsO
ccup
ancy
Fr
aud
App
rais
al
Frau
dSt
raw
bu
yers
ID
Frau
dID
The
ftFl
ippi
ngA
ppra
iser
47
(6.1
8%)
16
(3.2
3%)
42
(16.
47%
)21
5 (9
2.67
%)
25
(25%
)1(
less
th
an
1%)
3 (4
.92%
)48
(1
00%
)
Bor
row
er66
3 (8
7.12
%)
412
(83.
06%
)17
9 (7
0.20
%)
91
(39.
22%
)69
(6
9%)
171
(95%
)25
(4
0.98
%)
28
(58.
33%
)B
uild
er1
(less
than
1%
)1(
less
than
1%
)1
(less
than
1%
)
4 (1
.72%
)0
00
2 (4
.17%
)
Cor
resp
onde
nt
Lend
er15
(1
.97%
)4
(less
than
1%
)
3 (1
.18%
)4
(1.7
2%)
2 (2
%)
3 (1
.67%
)0
1 (2
.08%
)
Insi
der (
loan
of
ficer
)3
(less
than
1%
)11
(2
.22%
)4
(1.5
7%)
6 (2
.59%
)3
(3%
)1
(less
th
an
1%)
1 (1
.64%
)1
(2.0
8%)
Inve
stor
47
(6.1
8%)
5 (1
.00%
)51
(2
0%)
22
(9.4
8%)
11
(11%
)1
(less
th
an
1%)
07
(14.
58%
)
Mor
tgag
e B
roke
r48
8 (6
4.13
%)
338
(68.
15%
)15
8 (6
1.96
%)
113
(48.
71%
)66
(6
6%)
72
(40%
)39
(6
3.93
%)
33
(68.
75%
)R
ealto
r9
(1.1
8%)
4 (le
ss th
an
1%)
4 (1
.57%
)6
(2.5
9%)
4 (4
%)
03
(4.9
2%)
3 (6
.25%
)S
elle
r12
(1
.58%
)8
(1.6
1%)
20
(7.8
4%)
26
(11.
21%
)21
(2
1%)
00
14
(29.
17%
)S
ettle
men
t S
ervi
ces
(incl
udes
at
torn
eys
and
nota
ries)
12
(1.5
8%)
9 (1
.81%
)4
(1.5
7%)
6 (2
.59%
)4
(4%
)1
(less
th
an
1%)
1 (1
.64%
)2
(4.1
7%)

�� Mortgage Loan Fraud
Financial Crimes Enforcement Network
Commonly Reported Variations of Mortgage Fraud
Activities identified through a narrative analysis of the sampled SARs follow.
Misrepresentation of income/assets/debts (43.02%). Material misrepresenta-tion of income, assets, or debts was seen in both reports of fraud for housing (68.20%) and fraud for profit (31.41%). The suspected fraudulent loans were identified during post loan audits (56.37%); pre-funding reviews (24.44%); and upon loan defaults (15.90%). The reported activity involved fraudulent mis-representation of employment and income and/or failure to disclose all debts or assets, such as additional real properties owned. These suspected misrepre-sentations resulted in higher debt to income ratios than considered acceptable, and would likely have precluded the loan issuance if reported accurately. Early payment defaults were reported in 5.12% of these narratives. Mortgage brokers initiated the loans on 64.13% of these reports. Forged/fraudulent documents (15.64%) and occupancy fraud (13.53%) were the most commonly reported ac-tivities in conjunction with misrepresentation of income, assets, or debts.
Forged/fraudulent documents (28.04%). Filers reported submission of fraudu-lent W-2s, tax returns, verifications of deposit; verifications of rent; credit re-ports; and forged signatures on loan documents submitted to support income and assets. This activity was seen in fraud for housing (79.64%) and fraud for profit (19.56%). Mortgage brokers initiated the loans on 68.15% of the reports describing this activity. The suspected fraudulent activity was detected dur-ing pre-loan fund reviews (52.42%); post loan audits (31.05%); loan defaults (9.88%); and victims reporting forged signatures (3.83%).
Occupancy fraud (14.41%). SARs reporting misrepresentation of the borrow-er’s intent to occupy the property as a primary residence most frequently were associated with fraud for profit (94.51%). Generally, this misrepresentation was perpetrated in order to obtain a more favorable finance rate. Real estate inves-tors participated in occupancy fraud for profit in 20% of these reports. A small percentage of the reports involving occupancy fraud (5.49%) described indi-viduals acting as straw buyers for family members in order to help them obtain property. Mortgage brokers originated the loans involving suspected occupan-cy fraud on 61.96% of these reports.
Appraisal Fraud (13.11%). Narratives indicating appraisal fraud described suspected fraud for profit in 60.34% and fraud for housing in 33.19% of filings. Generally the suspected fraud was committed through the use of inappropriate
•
•
•
•

��Mortgage Loan Fraud
Financial Crimes Enforcement Network
comparable properties to inflate property evaluations; inaccurate descriptions of the subject properties (failure to cite deficiencies or needed repairs); theft of a licensed appraiser’s license number, or forgery of licensed appraiser’s sig-nature. In addition to appraisers, participants in loans where reviewed SARs indicated suspected appraisal fraud included: borrowers/investors (48.71%); mortgage brokers (48.71%); sellers (11.21%); loan settlement providers (includ-ing attorneys, and notaries) (2.59%); insider loan officers (2.59%); and corre-spondent lenders (1.72%).
ID Fraud (10.18%). Identity fraud, the unauthorized and illegal use of another person’s Social Security Number or a fraudulent (invented) Social Security Number not yet issued by the Social Security Administration, was nearly al-ways classified as fraud for housing. Mortgage brokers reportedly originated 40% of the loans that were reported for identity fraud. Borrowers requested a change of the Social Security Number associated with their loans on 7.26% of these reports, thereby highlighting a likely identity fraud. Individuals who were associated with an ITIN15 after obtaining a loan with a Social Security Number were identified on 17.22% of these reports. Filers identified the use of an ITIN prior to loan funding on 67.74% of the reports.
Straw buyers (5.65%). Straw buyers were used in both fraud for profit (83%) and fraud for housing (15%) schemes. In the cases of fraud for housing, filers described individuals acting as straw buyers to help family and friends obtain property. Filers noted that mortgage brokers initiated the loans on 66% of nar-ratives describing straw buyers. Many of the reports described individuals act-ing as straw buyers who failed to disclose all of their assets and liabilities, such as additional properties and mortgages they held.
ID Theft (3.45%). Identity theft involved the actual theft of another person’s true identity with the intention of obtaining a loan. All of the SARs reporting identity theft were classified as fraud for profit. Mortgage brokers originated the loans on 63.93% of the reports of identity theft. Suspected elder exploita-tion was described in six (9.84%) of the identity theft reports. Victims informed filers of identity theft activity in 65.57% of these reports. Filers identified the activity prior to funding the loan on 18.03% of the reports.
•
•
•
The IRS issues ITINs to help individuals comply with the U.S. tax laws, and to provide a means to efficiently process and account for tax returns and payments for those who do not have, nor are eligible for SSNs.
15.

�� Mortgage Loan Fraud
Financial Crimes Enforcement Network
Flipping (2.71%). All narratives describing flipping were classified as fraud for profit. Appraisal fraud was a part of fraudulent flipping on all narratives. Filers noted that mortgage brokers originated the loans on 68.75% of the narra-tives describing flipping.
Elaborate Mortgage Fraud Schemes
Although the numbers of SAR narratives describing elaborate mortgage fraud schemes did not constitute a particularly significant percentage of the entire sample, some of these narratives described apparent fraud for profit schemes that were nota-bly elaborate and organized. These schemes are described below.
Mortgage rescue schemes. Seven of the sampled narratives described fraudu-lent mortgage rescue schemes. Fraud perpetrators preyed on individuals threatened with foreclosure of their homes. Typically, the home owner was told that if they signed a quit claim deed for the benefit of the rescuer, the mort-gage would be paid and the homeowner could continue living in the house with the promise that the property would be deeded back when the homeown-er was able to obtain refinancing. The rescuer recorded the quit claim deed and then sold the property. Whereas in these instances, the borrower was the vic-tim of the fraud, another type of mortgage rescue scheme defrauded the lender. In these cases, borrowers participated as straw buyers to purchase property and then quit claim the property back to the seller. This was considered a type of mortgage rescue scheme since typically the sellers were in default when the transfers occurred.
“Freeman in nature” schemes. Four reports described attempted fraudulent payoffs with “Freeman in nature” arguments.16 These arguments claimed that no money exchanged hands (i.e., the loan was merely a paper transac-tion), therefore there was no duty to repay the mortgage. Suspected Freeman schemes made up less than 1% of the sampled narratives, but they represent a danger to both lenders and homeowners. The reviewed Freeman schemes fre-quently resulted in the filing of fraudulent lien releases in county land records endangering the lender’s loan security. Ultimately, homeowners who partici-pate in these schemes lose their homes.
•
•
•
“Freeman in nature” arguments refer to specious arguments that avow that the funds were never loaned and therefore the borrower has no duty to repay the mortgage. These arguments rely on an unreasonable interpretation of Section 1-207 of the Uniform Commercial Code that has never been affirmed or supported by any court or governmental authority.
16.

��Mortgage Loan Fraud
Financial Crimes Enforcement Network
Asset rental. Ten of the sampled narratives described suspected fraudulent attempts to temporarily inflate borrowers’ assets in order to qualify them for loans. Typically, the borrower’s name was added to an existing account. Af-ter the institution holding the account verified the assets in that account, the borrower’s name was removed. Eight (80%) of these reports were submitted by the institutions that were requested to prepare verifications of deposit. The fil-ers noticed that the funds were withdrawn or the names were removed shortly after a verification of deposit request was completed. These proactive reports demonstrated an awareness of this type of fraud and provided examples of successful industry efforts to identify them. Institutions receiving verification of deposit (VOD) requests are well posi-tioned to detect and prevent some asset rental schemes. It may be a red flag when an account holder repeatedly adds new names to an account, then drops them shortly after the bank responds to a VOD. In these cases, the account holder may have added the loan applicant’s name to the account to boost the latter’s (apparent) available assets. Recurring incidents of this type of asset rental suggest that the asset renter likely has a direct connection to the loan processor, either a broker or a bank insider that routinely arranges for loans. Banks tracking suspicious activity that includes VOD requests can note on their SAR the party that requests the VOD in either the subject field or the narrative, as is appropriate. Other instances of asset rental were detected when filers noted that funds were temporarily deposited into the loan applicant’s bank account for the time required to qualify for a loan. The funds came from friends or family, or even from mortgage brokers attempting to qualify an ineligible borrower. The temporary funds were withdrawn from the bank account after the loans were approved. Since these transactions only occur once, they are more difficult to detect than using the method above. However, the asset renter faces greater risk of losing his or her borrowed funds.
•

�� Mortgage Loan Fraud
Financial Crimes Enforcement Network
Fraudulent investment schemes. Borrowers obtained loans for multiple prop-erties within a short period of time. Frequently the subject properties were located in states outside the borrower’s home state. The fraudulent activities generally included appraisal fraud, occupancy fraud, fraudulent property flipping, forged or fraudulent documents, and misrepresentation of assets and debts. These schemes also included borrowers participating in fraudulent real estate investment schemes by agreeing to have their personal credit used to acquire mortgages in return for a fee plus the promise of additional commis-sions when the property was resold. Investors were told the properties would be renovated and sold in approximately one year, and that mortgage payments would be made with rental income. The fraudulent activities generally includ-ed appraisal fraud, asset rental fraud, occupancy fraud, straw buyer, and mis-representation of assets and debts. Ultimately the borrowers were left owing mortgages that exceeded the property value.
Creating false down payments for properties. Activities included depositing advances from credit cards into bank accounts then using those funds to ob-tain official checks payable to a title company. The funds were later returned from the title company to the bank account. In reality, the property was obtained for no money down, while creating a false appearance to the lender that the borrower had made a down payment. Another variation reported was the disguising of purchase loans as refinance loans with no money down and possibly cash back at the time of settlement. In reality the property is transferred to the borrower at the time the “refinance” loan is closed. This type of activity increases the likelihood the borrower will default on the loan since the borrower has no financial vested interest, since their earnest money was funded by a loan. Lenders may find it helpful to review the HUD-1 settlement statement for disbursements to unknown individuals or entities. These disbursements may represent payments to the sellers.
Short payoff. Inflated appraisals were used to obtain the subject loans. Bor-rowers defaulted on the loans and claimed a fraudulent hardship, such as loss of employment or illness. The borrowers further claimed they were victims of appraisal fraud and requested that the lenders accept short payoffs. The pro-posed payoffs were based on legitimate appraisals that were significantly less (40 to 60 percent less) than the appraisals used to obtain the loans.
•
•
•
��Mortgage Loan Fraud
Financial Crimes Enforcement Network
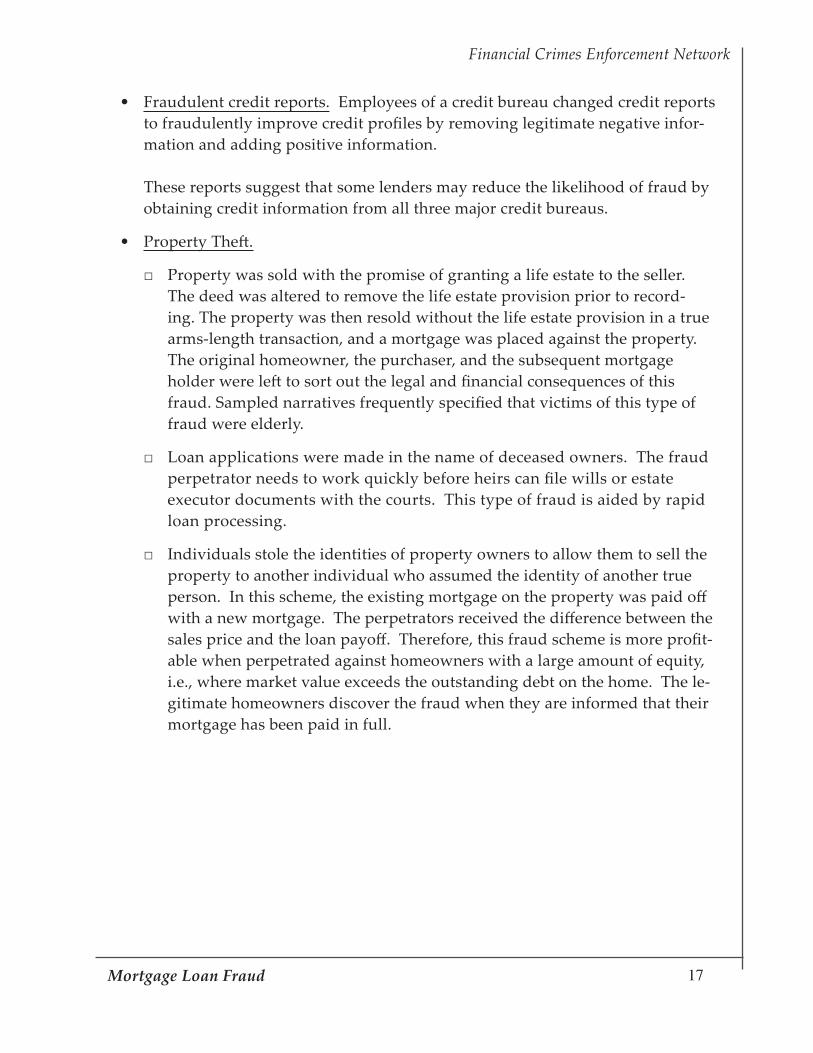
Fraudulent credit reports. Employees of a credit bureau changed credit reports to fraudulently improve credit profiles by removing legitimate negative infor-mation and adding positive information. These reports suggest that some lenders may reduce the likelihood of fraud by obtaining credit information from all three major credit bureaus.
Property Theft.
Property was sold with the promise of granting a life estate to the seller. The deed was altered to remove the life estate provision prior to record-ing. The property was then resold without the life estate provision in a true arms-length transaction, and a mortgage was placed against the property. The original homeowner, the purchaser, and the subsequent mortgage holder were left to sort out the legal and financial consequences of this fraud. Sampled narratives frequently specified that victims of this type of fraud were elderly.
Loan applications were made in the name of deceased owners. The fraud perpetrator needs to work quickly before heirs can file wills or estate executor documents with the courts. This type of fraud is aided by rapid loan processing.
Individuals stole the identities of property owners to allow them to sell the property to another individual who assumed the identity of another true person. In this scheme, the existing mortgage on the property was paid off with a new mortgage. The perpetrators received the difference between the sales price and the loan payoff. Therefore, this fraud scheme is more profit-able when perpetrated against homeowners with a large amount of equity, i.e., where market value exceeds the outstanding debt on the home. The le-gitimate homeowners discover the fraud when they are informed that their mortgage has been paid in full.
•
•
□
□
□

�� Mortgage Loan Fraud
Financial Crimes Enforcement Network
ID theft of the true homeowner’s identity to apply for home equity lines of credit or cash-out refinancing. “Shotgunning” is frequently a part of this fraud. In this scheme, the borrower applies for multiple loans from mul-tiple lenders on the same property in a short period of time. This allows the identity thief to take advantage of lag time in recording the mortgages. Consequently, lenders are unable to identify the existence of the other loans. By the time the lender is aware of the other mortgages, the loan payment has already been provided. Successful applications usually result in first payment defaults.
□

��Mortgage Loan Fraud
Financial Crimes Enforcement Network
Protective Measures
Effective Fraud Detection Measures Used by Filers
Filers reported various measures for detecting potential mortgage loan fraud involv-ing particular examination procedures and red flag indicators. There are a variety of legitimate transactions that can raise a red flag, and the mere presence of a red flag does not automatically indicate suspicious or illicit activity. The following red flags and detection measures were derived from a review of SAR narratives describing mortgage loan fraud detection measures.
Some lending institutions rely heavily, though not exclusively, on submitting brokers to perform proper due diligence checks on the loan applicant. Sampled SAR narratives suggest that lending institutions performing independent due diligence on the borrower and conducting re-verification of documents increase their ability to detect fraud. In many cases, these checks can quickly identify document fraud. Additionally, by tracking failure rates of loans associated with particular brokers, lenders are detecting systematic abuses.
In many cases, applying simple reasonability tests are sufficient to detect fraudu-lent documents. For instance, a much greater than normal increase in year-to-year income or an occupational income far higher than those of others in the same line of work can present a red flag. An effective measure to detect fraudulent documents includes performing routine tests to ensure the applicant’s reported Social Security and Medicare withholdings do not exceed the limits established by law.
Borrowers purchasing property described as a primary residence, but outside of their home states, or located an unreasonable commuting distance from their stated employer, could be an indication that the borrowers do not truly intend for the property to be their principal residence. This could be an indication of straw buyer involvement or that the property is intended as an investment rather than a princi-pal residence.
Mortgage brokers or borrowers that always use the same appraiser can be a red flag for appraisal fraud in some instances.

�0 Mortgage Loan Fraud
Financial Crimes Enforcement Network
In some cases, identity theft can be detected and prevented by ensuring that the borrower’s signature matches on all documents. Sampled SAR narratives show multiple instances of alert reviewers detecting fraudulent applications by comparing document signatures and finding discrepancies. Alert loan settlement providers can also prevent ID theft by ensuring that all parties present acceptable photo identifica-tion and ensuring that all documents are signed in front of a licensed notary public.
Multiple problematic loan applications containing the same parties working in conjunction with one another may also be a red flag for organized fraud. For ex-ample, numerous transactions involving the same mortgage broker, seller, appraiser, and settlement agency may be a red flag for a fraudulent arrangement.
Other Protective Measures
As noted below in the section on “Findings Observed from Sampled Narratives,” financial institutions are increasingly detecting fraud prior to loan funding.17 The most effective financial institutions observed in the sample achieved this during the underwriting process by re-verifying the information provided in the loan applica-tion. Various federal regulatory agencies have issued guidance in response to con-sumer protection concerns and for reasons of safety and soundness. This guidance may provide further insight on fraud detection. Some of these documents include guidance on issuing subprime loans,18 and best foreclosure prevention practices.19 In addition, various state agencies have offered guidance to banks on mortgage lending practices as well.20
Lenders are encouraged to use the loan settlement statement (frequently the Form HUD-1) to identify clues about possible loan fraud prior to loan disbursal. Close scrutiny of where the loan funds are going could identify potential fraud prior to loan disbursement. Anecdotal reporting by law enforcement suggests that an atypi-cally large disbursement or more of the funds to an entity or individual whose role in the transaction is not readily apparent could be an indication of fraud.
See subsection Fraud Detection.For an example of this, see Statement on Subprime Mortgage Lending, issued jointly by the Office of the Comptroller of the Currency, Federal Reserve System, Federal Deposit Insurance Corporation, Office of Thrift Supervision, and National Credit Union Administration. The full document can be found at: http://www.occ.treas.gov/ftp/release/2007-64a.pdf.For example, see Foreclosure Prevention: Improving Contact with Borrowers, Office of the Comptroller of the Currency, http://www.occ.treas.gov/cdd/Foreclosure_Prevention_Insights.pdf. For instance, various guidelines can be found on the Conference of State Bank Supervisors website; see http://www.csbs.org.
17.18.
19.
20.

��Mortgage Loan Fraud
Financial Crimes Enforcement Network
Trends and Patterns in Total SARs Reporting Mortgage Loan Fraud
S ARs reporting suspected mortgage loan fraud continue to increase. This study includes SARs reporting suspected mortgage loan fraud filed between April 1, 2006 and March 31, 2007. Figure 7 below provides a graphic depiction
of the filing trend of SARs reporting suspected mortgage loan fraud.
Figure 7
MORTGAGE LOAN FRAUD REPORTING TREND
37,313
52,868
25,989
18,391
9,5395,3874,6963,5152,9342,2691,720
0
10,000
20,000
30,000
40,000
50,000
60,000
1997 1998 1999 2000 2001 2002 2003 2004 2005 2006 2007
No.
ofSA
Rs
Quick Facts
Financial institutions filed 37,313 SARs citing suspected mortgage fraud in 2006, a 44% increase from 2005.
A comparison of 1st quarters 2006 and 2007 shows a 37% increase in SARs identifying mortgage fraud.
•
•

�� Mortgage Loan Fraud
Financial Crimes Enforcement Network
A comparison of SARs reporting suspected mortgage loan fraud for the first quar-ter of 2006 to the first quarter of 2007 revealed a growth of 36.79%.
Figure 8 provides this comparison.
FIGURE 8
COMPARISON OF 1ST QTR 2006 TO 1ST QTR 2007
2006 2007Percentage of
Growth
January 2,087 3,422 63.97%
February 2,301 3,522 53.06%
March 3,034 3,946 30.06%
Total 9,428 12,897 36.79%
Growth in SARs reporting mortgage loan fraud continues to outpace the growth of total depository institution SARs. Figure 9 provides the percentages of growth for all depository institution SARs and depository institution SARs reporting mortgage loan fraud while Figure 10 provides a graphic depiction of the growth.
FIGURE 9
COMPARISON OF GROWTH IN TOTAL DEPOSITORY SARs TO GROWTH IN SARs REPORTING MORTGAGE LOAN FRAUD
Year
Total Depository Institution
SAR Filings
Mortgage Loan Fraud
SARs
Growth in Total
Depository SARs
Growth in Mortgage
Loan Fraud SARs
1996 62,388 1,318 N/A N/A
1997 81,197 1,720 45.81% 30.50%
1998 96,521 2,269 18.87% 31.92%
1999 120,505 2,934 24.85% 29.31%
(FIGURE 9 continued on the next page)

��Mortgage Loan Fraud
Financial Crimes Enforcement Network
Year
Total Depository Institution
SAR Filings
Mortgage Loan Fraud
SARs
Growth in Total
Depository SARs
Growth in Mortgage
Loan Fraud SARs
2000 162,720 3,515 35.03% 19.80%
2001 203,538 4,696 25.08% 33.60%
2002 273,823 5,387 34.53% 14.71%
2003 288,343 9,539 5.30% 77.07%
2004 381,671 18,391 32.37% 92.80%
2005 522,655 25,989 36.94% 41.31%
2006 567,080 37,313 7.75% 43.57%
TOTAL 2,757,367 113,071
FIGURE 10
DEPOSITORY INSTITUTION SAR FILING PERCENTAGE OFGROWTH COMPARED TO MORTGAGE LOAN FRAUD
PERCENTAGE OF GROWTH
0%
20%
40%
60%
80%
100%
1997 1998 1999 2000 2001 2002 2003 2004 2005 2006
Growth in Total SARs Growth in Mortgage Loan Fraud SARs
Perc
enta
geof
chan
ge
(FIGURE 9 continued from the previous page)

�� Mortgage Loan Fraud
Financial Crimes Enforcement Network
Characterizations of Suspicious Activity
Many reports included more than one characterization of suspicious activity in ad-dition to mortgage loan fraud.21 False statement was the most reported suspicious activity in conjunction with mortgage loan fraud. Figure 11 reveals secondary charac-terizations of suspicious activities reported in conjunction with mortgage loan fraud and compares this to percentages from the preceding ten years. Reports of identity theft doubled from 2% to 4% of the SARs filed. Although the overall numbers of re-ports were small, computer intrusion also saw a significant percentage increase.
FIGURE 11
COMPARISON OF INITIAL AND UPDATED REPORTS BY CHARACTERIZATION OF SUSPICIOUS ACTIVITY
Characterization of Suspicious Activity
Updated Report (4/06 – 3/07)
Initial Report (4/96 – 3/06)
Percentage of Change
Mortgage Loan Fraud 100.00% 100.00% 0.00%
False Statement 29.43% 18.58% 58.42%
Other 4.65% 3.80% 22.36%
Identity Theft 4.17% 2.13% 95.62%
Consumer Loan Fraud 1.48% 0.84% 74.99%
Misuse of Position or Self Dealing
0.71% 1.47% -51.79%
BSA/Structuring/Money Laundering
0.60% 0.31% 95.25%
Check Fraud 0.26% 0.31% -14.28%
In our examination in mortgage loan fraud SARs, we identified 69 SARs with multiple activity characterizations that contained one or more mischaracterizations of financial crimes, including primary activities and those secondary to mortgage loan fraud. As the full 69 only reflect about one-tenth of one percent of all mortgage loan fraud SARs, the errors are not statistically significant.
21.
(FIGURE 11 continued on the next page)

��Mortgage Loan Fraud
Financial Crimes Enforcement Network
Characterization of Suspicious Activity
Updated Report (4/06 – 3/07)
Initial Report (4/96 – 3/06)
Percentage of Change
Counterfeit Instrument 0.19% 0.26% -26.97%
Defalcation/Embezzlement 0.15% 0.45% -66.77%
Computer Intrusion 0.13% 0.04% 214.01%
Wire Transfer Fraud 0.12% 0.20% -39.89%
Mysterious Disappearance22 n/a n/a n/a
Counterfeit Check 0.07% 0.08% -17.55%
Check Kiting 0.05% 0.07% -37.73%
Credit Card Fraud 0.04% 0.07% -42.97%
Bribery/Gratuity 0.03% 0.08% -64.14%
Terrorist Financing23 n/a n/a n/a
Debit Card Fraud 0.00% 0.03% -100.00%
Commercial Loan Fraud 0.00% 0.49% -100.00%
Counterfeit Credit/Debit Card
0.00% 0.01% -100.00%
Approximately half of the 30 reports characterized as mysterious disappearance appear to be misclassified. These mischaracterizations likely resulted from human or computer errors. For example, several SARs specified multiple activities including mortgage loan fraud, terrorist financing, identity theft, mysterious disappearance, but for all these SARs the activities were in fact attempts to evade filing thresholds for BSA documents, as gleaned from the filers’ thorough narrative descriptions.Although twelve SARs listed terrorist financing in conjunction with mortgage loan fraud, a close review of those SARs revealed that all these reports were mischaracterized.
22.
23.
(FIGURE 11 continued from the previous page)

�� Mortgage Loan Fraud
Financial Crimes Enforcement Network
Primary Federal Regulators
Figure 12 displays the primary federal regulators identified in the reports of mort-gage loan fraud.24 National banks with offices located throughout the country made up the largest group of lenders reporting mortgage loan fraud. The Office of the Comptroller of the Currency (OCC) is the primary regulator for national banks. National banks filed about a third of the total reports.
Figure 12
The Office of Federal Housing Enter-prise Oversight (OFHEO) is the federal regulator for two government spon-sored enterprises — Fannie Mae and Freddie Mac. In 2006, OFHEO adopted a final rule which established a process for the enterprises’ reporting of possible mortgage fraud to OFHEO and corre-sponding reporting to FinCEN. As this process continues to develop, FinCEN will continue to monitor these filings for developing trends.
Quick Facts
The top five subject states for reported mortgage fraud were California, Florida, Illinois, Georgia, and Texas.
SAR filings on suspected mortgage fraud subjects increased by more than 50% in ten subject states over the previous year.
•
•
Primary Federal Regulators
195
11,263
13,465
10,996
4,653
0
2,000
4,000
6,000
8,000
10,000
12,000
14,000
16,000
NCUA FDIC FED OTS OCC
SA
Rs
Some SARs did not indicate the primary regulator.24.

��Mortgage Loan Fraud
Financial Crimes Enforcement Network
Top Filing Institutions
In all, 788 depository institutions and their subsidiaries filed 40,781 SARs on sus-pected mortgage loan fraud (6.8% of total SARs filed in the same period) during the period April 1, 2006 through March 31, 2007. The top 10 filers that listed mortgage loan fraud as a category account for 61% of these SARs, while the top 25 filers ac-count for 87% of the total.
Fraud Locations
SARs contain data fields for subject addresses, the filer’s main office address, and the filer’s branch address where the suspicious activity was discovered. Because the subject address provides the best source for identifying geographic locations of real estate involved in mortgage loan fraud, this study identified the location of the fraud by the subject address. This is because most residential mortgage loan appli-cants intend to reside on the property used to secure the loan. In the SARs reviewed in this study, suspicious activity occurred in, or was otherwise associated with, all 50 states, the District of Columbia, Puerto Rico, and American Samoa.
�� Mortgage Loan Fraud
Financial Crimes Enforcement Network
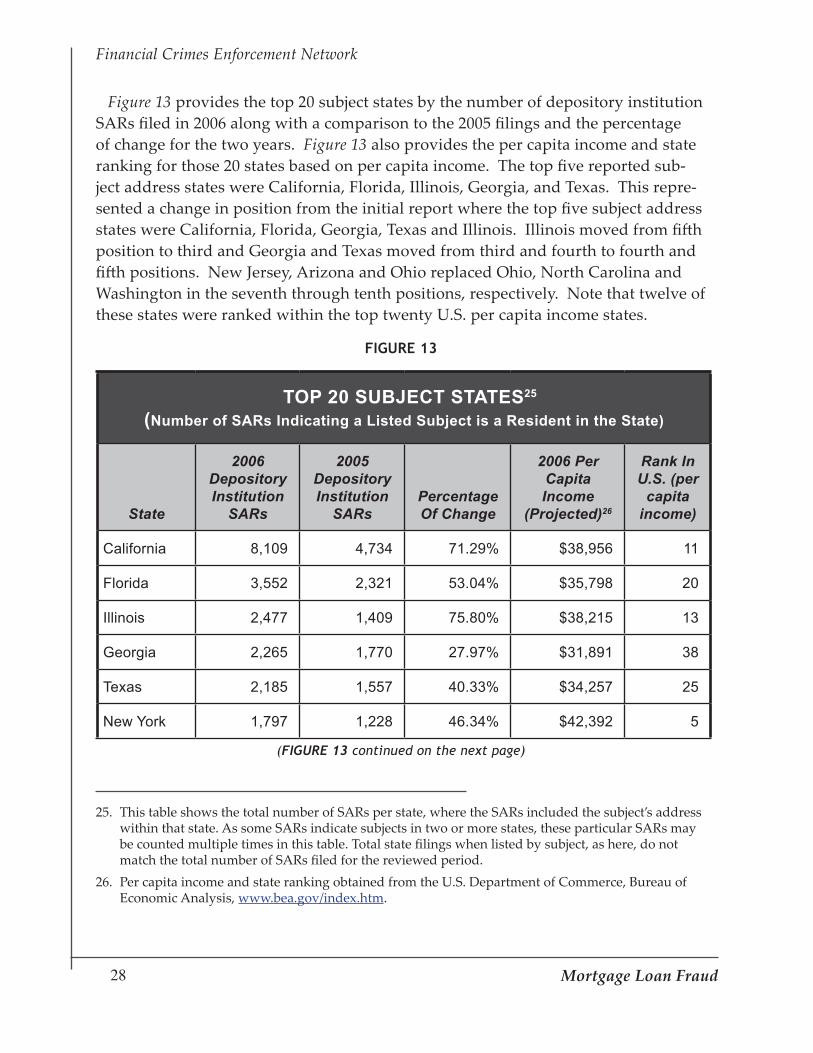
Figure 13 provides the top 20 subject states by the number of depository institution SARs filed in 2006 along with a comparison to the 2005 filings and the percentage of change for the two years. Figure 13 also provides the per capita income and state ranking for those 20 states based on per capita income. The top five reported sub-ject address states were California, Florida, Illinois, Georgia, and Texas. This repre-sented a change in position from the initial report where the top five subject address states were California, Florida, Georgia, Texas and Illinois. Illinois moved from fifth position to third and Georgia and Texas moved from third and fourth to fourth and fifth positions. New Jersey, Arizona and Ohio replaced Ohio, North Carolina and Washington in the seventh through tenth positions, respectively. Note that twelve of these states were ranked within the top twenty U.S. per capita income states.
FIGURE 13
TOP 20 SUBJECT STATES25
(Number of SARs Indicating a Listed Subject is a Resident in the State)
State
2006 Depository Institution
SARs
2005 Depository Institution
SARsPercentage Of Change
2006 Per Capita Income
(Projected)26
Rank In U.S. (per
capita income)
California 8,109 4,734 71.29% $38,956 11
Florida 3,552 2,321 53.04% $35,798 20
Illinois 2,477 1,409 75.80% $38,215 13
Georgia 2,265 1,770 27.97% $31,891 38
Texas 2,185 1,557 40.33% $34,257 25
New York 1,797 1,228 46.34% $42,392 5
This table shows the total number of SARs per state, where the SARs included the subject’s address within that state. As some SARs indicate subjects in two or more states, these particular SARs may be counted multiple times in this table. Total state filings when listed by subject, as here, do not match the total number of SARs filed for the reviewed period. Per capita income and state ranking obtained from the U.S. Department of Commerce, Bureau of Economic Analysis, www.bea.gov/index.htm.
25.
26.
(FIGURE 13 continued on the next page)

��Mortgage Loan Fraud
Financial Crimes Enforcement Network
State
2006 Depository Institution
SARs
2005 Depository Institution
SARsPercentage Of Change
2006 Per Capita Income
(Projected)
Rank In U.S. (per
capita income)
Michigan 1,671 1,103 51.50% $33,847 27
New Jersey 1,119 771 45.14% $46,344 2
Arizona 1,050 706 48.73% $31,458 39
Ohio 957 765 25.10% $33,338 29
Virginia 818 581 40.79% $39,173 9
Colorado 817 687 18.92% $39,186 8
Maryland 803 573 40.14% $44,077 4
Minnesota 758 426 77.93% $38,712 12
North Carolina
644 605 6.45% $32,234 36
Indiana 640 435 47.13% $32,526 33
Pennsylvania 635 553 14.83% $36,680 18
Missouri 605 487 24.23% $32,705 31
Washington 584 480 21.67% $37,423 14
Nevada 562 361 55.68% $37,089 17
(FIGURE 13 continued from the previous page)

�0 Mortgage Loan Fraud
Financial Crimes Enforcement Network
Figure 14 provides the percentage of change in reporting for all subject states along with data from the U.S. Department of Commerce, Bureau of Economics reporting the per capita income and state rankings for 2006 (projected). Although Alaska had only 38 SARs reporting mortgage loan fraud in 2006, it was the state with the largest growth in reports of mortgage loan fraud by percentage increase. States with nega-tive growth included South Dakota, Iowa, Vermont, South Carolina, New Mexico, and Kansas. Eleven of the twenty states showing the greatest increase in reported subjects were ranked within the top twenty states for per capita income.
FIGURE 14
PERCENTAGE OF CHANGE IN REPORTED SUBJECT STATES
State
2006 Depository Institution
SARs
2005 Depository Institution
SARsPercentage Of Change
2006 Per Capita Income
(Projected)27
Rank In U.S.(per capita
income)
Alaska 38 8 375.00% $37,271 16
Rhode Island 164 47 248.94% $37,388 15
Minnesota 758 426 77.93% $38,712 12
Illinois 2,477 1,409 75.80% $38,215 13
Massachusetts 477 276 72.83% $45,877 3
California 8,109 4,734 71.29% $38,956 11
Mississippi 150 92 63.04% $26,535 50
Nevada 562 361 55.68% $37,089 17
Florida 3,552 2,321 53.04% $35,798 20
Michigan 1,671 1,103 51.50% $33,847 27
Arizona 1,050 706 48.73% $31,458 39
Per capita income and state ranking obtained from the U.S. Department of Commerce, Bureau of Economic Analysis, www.bea.gov/index.htm.
27.
(FIGURE 14 continued on the next page)

��Mortgage Loan Fraud
Financial Crimes Enforcement Network
State
2006 Depository Institution
SARs
2005 Depository Institution
SARsPercentage Of Change
2006 Per Capita Income
(Projected)
Rank In U.S.(per capita
income)
Indiana 640 435 47.13% $32,526 33
Idaho 148 101 46.53% $29,952 43
New York 1,797 1,228 46.34% $42,392 5
Arkansas 95 65 46.15% $27,935 48
Wisconsin 495 340 45.59% $34,701 22
New Jersey 1,119 771 45.14% $46,344 2
Connecticut 252 174 44.83% $49,852 1
Maine 42 29 44.83% $32,348 34
Alabama 242 169 43.20% $31,295 40
Virginia 818 581 40.79% $39,173 9
Texas 2,185 1,557 40.33% $34,257 25
Maryland 803 573 40.14% $44,077 4
Utah 414 312 32.69% $29,108 47
District of Columbia
67 51 31.37% $55,755 --
Tennessee 483 376 28.46% $32,304 35
Georgia 2,265 1,770 27.97% $31,891 38
New Hampshire
61 48 27.08% $39,311 7
Montana 33 26 26.92% $30,688 42
Ohio 957 765 25.10% $33,338 29
Missouri 605 487 24.23% $32,705 31
(FIGURE 14 continued on the next page)
(FIGURE 14 continued from the previous page)

�� Mortgage Loan Fraud
Financial Crimes Enforcement Network
State
2006 Depository Institution
SARs
2005 Depository Institution
SARsPercentage Of Change
2006 Per Capita Income
(Projected)
Rank In U.S.(per capita
income)
Louisiana 222 181 22.65% $30,952 41
Washington 584 480 21.67% $37,423 14
Hawaii 73 60 21.67% $36,299 19
Nebraska 63 52 21.15% $34,397 23
Colorado 817 687 18.92% $39,186 8
Wyoming 14 12 16.67% $40,676 6
Delaware 50 43 16.28% $39,022 10
Oklahoma 195 168 16.07% $32,210 37
Pennsylvania 635 553 14.83% $36,680 18
Kentucky 162 146 10.96% $29,352 46
North Carolina
644 605 6.45% $32,234 36
Oregon 260 257 1.17% $33,666 28
West Virginia 34 34 0.00% $27,897 49
North Dakota 6 6 0.00% $32,552 32
Kansas 172 175 -1.71% $34,743 21
New Mexico 120 126 -4.76% $29,673 44
South Carolina
376 405 -7.16% $29,515 45
Vermont 11 12 -8.33% $34,264 24
Iowa 87 95 -8.42% $33,236 30
South Dakota
9 12 -25.00% $33,929 26
(FIGURE 14 continued from the previous page)

��Mortgage Loan Fraud
Financial Crimes Enforcement Network
The maps above depict the volume of SARs identifying subject states associated with suspected mortgage loan fraud for 2005 and 2006.
KY146
IN435
AK8
IL
51
2005 Mortgage Fraud Subject Map
WA480
ID101
MT26
WY12
OR257
NV361
UT312
CO687
AZ706
NM126
OK168
ND6
SD12
NE52
KS175
MN426
IA95
MO487
AR65
LA181
AL169
MS92
VA581
KY146
TN376
NC605
SC405
MI1,103
OH765
WI340
WV34
ME29
PA553IN
435
MA276
VT12 NH
48
MD573
AK
HI60
DE43 NJ
771
CT174
RI47
CA4,734
GA1,770
FL2,321
TX1,587
IL1,409
Greater than 1,000
Between 500 – 1,000
Between 100 - 499
Less than 100
DC51
2006 Mortgage Fraud Subject Map
MO605
AR95
LA222
VA818
MI
WV34
FL
WA584
ID148
MT33
WY14
OR260
NV652
UT414
CO817
AZ1,050
NM120
OK195
ND6
SD9
NE63
KS172
MN758
IA87
MO605
AR95
LA222
AL242
MS150
VA818
KY162
TN483
NC644
SC376
MI1,671
OH957
WI495
WV34
ME42
NY1,797
NY1,228
PA635IN
640
MA477
VT11
NH61
MD803
AK38
HI73
DE50
NJ1,119
CT252
RI164
CA8,109
GA2,265
FL3,552
TX2,185
IL2,477
Greater than 1,000
Between 500 – 1,000
Between 100 - 499
Less than 100
DC67
8
�� Mortgage Loan Fraud
Financial Crimes Enforcement Network
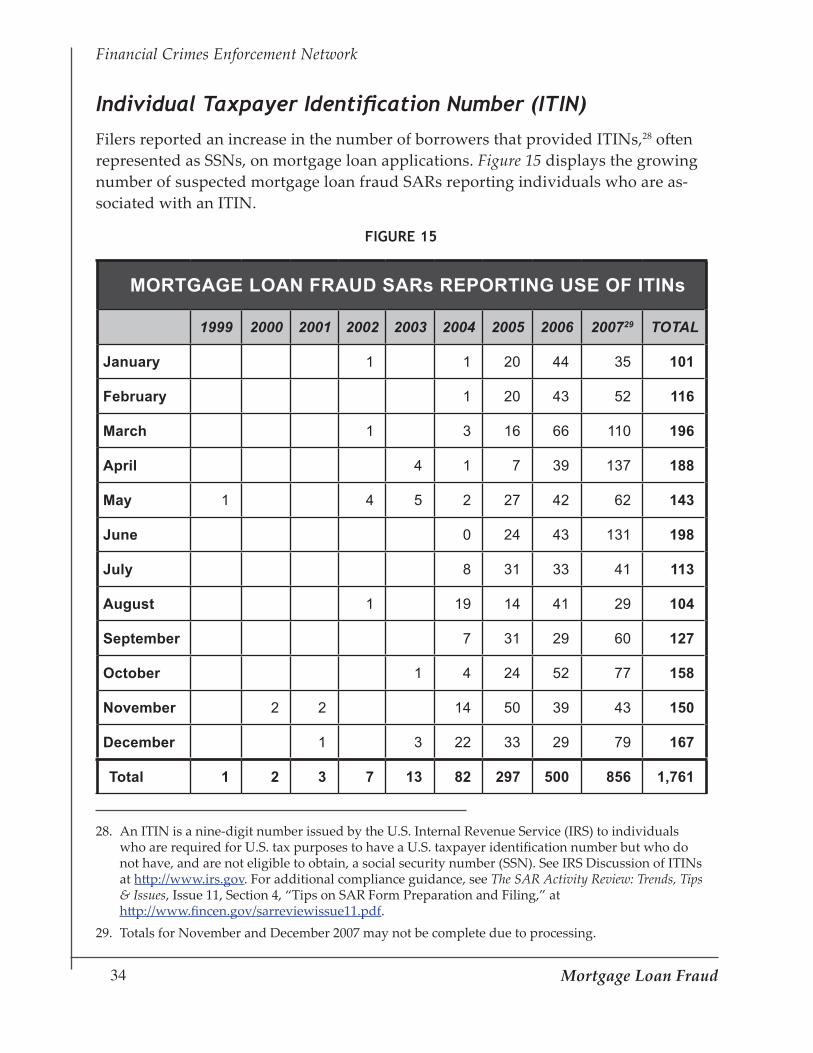
Individual Taxpayer Identification Number (ITIN)
Filers reported an increase in the number of borrowers that provided ITINs,28 often represented as SSNs, on mortgage loan applications. Figure 15 displays the growing number of suspected mortgage loan fraud SARs reporting individuals who are as-sociated with an ITIN.
FIGURE 15
MORTGAGE LOAN FRAUD SARs REPORTING USE OF ITINs
1999 2000 2001 2002 2003 2004 2005 2006 200729 TOTAL
January 1 1 20 44 35 101
February 1 20 43 52 116
March 1 3 16 66 110 196
April 4 1 7 39 137 188
May 1 4 5 2 27 42 62 143
June 0 24 43 131 198
July 8 31 33 41 113
August 1 19 14 41 29 104
September 7 31 29 60 127
October 1 4 24 52 77 158
November 2 2 14 50 39 43 150
December 1 3 22 33 29 79 167
Total 1 2 3 7 13 82 297 500 856 1,761
An ITIN is a nine-digit number issued by the U.S. Internal Revenue Service (IRS) to individuals who are required for U.S. tax purposes to have a U.S. taxpayer identification number but who do not have, and are not eligible to obtain, a social security number (SSN). See IRS Discussion of ITINs at http://www.irs.gov. For additional compliance guidance, see The SAR Activity Review: Trends, Tips & Issues, Issue 11, Section 4, “Tips on SAR Form Preparation and Filing,” at http://www.fincen.gov/sarreviewissue11.pdf. Totals for November and December 2007 may not be complete due to processing.
28.
29.
��Mortgage Loan Fraud
Financial Crimes Enforcement Network
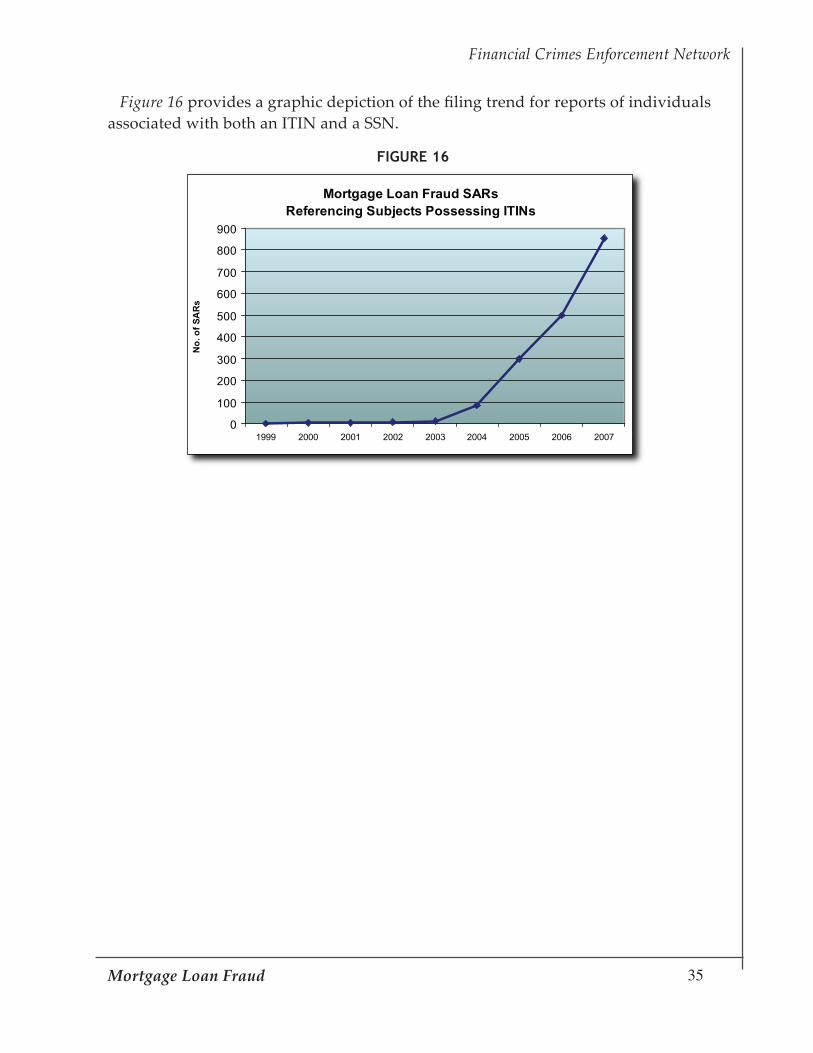
Figure 16 provides a graphic depiction of the filing trend for reports of individuals associated with both an ITIN and a SSN.
FIGURE 16
Mortgage Loan Fraud SARsReferencing Subjects Possessing ITINs
0
100
200
300
400
500
600
700
800
900
1999 2000 2001 2002 2003 2004 2005 2006 2007
No.
ofSA
Rs
.

�� Mortgage Loan Fraud
Financial Crimes Enforcement Network

��Mortgage Loan Fraud
Financial Crimes Enforcement Network
Findings Observed from Sampled Narratives
A sample of 1,769 depository institution SAR narratives was reviewed to iden-tify additional trends and patterns reported in those narratives. Comparisons to the findings in the FinCEN report published November 2006 were made
whenever possible. The percentages presented frequently do not add up to 100% because not all narratives provided sufficient information to determine classifica-tions such as loan types, fraud types, and activities.
Types of Fraud
Mortgage fraud is generally divided into two broad categories: fraud for housing and fraud for profit. Fraud for housing was the most common type reported in the sampled narratives (60%).30 Fraud for profit was reported in just over 36% of the sampled narratives.
For this study, occurrences are classified as fraud for profit in SARs where 1) the filers specifically state their suspicion is about fraud for profit, 2) the filers do not specifically state it is fraud for housing, 3) the narrative describes subjects other than the borrower as suspected primary participants, 4) the filer specifically notes possible occupancy fraud, or 5) the suspected fraudulent loan is not a first mortgage. Absent any of these criteria, other reports are classified as fraud for housing, when the filer named the borrower as a subject.
30.

�� Mortgage Loan Fraud
Financial Crimes Enforcement Network
Figures 17 and 18 displays the types of participants in these fraud categories and show the frequency of their mention in each category.
FIGURE 17
COMPARISON OF FRAUD FOR PROFIT AND HOUSING BY PARTICIPANT
Participant
Percentage of Participants in SARs Describing Fraud
For Profit
Percentage of Participants in SARs Describing Fraud
For Housing
Mortgage Broker 62.07% 58.55%
Borrower 60.66% 87.06%
Appraiser 23.04% 7.46%
Investor 14.42% 0.00%
Seller 7.52% 0.76%
Settlement Agency/Notary 2.66% 1.13%
Insider (Loan Officer) 2.35% 1.13%
Correspondent Lender 1.72% 1.42%
FIGURE 18
Comparison of Fraud for Profit to Fraud for Housing
0%20%40%60%80%
100%
Mor
tgag
eB
roke
r
Bor
row
er
App
rais
er
Inve
stor
Sel
ler
Set
tlem
ent
Age
ncy/
Not
ary
Insi
der(
Loan
Offi
cer)
Cor
resp
onde
ntLe
nder
% OF FRAUD FOR PROFIT % OF FRAUD FOR HOUSING

��Mortgage Loan Fraud
Financial Crimes Enforcement Network
Reports describing suspected fraud for housing referenced purchase loans most often, followed by refinance, 2nd trust, and home equity loans. All reports regarding construction loans described suspected fraud for profit. Home equity loans had the second highest percentage of fraud for profit with 2nd trust, refinance, and purchase loans showing the next highest percentages.
Figure 19 illustrates a comparison of the type of fraud by loan type as seen in the sampled narratives.
FIGURE 19
LOAN TYPE COMPARISON FOR TYPE OF FRAUD
Loan Type ProfitPercentage
of Loan Type HousingPercentage
of Loan Type
Purchase 440 34.00% 840 64.91%
Refinance 93 45.15% 112 54.37%
2nd Trust 20 47.62% 22 52.38%
Home Equity 38 61.29% 24 38.71%
Construction 19 100.00% 0 0%
Total 610 998

�0 Mortgage Loan Fraud
Financial Crimes Enforcement Network
Loan Types
Loans for purchasing houses, either for a primary residence, second home, or invest-ment, were the most commonly reported loan types detailing suspected fraud, at 72.75%. Other types of loans reported were: refinance (12.04%), home equity (3.5%), 2nd trust (2.37%), and construction (1.07%). Some significant changes were found by comparing loan types reported in FinCEN’s previous mortgage fraud report to loan types reported during the update period. The percentage of fraudulent construction loans and purchase loans reported experienced a decrease while reports of fraud in 2nd trust, refinance, and home equity loans increased.
Figure 20 displays the comparison.
FIGURE 20
Loan Type Comparisons
0%10%20%30%40%50%60%70%80%90%
100%
Purchase Refinance Home Equity 2nd Trust Construction FHA Title One
Perc
enta
geof
SARs
INITIAL UPDATE

��Mortgage Loan Fraud
Financial Crimes Enforcement Network
Filers specified that loans were subprime in 79 SARs (0.19%) for the reviewed period. Without this specification, it is not possible to determine whether mortgages described in the remaining SARs were subprime loans.
Filers did not identify any FHA Title One loans in the sampled narratives re-viewed for this update report. It is unknown if there was a decrease in reports of fraud in FHA Title One loans, or if the filers simply did not identify the loans as such. Filers did note that six purchase loans and one refinance loan were FHA insured loans.
Figure 21 provides a comparison of loan types for the initial and updated reports.
FIGURE 21
REPORT COMPARISON
Loan Type Initial Report Updated ReportPercentage Of
Change
Purchase 83.65% 72.75% -13.03%
Refinance 7.21% 12.04% 66.99%
Home Equity 2.66% 3.50% 31.76%
2nd Trust 0.38% 2.37% 524.80%
Construction 1.52% 1.07% -29.34%
FHA Title One 1.90% 0.00% -100.00%
Filers noted in the sampled narratives that 54 (25.35%) of the refinance loans were “cash-out refinance.” Additionally, filers noted that 7.41% of the cash-out refinance loans were early defaults; half of those were first payment defaults.
Early Payment Default
Filers reported that early payment defaults triggered suspicion that loans may have been obtained through fraudulent methods in 71 (4%) of the
Quick Facts
Early payment defaults were indicated in only 4% of sampled narratives.
Suspected fraud detected during foreclosure rose by 23%.
•
•

�� Mortgage Loan Fraud
Financial Crimes Enforcement Network
sampled narratives. Twenty-five (35.21%) of those narratives specified a first pay-ment default. Filers reported early payment defaults were moderately more com-mon in fraud for profit (57.75%) than fraud for housing (42.25%).
Figure 22 displays the types of loans where early payment defaults were detected.
FIGURE 22
EARLY DEFAULT BY LOAN TYPE
Loan Type No. Of SARs Percentage Of Loan Type
Purchase 53 4.12%
Refinance 13 6.10%
2nd Trust 3 7.14%
Home Equity 2 3.23%
Figure 23 provides a comparison of suspected fraud for profit and fraud for housing by loan type.
FIGURE 23
EARLY PAYMENT DEFAULT COMPARISON BY FRAUD TYPE
Type of Loan Profit Housing
Purchase 29 24
Refinance 9 4
Home Equity 2 0
2nd Trust 1 2
Total 41 30

��Mortgage Loan Fraud
Financial Crimes Enforcement Network
Stated Income/Low Document or No Document Loans
Filers reported in 69 (3.90%) of the sampled narratives that the reviewed loans were Stated Income, Low Document or No Document loans. Mortgage brokers originated nearly 80% of these loans. Filers reported that fraud for housing (49.28%) and fraud for profit (47.83%) were nearly equally represented in these loans. Nearly 9% of these loans were early payment defaults; 50% of those were first payment defaults.
Figure 24 below displays the types of loans granted as low/no document or stated income.
FIGURE 24
STATED INCOME/LOW or NO DOCUMENT LOANS
Loan Type Low Doc/Stated Income Percentage Of Low Doc
Purchase 55 79.71%
Refinance 12 17.39%
Home Equity 2 2.90%
2nd Trust 0 0.00%
Construction 0 0.00%
Fraud Detection
Filers reported they detected the possibility of fraud in various phases of the loan process: pre-finance, post finance audit, loan default; and through reports by vic-tims, law enforcement, and even the borrowers themselves. SARs noting detection during post finance audits also reported that the loans were performing and current at the time the SARs were filed.
�� Mortgage Loan Fraud
Financial Crimes Enforcement Network
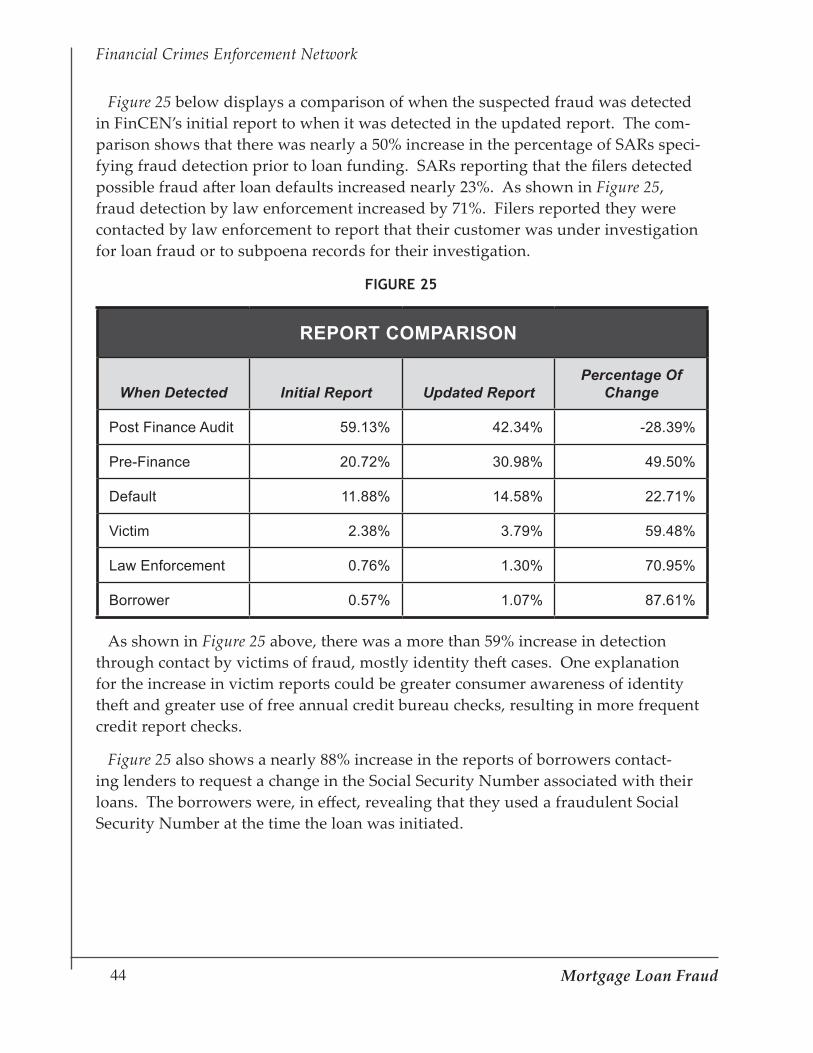
Figure 25 below displays a comparison of when the suspected fraud was detected in FinCEN’s initial report to when it was detected in the updated report. The com-parison shows that there was nearly a 50% increase in the percentage of SARs speci-fying fraud detection prior to loan funding. SARs reporting that the filers detected possible fraud after loan defaults increased nearly 23%. As shown in Figure 25, fraud detection by law enforcement increased by 71%. Filers reported they were contacted by law enforcement to report that their customer was under investigation for loan fraud or to subpoena records for their investigation.
FIGURE 25
REPORT COMPARISON
When Detected Initial Report Updated ReportPercentage Of
Change
Post Finance Audit 59.13% 42.34% -28.39%
Pre-Finance 20.72% 30.98% 49.50%
Default 11.88% 14.58% 22.71%
Victim 2.38% 3.79% 59.48%
Law Enforcement 0.76% 1.30% 70.95%
Borrower 0.57% 1.07% 87.61%
As shown in Figure 25 above, there was a more than 59% increase in detection through contact by victims of fraud, mostly identity theft cases. One explanation for the increase in victim reports could be greater consumer awareness of identity theft and greater use of free annual credit bureau checks, resulting in more frequent credit report checks.
Figure 25 also shows a nearly 88% increase in the reports of borrowers contact-ing lenders to request a change in the Social Security Number associated with their loans. The borrowers were, in effect, revealing that they used a fraudulent Social Security Number at the time the loan was initiated.

��Mortgage Loan Fraud
Financial Crimes Enforcement Network
Securities and Futures Industries (SAR-SFs)
I n this updated study, FinCEN also examined Suspicious Activity Reports by securities firms involved in the issuance and sale of mortgage-backed securities. Eighteen filers submitted 36 Suspicious Activity Report by the Securities and
Futures Industries (SAR-SF) forms indicating activity involving suspected mortgage loan fraud from the mandated reporting date of January 1, 2003 through May 1, 2007. These reports were retrieved using narrative searches for the terms: “secu-ritized loans,” “mortgage loan,” within three words of “pooled investment,” “real estate securities,” “collateralized mortgage,” “mortgage insurance,” “sub-prime” and “fraud” within three words of “mortgage.”31
These SAR-SFs reported the following activities:
Asset fraud. Filers reported that account statements provided as proof of a borrower’s assets had been fraudulently altered. This fraud was discovered when lenders requested re-verifications of the account statements.
Securities accounts containing proceeds from possible mortgage fraud. Filers reported that individuals identified in news media articles as either suspected or convicted of mortgage loan fraud held accounts with the filers. No filers were able to confirm if the accounts were funded with proceeds from the fraud-ulent activity. Accounts held by these subjects were included in on-going due diligence programs.
Life insurance policies possibly funded with proceeds from possible mortgage fraud. Two life insurance companies reported that their clients were identified in news media as being associated with mortgage loan fraud. The filers could not determine if the policies were funded with proceeds derived from mort-gage fraud schemes. The news articles were reviewed as part of on-going due diligence programs.
•
•
•
The searches did not retrieve SAR-SFs reporting fraud in securitized or pooled mortgages.31.

�� Mortgage Loan Fraud
Financial Crimes Enforcement Network

��Mortgage Loan Fraud
Financial Crimes Enforcement Network
Conclusion
A review of SARs suggests that although reports of suspected mortgage loan fraud continue to grow, the filers appeared to be initiating more stringent practices to prevent it. Although reports of mortgage loan fraud increased, a
higher percentage of filers over previous years indicated detection of potential fraud earlier in the loan process. Reports that were reviewed demonstrated due diligence measures strengthened, at least in part, by practicing a thorough verification of data received from third parties. Consequently, the reviewed SAR filings showed a pre-funding fraud detection rate of nearly 31%, an improvement of ten percentage points over the previous years.
Narrative details in the reviewed SARs identified mortgage brokers as the loan originators for the majority of the suspected fraudulent loans; 1,025 of 1,769 nar-ratives (nearly 58%) disclosed that the loans were originated by mortgage brokers. Details from sampled narratives identified depository institution filers as loan originators in 179 SARs (10%). Of those SARs, the fraud was detected prior to loan financing on 60 SARs (nearly 34%). Since mortgage brokers are not required to file suspicious activity reports, the number of applications rejected by mortgage brokers for suspected mortgage fraud can not be estimated from SAR filings.
�� Mortgage Loan Fraud
Financial Crimes Enforcement Network