Financial Contracting and the Choice between Private Placement and Publicly Offered Bonds
43
FEDERAL RESERVE BANK OF SAN FRANCISCO WORKING PAPER SERIES The views in this paper are solely the responsibility of the authors and should not be interpreted as reflecting the views of the Federal Reserve Bank of San Francisco or the Board of Governors of the Federal Reserve System. Financial Contracting and the Choice between Private Placement and Publicly Offered Bonds Simon Kwan Federal Reserve Bank of San Francisco and Willard T. Carleton University of Arizona Working Paper 2004- 20 http://www.frbsf.org/publicatio ns/economics/papers/2004/wp04-20bk.pdf
Transcript of Financial Contracting and the Choice between Private Placement and Publicly Offered Bonds
FEDERAL RESERVE BANK OF SAN FRANCISCO
WORKING PAPER SERIES
The views in this paper are solely the responsibility of the authors and should not be interpreted as reflecting the views of the Federal Reserve Bank of San Francisco or the Board of Governors of the Federal Reserve System.
Financial Contracting and the Choice
between Private Placement and Publicly Offered Bonds
Simon Kwan Federal Reserve Bank of San Francisco
and
Willard T. Carleton
University of Arizona
Working Paper 2004-20 http://www.frbsf.org/publications/economics/papers/2004/wp04-20bk.pdf
Financial Contracting and the Choice between PrivatePlacement and Publicly Offered Bonds
Simon H. KwanEconomic Research Department
Federal Reserve Bank of San Francisco101 Market Street, San Francisco, CA 94105
Telephone (415) 974-3485Fax (415) 974-2168
E-mail address: [email protected]
and
Willard T. CarletonDepartment of Finance
College of Business and Public AdministrationUniversity of Arizona
Tucson, AZ 85721Telephone (520) 621-1520
November, 2004
All comments welcome.Preliminary, please do not quote without permission.
We thank Teachers Insurance and Annuity Association for providing the data on privateplacement bonds, Merrill Lynch & Co. and Jerome Fons of Moody’s Investor Services forproviding the data on publicly offered bonds, participants at the Federal Reserve SystemConference and the AFA Annual Meeting for helpful comments. The views expressed in thispaper represent the authors’ views only and do not necessarily represent the views of the FederalReserve Bank of San Francisco or the Federal Reserve System.

Financial Contracting and the Choice between PrivatePlacement and Publicly Offered Bonds
Abstract
Private placement bonds have unique financial contracting in controlling borrower-lender agencyconflicts due to direct monitoring and the relative ease of future renegotiation. Our data showthat private placements are more likely to have restrictive covenants and are more likely to beissued by smaller and riskier borrowers. We find the determinants of bond yield spreads to bequite different between private placements and public issues, reflecting the different institutionalarrangements between the two markets. Finally, in issuing bonds, we find that firms self-selectthe bond type to minimize both the financing costs and the transaction costs.
1 Our empirical analysis is based on private placement data between 1985 to 1994obtained from Teachers Insurance and Annuity Association. More recent data are not availableto us.
2 In Denis and Mihov (2003), their nonbank private debts were mainly Rule 144A privateplacements that can be traded among institutional investors. We exclude Rule 144A privateplacements in this paper and study only non-144A private placements that have no secondarymarket. Please also see footnote 10 in section III.
1
I. Introduction
A private placement bond is a non-underwritten, unregistered corporate bond sold directly
to a single investor or a small group of investors. From 1985 to 1995, 23 percent of the $4.3
trillion corporate bonds issued by U.S. corporations was privately placed, clearly indicating that
private placement bonds represent an important source of funds to U.S. corporations.1 However,
research on the structure and pricing of private placement corporate bonds is somewhat limited.
Analyses of how firms choose between issuing bonds privately versus publicly are even more
rare. In this paper, we employ a large dataset of private placement and publicly offered bonds to
shed light on these two issues.
There were a number of studies that examined the choice between private and public
debt, including Houston and James (1996), Krishnaswami, Spindt, and Subramaniam (1999),
Cantillo and Wright (2000), and Denis and Mihov (2003). However, within the class of private
debt, none of these studies, with the exception of Denis and Mihov, made the distinction between
bank loans and private placement bonds.2 In this paper, we study only private placement bonds
and exclude bank loans for the following reasons. First, banks are protected by the bank safety
net and are subject to extensive banking regulations while private placement investors are not,

3 Indeed, studies by James (1987) and Lummer and McConnell (1989) suggested thatthere is something unique about bank loans but not private placement debts.
4 See for example, Carey, Prowse, Rea, and Udell (1993).
5 Hereafter, private placements refer to privately placed corporate bonds, and publicissues refer to publicly offered corporate bonds.
6 Hawkins (1982), however, does not find a relationship between the restrictiveness ofcovenants in his small sample of private placements and the quality of the borrower.
2
implying important differences between the two types of lenders.3 Second, bank loans tend to be
structured somewhat differently than private placement bonds. For example, bank loans tend to
have shorter maturity and are usually floating-rate loans whereas private placement bonds have
maturity and pricing conventions much closer to publicly offered bonds.4 Thus, in the spectrum
of private debts, bank loans are arguably less directly comparable to public market bonds than
private placement bonds. In focussing on just private placement bonds, our analysis will not be
confounded by the uniqueness of bank loans.
Regarding the structure of private placement bonds, Zinbarg (1975) and Smith and
Warner (1979) argued that covenants in private placements tend to be more restrictive than
public issues.5 El-Gazzar and Pastena (1990) and Laber (1992) empirically examined the
frequency of different types of covenants in private placements. Although drawn from relatively
small samples, their results did show that private placement covenants tend to be tighter than
public bond covenants.6 With micro data on a much larger sample of private placement and
public bonds, our analysis also indicates that private placements are more likely to have
restrictive covenant provisions than public issues.
Furthermore, we show that firms that borrow from both the public and the private

3
placement markets, referred to as “switchers,” are fundamentally different from firms that borrow
only from the private market, referred to as “non-switchers.” For example, we find that switchers
tend to be larger and have higher credit risk ratings than non-switchers. Hence, it is also
important to distinguish between private placements issued by switchers and those issued by non-
switchers. While significant differences in contract features between switchers’ and non-
switchers’ private placements are found, it is worth noting that there are also significant
differences between switchers’ private placements and public issues.
Regarding the pricing of private placement bonds and firms’ issuance choice, Zwick
(1980) suggested that private placements seem to cost more than public issues but did not model
the pricing of private placement bonds, nor the firm’s borrowing decision. Blackwell and
Kidwell (1988) found that the yield spreads between private placements and public bonds issued
by utility companies were related to interest rate volatility, and suggested that firms were trying
to minimize borrowing costs by selecting the market providing the lowest transaction costs. In
this paper, we allow for complete interaction between bond pricing and issuance type, and we
explicitly model the self-selectivity problem with regard to firms’ issuance choice for those that
access both the private and public bond markets. While we also find that firms choose between
private placements and public issues to minimize financing costs, our results suggest that the
yield spread between private placement and public bonds is attributable to the somewhat
different pricing schemes between the two markets, rather than to external market conditions. In
addition, we find that for switchers, the choice between issuing private placements and public
issues is related to the bond issue size and the borrowing firm’s financial leverage, but not to the
potential difference in bond yield spread between the two markets.

4
The rest of the paper is organized as follows. Section II compares the areas of contract
design, lender monitoring, and debt renegotiation between the private placement market and the
public bond market. Section III describes the data used in this study. Descriptive statistics of
contract characteristics and firm characteristics are presented in section IV. Section V studies the
determinants of yield spread in private placement and public bonds, while simultaneously
modelling borrowing firms’ issuance choice. Section VI concludes this study.
II. Private placements versus public offerings
Private placement bonds differ from publicly offered bonds in three key areas: (1) the
design of bond covenants, (2) credit monitoring, and (3) the relatively ease of renegotiation.
Theoretical work by Diamond (1991), Berlin and Loeys (1988), Berlin and Mester (1992), and
Chemmanur and Fulghieri (1994) suggested that private debts, whose terms could be modified
throughout the life of the debt contract upon mutual agreement between the borrower and the
lender, are more likely to have restrictive covenants than public debts. In fact, in a public bond
offering, a debt security is sold at a fixed price to the public on a take-it-or-leave-it basis.
Investors in a public offering do not participate in shaping the bond’s contract features, though
their interests will be solicited by bond salespeople from the investment banker. Whereas in
private placements, the lender often influences the structure of the debt contract. In particular,
when only one lender is involved in a private debt issue, the convenience (especially if the
contract is anticipated to require modifications during the life of the loan) of dealing with a sole
lender gives the lender some bargaining advantages, who therefore can have considerable input
into the final jointly acceptable loan contract. If the bond issue is large and must be syndicated,
7 Smith and Warner (1979) argued that “the trustee will not act entirely in thebondholders’ interest. This is particularly true because the extent to which the trustee can be heldnegligent is limited: while the trustee must act in good faith, his responsibilities often go nofurther unless there is a default. Under the Trust Indenture Act, when a default has occurred, thetrustee is only required to ‘use the same degree of care and skill ... as a prudent man wouldexercise’ in enforcing the covenants.”
5
the lead lender in the syndicate usually has some influence on the terms of the final contract.
Thus, while public bond issues usually contain mostly standardized “boilerplate” covenant
provisions [Smith and Warner (1979)], private placements tend to have more restrictive
covenants that are customized to fit the unique borrowing situation. In addition to the negative
covenants that are used predominantly in public issues, private placements often adopt
affirmative (maintenance) covenants which require the borrowing firm to maintain (and report
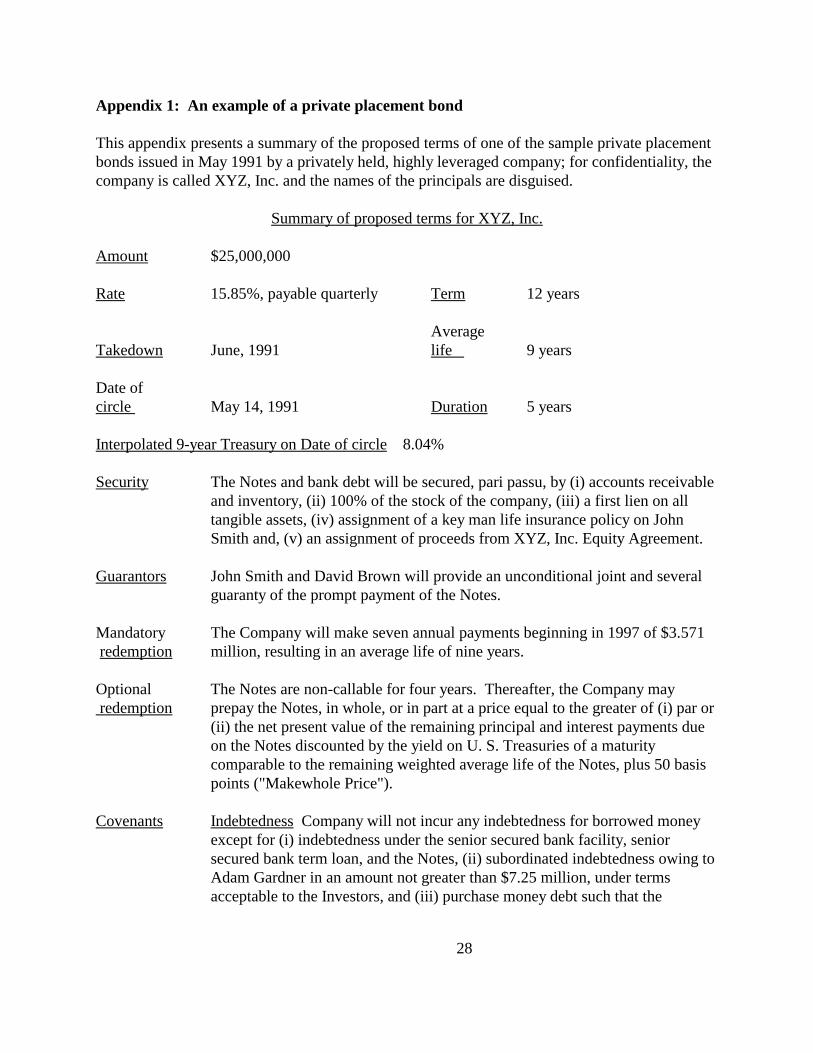
on) certain minimum standards of financial soundness. Appendix 1 presents a summary of the
proposed terms of a representative private placement bond made by a privately held company.
For publicly issued bonds that are held by a large number of bondholders, costly loan
monitoring results in either duplication of effort when each lender monitors directly or a free-
rider problem when no lender monitors [Diamond (1984)]. In practice, the covenants of publicly
offered bonds are enforced by the bond’s trustee who is appointed and paid by the borrowing
firm, and the borrowing firm’s repayment capacity is monitored by third party bond-rating
agencies.7 In contrast, private placement bonds are monitored directly and primarily by the
private lender(s), who has little to no free-rider problem in loan monitoring. Almost all private
placement investors are institutional lenders who have expertise and scale economies in credit
monitoring. Failure to meet the bond covenant provisions subjects the borrowing firm to
technical default. Except in the case of financial distress, modification of a public bond covenant
8 As of 1995, TIAA was the third largest life insurance company in the U. S. in terms ofgeneral account assets. Together with College Retirement Equities Fund, they made up thelargest private pension system in the U.S. TIAA has been one of the major lenders in the privateplacement bond market, and a large majority of sample private placement bonds were brought toTIAA by investment bankers.
6
to alleviate default is virtually impossible because it requires unanimous bondholder consent
under the Trust Indenture Act. However, in private placements, technical default and
renegotiation of bond covenants occur quite frequently [Beneish and Press (1993) and Chen and
Wei (1993)]. During the renegotiation of private placement bonds, the information exchange
between the borrower and the lender can be viewed as an integral part of loan monitoring. Thus,
the combination of restrictive covenants, ex post renegotiation, and direct credit monitoring make
private placement bonds particularly effective in controlling agency conflicts between borrowers
and lenders, implying that these credit instruments are particularly well suited for high risk
borrowers.
III. Data
To study private placement bonds, we obtain data from Teachers Insurance and Annuity
Association (TIAA) on all privately placed bonds that were approved by its finance committee
between January 1985 and December 1994.8 All convertible bonds, variable-rate bonds, and
bonds with equity features such as warrants or rights are eliminated, leaving only fixed-rate,
straight bonds in our sample. All Rule 144a-private placements (as stated in the offering
proposal) are also excluded because, unlike non-144a private placements, Rule 144a-private
placements are structured to facilitate inter-institutional trading in the secondary market and

9 In 1990, the Securities and Exchange Commission adopted Rule 144a permitting inter-institutional sale of unregistered securities in order to establish secondary markets for privateplacement securities. See also Fenn (2000) for important qualitative differences between 144aand non-144a private placements.
7
therefore tend to resemble publicly offered bonds more than traditional, non-144a private bonds.9
Occasionally, the issuing firm offered a package of straight debt securities, distinguished by
contract terms, maturity tranches, and covenant packages, in a single private placement offering.
For the purpose of this study, each constituent security in the offering is treated separately
because the contract terms are different. The final sample consists of 658 private placement
bonds issued by 466 firms. Assuming firms that had publicly issued bond(s) on their balance
sheets at the time of the private placement were switchers, 123 private placements were issued by
89 switchers, and the remaining 535 private placements were issued by 377 non-switchers.
In order to compare private placement bonds to public bonds, we also collect an
independent sample of publicly issued corporate bonds from Merrill Lynch’s proprietary fixed-
income securities database, which includes all publicly traded corporate bonds that are quoted in
the Bloomberg terminal. Similar to the private placement sample, we include only fixed-rate,
straight bonds in the public bond sample. The final public bond sample consists of 1,643 public
bonds issued by 414 publicly held companies.
IV. Contract and firm characteristics
A. Contract Characteristics
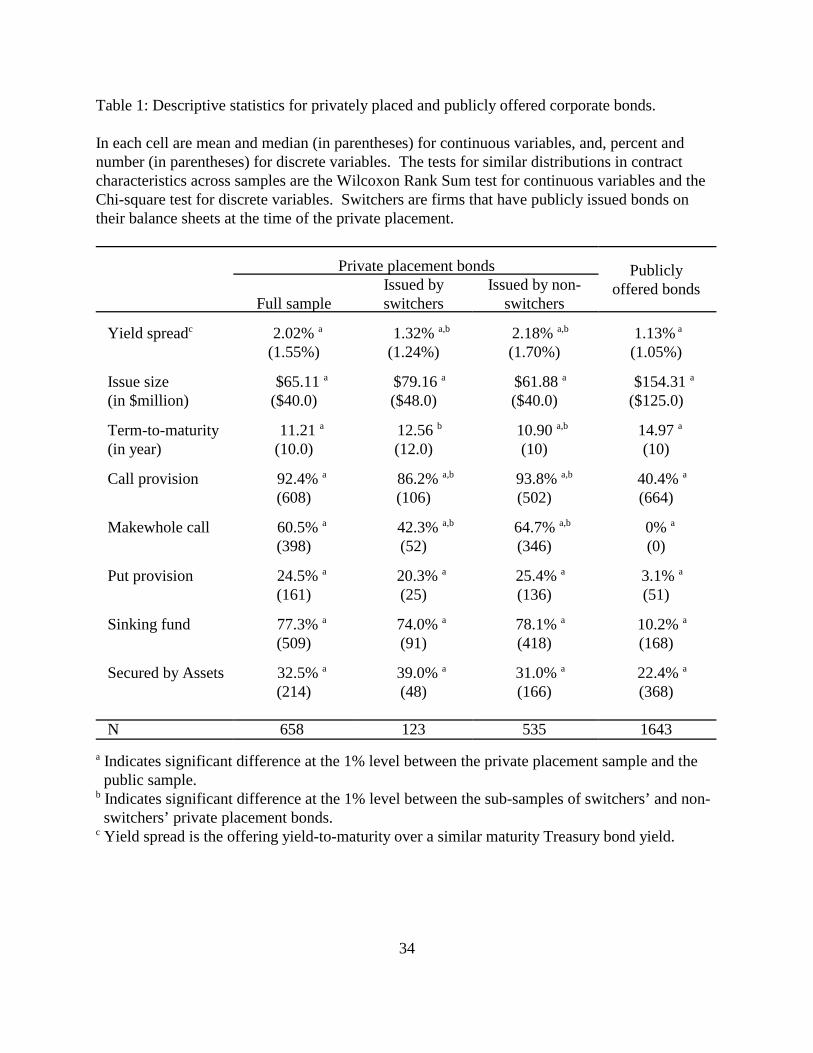
Table 1 provides descriptive statistics for the sample private placement and publicly
offered bonds. Private placement bonds are also grouped according to whether they were issued

10 Note that this pricing format does not formally address the possibility of a significantduration difference between the corporate bond and the Treasury bond. Pricing off Treasuries asof the “date of circle,” the offering date, eliminates any price adjustment at the take-down datedue to daily market interest rate fluctuations, but it exposes both the borrower and the lender tointerest rate risk relative to the take-down date.
11 The yield spread for publicly offered bonds is equal to the bond’s offering yield inexcess of the interpolated yield-to-maturity of actively traded Treasuries with matching term-to-maturity, for both sinking fund and non-sinking fund bonds. We do not have information on thesinking fund bonds’ sinking fund schedules.
8
by switchers or non-switchers. To test whether the structure of private placement bonds is
systematically different from that of publicly offered bonds, bivariate comparisons of contract
characteristics between the two samples of private and public bonds are conducted using the non-
parametric Wilcoxon Rank Sum test for continuous variables, and the Chi-square test for discrete
variables. Furthermore, to test whether the structure of private placement bonds issued by
switchers and non-switchers are systematically different, we conduct the same tests across the
two sub-samples of private placement bonds.
Private placement bonds are usually issued at par value. As illustrated in Appendix 1, the
coupon rate and hence the computed yield-to-maturity based on a par value price are set relative
to the interpolated yield-to-maturity of actively traded Treasury securities with maturity equal to
the private placement's average life, which is the weighted average maturity of the principal after
taking the mandatory redemption into consideration.10 In the private placement sample, the yield
spread in excess of similar maturity Treasuries averages 2.02 percent with the median yield
spread at 1.55 percent. The average yield spread for the sample public bonds is only 1.13 percent
with the median yield spread at 1.05 percent.11 The Wilcoxon Rank Sum test rejects the
hypothesis that the yield spreads in both the public and the private samples have the same

12 See also Bodie and Taggart (1978), Barnea, Haugen, and Senbet (1980), and Robbinsand Schatzberg (1986).
13 Thatcher (1985) found that firms with large agency costs of debts are more likely toissue callable bonds.
9
distribution. While removing non-switchers’ issues from the private placement sample narrows
the yield spread difference substantially, the difference in yield spread between switches’ private
placements and publicly issued bonds remains statistically significant.
The mean (median) issue size of the sample private placements is $65.11 million ($40
million). Compared to the mean (median) issue size of $154.31 ($125) million for the public
sample, private placements are significantly smaller. Note that the difference in issue size
between switchers’ and non-switchers private placements is insignificant.
The mean (median) maturity of the sample public bonds is 14.97 (10) years. Private
placements, on average, have shorter maturities, with mean (median) maturity of 11.21 (10)
years. However, the difference in maturity is driven by non-switchers’ private placements, as
evidenced by the insignificant maturity difference between switchers’ private placements and
public bonds.
Turning to bond covenants, private placements are significantly more likely to have a call
provision than public issues. Over 90 percent of our sample private placements are callable,
compared to only 40 percent in the public sample. A call provision can be used to mitigate
certain agency conflicts between borrowers and lenders, such as the under-investment problem
described in Myers (1977).12, 13 Furthermore, in private placement bonds that tend to have more
restrictive covenants, borrowing firms may want to use the call feature as an option to seek relief
from those covenants. Thus, the prevalence of restrictive covenants in private placements may

10
actually lead to wider adoption of call provisions. Note that within the sample of private
placement bonds, a call option is more likely to be found in non-switchers’ than switchers’ bond
issues, and the difference is significant.
Further down in Table 1, over 60 percent of the sample private placement bonds are
callable at the so called “makewhole” price, which is equal to the greater of the par value or the
net present value of the remaining cash flows discounted at the prevailing similar-maturity
Treasury rates plus a yield premium (see Appendix 1 for an illustration). Since the makewhole
call price decreases with the level of interest rates, it has the effect of transferring the refinancing
gains from the borrower to the lender. To the extent that the makewhole call option limits or
eliminates all together the gains from refinancing to the borrower, it further suggests that the
motivation for the call option may be to insure against covenants that could become unduly
restrictive in the future. Within the sample of private placement bonds, a makewhole call is
again more likely to be found in non-switchers’ than switchers’ issues.
The incidence of put option is significantly higher in the private placement sample than in
the public sample. In the private sample, 24.5 percent of the private bonds have a put option, as
compared to a mere 3.1 percent in the public sample. A put option gives bondholders the right to
put the bond issue to the borrower at the pre-specified price when certain pre-specified events
occur, protecting bondholders against event risks. While the difference in the incidence of put
option between the private and the public samples is statistically significant, no significant
difference is detected between switchers’ and non-switchers private placements.
Regarding sinking fund provisions, 77.3 percent of the sample private placements have a
sinking fund provision, which is significantly higher than the 10.2 percent observed in the public
11
sample. Sinking fund reduces the lender’s exposure in parallel with the expected decline in the
value of the assets financed by the debt [Myers (1977)]. Sinking fund also reduces the possibility
that any dividend constraint may entail additional investment even when no profitable projects
are available [Smith and Warner (1979)]. While the incidence of sinking fund is significantly
higher among private placements than public issues, no significant difference in this contract
provision between switchers’ and non-switchers’ private placements is detected.
Finally, the proportion of sample private placement bonds that were secured by firm
assets is 32.5 percent, which is significantly higher than what is found in the public sample, at
22.4 percent. Secured debts limit the borrower’s ability to engage in asset substitution [Smith
and Warner (1979)], and provides the lender with the first claim on the underlying collateral in
the event of a default. Again, while the incidence of asset security is significantly higher in the
private placement sample than in the public sample, within the sample of private placement
bonds, the difference in the incidence of asset security between switchers’ and non-switchers’
private placements is insignificant.
The results in Table 1 indicate significant differences in the structure of private placement
and public bonds. The findings are generally consistent with private placement bonds having
more restrictive covenants than public bonds, and this remains to be the case even when only
switchers’ private placements are considered. Of course, the differences in contract
characteristics could be the result of the systematic differences in firm characteristics across the
two market, which are discussed next.
B. Firm Characteristics
In this subsection, we compare two important aspects of firm characteristics between
14 While the creditworthiness of switchers can be proxied by their public bond ratings,non-switchers by definition do not have public bond ratings. Furthermore, financial informationof non-switchers, many of which are privately held, is generally unavailable so that it is notfeasible to estimate their bond ratings using statistical models.
15 The old system classifies bonds into four rating categories with the highest qualityissue subject to a 2 percent MSVR requirement, instead of the current 1 percent [see Society ofActuaries (1996)]. We assume private placements with a 2 percent MSVR under the old ratingsystem would receive a NAIC 1 rating under the current system.
12
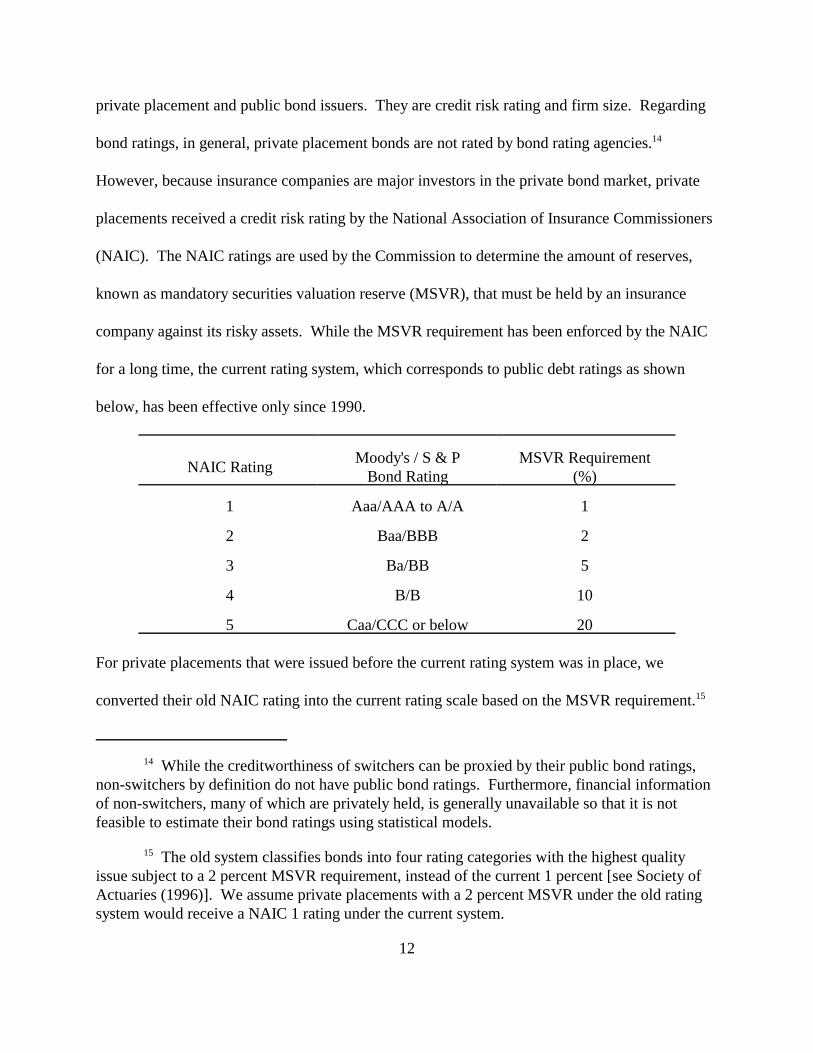
private placement and public bond issuers. They are credit risk rating and firm size. Regarding
bond ratings, in general, private placement bonds are not rated by bond rating agencies.14
However, because insurance companies are major investors in the private bond market, private
placements received a credit risk rating by the National Association of Insurance Commissioners
(NAIC). The NAIC ratings are used by the Commission to determine the amount of reserves,
known as mandatory securities valuation reserve (MSVR), that must be held by an insurance
company against its risky assets. While the MSVR requirement has been enforced by the NAIC
for a long time, the current rating system, which corresponds to public debt ratings as shown
below, has been effective only since 1990.
NAIC RatingMoody's / S & P
Bond RatingMSVR Requirement
(%)
1 Aaa/AAA to A/A 1
2 Baa/BBB 2
3 Ba/BB 5
4 B/B 10
5 Caa/CCC or below 20
For private placements that were issued before the current rating system was in place, we
converted their old NAIC rating into the current rating scale based on the MSVR requirement.15

16 Assuming all private placements with a 2 percent MSVR under the old rating systemare rated NAIC-2, the percentages of NAIC-1 and NAIC-2 rated issues would be 12.6 percentand 53.9 percent, respectively.
13
For bonds in the public sample, we map their public bond ratings to NAIC ratings according to
the above table.
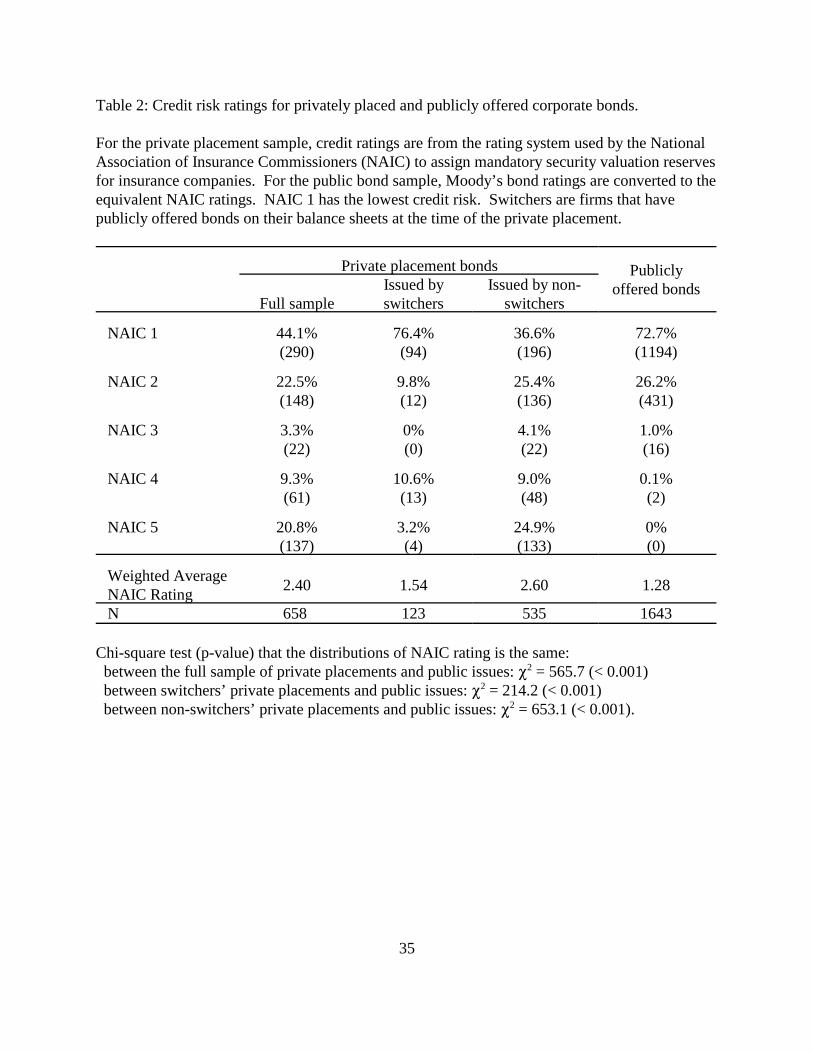
Table 2 depicts the distribution of NAIC credit risk rating for our sample private
placements and public issues. In the public sample, 73 percent of public issues have the
equivalent of NAIC-1 rating and 26 percent have the NAIC-2 equivalent. Together, 99 percent
of the public bonds in our sample are of investment grade quality, i.e., rated NAIC-2 or higher.
In the private sample, only 66 percent of the sample private placements are investment grade
quality: 44 percent rated NAIC-1 and 22 percent rated NAIC-2.16 Of the remaining 34 percent,
21 percent have the lowest NAIC-5 credit rating, as compared to none in the public sample. The
weighted average NAIC rating for the private placement sample is 2.4, almost twice as high as
the 1.28 average for the public bond sample. The chi-square test rejects the hypothesis that the
distributions of NAIC rating between the private placement sample and the public bond sample
are similar.
However, within the private placement sample, there is a significant difference in the
distribution of the NAIC rating between switchers’ and non-switchers’ private placements. In the
switchers’ sub-sample, 86 percent have investment grade rating, while only 62 percent in the
non-switchers’ sub-sample are rated at or above NAIC-2. Furthermore, 25 percent of non-
switchers’ issues have the lowest NAIC-5 rating, as compared to only 3 percent among
switchers’. The weighted average NAIC rating for the non-switchers sub-sample is 2.6, which is
substantially higher than the 1.54 average for the switchers sub-sample. Although the chi-square
14
test also rejects the hypotheses that the two sub-samples of private placements have similar credit
risk distribution as the public sample, switchers’ private placements nonetheless have close
resemblance to publicly offered bonds in the distribution of credit risk.
Table 3 reports the firm size of the borrowers in both the public and private samples.
Measured by total assets, the average borrower in the private sample is about one-fifth the size of
the average borrower in the public sample. Within the sample of private placements, non-
switchers tend to be much smaller than switchers. The Wilcoxon Rank Sum test rejects the
hypothesis that switchers and non-switchers have similar size distribution at the 1% level, but
fails to reject the hypothesis that switchers and firms in the public sample have similar asset size.
Using annual sales revenues to measure firm size provides qualitatively identical results.
V. Bond pricing and borrowing choice
In this section, we investigate jointly the pricing of privately placed and publicly offered
corporate bonds and the determinants of firms’ issuance choice. In making its financing
decision, we assume that a firm chooses to issue bonds privately or publicly based on the
considerations about the bond yield, covenant provisions, issuance cost, and the condition of the
bond market. To issue bonds publicly, a firm incurs flotation costs, including a registration fee
with the Securities and Exchange Commission, underwriter compensation, legal and professional
fees, a trustee’s fee, and printing and engraving outlays. Private placement of securities avoids
all those fees except those due to investment bankers, who may be hired to assist finding buyers

17 Blackwell and Kidwell reported that total flotation costs per $1,000 bond on averageare almost 50 percent higher in public issues than in private placements.
15
(1)
(2)
or forming lending syndicates.17 The contract terms, yield-to-maturity, and bond type (i.e.,
private versus public), are assumed to be jointly determined, given the issue size, term-to-
maturity, and bond market condition.
A. The Model
Let Y ui and Ypi be the public and private placement bond yields for the ith firm, and let Di
be the reservation yield differential which summarizes the ith firm’s specific preferences. The
firm is assumed to issue private placement bonds if:
In other words, the ith firm issues private placement bonds if the percentage yield differential
between public and private bonds exceeds its reservation yield differential. The reservation yield
differential, Di , summarizes firm i’s receptivity to issuing private placement bonds; it captures
the differences in both the financial contracting (discussed in section II) and flotation costs
between private placements and public bonds. Depending on firm i’s agency costs of debt and
hence its demand for financial contracting, Di can be either positive or negative. Specifically, we
assume that Di is a function of both firm characteristics and the difference in flotation cost
between issuing bonds privately and publicly. As a first order approximation, therefore,

16
(3)
(4)
where Xi is a vector of firm characteristics, Ci is an index which summarizes the monetary costs
and non-pecuniary costs of private placement debts, and g1 is random error. g1 is assumed to be
normally distributed with mean zero and variance F2ig.
Firms with high agency costs of debt may demand restrictive covenants and lender
monitoring to increase the value of the firm [Jensen and Meckling (1976), Smith and Warner
(1979)]. Other firms with high growth opportunities may demand flexibility in future contract
renegotiation. Thus, as the first step, Ci is modelled to be dependent on firm characteristics.
Since the differences in flotation costs between issuing bonds privately and publicly are
dependent on bond attributes, such as issue size, we model Ci also to be dependent on contract
characteristics. Finally, Blackwell and Kidwell found that the cost differences between public
sale and private placement of utility bonds were related to the condition of the bond market. Ci ,
therefore, is modelled to be also dependent on bond market condition as well. Hence, we assume
where Xi is a vector of firm characteristics, Zi is a vector of contract characteristics, and Mi is a
vector of market condition variables. g2 is random error which is assumed to be normally
distributed with mean zero and variance F22g. Thus, firm i will issue bonds privately if
This criterion may be written in the form of a probit model:
If Ii* > 0, then firm i issues private placement bonds; otherwise it issues public bonds, where

17
(5)
(6)
(7)
Finally, we specify the following models for bond yield spreads:
where Y ui , Ypi are the public and private bond yield spreads over similar maturity Treasuries,
respectively, for the ith firm; Zui , Zpi are respectively the attributes of the public and private
placement bonds; and M is the vector of bond market condition variables. gu and gp are random
errors which are assumed to be N(0, F2u ) and N(0, F2
p ), respectively. Note that we allow
complete interactions between bond yield spreads and bond types by specifying one equation for
private placement bonds and one equation for public bonds.
In estimating the model, the natural logarithm of the yield-to-maturity of the corporate
bond in excess of the interpolated yield-to-maturity of actively traded Treasury securities is used
as the dependent variable in the bond pricing equations. Since logYui - log Ypi is approximately
equal to (Yui - Ypi )/Ypi , we rewrite the model in terms of this variable, which simplifies the
estimation and is consistent with the theory. Thus, the model to be estimated consists of the
following three equations:

18 See for example, Ederington (1975), Fabozzi and West (1981), Kidwell, Marr, andThompson (1984), and Sorensen (1979).
19 Using dummy variables to control for the incidence of call and put options issomewhat imprecise, but we do not have the necessary information to compute the option-adjusted spread for our sample bonds.
20 As discussed later, below investment grade issues are not used to fit the model.
18
where gu ~ N(0, F2u ), gp ~ N(0, F2
p ) , and g ~ N(0, F2g) .
Following prior studies on offering yields of newly issued corporate bonds,18 the bond pricing
equations include the following bond attribute and market condition variables:
Call = one if the bond is callable before maturity, zero otherwise;
Put = one if the bond is puttable before maturity, zero otherwise;19
Sinking Fund = one if the bond has a sinking fund provision, zero otherwise;
Junior = one if the bond is a subordinated debt, zero otherwise;
Secured = one if the bond is secured by firm assets, zero otherwise;
Maturity = natural log of the bond’s term-to-maturity in years;
Proceeds = natural log of the dollar size of the bond issue in millions;
Rating = 1, 2, 3, 4, ... , 10,11 if rated Aaa1, Aaa, Aa1, Aa2, ... , Baa2, Baa3, respectively byMoody’s, 4 and 10 for NAIC-1 and NAIC-2 rated private placements, respectively;20
Treasury = the ten-year constant-maturity Treasury bond yield at the offering date; and
Volatility = standard deviation of the daily ten-year constant-maturity Treasury bond yield over a 20-trading-day period immediately prior to the offering date.
In the private placement model, we include a dummy variable, Switcher, which equals one if the
private placement bond is issued by a switcher and zero otherwise, to distinguish between
switchers’ and nonswitchers’ private placements. We also include time-effect dummy variables

19
in both pricing models to control for systematic market effects.
The exogenous variables for the issuance choice equation include the variable Firm Size
which equals the natural log of the total assets of the issuing firm, and five previously defined
variables: Maturity, Proceeds, Rating, Treasury, and Volatility. The variables Firm Size and
Rating capture the firm’s agency cost of debt and are expected to affect the firm’s reservation
yield differential and, hence, its debt choice. We allow the variable Proceeds to influence debt
choice due to the economies of scale in issuing large debt issues, as part of the flotation costs are
fixed costs that do not vary with issue size. The variable Maturity may also influence debt choice
as private placement bonds are more flexible for renegotiation before maturity than public bonds.
The variables Treasury and Volatility test the effects of market conditions on borrowing choice
[Blackwell and Kidwell (1988)].
In our model, we observe the exogenous variables, the type of bond issue, and the
dependent variables Y ui or Ypi . The observed yield spread depends on the bond type; we
observe Y pi when Ii = 1 and Y ui when Ii = 0, but never both. This is a simultaneous equations
model involving qualitative and limited dependent variables. In general, the bond pricing
equations cannot be consistently estimated by ordinary least squares using the observed yield
spreads because E(gu *Ii = 0) … 0 and E(gp *Ii = 1) … 0. Consistent estimators for this type of self-
selection model are discussed in Heckman (1976) and Lee (1978) using a two-stage procedure.
We estimate our model using the more efficient Full Information Maximum Likelihood (FIML)
method.
Since 99 percent of our sample public bonds are of investment grade quality, and over 90
percent of below-investment grade private placement bonds are issued by non-switchers, we have

21 In the final stage, both bond pricing equations were estimated jointly with the selectionequation in one step so that there are no separate R-squares for the final estimates of theindividual pricing equations.
20
a very unbalanced panel of below investment grade bonds. In estimating our model, we include
only investment grade bonds from both the public and private samples, and exclude all below-
investment grade bonds.
B. The Results
Table 4 presents the FIML estimates of the two bond pricing equations. The R-squares
for the private placement and public bond models from the second stage regressions are 0.37 and
0.54, respectively.21 The coefficient of Call is insignificant for public bonds but is significantly
negative for private placements. The negative effect of Call on private placement yields may
seem puzzling. One explanation is that issuers of private placement bonds that have restrictive
covenants may demand a call option mainly to protect against future inflexibility rather than
against interest rate declines. In particular, the majority of callable private placements have
expensive makewhole call premium to protect the lenders from prepayment risk. Thus, the
makewhole call option by itself may actually be valuable to the lender simply due to the rich call
premium.
The coefficient of Put is significantly negative for public bonds, indicating that the put
option is valuable to public bondholders for protection against event risks. However, the variable
Put has a negative sign but is insignificant in the private placement model.
The coefficient of Sinking Fund is significantly positive for both private and public
bonds, indicating that riskier bonds are more likely to have sinking fund provisions. The
coefficient of Junior is insignificant. The significantly positive coefficient of Secured for private

22 Berger and Udell (1990) also found that riskier loans are more likely to be secured bycollateral.
23 Note that the Moody’s or S&P bond ratings for public bonds have a finer grid than theNAIC rating for private placements, so that the contract variables in the private placement modelhave a greater propensity to reflect the underlying credit risk of the borrower than the public bondmodel. This is another reason for fitting two separate bond pricing models for the two differenttypes of bonds.
21
placements suggests that riskier bonds are more likely to be secured by firm assets.22 The
findings indicate that both Sinking Fund and Secured appear to reflect the underlying credit risk
of the borrower, as opposed to trading off bond yield against contract features.
The coefficient of Term-to-Maturity is significantly positive for public bonds, but is
significantly negative for private placement issues. The positive effect of maturity on public
bond yields suggests an additional risk premium demanded by investors to hold longer maturity
publicly traded corporate bonds. In the private placement model, the negative effect of maturity
on bond yield may be capturing the self-selection between maturity and credit risk, where high
risk borrowers are less able to issue longer term debts.23
The coefficient of Proceeds is significantly negative for public bonds, but is significantly
positive for private placements. This result suggests that in publicly offered bonds, a larger bond
issue results in a deeper secondary market, which tends to lessen the bond’s liquidity risk. On
the other hand, the lack of a secondary market for private placement bonds may lead investors to
demand a higher risk premium for holding a larger private bond issue.
The coefficient of Bond Rating is significantly positive for both public and private bond
issues, confirming that riskier bonds have significantly higher yield spreads than less risky bonds.
Note that the point estimate of this coefficient in the public bond model is more than three times

22
the point estimate in the private placement model, indicating a much steeper trade off between
bond yield spreads and credit risk ratings for public bonds than for private issues. This
relationship is consistent with private placement bonds being more effective in controlling credit
risk exposure than public market bonds because of their stronger covenant provisions and direct
loan monitoring.
The significantly negative coefficient of Treasury indicates that bond yield spreads tend to
decline with the level of interest rates. This reflects the relationship between credit spreads and
the business cycle, where credit spreads tend to be highest at the bottom of the business cycle
when interest rates are low, and vice versa. The coefficient of Volatility is insignificant,
indicating that bond yield spreads in our sample are not determined by bond market volatility.
In the private placement model, the coefficient of Switcher is significantly negative. The
finding suggests that firms that access the public debt market pay significantly less on their
private placement bonds than firms that do not. This cost saving on private debt enjoyed by
switchers is consistent with the cross-monitoring by public bondholders, as suggested by Booth
(1992).
At the bottom of Table 4, we report the coefficient of the selectivity variable in the
second stage estimation. It is significant for the public bond pricing equation, confirming the
presence of a selection effect among public bond issuers. The coefficient of the selectivity
variable, however, is insignificant in the private placement model.
C. Issuance Choice and Cost Savings
The two separate bond pricing models allow calculation of cost savings between the two
bond markets for the sample borrowers. For private placement bonds, we estimate their public

23
(8)
(9)
yield spreads using the public bond pricing model, i.e.,
We then subtract the observed private placement yield spread from the estimated public yield
spread to compute the cost savings of issuing bonds privately rather than publicly. Panel A of
Table 5 shows that based on investment grade firms, on average, switchers save 6 basis points by
issuing bonds privately rather than publicly, but it is not statistically significant. Non-switchers,
however, on average save 38 basis points by issuing bonds privately, which is significant at the 1
percent level. The non-parametric Wilcoxon signed rank statistic also indicates that the cost
saving is statistically significant. Overall, yield spreads of private placements on average are 30
basis points cheaper than otherwise similar public offerings, and the difference is significant.
Note that the cost comparison is based on only the yield spread differences before flotation costs.
The total cost savings of issuing bonds privately would be even larger to the extent that the
flotation costs for private placements are expected to be smaller than public offerings.
For publicly offered bonds, we treat the borrower as a switcher and estimate the private
placement yield spread using the private placement bond pricing model, i.e.,
We subtract the observed public bond yield spread from the estimated private yield spread to
compute the cost savings of issuing bonds publicly instead of privately for public bond issuers.
24 Debt Ratio and Q Ratio are added to the selection equation in (7) to improve the modelonce we exclude non-switchers’ private placements from the estimation. Omitting these twovariables from equation (7) (due to lack of data for non-switchers) would not bias the resultssince they are not correlated with the right-hand-side variables. The two variables are calculatedfrom data in Compustat.
24
The results are shown in Panel B of Table 5. On average, borrowing firms save 39 basis points
by issuing bonds publicly instead of privately, and the cost saving is statistically significant.
However, the net cost savings of issuing bonds publicly would probably be less than reported
here after accounting for the difference in flotation costs.
One issue remains unsettled, namely, the motivation for switchers to issue bonds in the
private market, since doing so does not seem to produce significant cost savings. To shed light
on switchers’ bond issuance decisions, we estimate the structural form of the bond selection
equation with all public bonds and switchers’ private placement bonds. In essence, we estimate
the modified choice equation in (7) using the estimated yield difference from the two bond
pricing models as an explanatory variable. The dependent variable is a binary variable which
equals one for private placements and zero for public issues. The explanatory variables are: Firm
size, Term-to-Maturity, Proceeds, Treasury, Volatility, Bond Rating, Yield Difference, Debt
Ratio, Q Ratio, and time-effect dummies.24 Debt Ratio is the issuing firm’s debt-to-asset ratio
and it measures the borrowing firm’s financial leverage at the time of borrowing, which reflects
its agency cost of debt and hence its demand for financial contracting. Q Ratio is the ratio of the
issuing firm’s market value equity to book value equity and it captures the firm’s future growth
opportunities; firms with high growth options may have higher agency costs of debt due to
difficulty in bonding and monitoring.
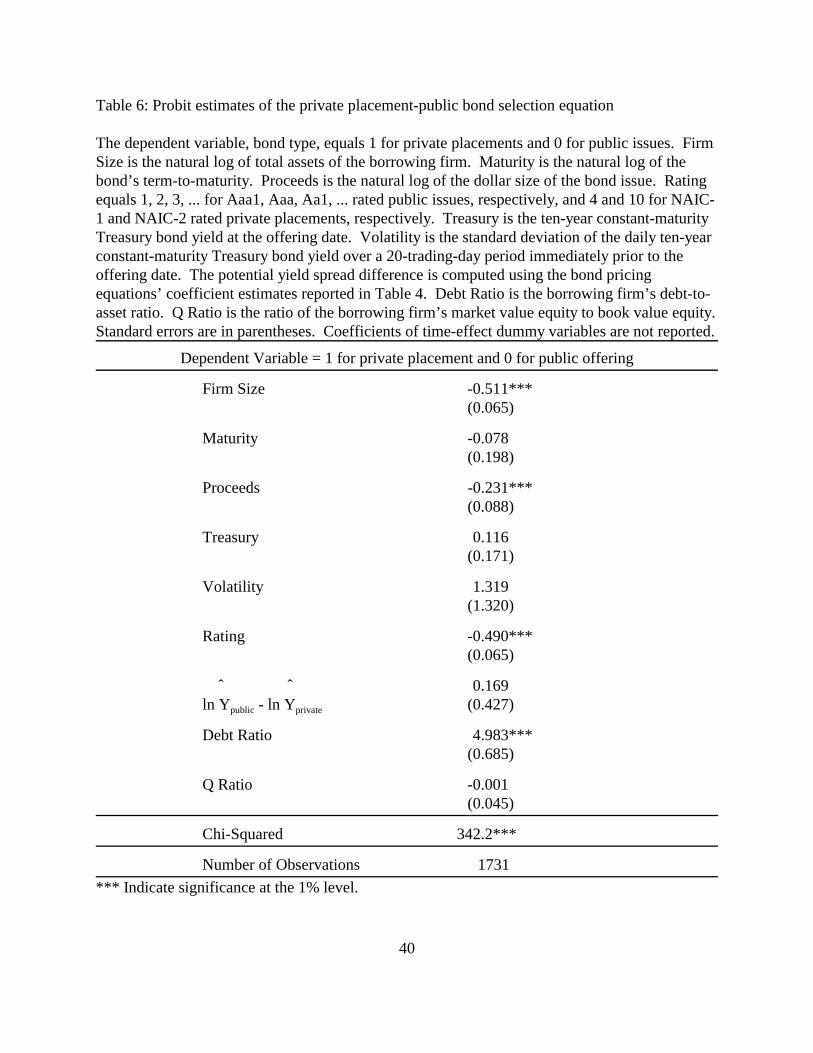
The Probit estimates of the bond selection equation are shown in Table 6. The coefficient

25
of Firm Size is significantly negative. Although the size distributions between switchers and
public bond issuers are similar (as shown in Table 3), the multivariate analysis indicates that
private placement bonds are less likely to be issued by larger firms. The significantly negative
coefficient of Proceeds confirms that larger bond issues are less likely to be privately placed.
This is consistent with the scale economies of issuing bonds in the public market. The
coefficient of Bond Rating is significantly negative. The finding indicates that among investment
grade borrowers, firms with lower credit quality are less likely to issue bonds privately, perhaps
to avoid the tight covenants in private placements once they gain access to the public bond
market. The coefficient of Yield Difference has the positive sign but is insignificant. This is
consistent with the earlier finding that switchers who issue private placement bonds do not seem
to be motivated by the potential cost difference between the two markets. The coefficient of
Debt Ratio is significantly positive. This finding suggests that firms with high financial leverage
are more likely to issue bonds privately, indicating that a firm’s borrowing choice reflects its
underlying agency costs of debt and hence its demand for financial contracting. The coefficients
of the remaining variables, including Maturity, Treasury, Volatility, and Q-Ratio, are
insignificant. In summary, the results in Table 6 suggest that switchers choose to issue bonds
privately when the issue size is small, and when the financial leverage, and hence the agency
costs of debt, is high.
VI. Conclusion
This paper compares the structure and pricing of corporate bonds that are privately placed
versus those that are offered to the public, and then examines firms’ choice between issuing

26
bonds privately verus publicly. The financial contracting in private placement bonds is quite
unique due to the relatively ease of future renegotiation and direct credit monitoring. As such,
the covenants in private placement bonds can be more restrictive compared to the relatively
inflexible publicly offered bonds. Thus, private placements provide a bonding mechanism that is
arguably much stronger than the bonding mechanism in public issues. Using micro data on a
large sample of privately placed and publicly offered corporate bonds, our results suggest that
private placement bonds indeed are more likely to have restrictive covenants than public issues.
This is true even for the sub-sample of private placement bonds issued by borrowers who also
accessed the public bond market in the past.
Among the issuers of private placement bonds, firms that borrow exclusively from the
private market (or non-switchers) tend to be both riskier and smaller. This suggests that small
and risky borrowers facing relatively high agency costs of debt demand stronger financial
contracting in private placements to mitigate their incentive problems. While non-switchers may
be systematically different from public bond issuers, it is an interesting question to study what
motivates switchers, i.e., firms that issue bonds both publicly and privately, issuance choice.
In fitting two separate bond yield spread models for private placements and public issues
with the adjustment for self-selection, we find important qualitative differences in the
determinants of bond yield spreads across the two bond markets, including both the term-to-
maturity and the bond issue size. They may stem simply from the different institutional
arrangements between the two bond markets, such as one has a secondary market and the other
has not, and one involves securities registration and underwriting and the other do not.
Interestingly, we find the effect of bond rating on bond yield spread to be much larger in the

27
public market than in the private market, which seems to be consistent with the more effective
bonding and monitoring mechanism in the private placement market in reducing the credit risk
premium.
Finally, we find evidence that borrowers self-select their debt issuance choice to
minimize financing costs. However, switchers that issue debt in both markets do not realize
significant cost savings by issuing bonds in the private market. Upon further investigation into
switchers’ debt choice, we find that smaller bond issues are more likely to be privately placed,
indicating the presence of scale economies in issuing bonds in the public market. We also find
that the higher the debt-to-asset ratio of the borrowing firm, the more likely the firm would issue
bonds privately rather than publicly, indicating that firms with high agency costs of debt would
prefer the financial contracting in private placements.
28
Appendix 1: An example of a private placement bond
This appendix presents a summary of the proposed terms of one of the sample private placementbonds issued in May 1991 by a privately held, highly leveraged company; for confidentiality, thecompany is called XYZ, Inc. and the names of the principals are disguised.
Summary of proposed terms for XYZ, Inc.
Amount $25,000,000
Rate 15.85%, payable quarterly Term 12 years
AverageTakedown June, 1991 life 9 years
Date ofcircle May 14, 1991 Duration 5 years
Interpolated 9-year Treasury on Date of circle 8.04%
Security The Notes and bank debt will be secured, pari passu, by (i) accounts receivableand inventory, (ii) 100% of the stock of the company, (iii) a first lien on alltangible assets, (iv) assignment of a key man life insurance policy on JohnSmith and, (v) an assignment of proceeds from XYZ, Inc. Equity Agreement.
Guarantors John Smith and David Brown will provide an unconditional joint and severalguaranty of the prompt payment of the Notes.
Mandatory The Company will make seven annual payments beginning in 1997 of $3.571 redemption million, resulting in an average life of nine years.
Optional The Notes are non-callable for four years. Thereafter, the Company may redemption prepay the Notes, in whole, or in part at a price equal to the greater of (i) par or
(ii) the net present value of the remaining principal and interest payments dueon the Notes discounted by the yield on U. S. Treasuries of a maturitycomparable to the remaining weighted average life of the Notes, plus 50 basispoints ("Makewhole Price").
Covenants Indebtedness Company will not incur any indebtedness for borrowed moneyexcept for (i) indebtedness under the senior secured bank facility, seniorsecured bank term loan, and the Notes, (ii) subordinated indebtedness owing toAdam Gardner in an amount not greater than $7.25 million, under termsacceptable to the Investors, and (iii) purchase money debt such that the

29
aggregate amount does not exceed $500,000.
Liens and encumbrances No creation by the Company of any liens orencumbrances subject to permitted exceptions.
Restricted payments Company will not (i) declare or pay any dividend on itscapital stock, (ii) make any distribution or loan to stockholders or affiliates,(iii) purchase or redeem any of its capital stock, or (iv) defease or redeem anysubordinated indebtedness except with the proceeds of or in exchange forcommon stock (items (i) through (iv) above to be termed "RestrictedPayments") unless, after giving effect thereto, (v) the sum of such RestrictedPayments in any fiscal year is not in excess of $500,000 and (vi) the ratio ofSenior Debt to earnings before interest, depreciation and amortization, andtaxes ("EBITD") is less than 3.50; provided however, that no restrictedpayment may be made, if after giving effect thereto, an event of default exists. No Contingent Payment or Subordinated Note payment may be made, if aftergiving effect thereto, an event of default exists.
Amendment of subordinated indebtedness Company will not consent to anyamendment or modification to any agreements or instruments evidencingsubordinated indebtedness without the prior written consent of theNoteholders.
Sale of assets Company will not sell assets which constitute 10% or more ofthe assets of Company.
EBITD to senior interest ratio The ratio of EBITD to senior cash interestexpense (measured on a rolling four quarter basis) shall not be less than:
Period Minimum ratio
Closing through 12/31/92 1.751/1/93 through 12/31/93 1.951/1/94 through 12/31/95 2.251/1/94 through 12/31/95 2.50
EBITD to fixed charge ratio The ratio of EBITD to fixed charges (measuredon a rolling four quarter basis) shall not be less than:
Period Minimum ratio
Closing through 12/31/92 1.25Thereafter 1.35

30
Fixed charges will be defined to be the sum of (i) interest expense, (ii)scheduled principal payments, (iii) operating lease expenses, (iv) rentalexpenses and (v) capital lease payments.
Senior debt to EBITD The ratio of senior debt to EBITD on a rolling fourquarter basis will not be greater than:
Period Maximum ratio
Closing through 12/31/91 6.251/1/92 through 12/31/92 5.751/1/93 through 12/31/93 5.101/1/94 through 12/31/94 4.751/1/95 through 12/21/95 4.35Thereafter 4.00
Senior debt will be defined as indebtedness for borrowed money, capitalizedlease obligations and contingent liabilities (e.g. guarantees, letters of credit,etc.) not expressly subordinate to the Notes.
Loans, investments and advances Company will not make any loan to oracquire any securities of or other interest in any person except for (i) loans andadvances to stockholders, officers or employees in an amount up to $750,000and (ii) temporary cash investments of acceptable credit quality.
Current ratio The ratio of consolidated current assets to consolidated currentliabilities (excluding funded indebtedness) shall not be less than 1.20 to 1.00.
Equity agreement Company will not sell, assign, transfer, or convey the EquityAgreement.
Change of control Upon a change of control, defined as a change in 10% ofthe ownership of any individual, the holders of the Notes may requestprepayment of the Notes at the greater of par or the Makewhole Price. JohnSmith must maintain in excess of 51% ownership.
31
References
Barnea, A., R. Haugen, and L. Senbet, 1980, A rationale for debt maturity structure and callprovisions in the agency theory framework, Journal of Finance 35, 1223-1234.
Beneish, M. and E. Press, 1993, Costs of technical violation of accounting-based debt covenants,The Accounting Review 68, 233-257.
Berger, A. and G. Udell, 1990, Collateral, loan quality, and bank risk, Journal of MonetaryEconomics 25, 21-42.
Berlin, M. and J. Loeys, 1988, Bond covenants and delegated monitoring, Journal of Finance 43,397-412.
Berlin, M. and L. Mester, 1992, Debt covenants and renegotiation, Journal of FinancialIntermediation 2, 95-133.
Blackwell, D. and D. Kidwell, 1988, An investigation of cost differences between public salesand private placements of debt, Journal of Financial Economics 22, 253-278.
Bodie, Z. and R. Taggart, 1978, Future investment opportunities and the value of the callprovision on a bond, Journal of Finance 33, 1187-1200.
Booth, J., 1992, Contract costs, bank loans, and the cross-monitoring hypothesis, Journal ofFinancial Economics 31, 25-41.
Carey, M., S. Prowse, J. Rea, and G. Udell, 1993, The economics of private placements: A newlook, Financial Markets, Institutions and Instruments 2, 1-67.
Cantillo, M. and J. Wright, 2000, How do firms choose their lenders? An empiricalinvestigation. Review of Financial Studies 13, 155-189.
Chemmanur, T. and P. Fulghieri, 1994, Reputation, renegotiation, and the choice between bankloans and publicly traded debt, Review of Financial Studies 7, 475-506.
Chen, K. and K. Wei, 1993, Creditors' decisions to waive violations of accounting-based debtcovenants, The Accounting Review 68, 218-232.
Denis, D. J. and V. T. Mihov, 2003, The choice among bank debt, non-bank private debt, andpublic debt: Evidence from new corporate borrowings, Journal of Financial Economics 70, 3-28.
Diamond, D., 1984, Financial intermediation and delegated monitoring, Review of EconomicStudies 51, 393-414.

32
Diamond, D., 1991, Monitoring and reputation: The choice between bank loans and directlyplaced debt, Journal of Political Economy 99, 688-721.
Ederington, L., 1975, Uncertainty, competition, and costs in corporate bond underwriting,Journal of Financial Economics 2, 71-94.
El-Gazzar, S. and V. Pastena, 1990, Negotiated accounting rules in private financial contracts,Journal of Accounting and Economics 12, 381-396.
Fabozzi, F. and R. West, 1981, Negotiated versus competitive underwritings of public utilitybonds: Just one more time, Journal of Financial and Quantitative Analysis 16, 323-339.
Fenn, G., 2000, Speed of issuance and the adequacy of disclosure in the 144A high-yield debtmarket, Journal of Financial Economics 56, 383-406.
Hawkins, G., 1982, Essay on non-publicly issued debt: Revolving credit agreements and thepricing of privately placed debt, Unpublished Ph.D. dissertation, M.I.T.
Heckman, J., 1976, The common structure of statistical models of truncation, sample selection,and limited dependent variables and a simple estimator for such models, Annals of Economicsand Social Measurement, 5, 475-492.
Houston, J. and C. James, 1996, Bank information monopolies and the mix of private and publicdebt claims, Journal of Finance 51, 1863-1889.
James, C., 1987, Some evidence on the uniqueness of bank loans, Journal of FinancialEconomics 19, 217-235.
Jensen, M. and W. Meckling, 1976, Theory of the firm: Managerial behavior, agency costs andownership structure, Journal of Financial Economics 3, 305-360.
Kidwell, D., W. Marr, and R. Thompson, 1984, SEC rule 415: The ultimate competitive bid,Journal of Financial and Quantitative Analysis 19, 183-195.
Krishnaswami, S., P. Spindt, and V. Subramaniam, 1999, Information asymmetry, monitoring,and the placement structure of corporate debt, Journal of Financial Economics 51, 407-434.
Laber, G., 1992, Bond covenants and financial management: Some comparisons of public andprivate debt, University of Vermont Working Paper.
Lee, L., 1978, Unionism and wage rates: A simultaneous equations model with qualitative andlimited dependent variables, International Economic Review 19, 415-433.

33
Lummer, S. and J. McConnell, 1989, Further evidence on the bank lending process and thecapital market response to bank loan agreements, Journal of Financial Economics 25, 99-122.
Myers, S., 1977, Determinants of corporate borrowing, Journal of Financial Economics 5, 147-175.
Robbins, E. and J. Schatzberg, 1986, Callable bonds: A risk-reducing signaling mechanism,Journal of Finance 41, 935-949.
Smith, C. and J. Warner, 1979, On financial contracting: An analysis of bond covenants, Journalof Financial Economics 7, 117-161.
Society of Actuaries, 1996, 1986-1992 credit risk loss experience study: Private placementbonds, published study by the Society of Actuaries, Schaumburg, Illinois.
Sorensen, E., 1979, The impact of underwriting method and bidder competition upon corporatebond interest cost, Journal of Finance 34, 863-870.
Thatcher, J. 1985, The choice of call provision terms: Evidence of the existence of agency costsof debt, Journal of Finance 40, 549-561.
Zinbarg, E., 1975, The private placement loan agreement, Financial Analysts Journal 31, 33-52.
Zwick, B., 1980, Yields on privately placed corporate bonds, Journal of Finance 35, 23-29.
34
Table 1: Descriptive statistics for privately placed and publicly offered corporate bonds.
In each cell are mean and median (in parentheses) for continuous variables, and, percent andnumber (in parentheses) for discrete variables. The tests for similar distributions in contractcharacteristics across samples are the Wilcoxon Rank Sum test for continuous variables and theChi-square test for discrete variables. Switchers are firms that have publicly issued bonds ontheir balance sheets at the time of the private placement.
Private placement bonds Publiclyoffered bonds
Full sampleIssued byswitchers
Issued by non-switchers
Yield spreadc 2.02% a
(1.55%) 1.32% a,b
(1.24%) 2.18% a,b
(1.70%) 1.13% a
(1.05%)
Issue size(in $million)
$65.11 a
($40.0) $79.16 a
($48.0) $61.88 a
($40.0) $154.31 a
($125.0)
Term-to-maturity(in year)
11.21 a
(10.0) 12.56 b
(12.0) 10.90 a,b
(10) 14.97 a
(10)
Call provision 92.4% a
(608) 86.2% a,b
(106) 93.8% a,b
(502) 40.4% a
(664)
Makewhole call 60.5% a
(398) 42.3% a,b
(52) 64.7% a,b
(346) 0% a
(0)
Put provision 24.5% a
(161) 20.3% a
(25) 25.4% a
(136) 3.1% a
(51)
Sinking fund 77.3% a
(509) 74.0% a
(91) 78.1% a
(418) 10.2% a
(168)
Secured by Assets 32.5% a
(214) 39.0% a
(48) 31.0% a
(166) 22.4% a
(368)
N 658 123 535 1643
a Indicates significant difference at the 1% level between the private placement sample and the public sample.b Indicates significant difference at the 1% level between the sub-samples of switchers’ and non- switchers’ private placement bonds.c Yield spread is the offering yield-to-maturity over a similar maturity Treasury bond yield.
35
Table 2: Credit risk ratings for privately placed and publicly offered corporate bonds.
For the private placement sample, credit ratings are from the rating system used by the NationalAssociation of Insurance Commissioners (NAIC) to assign mandatory security valuation reservesfor insurance companies. For the public bond sample, Moody’s bond ratings are converted to theequivalent NAIC ratings. NAIC 1 has the lowest credit risk. Switchers are firms that havepublicly offered bonds on their balance sheets at the time of the private placement.
Private placement bonds Publiclyoffered bonds
Full sampleIssued byswitchers
Issued by non-switchers
NAIC 1 44.1%(290)
76.4%(94)
36.6%(196)
72.7%(1194)
NAIC 2 22.5%(148)
9.8%(12)
25.4%(136)
26.2%(431)
NAIC 3 3.3%(22)
0%(0)
4.1%(22)
1.0%(16)
NAIC 4 9.3%(61)
10.6%(13)
9.0%(48)
0.1%(2)
NAIC 5 20.8%(137)
3.2%(4)
24.9%(133)
0%(0)
Weighted AverageNAIC Rating
2.40 1.54 2.60 1.28
N 658 123 535 1643
Chi-square test (p-value) that the distributions of NAIC rating is the same: between the full sample of private placements and public issues: P2 = 565.7 (< 0.001) between switchers’ private placements and public issues: P2 = 214.2 (< 0.001) between non-switchers’ private placements and public issues: P2 = 653.1 (< 0.001).

36
Table 3: Firm size of borrowers in the private placement and public bond markets.
Mean (median) is based on a sample of 658 private placement bonds issued by 466 firms and asample of 1,643 publicly offered bonds issued by 414 firms. The test for similar distributions oftotal assets and annual sales across samples is the Wilcoxon Rank Sum test. Switchers are firmsthat have publicly offered bonds on their balance sheets at the time of the private placement.
Private placement bonds Publiclyoffered bonds
Full sample Switchers Non-switchers
Total assets(millions)
$2,454 a
($401)$6,827 b
($4,009) $1,421 a,b
($311)$12,246 a ($4,033)
Annual sales(millions)
$2,145 a
($472)$4,929 b
($2,935) $1,488 a,b
($312)$6,007 a
($2,455)N 466 89 377 414
a Indicates significant difference at the 1% level between the private placement sample and the public sample.b Indicates significant difference at the 1% level between the sub-samples of switchers and non- switchers.

37
Table 4: Full information maximum likelihood estimates of the switching regression model ofprivate placement and publicly offered investment grade corporate bond yield spread.
Regression of yield spread in excess of a similar maturity Treasury bond yield on bondcharacteristics and market conditions, with adjustment for self-selection (see notes on next page). Standard errors are in parentheses. Coefficients of time-effect dummy variables are not reported.
Variable Private Placement Bonds Publicly Offered Bonds
Call -0.173***(0.056)
0.011(0.024)
Put -0.049(0.036)
-0.631***(0.029)
Sinking Fund 0.130***(0.042)
0.198***(0.037)
Junior 0.068(0.057)
0.078(0.048)
Secured 0.127***(0.030)
-0.052(0.032)
Term-to-Maturity -0.120**(0.047)
0.223***(0.014)
Proceeds 0.051***(0.017)
-0.099***(0.014)
Bond Rating 0.034***(0.006)
0.122***(0.004)
Treasury -0.073***(0.025)
-0.091***(0.020)
Volatility -0.106(0.260)
0.013(0.152)
Switcher -0.129***(0.043)
Selectivity Variable(from second stage)
-0.011(0.027)
0.154***(0.039)
R² (from second stage) 0.37 0.54
Number of Observations 438 1625
***,** Indicate significance at the 1% and 5% levels, respectively.

38
Notes to Table 4:
The empirical model consists of the following three equations:
where gu ~ N(0, F2u ), gp ~ N(0, F2
p ), and g ~ N(0, F2g).
In the first two equations, Y ui and Ypi are the public and private bond yield spread, respectively,for the ith firm. Zui , Zpi are the vectors of variables for bond attributes, including:Call = one if the bond is callable before maturity, zero otherwise;Put = one if the bond is puttable before maturity, zero otherwise;Sinking Fund = one if the bond has a sinking fund provision, zero otherwise;Junior = one if the bond is a subordinated debt, zero otherwise;Secured = one if the bond is secured by firm assets, zero otherwise;Maturity = natural log of the bond’s term-to-maturity in years;Proceeds = natural log of the dollar size of the bond issue in millions;Rating = 1, 2, 3, 4, ... , 10,11 for Aaa1, Aaa, Aa1, Aa2, ... , Baa2, Baa3 rated public issues,
respectively, 4 and 10 for NAIC-1 and NAIC-2 rated private placements,respectively; and
Switcher = one if the private placement is issued by a switcher, zero otherwise.M is the vector of variables for market condition, including time-effect dummies;Treasury = the ten-year constant-maturity Treasury bond yield at the offering date; andVolatility = standard deviation of the daily ten-year constant-maturity Treasury bond yield over a
20-trading-day period immediately prior to the offering date.
The third equation models bond selection: if Ii* > 0, then the ith firm issues private placement
bonds; otherwise it issues public bonds. The exogenous variables for the selection equationinclude Firm Size which equals the natural log of the total assets of the issuing firm and thevariables Maturity, Proceeds, Rating, Treasury, and Volatility as defined above.

39
Table 5: Cost savings of issuing bonds privately versus publicly by investment grade firms
In panel A, cost saving equals predicted public bond yield spread, calculated from estimates inTable 4, minus observed private placement yield spread. In panel B, cost saving equals predictedprivate placement bond yield spread, calculated from estimates in Table 4, minus observed publicbond yield spread.
Panel A: Cost savings of issuing private placement bonds for 438 private placement issues, in basis points
Mean Median % Positive (Wilcoxon SignedRank Statistic)
N
Switchers 6.6 -4.9 48% (292.5) 106
Non-switchers 37.7*** 15.6 55% (8143***) 332
All 30.2*** 9.9 54% (11931.5***) 438
Panel B: Cost savings of issuing bonds in the public market for 1,625 public issues, in basis points
Mean Median % Positive (Wilcoxon Signed RankStatistic)
N
39.0*** 44.5 77% (450865***) 1625
*** Indicates significance at the 1% level.
40
Table 6: Probit estimates of the private placement-public bond selection equation
The dependent variable, bond type, equals 1 for private placements and 0 for public issues. FirmSize is the natural log of total assets of the borrowing firm. Maturity is the natural log of thebond’s term-to-maturity. Proceeds is the natural log of the dollar size of the bond issue. Ratingequals 1, 2, 3, ... for Aaa1, Aaa, Aa1, ... rated public issues, respectively, and 4 and 10 for NAIC-1 and NAIC-2 rated private placements, respectively. Treasury is the ten-year constant-maturityTreasury bond yield at the offering date. Volatility is the standard deviation of the daily ten-yearconstant-maturity Treasury bond yield over a 20-trading-day period immediately prior to theoffering date. The potential yield spread difference is computed using the bond pricingequations’ coefficient estimates reported in Table 4. Debt Ratio is the borrowing firm’s debt-to-asset ratio. Q Ratio is the ratio of the borrowing firm’s market value equity to book value equity. Standard errors are in parentheses. Coefficients of time-effect dummy variables are not reported.
Dependent Variable = 1 for private placement and 0 for public offering
Firm Size -0.511***(0.065)
Maturity -0.078(0.198)
Proceeds -0.231***(0.088)
Treasury 0.116(0.171)
Volatility 1.319(1.320)
Rating -0.490***(0.065)
ˆ ˆln Ypublic - ln Yprivate
0.169(0.427)
Debt Ratio 4.983***(0.685)
Q Ratio -0.001(0.045)
Chi-Squared 342.2***
Number of Observations 1731
*** Indicate significance at the 1% level.