Financial Assessment of Wind Project 18-19, 2011 | Dhaka, Bangladesh . Agenda What is financial...
24
1.800.580.3765 ▪ WWW.TTECI.COM Financial Assessment of Wind Project Presented to: USAID Wind Workshop October 18-19, 2011 | Dhaka, Bangladesh
Transcript of Financial Assessment of Wind Project 18-19, 2011 | Dhaka, Bangladesh . Agenda What is financial...

1.800.580.3765 ▪ WWW.TTECI.COM
Financial Assessment of
Wind Project
Presented to:
USAID Wind Workshop October 18-19, 2011 | Dhaka, Bangladesh

Agenda
What is financial assessment? • Revenue
• Capital costs
• Operating costs
Financial statements and metrics
What is the associated uncertainty? • Project stages
• Reduction in uncertainty
What are the financing options? • Organizational structure
• Financing structure
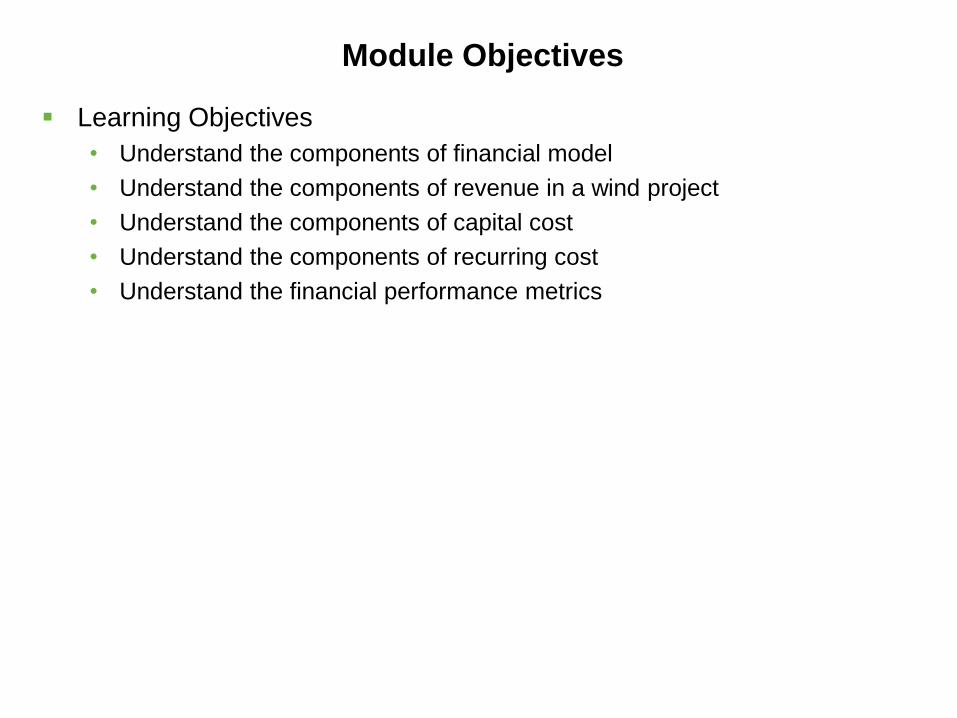
Module Objectives
Learning Objectives
• Understand the components of financial model
• Understand the components of revenue in a wind project
• Understand the components of capital cost
• Understand the components of recurring cost
• Understand the financial performance metrics
Financial Assessment
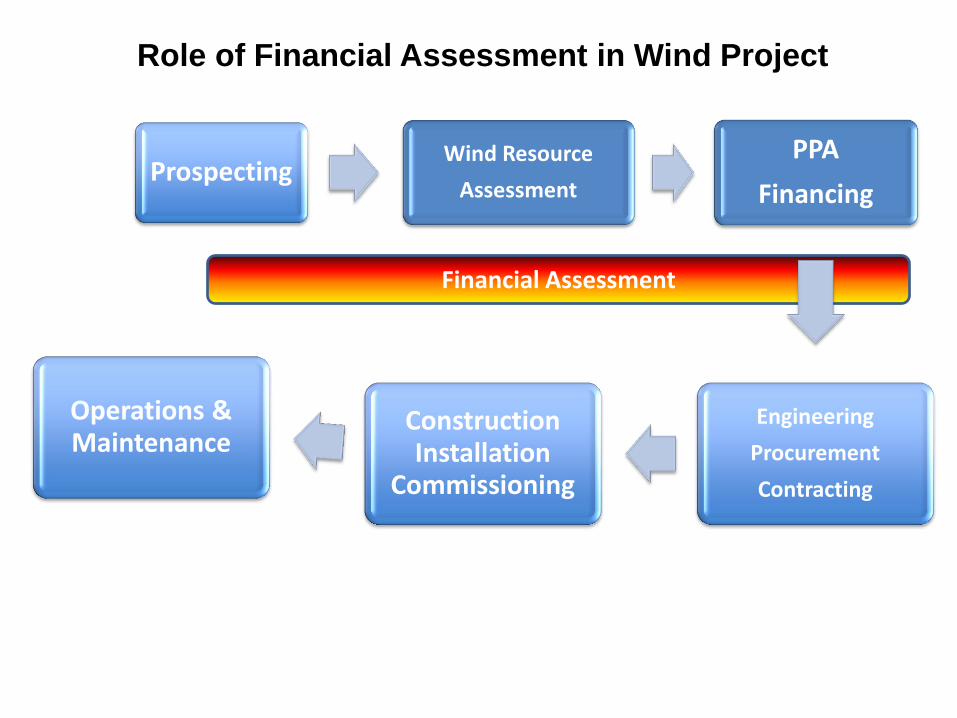
Role of Financial Assessment in Wind Project
Prospecting Wind Resource
Assessment
PPA
Financing
Engineering
Procurement
Contracting
Construction Installation
Commissioning
Operations & Maintenance

Components of Financial Model
Deterministic Financial Model
Capital & Operating
Cost
PPA
Average Annual Energy Prod
Risk
Cost
Time
Others
PPA
Risk-based Financial Model
Scenarios Uncertainty Impact on financial
performance
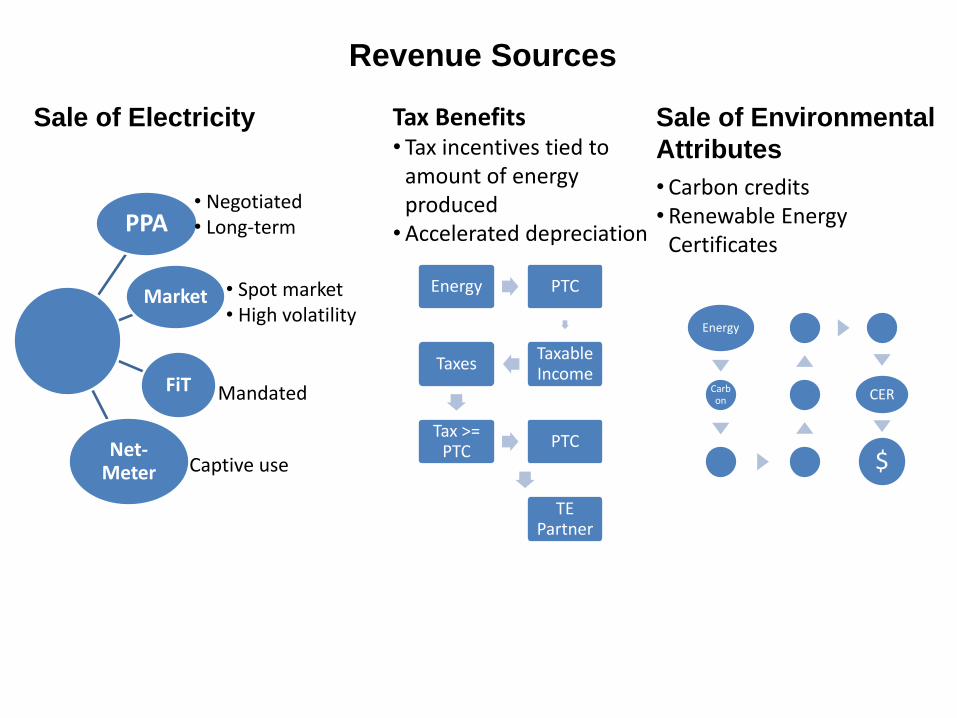
Revenue Sources
Sale of Electricity
PPA
Market
FiT
Net-Meter
Sale of Environmental
Attributes
• Negotiated • Long-term
• Spot market • High volatility
Captive use
Mandated
Tax Benefits
Energy
Carbon CER
$
• Carbon credits • Renewable Energy
Certificates
Energy PTC
Taxable Income
Taxes
Tax >= PTC
PTC
TE Partner
• Tax incentives tied to amount of energy produced •Accelerated depreciation
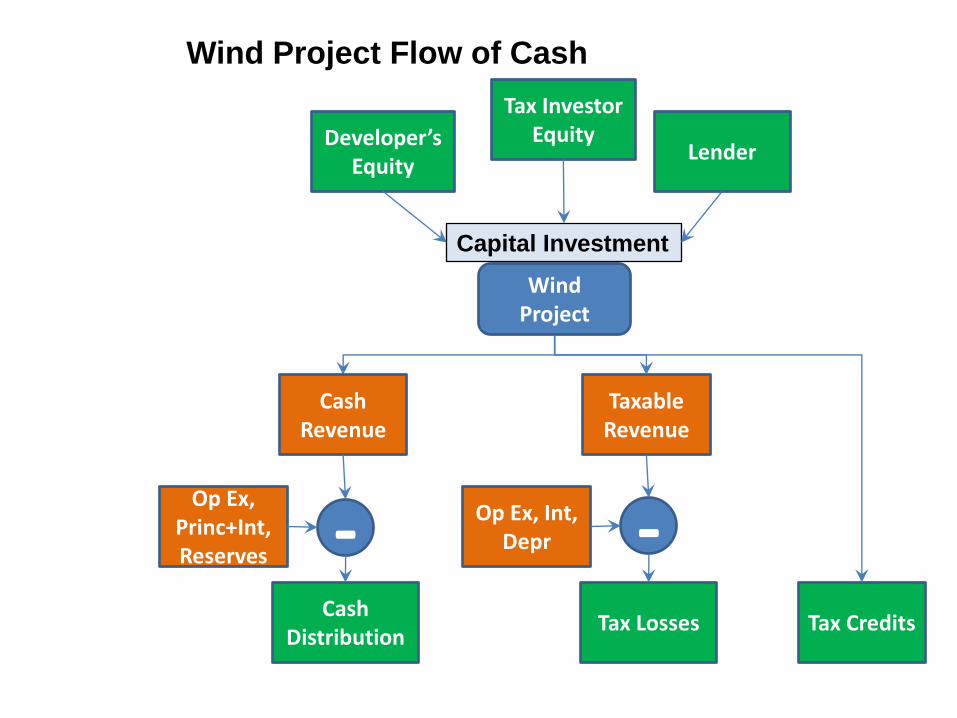
Wind Project Flow of Cash
Wind Project
Developer’s Equity
Tax Investor Equity
Lender
Capital Investment
Cash Revenue
Taxable Revenue
Tax Credits
Op Ex, Princ+Int, Reserves
Op Ex, Int, Depr - -
Cash Distribution
Tax Losses

Sale Price of Wind Energy in US, Source Lawrence Berkeley National Labs
Source: P. Jain, Wind Energy Engineering, 2010

Range of Capital Costs & Recurring Costs
Range, $/kW Reasons for variance
Capital Costs (Total Installed Cost)
$1,200 to $2,200 Normal range: $1,800 to $2,100
India costs are: $1,200 to $1,500/kW US costs are: $1,800 /kW Europe costs are: $2,000/kW Shipping cost, Terrain, Insurance
Operations and maintenance
$20 to $50/kW annually Normal: $40/KW
Duration of manufacturer warranty Remoteness of site
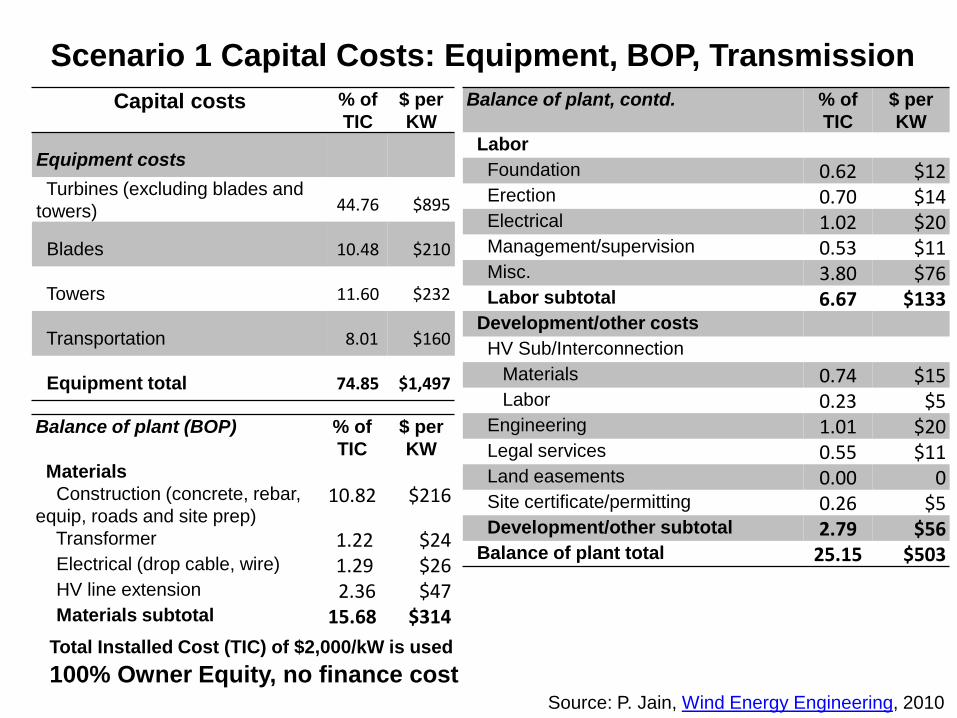
Scenario 1 Capital Costs: Equipment, BOP, Transmission
Capital costs % of
TIC
$ per
KW
Equipment costs
Turbines (excluding blades and
towers) 44.76 $895
Blades 10.48 $210
Towers 11.60 $232
Transportation 8.01 $160
Equipment total 74.85 $1,497
Balance of plant, contd. % of
TIC
$ per
KW
Labor Foundation 0.62 $12 Erection 0.70 $14 Electrical 1.02 $20 Management/supervision 0.53 $11 Misc. 3.80 $76 Labor subtotal 6.67 $133 Development/other costs HV Sub/Interconnection Materials 0.74 $15 Labor 0.23 $5 Engineering 1.01 $20 Legal services 0.55 $11 Land easements 0.00 0 Site certificate/permitting 0.26 $5 Development/other subtotal 2.79 $56 Balance of plant total 25.15 $503
Balance of plant (BOP) % of
TIC
$ per
KW
Materials
Construction (concrete, rebar,
equip, roads and site prep) 10.82 $216
Transformer 1.22 $24 Electrical (drop cable, wire) 1.29 $26 HV line extension 2.36 $47 Materials subtotal 15.68 $314
Total Installed Cost (TIC) of $2,000/kW is used
Source: P. Jain, Wind Energy Engineering, 2010
100% Owner Equity, no finance cost
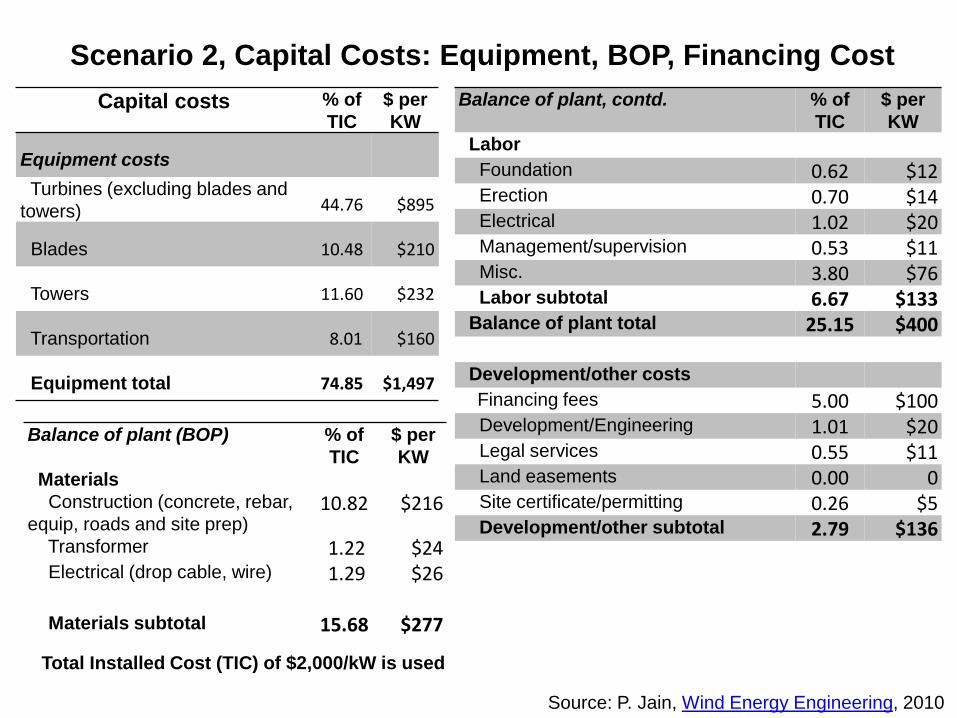
Scenario 2, Capital Costs: Equipment, BOP, Financing Cost
Capital costs % of
TIC
$ per
KW
Equipment costs
Turbines (excluding blades and
towers) 44.76 $895
Blades 10.48 $210
Towers 11.60 $232
Transportation 8.01 $160
Equipment total 74.85 $1,497
Balance of plant, contd. % of
TIC
$ per
KW
Labor Foundation 0.62 $12 Erection 0.70 $14 Electrical 1.02 $20 Management/supervision 0.53 $11 Misc. 3.80 $76 Labor subtotal 6.67 $133 Balance of plant total 25.15 $400
Development/other costs Financing fees 5.00 $100
Development/Engineering 1.01 $20 Legal services 0.55 $11 Land easements 0.00 0 Site certificate/permitting 0.26 $5 Development/other subtotal 2.79 $136
Balance of plant (BOP) % of
TIC
$ per
KW
Materials
Construction (concrete, rebar,
equip, roads and site prep) 10.82 $216
Transformer 1.22 $24 Electrical (drop cable, wire) 1.29 $26
Materials subtotal 15.68 $277
Total Installed Cost (TIC) of $2,000/kW is used
Source: P. Jain, Wind Energy Engineering, 2010
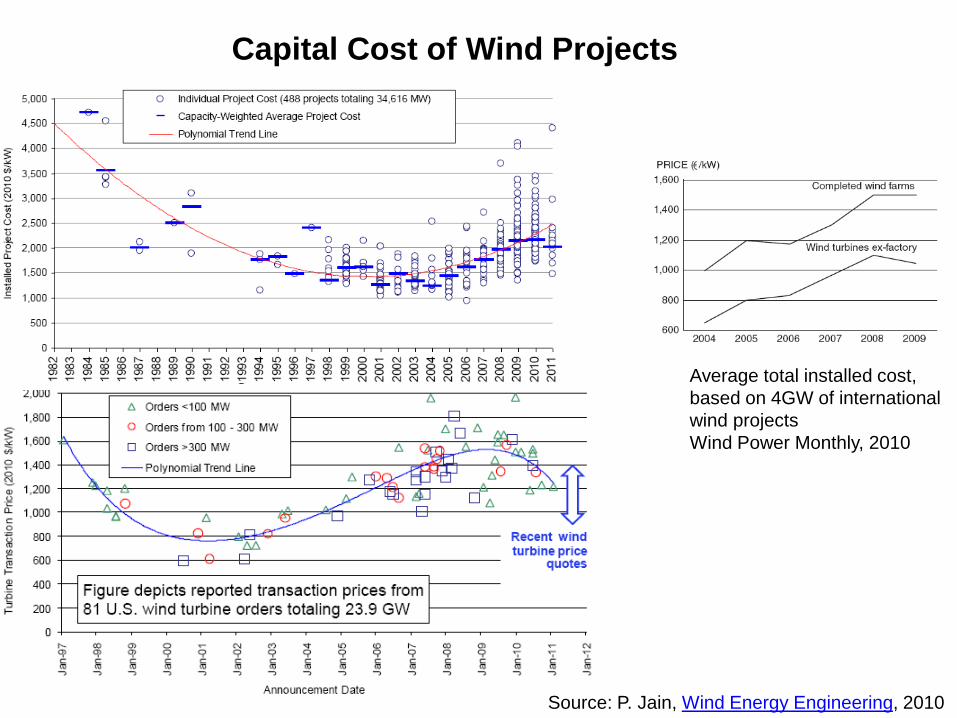
Capital Cost of Wind Projects
Average total installed cost,
based on 4GW of international
wind projects
Wind Power Monthly, 2010
Source: P. Jain, Wind Energy Engineering, 2010
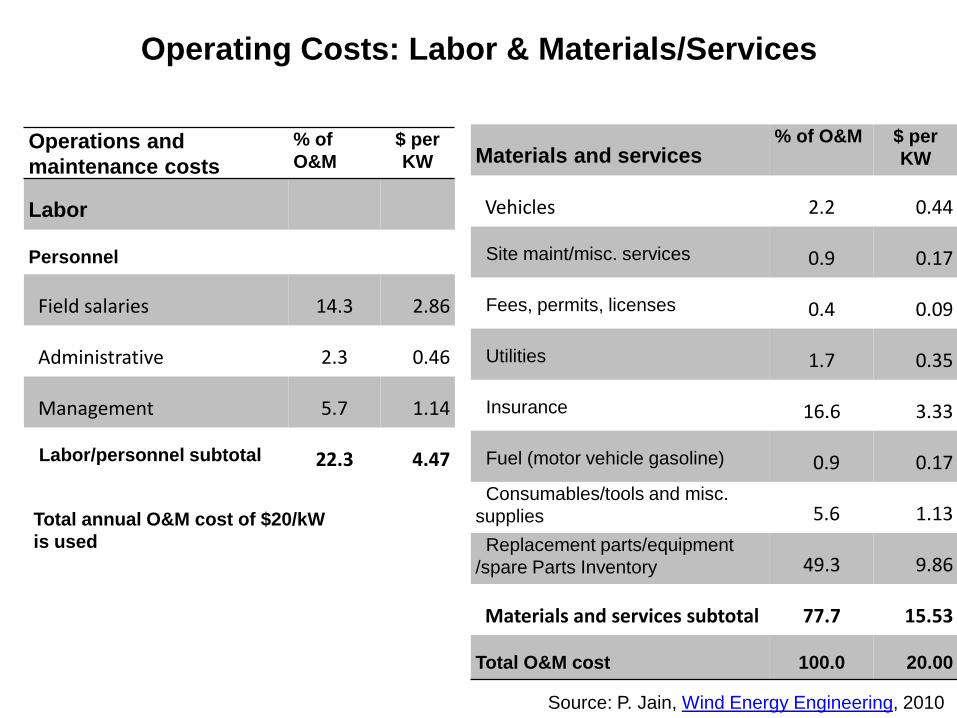
Operating Costs: Labor & Materials/Services
Operations and
maintenance costs
% of
O&M
$ per
KW
Labor
Personnel
Field salaries 14.3 2.86
Administrative 2.3 0.46
Management 5.7 1.14
Labor/personnel subtotal 22.3 4.47
Materials and services % of O&M $ per
KW
Vehicles 2.2 0.44
Site maint/misc. services 0.9 0.17
Fees, permits, licenses 0.4 0.09
Utilities 1.7 0.35
Insurance 16.6 3.33
Fuel (motor vehicle gasoline) 0.9 0.17
Consumables/tools and misc.
supplies 5.6 1.13
Replacement parts/equipment
/spare Parts Inventory 49.3 9.86
Materials and services subtotal 77.7 15.53
Total O&M cost 100.0 20.00
Total annual O&M cost of $20/kW
is used
Source: P. Jain, Wind Energy Engineering, 2010

Questions?
Questions?
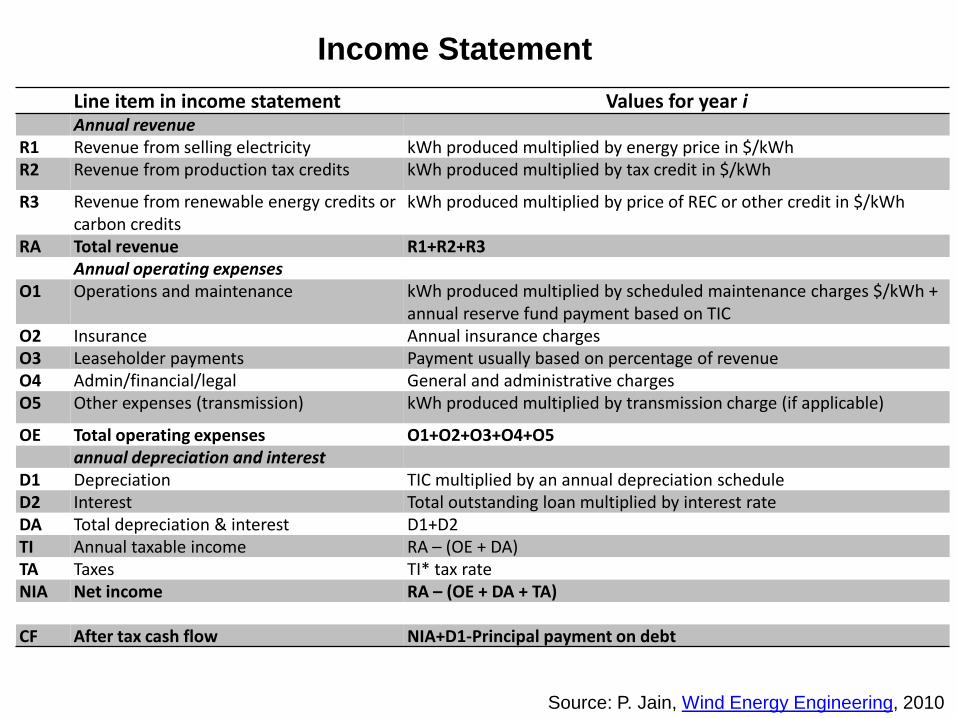
Line item in income statement Values for year i Annual revenue
R1 Revenue from selling electricity kWh produced multiplied by energy price in $/kWh
R2 Revenue from production tax credits kWh produced multiplied by tax credit in $/kWh
R3 Revenue from renewable energy credits or carbon credits
kWh produced multiplied by price of REC or other credit in $/kWh
RA Total revenue R1+R2+R3
Annual operating expenses
O1 Operations and maintenance kWh produced multiplied by scheduled maintenance charges $/kWh + annual reserve fund payment based on TIC
O2 Insurance Annual insurance charges O3 Leaseholder payments Payment usually based on percentage of revenue
O4 Admin/financial/legal General and administrative charges
O5 Other expenses (transmission) kWh produced multiplied by transmission charge (if applicable)
OE Total operating expenses O1+O2+O3+O4+O5
annual depreciation and interest D1 Depreciation TIC multiplied by an annual depreciation schedule
D2 Interest Total outstanding loan multiplied by interest rate
DA Total depreciation & interest D1+D2
TI Annual taxable income RA – (OE + DA) TA Taxes TI* tax rate
NIA Net income RA – (OE + DA + TA)
CF After tax cash flow NIA+D1-Principal payment on debt
Income Statement
Source: P. Jain, Wind Energy Engineering, 2010

Balance Sheet
Balance sheet line items Values for year i Current assets
B1 Cash in bank Year-end cash position
BA Total current assets B1
Fixed assets
FA1 Machinery and equipment Total installed cost of the project
FA2 Less accumulated depreciation Sum of depreciation claimed up to current year
FAA Total fixed assets FA1 – FA2
Total assets FAA + B1
Liabilities and equity
L1 Current liabilities Short-term debt L2 Long term debt Long-term debt LA Total liabilities L1 + L2
Owner’s equity
C1 Invested capital Equity investment in project
C2 Retained earnings From income statement CA Total owner’s equity C1 + C2
Total liabilities + owner’s equity LA + CA
Source: P. Jain, Wind Energy Engineering, 2010
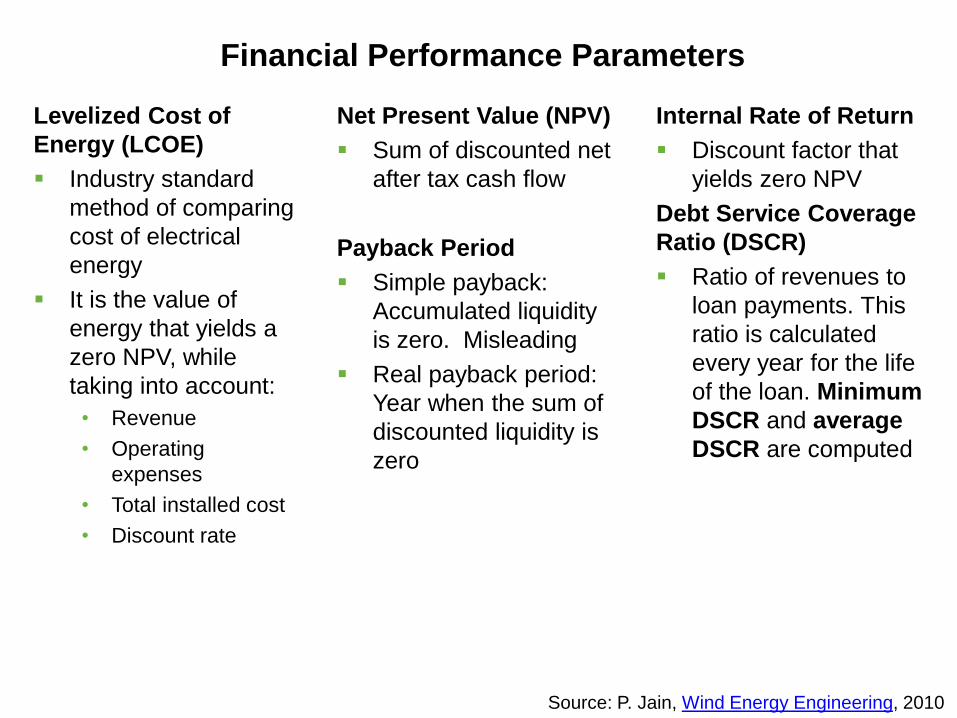
Financial Performance Parameters
Levelized Cost of
Energy (LCOE)
Industry standard
method of comparing
cost of electrical
energy
It is the value of
energy that yields a
zero NPV, while
taking into account:
• Revenue
• Operating
expenses
• Total installed cost
• Discount rate
Net Present Value (NPV)
Sum of discounted net
after tax cash flow
Payback Period
Simple payback:
Accumulated liquidity
is zero. Misleading
Real payback period:
Year when the sum of
discounted liquidity is
zero
Internal Rate of Return
Discount factor that
yields zero NPV
Debt Service Coverage
Ratio (DSCR)
Ratio of revenues to
loan payments. This
ratio is calculated
every year for the life
of the loan. Minimum
DSCR and average
DSCR are computed
Source: P. Jain, Wind Energy Engineering, 2010

Implications of Debt Service Coverage Ratio
Common to have minimum DSCR in the first year of operation
• This is because of ramp up of production, leading to lower revenue
Minimum DSCR limits the amount of debt
• => higher equity requirement
• => lower return
Tricks used:
• Front load the PPA (through constant nominal payments)
• Back load debt payments
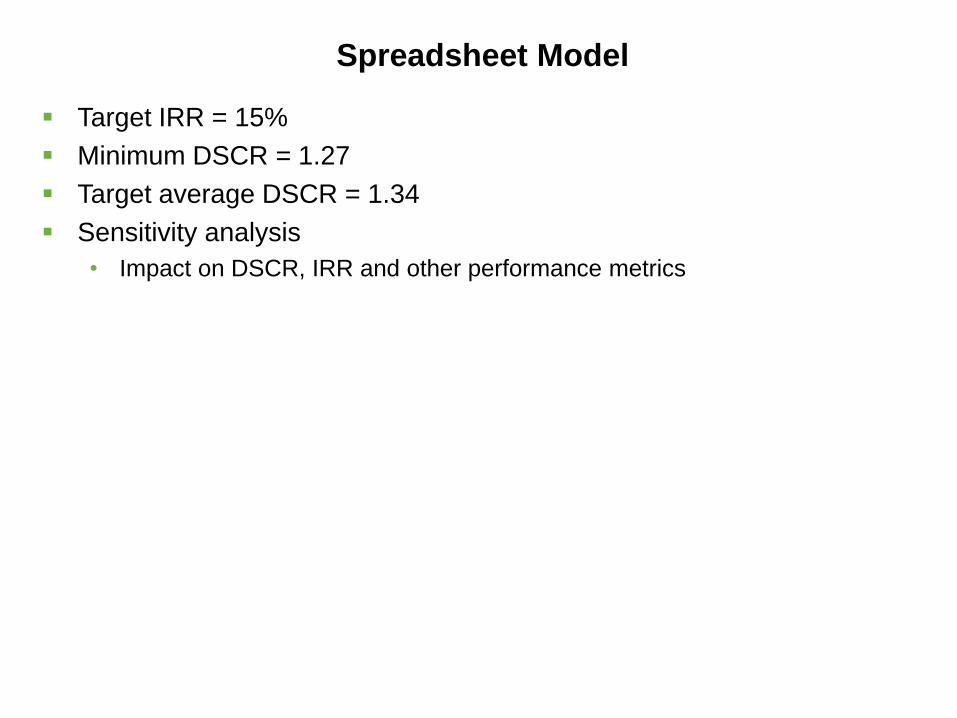
Spreadsheet Model
Target IRR = 15%
Minimum DSCR = 1.27
Target average DSCR = 1.34
Sensitivity analysis
• Impact on DSCR, IRR and other performance metrics
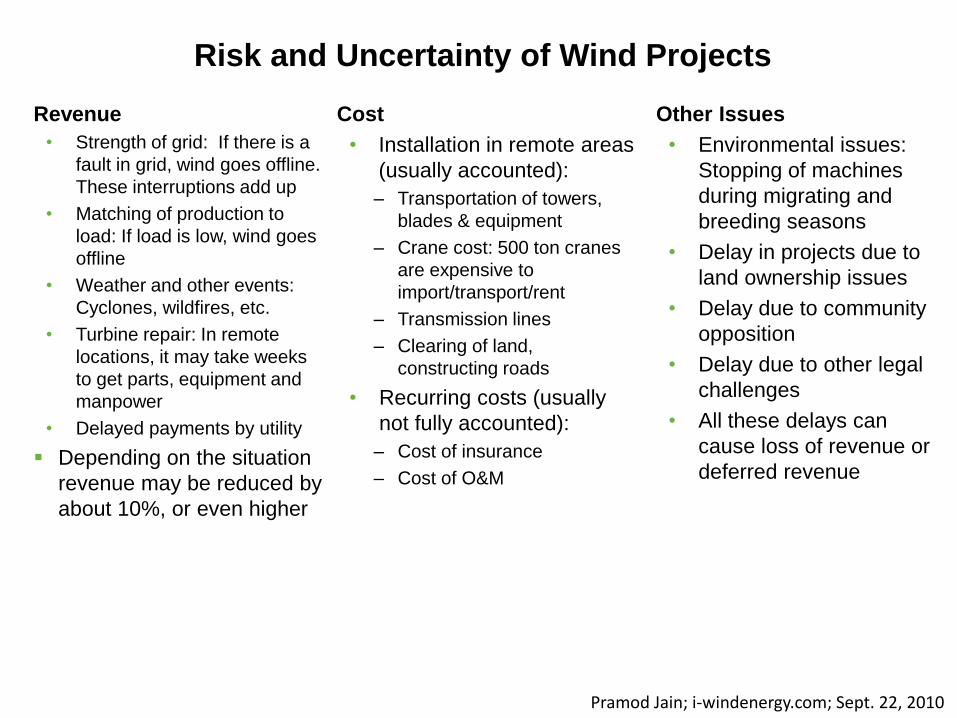
Risk and Uncertainty of Wind Projects
Revenue
• Strength of grid: If there is a
fault in grid, wind goes offline.
These interruptions add up
• Matching of production to
load: If load is low, wind goes
offline
• Weather and other events:
Cyclones, wildfires, etc.
• Turbine repair: In remote
locations, it may take weeks
to get parts, equipment and
manpower
• Delayed payments by utility
Depending on the situation
revenue may be reduced by
about 10%, or even higher
Cost
• Installation in remote areas
(usually accounted):
– Transportation of towers,
blades & equipment
– Crane cost: 500 ton cranes
are expensive to
import/transport/rent
– Transmission lines
– Clearing of land,
constructing roads
• Recurring costs (usually
not fully accounted):
– Cost of insurance
– Cost of O&M
Other Issues
• Environmental issues:
Stopping of machines
during migrating and
breeding seasons
• Delay in projects due to
land ownership issues
• Delay due to community
opposition
• Delay due to other legal
challenges
• All these delays can
cause loss of revenue or
deferred revenue
Pramod Jain; i-windenergy.com; Sept. 22, 2010

Organization Structure and Flow of Money
Alternate Organization
Structures
Corporate structure
Tax-equity & flip investor
Debt leveraged
Source: P. Jain, Wind Energy Engineering, 2010
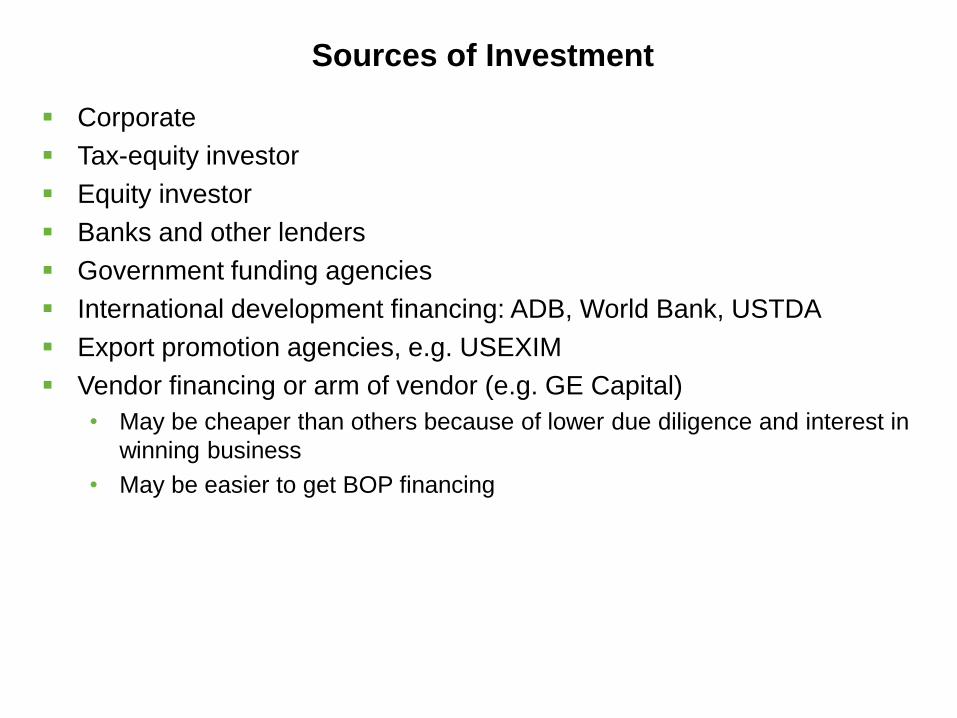
Sources of Investment
Corporate
Tax-equity investor
Equity investor
Banks and other lenders
Government funding agencies
International development financing: ADB, World Bank, USTDA
Export promotion agencies, e.g. USEXIM
Vendor financing or arm of vendor (e.g. GE Capital)
• May be cheaper than others because of lower due diligence and interest in
winning business
• May be easier to get BOP financing
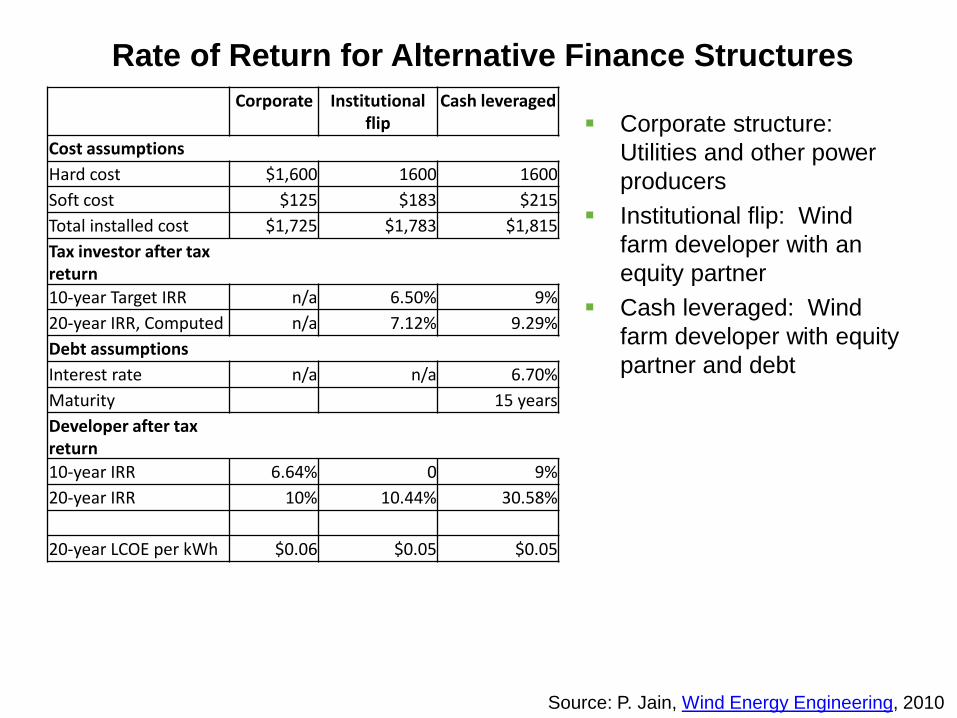
Rate of Return for Alternative Finance Structures
Corporate Institutional flip
Cash leveraged
Cost assumptions
Hard cost $1,600 1600 1600
Soft cost $125 $183 $215
Total installed cost $1,725 $1,783 $1,815
Tax investor after tax return
10-year Target IRR n/a 6.50% 9%
20-year IRR, Computed n/a 7.12% 9.29%
Debt assumptions
Interest rate n/a n/a 6.70%
Maturity 15 years
Developer after tax return
10-year IRR 6.64% 0 9%
20-year IRR 10% 10.44% 30.58%
20-year LCOE per kWh $0.06 $0.05 $0.05
Corporate structure:
Utilities and other power
producers
Institutional flip: Wind
farm developer with an
equity partner
Cash leveraged: Wind
farm developer with equity
partner and debt
Source: P. Jain, Wind Energy Engineering, 2010

Conclusions
Detailed financial analysis requires significant due diligence
Fixed fee construction contracts and third party
maintenance contracts tied to production are strategies to
minimize risk
Wind projects require a framework for risk management for:
• Categorizing risk
• Quantifying risk
• Assessing impact of risk
• Strategies for mitigating risk
Risk management has to be a ongoing task along with
project management