Financial Analyst Meeting - Beiersdorf/media/Beiersdorf/investors/... · 2019-03-04 · february...
67
FINANCIAL ANALYST MEETING 2019 FEBRUARY 27 TH , 2019
Transcript of Financial Analyst Meeting - Beiersdorf/media/Beiersdorf/investors/... · 2019-03-04 · february...

FINANCIAL ANALYST
MEETING 2019
FEBRUARY 27TH, 2019
DISCLAIMER
Some of the statements made in this presentation contain forward-looking information that involve a number of risks and uncertainties. Such statements are based on a number of assumptions, estimates, projections or plans that are inherently subject to significant risks, as well as uncertainties and contingencies that are subject to change. Actual results can differ materially from those anticipated in the Company´s forward-looking statements as a result of a variety of factors, including those set forth from time to time in the Company´s press releases and reports and those set forth from time to time in the Company´s analyst calls and discussions. We do not assume any obligation to update the forward-looking statements contained in this presentation.This presentation does not constitute an offer to sell or a solicitation or offer to buy any securities of the Company, and no part of this presentation shall form the basis of or may be relied upon in connection with any contract or commitment. This presentation is being presented solely for your information and is subject to change without notice.
February 27, 2019 | Financial Analyst Meeting 2019
Page 2

AGENDA
February 27, 2019 | Financial Analyst Meeting 2019
Page 3
FINANCIAL RESULTS 2018
FINANCIAL AMBITIONS
STRATEGY UPDATE
SUMMARY
Q&A

AGENDA
February 27, 2019 | Financial Analyst Meeting 2019
Page 4
FINANCIAL RESULTS 2018
FINANCIAL AMBITIONS
STRATEGY UPDATE
SUMMARY
Q&A

FINANCIAL RESULTS 2018
February 27, 2019 | Financial Analyst Meeting 2019
Page 5
GROWTH AHEAD OF THE MARKET
2018CHALLENGING FX, PRICING & INPUT COST ENVIRONMENT

GROUP – KEY FIGURES
February 27, 2019 | Financial Analyst Meeting 2019
Page 6
JAN. – DEC. 2017 JAN. – DEC. 2018 CHANGE
MILL. € MILL. € NOMINAL ORGANIC
SALES 7,056 7,233 +2.5% +5.4%
EBIT 1,088 1,097 +0.8%
PROFIT AFTER TAX 689 745 +8.1%
EARNINGS PER SHARE IN € 2.96 3.21 +8.4%
EBIT* 1,088 1,113 +2.3%
PROFIT AFTER TAX* 689 756 +9.6%
EBIT MARGIN* 15.4% 15.4% FLAT
PROFIT AFTER TAX MARGIN* 9.8% 10.5% +70BPS
* Excl. special factors

GROUP – SEGMENTS
February 27, 2019 | Financial Analyst Meeting 2019
Page 7
* Excl. special factors
JAN. – DEC. 2017 JAN. – DEC. 2018 CHANGE
GROUP MILL. € MILL. € NOMINAL ORGANIC
SALES 7,056 7,233 +2.5% +5.4%
EBIT* 1,088 1,113 +2.3%
EBIT MARGIN* 15.4% 15.4% FLAT
CONSUMER
SALES 5,799 5,890 +1.6% +5.0%
EBIT* 881 903 +2.5%
EBIT MARGIN* 15.2% 15.3% +10BPS
TESA
SALES 1,257 1,343 +6.8% +6.8%
EBIT 207 210 +1.3%
EBIT MARGIN 16.5% 15.7% -80BPS

CONSUMER – GROWTH
February 27, 2019 | Financial Analyst Meeting 2019
Page 8
* Consumer organic sales growth if sales in Argentina had been calculated at constant FX rates
ORGANIC SALES GROWTH IN %
FY 2016
+3.3
Q1 2018
+4.9*
+4.7
FY 2017
+8.0
+6.1
Q2 2018
+2.9
Q3 2018
+8.5*
+3.3
Q4 2018
+5.0
FY 2018
+4.1*
+6.6*
+3.9*+4.5*
+5.9*

CONSUMER – GROWTH
February 27, 2019 | Financial Analyst Meeting 2019
Page 9
+38.5%+2.8% +5.9% -1.8%
NIVEA DERMA HEALTHCARE LA PRAIRIE
+14.3%+3.2% +4.6% -3.1%
FY 2018
Q4 2018

CONSUMER – EUROPE
February 27, 2019 | Financial Analyst Meeting 2019
Page 10
JAN. – DEC. 2018 CHANGE
MILL. € FY 2018 NOMINAL FY 2018 ORGANIC Q4 2018 ORGANIC
WESTERN EUROPE 2,354 +3.2% +3.9% +1.6%
EASTERN EUROPE 587 +1.1% +5.3% +6.5%
EUROPE 2,941 +2.8% +4.2% +2.7%
• STRONG GROWTH OF LA PRAIRIE
• EASTERN EUROPE CONTINUES SOLID, BROAD-BASED PERFORMANCE
• SIGNIFICANT CONTRIBUTION FROM SUCCESSFUL LAUNCHES
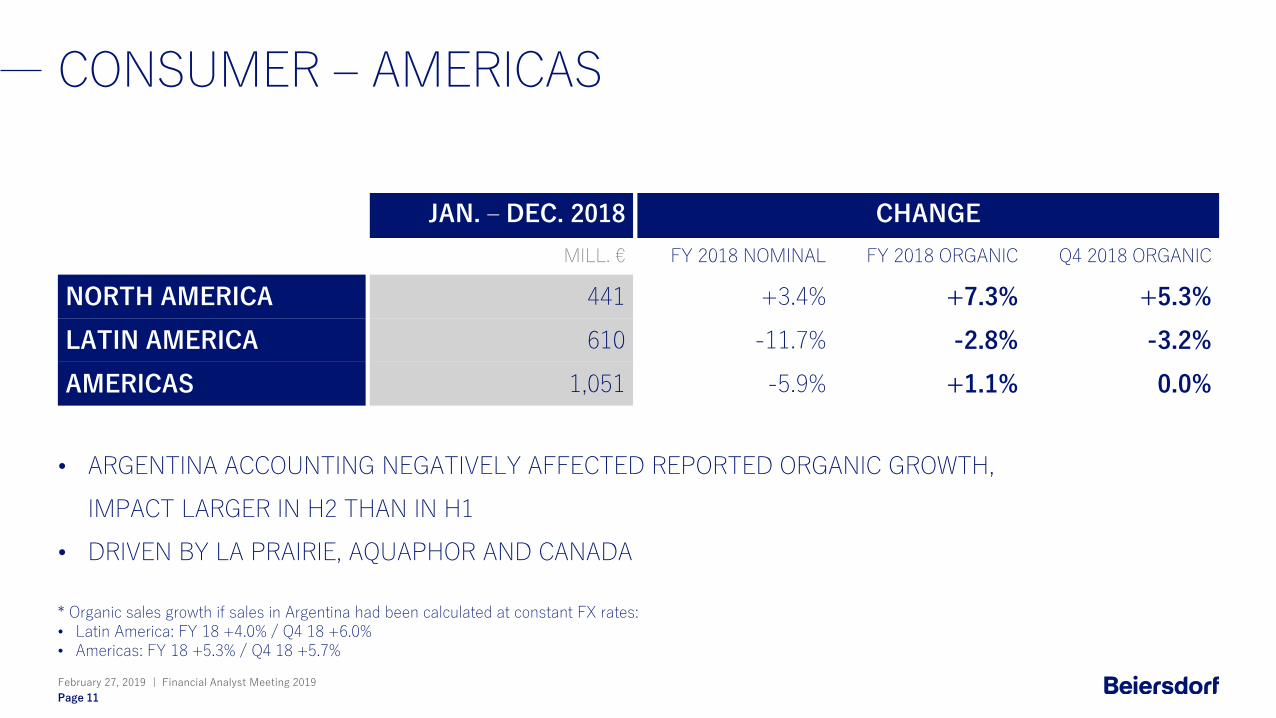
CONSUMER – AMERICAS
February 27, 2019 | Financial Analyst Meeting 2019
Page 11
JAN. – DEC. 2018 CHANGE
MILL. € FY 2018 NOMINAL FY 2018 ORGANIC Q4 2018 ORGANIC
NORTH AMERICA 441 +3.4% +7.3% +5.3%
LATIN AMERICA 610 -11.7% -2.8% -3.2%
AMERICAS 1,051 -5.9% +1.1% 0.0%
• ARGENTINA ACCOUNTING NEGATIVELY AFFECTED REPORTED ORGANIC GROWTH,
IMPACT LARGER IN H2 THAN IN H1
• DRIVEN BY LA PRAIRIE, AQUAPHOR AND CANADA
* Organic sales growth if sales in Argentina had been calculated at constant FX rates:• Latin America: FY 18 +4.0% / Q4 18 +6.0%• Americas: FY 18 +5.3% / Q4 18 +5.7%

CONSUMER – AFRICA/ASIA/AUSTRALIA
February 27, 2019 | Financial Analyst Meeting 2019
Page 12
JAN. – DEC. 2018 CHANGE
MILL. € FY 2018 NOMINAL FY 2018 ORGANIC Q4 2018 ORGANIC
A/A/A 1,898 +4.2% +8.8% +6.3%
• STRONG BROAD-BASED GROWTH LED BY AFRICA, INDIA AND INDONESIA
• CHINA HAIR CARE REMAINS DIFFICULT
• LA PRAIRIE MADE A POSITIVE CONTRIBUTION

CONSUMER – EBIT
February 27, 2019 | Financial Analyst Meeting 2019
Page 13
IN % OF CONSUMER SALES, EXCL. SPECIAL FACTORS
2016
13.0%
2015 2017
13.9%
2014 2018
14.8% 15.2% 15.3%
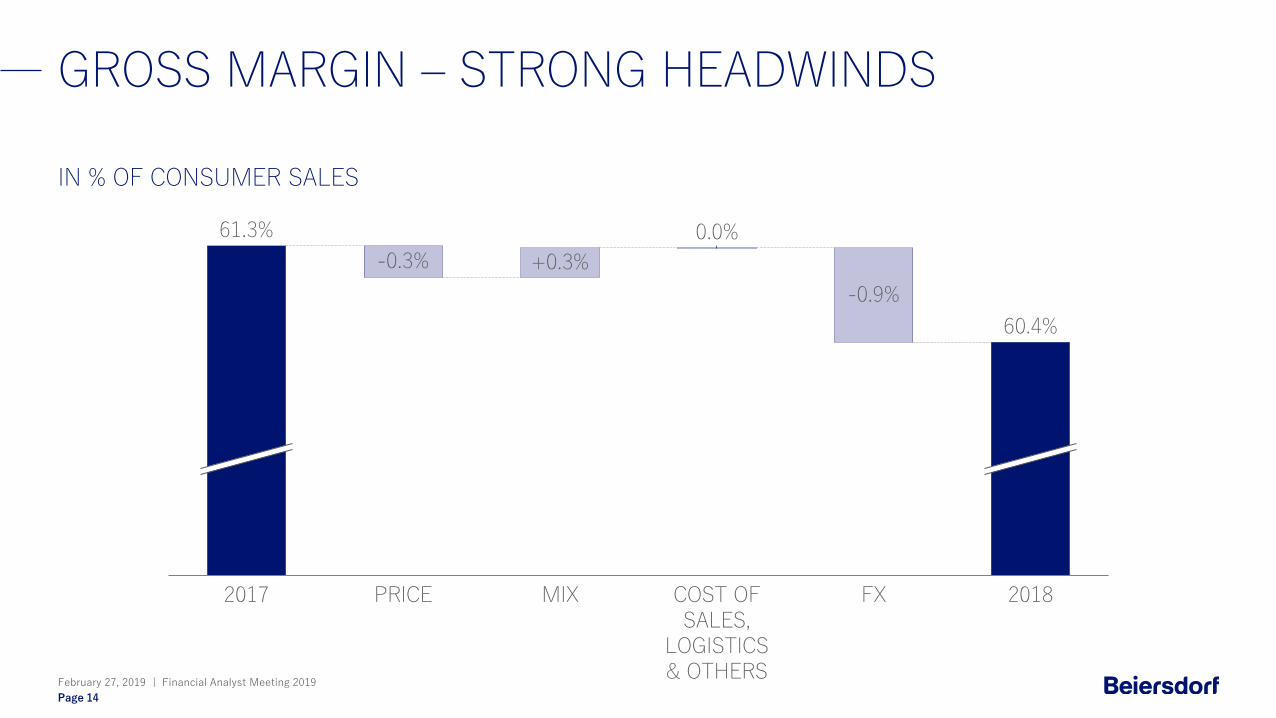
GROSS MARGIN – STRONG HEADWINDS
February 27, 2019 | Financial Analyst Meeting 2019
Page 14
IN % OF CONSUMER SALES
2017
-0.3%
PRICE
+0.3%
MIX
0.0%
COST OF SALES,
LOGISTICS & OTHERS
FX
-0.9%
61.3%
2018
60.4%

WOC – 2018 NORMALIZED POST CYBER
February 27, 2019 | Financial Analyst Meeting 2019
Page 15
WORKING CAPITAL IN % OF CONSUMER SALES ON A 12-MONTH ROLLING BASIS
2018
9.9%
2014 2015 2016
9.2%
13.6%
2017
14.6%
11.0%

TESA – KEY FIGURES
February 27, 2019 | Financial Analyst Meeting 2019
Page 16
JAN. – DEC. 2017 JAN. – DEC. 2018 CHANGE
MILL. € MILL. € NOMINAL ORGANIC
SALES 1,257 1,343 +6.8% +6.8%
EBIT 207 210 +1.3%
EBIT MARGIN 16.5% 15.7% -80BPS
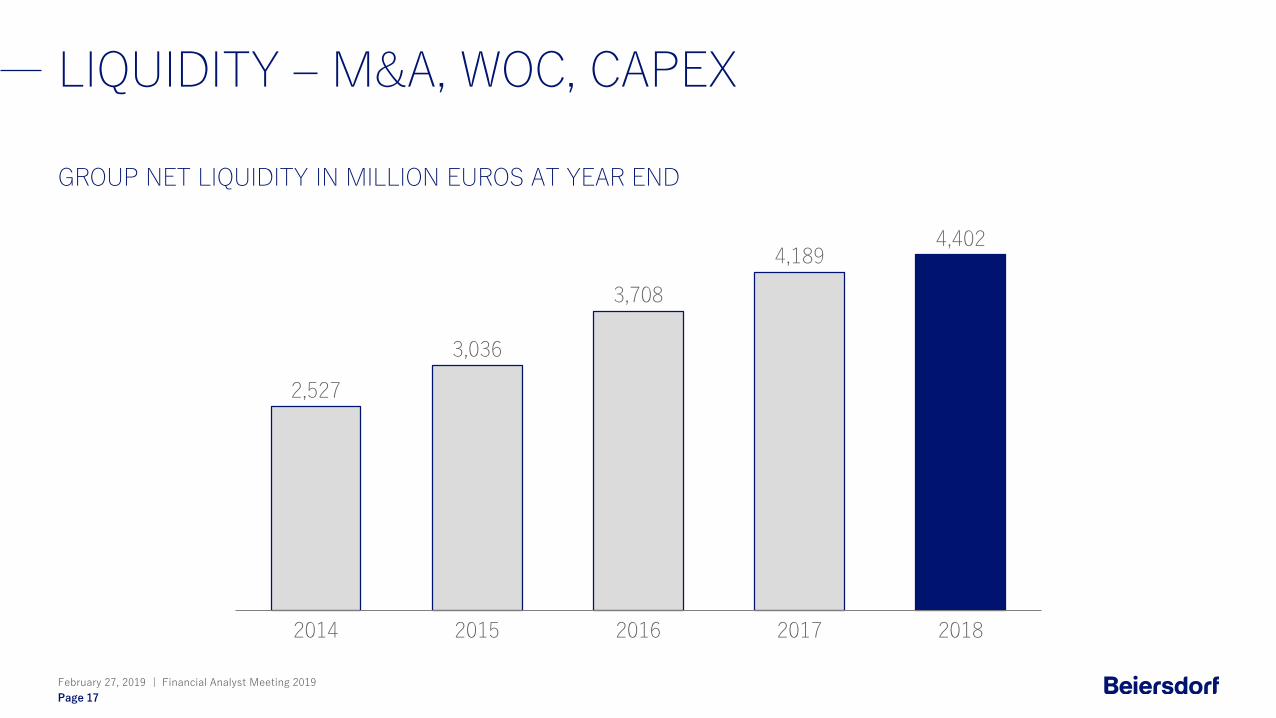
LIQUIDITY – M&A, WOC, CAPEX
February 27, 2019 | Financial Analyst Meeting 2019
Page 17
GROUP NET LIQUIDITY IN MILLION EUROS AT YEAR END
20152014
4,189
2,527
2016
3,036
20182017
3,708
4,402

PAT – SIGNIFICANTLY IMPROVED
February 27, 2019 | Financial Analyst Meeting 2019
Page 18
IN % OF GROUP SALES, EXCL. SPECIAL FACTORS
10.8%
9.2%
2014 2015 20172016 2018
10.0% 9.8%10.5%

GUIDANCE 2019
February 27, 2019 | Financial Analyst Meeting 2019
Page 19
CONSUMER• SALES GROWTH 3-5%
• EBIT MARGIN 14-14.5%
TESA• SALES GROWTH 3-4%
• EBIT MARGIN SLIGHTLY BELOW PREVIOUS YEAR
TOTAL GROUP• SALES GROWTH 3-5%
• EBIT MARGIN AROUND 14.5%
• PAT MARGIN SLIGHTLY BELOW PREVIOUS YEAR
2018 DATA FOR REFERENCE (EXCLUDING SPECIAL FACTORS):• CONSUMER EBIT 15.3%
• TESA EBIT 15.7%
• GROUP EBIT 15.4%
• GROUP PROFIT AFTER TAX MARGIN 10.5%
Note: Sales development on an organic basis – Profit development on an operative basis

AGENDA
February 27, 2019 | Financial Analyst Meeting 2019
Page 20
FINANCIAL RESULTS 2018
FINANCIAL AMBITIONS
STRATEGY UPDATE
SUMMARY
Q&A

BEIERSDORF
February 27, 2019 | Financial Analyst Meeting 2019
Page 21
5,890 MILL. €/ 81% 1,343 MILL. €/ 19%
CONSUMER SKIN CARE TESA

TODAY
February 27, 2019 | Financial Analyst Meeting 2019
Page 22
DISRUPTION
DIGITAL TECHNOLOGIESEMPOWERING CONSUMERS
PERSONALIZATION
DYNAMIC GROWTH OF SMALL BRANDS
OPPORTUNITY
SKIN CARE IS AN ATTRACTIVE MARKET
BEIERSDORF IS VERY WELL POSITIONED TO CAPTURE THE OPPORTUNITY
NEED TO ACT
EUROPEAN MASS MARKET BUSINESS UNDER PRESSURE
UNDERWEIGHT PRESENCE IN GROWTH MARKETS

EUROPELATAM, AFRICA,
NEAR EAST
21%21%
Future Growth
10%
49%
Future Growth
STRENGTHENMARKET LEADERSHIP
DRIVE CATEGORY GROWTH & MARKET ENTRY
Share
of
Net
Sale
s /
Futu
re M
ark
et
Gro
wth
ASIA
CAPTURE GROWTH POTENTIAL
54%
22%
Future Growth
GROWTH OPPORTUNITY
February 27, 2019 | Financial Analyst Meeting 2019
Page 23
Source: Beiersdorf Net Sales, Euromonitor, Forecast 2017-2021, not shown: North America, representing 8% of Beiersdorf Net Sales and 15% of future market growth

February 27, 2019 | Financial Analyst Meeting 2019
Page 24
OUR ABILITY TO CAPTURETHE GROWTH POTENTIAL
STRONG BALANCE SHEET
LONG TERM PERSPECTIVE
PEOPLE
INNOVATION KNOW HOW
FOCUS ON SKIN CARE
GLOBAL, ICONIC BRANDS

OUR COMMITMENT
February 27, 2019 | Financial Analyst Meeting 2019
Page 25
SUSTAINABLE PROFITABILITY
CREATE CONSUMER VALUE
OUTPERFORM THE MARKET
COMPETITIVE SUSTAINABLE GROWTH

5 STRATEGIC PRIORITIES
February 27, 2019 | Financial Analyst Meeting 2019
Page 26
INCREASE PRODUCTIVITY
CREATE VALUE FOR SOCIETY
DRIVE GROWTH
ACCELERATE IN WHITE SPOTS
WIN WITH SKIN CARE
STEP UP DIGITALIZATION
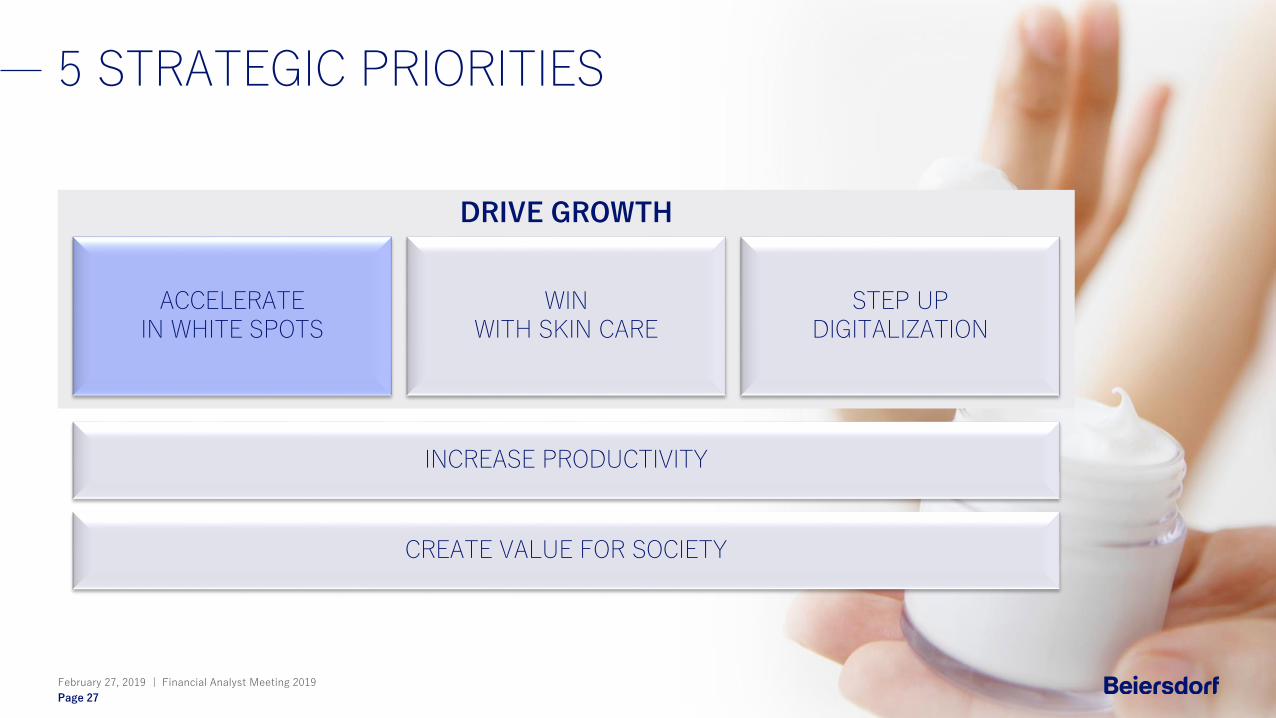
5 STRATEGIC PRIORITIES
February 27, 2019 | Financial Analyst Meeting 2019
Page 27
INCREASE PRODUCTIVITY
CREATE VALUE FOR SOCIETY
DRIVE GROWTH
ACCELERATE IN WHITE SPOTS
WIN WITH SKIN CARE
STEP UP DIGITALIZATION

WIN IN INDIA
February 27, 2019 | Financial Analyst Meeting 2019
Page 28
PROFITABLE AFTER 5 YEARS
NUMBER OF STORES x 5
No. 1 IN MODERN TRADE & ECOMMERCE
No. 2 MARKET POSITION IN DEO & BODY
NET SALES x7
NET SALES DEVELOPMENT SINCE 2011
2011 2012 20182013 2014 2015 2016 2017
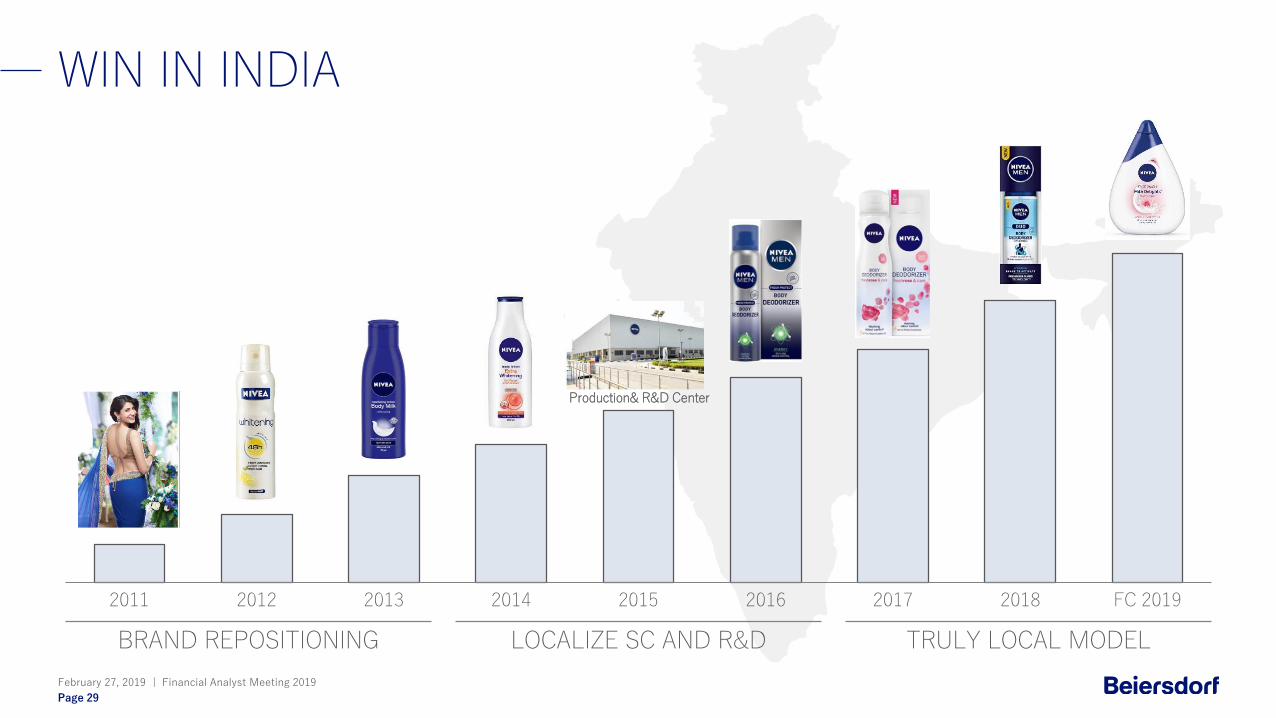
WIN IN INDIA
February 27, 2019 | Financial Analyst Meeting 2019
Page 29
FC 201920122011 2013 20172014 20182015 2016
Production& R&D Center
TRULY LOCAL MODELLOCALIZE SC AND R&DBRAND REPOSITIONING

WHITE SPOT POTENTIAL
February 27, 2019 | Financial Analyst Meeting 2019
Page 30
43%
HALF OF THE WORLD’S POPULATION CONSUMES
LESS THAN
10 CENTS
WORTH OF BEIERSDORF PRODUCTS
% OF NET SALES
43%
SOURCE: Euromonitor

NEW AFFILIATES
February 27, 2019 | Financial Analyst Meeting 2019
Page 31
RECENTLY FOUNDED
PLANNED
PRODUCTION CENTER
Myanmar
Nigeria
Bangladesh
Pakistan
Saudi ArabiaEgypt
Ghana
2016
2018
20162017
2012
ADDITIONAL POPULATION COVERED: ~800 MILLION

LONG TERM COMMITMENT TO CHINA
February 27, 2019 | Financial Analyst Meeting 2019
Page 32
CHINA HEADQUARTERED SKIN CARE INNOVATION CENTER
STRATEGIC REVIEW SLEK HAIR CARE

5 STRATEGIC PRIORITIES
February 27, 2019 | Financial Analyst Meeting 2019
Page 33
INCREASE PRODUCTIVITY
CREATE VALUE FOR SOCIETY
DRIVE GROWTH
ACCELERATE IN WHITE SPOTS
WIN WITH SKIN CARE
STEP UP DIGITALIZATION

WIN WITH SKIN CARE
February 27, 2019 | Financial Analyst Meeting 2019
Page 34
STEP UP INNOVATION CAPABILITIES
MARGIN ENHANCING INNOVATION
PORTFOLIO FOCUS

COMPLEMENTING BRAND PORTFOLIO
February 27, 2019 | Financial Analyst Meeting 2019
Page 35
DERMOCOSMETIC
MASS SKIN CARE
HEALTH CARE
LUXURY SKIN CARE
NEW SEGMENTS

INNOVATIONS 2019
REJUVENATING & DETOXIFYING TREATMENT
LOTION
ACTIVATES CELLS FOR RESHAPED & STRENGHTENED
SKIN
STRENGTHENS SKIN &PLUMPS UP WRINKLES
IN 7 DAYS
SENSITIVE BALMFOR MEN’S
SKIN & STUBBLE
REPLENISHES, PROTECTS & BEAUTIFIES
SKIN AFTER SHAVING
February 27, 2019 | Financial Analyst Meeting 2019
Page 36

February 27, 2019 | Financial Analyst Meeting 2019
Page 37
THE NEXT MILESTONE IN INNOVATION

HYPERPIGMENTATION
ONE COMMON SKIN CONCERN WHICH AFFECTS MORE THAN HALF OF THE GLOBAL
FEMALE POPULATION
February 27, 2019 | Financial Analyst Meeting 2019
Page 38

THE SOLUTION – THIAMIDOL
GIVES THE SKIN A MORE EVEN COMPLEXION
CLINICALLY PROVEN TO VISIBLY REDUCE DARK SPOTS
BEFORE AFTER
10 YEARS OF PIONEERING RESEARCHPATENT PROTECTION
February 27, 2019 | Financial Analyst Meeting 2019
Page 39
0 4 8 1 2
-6
-5
-4
-3
-2
-1
0
1
2
tre a tm e n t (w e e k s )
mM
AS
I S
co
re C
ha
ng
e (
me
an
SD
)
c o n tro l
T h ia m id o l

5 STRATEGIC PRIORITIES
February 27, 2019 | Financial Analyst Meeting 2019
Page 40
INCREASE PRODUCTIVITY
CREATE VALUE FOR SOCIETY
DRIVE GROWTH
ACCELERATE IN WHITE SPOTS
WIN WITH SKIN CARE
STEP UP DIGITALIZATION

STEP UP DIGITALIZATION
February 27, 2019 | Financial Analyst Meeting 2019
Page 41
INCREASE PRODUCTIVITY
DIGITAL TRANSFORMATION
DIGITAL CONNECTION TO CONSUMER

5 STRATEGIC PRIORITIES
February 27, 2019 | Financial Analyst Meeting 2019
Page 42
INCREASE PRODUCTIVITY
CREATE VALUE FOR SOCIETY
DRIVE GROWTH
ACCELERATE IN WHITE SPOTS
WIN WITH SKIN CARE
STEP UP DIGITALIZATION

February 27, 2019 | Financial Analyst Meeting 2019
Page 43
FUEL THE GROWTH
WORKING CAPITAL & TAX RATE
SIMPLE & FAST ORGANIZATION
DRIVE GROSS MARGIN

5 STRATEGIC PRIORITIES
February 27, 2019 | Financial Analyst Meeting 2019
Page 44
INCREASE PRODUCTIVITY
CREATE VALUE FOR SOCIETY
DRIVE GROWTH
ACCELERATE IN WHITE SPOTS
WIN WITH SKIN CARE
STEP UP DIGITALIZATION

WE CARE. ACHIEVEMENTS
February 27, 2019 | Financial Analyst Meeting 2019
Page 45
PRODUCTS PLANET PEOPLE
100% FREE OF MICROBEADS SINCE 2015
74% CERTIFIED PALM
81% RENEWABLE ELECTRICITY
-59% ENERGY-RELATED CO2 PER UNIT SINCE 2014
960,000 FAMILIES SOCIALLY SUPPORTED SINCE 2013
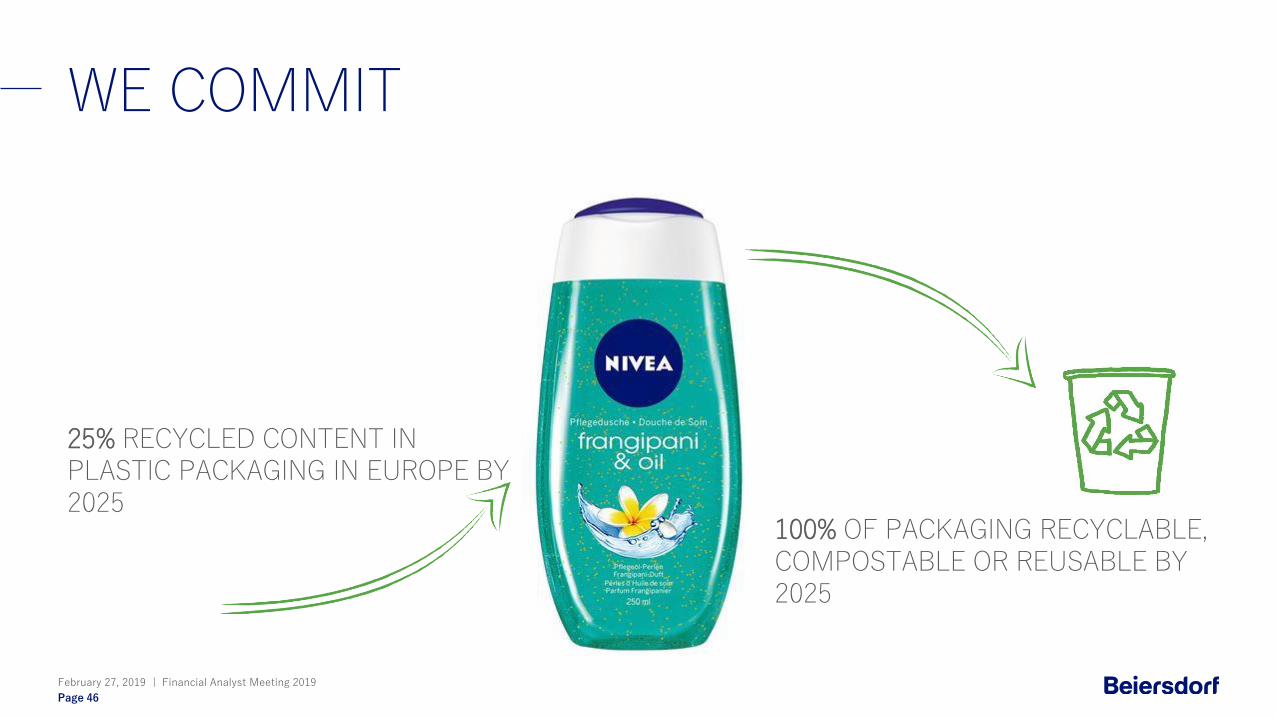
WE COMMIT
100% OF PACKAGING RECYCLABLE, COMPOSTABLE OR REUSABLE BY 2025
25% RECYCLED CONTENT IN PLASTIC PACKAGING IN EUROPE BY 2025
February 27, 2019 | Financial Analyst Meeting 2019
Page 46
February 27, 2019 | Financial Analyst Meeting 2019
Page 47

TESA BUSINESS SEGMENTS
February 27, 2019 | Financial Analyst Meeting 2019
Page 48
IN MILL. €, ORGANIC GROWTH
* Incl. ancillary businesses
DIRECT INDUSTRIES(+9.1% )
TRADE MARKETS(+3.8%)
TESA TOTAL(+6.8%)
AUTOMOTIVE
ELECTRONICS
PRINT AND PAPER
BUILDING SUPPLY
CONSUMER & CRAFTSMEN
GENERAL INDUSTRIAL MARKETS
1,343*
2018
539
2018
798
2018

ELECTRONIC INDUSTRY SOLUTIONS
February 27, 2019 | Financial Analyst Meeting 2019
Page 49
Bonding and Detaching
Reliable bonding and residue-free detaching
Shielding and GroundingElectrically conductive tapes for
shielding and grounding applications
Structural Bonding
Superior bonding strength even on
small bonding areas
Screen MountingMounting of demanding
lens and touch panel applications
Optically Clear Lamination
Highest transparency for outstanding
lamination
Film and Graphite Sheet Lamination
Reliable bonding tapes for easy lamination process
Component MountingSecure component mounting
inside and outside of the device
Sealing and Cushioning
Preventing humidity, dust and
providing cushioning
WELL-POSITIONED AND BALANCED
February 27, 2019 | Financial Analyst Meeting 2019
Page 50
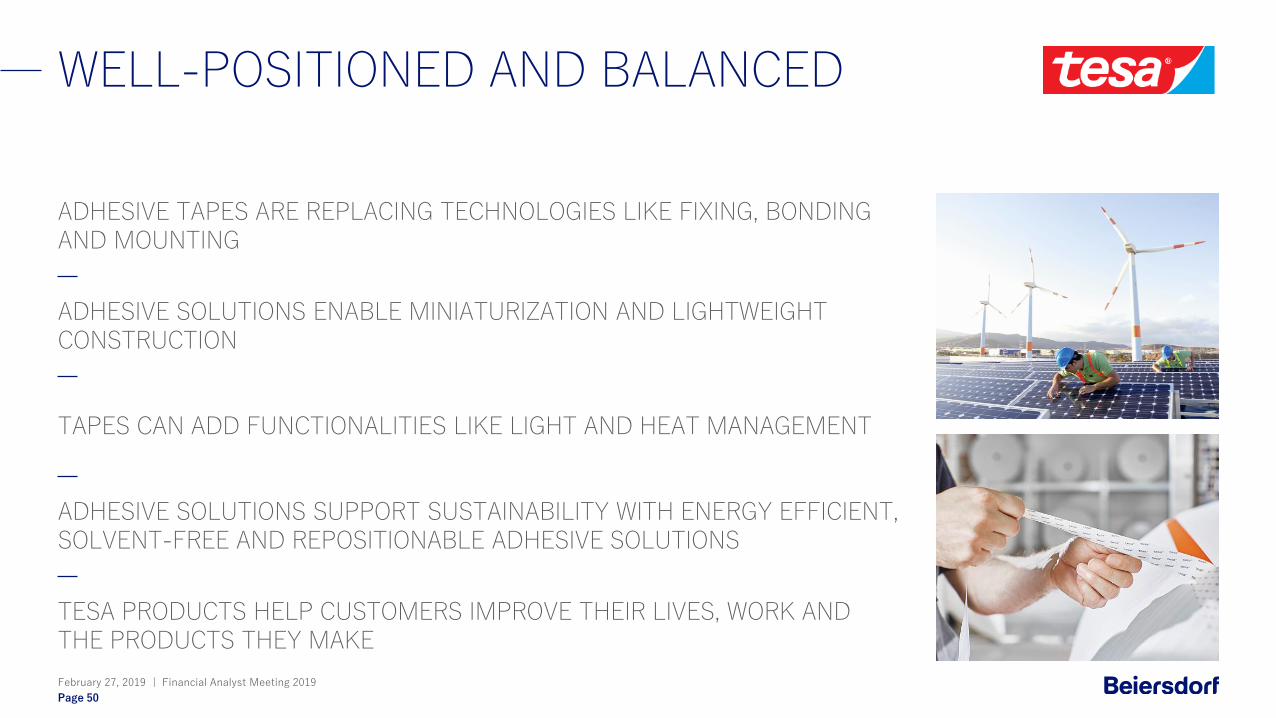
TESA PRODUCTS HELP CUSTOMERS IMPROVE THEIR LIVES, WORK AND THE PRODUCTS THEY MAKE
ADHESIVE SOLUTIONS SUPPORT SUSTAINABILITY WITH ENERGY EFFICIENT, SOLVENT-FREE AND REPOSITIONABLE ADHESIVE SOLUTIONS
TAPES CAN ADD FUNCTIONALITIES LIKE LIGHT AND HEAT MANAGEMENT
ADHESIVE SOLUTIONS ENABLE MINIATURIZATION AND LIGHTWEIGHT CONSTRUCTION
ADHESIVE TAPES ARE REPLACING TECHNOLOGIES LIKE FIXING, BONDING AND MOUNTING

AGENDA
February 27, 2019 | Financial Analyst Meeting 2019
Page 51
FINANCIAL RESULTS 2018
FINANCIAL AMBITIONS
STRATEGY UPDATE
SUMMARY
Q&A
WE COMMIT TO SUSTAINABLE VALUE CREATION
February 27, 2019 | Financial Analyst Meeting 2019
Page 52
CAPITAL ALLOCATION
INCREASED PRODUCTIVITY
INVESTMENTS FOR GROWTH

CONSUMER GROWTH AMBITION
February 27, 2019 | Financial Analyst Meeting 2019
Page 53
OUTPERFORM THE MARKET WITH MEDIUM-TERM GROWTH OF 4%-6%
* Assuming 3% underlying market growth in Skin and Personal Care
2019
+4-6%*
2023
+3-5%
WHITE SPOTS
SKIN CARE CONSUMER/DIGITAL

INVESTMENTS FOR GROWTH / CONSUMER BUSINESS
February 27, 2019 | Financial Analyst Meeting 2019
Page 54
INCREASE INVESTMENTS BY EUR 70-80M
ACCELERATE IN WHITE SPOTS STEP UP DIGITALIZATIONWIN WITH SKIN CARE
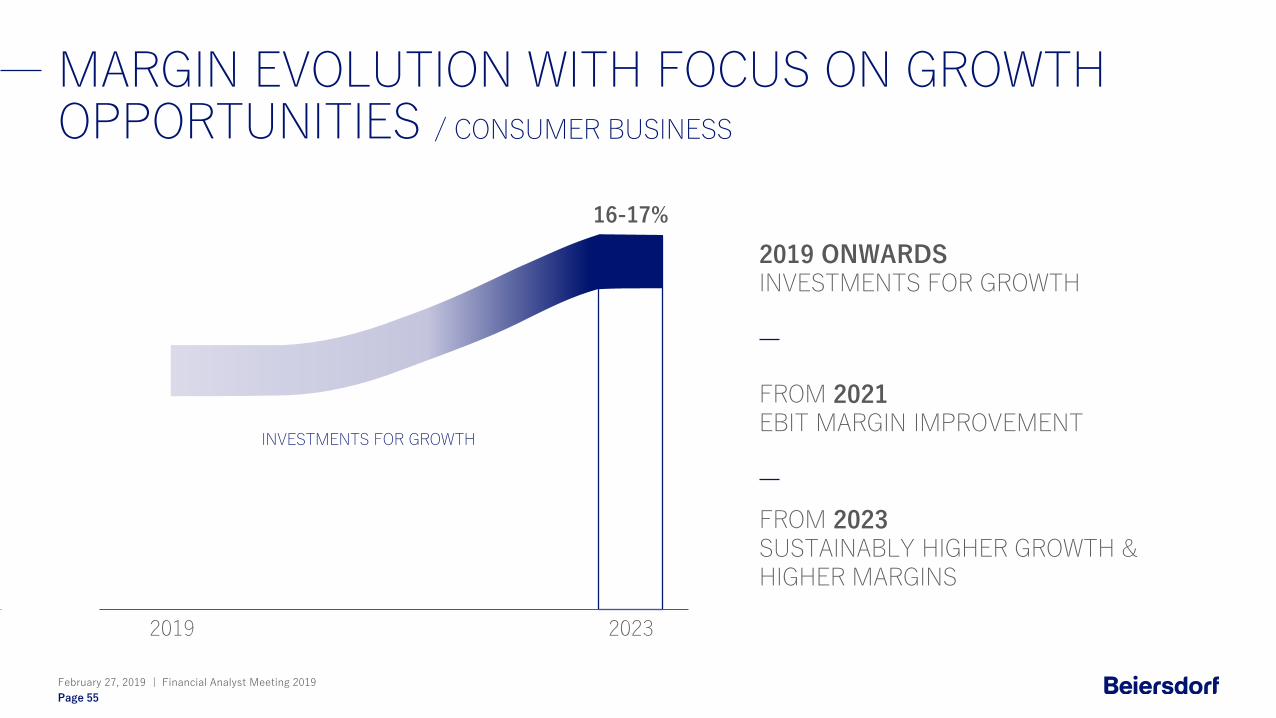
MARGIN EVOLUTION WITH FOCUS ON GROWTH OPPORTUNITIES / CONSUMER BUSINESS
February 27, 2019 | Financial Analyst Meeting 2019
Page 55
15.3%
2018 2019 2023
INVESTMENTS FOR GROWTH
16-17%
FROM 2023SUSTAINABLY HIGHER GROWTH & HIGHER MARGINS
FROM 2021EBIT MARGIN IMPROVEMENT
2019 ONWARDSINVESTMENTS FOR GROWTH

STRATEGIC PRIORITY / CONSUMER BUSINESS
February 27, 2019 | Financial Analyst Meeting 2019
Page 56
• REVENUE GROWTH MANAGEMENT
• VALUE ENGINEERING
• ORGANIZATIONAL EFFICIENCIES
• TAX RATE IMPROVEMENT
• GROSS MARGIN
• GENERAL EXPENSES
KPIs
IN SCOPEPRODUCTIVITY
• EBIT MARGIN
• EFFECTIVE TAX RATE (ETR)

TAX RATE IMPROVEMENT
February 27, 2019 | Financial Analyst Meeting 2019
Page 57
IN %
33.4 33.8 30.730.1
32.6
28.928.0
30.0
20.0
25.0
30.0
35.0
2013 2014 2015 2016 2017 2018 2019 2020 2021
EFFECTIVE TAX RATE (ETR) NORMALIZED ETR CURVE
-200bps

AMBITION 2023 / CONSUMER BUSINESS
February 27, 2019 | Financial Analyst Meeting 2019
Page 58
GROSS MARGIN
SUSTAINABLE INCREASE DUE TO
• RGM
• VALUE ENGINEERING
• CAPACITY EXPANSION
ORGANIZATIONALEFFICIENCIES
ENSURE ORGANIZATIONAL EFFICIENCIES, UPSKILLING WORKFORCE AND COST DISCIPLINE
EFFECTIVE TAX RATE
IMPROVE ETR BY SEIZING LOCAL TAX OPTIMIZATION OPPORTUNITIES AND CONTINUOUS GLOBAL IMPROVEMENT
SAVINGS 250-350BPS ETR -200BPS
REINVESTMENT : 100BPS

CAPITAL ALLOCATION
February 27, 2019 | Financial Analyst Meeting 2019
Page 59
WORKING CAPITAL
M&A OPPORTUNITIES
CAPEX INVESTMENTS

CAPITAL EXPENDITURES
February 27, 2019 | Financial Analyst Meeting 2019
Page 60
IN MILLION EUROS AND IN % OF GROUP SALES
4%
2014 2015 2016
4.8%3.7%
2.4%
195
2.8%
2017
4.9%
2018 2019 -2023
301
249
162
358
250-350 P.A. CAPACITY
CAPABILITIES
EFFICIENCIES

M&A OPPORTUNITIES
February 27, 2019 | Financial Analyst Meeting 2019
Page 61
GAPS IN THE PORTFOLIO
• NEW MARKET SEGMENTS
• GEOGRAPHY/CATEGORY WHITE SPOTS
• DIGITAL ENABLERS
VC FUND: EUR 50M
• SKIN CARE TECHNOLOGIES
• NEW BUSINESS MODELS
• DIGITAL PLATFORMS

WORKING CAPITAL
February 27, 2019 | Financial Analyst Meeting 2019
Page 62
12-MONTH ROLLING AVERAGE IN % OF CONSUMER SALES
14.6%13.6%
11.0%
9.2%9.9%
202320182014 2015 2016 2017
MORE THAN50 BPS P.A.

FINANCIAL SUMMARY
February 27, 2019 | Financial Analyst Meeting 2019
Page 63
GROUP TAX RATE IMPROVEMENT
MARGIN IMPROVEMENT
GROWTH AMBITION
AROUND 200BPS
150-250BPS
+4-6%
CONSUMER 2023

FINANCIAL SUMMARY
February 27, 2019 | Financial Analyst Meeting 2019
Page 64
PROFITABILITY
INVESTMENTS
GROWTH AMBITION
MAINTAIN THE EBIT MARGIN ABOVE 15%
CONTINUE BUILDING CAPABILITIES
OUTPERFORM THE MARKET BY 2% P.A.
TESA MID-TERM

AGENDA
February 27, 2019 | Financial Analyst Meeting 2019
Page 65
FINANCIAL RESULTS 2018
FINANCIAL AMBITIONS
STRATEGY UPDATE
SUMMARY
Q&A

SUMMARY
February 27, 2019 | Financial Analyst Meeting 2019
Page 66
INDUSTRY IN DISRUPTION
NEED TO ACT IMMEDIATELY & DECISIVELY
OPPORTUNITIES FOR BEIERSDORF
WE ARE READY TO ACT - C.A.R.E +
WE ARE COMMITTED TO LONGTERM VALUE
CREATION

February 27, 2019 | Financial Analyst Meeting 2019
Page 67
Q&A