Financial Analysis for the Boardroom
39
Financial Analysis for the Boardroom Intermediate Case Study April 18, 2018
Transcript of Financial Analysis for the Boardroom

Financial Analysis for the BoardroomIntermediate Case StudyApril 18, 2018

2
The Speakers
Christina E. Carroll, CFAManaging [email protected]
Marc C. Asbra, CFA, ASAManaging [email protected]

3
Table of Contents
I. Analyzing the CompanyII. Assessing the TransactionIII. Evaluating the Impact

Analyzing the Company
Assessing the Transaction
Evaluating the Impact
4

Company Overview
5
Branded apparel and accessories
Wholesale operations across the U.S.
Mature business built from organic growth
Several strategic challenges, but no signs of severe financial distress

Summary
6
In $000s
Summary View 2013 2014 2015 2016 2017
1 Revenue $272,289 $285,125 $298,999 $313,889 $329,7762 Cost of Goods Sold 114,182 127,143 140,570 154,589 169,2193 Gross Profit 158,107 157,982 158,429 159,300 160,557
4 Operating Expenses 123,938 124,270 126,364 127,320 128,6115 EBITDA 34,169 33,712 32,064 31,980 31,946
CAGR6 Revenue Growth n/a 4.7% 4.9% 5.0% 5.1% 4.9%
Common Size (% of Revenue) MarginChange
7 Cost of Goods Sold 41.9% 44.6% 47.0% 49.2% 51.3% 9.4%8 Gross Profit 58.1% 55.4% 53.0% 50.8% 48.7% -9.4%
9 Operating Expenses 45.5% 43.6% 42.3% 40.6% 39.0% -6.5%10 EBITDA 12.5% 11.8% 10.7% 10.2% 9.7% -2.9%
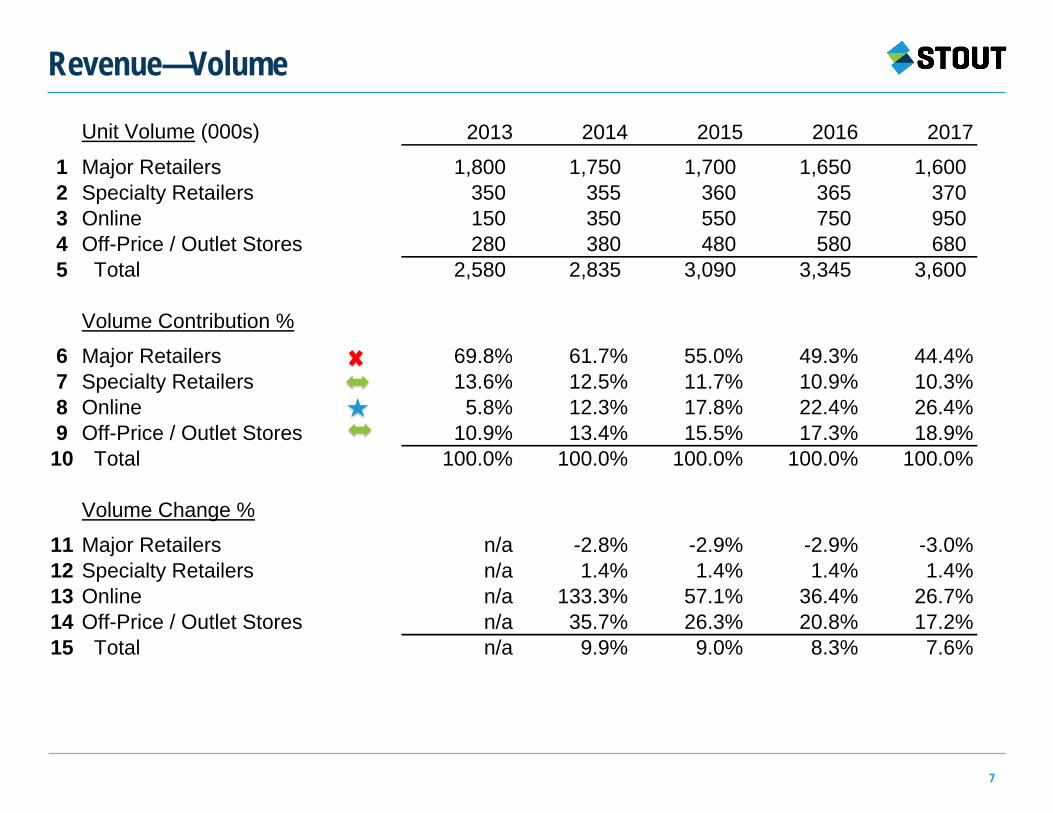
Revenue—Volume
7
Unit Volume (000s) 2013 2014 2015 2016 2017
1 Major Retailers 1,800 1,750 1,700 1,650 1,6002 Specialty Retailers 350 355 360 365 3703 Online 150 350 550 750 9504 Off-Price / Outlet Stores 280 380 480 580 6805 Total 2,580 2,835 3,090 3,345 3,600
Volume Contribution %
6 Major Retailers 69.8% 61.7% 55.0% 49.3% 44.4%7 Specialty Retailers 13.6% 12.5% 11.7% 10.9% 10.3%8 Online 5.8% 12.3% 17.8% 22.4% 26.4%9 Off-Price / Outlet Stores 10.9% 13.4% 15.5% 17.3% 18.9%10 Total 100.0% 100.0% 100.0% 100.0% 100.0%
Volume Change %
11 Major Retailers n/a -2.8% -2.9% -2.9% -3.0%12 Specialty Retailers n/a 1.4% 1.4% 1.4% 1.4%13 Online n/a 133.3% 57.1% 36.4% 26.7%14 Off-Price / Outlet Stores n/a 35.7% 26.3% 20.8% 17.2%15 Total n/a 9.9% 9.0% 8.3% 7.6%
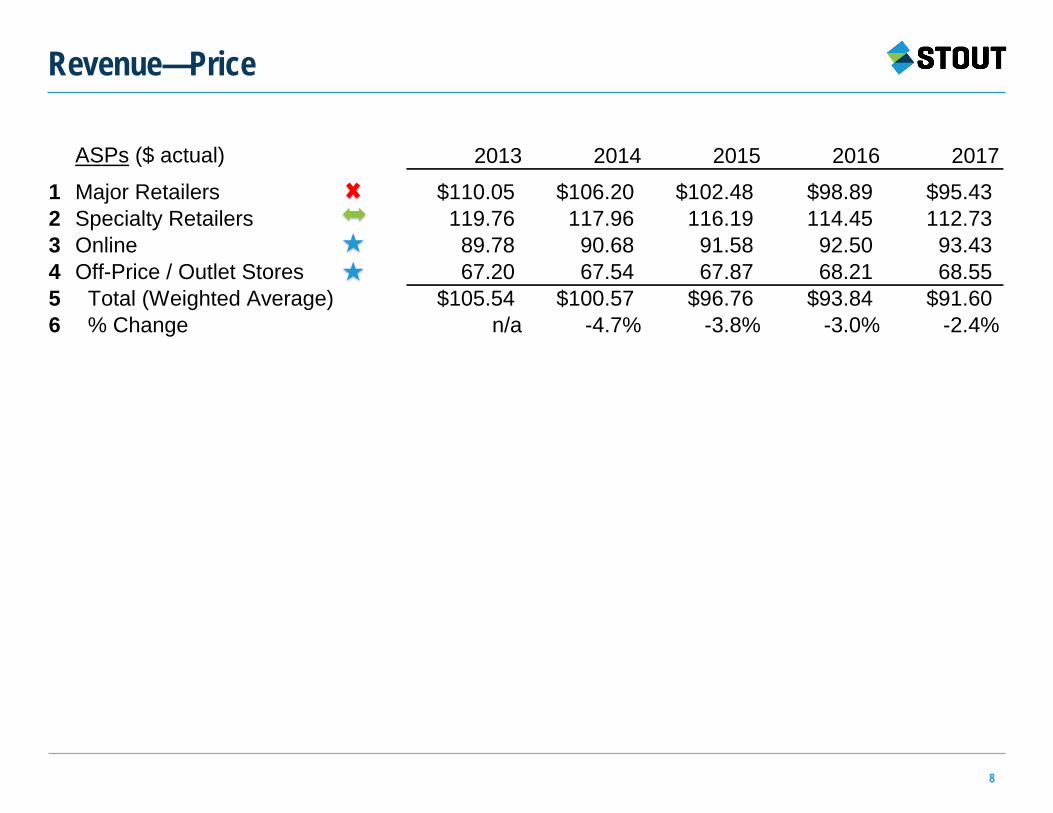
Revenue—Price
8
ASPs ($ actual) 2013 2014 2015 2016 2017
1 Major Retailers $110.05 $106.20 $102.48 $98.89 $95.432 Specialty Retailers 119.76 117.96 116.19 114.45 112.733 Online 89.78 90.68 91.58 92.50 93.434 Off-Price / Outlet Stores 67.20 67.54 67.87 68.21 68.555 Total (Weighted Average) $105.54 $100.57 $96.76 $93.84 $91.606 % Change n/a -4.7% -3.8% -3.0% -2.4%

Revenue—Mix
9
In $000s
Revenue 2013 2014 2015 2016 2017
1 Major Retailers $198,090 $185,847 $174,218 $163,176 $152,6932 Specialty Retailers 41,916 41,877 41,830 41,775 41,7123 Online 13,467 31,737 50,372 69,375 88,7544 Off-Price / Outlet Stores 18,816 25,664 32,579 39,564 46,6175 Total $272,289 $285,125 $298,999 $313,889 $329,7766 % Change n/a 4.7% 4.9% 5.0% 5.1%
Revenue Change %
7 Major Retailers n/a -6.2% -6.3% -6.3% -6.4%8 Specialty Retailers n/a -0.1% -0.1% -0.1% -0.2%9 Online n/a 135.7% 58.7% 37.7% 27.9%10 Off-Price / Outlet Stores n/a 36.4% 26.9% 21.4% 17.8%11 Total n/a 4.7% 4.9% 5.0% 5.1%

Cost of Goods Sold
10
Cost per Unit ($ actual) 2013 2014 2015 2016 2017
1 Major Retailers $45.10 $46.09 $47.11 $48.14 $49.202 Specialty Retailers 46.90 48.19 49.21 50.24 51.303 Online 41.70 42.89 43.91 44.94 46.004 Off-Price / Outlet Stores 36.90 37.79 38.81 39.84 40.905 Total (Weighted Average) $44.26 $44.85 $45.49 $46.22 $47.016 % Change n/a 1.3% 1.4% 1.6% 1.7%
Gross Profit (in $000s)
7 Major Retailers $116,910 $105,186 $94,138 $83,741 $73,9708 Specialty Retailers 25,501 24,769 24,116 23,436 22,7309 Online 7,212 16,725 26,223 35,668 45,05310 Off-Price / Outlet Stores 8,484 11,303 13,952 16,455 18,80411 Total 158,107 157,982 158,429 159,300 160,557
Gross Margins
12 Major Retailers 59.0% 56.6% 54.0% 51.3% 48.4%13 Specialty Retailers 60.8% 59.1% 57.7% 56.1% 54.5%14 Online 53.6% 52.7% 52.1% 51.4% 50.8%15 Off-Price / Outlet Stores 45.1% 44.0% 42.8% 41.6% 40.3%16 Total 58.1% 55.4% 53.0% 50.8% 48.7%
?

Operating Expenses
11
In $000s
Operating Expenses 2013 2014 2015 2016 2017
1 Selling & Marketing $58,317 $57,618 $57,082 $56,706 $56,4882 Information Technology 1,634 2,042 2,553 3,191 3,9893 Rent 3,540 3,628 5,200 5,330 5,4634 Compensation, Executives 14,159 14,584 15,021 15,472 15,9365 Compensation, Others 38,120 38,311 38,503 38,695 38,8896 Other G&A 8,169 8,087 8,006 7,926 7,8477 Total 123,938 124,270 126,364 127,320 128,611
Operating Expense Margins
8 Selling & Marketing 21.4% 20.2% 19.1% 18.1% 17.1%9 Information Technology 0.6% 0.7% 0.9% 1.0% 1.2%10 Rent 1.3% 1.3% 1.7% 1.7% 1.7%11 Compensation, Executives 5.2% 5.1% 5.0% 4.9% 4.8%12 Compensation, Others 14.0% 13.4% 12.9% 12.3% 11.8%13 Other G&A 3.0% 2.8% 2.7% 2.5% 2.4%14 Total 45.5% 43.6% 42.3% 40.6% 39.0%
Operating Expenses (cont’d)
12

In $000s
Selling & Marketing Detail 2013 2014 2015 2016 2017
1 Sales Commissions $36,001 $34,159 $32,407 $30,743 $29,1612 Print Advertising 8,713 8,278 7,864 7,471 7,0973 Other Media Advertising 1,634 1,797 1,977 2,174 2,3924 Online Programs 1,077 2,539 4,030 5,550 7,1005 Trade Shows 3,812 3,907 4,005 4,105 4,2086 Other 7,080 6,938 6,799 6,663 6,5307 Total 58,317 57,618 57,082 56,706 56,488
Selling & Marketing Margins
8 Sales Commissions 13.2% 12.0% 10.8% 9.8% 8.8%9 Print Advertising 3.2% 2.9% 2.6% 2.4% 2.2%10 Other Media Advertising 0.6% 0.6% 0.7% 0.7% 0.7%11 Online Programs 0.4% 0.9% 1.3% 1.8% 2.2%12 Trade Shows 1.4% 1.4% 1.3% 1.3% 1.3%13 Other 2.6% 2.4% 2.3% 2.1% 2.0%14 Total 21.4% 20.2% 19.1% 18.1% 17.1%
Selling & Marketing Expenses
13
?
?

14
What is the plan to address the underperformance in the Majors channel (lower volumes and ASPs)?
How will management handle the channels to avoid brand dilution and cannibalization?
Can the Company sell more product online through its own site or specialty e-tailers?
Are there savings opportunities within COGS (changes to product designs, materials, outsourcing, etc.)?
Is the supply chain fully-optimized?
Strategic Questions for Management
15
Should the Company reassess its Selling & Marketing strategy in light of market trends?
Will the decline in Selling & Marketing spending at some point negatively impact the brand and depress sales through the e-commerce channel?
Is the Company’s compensation plan aligned with the current trends and future company goals?
Strategic Questions for Management (cont’d)

16
Financial Analysis is like…
Key Take-Away
Revenue
Price
Brand Position and Strength
Channel Mix
Marketing and Promotion
Consumer Demand
Quantity

17
Financial Analysis is like “peeling…”
Key Take-Away
Revenue
Price
Brand Position and Strength
Channel Mix
Marketing and Promotion
Consumer Demand
Quantity

18
Financial Analysis is like “peeling an artichoke”
Key Take-Away
Revenue
Price
Brand Position and Strength
Channel Mix
Marketing and Promotion
Consumer Demand
Quantity

19
Analyzing the Company
Assessing the Transaction
Evaluating the Impact

Situation Overview
20
Business Unit
Business unit (“BU”) focused on accessories
Distant second in terms of strategic importance
Lackluster historical performance and marginal outlook
Transaction
Unsolicited offer from strategic buyer
Asset sale in a cash-free, debt-free transaction
Price: $21 million in cash

Business Unit and Transaction Metrics
21
Enterprise Value = Debt + Equity – Cash
In $000s Before Sale Retained BU Total
1 Revenue $274,176 $55,600 $329,7762 Costs and Expenses 243,730 54,100 297,8303 EBITDA 30,446 1,500 31,9464 Margin 11.1% 2.7% 9.7%
5 Capital Expenditures 4,113 556 4,6696 % of Revenue 1.5% 1.0% 1.4%
7 Enterprise Value $21,000 $265,000
Business Unit and Transaction Metrics
22
In $000s Before Sale Retained BU Total
1 Revenue $274,176 $55,600 $329,7762 Costs and Expenses 243,730 54,100 297,8303 EBITDA 30,446 1,500 31,9464 Margin 11.1% 2.7% 9.7%
5 Capital Expenditures 4,113 556 4,6696 % of Revenue 1.5% 1.0% 1.4%
7 Enterprise Value $21,000 $265,000
8 EV / Revenue Multiple 0.38 x 0.80 x9 EV / EBITDA Multiple 14.0 x 8.3 x
BU% of Total
16.9%18.2%
4.7%
Enterprise Value = Debt + Equity – Cash

Comparable Public Companies
23
In $ millions MultiplesEnterprise LTM LTM
Comparable Public Companies Value Net Sales EBITDA
1 Ralph Lauren Corporation $7,726.6 1.24 x 7.9 x2 Perry Ellis International, Inc. 430.9 0.51 x 8.4 x3 Oxford Industries, Inc. 1,331.7 1.26 x 9.9 x4 Hanesbrands Inc. 11,219.3 1.73 x 10.7 x5 V.F. Corporation 32,078.2 2.72 x 17.7 x6 Columbia Sportswear Company 4,621.6 1.87 x 14.3 x7 Deckers Outdoor Corporation 2,499.6 1.34 x 10.4 x8 Fossil Group, Inc. 706.3 0.25 x 6.2 x
9 High 2.72 x 17.7 x10 Average 1.37 x 10.7 x11 Median 1.30 x 10.2 x12 Low 0.25 x 6.2 x
13 Company $265.0 0.80 x 8.3 x14 BU 21.0 0.38 x 14.0 x
LTM = Latest Twelve Months

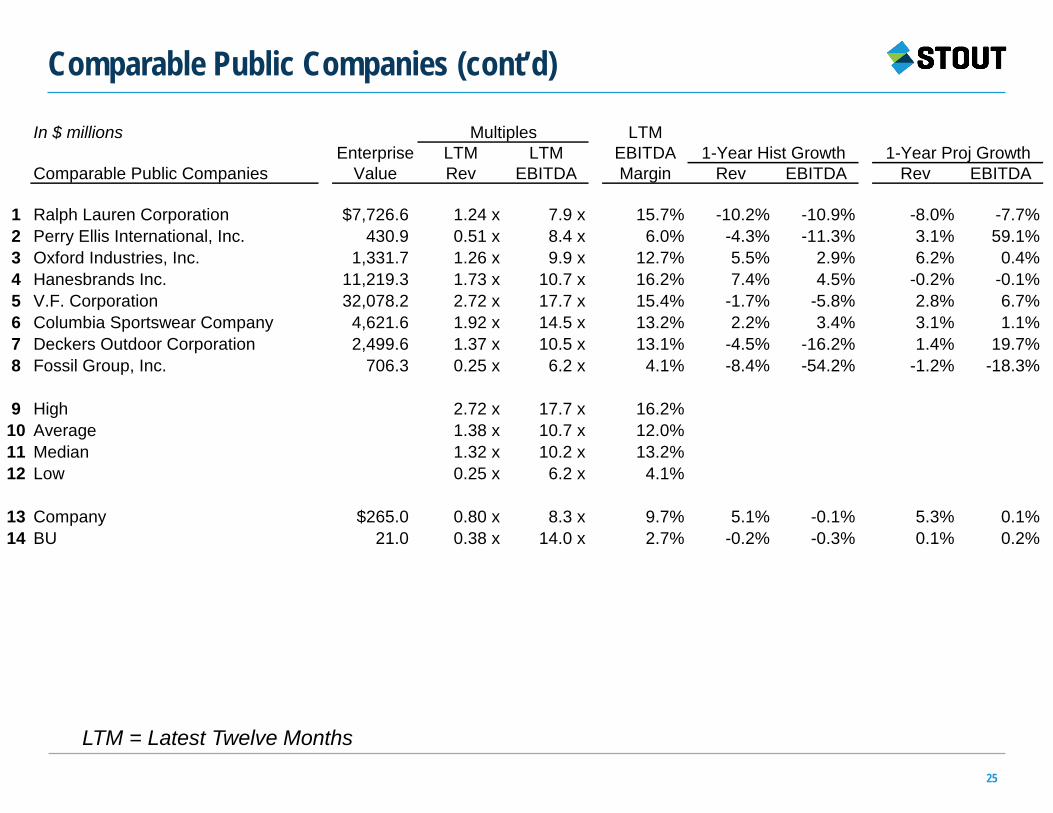
Comparable Public Companies (cont’d)
24
In $ millions Multiples LTMEnterprise LTM LTM LTM LTM EBITDA
Comparable Public Companies Value Rev EBITDA Net Sales EBITDA Margin
1 Ralph Lauren Corporation $7,726.6 1.24 x 7.9 x $6,218.5 $974.7 15.7%2 Perry Ellis International, Inc. 430.9 0.51 x 8.4 x 851.7 51.1 6.0%3 Oxford Industries, Inc. 1,331.7 1.26 x 9.9 x 1,054.1 134.0 12.7%4 Hanesbrands Inc. 11,219.3 1.73 x 10.7 x 6,471.4 1,050.7 16.2%5 V.F. Corporation 32,078.2 2.72 x 17.7 x 11,811.2 1,814.1 15.4%6 Columbia Sportswear Company 4,621.6 1.92 x 14.5 x 2,407.5 318.5 13.2%7 Deckers Outdoor Corporation 2,499.6 1.37 x 10.5 x 1,822.0 238.5 13.1%8 Fossil Group, Inc. 706.3 0.25 x 6.2 x 2,788.2 113.1 4.1%
9 High 2.72 x 17.7 x 16.2%10 Average 1.38 x 10.7 x 12.0%11 Median 1.32 x 10.2 x 13.2%12 Low 0.25 x 6.2 x 4.1%
13 Company $265.0 0.80 x 8.3 x $329.8 $31.9 9.7%14 BU 21.0 0.38 x 14.0 x 55.6 1.5 2.7%
LTM = Latest Twelve Months
Comparable Public Companies (cont’d)
25
In $ millions Multiples LTM Enterprise LTM LTM EBITDA 1-Year Hist Growth 1-Year Proj Growth
Comparable Public Companies Value Rev EBITDA Margin Rev EBITDA Rev EBITDA
1 Ralph Lauren Corporation $7,726.6 1.24 x 7.9 x 15.7% -10.2% -10.9% -8.0% -7.7%2 Perry Ellis International, Inc. 430.9 0.51 x 8.4 x 6.0% -4.3% -11.3% 3.1% 59.1%3 Oxford Industries, Inc. 1,331.7 1.26 x 9.9 x 12.7% 5.5% 2.9% 6.2% 0.4%4 Hanesbrands Inc. 11,219.3 1.73 x 10.7 x 16.2% 7.4% 4.5% -0.2% -0.1%5 V.F. Corporation 32,078.2 2.72 x 17.7 x 15.4% -1.7% -5.8% 2.8% 6.7%6 Columbia Sportswear Company 4,621.6 1.92 x 14.5 x 13.2% 2.2% 3.4% 3.1% 1.1%7 Deckers Outdoor Corporation 2,499.6 1.37 x 10.5 x 13.1% -4.5% -16.2% 1.4% 19.7%8 Fossil Group, Inc. 706.3 0.25 x 6.2 x 4.1% -8.4% -54.2% -1.2% -18.3%
9 High 2.72 x 17.7 x 16.2%10 Average 1.38 x 10.7 x 12.0%11 Median 1.32 x 10.2 x 13.2%12 Low 0.25 x 6.2 x 4.1%
13 Company $265.0 0.80 x 8.3 x 9.7% 5.1% -0.1% 5.3% 0.1%14 BU 21.0 0.38 x 14.0 x 2.7% -0.2% -0.3% 0.1% 0.2%
LTM = Latest Twelve Months
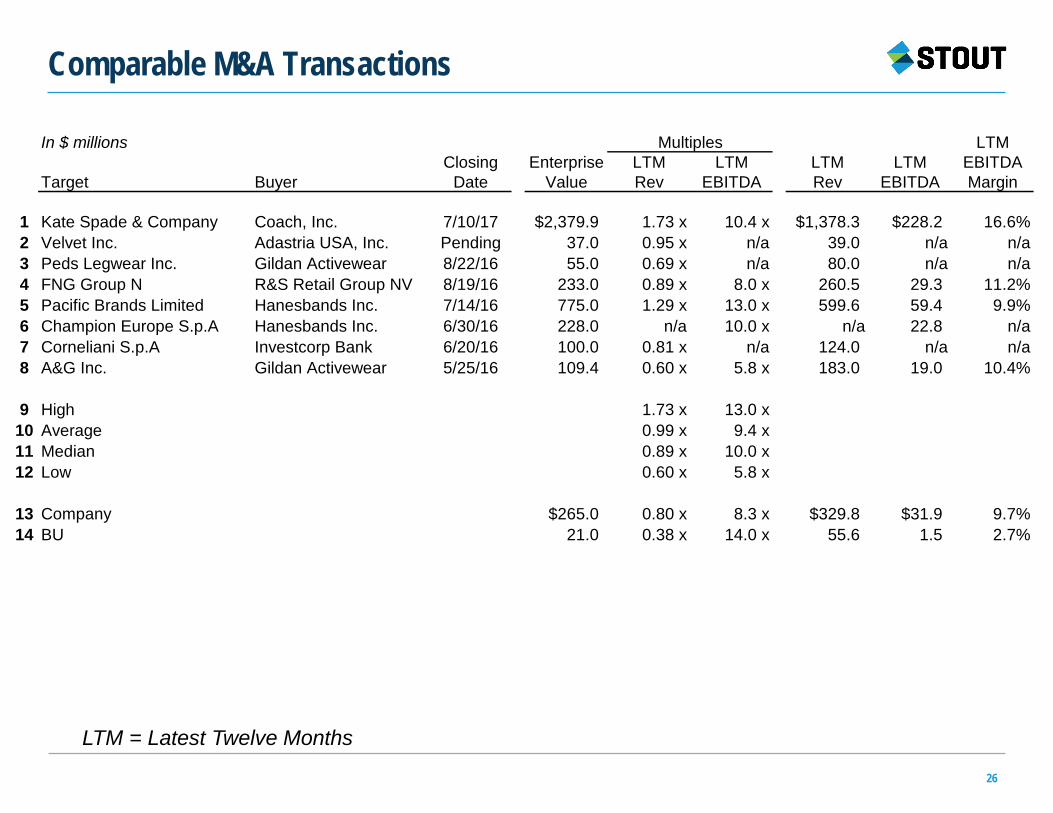
Comparable M&A Transactions
26
In $ millions Multiples LTMClosing Enterprise LTM LTM LTM LTM EBITDA
Target Buyer Date Value Rev EBITDA Rev EBITDA Margin
1 Kate Spade & Company Coach, Inc. 7/10/17 $2,379.9 1.73 x 10.4 x $1,378.3 $228.2 16.6%2 Velvet Inc. Adastria USA, Inc. Pending 37.0 0.95 x n/a 39.0 n/a n/a3 Peds Legwear Inc. Gildan Activewear 8/22/16 55.0 0.69 x n/a 80.0 n/a n/a4 FNG Group N R&S Retail Group NV 8/19/16 233.0 0.89 x 8.0 x 260.5 29.3 11.2%5 Pacific Brands Limited Hanesbands Inc. 7/14/16 775.0 1.29 x 13.0 x 599.6 59.4 9.9%6 Champion Europe S.p.A Hanesbands Inc. 6/30/16 228.0 n/a 10.0 x n/a 22.8 n/a7 Corneliani S.p.A Investcorp Bank 6/20/16 100.0 0.81 x n/a 124.0 n/a n/a8 A&G Inc. Gildan Activewear 5/25/16 109.4 0.60 x 5.8 x 183.0 19.0 10.4%
9 High 1.73 x 13.0 x10 Average 0.99 x 9.4 x11 Median 0.89 x 10.0 x12 Low 0.60 x 5.8 x
13 Company $265.0 0.80 x 8.3 x $329.8 $31.9 9.7%14 BU 21.0 0.38 x 14.0 x 55.6 1.5 2.7%
LTM = Latest Twelve Months
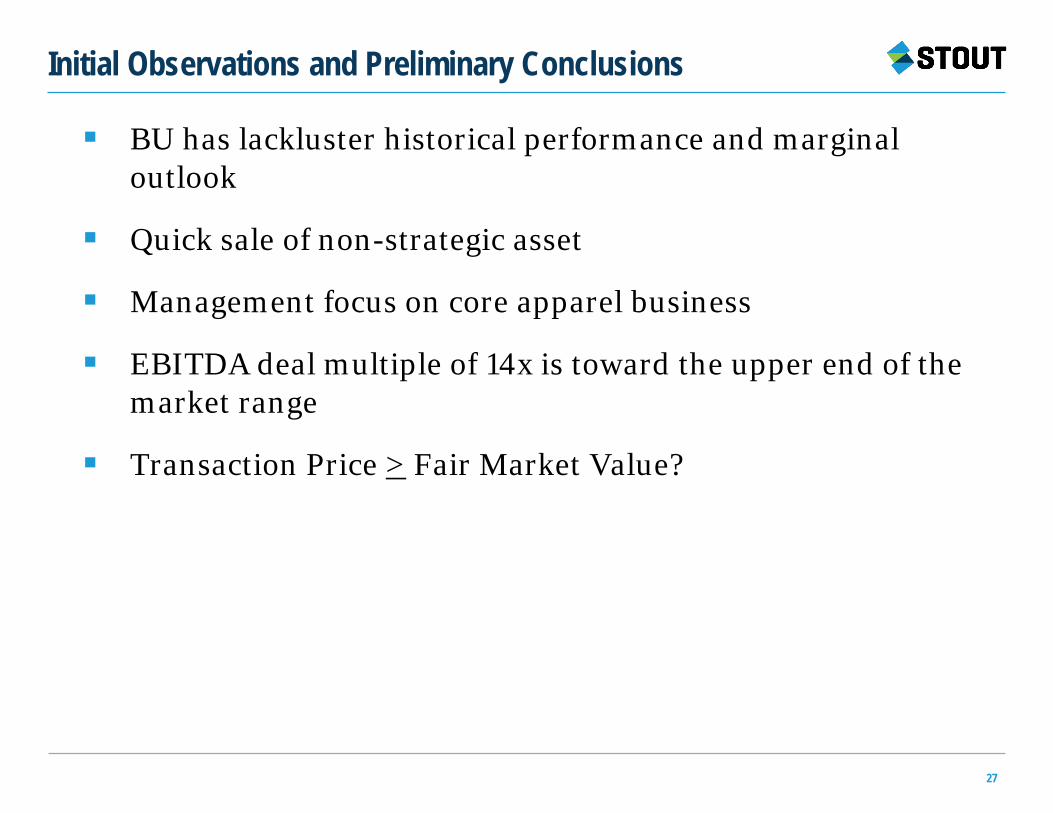
Initial Observations and Preliminary Conclusions
27
BU has lackluster historical performance and marginal outlook
Quick sale of non-strategic asset
Management focus on core apparel business
EBITDA deal multiple of 14x is toward the upper end of the market range
Transaction Price > Fair Market Value?

28
Analyzing the Company
Assessing the Transaction
Evaluating the Impact
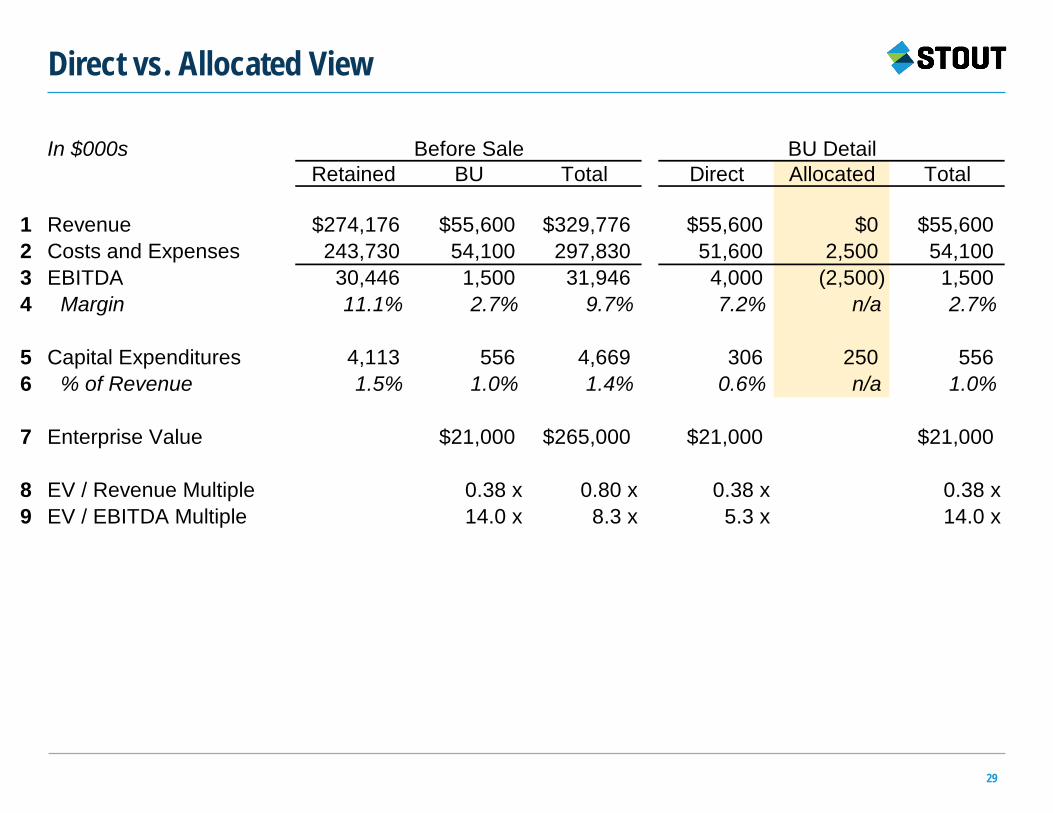
Direct vs. Allocated View
29
In $000s Before Sale BU DetailRetained BU Total Direct Allocated Total
1 Revenue $274,176 $55,600 $329,776 $55,600 $0 $55,6002 Costs and Expenses 243,730 54,100 297,830 51,600 2,500 54,1003 EBITDA 30,446 1,500 31,946 4,000 (2,500) 1,5004 Margin 11.1% 2.7% 9.7% 7.2% n/a 2.7%
5 Capital Expenditures 4,113 556 4,669 306 250 5566 % of Revenue 1.5% 1.0% 1.4% 0.6% n/a 1.0%
7 Enterprise Value $21,000 $265,000 $21,000 $21,000
8 EV / Revenue Multiple 0.38 x 0.80 x 0.38 x 0.38 x9 EV / EBITDA Multiple 14.0 x 8.3 x 5.3 x 14.0 x

Direct vs. Allocated View (cont’d)
30
In $000s Before Sale BU Detail After SaleRetained BU Total Direct Allocated Total Total
1 Revenue $274,176 $55,600 $329,776 $55,600 $0 $55,600 $274,1762 Costs and Expenses 243,730 54,100 297,830 51,600 2,500 54,100 246,2303 EBITDA 30,446 1,500 31,946 4,000 (2,500) 1,500 27,9464 Margin 11.1% 2.7% 9.7% 7.2% n/a 2.7% 10.2%
5 Capital Expenditures 4,113 556 4,669 306 250 556 4,3636 % of Revenue 1.5% 1.0% 1.4% 0.6% n/a 1.0% 1.6%
7 Enterprise Value $21,000 $265,000 $21,000 $21,000
8 EV / Revenue Multiple 0.38 x 0.80 x 0.38 x 0.38 x9 EV / EBITDA Multiple 14.0 x 8.3 x 5.3 x 14.0 x
?
Costs and Expenses 243,730 2,500 246,230

Value Impact
31
In $000sView #1
Enterprise Value Before After Change
1 EBITDA $31,946 $27,946 ($4,000)2 Multiple 8.3 x 8.3 x 0.0 x3 Enterprise Value 265,000 231,819 (33,181)
4 Add: Sale Proceeds 21,0005 Net Economic Benefit to Company ($12,181)
Transaction provides $21 million of proceeds in exchange for $4 million of annual EBITDA
Value Impact (cont’d)
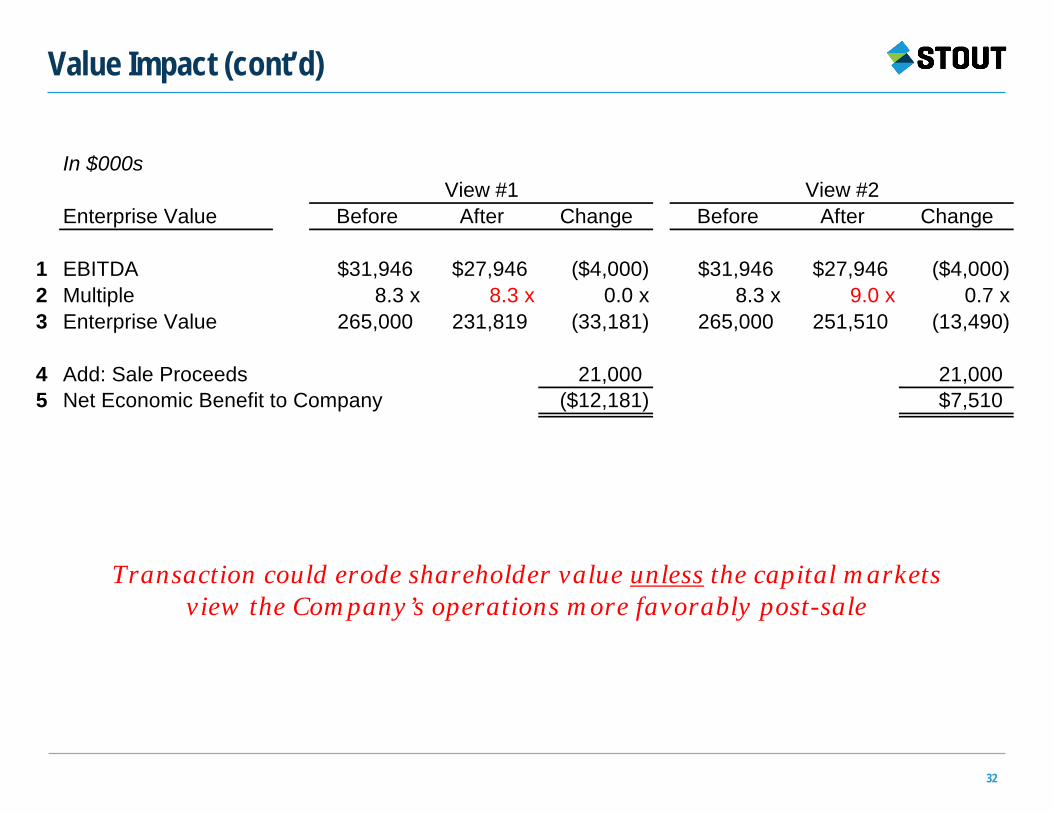
32
In $000sView #1 View #2
Enterprise Value Before After Change Before After Change
1 EBITDA $31,946 $27,946 ($4,000) $31,946 $27,946 ($4,000)2 Multiple 8.3 x 8.3 x 0.0 x 8.3 x 9.0 x 0.7 x3 Enterprise Value 265,000 231,819 (33,181) 265,000 251,510 (13,490)
4 Add: Sale Proceeds 21,000 21,0005 Net Economic Benefit to Company ($12,181) $7,510
Transaction could erode shareholder value unless the capital markets view the Company’s operations more favorably post-sale

Value Impact (cont’d)
33
Transaction could erode shareholder value unless the capital markets view the Company’s operations more favorably post-sale
In $000sChanges View #3
Enterprise Value View #1 View #2 Before After Change
1 EBITDA ($4,000) ($4,000) $31,946 $28,946 ($3,000)2 Multiple 0.0 x 0.7 x 8.3 x 9.0 x 0.7 x3 Enterprise Value (33,181) (13,490) 265,000 260,510 (4,490)
4 Add: Sale Proceeds 21,000 21,000 21,0005 Net Economic Benefit to Company ($12,181) $7,510 $16,510

Financing Impact
34
In $000s
Debt Service Capacity Before After Change
1 Debt $105,000 $105,000 $02 EBITDA 31,946 27,946 (4,000)3 Debt / EBITDA 3.3 x 3.8 x 0.5 x

Financing Impact (cont’d)
35
In $ millionsLTM Debt /
Comparable Public Companies Debt EBITDA EBITDA
1 Ralph Lauren Corporation $924.0 $974.7 0.9 x2 Perry Ellis International, Inc. 90.6 51.1 1.8 x3 Oxford Industries, Inc. 72.1 134.0 0.5 x4 Hanesbrands Inc. 3,963.5 1,050.7 3.8 x5 V.F. Corporation 2,923.3 1,837.8 1.6 x6 Columbia Sportswear Company 0.0 318.5 0.0 x7 Deckers Outdoor Corporation 165.3 238.5 0.7 x8 Fossil Group, Inc. 446.0 113.1 3.9 x
9 High 3.9 x10 Average 1.7 x11 Median 1.3 x12 Low 0.0 x
13 Company, Before $105.0 $31.9 3.3 x14 Company, After 105.0 27.9 3.8 x
Debt /EV
12.6%11.9%10.1%
9.4%5.7%6.9%9.5%
16.0%
16.0%10.3%
9.8%5.7%
39.6%n/a

Financing Impact (cont’d)
36
Debt Service Capacity Before After Change
1 Debt $105,000 $105,000 $02 EBITDA 31,946 27,946 (4,000)3 Debt / EBITDA 3.3 x 3.8 x 0.5 x
4 Depreciation 8,244 7,540 (705)5 EBIT 23,701 20,406 (3,295)
6 Interest Expense 7,350 7,350 07 Pretax Income 16,351 13,056 (3,295)
8 Taxes 4,088 3,264 (824)9 Net Income $12,263 $9,792 ($2,472)
10 add: Depreciation 8,244 7,540 (705)11 less: Capital Expenditures (4,669) (4,363) 30612 After-Tax Cash Flow 15,839 12,969 (2,870)
13 EBIT / Interest Expense 3.2 x 2.8 x -0.4 x
14 Debt / (EBITDA-Capex) 3.8 x 4.5 x 0.6 x

Strategic Questions for Management
How are costs allocated?
If BU is retained, what actions can management take to improve its growth and profitability?
If BU is sold, what actions can management take to reduce costs that were previously allocated to the BU?
If BU is sold, what is management’s degree of confidence that the Company will be rewarded with a higher multiple?
If BU is sold, what should the Company do with the sales proceeds?― Invest in other growth areas of the business
― Pay down debt
― Pay special dividend to shareholders
37
38
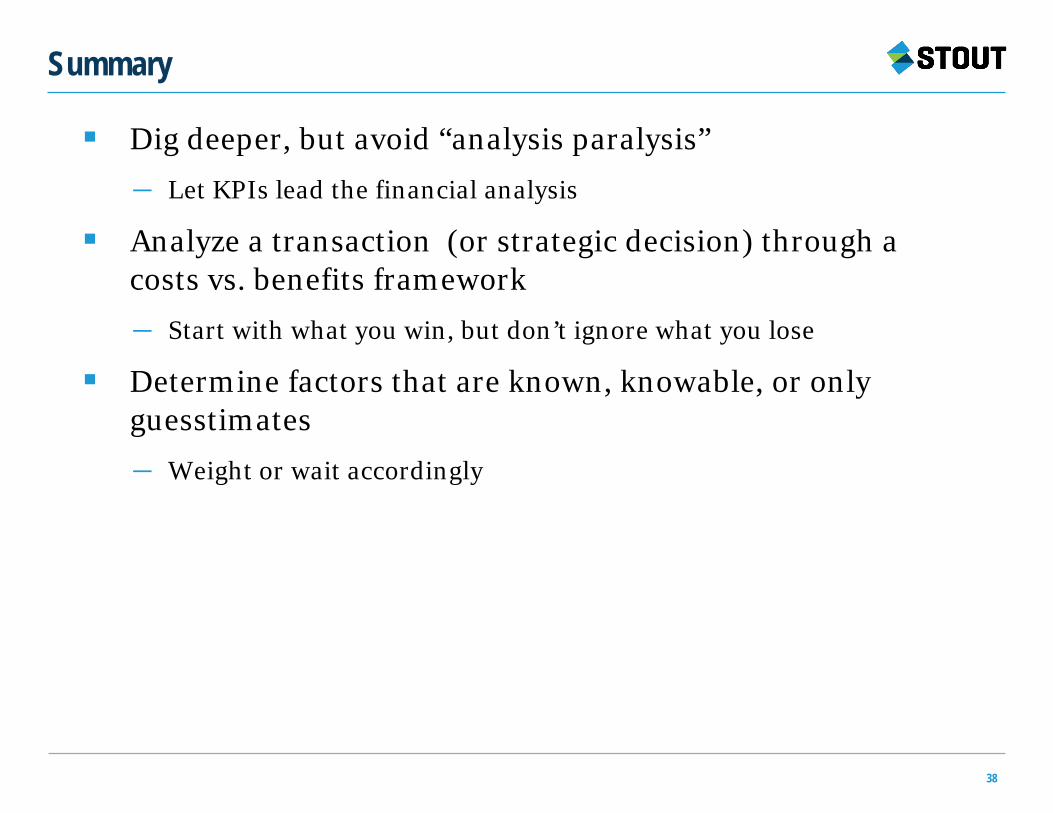
Dig deeper, but avoid “analysis paralysis”― Let KPIs lead the financial analysis
Analyze a transaction (or strategic decision) through a costs vs. benefits framework ― Start with what you win, but don’t ignore what you lose
Determine factors that are known, knowable, or only guesstimates― Weight or wait accordingly
Summary

Thank you!
Christina E. Carroll, CFAManaging [email protected]
Marc C. Asbra, CFA, ASAManaging [email protected]