Financial Analysis Fitbit vs. Garmin
40
International Accounting Hult International Business School, San Francisco Financial Analysis Project Fitbit, Inc. ready for competitive growth? Date: November 19, 2015
-
Upload
thomas-pilatyk -
Category
Documents
-
view
208 -
download
3
Transcript of Financial Analysis Fitbit vs. Garmin

International Accounting
Hult International Business School, San Francisco
Financial Analysis Project
Fitbit, Inc. ready for competitive growth?
Date: November 19, 2015
Index of Abbreviations I
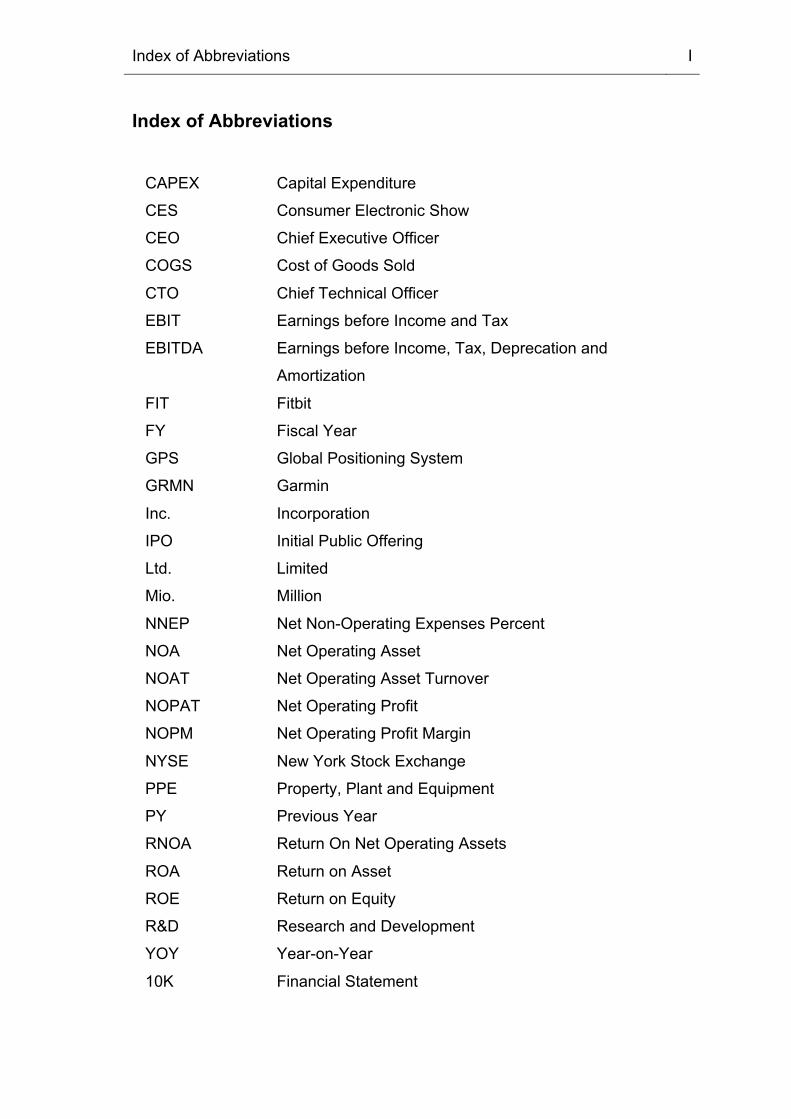
Index of Abbreviations
CAPEX Capital Expenditure
CES Consumer Electronic Show
CEO Chief Executive Officer
COGS Cost of Goods Sold
CTO Chief Technical Officer
EBIT Earnings before Income and Tax
EBITDA Earnings before Income, Tax, Deprecation and
Amortization
FIT Fitbit
FY Fiscal Year
GPS Global Positioning System
GRMN Garmin
Inc. Incorporation
IPO Initial Public Offering
Ltd. Limited
Mio. Million
NNEP Net Non-Operating Expenses Percent
NOA Net Operating Asset
NOAT Net Operating Asset Turnover
NOPAT Net Operating Profit
NOPM Net Operating Profit Margin
NYSE New York Stock Exchange
PPE Property, Plant and Equipment
PY Previous Year
RNOA Return On Net Operating Assets
ROA Return on Asset
ROE Return on Equity
R&D Research and Development
YOY Year-on-Year
10K Financial Statement
Index II
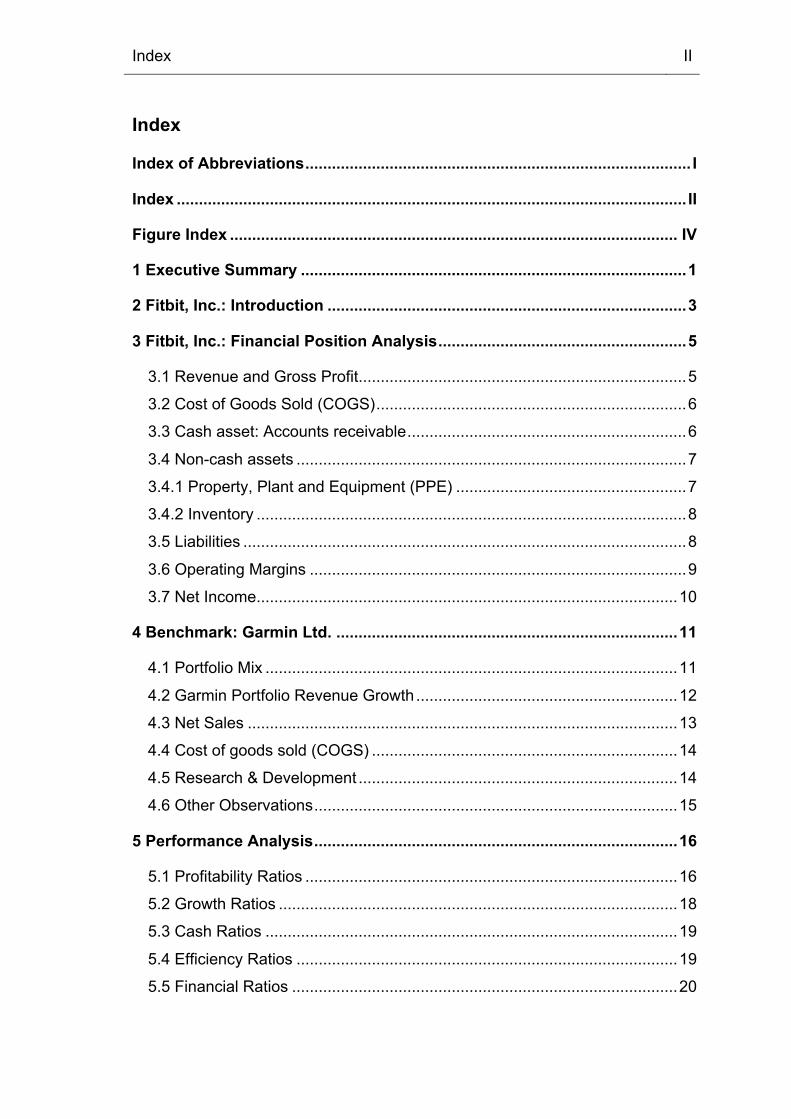
Index
Index of Abbreviations ....................................................................................... I
Index ................................................................................................................... II
Figure Index ..................................................................................................... IV
1 Executive Summary ....................................................................................... 1
2 Fitbit, Inc.: Introduction ................................................................................. 3
3 Fitbit, Inc.: Financial Position Analysis ........................................................ 5
3.1 Revenue and Gross Profit .......................................................................... 5
3.2 Cost of Goods Sold (COGS) ...................................................................... 6
3.3 Cash asset: Accounts receivable ............................................................... 6
3.4 Non-cash assets ........................................................................................ 7
3.4.1 Property, Plant and Equipment (PPE) .................................................... 7
3.4.2 Inventory ................................................................................................. 8
3.5 Liabilities .................................................................................................... 8
3.6 Operating Margins ..................................................................................... 9
3.7 Net Income ............................................................................................... 10
4 Benchmark: Garmin Ltd. ............................................................................. 11
4.1 Portfolio Mix ............................................................................................. 11
4.2 Garmin Portfolio Revenue Growth ........................................................... 12
4.3 Net Sales ................................................................................................. 13
4.4 Cost of goods sold (COGS) ..................................................................... 14
4.5 Research & Development ........................................................................ 14
4.6 Other Observations .................................................................................. 15
5 Performance Analysis .................................................................................. 16
5.1 Profitability Ratios .................................................................................... 16
5.2 Growth Ratios .......................................................................................... 18
5.3 Cash Ratios ............................................................................................. 19
5.4 Efficiency Ratios ...................................................................................... 19
5.5 Financial Ratios ....................................................................................... 20
Index III
6 Final Observation / Forecast ....................................................................... 22
6.1 Short-term forecast .................................................................................. 22
6.2 Long-term forecast ................................................................................... 23
6.3 Fitbit’s Risks ............................................................................................. 24
6.4 FIT´s Competitive Advantages ................................................................. 24
References ....................................................................................................... 25
Exhibits............................................................................................................. 27
Exhibit 1 ............................................................................................................. 27
Exhibit 2 ............................................................................................................. 28
Exhibit 3 ............................................................................................................. 29
Exhibit 4 ............................................................................................................. 30
Exhibit 5 ............................................................................................................. 32
Exhibit 6 ............................................................................................................. 32
Exhibit 7 ............................................................................................................. 33
Exhibit 8 ............................................................................................................. 34
Exhibit 6 ............................................................................................................. 35
Figure Index IV
Figure Index
Figure 1 - Fitbit revenue & gross profit ................................................................ 5
Figure 2 - Fitbit COGS ......................................................................................... 6
Figure 3 - Fitbit accounts receivable ................................................................... 6
Figure 4 - Fitbit assets ......................................................................................... 7
Figure 5 - Fitbit liabilities ...................................................................................... 8
Figure 6 - Fitbit liabilities ...................................................................................... 9
Figure 7 - Fitbit operating margins ...................................................................... 9
Figure 8 - Fitbit net income ................................................................................ 10
Figure 9 - Garmin Portfolio Mix ......................................................................... 11
Figure 10 - Portfolio Revenue Growth ............................................................... 12
Figure 11 - Net Sales Analysis .......................................................................... 13
Figure 12 - COGS Analysis ............................................................................... 14
Figure 13 - R&D Analysis .................................................................................. 14
Figure 14 - Profitability ...................................................................................... 16
Figure 15 - Profitability ...................................................................................... 17
Figure 16 - Growth ratios ................................................................................... 18
Figure 17 - Cash flow ratios .............................................................................. 19
Figure 18 - Efficiency ratios ............................................................................... 20
Figure 19 - Balance sheet ratios ....................................................................... 21
Figure 20 - Wearable device market ................................................................ 22
Figure 21 - Fitbit forecast .................................................................................. 23

Hult International Business School: Team 11 1
1 Executive Summary
The purpose of this report is to present a financial analysis and evaluation of
one of the key players and current market leader of the newly developed
category in Wearable Technology, Fitbit (FIT). The goal is to understand how
it’s rapid growth in revenue (254% in 2013 and 175% in 2014 according to FIT’s
2013 / 2014 10K) is managed and the implications of acquiring more debt in
order to keep up with the industry's demand for innovation and an increase of
competitive threats. This is a closer look into the company's current and
potential profitability, liquidity and performance facilitates a studied point of view
of FIT's standing point.
The methods selected for developing this report includes Trends, Financial
Ratios, Vertical and Horizontal analysis. Calculations range from Liquidity
observations, to Debt and Equity calculations. Other measurements include
R&D analysis and Inventory. Garmin (GRMN), a key player in this segment, is
used as a benchmark to give an example of the different strategies used by the
players (calculations / ratios see Exhibit 3 and 4).
The highlights of the analysis found that FIT's sales during 2014 helped the
company achieve higher ROA with respect to previous years with the current
2014 ratio of 7.8% compared to -44.72% in 2013. Further observations show
that FIT's NOPM went from negative to a double digit percentage by increasing
sales and leveraging from it’s retail sales and online services, while keeping
costs low. 2014’s NOPM shows positive returns because of it’s attractive
product line and network services.
As the category grows, competitors join and attract more consumers to their
platforms. The challenge for FIT will be to keep a healthy finance in order to
meet international expansion. The introduction of both Apple watch and
Xiaomi’s Mi Band has caused FIT’s worldwide market share to dwindle (see
Exhibit 2). For GRMN (our benchmark), this category is gaining importance as
Hult International Business School: Team 11 2
it’s grown from representing 14% to 20% revenue contribution in the product
portfolio. FIT can be a viable competitive leader in the future if it can manage a
business strategy that looks to keep R&D innovative yet expenses comparable
low.
One of the biggest benefits that FIT has is sales have grown, it is still to
attractive to investors in terms of profitability. This is in part due to increased
financial pressure, rapid growth and taxes. Return on Equity is low with respect
to its competitors due to high debt. The market requiring constant innovation,
high R&D investments is causing FIT not to be as liquid as other competitors.
The company must pay special attention to this in order to avoid losing its
leadership.
This report shows that as the category of wearable technology grows,
competitors join to attract more consumers. The challenge for FIT will be to
keep its agility towards innovation along with the ability to keep healthy finances
in order to meet demand to cover international expansion. We believe that FIT
can be a viable competitive leader in the future.

Hult International Business School: Team 11 3
2 Fitbit, Inc.: Introduction
Fitbit, Inc. - a company headquartered in San Francisco, California - was
founded by James Park (CEO, President) and Eric Friedman (CTO). The
company is known for its development of wireless, wearable technology which
is tracking person’s activities like for example calories burned, sleep quality,
steps and distance. Based on the data collected the users are able to monitor
their performances and progresses over a certain time.1
"Wearable technology has the potential to be a powerful solution to societal
challenges.” 2
Wearable technology is an industry that is making a huge impact on everyday
lives both for fitness novice to fashionistas in Paris. As Statista states, this type
of technologies have been around for decades for military forces and medical
professionals, however the private consumer market has only recently started to
feature items such as smart glasses, smart watches, fitness and health trackers
or even smart jewelry and smart fashion.
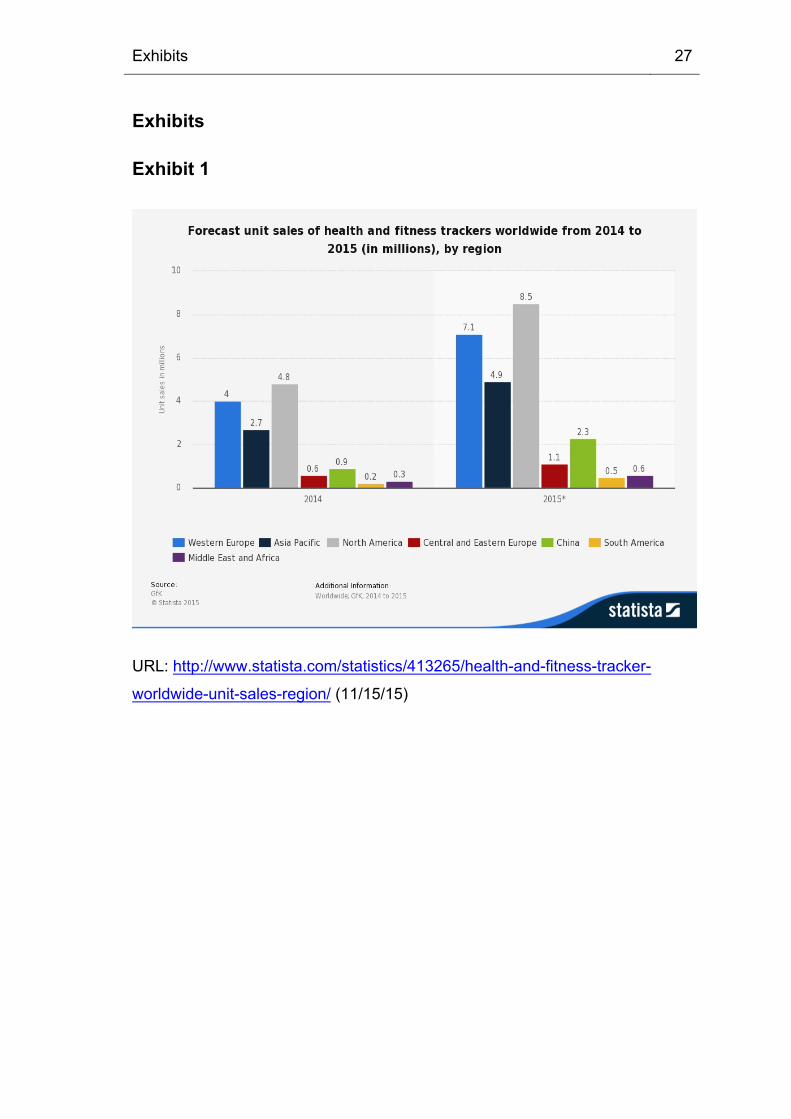
As a large proportion of people in the United States of America and Canada are
tech-savvy, health conscious and affluent enough to purchase and use
wearable technology devices, North America expected to dominate the global
wearable technology market, with an estimated 43% market share by 2019 (see
Exhibit 1). However, the lack of such consumers is hampering the growth of the
wearable technology market in Asia Pacific, Latin America and Africa.
As this industry grows at dramatic rates with the customer-driven culture Smart
Wearables in the technology industry for 2015 is one that is looking to be a big
and profitable market. The technology that these new devices are employing is
innovative to say at the least.
1 FactSet Research Systems Inc., 2015, website
2 Wearable technology AG, 2015, website

Hult International Business School: Team 11 4
Smart technology is certainly something that will be the key to the optimal
operating of our future society, especially when it comes to healthcare.
We, Team 11 Golden Gate, are concentrating our research within the
wearable’s industry. Our focus is to analyze the fitness tracking monitor niche of
the industry in order to understand the performance of two of the top players
towards the consumer’s preferences. Within our research, we are looking at FIT
for our financial analysis and using GRMN as the benchmark.
Since wearable fitness components become readily available to consumers, the
wearable fitness tracker market is becoming increasingly crowded. FIT may see
more competitive pressure in the future. Other key players that are having a
strong presence include Samsung, Apple, Jawbone and Chinese based Xiaomi
brand which introduced itself by pricing its devices as low as $20 US dollars
(see Exhibit 2).
FIT has hold on to the market’s leadership by combining a powerful tracker with
smart watch functionality in their most-recent flagship product. This helped
against the introduction of Apple’s smart watch in 2015, but will it be able to
keep up with the consumer’s demand and trends? (see Exhibit 2).
Apple managed to sell 3.6 million Apple Watches in its first quarter on the
market. Remarkably, the Apple Watch with its steep starting price even outsold
Xiaomi's ultra-cheap Mi Band. FIT has seen its shares take a nice climb post
IPO (NYSE:FIT). FIT is trading at nearly 10x sales, it could be though that the
company is looking pretty overvalued right now.
FIT sold 4.8 million new devices during the quarter, nearly tripling revenue
compared to last year. Shares pulled back following the announcement of a
secondary stock offering. This is a normal transaction for a growth company like
FIT. FIT's domestic growth is quite impressive. This company's international
sales should lead the company to continue to post strong revenue growth for
years to come.
Hult International Business School: Team 11 5
3 Fitbit, Inc.: Financial Position Analysis
In order to get a sense of how FIT is performing financially the following
financial position analysis is executed by the use of their financial statements.
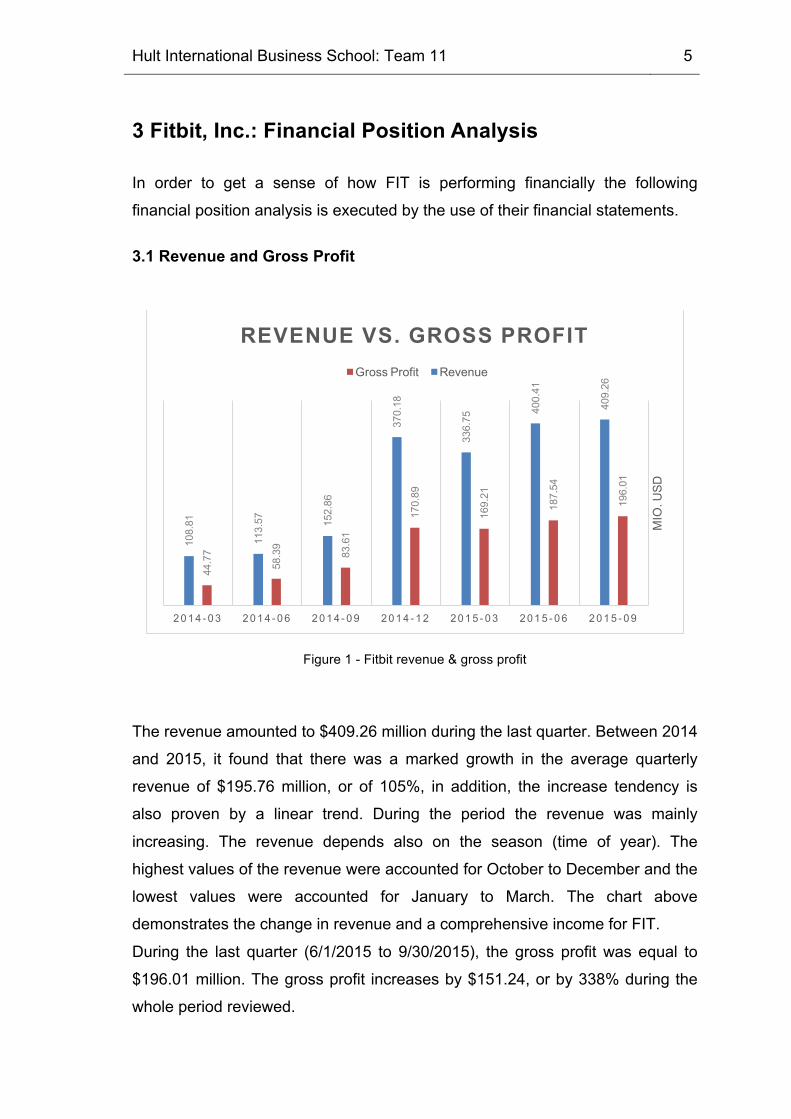
3.1 Revenue and Gross Profit
Figure 1 - Fitbit revenue & gross profit
The revenue amounted to $409.26 million during the last quarter. Between 2014
and 2015, it found that there was a marked growth in the average quarterly
revenue of $195.76 million, or of 105%, in addition, the increase tendency is
also proven by a linear trend. During the period the revenue was mainly
increasing. The revenue depends also on the season (time of year). The
highest values of the revenue were accounted for October to December and the
lowest values were accounted for January to March. The chart above
demonstrates the change in revenue and a comprehensive income for FIT.
During the last quarter (6/1/2015 to 9/30/2015), the gross profit was equal to
$196.01 million. The gross profit increases by $151.24, or by 338% during the
whole period reviewed.
196.01
187.54
169.21
170.89
83.61
58.39
44.77
409.26
400.41
336.75370.18
152.86
113.57
108.81
2 015 - 092015 - 062015 - 032014 - 122014 - 092014 - 062014 - 03
MIO. USD
REVENUE VS. GROSS PROFITGross Profit Revenue

Hult International Business School: Team 11 6
FIT has generated brand awareness and engaged new sales methods to get
large corporate clients in their folds becoming a market leader in the Fitness
wearable consumer durable segment (68% Market Share).
3.2 Cost of Goods Sold (COGS)
(all figures are in US$ millions) 2014 2013 2012
Cost Of Goods Sold 387.78 210.84 49.73
Revenue Growth (Total Company) 52.02% 77.77% 65.12%
Figure 2 - Fitbit COGS
COGS has increased decreased in 2014 from pick of 78% in the 2013 thus
contributing to the margin growth. Although, in the following section the
increased investment in sales and general expenses as well as R&D expenses
will be highlighted. This surely has bearings on the overall profit margins.
3.3 Cash asset: Accounts receivable
Figure 3 - Fitbit accounts receivable
In the chart below, you will see a correlation of the basic groups of the
company's assets.
238.86
80.62
0
50
100
150
200
250
300
2014-122013-12
ACCOUNTS RECEIVABLE

Hult International Business School: Team 11 7
Figure 4 - Fitbit assets
The inventories equaled $276.08 million at the end of the period analyzed;; it is
$161.01 million higher than the level of the inventories at the beginning of the
period (12/31/2014).
During the period analyzed (from 12/31/2014 to 9/30/2015), the current
receivables were found to alter more or less.
3.4 Non-cash assets
Non-cash assets are assets that add value to the company but cannot be easily
turned into cash.
3.4.1 Property, Plant and Equipment (PPE)
FIT is investing into building their PPE assets by increasing from $6.5 Mio. to
$26 Mio. in 2014. They have increased the investment 4 times into the PPE.
FIT is increasing their non-cash assets and that is showing in their ROA.
Accounts Receivable39%
Inventories45%
Other Current Assets2%
Non-current asset14%
Fitbit's assets structure on 31 September, 2015
Accounts Receivable Inventories Other Current Assets Non-current asset

Hult International Business School: Team 11 8
3.4.2 Inventory
In order to meet the growing sales demand FIT increased their inventories from
$56 Mio. in 2013 to $115 Mio. That shows FIT’s preparedness and investment
into meeting their aggressive sales push.
3.5 Liabilities
In order to assess the liabilities that the company should repay for the use of
borrowed capital, an interest coverage ratio was calculated.
Figure 5 - Fitbit liabilities
The acceptable value is deemed to be no less than 1.5. In this case, the interest
coverage ratios are high above the threshold which is evidence of FIT capability
to pay interest on borrowed asset.
312
212193
107
645739
0
50
100
150
200
250
300
350
2015-092015-062015-032014-122014-092014-062014-03
INTEREST COVERAGE RATIO
Hult International Business School: Team 11 9
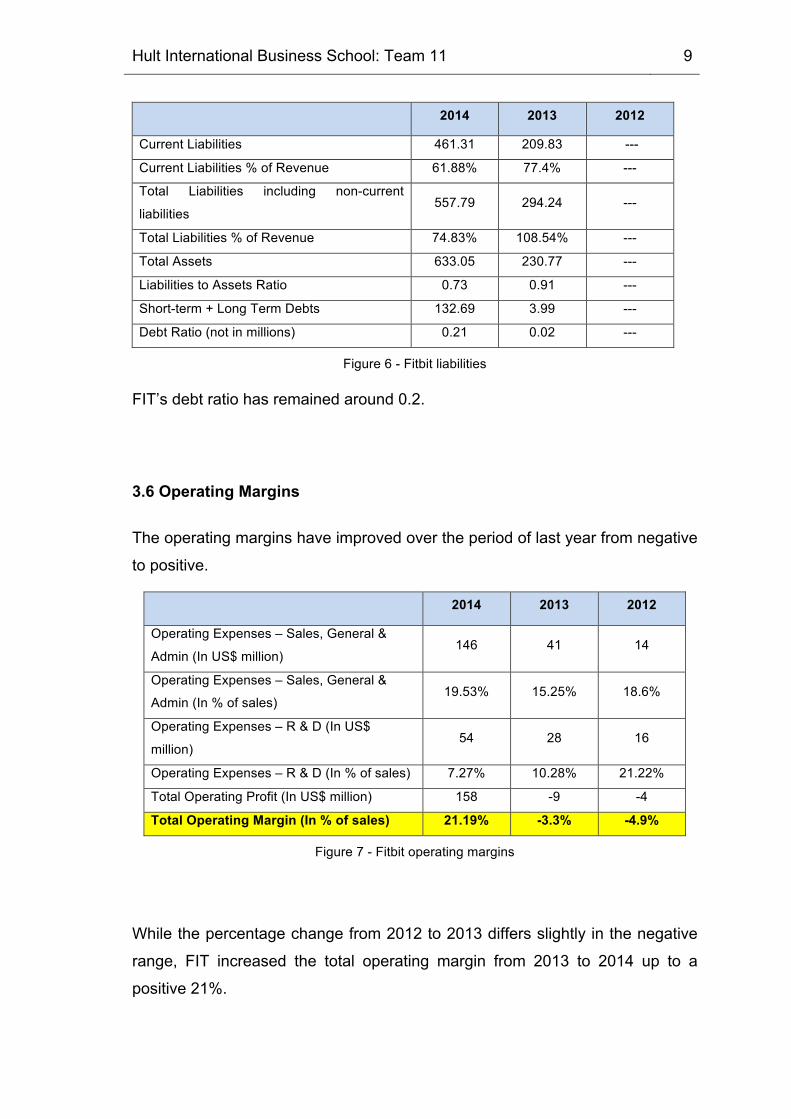
2014 2013 2012
Current Liabilities 461.31 209.83 ---
Current Liabilities % of Revenue 61.88% 77.4% ---
Total Liabilities including non-current
liabilities 557.79 294.24 ---
Total Liabilities % of Revenue 74.83% 108.54% ---
Total Assets 633.05 230.77 ---
Liabilities to Assets Ratio 0.73 0.91 ---
Short-term + Long Term Debts 132.69 3.99 ---
Debt Ratio (not in millions) 0.21 0.02 ---
Figure 6 - Fitbit liabilities
FIT’s debt ratio has remained around 0.2.
3.6 Operating Margins
The operating margins have improved over the period of last year from negative
to positive.
2014 2013 2012
Operating Expenses – Sales, General &
Admin (In US$ million) 146 41 14
Operating Expenses – Sales, General &
Admin (In % of sales) 19.53% 15.25% 18.6%
Operating Expenses – R & D (In US$
million) 54 28 16
Operating Expenses – R & D (In % of sales) 7.27% 10.28% 21.22%
Total Operating Profit (In US$ million) 158 -9 -4
Total Operating Margin (In % of sales) 21.19% -3.3% -4.9%
Figure 7 - Fitbit operating margins
While the percentage change from 2012 to 2013 differs slightly in the negative
range, FIT increased the total operating margin from 2013 to 2014 up to a
positive 21%.
Hult International Business School: Team 11 10
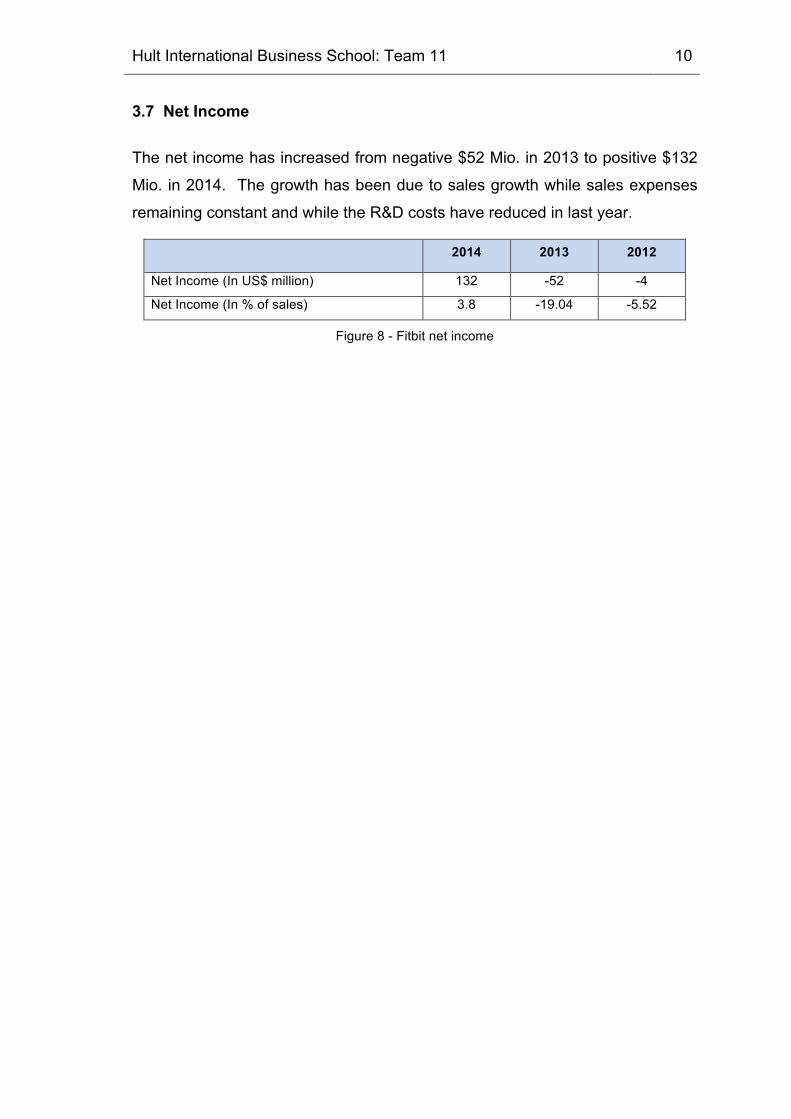
3.7 Net Income
The net income has increased from negative $52 Mio. in 2013 to positive $132
Mio. in 2014. The growth has been due to sales growth while sales expenses
remaining constant and while the R&D costs have reduced in last year.
2014 2013 2012
Net Income (In US$ million) 132 -52 -4
Net Income (In % of sales) 3.8 -19.04 -5.52
Figure 8 - Fitbit net income
Hult International Business School: Team 11 11
4 Benchmark: Garmin Ltd.
Garmin Ltd. is a company that creates and manufactures navigation products
for the automobile, aviation, marine and outdoor industry. In recent years, the
firm has also explored and developed in the fitness industry. The Swiss
company pioneered with Global Positioning System (GPS) navigation applied
for people that live an active lifestyle. These products, originally created for the
military, have been a widely spread in the Automobile and Outdoor industry.
During 2010, GRMN entered the fitness sector with the Forerunner line. Finally,
in 2014, it developed the GRMN Vivo series as part of their wearable
technology segment. The latter has become fastest growing sector, increasing
revenue growth +60% vs. Last Year ($ 212.16 Million) and now represents 20%
of GRMN’s total revenue.
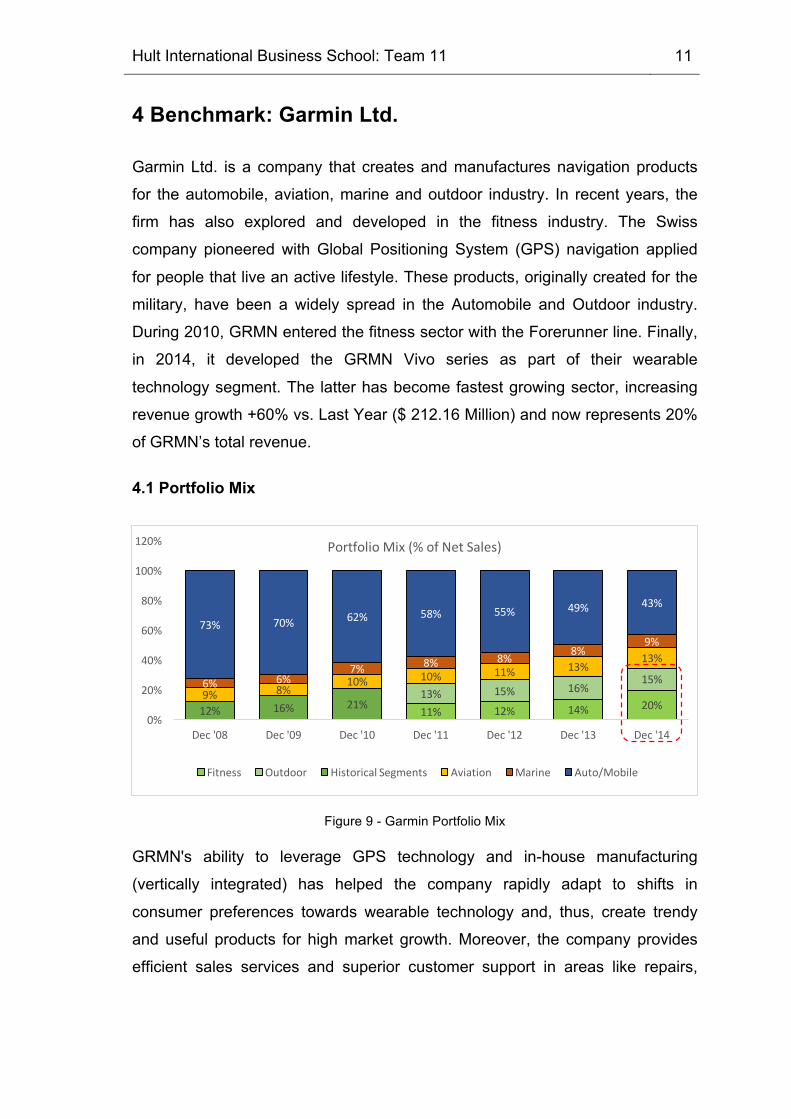
4.1 Portfolio Mix
Figure 9 - Garmin Portfolio Mix
GRMN's ability to leverage GPS technology and in-house manufacturing
(vertically integrated) has helped the company rapidly adapt to shifts in
consumer preferences towards wearable technology and, thus, create trendy
and useful products for high market growth. Moreover, the company provides
efficient sales services and superior customer support in areas like repairs,
11% 12% 14% 20%13% 15% 16%
15%
12% 16% 21%9% 8%
10% 10% 11% 13%13%
6% 6%7% 8% 8% 8%
9%73% 70% 62% 58% 55% 49% 43%
0%
20%
40%
60%
80%
100%
120%
Dec '08 Dec '09 Dec '10 Dec '11 Dec '12 Dec '13 Dec '14
Portfolio Mix (% of Net Sales)
Fitness Outdoor Historical Segments Aviation Marine Auto/Mobile
Hult International Business School: Team 11 12
technical support and warranty services that have given their products good
reputation across all their portfolio.
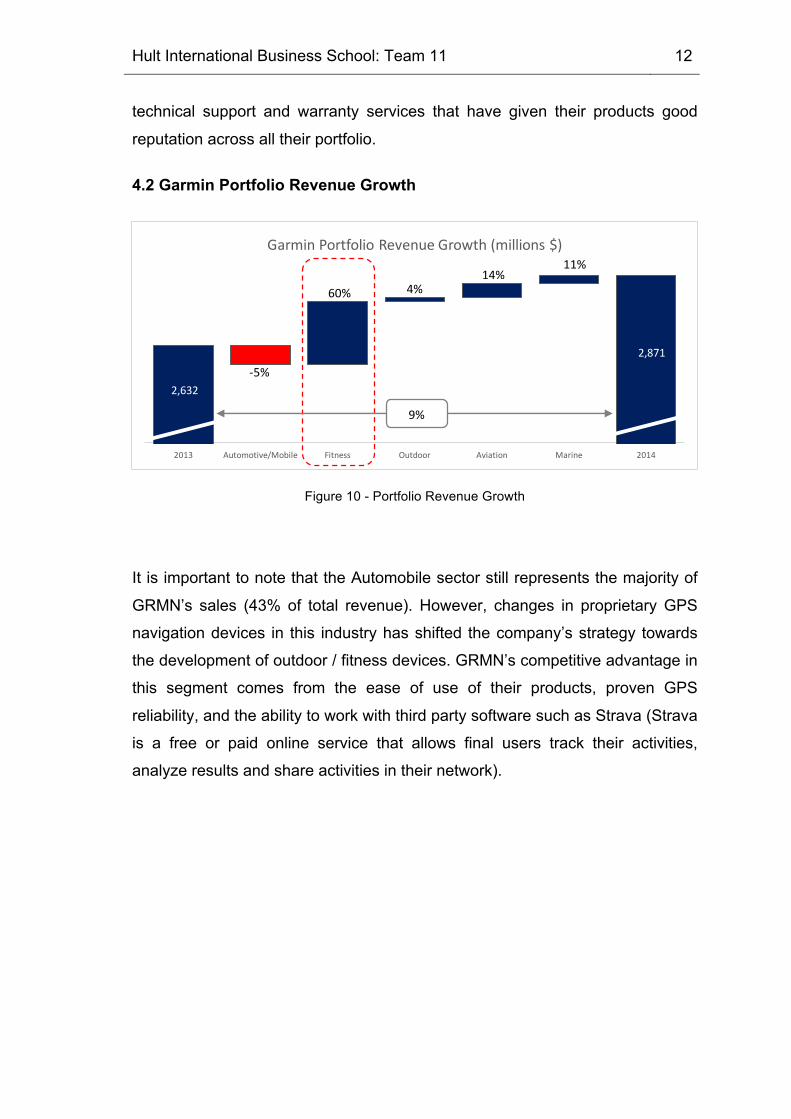
4.2 Garmin Portfolio Revenue Growth
Figure 10 - Portfolio Revenue Growth
It is important to note that the Automobile sector still represents the majority of
GRMN’s sales (43% of total revenue). However, changes in proprietary GPS
navigation devices in this industry has shifted the company’s strategy towards
the development of outdoor / fitness devices. GRMN’s competitive advantage in
this segment comes from the ease of use of their products, proven GPS
reliability, and the ability to work with third party software such as Strava (Strava
is a free or paid online service that allows final users track their activities,
analyze results and share activities in their network).
2,632
2,871
2013 Automotive/Mobile Fitness Outdoor Aviation Marine 2014
Garmin Portfolio Revenue Growth (millions $)
9%
-‐5%
60% 4% 14%
11%

Hult International Business School: Team 11 13
4.3 Net Sales
Portfolio Comparison
2014/2013
2014 Net Sales in $
% of revenue
2013 Net Sales in $
% of revenue
Vs. PY $ change
% change
Outdoor 428 15% 411 16% 16.57 4%
Fitness 568 20% 356 14% 212.16 60%
Marine 248 9% 223 8% 25.44 11%
Automotive Mobile 1,240 43% 1,302 49% (61.94) -‐5%
Aviation 386 13% 339 13% 46.58 14%
Total $ 2,871 100% $ 2,632 100% $ 238.81 9%
Figure 11 - Net Sales Analysis
By segment, the automotive / mobile segment revenues decreased -5% vs. PY
2013, in part, due to a -10% volume decrease, as well as, reduced prices. As
previously mentioned, results affected by increased proprietary Built-in GPS
systems in the auto industry, as well as by unearned income (deferred revenue)
from future payments of products yet to be delivered.
The Fitness segment shows the biggest increase in revenue (+60% vs. 2013)
due to growing demand of fitness products, as well as GRMN’s efforts to
develop this sector (R&D expense in sector grew +41% vs. 2013). On the other
hand, outdoor sector revenues increased +4% vs. 2013 primarily due to strong
sales of their watch, Fēnix 2 (A new version of this watch came out this year).
For the coming year, GRMN estimates revenue growth at a conservative $2.9
billion in 2015 (+1.02%) driven by the fitness sector, but partially affected by the
continuous downfall of the automotive sector.
Hult International Business School: Team 11 14
4.4 Cost of goods sold (COGS)
Portfolio Comparison
2014/2013
2014 Gross Profit in $
% of total 2013 Gross
Profit in $
% of total
Vs. PY $ change
% change Gross Margin
Outdoor 267 17 263 19 4.02 2% 62%
Fitness 358 22 223 16 135.36 61% 63%
Marine 130 8 115 8 14.62 13% 52%
Automotive
Mobile
569 35 565 40 4.37 1% 46%
Aviation 280 17 242 17 38.74 16% 73%
Total $ 1,604 100% $ 1,407 100% $ 197.11 14% 56%
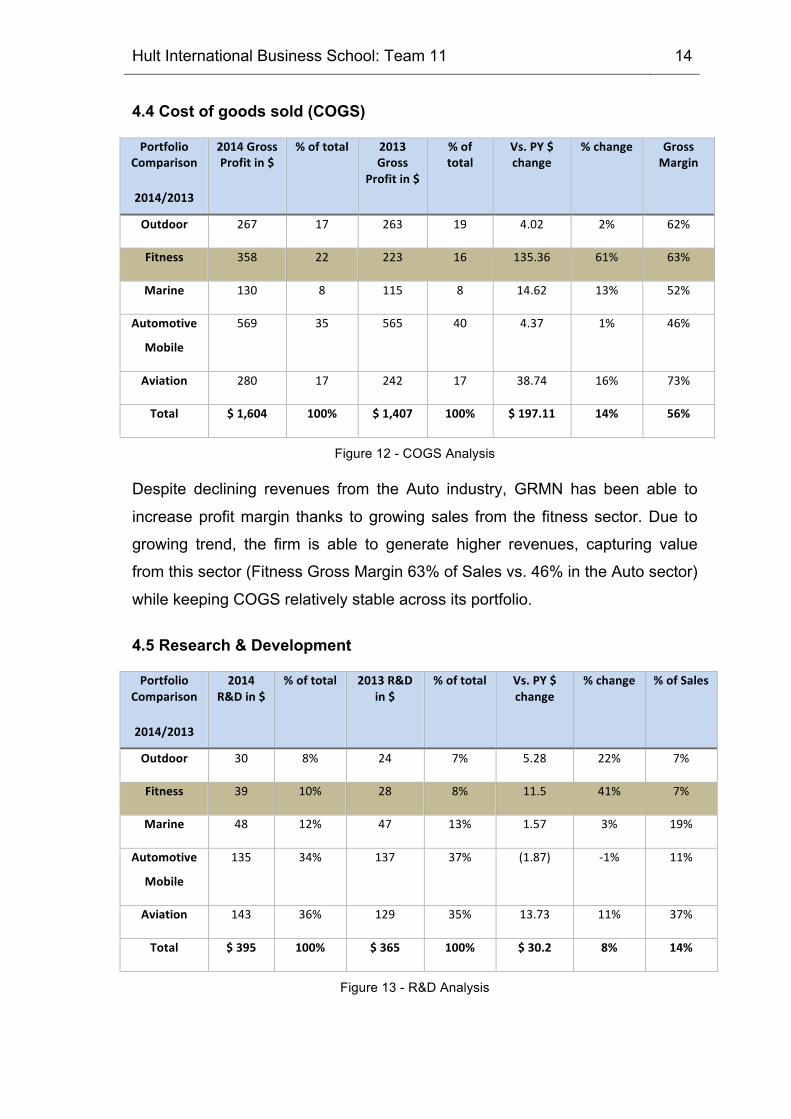
Figure 12 - COGS Analysis
Despite declining revenues from the Auto industry, GRMN has been able to
increase profit margin thanks to growing sales from the fitness sector. Due to
growing trend, the firm is able to generate higher revenues, capturing value
from this sector (Fitness Gross Margin 63% of Sales vs. 46% in the Auto sector)
while keeping COGS relatively stable across its portfolio.
4.5 Research & Development
Portfolio Comparison
2014/2013
2014 R&D in $
% of total 2013 R&D in $
% of total Vs. PY $ change
% change % of Sales
Outdoor 30 8% 24 7% 5.28 22% 7%
Fitness 39 10% 28 8% 11.5 41% 7%
Marine 48 12% 47 13% 1.57 3% 19%
Automotive
Mobile
135 34% 137 37% (1.87) -‐1% 11%
Aviation 143 36% 129 35% 13.73 11% 37%
Total $ 395 100% $ 365 100% $ 30.2 8% 14%
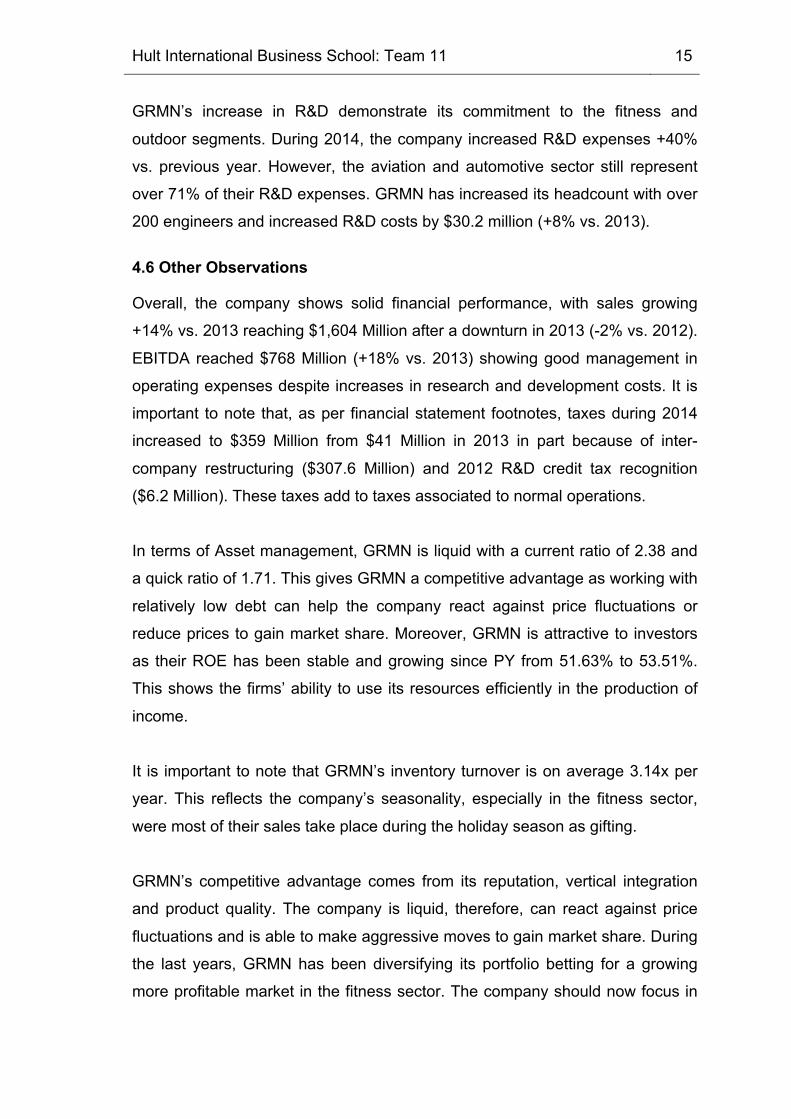
Figure 13 - R&D Analysis
Hult International Business School: Team 11 15
GRMN’s increase in R&D demonstrate its commitment to the fitness and
outdoor segments. During 2014, the company increased R&D expenses +40%
vs. previous year. However, the aviation and automotive sector still represent
over 71% of their R&D expenses. GRMN has increased its headcount with over
200 engineers and increased R&D costs by $30.2 million (+8% vs. 2013).
4.6 Other Observations
Overall, the company shows solid financial performance, with sales growing
+14% vs. 2013 reaching $1,604 Million after a downturn in 2013 (-2% vs. 2012).
EBITDA reached $768 Million (+18% vs. 2013) showing good management in
operating expenses despite increases in research and development costs. It is
important to note that, as per financial statement footnotes, taxes during 2014
increased to $359 Million from $41 Million in 2013 in part because of inter-
company restructuring ($307.6 Million) and 2012 R&D credit tax recognition
($6.2 Million). These taxes add to taxes associated to normal operations.
In terms of Asset management, GRMN is liquid with a current ratio of 2.38 and
a quick ratio of 1.71. This gives GRMN a competitive advantage as working with
relatively low debt can help the company react against price fluctuations or
reduce prices to gain market share. Moreover, GRMN is attractive to investors
as their ROE has been stable and growing since PY from 51.63% to 53.51%.
This shows the firms’ ability to use its resources efficiently in the production of
income.
It is important to note that GRMN’s inventory turnover is on average 3.14x per
year. This reflects the company’s seasonality, especially in the fitness sector,
were most of their sales take place during the holiday season as gifting.
GRMN’s competitive advantage comes from its reputation, vertical integration
and product quality. The company is liquid, therefore, can react against price
fluctuations and is able to make aggressive moves to gain market share. During
the last years, GRMN has been diversifying its portfolio betting for a growing
more profitable market in the fitness sector. The company should now focus in
Hult International Business School: Team 11 16
reducing risks associated to market seasonality in order to avoid stock-outs and
increased liabilities due to shortage in sales in the low.
5 Performance Analysis
The performance ratios for the analysis are based on different data taken out
from the 10K report. They measure FIT’s ability to meet overall performance
and give more information about the decisions made by its management. For
example, “is the company managed efficiently and profitably? Does it use
assets effectively”3 or how quick is FIT in converting its assets into cash. All
these ratios will be used for the company´s credibility and for planning purposes
the coming fiscal period.
5.1 Profitability Ratios
Profitability is the capacity to make a profit, and a profit is what is left over from
income earned after you have deducted all costs and expenses related to
earning the income.
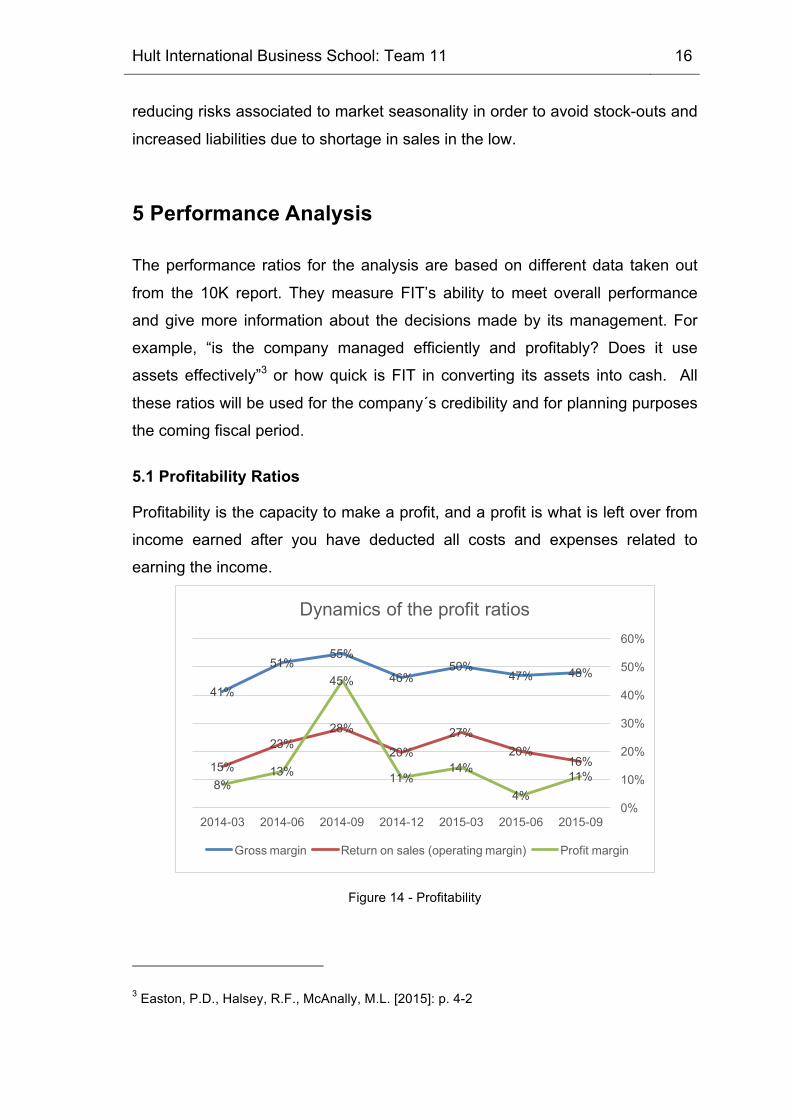
Figure 14 - Profitability
3 Easton, P.D., Halsey, R.F., McAnally, M.L. [2015]: p. 4-2
48%47%50%
46%
55%51%
41%
16%20%
27%20%
28%23%
15%11%
4%
14%11%
45%
13%8%
0%
10%
20%
30%
40%
50%
60%
2015-092015-062015-032014-122014-092014-062014-03
Dynamics of the profit ratios
Gross margin Return on sales (operating margin) Profit margin
Hult International Business School: Team 11 17
During the last quarter (6/1/2015 to 9/30/2015), the gross margin was equal to
48%. The gross margin decreased by -7% for the last quarter in comparison
with the same period of the prior financial year. In addition, the decrease in the
gross margin during the period is demonstrated with an average (linear) trend.
Profitability calculated by net income (profit margin) deserves more attention.
During the reviewed period, multidirectional changes in the profit (both growth
and reduction) was observed;; the maximum value was 45%, the minimum one
was 4%. For the period from 7/1/2014 to 9/31/2014, the return on sales was
28% per annum, and profitability calculated by net profit was 45% per annum.
2012-12 2013-12 2014-12 2012-12 2013-12 2014-12TaxRate% — — 5.72 13.15 6.3 49.68
NetMargin% -5.52 -19.04 3.8 19.97 23.27 12.69
AssetTurnover(Average) — 1.17 1.73 0.58 0.54 0.6
ReturnonAssets% — -22.37 6.56 11.68 12.63 7.61
FinancialLeverage(Average) — — 8.41 1.36 1.33 1.38
ReturnonEquity% — — 480.64 15.98 17.03 10.31
ReturnonInvestedCapital% — — 36.56 15.08 16.11 9.66
InterestCoverage — — — — — —
FITBIT GARMINProfitability
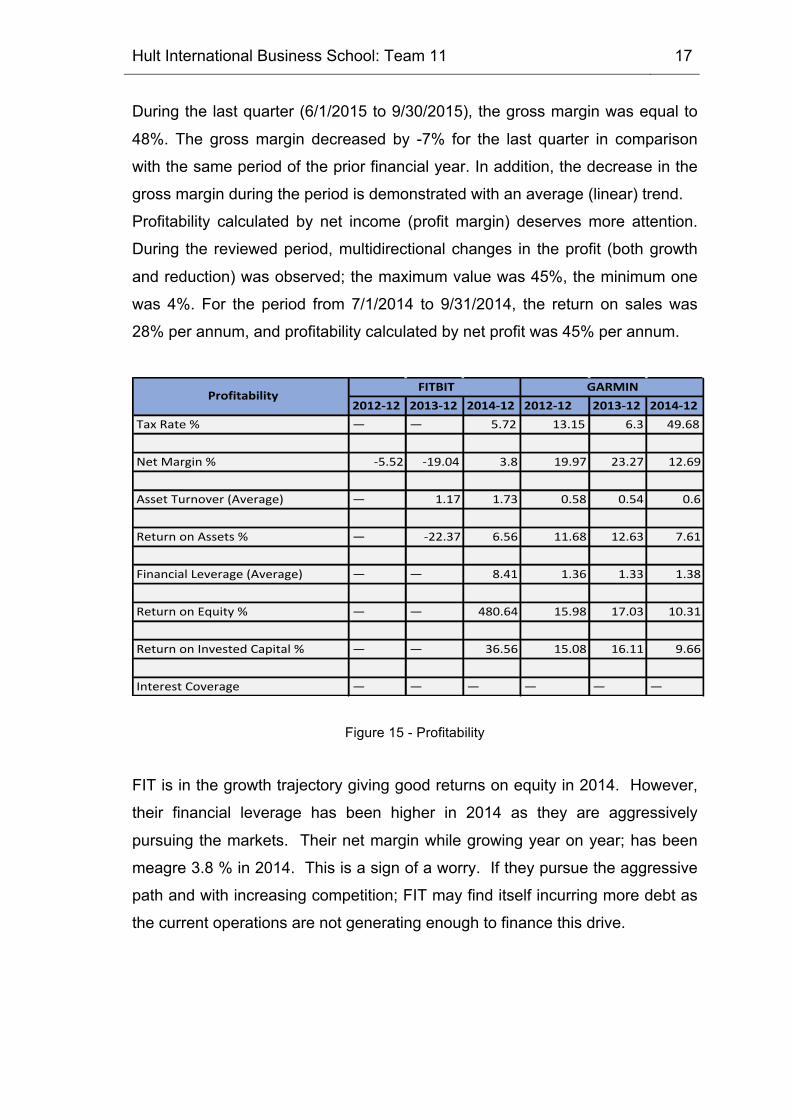
Figure 15 - Profitability
FIT is in the growth trajectory giving good returns on equity in 2014. However,
their financial leverage has been higher in 2014 as they are aggressively
pursuing the markets. Their net margin while growing year on year;; has been
meagre 3.8 % in 2014. This is a sign of a worry. If they pursue the aggressive
path and with increasing competition;; FIT may find itself incurring more debt as
the current operations are not generating enough to finance this drive.
Hult International Business School: Team 11 18
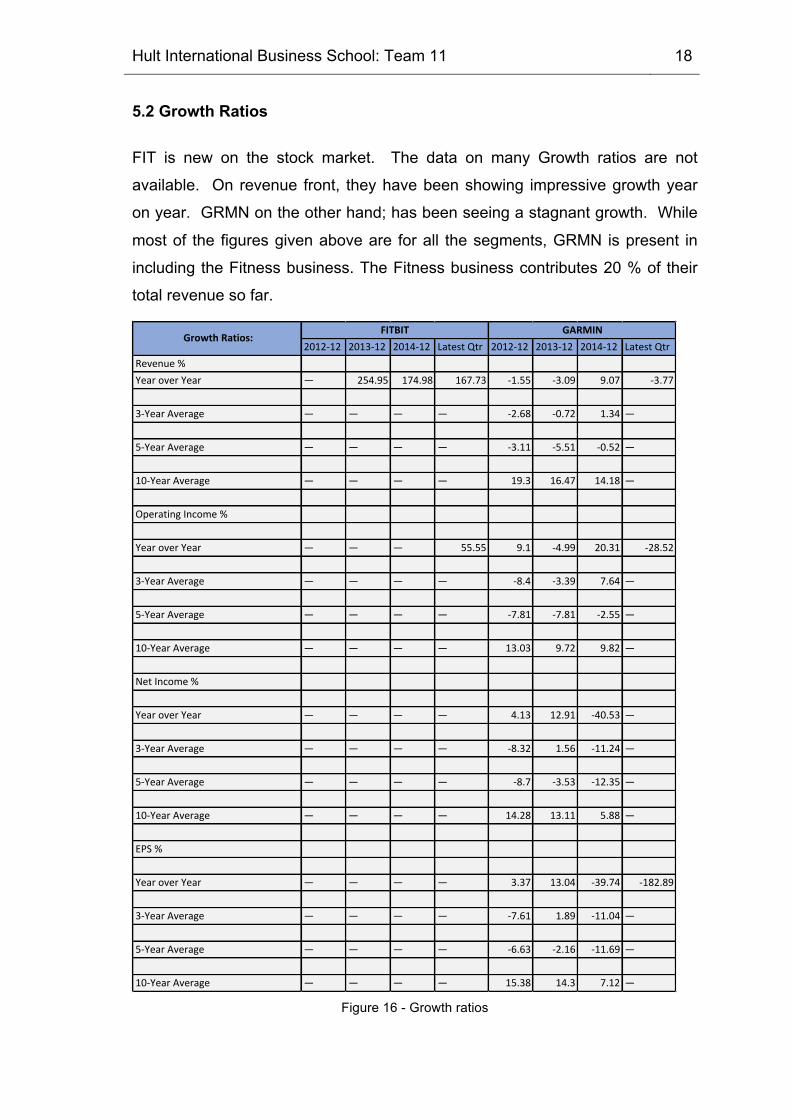
5.2 Growth Ratios
FIT is new on the stock market. The data on many Growth ratios are not
available. On revenue front, they have been showing impressive growth year
on year. GRMN on the other hand;; has been seeing a stagnant growth. While
most of the figures given above are for all the segments, GRMN is present in
including the Fitness business. The Fitness business contributes 20 % of their
total revenue so far.
2012-12 2013-12 2014-12 LatestQtr 2012-12 2013-12 2014-12 LatestQtrRevenue%YearoverYear — 254.95 174.98 167.73 -1.55 -3.09 9.07 -3.77
3-YearAverage — — — — -2.68 -0.72 1.34 —
5-YearAverage — — — — -3.11 -5.51 -0.52 —
10-YearAverage — — — — 19.3 16.47 14.18 —
OperatingIncome%
YearoverYear — — — 55.55 9.1 -4.99 20.31 -28.52
3-YearAverage — — — — -8.4 -3.39 7.64 —
5-YearAverage — — — — -7.81 -7.81 -2.55 —
10-YearAverage — — — — 13.03 9.72 9.82 —
NetIncome%
YearoverYear — — — — 4.13 12.91 -40.53 —
3-YearAverage — — — — -8.32 1.56 -11.24 —
5-YearAverage — — — — -8.7 -3.53 -12.35 —
10-YearAverage — — — — 14.28 13.11 5.88 —
EPS%
YearoverYear — — — — 3.37 13.04 -39.74 -182.89
3-YearAverage — — — — -7.61 1.89 -11.04 —
5-YearAverage — — — — -6.63 -2.16 -11.69 —
10-YearAverage — — — — 15.38 14.3 7.12 —
GARMINFITBITGrowthRatios:
Figure 16 - Growth ratios

Hult International Business School: Team 11 19
5.3 Cash Ratios
The overall analysis based on cash flow ratios is that FIT has been spending
more on CAPEX in comparison to GRMN. This explains their increasing asset
base. Cash flow has seen negative growth suggesting that FIT is borrowing
more to run operations as well as expand the business.
Cash Flow Ratios FITBIT GARMIN
2012-‐12 2013-‐12 2014-‐12 2012-‐12 2013-‐12 2014-‐12
Operating Cash Flow
Growth % YOY — — -‐43.4 -‐16.73 -‐7.98 -‐17.04
Free Cash Flow Growth %
YOY — — — -‐18.13 -‐10.42 -‐22.38
Cap Ex as a % of Sales 3.28 2.78 3.55 1.67 2.17 2.72
Free Cash Flow/Sales % -‐12.29 9.46 -‐1.04 23.55 21.77 15.49
Free Cash Flow/Net Income 2.23 -‐0.5 -‐0.06 1.18 0.94 1.22
Figure 17 - Cash flow ratios
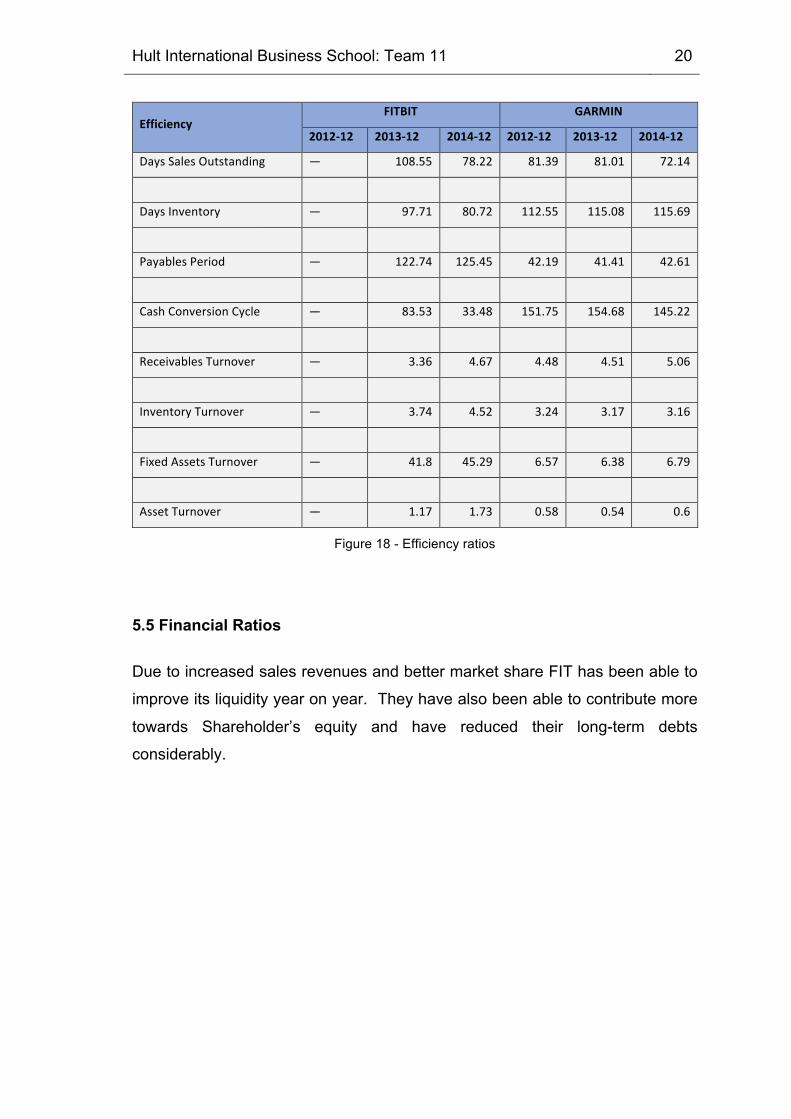
5.4 Efficiency Ratios
Key takeaways from the Efficiency ratios are that FIT manages comfortable
outstanding collection to payment to vendor cycle. Their cash conversion cycle
has improved from 84 days to 33 days, thus improving their cash flow. They
have maintained good receivables turnover ratio and inventory turnover ratio.
GRMN has a better position here. FIT in comparison to GRMN has been able
to generate better revenues per fixed asset investments.
Hult International Business School: Team 11 20
Efficiency FITBIT GARMIN
2012-‐12 2013-‐12 2014-‐12 2012-‐12 2013-‐12 2014-‐12
Days Sales Outstanding — 108.55 78.22 81.39 81.01 72.14
Days Inventory — 97.71 80.72 112.55 115.08 115.69
Payables Period — 122.74 125.45 42.19 41.41 42.61
Cash Conversion Cycle — 83.53 33.48 151.75 154.68 145.22
Receivables Turnover — 3.36 4.67 4.48 4.51 5.06
Inventory Turnover — 3.74 4.52 3.24 3.17 3.16
Fixed Assets Turnover — 41.8 45.29 6.57 6.38 6.79
Asset Turnover — 1.17 1.73 0.58 0.54 0.6
Figure 18 - Efficiency ratios
5.5 Financial Ratios
Due to increased sales revenues and better market share FIT has been able to
improve its liquidity year on year. They have also been able to contribute more
towards Shareholder’s equity and have reduced their long-term debts
considerably.

Hult International Business School: Team 11 21
2012-‐122013-‐122014-‐12Latest Qtr2012-‐122013-‐122014-‐12Latest Qtr
Cash & Short-‐Term Investments — 35.41 30.9 45.58 28.72 27.24 29.07 25.68
Accounts Receivable — 34.94 37.73 19.4 12.53 14.39 12.15 9.84
Inventory — 24.46 18.18 21.87 8.09 7.83 8.96 11.47
Other Current Assets — 2.38 7.45 6.18 3.28 3.74 3.33 3.88
Total Current Assets — 97.19 94.26 93.04 52.63 53.19 53.5 50.86
Net PP&E — 2.81 4.18 2.83 8.5 8.5 9.18 10.01
Intangibles — — — 2.76 4.83 4.5 4.65 5.03
Other Long-‐Term Assets — — 1.56 1.37 34.04 33.81 32.67 34.1
Total Assets — 100 100 100 100 100 100 100
Accounts Payable — 30.72 30.91 25.36 2.72 3 3.18 3.62
Short-‐Term Debt — 1.73 20.94 — — — — —
Taxes Payable — 8.5 5.2 0.46 0.66 0.78 3.88 0.42
Accrued Liabil ities — 11.25 9.83 7.41 6.58 5.88 6.29 3.93
Other Short-‐Term Liabil ities — 38.73 5.98 3.18 8.89 8.89 8.66 12.42
Total Current Liabil ities — 90.92 72.87 36.41 18.86 18.55 22.02 20.39
Long-‐Term Debt — 2.91 — — — — — —
Other Long-‐Term Liabil ities — 33.66 15.24 1.48 7.85 6.45 5.47 5.9
Total Liabil ities — 127.5 88.11 37.89 26.71 25 27.48 26.29
Total Stockholders' Equity — -‐27.5 11.89 62.11 73.29 75 72.52 73.71
Total Liabil ities & Equity 100 100 100 100 100 100 100 100
Liquidity/Financial Health 2012-‐122013-‐122014-‐12Latest Qtr 2012-‐122013-‐122014-‐12Latest Qtr
Current Ratio — 1.07 1.29 2.56 2.79 2.87 2.43 2.49
Quick Ratio — 0.77 0.94 1.78 2.19 2.24 1.87 1.74
Financial Leverage — — 8.41 1.61 1.36 1.33 1.38 1.36
Debt/Equity — — — — — — — —
Balance Sheet Items (in %)FITBIT GARMIN
Figure 19 - Balance sheet ratios
Hult International Business School: Team 11 22
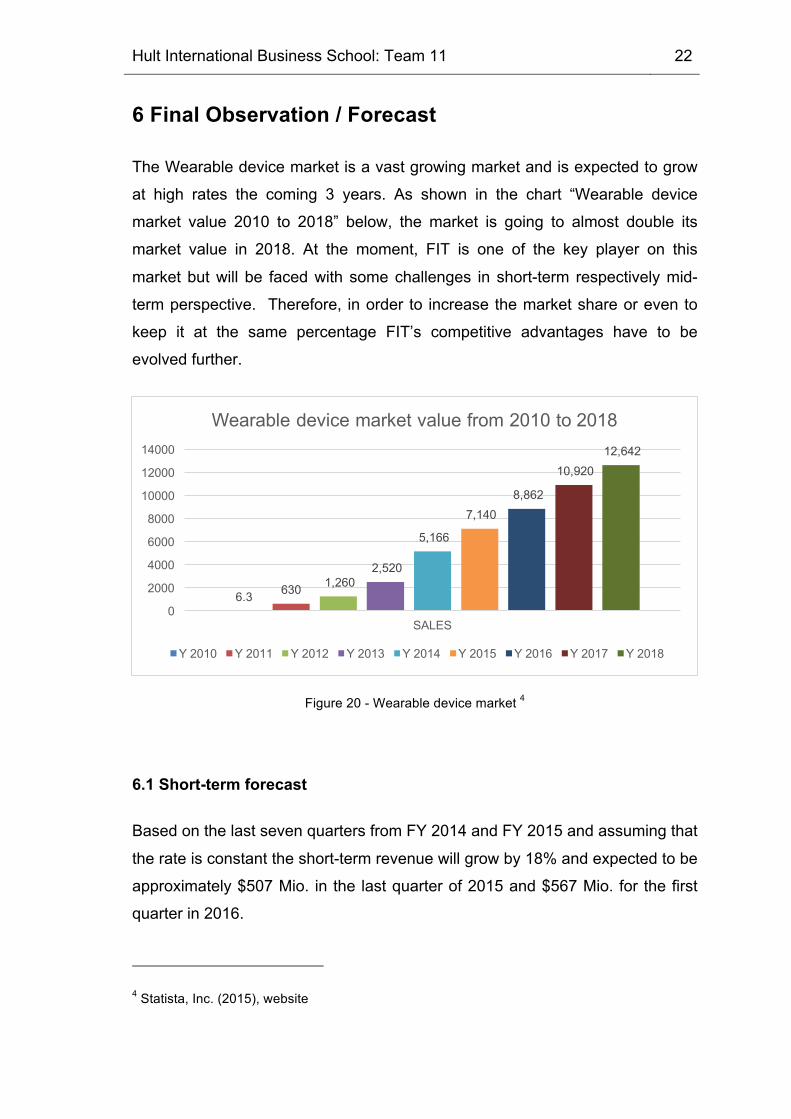
6 Final Observation / Forecast
The Wearable device market is a vast growing market and is expected to grow
at high rates the coming 3 years. As shown in the chart “Wearable device
market value 2010 to 2018” below, the market is going to almost double its
market value in 2018. At the moment, FIT is one of the key player on this
market but will be faced with some challenges in short-term respectively mid-
term perspective. Therefore, in order to increase the market share or even to
keep it at the same percentage FIT’s competitive advantages have to be
evolved further.
Figure 20 - Wearable device market 4
6.1 Short-term forecast
Based on the last seven quarters from FY 2014 and FY 2015 and assuming that
the rate is constant the short-term revenue will grow by 18% and expected to be
approximately $507 Mio. in the last quarter of 2015 and $567 Mio. for the first
quarter in 2016.
4 Statista, Inc. (2015), website
6.3 630 1,260 2,520
5,166
7,140 8,862
10,920 12,642
0
2000
4000
6000
8000
10000
12000
14000
SALES
Wearable device market value from 2010 to 2018
Y 2010 Y 2011 Y 2012 Y 2013 Y 2014 Y 2015 Y 2016 Y 2017 Y 2018

Hult International Business School: Team 11 23
However, since FIT's revenue is highly influenced by its seasonal business it
expected to be higher for quarter 2015 ($507 Mio.) and lower for the first quarter
of 2016 ($461 Mio.).
Figure 21 - Fitbit forecast
6.2 Long-term forecast
FIT is experiencing a high rivalry power since existing competitors are
defending their market share with comparable technology and new competitors
are entering the market including newcomer as well as established corporations
like Apple and Google. While for example Xiaomi, a Chinese competitor, is
penetrating the market with low prices, FIT is losing a significant market share.
Based on the gained knowledge out of the analysis and the market insights it is
difficult to predict the long-term forecast because it is depending on several
factors: Portfolio diversity, price, network, and consumer preference.
y = 52.245x + 56.614R² = 0.87384
0
100
200
300
400
500
600
Q1 - 2014 Q2 - 2014 Q3 - 2014 Q4 - 2014 Q1 - 2015 Q2 - 2015 Q3 - 2015 Q4 - 2015 Q1 - 2016
Fitbit: Short-term Revenue Forecast

Hult International Business School: Team 11 24
6.3 Fitbit’s Risks
• Decreasing market share from 45% (Q1 2014) to 35% (Q1 2015) – most
of it captured by Xiaomi (25%)
• Highly competitive wearable market
• Material disruption of FIT information technology (customer information)
might give company bad reputation
• Highly seasonality – 50% of full-year revenue in last Q4
• Ability to create new products and adapt to changing consumer tastes
and preferences
• Firms like Google and Apple with financial power are entering the market
6.4 FIT´s Competitive Advantages
• Leading market position and global brand
• Broad range of connected health / fitness devices
• Broad and differentiated go-to-go market strategy
• Breadth and depth of established sales selling channels / prominent
presence in retail stores is difficult for competitors to replicate
• Large and growing community
• Direct relationship and continuous communication with FIT users
References 25
References
Bibliography Session 1 - 6: International Accounting, Prof. Larry Louie
Easton, P.D., Halsey, R.F., McAnally, M.L., Hartgraves, A.L., & Wayne, J.M.,
[2015] Financial & Managerial Accounting for MBA’s (4th), ISBN 978-
1618531025
Inspection: 11/18/15
Internet Sources Fitbit, Inc. https://www.fitbit.com 11/15/15
FactSet Research
Systems, Inc.
http://www.factset.com/ 11/16/15
Garmin Ltd. http://www.garmin.com/en-US 11/17/15
http://sites.garmin.com/en-US/annualreport/ 11/18/15
http://www8.garmin.com/aboutGarmin/invRela
tions/reports/10-K_2013.pdf
11/18/15
Investopia, LLC. http://www.investopedia.com/ 11/15/15
Morningstar http://www.morningstar.com/ 11/14/15
Seeking Alpha http://seekingalpha.com/ 11/15/15
http://seekingalpha.com/article/3368955-fitbit-
the-market-for-wearable-fitness-trackers-is-
getting-crowded
Statista, Inc. http://www.statista.com/ 11/15/15
http://www.statista.com/topics/1556/wearable-
technology/
11/18/15
Wearable
Technologies AG
https://www.wearable-technologies.com/ 11/15/15

References 26
https://www.wearable-
technologies.com/2015/04/wearables-in-
healthcare/
11/16/15
http://www.wearabletechnology-
news.com/news/2015/oct/23/review-putting-fitbit-
surge-through-its-paces/
11/15/15
Zensorium https://www.zensorium.com/ 11/15/15
http://blog.zensorium.com/latest-trends-in-the-
wearable-technology-industry/
11/15/15
Figures
Figure – Cover page
URL: https://www.fitbit.com
Inspection: 11/14/15
Figure 20 – Wearable device market
URL: http://www.statista.com/statistics/259372/wearable-device-market-value/
Inspection: 11/15/15
Exhibits 27
Exhibits
Exhibit 1
URL: http://www.statista.com/statistics/413265/health-and-fitness-tracker-
worldwide-unit-sales-region/ (11/15/15)

Exhibit 2 28
Exhibit 2
URL: http://www.statista.com/chart/3762/wearable-device-shipments/ (11/15/15)

Exhibit 3 29
Exhibit 3
URL: -
Ratios (2014)
2014 2013 2012
Sales Volume (Total Company) 2,870.66 2,631.85 2,715.68 Sales Volume (Fitness Sector) 568.44 356.28 321.79
Market Share (w/I Fitness)
Revenue Growth (Total Company) 9.07% -‐3.09% 0.34%Revenue Growth (Fitness Sector) 60.72% 11.04% N/A
Gross Profit (Total Company) 1,604.41 1,407.30 1,438.48 Gross Profit (Fitness Sector) 358.29 222.93 204.62
Gross Margin (Total Company) 55.89% 53.47% 52.97%Gross Margin (Fitness Sector) 63.03% 62.57% 63.59%% Sales R&D (Total Company) 13.76% 13.87% 12.00%% Sales R&D (Fitness Sector) 6.91% 7.79% 7.32%
Return on Assets (ROA) 7.61% 12.63% 11.68%Profitability 12.69% 23.27% 19.97%Productivity (Asset Turnover) 59.97% 54.27% 58.46%
Net Working Capital 1,426 1,633 1,573 Net Income 364.21 612.41 542.40 Prepaid Expenses N/A N/A N/AUnearned Revenues N/A N/A N/AAccrued Expenses 62.76 59.79 55.97
Return On Equity (ROE) 53.51% 51.63% 57.55%Return On Operating Assets (RNOA) 34.10% 44.39% 44.23%Net Operating Profit (NOPAT) 352.62 584.58 535.27 Tax On Operating Profit 371.13 68.98 89.25 Net Operating Assets (NOA) 1,033.96 1,316.85 1,210.15 Net Operating Profit Margin (NOPM) 12.28% 22.21% 19.71%Net Operating Asset Turnover (NOAT) 2.78 2.00 2.24 Net Nonoperating Expenses Percent (NNEP) N/A N/A N/ANonoperating Return N/A N/A N/ANoncontrolling Interest Ratio N/A N/A N/AReturn On Capital Employed (ROCE) N/A N/A N/ACurrent Ratio 2.38 2.80 2.73 Quick Ratio 1.71 1.93 2.02 Net Operating Working Capital N/A N/A N/ALiabilities to Equity Ratio 37.90% 33.33% 36.45%Return On Asset 7.61% 12.63% 11.68%
Earnings Per Share 2.78 1.88 3.12
Accounts Receivable Turnover 4.89 4.32 4.27 Inventory Turnover 3.15 3.17 3.24
Garmin

Exhibit 4 30
Exhibit 4
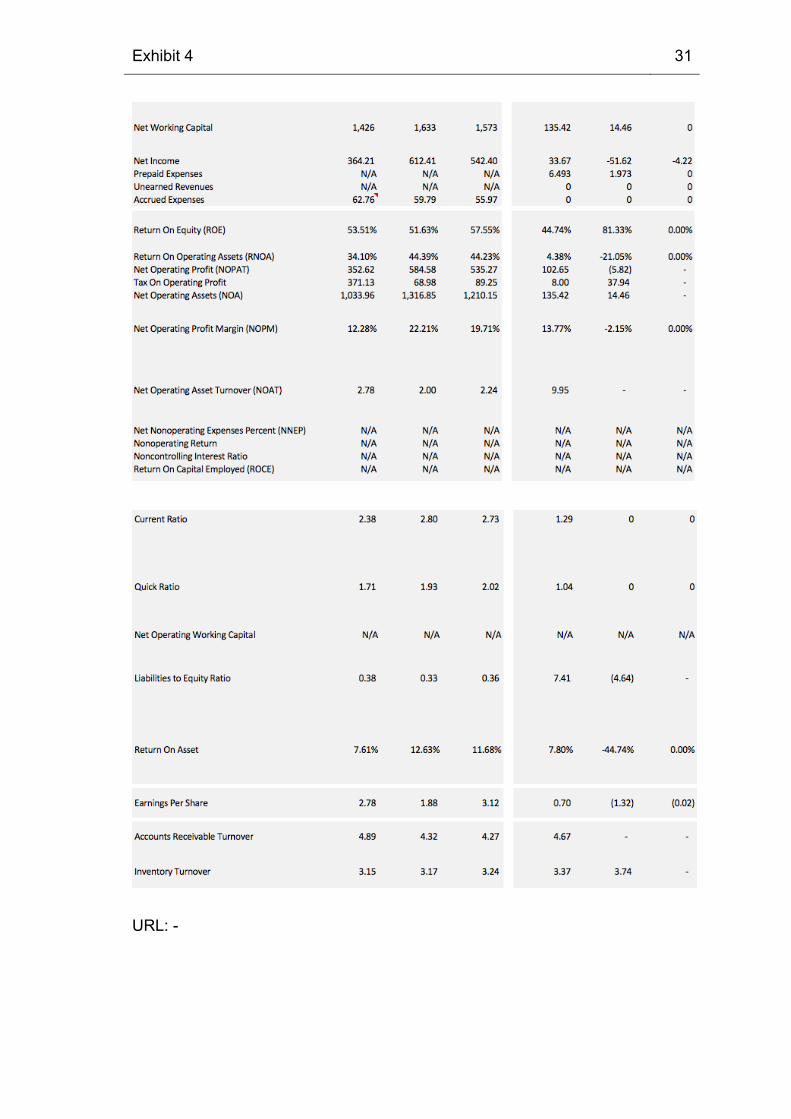
Exhibit 4 31
URL: -
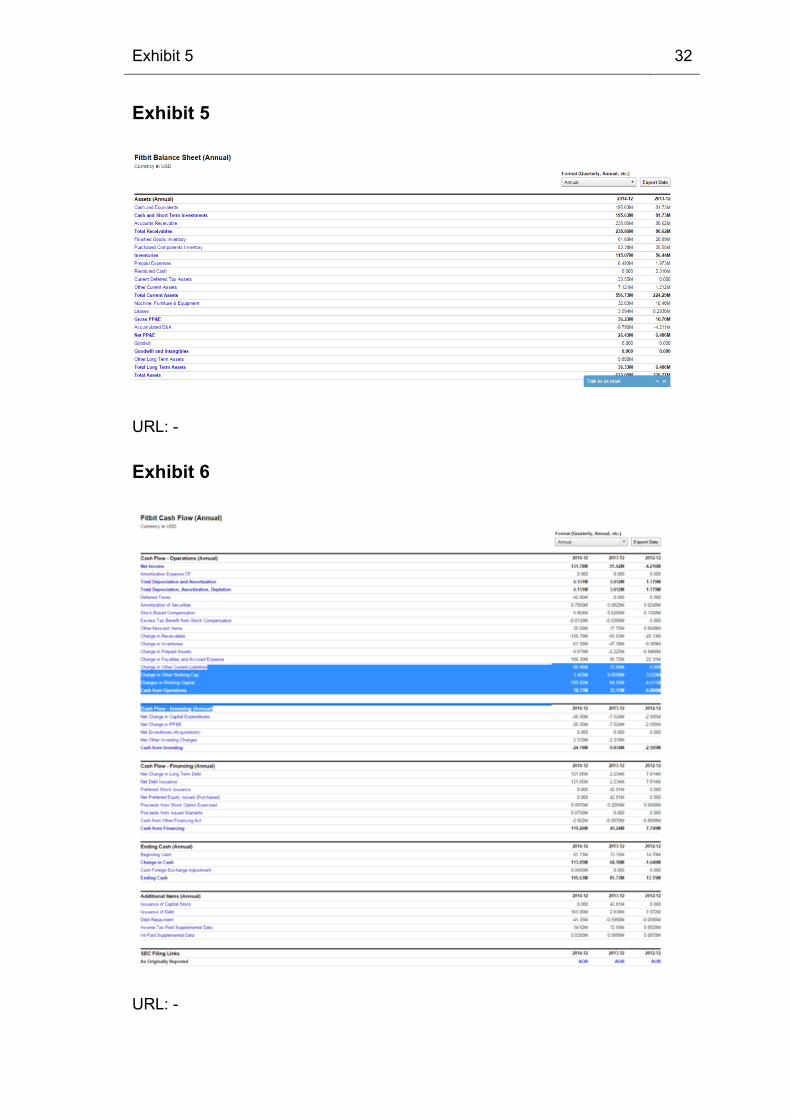
Exhibit 5 32
Exhibit 5
URL: -
Exhibit 6
URL: -
Exhibit 7 33
Exhibit 7
URL: -

Exhibit 8 34
Exhibit 8
URL: -

Exhibit 6 35
Exhibit 6
URL: -