
FINANCIAL ANALYSIS AND EVALUATION · 2019-10-30 · Financial Analysis and Evaluation Technical...
64
ASIAN DEVELOPMENT BANK FINANCIAL ANALYSIS AND EVALUATION TECHNICAL GUIDANCE NOTE OCTOBER 2019
Transcript of FINANCIAL ANALYSIS AND EVALUATION · 2019-10-30 · Financial Analysis and Evaluation Technical...

Financial Analysis and EvaluationTechnical Guidance Note
Financial analysis and evaluation of implementing and executing agencies (EAs/IAs) and projects are tools used by Asian Development Bank (ADB) for ensuring prudent use of its resources. This Technical Guidance Note (TGN) describes ADB’s requirements and good practices for fi nancial analysis and evaluation of sovereign projects, and identifi es measures for ensuring that ADB-supported investments are fi nancially viable and sustainable. In addition, this TGN provides a sound analytical framework for assessing whether Developing Member Countries’ (DMC) agencies are fi nancially capable of implementing an ADB project and operating and maintaining it in a fi nancially sustainable manner over the investment’s economic life.
In alignment with Strategy 2030 Operational Priority 6—Strengthening Governance and Institutional Capacity, robust fi nancial analysis and evaluation allows ADB and EAs/IAs to identify and agree actions for enhancing their fi nancial capacity, which contributes to strengthening DMC’s overall governance and institutional capacity.
About the Asian Development Bank
ADB is committed to achieving a prosperous, inclusive, resilient, and sustainable Asia and the Pacifi c, while sustaining its e� orts to eradicate extreme poverty. Established in 1966, it is owned by 68 members—49 from the region. Its main instruments for helping its developing member countries are policy dialogue, loans, equity investments, guarantees, grants, and technical assistance.
ASIAN DEVELOPMENT BANK6 ADB Avenue, Mandaluyong City1550 Metro Manila, Philippineswww.adb.org
ASIAN DEVELOPMENT BANK
FINANCIAL ANALYSIS AND EVALUATIONTECHNICAL GUIDANCE NOTE
OCTOBER 2019


ASIAN DEVELOPMENT BANK
FINANCIAL ANALYSIS AND EVALUATIONTECHNICAL GUIDANCE NOTE
OCTOBER 2019

Creative Commons Attribution 3.0 IGO license (CC BY 3.0 IGO)
© 2019 Asian Development Bank6 ADB Avenue, Mandaluyong City, 1550 Metro Manila, PhilippinesTel +63 2 632 4444; Fax +63 2 636 2444www.adb.org
Some rights reserved. Published in 2019.
ISBN 978-92-9261-820-9 (print), 978-92-9261-821-6 (electronic)Publication Stock No. TIM190489-2DOI: http://dx.doi.org/10.22617/TIM190489-2
The views expressed in this publication are those of the authors and do not necessarily reflect the views and policies of the Asian Development Bank (ADB) or its Board of Governors or the governments they represent.
ADB does not guarantee the accuracy of the data included in this publication and accepts no responsibility for any consequence of their use. The mention of specific companies or products of manufacturers does not imply that they are endorsed or recommended by ADB in preference to others of a similar nature that are not mentioned.
By making any designation of or reference to a particular territory or geographic area, or by using the term “country” in this document, ADB does not intend to make any judgments as to the legal or other status of any territory or area.
This work is available under the Creative Commons Attribution 3.0 IGO license (CC BY 3.0 IGO) https://creativecommons.org/licenses/by/3.0/igo/. By using the content of this publication, you agree to be bound by the terms of this license. For attribution, translations, adaptations, and permissions, please read the provisions and terms of use at https://www.adb.org/terms-use #openaccess.
This CC license does not apply to non-ADB copyright materials in this publication. If the material is attributed to another source, please contact the copyright owner or publisher of that source for permission to reproduce it. ADB cannot be held liable for any claims that arise as a result of your use of the material.
Please contact [email protected] if you have questions or comments with respect to content, or if you wish to obtain copyright permission for your intended use that does not fall within these terms, or for permission to use the ADB logo.
Corrigenda to ADB publications may be found at http://www.adb.org/publications/corrigenda.
Note:In this publication, “$” refers to United States dollars.
Cover design by Josef Ilumin.

CONTENTS
Tables iv
About This Publication v
Acknowledgments vii
Abbreviations viii
Executive Summary ix
I. Introduction 1
II. Policy Requirements 3
III. Financial Analysis 5
IV. Financial Cost–Benefit Evaluation 14
V. Financial Covenants 22
VI. Reporting and Monitoring 24
Appendix 1: Definitions 27
Appendix 2: Sector-Specific Considerations 31
Appendix 3: Basic Financial Statements 33
Appendix 4: Definitions of Financial Ratios 34
Appendix 5: Weighted Average Cost of Capital 37
Appendix 6: Risk and Sensitivity Analysis 41
Appendix 7: Financial Performance Indicators and Draft Covenants 46

TABLES
1 Fiscal Analysis of Operations and Maintenance Allocations 7
2 Present Value of Money 19
3 Calculating Net Present Value 20

ABOUT THIS PUBLICATION
This guidance note was issued to facilitate Asian Development Bank (ADB) staff and consultants as well as staff of executing agencies and/or implementing agencies in conducting the financial analysis and evaluation required during processing, implementation, change of scope, and completion of projects financed under sovereign-backed loans by ADB.
The following is a list of guidance materials on financial due diligence issued by the Procurement, Portfolio, and Financial Management Department, ADB and shows their applicability in the ADB project cycle.
Medium-Term Strategic Planning Processing Implementation Project
Closing
CPS COBP Concept Stage
Fact Finding
RRP Reporting PCR
Guidelines on the financial management and analysis of projects
Handbook for borrowers on the financial management and analysis of projects
Financial analysis and evaluation
Financial management assessment
Guidance on using the APFS checklist
about this PubliCation
This technical guidance note is one in a series issued to facilitate Asian Development Bank (ADB) staff, staff of the executing and implementing agencies, and consultants in conducting financial due diligence of ADB-supported projects.
the following is a list of guidance materials on financial due diligence issued by the Procurement, Portfolio, and Financial Management department, adb, and shows their applicability in the adb project cycle:
Guidance Material
Medium Term Strategic Planning Processing Implementation
Project Close
CPS CObPConcept
StageFact
Finding RRP PAM PCR
Guidelines on the financial management and analysis of projects
✔ ✔ ✔ ✔ ✔
Handbook for borrowers on the financial management and analysis of projects
✔ ✔ ✔ ✔ ✔
Financial analysis and evaluation ✔ ✔ ✔
Financial management assessment
✔ ✔ ✔
Guidance on using the apfs checklist ✔ ✔
Preparing cost estimates ✔ ✔ ✔
continued on next pagecontinued on next page

vi About This Publication
Medium-Term Strategic Planning Processing Implementation Project
Closing
CPS COBP Concept Stage
Fact Finding
RRP Reporting PCR
Preparing cost estimates
Project financial reporting and auditing
Preparing a country audit strategy
APFS = audited project financial statement, COBP = country operations business plan, CPS = country partnership strategy, PCR = project completion report, RRP = report and recommendation of the President.
ObjectiveThis guidance note is intended to assist readers by elaborating and explaining how to perform financial analysis and evaluation of ADB’s sovereign-financed projects.
Living DocumentThis guidance note is intended to be a living document and will be revised as required.
The ReaderReaders are expected to use this guidance note according to their needs. For consistency purposes, throughout the document, it is assumed that the reader is a professional, with basic financial knowledge, who is involved in activities financed in whole or in part by an ADB sovereign-backed loan or grant, or by ADB-administered funds.
FAQsFrequently asked questions, clarifications, examples, additional information, links to training, and other useful resources are available on the ADB website.
Legal and Order of PriorityIn the event of any discrepancy between this guidance note and legal agreements, the latter will prevail. The legal agreement governs the legal relationship between the borrower and ADB.
Table continued
About This Publicationvi
objectiveThis guidance note is intended to assist stakeholders by elaborating on and explaining ADB’s financial due diligence requirements for borrowers and grant recipients of financial intermediaries.
living documentThis guidance note is intended to be a living document and will be revised as required.
the reader In many circumstances, readers are expected to use this guidance note in a manner unique to their needs. For consistency throughout the guidance notes, the following assumption is made about the reader:
The reader is a professional involved in activities financed in whole or in part by an ADB loan or grant, or by ADB-administered funds.
FaQsFrequently asked questions, clarifications, examples, additional information, links to training, and other useful resources will be made available on the ADB website.
legal and order of PriorityIn the event of any discrepancy between this guidance note and legal agreements, the latter will prevail. The legal agreement governs the legal relationships between the borrower and ADB.
Guidance Material
Medium Term Strategic Planning Processing Implementation
Project Close
CPS CObPConcept
StageFact
Finding RRP PAM PCR
Project financial reporting and auditing
✔ ✔ ✔
Preparing a country audit strategy ✔ ✔
COBP=Country Operations Business Plan, CPS=country partnership strategy, PAM=project administration manual, PCR=project completion report, RRP=report and recommendation of the President.
Table continued

ACKNOWLEDGMENTS
This guidance note was drafted by a team of staff of the Public Financial Management division of the Procurement, Portfolio and Financial Management Department under the guidance of Public Financial Management division director Aman Trana. The core team is comprised of Srinivasan Janardanam, Maria Joao Kaizeler, Mocktar Adamou-Ndiaye, and Ashima Bali. Teresita L. Contreras and Cecilia Peralta provided administrative and secretarial support.
The team gratefully acknowledges the valuable technical inputs of M. C. Srikanth, consultant, in the drafting of this guidance note. Copyediting was done by Levi Lusterio; proofreading by Lawrence Casiraya; and layout, cover design, and typesetting by Principe Nicdao. Detailed comments received during interdepartmental review from departments of Central and West Asia; East Asia; South Asia; Southeast Asia; Pacific; Sustainable Development and Climate Change; Strategy, Policy, and Partnerships; Independent Evaluation; Economics Research and Regional Cooperation; Controllers; Office of General Counsel; and various sector and thematic groups are gratefully acknowledged.

ABBREVIATIONS
ADB – Asian Development Bank
DMC – developing member country
FIRR – financial internal rate of return
FNPV – financial net present value
GGSU – general government sector unit
LIBOR – London Interbank Offered Rate
OM – operations manual
O&M – operations and maintenance
RRP – report and recommendation of the President
TGN – technical guidance note
WACC – weighted average cost of capital

EXECUTIVE SUMMARY
The Agreement Establishing the Asian Development Bank (ADB) requires staff to “take the necessary measures to ensure that the proceeds of any loan made, guaranteed, or participated in by the bank are used only for the purposes for which the loan was granted and with due attention to considerations of economy and efficiency” (Article 14.11). It also states that staff “should pay due regard to the prospects that the borrower and its guarantor, if any, will be in a position to meet their obligations under the loan contract” (Article 14.6).
Project financial analysis and evaluation are key steps in the financial due diligence process to ensure that ADB operations comply with this mandate and contribute to the broad objectives of poverty reduction, inclusive economic growth, environmental sustainability, and regional integration.
ADB’s Strategy 2030 envisages that ADB will sustain its efforts to eradicate extreme poverty, and expand its vision to achieve a prosperous, inclusive, resilient, and sustainable Asia and the Pacific. One of the seven operational priorities is strengthening governance and institutional capacity.
Project financial analysis and evaluation is performed to ensure efficient allocation of limited ADB resources. By assessing whether the proposed project intervention is the best use of the scarce ADB funds, robust financial analysis and evaluation will contribute to the overall ADB objective of achieving a prosperous, inclusive, resilient, and sustainable Asia and the Pacific.
Financial analysis and evaluation are essential elements of the financial due diligence required to be performed for all project investment proposals. Financial analysis provides a sound analytical basis to conclude whether the executing agency and/or implementing agency is financially capable to implement the project, and operate and maintain it in a financially sustainable manner over the project’s economic life. Financial evaluation assesses the project’s inherent financial viability without any reliance on external support, and whether, during the operational phase, it will generate adequate cash resources for the project owner to operate and maintain the investment, and service the capital. A project that requires external support (e.g., viability gap funding or revenue subsidy) for operations and maintenance or capital servicing is not intrinsically viable and should be assessed for financial sustainability.
x Executive Summary
The process of financial analysis and evaluation may identify significant risks to project viability or sustainability. In such cases, suitable financial performance indicators need to be identified that can serve as early warning signals about the occurrence of potential risk events and incorporated as covenants in the legal agreements to be monitored throughout project implementation.
The conclusions from the financial analysis and evaluation process should be described succinctly in the report and recommendation of the President (RRP) along with the key risks and mitigation measures, with details in the financial analysis link document. The identified financial covenants should be incorporated in the legal agreements. The RRP should articulate the rationale to continue with a project where substantial or high risks to financial viability or sustainability are identified.
Emphasis should be on proactive implementation of risk mitigation measures monitored during implementation through regular project review missions, periodic progress reports, annual audited project and entity financial statements, and auditors’ opinions on compliance with covenants. At project completion, the financial analysis and evaluation should be updated to assess actual accomplishment against appraisal estimates. Any lessons learned or recommendations for future operations should be included in the project completion report.
Robust financial analysis and evaluation is an integral part of good project design and will help achieve Strategy 2030’s seven operational priorities across all sectors. These projects, if implemented as designed, will enhance the likelihood of a financially sustainable project that can achieve its intended development impact and deliver the designed services to the beneficiary population over the economic life.

I. Introduction
1.1 ADB’s Strategy 2030 envisages that ADB will sustain its efforts to eradicate extreme poverty, and expand its vision to achieve a prosperous, inclusive, resilient, and sustainable Asia and the Pacific.1 One of the seven operational priorities of Strategy 2030 is strengthening governance and institutional capacity to support developing member countries (DMC) improve governance and create an enabling environment for sustainable growth. Project financial analysis and evaluation are two key steps in the due diligence process to assess the capacity and sustainability of executing agencies and/or implementing agencies, ensure that ADB’s interventions will remain sustainable, and contribute to the broad objectives of poverty reduction, inclusive economic growth, environmental sustainability, and regional integration.
1.2 Financial analysis and evaluation of projects are two key steps in ADB’s due diligence process for ensuring prudent use of ADB’s resources and for identifying and mitigating risks to project and entity sustainability. ADB, as a financial institution with a development mandate, has a fiduciary responsibility to ensure that all investment projects it supports are subjected to the highest standards of financial due diligence so that their implementation complies with the requirements for economy and efficiency.
1.3 All sovereign project investment proposals supported by ADB need to be assessed for financial sustainability and economic viability.2 Both analyses are performed with the same objective—to assess whether the proposed project intervention is the best use of limited ADB resources. Economic analysis measures the impact of the project on the national economy, while financial analysis focuses on the adequacy of financial returns to the project owners and operators to allow sustainable operation of the project during its economic life.3 A financially unsustainable project is unlikely to deliver the anticipated economic benefits.
1.4 A project should only be considered by ADB as acceptable for investment if it is economically viable, and either (i) inherently financially viable without any external support or (ii) credible arrangements are in place for external financial support during its operational phase for its sustainable operation.
1 ADB. 2018. Strategy 2030: Achieving a Prosperous, Inclusive, Resilient, and Sustainable Asia and the Pacific. Manila.
2 For economic viability assessments, refer to the guidelines for economic analysis of projects (ADB. 2017. Guidelines for Economic Analysis of Projects. Manila).
3 Project owners own the project assets, while project operators are responsible for operation and service delivery. In some cases, ownership and operation are with different entities.

2 Financial Analysis and Evaluation
Financial analysis and evaluation are highly skilled tasks and should be performed by experienced finance professionals with thorough knowledge of the country, sector, and project.
1.5 Financial analysis and evaluation are required for all sovereign investment projects (whether loan- or grant-financed). These analyses help establish whether a project is intrinsically viable, i.e., has potential to generate sufficient internal cash resources to fully cover all costs, including debt service. Projects that are not intrinsically viable will need external support for operations and maintenance (O&M) and/or debt servicing to be sustainable. The extent and nature of the analysis varies with the financing modality and nature of the project.
1.6 This technical guidance note (TGN) provides guidance on how to perform financial analysis and evaluation of ADB’s sovereign investment projects.4 Based on the analysis, key financial performance indicators should be identified to serve as early warning signals about the occurrence of potential risk events and incorporated as covenants in the legal agreements to be monitored throughout project implementation. This TGN is for ADB’s staff and consultants, and for the staff of executing agencies and/or implementing agencies of ADB’s sovereign projects. Definitions of key concepts are listed in Appendix 1.
1.7 The financial analyst should obtain reliable information through a combination of desk research and field research. Initial preparation would include gathering existing information available from a variety of secondary sources—such as past ADB assessments, assessments by other development partners, information available from online financial data libraries, reports from the executing agency and/or implementing agency on existing projects, etc. This should be supplemented by field research that can include information obtained through consultants and directly from the executing agency and/or implementing agency through interviews, government budget records, etc. The financial specialist needs to exercise professional judgment in obtaining the information and assessing its credibility and consistency. Project teams should ensure that, at the time of project approval, they secure a full working model of the financial analysis and evaluation.5
1.8 Financial due diligence of ADB projects broadly comprises several interlinked activities. These include (i) financial management assessment; (ii) preparation of cost estimates and financing plan; (iii) financial analysis; (iv) financial evaluation; and (v) designing funds flow, accounting, and auditing requirements. Each of these aspects will affect the others (e.g., financial management capacity will affect all the other aspects of financial due diligence, cost estimates and financing plan affect financial viability, etc.). This TGN focuses on the activity of financial analysis and evaluation.
4 This TGN does not apply to ADB’s nonsovereign operations and to economic analysis of ADB’s projects.
5 As majority of financial analysis and evaluation work are performed by consultants, it is imperative the ADB project team hold full working models for supervision and revision during project implementation, changes of scope, and for reassessment at project completion.

II. Policy Requirements
2.1 The requirement for performing financial analysis and evaluation of ADB’s sovereign investment projects derives from three key provisions in the Agreement Establishing ADB (the Charter).6 Article 14 (vi) of the Charter provides that, in making or guaranteeing a loan, the bank shall pay due regard to the prospects that the borrower and the guarantor, if any, will be in a position to meet their obligations under the loan contract.7 Article 14 (xi) requires ADB to take necessary measures to ensure that the proceeds of any loan made, guaranteed, or participated in by ADB are used only for the purposes for which the loan was granted, and with due attention to considerations of economy and efficiency.
Moreover, Article 14 (xiv) of the Charter provides that ADB shall be guided by sound banking principles in its operations.
2.2 Operations Manual (OM) Section D11 governs the business processes for ADB’s sovereign operations and identifies financial due diligence as one of the key due diligence activities during project processing.8 OM G2 explains the purpose, requirements, and responsibilities for financial analysis, and where applicable, for financial evaluation of the project (or project components).9 Financial analysis is the transformation of financial data into a form that can be used to evaluate an entity’s historical financial position and performance and estimate its future status. Financial evaluation is the process of comparing the financial benefits of a project or a project component as indicated by the financial internal rate of return (FIRR) with the financial cost as indicated by the weighted average cost of capital (WACC). Sufficient analysis is to be performed to determine whether the project is financially viable and sustainable. The extent and nature of the analysis varies with the type of entity and financing modality.
2.3 The nature of the financial analysis to be performed depends on the nature of the executing agency and/or implementing agency. The objective of
6 ADB. 1966. Agreement Establishing the Asian Development Bank. Manila.7 DMC capacity may be assessed as part of higher-level country assessments (whether as
borrower or guarantor), which would set the country eligibility for receiving ADB loans and grants from ordinary capital resources, concessional loans, or grants. For borrowers other than DMCs, such assessments are usually part of project level assessments.
8 ADB. 2017. Operations Manual, Section D11–Sovereign Operations. Manila; ADB. 2014. Operations Manual, Section G2–Financial Management, Cost Estimates, Financial Analysis, and Financial Performance Indicators. Manila.
9 The scope of financial due diligence includes preparation of cost estimates and financing plan; financial management assessment; financial evaluation and analysis; developing funds flow, accounting, and auditing arrangements; and identifying financial covenants.
4 Financial Analysis and Evaluation
financial analysis is to assess the likelihood of effective operation of the entire network of assets managed by the executing agency and/or implementing agency including the ADB-supported project or project component, to deliver the intended volume and quality of services over the economic life.
2.4 Where the executing agency and/or implementing agency is a general government sector unit (GGSU), the financial analysis focuses on assessing whether it will have adequate cash resources to finance the recurrent costs of operating its overall network of assets including the ADB-supported project or project component.
2.5 Where the executing agency and/or implementing agency is a public corporation, a private sector corporation, or other nongovernment entity, a financial analysis of historical and projected financial statements of the executing agency is performed to establish the financial capacity of the executing agency and/or implementing agency to operate and maintain the network of assets and, if required, service the capital.10
2.6 A financial evaluation is required to assess financial viability in cases where a project or a project component is intended to recover all costs without any external support. The financial evaluation is performed in real terms at the project/component level, after excluding the impact of inflation, on an after-tax basis. This is required at the project/component level.
2.7 Financial covenants are incorporated in the legal agreements to mitigate risks to entity financial sustainability and/or project viability. The objective of such covenants is to provide early warning signals of deteriorating financial performance, thereby providing an opportunity for the government or other stakeholders to take prompt corrective action to prevent likely adverse impact on entity or project performance. The covenants should be timebound, measurable, and monitorable. Identification of suitable covenants should consider financial policies pertaining to the country, sector, project, and executing agencies and/or implementing agencies. Sufficient analysis should be performed to provide a reasonable basis to assume that they are achievable.
10 A GGSU is primarily engaged in nonmarket operations (examples are ministries and departments). Public or private corporations or nongovernment entities are created for producing goods or services for the market. Please refer to OM G2 for a more detailed description.
III. Financial Analysis
3.1 Most projects supported by ADB are subject to financial analysis as described in this TGN, with one exception. The financial analysis of policy-based loans is beyond the scope of this TGN, as it is based on fiscal assessment of government finances and usually performed by public financial management experts. For all other projects, including results-based lending, the extent and nature of the financial analysis is determined by the nature of the project, the sector, and the executing agency and/or implementing agency. For projects under a project readiness facility, limited financial analysis may be required if the executing agency and/or implementing agency is not a GGSU, to establish the capacity of the executing agency and/or implementing agency to repay the readiness loan.11
3.2 Financial analysis should be performed for the entire network of assets managed by the executing agency and/or implementing agency. This analysis should assess the capacity of the executing agency and/or implementing agency to finance the total recurrent costs to operate and maintain the entire network of assets to deliver the designed quality and quantity of services, including the ADB-supported project or project components. Financial analysis of an executing agency and/or implementing agency is carried out to obtain reasonable comfort that it has adequate financial capability to implement, operate, and maintain the ADB-supported project in addition to its existing operations and deliver the full range of network services. The analysis may need to be extended beyond the executing agency and/or implementing agency to include the government fiscal capacity as well. Appendix 2 presents sector-specific considerations on financial analysis of major sectors and subsectors in which ADB operates.
3.3 The financial analysis should be performed in nominal terms in the presentation currency, and not in the loan currency.12 Financial statements are usually presented in the principal currency in which the executing agency and/or implementing agency earns and incurs all its revenues and costs, which is defined as the “presentation currency” in both the International Financial Reporting Standards
11 Where a project readiness facility or PRF loan does not lead to an ensuing investment project, the executing agency and/or implementing agency will need to repay the PRF loan from its general resources.
12 Presenting the financial analysis in the loan currency would be misleading, as it makes an implicit (and incorrect) assumption that all revenues and costs will move in line with exchange rate movements. In some countries, particularly in the Pacific region, the financial statements are presented in Australian or New Zealand dollars. In such cases, the presentation currency would be A$ or NZ$.

6 Financial Analysis and Evaluation
and International Public Sector Accounting Standards.13 The presentation currency would be the national currency in most cases.
3.4 The nature of the financial analysis to be performed depends on the nature of the executing agency and/or implementing agency. There are two broad methods for conducting financial analysis: (i) incremental recurrent cost analysis and (ii) financial statement analysis. Where the executing agency and/or implementing agency is a GGSU, the financial analysis involves assessing whether it will have adequate cash resources to finance incremental recurrent costs.14 Where the executing agency and/or implementing agency is a public corporation, or a private sector or other nongovernmental entity, the financial analysis is based on an analysis of historical and projected financial statements.15
A. Incremental Recurrent Cost Analysis
3.5 The incremental recurrent cost analysis consists of estimating the projected recurrent cost requirements to operate and maintain the total network of assets managed by the executing agency and/or implementing agency, including the incremental requirements arising from the ADB-supported project and the capacity of the executing agency and/or implementing agency to finance it from its budget appropriation. GGSUs are not responsible for debt service and are usually required to transmit all revenue collections to the national Treasury. They depend on budgetary appropriations to operate and maintain their network and deliver services (including the ADB-supported project). The focus is on the unconstrained network recurrent cost requirements, and the budget allocation and execution capacity of the executing agency and/or implementing agency. Projections should be prepared for the duration of project implementation, and for another 3 to 5 years, or until the project attains full capacity, whichever comes earlier.
3.6 GGSUs should make their budget requests based on the unconstrained network-level O&M requirements. Unconstrained network recurrent costs are those that are required, based on technical or normative requirements pertaining to the network, to operate and maintain the network for optimum service delivery over its economic life. The quality and credibility of unconstrained network O&M cost estimation is improved if the executing agency and/or implementing agency has an Asset Management System. Such a system documents the asset location,
13 Issued by the International Financial Reporting Standards Foundation, and the International Public Sector Accounting Standards Board, respectively.
14 Recurrent costs refer to the regular operating costs that an entity incurs to operate and/or maintain an asset. These costs may either be variable, such as electricity or water or heating or cooling costs, consumables, etc.; or fixed, such as staff salaries, office rentals, and other establishment costs.
15 Where an entity is a group consisting of a holding company and one or more subsidiaries, the consolidated financial position of the group should be assessed.

Financial Analysis 7
age, physical condition, historical O&M, and recommended O&M, and can help provide objective estimates of O&M requirements and asset replacements. Budget appropriation may be lower due to fiscal constraints, and budget utilization or execution needs to be compared with the unconstrained requirement to establish the level of funding of unconstrained O&M requirements.
3.7 The analysis should compare the unconstrained network O&M requirements with budget allocation and execution. It is a fallacy to compare the incremental recurrent cost requirement for the ADB-supported project as a percentage of the total O&M budget requirement of the entity to assess likelihood of availability. Given the small size of the project’s incremental recurrent cost relative to the total network recurrent cost, in such cases the inevitable (and possibly fallacious) conclusion would be that the small percentage of increase in budget needs is likely to be met. Executing agencies and/or implementing agencies are always allocated a consolidated budget for the entire network that they manage, and it is unreasonable to expect that the ADB-supported project would be fully funded for O&M, while other parts of the same network remain underfunded.
3.8 To establish financial sustainability, the projected budget requirements, including the ADB project, should be compared with the projected budget allocation and execution. A simplified example of fiscal analysis is in Table 1.
Table 1: Fiscal Analysis of Operations and Maintenance Allocations (local currency million)
Item
Year 1 without ADB
project
Year 2 with ADB
projectDifference
(%)
Unconstrained O&M requirement 1,000 1,100 10.00
Allocation 800 825 3.12
Utilization or execution 700 750 5.00
O&M shortfall (to unconstrained requirement)
30% 32%
Other information
Increase in budget 3.12%
Annual inflation 5.00%
Inflation-linked increase in O&M requirement for existing network in Year 2 (A)
50
Incremental requirement for ADB project in Year 2 (B) 50
Total increase in O&M requirement in Year 2 (A + B) 100
ADB = Asian Development Bank, O&M = operations and maintenance.Source: Asian Development Bank.

8 Financial Analysis and Evaluation
3.9 Inadequate O&M of the network leads to progressive build-up of a maintenance backlog, and could shorten the economic life of the network compared to the design life. As can be seen from Table 1, the historical execution shortfall against the unconstrained O&M requirement in the base year is 30% (1 – [700/1,000]). In Year 2, in the “with project” scenario, the unconstrained O&M requirement increases by 100, but the budget allocation is increased by only 25, which is lower than the inflation-induced requirement. The execution shortfall increases from 30% (1 – [700/1,000]) to 32% (1 – [750/1,100]). Though the ADB project requires only 4.5% (50/1,100) of the unconstrained O&M requirement, allocation is 25% lower (1 – [825/1,100]), and the execution of 32% (1 – [750/1,100]) is even lower. In this scenario, the available evidence indicates that O&M of the ADB project may not be fully funded and/or executed, which adversely affects the likely sustainability of the ADB project.
3.10 In some cases, the project facilities may be developed by one agency, but transferred to a different agency for O&M. In such a case, the analysis needs to focus on the agency that will be responsible for O&M. If more than one agency should have responsibility for O&M, the analysis should consider all such agencies.
3.11 Financial analysis must be performed before an investment decision is made and correct level of risk must be highlighted. When the analysis concludes that the GGSU is unlikely to receive adequate resources to meet its unconstrained network O&M requirements, the project sustainability is exposed to substantial risk. This will guide the project team to policy dialogue with the government to identify measures to address this risk. The risk, together with the proposed mitigation measures, needs to be disclosed in the due diligence section of the report and recommendation of the President (RRP), the summary of risks table in the RRP, and in the risk assessment and risk management plan. The RRP should clearly justify the decision to continue with the project despite the sustainability risk.16 Covenants may be developed and incorporated into the legal agreements to mitigate such risks and should be monitored for compliance during implementation.
B. Financial Statements Analysis
3.12 Where the executing agency and/or implementing agency is a public or private corporation, or a nongovernment organization, the financial analysis takes the form of financial statements analysis. Such entities present the results of their financial activities in three key financial statements: balance sheet/statement of financial position, income statement, and cash flow statement. The information presented in these financial statements needs to be analyzed to assess whether the entity is financially capable to implement the project, operate and maintain its total
16 ADB may invest in an economically feasible project and identify ways to achieve entity financial sustainability even if the project is not financially viable. Failure to achieve this could pose serious risk to the overarching objective of achieving development impact.

Financial Analysis 9
network of assets including the project assets, and continue as a going concern.17, 18
A brief description of each of the financial statements is in Appendix 3.
3.13 The financial statements of the executing agency and/or implementing agency need to be analyzed and cover both the historical and projected financial performance of the entity. A financial model, comprising historical and projected financial statements, should be prepared to assess the impact of the proposed project on the entity’s financial performance and financial position.19
3.14 The historical financial performance should be analyzed to assess the current financial state of the entity. The analysis should include an analysis of significant movements in the entity’s financial position and operation to identify any trends. The period for which the review is conducted depends on the country, sector, and institutional context.20 At least 3 years of audited financial statements should be reviewed, depending on the circumstances.21 Where the entity has been in operation for less than 3 years, the available financial statements should be reviewed from the date of its formation. Professional judgment is required in selecting the historical review period, which may extend to 5 or even more years to cover an entire economic cycle. The review should consider the financial reporting and auditing standards applied and the findings in audit reports.22
3.15 Financial performance is affected by many factors, such as corporate governance; management strategies; changes in shareholders or management; management actions; industry position; competition; price elasticity; quality of technology; government subsidy and budget allocation; regulations; political interference; and force majeure events such as likelihood and impact of drought, extreme weather conditions, and flooding. Additional research would be required, including review of other materials such as business plan, credit rating reports, investor reports, and other investigations as may be warranted under the circumstances. Operating and financial performance metrics and financial ratios are used to compare the performance against benchmarks or peer companies in the same sector, or similar projects.
17 An entity is assumed to continue as a going concern if it is expected to continue in business for the foreseeable future.
18 The Introduction to Fundamental Analysis by Investopedia may be used as guide when conducting financial statement analysis. https://www.investopedia.com/fundamental-analysis-4689757.
19 For entities newly formed as part of the ADB project, a historical analysis cannot be performed, and only projected financial performance can be analyzed based on a business plan.
20 Where the entity presents a consolidated financial statement, it should be analyzed. If the entity is a controlled entity, the impact of support from the controlling entity (or the need to provide support to other entities in the group) should be taken into consideration.
21 In rare cases, audited financial statements may not be available. In such instances, the unaudited statements should be used for the analysis, while recognizing the risks of not having an audit review.
22 Where the audit opinion is not clean, or where the financial reporting and auditing standards used are other than the international standards, the analyst shall consider the impact of such elements on the relevance and reliability of the financial statements for the use during financial performance analysis.

10 Financial Analysis and Evaluation
3.16 The projected financial statements should reflect the financial impact of the project on the entity. The projected financial performance of the entity should cover at least 3 to 5 years beyond the implementation of the ADB-financed project, or until the project attains full capacity or enters a steady state, whichever is earlier.23 The business plan of the entity should be the basis for such projections. The projections will reflect the impact of the entity’s anticipated market developments for the whole business (and not just the ADB project), management strategy, plans for capacity expansion, investment, borrowing, and additional equity infusion. The financial projections need to be updated at project completion, or after any material change in the project scope to assess and reconfirm financial sustainability.
3.17 The underlying management assumptions and estimates for financial projections should be validated for reasonableness and likelihood of achievement. The quality of the assumptions has a material impact on the result of the financial analysis. Key assumptions include economic life, depreciation rate, level of borrowings and the cost, repayment structure, funding sources, capital investment plans, growth rates, supply and demand assessments, etc. The analyst shall employ various tools and reliable information, including but not limited to, relevant market data generated by economists, financial analysts, public and private research organizations, published industry averages, previous examples, or consult with the Public Financial Management division for necessary guidance and referrals.
3.18 The approach to forecasting is centered on the income statement and cash flow statement. The income statement should be projected starting with historical data, with assumptions regarding future revenue and expenditure items with adequate granularity. The potential impact of foreign exchange, tax, and interest rate fluctuations needs to be considered.
3.19 The cash flows are divided into three components: (i) cash flow from operations, which is derived from the net income after taxes (indirect method) adjusted for noncash transactions and movements in working capital; (ii) investment cash flow; and (iii) financing cash flows. Assumptions are required for the behavior of many variables such as additional equity or grant receipts, additional borrowings (with tenor and costs), dividend payment policy, investment and asset replacement requirements, turnover of accounts receivable and payable, inventory turnover, etc.
3.20 Several methods are available for conducting financial analysis. The following examples may be used in isolation or in combination with other methods:
(i) Common-size analysis—comparing the behavior of one financial parameter against a base parameter or variable. This analysis allows analysts to spot trends over time and against peers.
23 For financial intermediation loans that comprise onlending directly to subborrowers or through other financial intermediaries, the analysis may be limited to the implementation period of the ADB loan.

Financial Analysis 11
(ii) Comparative ratio analysis—use of financial ratios and variance analysis to compare movements from one period to another.
(iii) Peer comparison—comparing performance of the entity against entity/entities in the same sector or entities of similar nature or size.
(iv) Benchmarking—comparing performance of the entity against industry norms.
3.21 Financial ratios are helpful in analyzing financial data of entities and identify correlations between different financial variables. Refer to Appendix 4 for an illustrative list of commonly used financial ratios. The broad categories of financial ratios are:
(i) Operating performance ratio—evaluates how efficiently and effectively a company is using its resources to generate sales and increase shareholder value. The better these ratios are, the better it is for shareholders.
(ii) Profitability ratios—assess the entity’s ability to generate earnings as compared to its expenses and other costs incurred during the reporting or projection period.
(iii) Debt ratios—measure the capital structure of the entity and help assess if the capital structure is optimal given the industry. If the debt ratio exceeds the industry average or the optimal structure for the entity, it would be indicative of higher financial risk.
(iv) Solvency ratios—show whether the entity’s cash flow is sufficient to meet its debt service obligations for long-term liabilities. The lower a company’s solvency ratio, the greater the risk that it may be unable to meet its long-term debt service obligations in a timely manner.
(v) Liquidity ratios—determine an entity’s ability to meet its short-term obligations in the ordinary course of business.
3.22 Financial analysis reveals trends in ratios over the historical and the projected period, which can identify potential financial weaknesses and strengths. An entity’s financial capacity can be assessed by its ability to match or exceed the benchmark or threshold set for various financial ratios. This threshold can be set at market or industry acceptable levels, or can be entity-specific and thus different from the market standards. However, industry norms and good practices help define a standard among similar entities and projects, especially with the selection of financial ratios and the assignment of threshold. Ratio analysis requires a high degree of professional judgment coupled with experience and knowledge of the sector and country.
3.23 Key nonfinancial performance indicators that vary by sector should also be considered. For example, electricity sector projects require an assessment of the commercial and technical losses and water sector projects require an

12 Financial Analysis and Evaluation
assessment of the nonrevenue water. Reasonable assumptions need to be made regarding the movement of these critical indicators, as these have implications for future capital investments and institutional financial performance and sustainability. The indicators should be benchmarked to industry norms, and with historical performance.
3.24 Entities must incorporate mechanisms to identify, manage, and mitigate financial risks. The financial analysis of an entity is modeled based on the most likely scenario (the base case). Key factors that could adversely affect the financial performance or position of the entity should be identified along with their probability of occurrence and severity of impact. This could include, for instance, lower demand, inadequate and/or delayed tariff revisions, higher capital costs, lower than anticipated efficiency improvements, etc. The base case financial model should be revised to assess the impact of the occurrence of such risks that have a higher impact or probability of occurrence and to establish the degree of vulnerability of the entity.
3.25 A risk mitigation plan should be developed for major adverse contingencies that have a high probability of occurrence and monitored actively during implementation. This includes designing suitable financial covenants that serve as early warning signals to trigger mitigation actions including policy dialogue. The following are the steps in risk and sensitivity analysis:
(i) identify risk events or risk factors,(ii) determine severity of impact and probability of occurrence,(iii) incorporate the impact into the projected financial statements,(iv) recalculate the ratios and other operating and financial
performance indicators, and(v) summarize results and identify mitigating actions.
3.26 Even though a project may be viable, the entity may be financially unsustainable. For instance, it may have
(i) liquidity pressure, (i) weak capitalization, (i) unprofitable business segments that require cross-subsidy, (i) high existing financial obligations, or (ii) delays or nonreceipt of promised compensation from the
government.
Such financial weaknesses may undermine the capacity of the entity to operate and maintain its overall network, which will also affect the sustainability of the ADB-supported project. To address such an eventuality, the financial due diligence may extend to the development of a suitable financial restructuring plan and its implementation, either as part of the ADB-supported project or by the government subject to mutual agreement.

Financial Analysis 13
3.27 In the case of some projects, the revenue generated from the operations is found to be insufficient for effective O&M, or insufficient for debt service (e.g., many water supply or wastewater projects). In these cases, and where the financing gap needs to be funded, at least in part, through transfers from the government, a fiscal analysis of the appropriate level of government will be needed to establish the likelihood of adequate funding. This will focus on the historical allocations to the project operating entities, the vision and policy of the government for the sector, the size of the transfers expected from the government, the fiscal deficit as a proportion of the gross domestic product, etc. As this may be beyond the expertise of the financial analyst, advice of the country economist or project economist should be sought.

IV. Financial Cost–Benefit Evaluation
4.1 Where a project or a project component is intended to recover all costs without external support, financial evaluation is required to assess the financial viability of the project. For financial intermediary loans, the financial evaluation would usually be a subproject selection criterion. For results-based lending, a financial evaluation is not expected to be performed, unless there are specific reasons.
4.2 Cost recovery should not be dependent on any unpredictable subsidy or external support, including annual or other legislative appropriations, or any other grants from the government. The project or project component must recover costs through user charges; through improved efficiency leading to lower costs; or through other predictable revenue sources (e.g., earmarked taxes, legislated universal service obligation payments, viability gap financing under public–private partnership concession agreements,24 feed-in tariffs).25 Subsidies or other external support may have a degree of unpredictability, as they are subject to the discretion of the legislature or government and not usually vested as a matter of right (like a tariff).
4.3 For projects or components that depend on subsidies or other external support through annual legislative appropriations or discretionary grants from government, an entity level financial analysis needs to be performed, focusing on adequacy of resources for full O&M of the entity’s network of assets including the ADB-supported component to deliver intended services and debt service (if required) as described in Section 3.
4.4 The cost–benefit evaluation is a discounted cash flow analysis performed in real terms on an after-tax basis in the presentation currency.26 The cash flows over the economic life of the project should be estimated in the presentation currency of the executing agency and/or implementing agency,
24 In public–private partnership arrangements, it is sometimes the case that the government guarantees to bridge the gap between resources generated from the project and the amount required by the concessionaire for financial viability. This payment is called viability gap financing.
25 Even feed-in tariffs intended to provide support for nascent technologies (e.g., concentrated solar power) are not entirely predictable. There are examples in Europe where governments, unable to fund the feed-in tariff payments, retroactively amended the rules to withdraw the feed-in tariff or introduce new rules on life-of-project internal rate of returns.
26 Real cost is the price of a good or service (including taxes) minus the effect of general inflation, thereby providing true price of the good or service. Typically, the nominal cash flows identified in the financial analysis are discounted with the inflation factor to derive the real values.

Financial Cost–Benefit Evaluation 15
which will usually be the national currency in which the executing agency and/or implementing agency earns and incurs the major portion of its revenues and costs. Where some of the cash flows occur in currencies other than the presentation currency, the assumptions pertaining to exchange rates used for converting such foreign currency cash flows to the presentation currency should be stated.
4.5 The usual economic life of projects ranges from 15 years to as much as 40 years, or even longer. For purposes of ADB’s financial evaluation, cash flows for at least 15 years of operation should be projected. The residual value of the investment estimated at the end of 15 years should be treated as a cash inflow.27 This can be broken down into the following steps:
(i) preparation of project cost estimates;(ii) forecasting incremental project net cash flows;28
(iii) determining the appropriate discount rate, usually the weighted average cost of capital (WACC);
(iv) calculating the financial net present value (FNPV) at the WACC and the financial internal rate of return (FIRR), the discount rate at which FNPV is equal to zero; and
(v) undertaking risk and sensitivity analysis.
4.6 The real value of future cash flows is computed by eliminating the impact of inflation. Nominal prices (also referred to as current prices) always include the impact of general price inflation, and real prices (also referred to as constant prices) are derived from nominal prices by removing this impact.29 Real value of cash flows are expressed as of a particular base year by removing the impact of inflation from the nominal value of cash flows in future years. For example, if the operating cost in 2015 was $100,000 for a given activity level, and the general price inflation was 3% per annum, the nominal operating cost in 2019 will be $112,550 for the same activity level (inflation of 3% per annum compounded for 4 years) due to the impact of inflation. However, the real operating cost, expressed in 2015 prices, does not change—it is still $100,000. Mathematically, the relationship between real and nominal prices can be expressed as follows:
Where Pr = real price; Pnt = nominal price in time interval “t”; i = general inflation rate in percentage; and t = time interval.
27 The residual value of an asset is the estimated amount that an entity would currently obtain from disposal of the asset, after deducting the estimated costs of disposal, if the asset were already of the age and in the condition expected at the end of its useful life
28 Typically, the nominal cash flows from financial analysis are converted into real cash flows by eliminating the impact of inflation.
29 Refer to Appendix 2 of the Guidelines for Economic Analysis of Projects for more guidance on the concept of real and nominal prices. ADB. 2017. Guidelines for the Economic Analysis of Projects. Manila.
(1 )t
PntPri
=+
16 Financial Analysis and Evaluation
A. Preparation of Project Cost Estimates
4.7 Project cost estimates should be prepared during the project processing stage with sufficient detail to enable the user to understand the principal project cost components and enable efficient project cost control during implementation.30 Cost estimates comprise of three parts: (i) base cost including taxes; (ii) physical, price, and other contingencies; and (iii) financial charges during implementation. Only the base cost including taxes and physical contingencies are considered in the cost–benefit evaluation, and the remaining cost components are not considered.31
B. Forecasting Incremental Project Net Cash Flows
4.8 Project cash flows comprise inflows and outflows expressed in real terms. The net cash flow is the difference between inflows and outflows.
(i) Where there is an increase or addition to the existing network of assets, the project is incremental in nature (e.g., expansion of an electricity distribution network). Incremental cash flows represent the difference between “with project” and “without project” scenarios.
(ii) For new projects, the entire cash flow will be incremental.(iii) For replacement projects, the cash flows will be incremental, after
setting off any disposal costs of the existing facilities, and any retraining of staff.
4.9 Cash inflows include revenue tariff and other sources, and cost rebates due to improved processes or more efficient equipment or system design.
4.10 Cash outflows include all costs incurred to construct (including physical contingencies), operate, and maintain the project facilities over the projected economic life.32 All taxes applicable to the project such as taxes on imports, value added taxes, goods and services tax, or similar should be included. Taxes payable on earnings (income tax or its equivalent) should be computed based on operating incomes (i.e., after depreciation but without considering the financial charges) in nominal terms and converted into real terms by discounting with the inflation factor.
30 ADB. 2014. Technical Guidance Note for Preparation and Presentation of Cost Estimates. Manila.31 Being in real terms, the price contingency is excluded. At the project level, FIRR is computed
and compared with the project WACC, financial charges are excluded from the financial evaluation.
32 As this is an analysis in real terms, price contingencies are excluded.
Financial Cost–Benefit Evaluation 17
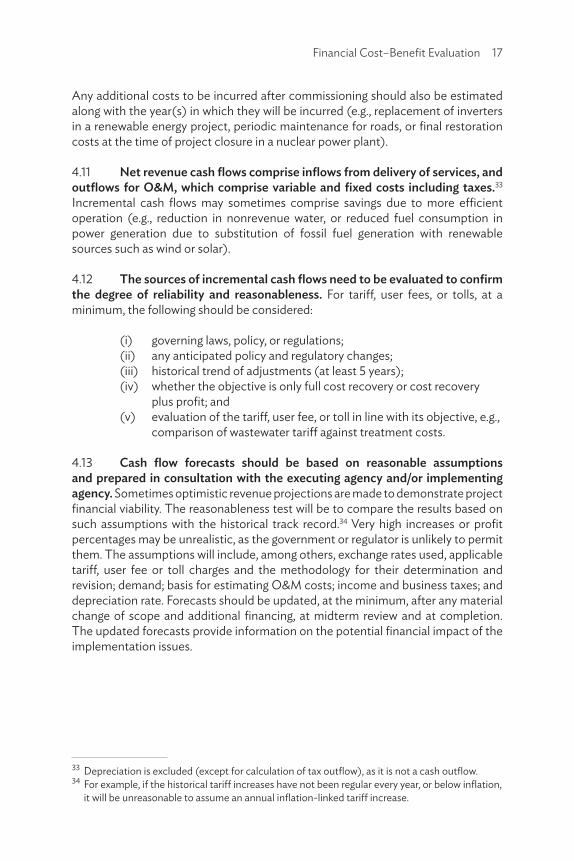
Any additional costs to be incurred after commissioning should also be estimated along with the year(s) in which they will be incurred (e.g., replacement of inverters in a renewable energy project, periodic maintenance for roads, or final restoration costs at the time of project closure in a nuclear power plant).
4.11 Net revenue cash flows comprise inflows from delivery of services, and outflows for O&M, which comprise variable and fixed costs including taxes.33 Incremental cash flows may sometimes comprise savings due to more efficient operation (e.g., reduction in nonrevenue water, or reduced fuel consumption in power generation due to substitution of fossil fuel generation with renewable sources such as wind or solar).
4.12 The sources of incremental cash flows need to be evaluated to confirm the degree of reliability and reasonableness. For tariff, user fees, or tolls, at a minimum, the following should be considered:
(i) governing laws, policy, or regulations;(ii) any anticipated policy and regulatory changes;(iii) historical trend of adjustments (at least 5 years);(iv) whether the objective is only full cost recovery or cost recovery
plus profit; and(v) evaluation of the tariff, user fee, or toll in line with its objective, e.g.,
comparison of wastewater tariff against treatment costs.
4.13 Cash flow forecasts should be based on reasonable assumptions and prepared in consultation with the executing agency and/or implementing agency. Sometimes optimistic revenue projections are made to demonstrate project financial viability. The reasonableness test will be to compare the results based on such assumptions with the historical track record.34 Very high increases or profit percentages may be unrealistic, as the government or regulator is unlikely to permit them. The assumptions will include, among others, exchange rates used, applicable tariff, user fee or toll charges and the methodology for their determination and revision; demand; basis for estimating O&M costs; income and business taxes; and depreciation rate. Forecasts should be updated, at the minimum, after any material change of scope and additional financing, at midterm review and at completion. The updated forecasts provide information on the potential financial impact of the implementation issues.
33 Depreciation is excluded (except for calculation of tax outflow), as it is not a cash outflow.34 For example, if the historical tariff increases have not been regular every year, or below inflation,
it will be unreasonable to assume an annual inflation-linked tariff increase.

18 Financial Analysis and Evaluation
C. Determining the Discount Rate
4.14 The WACC is the cost at which the project financing will be secured. WACC is used as the discount rate to estimate the FNPV of the project cash flows. The WACC is based on the financing plan for the project and computed only for the project sources of financing, and not for the entity.
4.15 There are many principles for estimating the cost of different sources of financing. The main principles are discussed briefly as follows, and more details are provided in Appendix 5.
• Debt with fixed interest rates. Fixed interest rate remains unchanged for the life of the debt, irrespective of market conditions (e.g., loans from ADB’s concessional resources). The cost of debt will include the interest, service charges, commitment fees, front-end fees, maturity premium, and any other charges, as defined in the debt contract.
• Debt with variable interest rates. Variable interest rates respond to market movements and change during the life of the debt (e.g., ADB’s flagship loan product is presently linked to the 6-month London Interbank Offered Rate (LIBOR)). A fixed swap rate for the corresponding tenor should be considered. The LIBOR fixed swap rate corresponding to the average maturity of the project loan can be taken as a proxy for the likely average cost over the life of the loan. If the exact tenor is not published by the Treasury, the project team may apply the nearest period for which a rate is available or seek assistance from the Treasury to obtain the relevant rate. The indicative LIBOR fixed swap rate published by ADB’s Treasury Department should be adjusted for lending spreads and other charges.35
• Equity. Unlike debt, the cost of equity is not explicit. Equity is risk capital that absorbs all losses, and its cost should represent the opportunity cost of capital for the government or other equity investor.36 As most borrowing DMCs run a fiscal deficit, they need to borrow to invest in capital projects. Hence, all government financing (equity or grant) is at a cost, which cannot be less than the government’s cost of borrowing, adjusted for tenor of investment and a premium for the risks associated with the project.
o For fully government-owned projects, a proxy can be the comparable interest rate for highly liquid government bonds (e.g., 10-year treasury bonds), which is the risk-free rate, adjusted for tenor and project risks.
35 Refer to https://www.adb.org/site/public-sector-financing/indicative-rates-libor-based-loans.36 Project teams may also seek the advice of ADB’s Office of Risk Management in assessing the
cost of equity.

Financial Cost–Benefit Evaluation 19
o For projects that are implemented with private sector participation (e.g., public–private partnerships), the cost of equity needs to be assessed based on market considerations, since the investors will have several investment options.
o Grants also have an opportunity cost. While the equity has an expectation of returns, no such expectation can be attributed to grant funds. For this reason, the cost of grant funds can be estimated as equal to the comparable interest rate for highly liquid government bonds (e.g., 10-year treasury bonds) adjusted for project tenor, without any adjustment for project risks.
D. Calculating the Financial Net Present Value and the Financial Internal Rate of Return
4.16 FNPV is the difference between the present value of cash inflows and outflows over the projection period. The cash flows for a project comprise capital costs; operational revenue; operational expenditure; and additional investments in working capital (e.g., inventory, accounts receivable and payable). Financial charges and noncash transactions, such as depreciation, are to be excluded. All forecasted cash flows generated over different time horizons are discounted at the WACC to the present time when the analysis is being performed to eliminate the time value of money. The discounted value is more commonly known as the present value. The sum of all these annual present values of cash flows is the FNPV. Table 2 illustrates the methodology for computing the present value of money.
Table 2: Present Value of Money
DetailsYear 1
(t1)Year 2
(t2)Year 3
(t3)
Amount invested at the beginning of the year (t0) 100 110 121
Interest rate 10% 10% 10%
Value after 1 year 110 121 133
Present value at t0 of 110 that will be received in year 1 100 – –
Present value at t0 of 121 that will be received in year 2 100 – –
Present value at t0 of 133 that will be received in year 3 100
Source: Asian Development Bank.

20 Financial Analysis and Evaluation
4.17 In mathematical notation, the FNPV formula is expressed as:
Where: Co = initial investment, Ct = net cash flow in time period t, r = discount rate and t = time. FNPV may be calculated manually using this formula or using the Excel function “NPV.”
Table 3 shows an example of FNPV calculated manually.
Table 3: Calculating Net Present Value
20X0 20X1 20X2 20X3 20X4
Item Outflow Outflow Inflow Inflow Inflow
Annual projected net cash flows –200 –150 +75 +100 +300
Discount rate (10%) 1.10 1.11 1.12 1.13 1.14
PV of annual net cash flows –200.00 –136.36 +61.98 +75.13 +204.90
FNPV (sum of all PVs) +5.14
FNPV = financial net present value, PV = present value.Source: Asian Development Bank.
4.18 FIRR is the discount rate at which the FNPV becomes 0. The mathematical notation for FIRR is . Unlike FNPV, this cannot be calculated manually given the complexity and iterative nature of the computation. FIRR is best calculated using the Excel function “IRR.”
4.19 A project is financially viable if its FNPV discounted at the WACC is positive, and the FIRR is greater than the WACC. A positive FNPV indicates an investment which generates sufficient incremental cash flows to recover its costs (excluding debt service). If the FIRR exceeds the WACC, then the project’s cash flows will be adequate to fully service the capital, and the project is financially viable.
E. Risk and Sensitivity Analysis
4.20 The financial cost–benefit evaluation is performed on the most likely scenario (the base case). However, it is only an estimate. The potential risks to the outcome and their impact on the FIRR and FNPV need to be evaluated. Risks need to be assessed in terms of severity of impact and probability of occurrence. The sensitivity of the project performance (FNPV, FIRR) to such risks should be assessed. Common risks include capital cost overrun, time overrun, delays in tariff revisions, lower demand, and underachievement of project objectives. The risk and sensitivity analysis may be divided into the following steps:
11
Table 2: Present Value of Money Details Year 1 (t1) Year 2 (t2) Year 3 (t3) Amount Invested (at the beginning of the year (t0) 100 110 121
Interest rate 10% 10% 10%
Value after one year 110 121 133
Present value at t0 of 110 that will be received in year 1 100 - -
Present value at t0 of 121 that will be received in year 2 Present value at t0 of 133 that will be received in year 3
100
100
-
-
-
-
Source: Asian Development Bank. 4.15 In mathematical notation, the FNPV formula is expressed as:
𝐹𝐹𝐹𝐹𝐹𝐹𝐹𝐹𝐹𝐹𝐹𝐹𝐹𝐹𝐹𝐹 = −𝐶𝐶𝐶𝐶𝐶𝐶𝐶𝐶 + 𝐶𝐶𝐶𝐶1/(1 + 𝑟𝑟𝑟𝑟)1 + 𝐶𝐶𝐶𝐶2/(1 + 𝑟𝑟𝑟𝑟)2 + ⋯+ 𝐶𝐶𝐶𝐶𝐶𝐶𝐶𝐶/(1 + 𝑟𝑟𝑟𝑟)𝑡𝑡𝑡𝑡
Where: Co = Initial Investment, Ct = Net Cash Flow in time period t, r = Discount Rate and t = time FNPV may be calculated manually using this formula or using the Excel function: “NPV”.
Table 3 shows an example of FNPV calculated manually.
Table 3: Calculating Net Present Value
20X0 20X1 20X2 20X3 20X4
Outflow Outflow Inflow Inflow Inflow
Annual projected Net cashflows -200 -150 +75 +100 +300
Discount rate (10%) 1.1
0
1.11
1.12
1.13
1.14
PV of annual net cashflows -200.0 -136.36 +61.98 +75.13 +204.90
FNPV (sum of all PVs) +5.14 Source: Asian Development Bank.
4.16 Financial Internal Rate of Return (FIRR) is that discount rate at which the FNPV becomes zero. The mathematical notation for FIRR is ∑▒〖𝐹𝐹𝐹𝐹𝐹𝐹𝐹𝐹 𝐴𝐴𝐴𝐴𝐴𝐴𝐴𝐴𝐴𝐴𝐴𝐴𝐴𝐴𝐴𝐴𝐴𝐴𝐴𝐴𝐴𝐴𝐴𝐴 𝐹𝐹𝐹𝐹𝑁𝑁𝑁𝑁𝐶𝐶𝐶𝐶 𝐶𝐶𝐶𝐶𝐴𝐴𝐴𝐴𝐶𝐶𝐶𝐶ℎ𝑓𝑓𝑓𝑓𝐴𝐴𝐴𝐴𝐶𝐶𝐶𝐶𝑓𝑓𝑓𝑓𝐶𝐶𝐶𝐶〗 = 0. Unlike FNPV, this cannot be calculated manually given the complexity and iterative nature of the computation. FIRR is best calculated using the Excel function “IRR”.
4.17 A project is financially viable if its FNPV discounted at the WACC is positive, and the FIRR is greater than the WACC. A positive FNPV indicates an investment which generates sufficient incremental cash flows to recover its costs (excluding debt service). If the FIRR exceeds the WACC, then the project’s cash flows will be adequate to fully service the capital, and the project is financially viable.
E. Risk and Sensitivity Analysis
4.18 The financial cost–benefit evaluation is performed on the most likely scenario (the base case). However, it is only an estimate. The potential risks to the outcome and their impact on the FIRR and FNPV need to be evaluated. Risks need to be assessed in terms of severity of impact and probability of occurrence. The sensitivity of the project performance (FNPV, FIRR) to such risks should be assessed. Common risks include capital cost overrun, time overrun, delays in tariff revisions, lower demand, and underachievement of project objectives. The risk and sensitivity analysis may be divided into the following steps:
• Identify risk events or risk factors; • determine severity of impact and probability of occurrence;
1 2 = 1/ (1 ) 2 / (1 ) / (1 )tFNPV Co C r C r Ct r− + + + + +…+ +

Financial Cost–Benefit Evaluation 21
(i) identify risk events or risk factors,(ii) determine severity of impact and probability of occurrence,(iii) calculate the effect of the impact on base case FNPV and FIRR,
and(iv) summarize results and identify mitigating actions.
4.21 Some risks cannot be easily mitigated; these are identified by conducting a sensitivity analysis (e.g., risks that are beyond the project’s control). In such cases, measurable covenants need to be designed to provide early warning to the government, to the executing agency and/or implementing agency, and to ADB. Sensitivity analysis is the determination of how the movement of an independent variable affects a dependent variable for a given set of assumptions. The switching value is defined as the percentage change in the independent variable to reduce the FNPV to 0. The sensitivity indicators and switching values provide an objective guide to assessing key risks and designing mitigation measures and covenants.
4.22 The sensitivity of the FNPV can be expressed numerically as sensitivity indicator and switching value. The sensitivity indicator expresses the ratio of change in FNPV to the ratio of change in a variable. For example, if the tariff (variable) is reduced by 10%, the FNPV declines by 67%, therefore the sensitivity indicator is 6.70 (67/10). The switching value is the reciprocal of the sensitivity indicator. A decline of 14.9% (1/6.7) in the tariff will reduce the FNPV to 0.
4.23 The sensitivity of the FIRR can also be numerically expressed in terms of sensitivity indicator and switching value. The sensitivity indicator compares the change in FIRR above the WACC to the percentage change in the variable. For example, if the base case FIRR is 15.87% and the WACC is 12%, and FIRR declines by 2.56% (from 15.87% to 13.31%) for a 10% decline in tariff, the sensitivity indicator is 6.61 (0.0256 / 0.0387) * (10). The switching value is the reciprocal of the sensitivity indicator and is 15.1% in this case. Thus, a 15.1% decline in the tariff will reduce the FIRR to WACC.
4.24 The sensitivity analysis may identify one or more risks that could be serious for the project’s financial viability. For instance, a delay in tariff revisions, lower than anticipated offtake or less than anticipated improvements in efficiency, may undermine anticipated cash flows. If there is higher probability of occurrence of such risks, such risks should be rated as substantial or high, reported in the RRP together with suitable mitigation measures, and monitored during implementation. Appendix 6 provides more guidance on sensitivity and risk analysis.
4.25 Some examples of risk mitigation:
(i) restructure the financing plan to reduce WACC;(ii) change the project scope; and/or(iii) reevaluate cost estimates, e.g., cheaper ways of implementing
project.

V. Financial Covenants
5.1 Financial covenants are legally binding, measurable, and monitorable financial performance indicators that help to objectively assess the financial performance of an executing agency and/or implementing agency. They are incorporated into ADB project legal agreements, among others, to (i) safeguard the financial viability of the project, (ii) promote the financial sustainability of the entity, (iii) protect the interests of ADB and the borrower, (iv) strengthen the financial management capacity, (v) provide a basis for monitoring by regulators or the government, and (vi) enable the entity to attain a creditworthy status. Depending on the outcome of the financial cost–benefit evaluation and financial analysis, suitable financial covenants need to be identified. Covenants are context-specific and depend on factors such as country, sector, etc. Major risks may be mitigated by introducing covenants as conditions precedent to effectiveness or disbursement. Refer to Appendix 7, Section A7.1 for guidance on selection of suitable performance indicators.
5.2 Not all financial risks can be mitigated through covenants. Financial covenants must be within the control of the borrower, executing agency, or implementing agency. It is not advisable to incorporate financial covenants that are not aligned with the country laws and policies. For instance, it is possible to covenant a debt-to-equity ratio or a debt service coverage ratio, but usually impossible to covenant demand projections or annual legislative appropriations for subsidies. It may be possible to indirectly achieve this objective, by covenanting ratios that need to be achieved through a combination of tariff increases and subsidies.
5.3 Breach of financial covenants can have legal consequences. For instance, a condition precedent to disbursement that the executing agency shall appoint a director of finance on its board would limit the right of the executing agency to withdraw loan funds until compliance is achieved. Noncompliance with covenants constitute an event of default and under financial reporting standards (and as mandated by international standards such as International Financial Reporting Standards), they will be fully disclosed, and the consequences of default will be given effect in the financial statements. However, the borrower and ADB should usually identify potential noncompliances at an early stage, and may mutually agree to defer, restructure, or waive some covenants if supported by sufficient basis and analysis of the changes in the circumstances which are beyond the control of the borrower. Such collaborative approach between ADB and the borrower helps in avoiding an event of default and its consequences, and in initiating proactive steps to address such potential noncompliances.

Financial Covenants 23
5.4 Some covenants require only one-time compliance, while others may require continuing compliance. A covenant to convert existing government loans into equity would be a one-time covenant. A covenant that the executing agency and/or implementing agency will achieve and maintain a debt service coverage ratio of 1.3 from the next financial year needs continuing compliance. Some covenants may require prior ADB consent before the executing agency can take certain actions (e.g., a debt limitation covenant).
5.5 Identifying appropriate financial covenants is a highly skilled task, requiring professional judgement and thorough knowledge of the country, sector, project, and executing agency and/or implementing agency context. Section A7.2 of Appendix 7 provides the sample legal template language for some commonly used legal covenants. Some of the common financial ratio covenants used by ADB are as follows:
(i) accounts receivable (number of days) and collection efficiency ratios,
(ii) cash operating cost recovery ratio,(iii) current ratio,(iv) debt service coverage ratio,(v) debt-to-equity ratio, and(vi) self-financing ratio.

VI. Reporting and Monitoring
6.1 The results of the project financial evaluation and financial analysis are presented in ADB project documents. The documents are:
(i) During processing: RRP, financial analysis linked document, covenants in the legal agreement.
(ii) During implementation: audited project financial statements, auditors’ opinions, and quarterly progress reports.
(iii) At completion: project completion report.
A. During Processing
6.2 The conclusions from the financial analysis and evaluation should be provided in the due diligence section of the RRP, including the paragraph on sustainability. For specific project components that have been subject to full financial evaluation, the outcome of the evaluation (FIRR, FNPV) and viability should be stated, along with the findings from the risk and sensitivity analysis. For components found unviable, a justification should be provided for investing in the project, such as economic rationale and financial sustainability. For financial analysis, the conclusion should clearly state whether the entity is financially sustainable, with a succinct explanation. If the analysis determines that financial sustainability is at risk, the mitigating actions required to bring the entity into a financially sustainable state should be identified and agreed with the said entity. The key risks to project financial viability and financial sustainability should be reflected in the risk and mitigating measures table (Table 4 of RRP).
6.3 The linked document should summarize the results from the project financial evaluation and the entity financial analysis and sustainability assessment.37 Detailed assumptions and calculations should be presented in the linked document. Without repeating information from RRP background, rationale, or project description, the linked document needs to cover the following topics:
37 Given the page limitations, the link document may provide succinct information, and more details can be provided in a supplementary link document.

Reporting and Monitoring 25
I. Introduction and scopeII. Results of the financial evaluation of the project or project components
(if conducted) 1. Analysis of cost recovery mechanism 2. Cost–benefit analysis (i) Assumptions (ii) Project annual cash flows (iii) WACC calculation (iv) FNPV and FIRR calculations (v) Sensitivity analysis 3. ConclusionIII. Financial statement analysis (for public corporations, private sector, or other
nongovernment entities) 1. Analysis of historical financial statements 2. Analysis of projected financial statements 3. ConclusionIV. Recurrent cost analysis (in case of a GGSU) 1. Recurrent costs associated with the project 2. Analysis of executing agency and/or implementing agency capacity to
cover these costs as also normative/existing recurrent costs 3. Analysis of government fiscal capacity to bridge financing gaps 4. ConclusionV. Assurances and covenants
B. During Implementation
6.4 Any material changes to project design, scope, or financing arrangements during implementation may need a reevaluation to determine whether there is any impact on project financial viability and sustainability, and whether corrective and mitigating actions are needed. In the same manner, any events or developments that occurred during the life of the project that impact the ability of the entity to operate as a going concern, and/or affect the financial strength and stability of the entity, should lead to an updated financial analysis of the entity. An action plan and additional covenants may be agreed to ensure financial sustainability.
C. At Completion
6.5 The project completion report should contain the following discussions:
(i) Efficiency in achieving outcome and output—A financial reevaluation to determine whether (a) project design, scope, and implementation arrangements were appropriate to ensure financial viability; (b) there were any significant changes to project design, scope, and implementation arrangements which affected project

26 Financial Analysis and Evaluation
financial performance; (c) there were any actions performed during implementation to ensure financial viability and sustainability; (d) entity is financially sustainable and can operate and maintain the project; (e) the risks to financial sustainability require continuous monitoring or additional covenants;
and (f) the project design, implementation arrangements, implementing agency, and O&M entities (if different) were appropriately determined during project preparation.
(ii) Covenant compliance—Whether the covenants were appropriate, and if the borrower and executing agency and/or implementing agency complied with the legal covenants.
(iii) Monitoring of covenant compliance by ADB and the borrower and executing agency and/or implementing agency, and actions taken to address noncompliance.
(iv) Lessons learned and recommendation sections—A discussion of the key issues encountered during project implementation that affected financial management or performance, and proposed actions for future project preparation and project monitoring.

Appendix 1: Definitions
Capital expenditures—All expenditures incurred on account of fixed assets, including interest charged to construction, related to operations.
Capital asset pricing model—A model used to compute the nominal cost of equity by using the risk-free interest rate, the risk of the project (as measured by the market beta), the market risk premium, and a premium that incorporates risks specific to the project.
Cash from internal sources—The difference between:(i) the sum of cash flows from all sources related to operations, plus
cash generated from consumer deposits and consumer advances of any kind, sale of assets, cash yield of interest on investments, and net nonoperating income; and
(ii) the sum of all expenses related to operations, including administration, adequate maintenance and taxes and payments in lieu of taxes (excluding provision for depreciation and other noncash operating charges), debt service requirements, all cash dividends paid and other cash distributions of surplus, increase in working capital other than cash, and other cash outflows other than capital expenditures.
Conversion of foreign currency debt into local currency—Whenever it shall be necessary to value, in terms of the currency of the (borrower/guarantor), debt payable in another currency, such valuation shall be made on the basis of the prevailing lawful rate of exchange at which such other currency is, at the time of such valuation, obtainable for the purposes of servicing such debt, or, in the absence of such rate, on the basis of a rate of exchange acceptable to Asian Development Bank (ADB).
Current assets excluding cash—All assets other than cash which could in the ordinary course of business be converted into cash within 12 months, including accounts receivable, marketable securities, inventories, and prepaid expenses properly chargeable to operating expenses within the next fiscal year.
Current liabilities—All liabilities which will become due and payable or could under circumstances then existing be called for payment within 12 months, including accounts payable, customer advances, debt service requirements, taxes, and payments in lieu of taxes, and dividends.

28 Appendix 1
Debt—Any indebtedness of the borrower maturing by its terms more than 1 year after the date on which it is originally incurred. Debt shall be deemed to be incurred:
(i) under a loan contract or agreement or other instrument providing for such debt or for the modification of its terms of payment on the date of such contract, agreement, or instrument; and
(ii) under a guarantee agreement, on the date the agreement providing for such guarantee has been entered into. Financial liabilities incurred by a borrower who is a lessee under finance leasing agreements may also be included as debt.
Debt service requirements—The aggregate amount of repayments (including sinking fund payments, if any) of, and interest and other charges on, debt, excluding interest charged to construction and financed from loans. Interest charges which are incurred in financing capital expenditures during development are excluded, if such charges are capitalized. However, if the borrower’s policy is to meet the cost from operating income, such interest charges should be included in “debt service requirements.”
Equity—The sum of the total unimpaired paid-up capital, retained earnings, and reserves of the borrower not allocated to cover specific liabilities.
Financial analysis—The process of evaluating businesses, projects, and enterprises to determine their suitability for investment.
Financial evaluation—The process of evaluating the project cash flows to determine the cost effectiveness of the project in meeting its objectives, and to assess whether the cash flows are sufficient to fund the operating and maintenance costs of the project, meet its debt service commitments, and to pay back the project costs to stakeholders after meeting the tax liabilities, if any.
Financial internal rate of return—The discount rate at which the present value of future net cash flows is equal to the investment cost.
Financial viability—A project is financially viable if its financial net present value discounted at the weighted average cost of capital is positive, and the financial internal rate of return exceeds the weighted average cost of capital.
Financial net present value—The sum of forecasted net cash flows discounted at the weighted average cost of capital.
Free cash flows—The difference between:(i) the sum of revenues from all sources related to operations, after
making adequate provisions for uncollectible debts, adjusted to take account of the borrower’s [rates] [prices] in effect at the time of the incurrence of debt even though they were not in effect

Appendix 1 29
during the 12-month period to which such revenues relate and net nonoperating income; and
(ii) the sum of all expenses related to operations including administration, maintenance, taxes and payments in lieu of taxes, but excluding provision for depreciation, other noncash operating charges, movements in working capital, and interest and other charges on debt.
Liquid current assets—All current assets including cash and other assets, which could in the ordinary course of business be converted into cash within 12 months, including accounts receivable, marketable securities, and prepaid expenses properly chargeable to operating expenses within the next fiscal year, but excluding inventories.
Net nonoperating income—The difference between:(i) revenues from all sources other than those related to operations,
including receipts from disposal of assets; and(ii) expenses, including purchase of assets, taxes, and payments in lieu
of taxes, incurred in the generation of revenues in (i).
Nominal price or cost—The current price/cost of a good or service for the applicable year, including the effect of general inflation.
Operations or operating—The operations of the borrower.
Real cost—The price of a good or service including taxes minus the effect of general inflation, thereby providing true price of the good or service. Real cost enables comparability from one period to another. Future revenues (and costs) are valued based on base year price, and the impact of general inflation and foreign currency exchange rate variation throughout implementation is excluded.
Reporting currency—The currency in which the financial statements of the entity are presented (also known as the presentation currency, as per International Accounting Standards 21). This should be the currency of the primary economic environment in which the entity is domiciled, in which the entity earns the bulk of its revenues and incurs its expenditures.
Total operating expenses—All expenses related to operations, including administration, adequate maintenance, taxes and payments in lieu of taxes, and provision for depreciation following the relevant accounting policy, but excluding interest and other charges on debt.
Total operating revenues—Revenues from all sources related to operations, after making adequate provisions for uncollectible debts, but excludes all government grants, subsidies, and transfers of income.

30 Appendix 1
Weighted average cost of capital—The average cost at which the project secures funding from all its sources.
Working capital other than cash—The difference between current assets excluding cash and current liabilities at the end of each fiscal year.

Appendix 2: Sector-Specific Considerations
Table A2: Sector-Focus Areas
Sector Focus Area
Energy–Electricity • Sectororganization—whetheraverticallyintegratedentityforgeneration, transmission and distribution, or individual entities for each activity
• Forrenewableenergyinterventions,anyincentivessuchasfeed-intariff, renewable energy purchase obligation, grid code requirement of “must-run,” any carbon trading privilege, or other policy support
• Whileassessingfeed-intariffs,thefiscalcapacityofthegovernment to compensate the utility for feed-in tariff should be examined
• Whetherthetariffissetforfullcostrecovery,orcompetitivelydetermined, or set by government fiat
• Ifaregulatorsetsandrevisestariffs,oragovernmentministryplaysthis role
• Periodicityandextentoftariffrevisions• Billingandcollectionefficiency,accountsreceivableperformance.• Abilityoftheentitiestomanagetechnicalandcommerciallosses• Extentofeffectivemeteringatalllevels,adoptionofprepaid
meters• Extentofsubsidiesflowingtotheentities
Water and Wastewater
• Assesswhethertariffsaresetforpartialcostrecovery,whetherthey are adequate to cover cash operations and maintenance (O&M) costs
• IftariffsareinsufficienttorecoverO&Mcosts,arrangements,andactual flow of subsidy from the governments
• Extentofmeteringatdifferentlevels,managementofnonrevenuewater
• Metering,billingandcollectionefficiency,andaccountsreceivablemanagement
• Incomeaffordabilityassessment
Transport–Roads subsector
• Whethertheroadsarefreepublicaccessorsubjecttotoll.• Whethertollscanberetainedbytheentityormustbesurrendered
to the government• Iftheentityisnotreceivinggovernmentsubsidies,ifthetollsare
adequate for O&M and capital servicing• Iftheentityisrequiredtosurrendertollscollected,anddepends
on budgetary appropriation for O&M, a fiscal analysis to assess adequacy of budget allocation and execution in comparison to unconstrained O&M requirements
continued on next page

32 Appendix 2
Sector Focus AreaOther sectors– Education– Agriculture– Health– Elderlycare– Solidwaste
management– Urbanmetro
rail networks– Emergency
assistance loans
• Formostprojectsinthesesectors,fullcostrecoverytariffsarebeyond the capacity or willingness to pay of the beneficiaries
• Theymayhavepartialcostrecoverytariffs,butinsufficientinmanycases to fund cash operating costs
• Theyhaveahighlevelofrecurrentcoststomaintainservicedelivery relative to the capital cost
• Thefinancialanalysisneedstofocusonthefiscalcapacityofthegovernment to provide adequate budgetary support to enable full service delivery
• Inhealthsectororelderlycareprojects,incasepartofthefinancing is available through health insurance or health purchasing agencies, the capacity of the insuring/purchasing entity should be assessed
Financial intermediation loans
• Theparticipatingfinancialintermediaries(PFI)areassessedfortheir capacity to expand credit to the target groups
• ThePFI’sfinancialcapacitytocontinueasagoingconcernisalsoassessed
• Subprojectsareevaluatedforcreditqualityofthesubborrowers• Assessmentoftheregulatoryenvironment,whetheritis
comparable to international best practice, and compliance of the PFIs to the prudential regulations
Results-based lending
• Asresults-basedlending(RBL)canbeimplementedinanysector,the financial analysis and evaluation requirements will broadly follow the sectoral requirements described in this appendix. Sufficient analysis is required to provide a reasonable basis for concluding that the RBL investments would be sustainable during the operational phase
• ForallRBLs,anincrementalrecurrentcostanalysisshouldbeperformed to assess the likely availability of adequate financial resources for sustainable operation
• IftheoperatingentityfortheRBLinvestmentwillnotbeageneralgovernment sector unit (GGSU), its financial sustainability should be assessed
• ForthoseRBLinterventionsthatareinsectorswithfullcostrecovery, investment components would need to be evaluated for financial viability similar to investment projects. Typically, this would be through selection criteria for each investment component. The analysis should focus on intrinsic financial viability of each investment component
Sector development projects
• Thesample(core)subprojectsshouldbefullyassessed• Selectioncriteriaforfuturesubprojectshouldincludea
requirement for financial analysis (and financial evaluation, if warranted)
Source: Asian Development Bank.
Table A2 continued

Appendix 3: Basic Financial Statements
A. Balance Sheet/Statement of Financial Position
A3.1 Also known as the statement of financial position, this summarizes an entity’s assets, liabilities, and shareholders’ equity, and shows the financial status of an entity at a specific point in time. Assets are reported on one side and liabilities and equity on the other.
B. Cash Flow Statement/Statement of Cash Flows
A3.2 This is a statement that provides information on all cash inflows an entity receives from its ongoing operating, investing, and financing activities, and all cash outflows that it pays for business activities and investments during a certain period (usually one accounting year). This statement has three main categories: operating cash flows, investing cash flows, and financing cash flows. Operating cash flows are net cash flows from normal course of business operations of the entity. Investing cash flows refers to the net cash flows spent on fixed assets or properties and equipment. Financing cash flows consist of net external funds such as borrowings, grants and subsidies, and the associated interests and charges on these external funds.
C. Income Statement/Statement of Comprehensive Income
A3.3 Also known as the statement of comprehensive income, this statement provides a summary of the entity’s financial operating performance over a specific period (usually one accounting year). Financial performance is measured by revenue generated by the entity less the costs of doing business. Nonoperating activities that result in incremental costs or income are also part of the income statement but presented below the main line of activity. The end-result of the operations is shown as net profit or loss.

Appendix 4: Definitions of Financial Ratios
A. Operating Performance Ratios
Ratio Formulaa Purpose Applicable Sector
Fixed asset turnover
RevenueAverage net fixed assets
Measures effectiveness in using fixed assets to generate revenue
Capital intensive industries, e.g., energy, telecommunications, airline
Total asset turnover
RevenueAverage total assets
Measures ability to generate revenue given the entity’s asset base
All sectors
Accounts receivable turnover
RevenueAverage accounts
receivable
Measures the number of times the business can collect the average accounts receivables in a year
All sectors where trade and service provision are predominant activities
Accounts payable turnover
Cost of salesAverage accounts
payable
Measures the number of times the business can pay off its average accounts payable during the year
All sectors where trade and service provision are predominant activities
Revenue per employee
RevenueAverage no. of
employees
Measures employee productivity
Service-oriented industries, e.g., IT, health, education, telecommunications
Days in receivables
Average accounts receivable * 360
Revenue
Measures the average number of days required to recover accounts receivable
All sectors where trade and service provision are predominant activities
Days in accounts payables
Average accounts payable * 360Cost of sales
Measures the average time span of unpaid payables
All sectors where trade and service provision are predominant activities
a Averagemeans“(beginningofyearbalancesplusendofyearbalances),dividedby2.”

Appendix 4 35
B. Profitability Ratios
Ratio Formulaa Purpose Applicable Sector
Net income margin
Net profit after taxNet revenue
Measures profitability from all operations
All sectors
Operating profit ratio
Earnings before interest and tax
Net revenue
Measures profitability from core operations
All sectors
Return on assets
Net incomeAverage total assets
Measure effectiveness in using assets to generate profits
Capital intensive industries, e.g., energy, telecommunications, airline
Return on equity
Net incomeAverage equity
Measures effectiveness in using shareholders’ investments (capital) to generate profits
All sectors; generally, where entities are funded mostly by shareholders rather than creditors
Return on capital
Net incomeAverage equity +
average debt
Measures effectiveness of leverage in generating profits
All sectors; generally, where entities are financed with mix of debt and shareholders’ capital
a Averagemeans“(beginningofyearbalancesplusendofyearbalances),dividedby2.”
C. Debt Ratios
Ratio Formulaa Purpose Applicable Sector
Debt ratio Total liabilitiesTotal assets
Measures the amount of leverage used by the entity
All sectors
Debt–equity ratio
Total debtTotal equity
Measures the commitment from entity creditors versus what shareholders have invested
All sectors
Interest coverage ratio
Earnings before interest but after taxes
Interest expense
Measures the ability of the entity to pay interest on outstanding debt with its available earnings
All sectors
a Averagemeans“(beginningofyearbalancesplusendofyearbalances),dividedby2.”

36 Appendix 4
D. Solvency and Liquidity Ratios
Ratio Formulaa Purpose Applicable Sector
Debt service coverage ratio
Free cash flow from operations
Debt service requirement
(interest and principal)
Measures the adequacy of operating cash flows to service debt
Capital intensive industries, e.g., energy, telecommunications, airline
Self-financing ratio
Free cash flow from operations after debt
serviceAverage capital
expenditure
Free cash flow from operations= cash flow from
operations – capital expenditure
Measures the adequacy of operating cash flows to finance capital expansion and replacement
Capital intensive industries, e.g., energy, telecommunications, airline
Current ratio Current assetsCurrent liabilities
Measures the ability to pay short-term creditors using assets that are convertible to cash within 1 year without having to liquidate investments or long-term assets
All sectors, particularly industrial, transmission, distribution, airline where the need for working capital is prominent
Quick ratio Current assets – inventory – prepaid
expensesCurrent liabilities
Measures the ability to pay short-term creditors using cash and cash equivalents (assets that are easily convertible to cash)
All sectors
a Averagemeans“(beginningofyearbalancesplusendofyearbalances),dividedby2.”

Appendix 5: Weighted Average Cost of Capital
A. Identifying Cost of Capital
A5.1 The cost of capital should be determined for each source of funding that is indicated in the project’s financing plan. Where a project has only one funding source, the project cost of capital is equal to cost of the fund and is expressed in real terms after applicable taxes. The formula is:
Where: Nominal cost – determined depending on the source of funds Tax rate – the marginal corporate tax rate payable by the project
owner, and is applied only if the entity is subject to tax, and when the cost of capital is tax deductible (e.g., in most jurisdictions, the interest on the loan is deductible for tax purposes)
Inflation rate – long-term international inflation rate (for foreign currency funds) or domestic inflation rate (for local currency funds) published by Asian Development Bank’s (ADB) Economic and Regional Cooperation Department
A5.2 For debt instruments, the nominal cost of debt includes interest on loan, service charges, commitment fees, front-end fees, and other fees as reflected in the loan agreement.1 For fixed-rate loans, the interest is equivalent to the coupon rate (face value interest) of the loan. For floating debt instruments (variable interest rate) such as ADB’s London Interbank Offered Rate (LIBOR)-based lending, the likely interest rate for the term of the loan should be determined. For ADB loans, the 15-year fixed United States (US) dollar swap rate2 can be considered an appropriate proxy (matching the average maturity of ADB loans) and adjusted for the effective contractual spreads and maturity premiums.
1 Given that the front-end fees and commitment charges occur at the beginning of the loan term, the average cost of debt is calculated, i.e., [entire amount of interest to be paid over the life of the loan + commitment charges + front-end fees] / [loan term multiplied by amount of debt (principal)].
2 ADB Treasury Department regularly publishes the US dollar, LIBOR fixed swap rates.
(1 ( [1 ] )) / (1 ) 1Cost of capital in real prices nominal cost of capital Tax rate inflationrate= + × − + −├ ┤ (1 ( [1 ] )) / (1 ) 1Cost of capital in real prices nominal cost of capital Tax rate inflationrate= + × − + −├ ┤ (1 ( [1 ] )) / (1 ) 1Cost of capital in real prices nominal cost of capital Tax rate inflationrate= + × − + −├ ┤

38 Appendix 5
A5.3 In case of re-lending and onlending of ADB loan, the currency and re-lending/onlending terms should be used. If re-lent or on-lent in domestic currency, the debt is considered a domestic debt and should carry an interest equal to the interest charged by the government to the end-borrower. If re-lent or on-lent in US dollar, the debt remains a foreign currency debt and should carry interest equal to the cost of ADB loan plus additional margin or spread charged by the government to the end-borrower.3 Depending on the manner of re-lending/onlending, appropriate inflation rates should be used.
A5.4 Where the counterpart funds are sourced from domestic borrowings or bond issuance, the nominal cost of the counterpart funds is equal to the interest rate on the domestic loan plus other charges reflected in the loan agreement, or the coupon rate of the bond.
A5.5 Where the counterpart funds are financed by the government’s own funds, they are in the nature of equity or grant funding. The nominal cost of equity is more difficult to determine given the lack of readily available information. In theory, the nominal cost of equity should reflect the opportunity cost of capital which considers the economic cost of raising the capital. As a proxy, ADB uses two approaches: (i) use the nominal rate of long-term government bonds (assumed to be risk-free) and adjust this rate to reflect maturity (the economic lifetime of the project exceeds the term of the bond) and project risks, and (ii) estimate the nominal cost of equity by using the capital asset pricing model to determine the required rate of return for an equally risky project were it to be financed by the private sector. 4 The capital asset pricing model (CAPM) is more appropriate where the ADB project is implemented with private sector participation (e.g., public–private partnership model). For government-funded equity, it will be appropriate to estimate the bond rates for a comparable tenor, adjusted for project risk.
3 There are many different types of onlending arrangements being implemented across ADB’s developing member countries. It is important to have a complete knowledge of the financing terms passed on by the government so that an appropriate cost of capital may be assigned.
4 The CAPM estimates the cost of equity (CoE) using: (i) the risk-free interest rate, (ii) the systemic risk of the project relative to the market (as measured by the “market beta”), (iii) the market risk premium, and (iv) a premium that incorporate risks specific to the project.
In formula: CoE = Rf + β (Rm – Rf) + RP where: CoE = cost of equity Rf = the risk-free interest rate βa = market beta (of comparable investments fully financed by equity) Rma = the expected market return RPa = the project-specific risk premium
a However,emergingmarketsmayberelativelysmallandunderdeveloped.Determinationofan appropriate market beta coefficient and market premiums may be problematic. In the absence of such a beta, one approach would be to use a United States beta or betas for other neighboring countries (such as India, Thailand) for the relevant sector and adjust upwards to reflect country and project risks.

Appendix 5 39
A5.6 Where a project receives grants that are provided without any expectation of repayment, the cost of grants can be assumed to be the government bond rate for a comparable tenor to the project life, without any adjustment for project risk.
B. Calculating Weighted Average Cost of Capital
A5.7 Where there are multiple sources of funding (as reflected in the project’s financing plan), a single cost of capital can be derived by averaging all the cost of funds considering the financing allocation. This is referred to as the weighted average cost of capital (WACC), which acts as a proxy to the overall cost of capital raised for the project. Given that it is purely an estimation, the WACC may not be fully reflective of the market opportunity cost of capital. Thus, the WACC should not be equated to value for money or minimum required rate of return expected by private equity investors.5
A5.8 The following steps should be taken to calculate WACC:
(i) Estimate the nominal cost of each funding source. (ii) Calculate after-tax nominal cost of each funding source using
applicable tax rate. (iii) Calculate after-tax real cost of each funding source using
applicable inflation rate. If the after-tax real cost is negative, it should be treated as zero.
(iv) Calculate the weighted average of the after-tax real cost of each funding source using the funding ratio as weights.
A5.9 The resulting WACC is the estimated capital cost incurred by the project owner necessary to implement the project.
5 Although a project may generate returns to allow full recovery of all investment and operations and maintenance costs plus a return on investment, this return may not be sufficient incentive for private equity investors to make the original investment or to maintain the investment. Private investors typically look for returns on their equity that also include premium for risks such as political and economic risks and would also evaluate returns in comparable investments. Their access to alternative investments such as financial instruments, real estate, or other activities increases their bankable investments, which makes opportunity cost of funds easily identifiable and typically determines the benchmark for investing in a project. Government investment may be guided by whether the funds are fungible (interchangeable), by the real cost of investment funds and the economic benefits of the project. If funds are fungible, they may be more interested in investing in projects with higher returns whether economic or financial. Projects with low returns are riskier to implement and strain the financial sustainability of the corporate entity (public or private) charged with its O&M.

40 Appendix 5
Table A5: Calculating Weighted Average Cost of Capital
Item
Financing Sources
TotalADB LoanDomestic
Loan Equity
A. Amount [amount of funds per financier] 500 400 100 1,000
B. Weight [funding per financier/total project cost]
50.0% 40.0% 10.0% 100.0%
C. Nominal cost of capital 3.0% 10.0% 15.0%
D. Tax rate 20.0% 20.0% 0.0%
E. Tax-adjusted nominal cost [C x (1 – tax rate)]
2.4% 8.0% 15.0%
F. Inflation rate 2.0% 6.0% 6.0%
G. Real cost [(1+E) / (1+F)] – 1 0.4% 1.9% 8.5% 10.8%
WACC (in real terms) 0.196% 0.755% 0.849% 1.8%
WACC = weighted average cost of capital.Source: Asian Development Bank.

Appendix 6: Risk and Sensitivity Analysis
A. Risk Analysis
A6.1 When identifying risk events or risk factors affecting the project, one must select features of the project that may be highly sensitive to cost or revenue variables which could cause early or midterm financial failure. Typically, risks and uncertainties facing projects include, but are not limited to:
(i) Market risk—the risk that the cash flows change in value due to market forces (e.g., price levels, interest rate and foreign exchange rate). This risk can lead to changes in cost estimation resulting in cost overruns, or unexpected increase in operating and maintenance costs, or incorrect tariff assumptions.
(ii) Completion risk and execution risks—the risk that the project will encounter delay in implementation and the risk that project outputs will not be completed as intended. This can be caused by lack of funding, delayed approval, incorrect procurement, nonperforming contractors, delays in securing environmental clearances or payment of resettlement compensation, etc.
(iii) Regulatory risk—the risk of change in regulations or policies, or failure to approve regulations or policies that impact revenue streams such as tariffs, tolls, or user fees adjustments. Political interference also affects forecasted revenue.
(iv) Demand risk—the risk of significant change in demand projections or number of beneficiaries/users.
B. Determine Impact and Probability of Risk
A6.2 The degree of impact and the likelihood of occurrence should be determined in consultation with technical experts. The scenarios are defined by varying one variable at a time, keeping other variables constant. Correlations (a change in one variable is likely to cause or be caused by a change to another key variable) among variables affect the results of the sensitivity analysis and should be considered when creating scenarios. A project may not be too sensitive to each of the variables taken independently, however, a combination of these risk events taken together could substantially impact the project. A longer construction period usually results in higher construction costs and is often positively correlated with a delay in benefits, whereas increases in the number of beneficiaries tend to be

42 Appendix 6
negatively correlated with changes in tariff levels (higher tariffs usually result in a lower number of beneficiaries). Thus, any variables with high correlation should be varied jointly in a single scenario. Care must be exercised when creating scenarios and combining risk events as the greater the aggregation, the less useful is the information.
C. Calculate the Impact and Probability on Base Case
A6.3 The effect of changes to variables on the financial net present value (FNPV) and financial internal rate of return (FIRR) should be calculated for each scenario.
D. Summarize Results and Conclude
A6.4 Once the effect of the changes to variables has been calculated, the results will provide insights on how a project behaves under each scenario. Where FNPV falls below 0, or where FIRR falls below weighted average cost of capital (WACC), the project is deemed highly sensitive to the variable(s). In these cases, it is necessary to identify actions that could mitigate these potential adverse effects.
E. Update Project Design and Covenants
A6.5 The identified mitigating actions should be discussed with the executing agency and incorporated into project design and implementation arrangements. These should also be incorporated into legal agreements (where applicable) as covenants to ensure project financial viability.
F. Example of Risk and Sensitivity Analysis
A6.1: Risk and Sensitivity Analysis
ItemChange in Variable
New FNPV (%)
New FIRR (%)
Base case 12.6 13.7Increase in project cost + 10% –211.0 9.6Decrease in revenue – 10% –294.0 7.8Increase in operating and maintenance costs + 10% 68.0 12.9Foreign exchange movement – 20% -294.0 7.8Construction delays 1 year -99.0 10.8
FIRR = financial internal rate of return, FNPV = financial net present value.Source: Asian Development Bank.

Appendix 6 43
G. Sensitivity Indicators and Switching Values
A6.6 The FIRR and FNPV should be recalculated for different values of key variables and can be expressed numerically as sensitivity indicators (SIs) and switching values (SVs). SIs and SVs are useful to determine those variables that are most likely to affect project outcomes. SIs and SVs of the more important (or potent) variables should be presented in order of declining sensitivity. SIs and SVs calculated toward the FIRR yield slightly different results if compared to SIs and SVs calculated toward the FNPV. This is because the FIRR approach discounts all future net benefits at the FIRR value and the FNPV approach at the discount rate. Combinations of variables can also be considered. For example, the effect on the FNPV or FIRR of a simultaneous decline in economic benefits and an increase in investment cost can be computed. In specifying the combinations to be included, the project analyst should state the rationale for any combination to ensure it is plausible. The definitions of these concepts are presented in Table A6.2, Table A6.3 provides the formula, and Table A6.4 provides a sample calculation.
Table A6.2: Definition of Sensitivity Indicator and Switching Values
Sensitivity Indicator Switching Value
Toward the net present valueCompares percentage change in FNPV with percentage change in a variable or combination of variables.
Toward the net present valueThe percentage change in a variable or combination of variables to reduce the FNPV to zero (0).
Toward the internal rate of returnCompares percentage change in FIRR above the cut-off rate with percentage change in a variable or combination of variables.
Toward the internal rate of returnThe percentage change in a variable or combination of variables to reduce the FIRR to the cut-off rate (=discount rate).
FIRR = financial internal rate of return, FNPV = financial net present value.Source: Asian Development Bank.

44 Appendix 6
Table A6.3: Formula for Sensitivity Indicator and Switching Value
Sensitivity Indicator Switching Value
Toward the net present value
SI = ((FNPVb – FNPV1) / FNPVb) / ((Xb – X1) / Xb)
where:Xb – value of variable in the base caseX1 – value of the variable in the
sensitivity testFNPVb – value of FNPV in the base caseFNPV1 – value of the variable in the
sensitivity test
Toward the net present value
SV = ((100 * FNPVb) * (Xb – X1)) / ((FNPVb – FNPV1) * Xb)
where:Xb – value of variable in the base caseX1 – value of the variable in the
sensitivity testFNPVb – value of FNPV in the base caseFNPV1 – value of the variable in the
sensitivity test
Toward the internal rate of return
SI =
(FIRRb – FIRR1) (FIRRb – d)
(Xb – X1) Xb
where:Xb – value of variable in the base caseX1 – value of the variable in the
sensitivity testFIRRb – value of IRR in the base caseFIRR1 – value of the variable in the
sensitivity testd – discount rate
Toward the internal rate of return
SV = 100 * (FIRRb – d) * (Xb – X1)
(FIRRb – FIRR1) * Xb
where:Xb – value of variable in the base caseX1 – value of the variable in the
sensitivity testFIRRb – value of FIRR in the base caseFIRR1 – value of the variable in the
sensitivity testd – discount rate
FIRR = financial internal rate of return, FNPV = financial net present value, SI = sensitivity indicator, SV = switching value.Source: Asian Development Bank.

Appendix 6 45
Table A6.4: Example of Sensitivity Indicator and Switching Value Calculation
Sensitivity Indicator Switching Value
Toward the net present valueBase Case:Price = Pb = 300FNPVb = 20,912Scenario 1:P1 = 270 (10% change)FNPV1 = 6,895
SI = (20,912 – 6,895) / 20,912
= 6.70
(300 – 270) / 300
Toward the net present valueBase Case:Price = Pb = 300FNPVb = 20,912Scenario 1P1 = 270 (10% change)FNPV1 = 6,895
SV = (100 * 20,912) * (300 – 270)
= 14.9%
(20,912 – 6,895) * 300
Reciprocal of SI in percentage = 100/6.70 = 14.9%.
Toward the internal rate of returnBase Case:Price = Pb = 300FIRRb = 15.87%Scenario 1:P1 = 270 (10% change)FIRR1 = 13.31%d = 12%
SI =
(0.1587 – 0.1331)
= 6.61(0.1587 – 0.12)
(300 – 270)300
Toward the internal rate of returnBase Case:Price = Pb = 300FIRRb = 15.87%Scenario 1:P1 = 270 (10% change)FIRR1 = 13.31%d = 12%
SV = 100 * (0.1587 * 0.12) * (300 – 270)
= 15.1%
(0.1587 – 0.1331) * 300
Reciprocal of SI in percentage = 100/6.61 = 15.1%
FIRR = financial internal rate of return, FNPV = financial net present value, SI = sensitivity indicator, SV = switching value, WACC = weighted average cost of capital.Note: Interpretation: A 15% drop in tariff will render the project unviable, as the FNPV will become 0, and the FIRR will equal the WACC.Source: Asian Development Bank.
Appendix 7: Financial Performance Indicators and Draft Covenants
Section A7.1: Guide to Selecting Financial Performance Indicators
1. What is the basis for the financial analysis data?
2. Is it transparent, accurate, reliable, and the subject of an auditor’s report and opinion, or prepared by a consultant with a reliable financial management track record?
3. What are the current, or in the case of a “greenfield project,” the most likely, financial performance weaknesses that should be given priority for correction (or prevention)?
4. Which indicators and covenants could be the most appropriate to achieve correction (or prevention)?
5. For ongoing operations, what are the deficiencies in cash management performance for at least the past 3 years (using audited annual financial statements)? How should they be corrected?
6. Which indicators and covenants could be the most appropriate to achieve correction?
7. What changes are necessary to ensure an adequate capital structure (debt/equity including reserves) for the executing agency? How can they be affected?
8. What should be the time scale to achieve correction?
9. Which indicators and covenants could be the most appropriate to achieve correction?
10. Do the levels of revenue generation and collection need upgrading, prioritizing the steps to achieve (i) short-term improvements and (ii) long-term improvements?
11. Which performance indicators should be included in periodic performance reports (i.e., not subject to covenants)?

Appendix 7 47
12. Will ADB’s sector operational experts or consultants confirm that each level of operating costs are, or will be, operating at optimum efficiency and effectiveness?
13. If not, what performance levels are they proposing, and which financial performance indicators should be used to support their proposed operational performance upgrading?
14. Does (or will) the entity have a management system capable of developing and efficiently responding to the results of each proposed financial indicator and financial covenant?
15. Does the entity have qualified and experienced personnel who can interpret and monitor performance against the indicators or covenants?
Section A7.2: Sample Text for Common Covenants
The specific legal covenant should be drafted by the Asian Development Bank (ADB) Office of the General Counsel (OGC), with reference to the context of the entity and project.
a. Accounts Receivable and Collection Efficiency
Except as ADB shall otherwise agree, the borrower shall:
(a) Achieve a collection efficiency of __% for each of the financial years after its fiscal year ending on _______. The collection efficiency shall be computed as the proportion of amounts received from the customers to the sum of the opening uncollected balance of accounts receivable (net of any provision for uncollectable amounts) and the value of invoicing during the fiscal year.
(b) Achieve an accounts receivable of __ days of turnover for each of the financial years after its fiscal year ending on _______.
b. Break-even Ratio
(a) Except as ADB shall otherwise agree, the borrower shall produce for each of its fiscal years after its fiscal year ending on _______, total revenues equivalent to/or not less than the sum of (i) its total operating expenses and (ii) the amount by which debt service requirements exceed the provision for depreciation.
(b) Before (date/month) in each of its fiscal years, the borrower shall, on the basis of forecast prepared by the borrower and satisfactory to ADB, review whether it would meet the requirements set forth

48 Appendix 7
in paragraph (a) in respect of such year and the next following fiscal year and shall furnish to ADB the results of such review upon its completion.Paragraph (c): Option 1: Where the borrower or government has discretion to adjust tariffs/rates:
(c) If any such review shows that the borrower would not meet the requirements set forth in paragraph (a) for the borrower’s fiscal years covered by such review, the borrower shall promptly take all necessary measures (including without limitation, adjustments of the structure or levels of its rates (prices)) to meet such requirements.Paragraph (c): Option 2: Where there is an independent regulator in place (or where it is anticipated that an independent regulator may be established during the project implementation period):
(d) If any such review shows that the borrower would not meet the requirements set forth in paragraph (a) for the borrower’s fiscal years covered by such review, the borrower shall promptly take all necessary measures (including without limitation, filing applications with the [name of regulator] seeking a tariff/rate increase) in order to meet such requirements.
(e) If any such review shows that the borrower would not meet the requirements set forth in paragraph (a) for the borrower’s fiscal years covered by such review, the borrower shall promptly take all necessary measures (including without limitation, filing applications with the [name of regulator] seeking a tariff/rate increase) in order to meet such requirements.
c. Current Ratio
(a) Except as ADB shall otherwise agree, the borrower shall maintain a ratio of current assets to current liabilities of not less than _______.
(b) Before (date/month) in each of its fiscal years, the borrower shall, on the basis of forecasts prepared by the borrower and satisfactory to ADB, review whether it would meet the requirements set forth in paragraph (a) in respect of such year and the next following fiscal year and shall furnish to ADB the results of such review upon its completionParagraph (c): Option 1: Where the borrower or government has discretion to adjust tariffs/rates:
(c) If any such review shows that the borrower would not meet the requirements set forth in paragraph (a) for the borrower’s fiscal years covered by such review, the borrower shall promptly take all necessary measures (including without limitation, adjustments of the structure or levels of its rates [prices]) to meet such requirements.

Appendix 7 49
Paragraph (c): Option 2: Where there is an independent regulator in place (or where it is anticipated that an independent regulator may be established during the project implementation period):
(d) If any such review shows that the borrower would not meet the requirements set forth in paragraph (a) for the borrower’s fiscal years covered by such review, the borrower shall promptly take all necessary measures (including without limitation, filing applications with the [name of regulator] seeking a tariff/rate increase) in order to meet such requirements.
d. Debt–Equity Ratio
(a) Except as ADB shall otherwise agree, the borrower shall not incur any debt, if after the incurrence of such debt the ratio of debt-to-equity shall be greater than _______ to _______.
e. Debt Service Coverage Ratio (Historical)
(a) Except as ADB shall otherwise agree, the borrower shall not incur any debt, unless the free cash flows of the borrower for the twelve months prior to the date of such incurrence shall be at least ____ times the debt service requirements of the borrower for the same period on all debt.
f. Debt Service Coverage Ratio (Future-Oriented)
(a) Except as ADB shall otherwise agree, the borrower shall not incur any debt unless a reasonable forecast of the revenues and expenditures of the borrower shows that the estimated free cash flows of the borrower for each fiscal year during the term of the debt to be incurred shall be at least ____ times the estimated debt service requirements of the borrower in such year on all debt of the borrower including the debt to be incurred and no event has occurred since the date of the forecast which has, or may reasonably be expected in the future to have, a material adverse effect on the financial condition of future operating results of the borrower.
g. Operating Ratio
This covenant may be converted to a working ratio covenant by substituting a definition of working expenses for operating expenses, or a cash operating ratio covenant by revising the definition to exclude noncash revenues. This will normally require that depreciation be omitted from the definition of operating expenses.

50 Appendix 7
(a) Except as ADB shall otherwise agree, the borrower shall maintain, for each of its fiscal years after its fiscal year ending on _________, a ratio of total operating expenses to total operating revenue not higher than _______ (percent).
(b) Before (date/month) in each of its fiscal years, the borrower shall, on the basis of forecasts prepared by the borrower and satisfactory to ADB, review whether it would meet the requirements set forth in paragraph (a) in respect of such year and the next following fiscal year, and shall furnish to ADB the results of such review upon its completion.Paragraph (c): Option 1: Where the borrower or government has discretion to adjust tariffs/rates:
(c) If any such review shows that the borrower would not meet the requirements set forth in paragraph (a) for the borrower’s fiscal years covered by such review, the borrower shall promptly take all necessary measures (including without limitation, adjustments of the structure or levels of its rates (prices)) in order to meet such requirements.Paragraph (c): Option 2: Where there is an independent regulator in place (or where it is anticipated that an independent regulator may be established during the project implementation period):
(d) If any such review shows that the borrower would not meet the requirements set forth in paragraph (a) for the borrower’s fiscal years covered by such review, the borrower shall promptly take all necessary measures (including without limitation, filing applications with the [name of regulator] seeking a tariff/rate increase) in order to meet such requirements.
h. Quick Ratio
(a) Except as ADB shall otherwise agree, the borrower shall maintain a ratio of liquid current assets to current liabilities of not less than ______.
(b) Before (date/month) in each of its fiscal years, the borrower shall, on the basis of forecasts prepared by the borrower and satisfactory to ADB, review whether it would meet the requirements set forth in paragraph (a) in respect of such year and the next following fiscal year and shall furnish to ADB the results of such review upon its completion.Paragraph (c): Option 1: Where the borrower or government has discretion to adjust tariffs/rates:
(c) If any such review shows that the borrower would not meet the requirements set forth in paragraph (a) for the borrower’s fiscal years covered by such review, the borrower shall promptly take all necessary measures (including without limitation, adjustments of
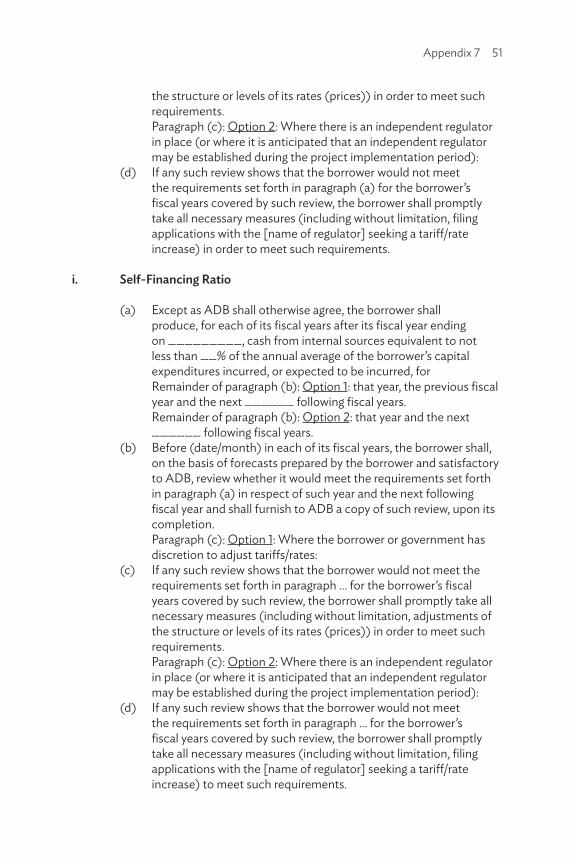
Appendix 7 51
the structure or levels of its rates (prices)) in order to meet such requirements.Paragraph (c): Option 2: Where there is an independent regulator in place (or where it is anticipated that an independent regulator may be established during the project implementation period):
(d) If any such review shows that the borrower would not meet the requirements set forth in paragraph (a) for the borrower’s fiscal years covered by such review, the borrower shall promptly take all necessary measures (including without limitation, filing applications with the [name of regulator] seeking a tariff/rate increase) in order to meet such requirements.
i. Self-Financing Ratio
(a) Except as ADB shall otherwise agree, the borrower shall produce, for each of its fiscal years after its fiscal year ending on _________, cash from internal sources equivalent to not less than __% of the annual average of the borrower’s capital expenditures incurred, or expected to be incurred, forRemainder of paragraph (b): Option 1: that year, the previous fiscal year and the next ______ following fiscal years.Remainder of paragraph (b): Option 2: that year and the next ______ following fiscal years.
(b) Before (date/month) in each of its fiscal years, the borrower shall, on the basis of forecasts prepared by the borrower and satisfactory to ADB, review whether it would meet the requirements set forth in paragraph (a) in respect of such year and the next following fiscal year and shall furnish to ADB a copy of such review, upon its completion.Paragraph (c): Option 1: Where the borrower or government has discretion to adjust tariffs/rates:
(c) If any such review shows that the borrower would not meet the requirements set forth in paragraph … for the borrower’s fiscal years covered by such review, the borrower shall promptly take all necessary measures (including without limitation, adjustments of the structure or levels of its rates (prices)) in order to meet such requirements.Paragraph (c): Option 2: Where there is an independent regulator in place (or where it is anticipated that an independent regulator may be established during the project implementation period):
(d) If any such review shows that the borrower would not meet the requirements set forth in paragraph … for the borrower’s fiscal years covered by such review, the borrower shall promptly take all necessary measures (including without limitation, filing applications with the [name of regulator] seeking a tariff/rate increase) to meet such requirements.

Financial Analysis and EvaluationTechnical Guidance Note
The Asian Development Bank (ADB) uses fi nancial analysis and evaluation of implementing and executing agencies and projects as tools for the prudent use of its resources. This Technical Guidance Note describes ADB’s requirements and good practices for fi nancial analysis and evaluation of sovereign projects, and identifi es measures for ensuring that ADB-supported investments are fi nancially viable and sustainable. It also provides a sound analytical framework for assessing if agencies are fi nancially capable of implementing and sustainably operating and maintaining an ADB project so it can achieve the intended development impact over its economic life. Robust fi nancial analysis and evaluation allow ADB and implementing and executing agencies to identify and agree on actions that enhance their fi nancial capacity, strengthening developing member countries’ overall governance and institutional capacity—one of ADB’s operational priorities in its Strategy 2030.
About the Asian Development Bank
ADB is committed to achieving a prosperous, inclusive, resilient, and sustainable Asia and the Pacifi c, while sustaining its e� orts to eradicate extreme poverty. Established in 1966, it is owned by 68 members—49 from the region. Its main instruments for helping its developing member countries are policy dialogue, loans, equity investments, guarantees, grants, and technical assistance.
ASIAN DEVELOPMENT BANK6 ADB Avenue, Mandaluyong City1550 Metro Manila, Philippineswww.adb.org
ASIAN DEVELOPMENT BANK
FINANCIAL ANALYSIS AND EVALUATIONTECHNICAL GUIDANCE NOTE
OCTOBER 2019


![EVALUATION OF CORPORATE PERFORMANCE … · aspects of financial statement analysis. B.L. Verma's book entitled ''Analysis of Financial Statement [1988], in this book the author has](https://static.fdocuments.in/doc/165x107/5b64cfee7f8b9ade588decf9/evaluation-of-corporate-performance-aspects-of-financial-statement-analysis.jpg)


