Financial Analysis 2013 - PHC4 | Pennsylvania Health Care …€¦ · · 2014-11-06Financial...
32
Pennsylvania Health Care Cost Containment Council November 2014 VOLUME TWO: Ambulatory Surgery Centers An Annual Report on the Financial Health of Pennsylvania’s Ambulatory Surgery Centers Financial A nalysis 2013
Transcript of Financial Analysis 2013 - PHC4 | Pennsylvania Health Care …€¦ · · 2014-11-06Financial...

Pennsylvania Health Care Cost Containment CouncilNovember 2014
VOLUME TWO: Ambulatory Surgery Centers
An Annual Report on the Financial Health of Pennsylvania’s Ambulatory Surgery Centers
Financial Analysis 2013

About PHC4Pennsylvania Health Care Cost Containment Council (PHC4) is an independent state agency charged with collecting, analyzing and reporting information that can be used to improve the quality and restrain the cost of health care in the state. It was created in the mid-1980s when Pennsylvania businesses and labor unions, in collaboration with other key stakeholders, joined forces to enact market-oriented health care reforms. Because of their efforts, the General Assembly passed legislation (Act 89 of 1986) creating PHC4.
The primary goal is to empower purchasers of health care benefits, such as businesses and labor unions, as well as other stakeholders, with information they can use to improve quality and restrain costs. Nearly 100 organizations and individuals annually utilize PHC4’s special requests process to access and use data. More than 840,000 public reports on patient treatment results are downloaded from the PHC4 website annually. Today, PHC4 is a recognized national leader in public health care reporting.
A 25-member board of directors representing business, labor, consumers, health care providers, insurers and state government governs PHC4.
Table of Contents Introduction ............................................................1
Key Findings ............................................................1
Ambulatory Surgery Centers ...............................2
Operating and Total Margins................................4
Outpatient Visits and Revenue ............................6
Outpatient Procedures ..........................................7
Payer Mix ..................................................................8
Individual Ambulatory Surgery Center Data .....9
Footnotes ...............................................................26
Explanation of Terms and Measures .................27
Non-Compliant Ambulatory Surgery Centers .. 28

Financial Analysis 2013 • Volume Two 1
INTRODUCTION
TABLE 1Number of Facilities, FY13by Facility Type
IntroductionOn an annual basis, the Pennsylvania Health Care Cost Containment Council (PHC4) produces a series of reports measuring the financial health of Pennsylvania’s hospitals and ambulatory surgery centers.
Volume One, released in May 2014, focused on the financial health of Pennsylvania’s General Acute Care (GAC) hospitals. This report, Volume Two, concentrates on Pennsylvania’s ambulatory surgery centers (ASCs). Volume Two provides a financial perspective on the outpatient care provided by licensed ambulatory surgery centers in the Commonwealth.
The reporting year for the ASCs in Volume Two is based on each facility’s fiscal year that ended during 2013. The fiscal year for the majority of ASCs is calendar year ending December 31, 2013. For those facilities that do not utilize a calendar year, the fiscal year typically ended on June 30, 2013.
The information in this report was derived from annual financial statements supplemented with additional data, as well as quarterly ambulatory/outpatient procedure data supplied by each facility. Every reasonable effort has been made to ensure the accuracy of the information. Each ASC has had the opportunity to review their data and make changes, if necessary. The ultimate responsibility for accuracy lies with the individual ASC.
Ambulatory Surgery Centers 285
General Acute Care Hospitals 173
Non-General Acute Care Hospitals 75
Total 533
Key Findings• The number of ambulatory surgery
centers (ASCs) in Pennsylvania increased by four in Fiscal Year 2013 (FY13) to 285.
• The average operating and total margins for ASCs statewide decreased from FY12 to FY13, with the average operating margin decreasing to 24.94% (from 25.74%) and the total margin decreasing to 25.13% (from 26.92%).
• ASCs reported 1.1 million outpatient visits and $1.2 billion in net outpatient revenue during FY13.
• The number of procedures at ASCs increased 0.5% from FY12.
• Medicare and Medical Assistance covered 41.9% of outpatient procedures at ASCs during FY13.

2 Financial Analysis 2013 • Volume Two
AMBULATORY SURGERY CENTERS
Ambulatory Surgery Centers
FIGURE 1Number of Ambulatory Surgery Centers, FY04 and FY13by Region
�
2947
717
2433
3973
1023
212
2847
712
1621
Number of ASCs in FY04 (Total = 162)
Number of ASCs in FY13 (Total = 285)
During Fiscal Year (FY) 2013, there were 285 Ambulatory Surgery Centers (ASCs) operating in Pennsylvania1. In FY13, the number of ASCs in Pennsylvania increased by four. Between FY12 and FY13, seven ASCs opened and three closed. Of the facilities that opened, one was in Region 4, one was in Region 5, four were in Region 8 and one was in Region 9. Of the facilities that closed, two were in Region 5 and one was in Region 6.
Figures 1 and 2 illustrate the growth in the number of ASCs in Pennsylvania from FY04 to FY13. Between FY04 and FY13, the number of ASCs in Pennsylvania grew by 123 facilities; with the largest increase (18%) occurring in FY06 (increased from 177 ASCs in FY05 to 209 ASCs in FY06). The greatest concentration of growth occurred in Region 8—Bucks, Ches-ter, Delaware and Montgomery counties (see Figure 1).
1Does not include new facilities operating less than six months.

Financial Analysis 2013 • Volume Two 3
AMBULATORY SURGERY CENTERS AMBULATORY SURGERY CENTERS
FIGURE 2Number of Ambulatory Surgery Centersby Fiscal Year
The analysis for FY13 and the individual ASC tables in this report is based on data collected from 272 ASCs; 13 ASCs did not submit complete data and their data is not included in this report.
Statewide and regional averages that are expressed as a percentage (e.g., operating
margin) in this report were calculated as if the entire group (state or region) were a single reporting entity. For example, the regional average operating margins were calculated by dividing the sum of operating income for all ASCs in the region and the sum of total operating revenue for all ASCs in the region.

4 Financial Analysis 2013 • Volume Two
OPERATING & TOTAL MARGINS
TABLE 2Ambulatory Surgery Centers Regional and Statewide Averages, FY13
Operating and Total MarginsThe average operating and total margins for ASCs statewide decreased slightly from FY12 to FY13, with the average operating margin decreasing to 24.94% (from 25.74%) and the total margin decreasing to 25.13% (from 26.92%). The average statewide operating and total margins for ASCs have changed only marginally over the past six fiscal years, FY08 to FY13 (see Figure 3).
The statewide average operating and total margins for ASCs are similar because ASCs realize only a small amount of non-operating income. Eighty-five percent (232) of reporting Pennsylvania ASCs operated as for-profit facilities in FY13. The remaining 15% (40) operated as non-profit facilities. Operating and total margins for ASCs do not always reflect
compensation to the physician owners or reflect the payment of income tax expenses.
Physician owners of surgery centers may receive all or part of their compensation as a distribution of net income instead of salaries or fees. Consequently, such distributions are not reported as an operating expense; if they were, that would reduce operating and total margins.
In addition, the majority of ASCs are limited liability partnerships or Sub-Chapter S corporations and therefore, are not subject to income taxes, which generally are paid as personal income tax by the owners. Consequently, the total margin for most for-profit ASCs does not reflect income tax expenses.
*See page 9 for the list of counties included in each region.
Region*Operating
MarginTotal
Margin
3-year Average
Total Margin
Medicare Share of
Net Patient Revenue
Medical Assistance
Share of Net Patient
RevenueAverage
Visits
Region 1 12.59% 12.60% 16.47% 25.81% 4.25% 3,754
Region 2 19.18% 19.19% 14.73% 30.35% 6.60% 4,871
Region 3 12.73% 12.73% 14.18% 23.02% 5.03% 3,640
Region 4 33.98% 33.98% 34.61% 21.34% 1.68% 3,432
Region 5 28.04% 28.49% 28.32% 22.98% 4.92% 4,233
Region 6 35.56% 35.79% 34.45% 24.43% 4.81% 4,554
Region 7 35.75% 36.21% 35.77% 25.32% 2.78% 4,600
Region 8 25.72% 25.79% 27.53% 22.32% 3.21% 3,548
Region 9 14.99% 15.03% 13.99% 31.85% 9.39% 3,141
Statewide 24.94% 25.13% 25.73% 24.47% 4.32% 3,909

Financial Analysis 2013 • Volume Two 5
OPERATING & TOTAL MARGINS OPERATING & TOTAL MARGINS
FIGURE 3Statewide Average Operating and Total Margins for Ambulatory Surgery Centersby Fiscal Year
18.77%20.69% 20.73%
24.11%26.00% 26.28%
24.87% 24.94%25.74%
24.94%
18.82%20.81% 20.85%
24.31%26.08% 26.30%
25.00% 25.12% 26.92% 25.13%
0%
5%
10%
15%
20%
25%
30%
FY04 FY05 FY06 FY07 FY08 FY09 FY10 FY11 FY12 FY13Opera�ng Margin Total Margin

6 Financial Analysis 2013 • Volume Two
OUTPATIENT VISITS & REVENUE
FIGURE 4Average Revenue per Visit at Ambulatory Surgery Centersby Fiscal Year
Outpatient Visits and RevenuePennsylvania’s ASCs reported 1.1 million total outpatient visits during FY13 and $1.2 billion total net outpatient revenue (Table 3). The slight decrease (0.4%) in the number of outpatient visits reported by ASCs during FY13, combined with the 4.4% increase in net outpatient revenue, resulted in an average revenue per visit of $1,084 during FY13, a 4.8% increase over the FY12 figure of $1,034.
There is a wide variation in the level of resources provided per visit among ASCs and
Hospital Outpatient Departments (HOPDs). For example, a patient may receive care as a series of visits comprised of relatively short treatments (e.g., psychotherapy) in a hospital outpatient setting, while a patient at an ASC may be subject to an entire surgical procedure during a single visit. As a group, ASCs provide a variety of outpatient services at varying levels of resource intensity; however, on an individual basis, ASCs specialize in surgical procedures, e.g., endoscopy, laser surgery, ophthalmology and spine care.
$696 $733 $772$811
$875 $914$964 $999 $1,034
$1,084
$0
$200
$400
$600
$800
$1,000
$1,200
FY04 FY05 FY06 FY07 FY08 FY09 FY10 FY11 FY12 FY13
$$669966 $$773333 $$772$811
$875 $$991144$964 $999 $1,034
$1,084
TABLE 3Statewide Outpatient Visits1 and Revenue (in Thousands) at Ambulatory Surgery Centersby Fiscal Year
FY04 FY05 FY06 FY07 FY08 FY09 FY10 FY11 FY12 FY13Outpatient Visits 689,451 703,863 789,857 881,562 935,984 1,024,310 1,033,283 1,040,877 1,067,728 1,063,353
Net Outpatient Revenue $479,962 $515,828 $609,383 $715,164 $818,531 $935,894 $995,789 $1,040,023 $1,104,392 $1,153,061
Average Revenue per Visit $696 $733 $772 $811 $875 $914 $964 $999 $1,034 $1,084
1 PHC4 captures the total number of visits with the annual financial data submissions.

Financial Analysis 2013 • Volume Two 7
OUTPATIENT VISITS & REVENUE OUTPATIENT PROCEDURES
TABLE 4Outpatient Procedures1
by Fiscal Year
Outpatient ProceduresDuring FY13, there were 3.1 million outpatient records1 submitted to PHC4 from ASCs and General Acute Care (GAC) HOPDs combined (Table 4). ASCs treated 30.6% or 943,479 of these outpatient procedures. In FY09, ASCs treated 31.3% or 886,933 of the total 2.8 million outpatient procedures. The percent of procedures performed at ASCs has remained relatively the same over the past five fiscal years, FY09 to FY13.
During FY13, the net growth in the number of outpatient procedures at GAC HOPDs and ASCs combined increased 0.3% over FY12. The number of outpatient procedures at GAC HOPDs increased 0.2%, and the number of procedures at ASCs increased 0.5% in FY13.
Facility Type
FY09 FY10 FY11 FY12 FY13
Procedures Percent Procedures Percent Procedures Percent Procedures Percent Procedures Percent
ASC 886,933 31.3% 907,431 31.6% 931,437 31.5% 938,700 30.5% 943,479 30.6%
GAC HOPD 1,947,317 68.7% 1,967,078 68.4% 2,025,254 68.5% 2,137,011 69.5% 2,141,258 69.4%
Statewide 2,834,250 100.0% 2,874,509 100.0% 2,956,691 100.0% 3,075,711 100.0% 3,084,737 100.0%
1The outpatient procedure codes captured by PHC4 are available on the PHC4 website at http://www.phc4.org/services/datarequests/procedures.htm.

8 Financial Analysis 2013 • Volume Two
PAYER MIX
FIGURE 5Outpatient Procedures1, FY13by Facility Type & Payer
Ambulatory Surgery Centers GAC Hospital Outpatient Departments
Payer MixFigure 5 presents the payer mix for outpatient procedures performed at ASCs compared to GAC HOPDs. The greatest differences between the two types of facilities are the proportion of procedures covered by Medical Assistance (MA) and commercial health insurance plans. During FY13, MA was the payer for 5.2% of outpatient procedures at ASCs, compared to 11.8% at
GAC HOPDs. Commercial health insurance plans covered 50.3% of outpatient procedures at ASCs, compared to 42.9% at GAC HOPDs.
In FY13, the mean age for patients undergoing an outpatient procedure at an ASC was 57.1 years, compared to 53.1 years for patients at GAC HOPDs.
Other7.8%
Commercial50.3%
Medicare36.7%
Medical Assistance
5.2%
1The outpatient procedure codes captured by PHC4 are available on the PHC4 website at http://www.phc4.org/services/datarequests/procedures.htm.
Other10.0%
Commercial42.9%
Medicare35.3%
Medical Assistance
11.8%

Financial Analysis 2013 • Volume Two 9
PAYER MIX INDIVIDUAL AMBULATORY SURGERY CENTER DATA
Individual Ambulatory Surgery Center Data
Pennsylvania Counties by Region
Region 1: Allegheny, Armstrong, Beaver, Butler, Fayette, Greene, Washington and Westmoreland.
Region 2: Cameron, Clarion, Clearfield, Crawford, Elk, Erie, Forest, Jefferson, Lawrence, McKean, Mercer, Potter, Venango and Warren.
Region 3: Bedford, Blair, Cambria, Indiana and Somerset.
Region 4: Centre, Clinton, Columbia, Lycoming, Mifflin, Montour, Northumberland, Snyder, Tioga and Union.
Region 5: Adams, Cumberland, Dauphin, Franklin, Fulton, Huntingdon, Juniata, Lancaster, Lebanon, Perry and York.
Region 6: Bradford, Lackawanna, Luzerne, Monroe, Pike, Sullivan, Susquehanna, Wayne and Wyoming.
Region 7: Berks, Carbon, Lehigh, Northampton and Schuylkill.
Region 8: Bucks, Chester, Delaware and Montgomery.
Region 9: Philadelphia.
The individual ASC data tables on the following pages are based on data collected from 272 ASCs; 13 ASCs did not submit complete data and their data is not included in this report. The facilities listed in the tables are arranged according to region.
Statewide and regional averages for ASCs are presented in the individual facility tables. Averages expressed as a percentage (e.g., operating margin) were calculated as if the entire group (state or region) were a single reporting entity. For example, the regional average operating margins were calculated by dividing
the sum of operating income for all ASCs in the region and the sum of total operating revenue for all ASCs in the region.
The FY13 operating and total margins for each individual facility are included in these tables. Each facility’s corresponding operating income, total income and total operating revenue, expressed in dollars, can be found on PHC4’s website at www.phc4.org. (Note: Other operating revenue must be included with net patient revenue to calculate the operating income that is used for operating margin.)

10 Financial Analysis 2013 • Volume Two
INDIVIDUAL AMBULATORY SURGERY CENTER DATA
Region/ Ambulatory Surgery Center
Net Patient Revenue (NPR) (thousands)
3-yr Avg Change in NPR
FY10-FY13
Total Operating Expenses (TOE) (thousands)
3-yr Avg Change in TOE
FY10-FY13FY13 FY12 FY11 FY10 FY13 FY12 FY11 FY10
Statewide Average $4,239 $4,106 $4,063 $3,890 2.99% $3,204 $3,072 $3,060 $2,943 2.96%
Region 1 Average $3,812 $3,928 $3,997 $3,893 -0.70% $3,375 $3,336 $3,216 $3,125 2.67%
1 20/20 SC1, 10 $2,846 $2,537 $2,348 $2,578 3.46% $1,672 $1,290 $1,183 $1,325 8.74%
1 Aestique ASC1, 10 $2,371 $2,002 $1,944 $1,873 8.85% $2,359 $1,959 $1,946 $1,872 8.66%
1 Assoc Kidney/Hypertension1, 10, 11 $277 $667 $1,157 $1,096 -24.90% $563 $656 $821 $797 -9.78%
1 CHP North SC $13,514 $14,225 $11,194 $10,787 8.43% $12,253 $11,770 $9,089 $8,884 12.64%
1 Delmont SC1, 3, 10, 13 $1,083 $1,088 $1,225 $127 NA $1,366 $1,276 $1,301 $321 NA
1 Dermatology & Cosmetic SC1, 10 $2,215 $2,354 $2,566 $2,501 -3.81% $2,334 $2,381 $2,508 $2,435 -1.39%
1 East Side SC1, 10 $2,713 $3,387 $3,651 $3,430 -6.97% $3,079 $3,723 $3,680 $3,164 -0.90%
1 Excela Health Norwin7 $4,251 $3,348 $3,881 $3,752 4.43% $1,878 $1,330 $2,380 $2,334 -6.51%
1 Four Seasons Endoscopy1, 10 $2,890 $2,899 $2,735 $3,154 -2.79% $1,444 $1,433 $1,402 $1,508 -1.42%
1 Gamma SC1, 10, 13 $2,964 $3,461 $3,316 $3,405 -4.31% $2,791 $3,290 $3,129 $2,826 -0.41%
1 Heritage Valley SC7 $4,891 $5,298 $4,633 $5,050 -1.05% $5,148 $5,012 $4,856 $4,793 2.47%
1 Laurel SC1, 2, 10, 13 $2,766 $5,578 $6,145 $5,652 NA $2,525 $4,257 $4,044 $3,895 NA
1 Leo R. McCafferty Plastic1, 10 $731 $619 $485 $432 23.09% $767 $437 $482 $355 38.74%
1 Lowry SC1, 10 $452 $471 $497 $611 -8.66% $456 $463 $498 $609 -8.36%
1 McCandless Endoscopy1, 10, 13 $1,842 $1,675 $1,432 $928 32.84% $1,020 $1,024 $980 $784 10.03%
1 Mt Lebanon SC7 $3,631 $3,634 $3,470 $3,163 4.94% $2,548 $2,565 $2,479 $2,192 5.41%
1 Mt Pleasant SC1, 10 $1,864 $1,419 $1,969 $1,922 -1.00% $2,450 $2,115 $2,335 $2,239 3.14%
1 North Shore Endoscopy1, 10 $1,772 $1,940 $1,512 $1,705 1.31% $1,059 $1,091 $981 $1,062 -0.10%
1 Peters Township SC1, 3, 10, 13 $1,327 $631 NA NA NA $2,645 $2,193 NA NA NA
1 Pittsburgh Reproductive1, 10 $201 $208 NA NA NA $238 $238 NA NA NA
1 Radiance SC1, 10 $3,189 $2,975 $3,871 $3,522 -3.15% $3,310 $3,076 $3,108 $2,882 4.94%
1 Renal Endocrine Assoc1, 10 $1,838 $1,519 $1,100 $987 28.75% $966 $860 $763 $723 11.20%
1 SC at Benbrook1, 10 $7,373 $6,667 $7,294 $7,346 0.12% $5,106 $4,686 $5,172 $5,447 -2.09%
1 SC Cranberry1, 10 $2,215 $2,529 $2,685 $2,876 -7.66% $2,034 $2,342 $2,402 $2,563 -6.88%
1 SC Edgeworth Commons1, 10 $3,878 $4,433 $4,319 $4,566 -5.02% $3,843 $3,824 $3,776 $3,739 0.93%
1 Shadyside SC1, 10 $371 $550 $563 $461 -6.49% $268 $419 $381 $335 -6.66%
1 Skin Center1, 3, 10 $1,028 $998 NA NA NA $1,062 $2,028 NA NA NA
1 South Hills Endoscopy1, 10 $3,200 $3,257 $3,109 $2,703 6.13% $1,842 $1,730 $1,491 $1,587 5.36%
1 South Hills SC1, 10, 13 $3,145 $2,628 NA NA NA $2,711 $2,463 NA NA NA
1 Southwestern ASC1, 10 $2,779 $2,635 $3,284 $3,605 -7.63% $2,740 $2,694 $3,228 $3,116 -4.02%
1 Southwestern Endoscopy1, 10 $4,308 $4,278 $4,233 $4,068 1.97% $2,947 $2,787 $2,729 $2,687 3.22%
1 Southwestern PA Eye SC1, 10 $3,524 $3,519 $3,208 $2,978 6.11% $2,926 $3,045 $2,240 $2,421 6.96%
1 Spartan Health SC1, 10, 13 $2,733 $3,131 $2,491 $2,308 6.13% $2,352 $2,387 $2,319 $2,148 3.17%
1 Three Rivers Endoscopy1, 10 $4,435 $4,832 $4,832 $4,495 -0.44% $2,518 $2,804 $2,745 $2,653 -1.70%
1 Tri-County Surgical1, 10 $785 $970 $942 $1,003 -7.25% $753 $916 $911 $951 -6.95%
See footnotes on page 26.

Financial Analysis 2013 • Volume Two 11
INDIVIDUAL AMBULATORY SURGERY CENTER DATA
Ambulatory Surgery Center
Operating Margin
FY13
Total Margin
FY13
3-yr Average Total Margin FY11-FY13
Medicare Share of NPR
FY13
Medical Assistance
Share of NPR FY13
Visits FY13
Statewide Average 24.94% 25.13% 25.73% 24.47% 4.32% 3,909
Region 1 Average 12.59% 12.60% 16.47% 25.81% 4.25% 3,754
20/20 SC1, 10 41.24% 41.24% 46.38% 57.24% 2.90% 2,545
Aestique ASC1, 10 0.51% 0.51% 1.76% 23.01% 1.52% 1,739
Assoc Kidney/Hypertension1, 10, 11 -103.01% -103.01% 2.92% 36.38% 0.18% 206
CHP North SC 9.33% 9.33% 14.95% 0.00% 19.67% 7,927
Delmont SC1, 3, 10, 13 -26.12% -26.12% -16.10% 5.99% 0.00% 749
Dermatology & Cosmetic SC1, 10 -5.39% -5.39% -1.24% 43.17% 0.00% 3,457
East Side SC1, 10 -13.49% -13.26% -7.31% 39.88% 1.41% 1,876
Excela Health Norwin7 55.82% 55.82% 51.32% 25.81% 2.38% 3,668
Four Seasons Endoscopy1, 10 50.06% 50.06% 49.82% 20.55% 0.39% 4,611
Gamma SC1, 10, 13 6.26% 6.27% 5.92% 14.22% 0.31% 2,800
Heritage Valley SC7 -5.25% -5.25% -1.31% 46.81% 7.36% 3,318
Laurel SC1, 2, 10, 13 8.70% 8.70% 25.39% 19.38% 1.87% 2,681
Leo R. McCafferty Plastic1, 10 -4.97% -4.97% 8.15% 2.67% 0.00% 645
Lowry SC1, 10 -0.81% -0.79% 0.24% 36.54% 0.00% 790
McCandless Endoscopy1, 10, 13 44.62% 44.62% 38.91% 7.52% 1.04% 2,831
Mt Lebanon SC7 29.84% 29.84% 29.28% 66.55% 1.14% 3,752
Mt Pleasant SC1, 10 -11.06% -11.06% -11.22% 46.95% 2.04% 1,473
North Shore Endoscopy1, 10 40.24% 40.24% 40.07% 9.44% 5.07% 2,843
Peters Township SC1, 3, 10, 13 -97.89% -97.89% NA 34.42% 0.00% 1,260
Pittsburgh Reproductive1, 10 -17.97% -17.97% NA 0.00% 0.00% 232
Radiance SC1, 10 -3.81% -3.73% 5.49% 9.78% 0.02% 1,548
Renal Endocrine Assoc1, 10 47.45% 47.45% 41.92% 36.32% 0.15% 1,522
SC at Benbrook1, 10 30.91% 30.91% 30.19% 23.97% 2.52% 9,323
SC Cranberry1, 10 8.24% 8.24% 8.81% 51.84% 0.12% 2,651
SC Edgeworth Commons1, 10 0.91% 1.00% 9.45% 22.91% 5.20% 3,441
Shadyside SC1, 10 27.85% 27.85% 28.03% 12.46% 0.00% 279
Skin Center1, 3, 10 -3.29% -3.29% NA 0.00% 0.00% 373
South Hills Endoscopy1, 10 42.43% 42.45% 47.09% 14.81% 0.00% 10,507
South Hills SC1, 10, 13 13.82% 14.06% NA 18.53% 1.78% 910
Southwestern ASC1, 10 1.37% 1.37% 0.49% 14.67% 26.44% 2,952
Southwestern Endoscopy1, 10 31.60% 31.60% 34.17% 28.02% 12.89% 10,774
Southwestern PA Eye SC1, 10 16.98% 16.98% 19.91% 54.60% 6.23% 3,913
Spartan Health SC1, 10, 13 13.93% 13.96% 15.66% 46.04% 7.33% 4,004
Three Rivers Endoscopy1, 10 43.37% 43.39% 42.85% 27.27% 2.12% 7,112
Tri-County Surgical1, 10 4.10% 4.10% 4.37% 64.91% 0.00% 659
See footnotes on page 26.

12 Financial Analysis 2013 • Volume Two
INDIVIDUAL AMBULATORY SURGERY CENTER DATA
Region/ Ambulatory Surgery Center
Net Patient Revenue (NPR) (thousands)
3-yr Avg Change in NPR
FY10-FY13
Total Operating Expenses (TOE) (thousands)
3-yr Avg Change in TOE
FY10-FY13FY13 FY12 FY11 FY10 FY13 FY12 FY11 FY10
Statewide Average $4,239 $4,106 $4,063 $3,890 2.99% $3,204 $3,072 $3,060 $2,943 2.96%
1 Tri-State SC1, 10, 13 $5,257 $6,397 $7,474 $7,541 -10.10% $4,958 $5,180 $5,514 $5,269 -1.97%
1 UPMC Digestive Hlth Endo1, 10, 13 $2,405 $2,860 $2,940 $2,409 -0.05% $1,491 $1,570 $1,355 $1,247 6.53%
1 UPMC Mercy South Side SC $19,795 $18,723 $14,361 $14,240 13.00% $21,160 $20,357 $13,395 $13,004 20.91%
1 UPMC Monroeville SC10 $4,508 $8,979 $8,555 $7,909 -14.33% $6,136 $8,545 $7,336 $7,072 -4.41%
1 UPMC South SC $6,733 $5,276 $5,247 $5,731 5.83% $6,217 $4,836 $4,961 $5,233 6.27%
1 UPMC St. Margaret OP Ctr $15,531 $16,605 $15,751 $15,926 -0.83% $12,865 $13,291 $12,734 $13,009 -0.37%
1 Waterfront SC1, 10 $5,578 $5,977 $5,116 $4,737 5.92% $4,409 $4,172 $3,725 $3,660 6.83%
1 Western PA SC1, 10 $7,775 $8,173 $8,113 $7,591 0.81% $6,124 $6,050 $6,120 $5,828 1.69%
1 Zitelli Brodland Central1, 10 $2,389 $2,085 $1,953 $1,535 18.55% $2,388 $2,085 $1,952 $1,535 18.54%
1 Zitelli Brodland South1, 10 $2,171 $1,882 $1,787 $1,506 14.71% $2,170 $1,882 $1,787 $1,506 14.71%
Region 2 Average $4,421 $3,909 $4,640 $4,506 -0.62% $3,594 $3,546 $3,778 $3,704 -0.99%
2 Community SC1, 10, 13 $1,287 $1,464 $1,577 $1,237 1.34% $721 $776 $730 $459 18.98%
2 Greater Erie SC1, 10, 13 $1,601 NR NR NR NR $1,682 NR NR NR NR
2 Laurel Laser/Brookville1, 7, 10 $3,311 $2,820 $2,695 $2,777 6.40% $2,237 $2,584 $2,480 $2,154 1.29%
2 Lawrence County SC1, 7, 10 $1,101 $986 $1,029 $1,058 1.35% $886 $866 $797 $915 -1.03%
2 Pine Grove ASC1, 10, 13 $2,524 $2,900 $2,452 $2,151 5.79% $2,276 $2,399 $2,335 $2,302 -0.37%
2 Regional ASC10 $2,442 $2,450 $2,689 $2,836 -4.63% $2,021 $2,113 $2,095 $2,111 -1.42%
2 Saint Vincent Endoscopy3, 7 $2,944 $1,599 $1,692 $1,806 21.01% $1,475 $723 $1,474 $1,560 -1.82%
2 Saint Vincent SC Erie3, 7, 13 $13,647 $6,887 $12,286 $11,905 4.88% $9,796 $4,755 $10,012 $9,550 0.86%
2 Shriners Children-Erie SC1, 3, 7 $202 $41 NA NA NA $2,956 $5,768 NA NA NA
2 Surgery & Laser1, 10, 13 $1,750 $1,786 $1,701 $1,832 -1.50% $1,382 $1,423 $1,320 $1,517 -2.97%
2 UPMC Hamot SC10 $15,950 $15,047 $13,257 $12,684 8.58% $11,917 $11,744 $10,789 $10,822 3.37%
2 Village SC1, 10 $6,299 $7,022 $7,020 $6,770 -2.32% $5,774 $5,855 $5,747 $5,649 0.74%
Region 3 Average $4,054 $4,222 $4,615 $4,035 0.15% $3,541 $3,570 $3,609 $3,308 2.35%
3 Advanced Center Surgery1, 3, 10 $5,320 $676 NA NA NA $5,614 $1,680 NA NA NA
3 Allegheny Reg Endoscopy1, 10 $3,946 $4,386 $4,217 $4,181 -1.88% $2,393 $2,392 $2,286 $2,170 3.43%
3 Allegheny SC 1, 10 $2,417 $2,599 $2,153 $2,723 -3.75% $1,334 $1,355 $1,201 $1,186 4.15%
3 Altoona Regional SC11 $10,718 $13,807 $12,360 $11,868 -3.23% $8,078 $10,054 $9,198 $8,999 -3.41%
3 Altoona Specialty Center1, 10 NA $3 NA $4 NA NA $1 NA $2 NA
3 Center for Surgical Arts1, 10, 13 $1,962 $2,668 $2,301 $1,516 9.80% $1,870 $2,342 $2,228 $933 33.44%
3 Digestive Health/Indiana1, 10 $854 $1,695 $1,765 $1,615 -15.70% $819 $1,655 $1,626 $1,818 -18.32%
3 Indiana AS Associates1, 10 $2,779 $3,013 $2,709 $3,361 -5.77% $2,561 $2,532 $2,379 $2,613 -0.66%
3 Laurel Laser/Altoona1, 7, 10 $2,342 $2,327 $2,008 $2,149 3.00% $1,389 $1,564 $1,484 $1,541 -3.28%
3 Lee ASC7 $10,702 $11,644 $10,354 $9,559 3.98% $11,541 $12,025 $11,703 $10,486 3.36%
3 Ophthalmic Associates SC1, 10 $2,129 $2,064 $2,242 $2,377 -3.47% $1,493 $1,454 $1,543 $1,601 -2.25%
3 Plastic Surgical Assoc1, 10 $5,474 $5,778 $6,045 $5,037 2.90% $5,404 $5,782 $6,053 $5,042 2.39%
See footnotes on page 26.

Financial Analysis 2013 • Volume Two 13
INDIVIDUAL AMBULATORY SURGERY CENTER DATA
Ambulatory Surgery Center
Operating Margin
FY13
Total Margin
FY13
3-yr Average Total Margin FY11-FY13
Medicare Share of NPR
FY13
Medical Assistance
Share of NPR FY13
Visits FY13
Statewide Average 24.94% 25.13% 25.73% 24.47% 4.32% 3,909
Tri-State SC1, 10, 13 6.32% 6.31% 18.59% 19.07% 6.70% 6,195
UPMC Digestive Hlth Endo1, 10, 13 38.43% 38.44% 47.43% 13.60% 0.10% 4,446
UPMC Mercy South Side SC 2.78% 2.78% 4.43% 18.43% 2.25% 4,176
UPMC Monroeville SC10 -36.12% -36.12% 0.14% 30.06% 2.58% 8,603
UPMC South SC 7.65% 7.65% 9.32% 29.81% 1.43% 3,556
UPMC St. Margaret OP Ctr 17.16% 17.16% 19.41% 23.11% 1.20% 11,726
Waterfront SC1, 10 21.00% 21.00% 26.20% 29.83% 2.78% 7,231
Western PA SC1, 10 19.12% 19.12% 23.44% 23.08% 1.47% 4,920
Zitelli Brodland Central1, 10 0.03% 0.03% 0.02% 59.45% 0.00% 4,374
Zitelli Brodland South1, 10 0.01% 0.01% 0.01% 63.43% 0.00% 4,345
Region 2 Average 19.18% 19.19% 14.73% 30.35% 6.60% 4,871
Community SC1, 10, 13 44.00% 44.00% 48.56% 56.22% 25.07% 2,344
Greater Erie SC1, 10, 13 -5.04% -5.04% NR 22.04% 0.00% 3,343
Laurel Laser/Brookville1, 7, 10 32.42% 32.42% 17.27% 50.29% 0.28% 3,451
Lawrence County SC1, 7, 10 19.48% 19.48% 18.18% 67.38% 2.29% 1,411
Pine Grove ASC1, 10, 13 9.82% 9.82% 12.93% 29.87% 8.92% 3,336
Regional ASC10 17.22% 17.24% -23.00% 32.54% 1.63% 2,226
Saint Vincent Endoscopy3, 7 50.39% 50.39% 41.41% 26.35% 2.18% 3,587
Saint Vincent SC Erie3, 7, 13 28.45% 28.45% 25.41% 35.12% 7.95% 11,674
Shriners Children-Erie SC1, 3, 7 -1193.67% -1193.67% NA 0.00% 52.19% 315
Surgery & Laser1, 10, 13 21.00% 21.08% 21.27% 19.65% 2.03% 2,316
UPMC Hamot SC10 26.23% 26.23% 22.54% 21.47% 7.52% 18,101
Village SC1, 10 8.34% 8.38% 14.62% 27.34% 5.98% 6,349
Region 3 Average 12.73% 12.73% 14.18% 23.02% 5.03% 3,640
Advanced Center Surgery1, 3, 10 -5.42% -5.42% NA 9.58% 0.42% 2,429
Allegheny Reg Endoscopy1, 10 39.35% 39.35% 43.66% 15.52% 1.99% 7,277
Allegheny SC1, 10 44.80% 44.80% 45.75% 25.10% 11.63% 4,099
Altoona Regional SC11 24.63% 24.63% 25.90% 25.80% 6.60% 4,290
Altoona Specialty Center1, 10 NA NA NA NA NA 1
Center for Surgical Arts1, 10, 13 4.70% 4.70% 7.08% 19.90% 6.96% 1,818
Digestive Health/Indiana1, 10 4.16% 4.16% 3.12% 7.80% 0.00% 1,352
Indiana AS Associates1, 10 9.32% 9.32% 14.81% 26.35% 5.15% 2,594
Laurel Laser/Altoona1, 7, 10 40.68% 40.68% 33.53% 41.01% 0.55% 2,577
Lee ASC7 -7.85% -7.85% -7.86% 21.52% 8.04% 5,853
Ophthalmic Associates SC1, 10 29.90% 29.97% 30.32% 61.59% 6.62% 4,104
Plastic Surgical Assoc1, 10 1.29% 1.30% 0.37% 17.94% 0.67% 7,286
See footnotes on page 26.

14 Financial Analysis 2013 • Volume Two
INDIVIDUAL AMBULATORY SURGERY CENTER DATA
Region/ Ambulatory Surgery Center
Net Patient Revenue (NPR) (thousands)
3-yr Avg Change in NPR
FY10-FY13
Total Operating Expenses (TOE) (thousands)
3-yr Avg Change in TOE
FY10-FY13FY13 FY12 FY11 FY10 FY13 FY12 FY11 FY10
Statewide Average $4,239 $4,106 $4,063 $3,890 2.99% $3,204 $3,072 $3,060 $2,943 2.96%
Region 4 Average $5,103 $5,106 $5,215 $4,984 0.80% $3,382 $3,295 $3,585 $3,378 0.04%
4 Betz Ophthalmology1, 10 $475 $490 $473 $408 5.43% $310 $341 $274 $283 3.19%
4 Brookpark SC1, 10 $301 $311 $302 $292 1.09% $228 $261 $238 $239 -1.44%
4 Central PA Endoscopy Ctr1, 10 $2,080 $1,860 $1,907 $1,962 2.00% $1,631 $1,860 $1,907 $1,999 -6.13%
4 Evangelical ASC $3,982 $4,609 $5,375 $5,741 -10.21% $4,388 $4,797 $5,205 $5,476 -6.63%
4 Geisinger Aest & Cosmetic2, 4, 13 $79 NA NA NA NA $849 NA NA NA NA
4 Geisinger Endo & SC7, 11 $3,152 $3,416 $2,849 $2,947 2.32% $2,396 $2,321 $2,044 $2,028 6.05%
4 Geisinger Gastro-Lewistown3, 7 $2,705 $312 $1,059 $1,608 22.75% $1,765 $394 $1,200 $1,793 -0.51%
4 Geisinger OP Woodbine $35,042 $34,007 $33,718 $31,314 3.97% $18,115 $18,730 $19,589 $17,387 1.39%
4 Lewisburg Plastic & Laser1, 10 $478 $510 $435 $424 4.27% $471 $458 $418 $333 13.83%
4 Mifflin County Com SC1, 10 $722 $735 $706 $809 -3.56% $728 $826 $717 $775 -2.02%
4 Mount Nittany SC11 $18,424 $16,339 $14,986 $13,157 13.34% $11,360 $8,345 $8,479 $8,188 12.91%
4 Penn State Hershey Endo10 $730 $645 NA NA NA $843 $738 NA NA NA
4 SC Central PA1, 7, 10 $6,065 $5,668 $4,817 $3,945 17.91% $4,106 $3,396 $3,040 $2,942 13.19%
4 Susquehanna Endoscopy1, 10 $1,614 $2,122 $1,724 $1,795 -3.36% $1,517 $1,568 $1,556 $1,346 4.22%
4 Susquehanna SC10 $1,407 $1,530 $1,238 $1,113 8.79% $1,406 $1,481 $1,242 $1,096 9.41%
4 UOC Surgical Services1, 10 $4,399 $4,032 $3,419 $4,259 1.09% $4,001 $3,911 $4,284 $3,403 5.86%
Region 5 Average $4,531 $4,509 $4,420 $4,374 1.19% $3,262 $3,213 $3,213 $3,158 1.10%
5 Apple Hill SC10 $12,837 $13,456 $13,593 $12,444 1.05% $10,717 $11,029 $10,618 $9,960 2.53%
5 Calcagno & Rossi Vein SC1, 10 $1,239 $1,172 $456 NA NA $489 $414 $142 NA NA
5 Capital Surgery & Laser1, 4, 10, 13 $933 NA NA NA NA $1,427 NA NA NA NA
5 Carlisle Endoscopy1, 10 $2,323 $2,196 $2,186 $2,425 -1.40% $2,323 $2,196 $2,186 $2,426 -1.42%
5 Carlisle Outpatient SC 1, 7, 10 $5,993 $7,548 $7,115 $4,161 14.68% $3,679 $3,793 $4,191 $1,597 43.47%
5 Center for Spine Care1, 10 $367 $646 $874 $803 -18.10% $370 $645 $787 $706 -15.84%
5 Chambersburg Endoscopy1, 10 $2,501 $2,434 $2,239 $2,213 4.34% $1,632 $1,518 $1,509 $1,494 3.08%
5 Children’s SC1, 3, 10 $4,889 $4,183 $2,397 NA NA $2,958 $2,598 $2,106 NA NA
5 Cumberland SC1, 10 $207 $175 $282 $659 -22.88% $196 $226 $296 $444 -18.58%
5 Digestive Disease Inst1, 10 $2,598 $2,526 $2,457 $2,618 -0.26% $2,710 $2,515 $2,477 $2,615 1.22%
5 Endoscopy Ctr/Central PA1, 10 $1,158 $1,234 $1,255 $1,182 -0.68% $1,151 $1,159 $1,223 $1,102 1.51%
5 Eyes of York SC1, 10 $2,035 $1,860 $1,452 $1,415 14.63% $1,705 $1,501 $1,177 $1,004 23.31%
5 Foot and Ankle SC1, 10 $2,085 $2,012 $2,380 $2,742 -7.99% $1,338 $1,288 $1,353 $1,445 -2.46%
5 Grandview Surgery & Laser1, 10 $8,880 $9,433 $8,917 $8,579 1.17% $5,902 $6,238 $5,652 $5,368 3.31%
5 GSH Outpatient SC7 $4,524 $4,568 $4,128 $4,928 -2.73% $2,152 $2,003 $2,008 $1,973 3.03%
5 Hanover SC3, 10 $3,383 $3,587 $3,553 $1,873 NA $3,066 $3,252 $3,347 $1,925 NA
5 Harrisburg Endoscopy & SC1, 10 $3,827 $3,821 $3,801 $3,764 0.56% $3,826 $3,820 $3,797 $3,775 0.45%
5 Harrisburg Pain Mgmt1, 10 $3,782 $3,147 $3,016 $3,233 5.67% $3,597 $2,905 $2,902 $2,894 8.10%
5 Hershey Endoscopy1, 10 $3,207 $3,059 $3,075 $2,989 2.43% $2,129 $2,019 $1,933 $1,900 4.02%See footnotes on page 26.

Financial Analysis 2013 • Volume Two 15
INDIVIDUAL AMBULATORY SURGERY CENTER DATA
Ambulatory Surgery Center
Operating Margin
FY13
Total Margin
FY13
3-yr Average Total Margin FY11-FY13
Medicare Share of NPR
FY13
Medical Assistance
Share of NPR FY13
Visits FY13
Statewide Average 24.94% 25.13% 25.73% 24.47% 4.32% 3,909
Region 4 Average 33.98% 33.98% 34.61% 21.34% 1.68% 3,432
Betz Ophthalmology1, 10 34.64% 34.64% 35.66% 74.00% 0.00% 541
Brookpark SC1, 10 24.21% 24.21% 21.19% 18.86% 0.00% 278
Central PA Endoscopy Ctr1, 10 21.56% 21.56% 7.67% 27.95% 2.05% 4,664
Evangelical ASC -10.10% -10.10% -2.90% 11.09% 1.91% 1,550
Geisinger Aest & Cosmetic2, 4, 13 -969.91% -969.91% NA 0.45% 0.10% 842
Geisinger Endo & SC7, 11 23.98% 23.98% 29.19% 17.86% 3.58% 4,277
Geisinger Gastro-Lewistown3, 7 34.73% 34.73% 20.07% 36.62% 6.02% 3,759
Geisinger OP Woodbine 48.31% 48.31% 46.43% 16.74% 1.54% 8,797
Lewisburg Plastic & Laser1, 10 1.57% 1.57% 5.46% 13.58% 0.00% 320
Mifflin County Com SC1, 10 3.23% 3.23% -3.53% 60.56% 5.52% 2,226
Mount Nittany SC11 38.33% 38.33% 43.40% 19.48% 1.16% 6,961
Penn State Hershey Endo10 -15.49% -15.49% NA 15.32% 1.10% 1,057
SC Central PA1, 7, 10 35.30% 35.30% 39.60% 50.13% 1.87% 6,845
Susquehanna Endoscopy1, 10 6.03% 6.03% 15.04% 25.48% 1.56% 8,553
Susquehanna SC10 0.07% 0.07% 1.07% 21.98% 1.22% 1,334
UOC Surgical Services1, 10 9.04% 9.04% -2.91% 10.06% 0.55% 2,911
Region 5 Average 28.04% 28.49% 28.32% 22.98% 4.92% 4,233
Apple Hill SC10 16.66% 16.71% 19.09% 23.47% 3.87% 10,451
Calcagno & Rossi Vein SC1, 10 60.54% 60.67% 63.62% 24.30% 0.00% 1,255
Capital Surgery & Laser1, 4, 10, 13 -52.96% -52.96% NA 30.54% 0.00% 1,053
Carlisle Endoscopy1, 10 0.00% 0.00% 0.00% 27.34% 1.10% 6,079
Carlisle Outpatient SC1, 7, 10 38.61% 38.61% 43.54% 28.87% 0.73% 1,952
Center for Spine Care1, 10 -0.99% -0.99% 4.95% 21.85% 1.78% 1,739
Chambersburg Endoscopy1, 10 34.77% 34.77% 35.13% 26.38% 1.53% 4,999
Children’s SC1, 3, 10 39.49% 50.05% 38.04% 0.00% 69.79% 2,108
Cumberland SC1, 10 4.96% 3.55% -6.70% 4.58% 0.00% 289
Digestive Disease Inst1, 10 -4.31% -3.14% -1.09% 46.62% 0.00% 5,012
Endoscopy Ctr/Central PA1, 10 0.53% 0.53% 3.21% 19.46% 0.00% 2,197
Eyes of York SC1, 10 16.86% 16.86% 18.33% 62.99% 0.00% 2,519
Foot and Ankle SC1, 10 35.84% 35.84% 38.84% 17.83% 0.00% 814
Grandview Surgery & Laser1, 10 33.73% 33.73% 35.29% 27.65% 0.97% 5,499
GSH Outpatient SC7 52.44% 52.44% 53.39% 29.70% 3.84% 3,832
Hanover SC3, 10 9.40% 9.40% 8.19% 42.50% 0.13% 2,648
Harrisburg Endoscopy & SC1, 10 0.02% 0.02% 0.05% 22.44% 1.19% 8,091
Harrisburg Pain Mgmt1, 10 4.92% 4.92% 5.45% 22.55% 2.60% 7,829
Hershey Endoscopy1, 10 33.60% 33.60% 34.94% 15.81% 0.00% 3,678See footnotes on page 26.

16 Financial Analysis 2013 • Volume Two
INDIVIDUAL AMBULATORY SURGERY CENTER DATA
Region/ Ambulatory Surgery Center
Net Patient Revenue (NPR) (thousands)
3-yr Avg Change in NPR
FY10-FY13
Total Operating Expenses (TOE) (thousands)
3-yr Avg Change in TOE
FY10-FY13FY13 FY12 FY11 FY10 FY13 FY12 FY11 FY10
Statewide Average $4,239 $4,106 $4,063 $3,890 2.99% $3,204 $3,072 $3,060 $2,943 2.96%
5 Hershey Outpatient SC1, 10 $7,922 $7,993 $7,291 $7,139 3.66% $7,863 $7,648 $7,122 $6,940 4.43%
5 Hillside Endoscopy1, 10 $406 $402 $286 NA NA $276 $249 $240 NA NA
5 Holy Spirit Endoscopy $931 $687 NA NA NA $1,754 $1,340 NA NA NA
5 Lancaster Gastro Center1, 10 $5,285 $5,137 $4,959 $4,983 2.02% $2,383 $2,297 $2,106 $2,142 3.75%
5 Leader SC1, 10, 13 $1,585 $1,302 $1,367 $1,406 4.23% $1,154 $783 $709 $675 23.65%
5 Ludwick Laser & SC1, 10 $1,607 $1,457 $1,575 $1,801 -3.59% $1,236 $1,225 $1,151 $1,196 1.12%
5 Memorial Outpatient Endo1, 10, 13 $3,734 $1,724 $930 $1,081 81.78% $1,060 $814 $561 $628 22.88%
5 Memorial SC York1, 10, 13 $4,823 $3,038 $3,132 $2,993 20.38% $2,724 $3,297 $3,483 $3,327 -6.04%
5 Mid-Atlantic Gastro Ctr1, 10 $3,182 $3,086 $2,750 $2,561 8.08% $1,580 $1,491 $1,499 $1,348 5.73%
5 Mid-Atlantic Gastro II1, 10 $2,995 $2,854 $2,521 $2,395 8.34% $1,940 $1,764 $1,805 $1,758 3.46%
5 Neurospine Center1, 10 $3,170 $3,644 $3,598 $2,802 4.37% $2,325 $2,460 $2,647 $2,488 -2.18%
5 North Pointe SC1, 10 $9,619 $9,368 $8,295 $6,224 18.18% $5,094 $5,387 $5,156 $4,350 5.71%
5 Ophthalmology & Surgical1, 10 $4,194 $3,878 $3,849 $4,148 0.37% $2,827 $2,670 $2,788 $2,899 -0.82%
5 Ophthalmology SC1, 10, 13 $1,867 $2,030 $2,020 $2,316 -6.46% $1,819 $1,879 $2,116 $2,465 -8.73%
5 OSS Ambulatory SC1, 7, 10 $6,705 $10,468 $11,488 $12,854 -15.95% $6,153 $8,208 $8,395 $8,002 -7.70%
5 PA Eye SC1, 10 $2,488 $2,525 $2,309 $2,049 7.14% $1,901 $1,865 $2,239 $1,512 8.57%
5 Physicians’ SC Lancaster1, 10 $22,071 $22,765 $22,710 $22,048 0.03% $11,730 $11,333 $10,688 $10,400 4.26%
5 PRISM Center1, 7, 10 $1,395 $1,763 $1,843 $1,605 -4.37% $1,250 $1,663 $1,660 $1,424 -4.08%
5 Roy A. Himelfarb SC10 $4,575 $4,545 $4,220 $4,217 2.83% $3,724 $3,663 $3,460 $3,541 1.71%
5 SC Lancaster1, 10 $10,657 $9,912 $7,895 $9,236 5.13% $7,470 $7,363 $7,058 $7,101 1.73%
5 SC of Lebanon1, 10 $7,086 $7,482 $6,545 $6,811 1.34% $3,468 $3,542 $3,459 $3,915 -3.80%
5 Susquehanna Valley SC1, 10 $9,062 $9,691 $8,688 $9,727 -2.28% $8,387 $7,941 $7,765 $8,095 1.20%
5 Valley View SC1, 10 $971 $1,029 $1,005 $1,068 -3.05% $803 $737 $682 $695 5.15%
5 Wellspan SC7 $3,060 $3,270 $4,591 $3,311 -2.53% $2,360 $2,588 $2,762 $2,671 -3.89%
5 West Shore Endoscopy1, 10 $13,187 $13,280 $14,130 $13,302 -0.29% $10,253 $9,703 $9,059 $8,738 5.78%
5 West Shore SC1, 10, 13 $8,375 $8,950 $8,108 $7,799 2.46% $6,139 $6,255 $6,102 $6,336 -1.04%
5 York Endoscopy1, 10 $3,724 $3,157 $3,457 $3,606 1.09% $2,790 $2,767 $3,016 $3,301 -5.15%
5 York Pain Specialists1, 10 $1,513 $1,843 $1,949 $1,756 -4.62% $1,478 $1,716 $1,878 $1,788 -5.78%
Region 6 Average $4,098 $3,757 $3,783 $3,296 8.11% $2,702 $2,606 $2,515 $2,382 4.48%
6 Angelina Theresa Bucci SC1, 10 $1,330 $1,403 $1,447 $1,321 0.24% $1,247 $1,206 $1,202 $1,091 4.74%
6 Center for Advanced Surg1, 10 $3,593 $3,579 $3,850 $4,662 -7.64% $2,919 $3,108 $3,395 $3,563 -6.03%
6 Center Same Day Surgery1, 3, 7, 10, 13 $11,945 $9,323 $9,793 $1,952 NA $1,703 $1,710 $1,907 $485 NA
6 East Stroudsburg ASC1, 7, 10 $3,905 $3,868 NA NA NA $3,928 $3,513 NA NA NA
6 Eynon SC1, 10 $1,281 $1,349 $1,555 $1,631 -7.15% $879 $851 $885 $994 -3.86%
6 Gateway SC1, 3, 10 $3,108 $3,166 $3,014 $1,590 NA $1,615 $1,620 $1,542 $719 NA
6 Guthrie Clinic7, 11 $3,075 $3,348 $3,491 $3,494 -4.00% $3,509 $3,432 $3,304 $3,158 3.70%
See footnotes on page 26.

Financial Analysis 2013 • Volume Two 17
INDIVIDUAL AMBULATORY SURGERY CENTER DATA
Ambulatory Surgery Center
Operating Margin
FY13
Total Margin
FY13
3-yr Average Total Margin FY11-FY13
Medicare Share of NPR
FY13
Medical Assistance
Share of NPR FY13
Visits FY13
Statewide Average 24.94% 25.13% 25.73% 24.47% 4.32% 3,909
Hershey Outpatient SC1, 10 0.76% 0.77% 2.49% 18.05% 12.37% 6,537
Hillside Endoscopy1, 10 31.94% 31.94% 30.05% 16.28% 0.24% 767
Holy Spirit Endoscopy -88.46% -88.46% NA 16.40% 0.79% 749
Lancaster Gastro Center1, 10 54.91% 54.99% 55.96% 18.53% 1.01% 7,988
Leader SC1, 10, 13 27.16% 27.16% 37.80% 17.11% 0.00% 1,689
Ludwick Laser & SC1, 10 23.17% 23.17% 22.16% 72.98% 0.21% 1,531
Memorial Outpatient Endo1, 10, 13 71.62% 71.62% 61.90% 26.91% 1.14% 2,587
Memorial SC York1, 10, 13 43.53% 43.53% 13.57% 42.88% 7.79% 2,131
Mid-Atlantic Gastro Ctr1, 10 50.33% 50.33% 49.32% 17.11% 0.00% 5,583
Mid-Atlantic Gastro II1, 10 35.22% 35.22% 34.18% 15.83% 0.00% 5,429
Neurospine Center1, 10 26.65% 26.65% 28.61% 0.98% 1.77% 532
North Pointe SC1, 10 47.04% 47.09% 42.72% 2.65% 9.61% 3,777
Ophthalmology & Surgical1, 10 32.58% 32.58% 30.56% 50.54% 4.05% 4,192
Ophthalmology SC1, 10, 13 2.55% 3.10% 1.92% 31.50% 4.25% 2,244
OSS Ambulatory SC1, 7, 10 8.24% 8.24% 20.90% 11.40% 2.51% 3,016
PA Eye SC1, 10 23.60% 26.43% 19.06% 43.84% 0.41% 9,428
Physicians’ SC Lancaster1, 10 46.87% 46.87% 50.05% 20.29% 1.48% 12,051
PRISM Center1, 7, 10 10.38% 10.38% 8.56% 28.10% 5.01% 2,637
Roy A. Himelfarb SC10 18.61% 19.11% 19.14% 17.97% 12.66% 3,209
SC Lancaster1, 10 29.91% 30.68% 24.14% 28.91% 10.43% 8,012
SC of Lebanon1, 10 51.06% 51.07% 50.42% 36.75% 6.54% 5,460
Susquehanna Valley SC1, 10 7.45% 7.47% 12.34% 16.06% 0.48% 6,704
Valley View SC1, 10 17.31% 17.31% 26.06% 74.00% 0.00% 1,258
Wellspan SC7 22.89% 22.89% 29.41% 26.10% 0.41% 3,150
West Shore Endoscopy1, 10 22.25% 22.30% 28.55% 9.97% 0.63% 8,561
West Shore SC1, 10, 13 26.70% 26.62% 27.26% 21.92% 1.98% 7,226
York Endoscopy1, 10 25.14% 25.14% 17.21% 16.08% 2.22% 6,941
York Pain Specialists1, 10 2.31% 2.31% 4.38% 37.80% 3.71% 3,515
Region 6 Average 35.56% 35.79% 34.45% 24.43% 4.81% 4,554
Angelina Theresa Bucci SC1, 10 6.26% 6.26% 12.57% 41.38% 0.88% 1,990
Center for Advanced Surg1, 10 19.04% 19.09% 14.67% 14.24% 3.41% 2,291
Center Same Day Surgery1, 3, 7, 10, 13 85.74% 85.74% 82.87% 13.73% 5.52% 3,436
East Stroudsburg ASC1, 7, 10 -0.58% -0.58% NA 14.75% 2.13% 1,877
Eynon SC1, 10 31.38% 31.38% 37.50% 24.93% 5.21% 2,372
Gateway SC1, 3, 10 48.02% 48.02% 48.55% 20.91% 0.52% 5,801
Guthrie Clinic7, 11 5.58% 6.04% 11.46% 13.24% 18.08% 5,860
See footnotes on page 26.

18 Financial Analysis 2013 • Volume Two
INDIVIDUAL AMBULATORY SURGERY CENTER DATA
Region/ Ambulatory Surgery Center
Net Patient Revenue (NPR) (thousands)
3-yr Avg Change in NPR
FY10-FY13
Total Operating Expenses (TOE) (thousands)
3-yr Avg Change in TOE
FY10-FY13FY13 FY12 FY11 FY10 FY13 FY12 FY11 FY10
Statewide Average $4,239 $4,106 $4,063 $3,890 2.99% $3,204 $3,072 $3,060 $2,943 2.96%
6 Hazleton ASC1, 10 $1,752 $2,074 $2,191 $1,651 2.05% $986 $1,255 $1,140 $1,094 -3.29%
6 Hazleton Endoscopy1, 10, 13 $747 $736 $821 $770 -0.98% $752 $734 $823 $773 -0.89%
6 Kingston Ophthalmology1, 10 $4,781 $4,700 $4,581 $4,734 0.33% $2,791 $2,772 $2,563 $2,738 0.64%
6 Mountain Laurel SC1, 10 $2,589 $2,567 $2,325 $2,217 5.59% $1,625 $1,724 $1,680 $1,511 2.52%
6 NEI AS1, 10 $5,584 $4,420 $4,838 $4,996 3.92% $4,847 $3,998 $4,063 $4,467 2.83%
6 North East SC1, 10 $6,729 $6,510 $6,216 $5,748 5.69% $6,590 $6,163 $5,690 $5,663 5.46%
6 Pocono ASC1, 10, 13 $6,789 $6,331 $6,191 $5,749 6.03% $5,997 $5,232 $4,590 $4,439 11.70%
6 Regional Hospital SC1, 7, 10, 13 $5,291 $2,203 $2,028 NR NR $1,030 $1,125 $1,870 NR NR
6 Renaissance Center1, 10 $701 $519 $672 $715 -0.62% $810 $654 $833 $776 1.46%
6 Riverview ASC1, 10 $5,170 $5,303 $4,782 $5,012 1.05% $3,796 $3,568 $3,241 $3,524 2.57%
6 Same Day Geisinger South7 $6,543 $6,274 $6,206 $5,001 10.28% $5,024 $5,314 $4,780 $4,341 5.25%
6 Scranton Endoscopy1, 10 $4,878 $4,884 $4,852 $4,953 -0.50% $1,740 $1,713 $1,684 $1,772 -0.59%
6 Surgical Specialty NE PA1, 10 $2,162 $2,577 $3,018 $3,459 -12.50% $2,253 $2,429 $2,584 $2,773 -6.25%
Region 7 Average $4,370 $4,214 $3,988 $3,773 5.27% $2,814 $2,670 $2,630 $2,460 4.80%
7 Berks Ambulatory SC1, 10 $954 $794 $839 $868 3.30% $856 $689 $658 $732 5.68%
7 Berks Digestive Health1, 10 $6,457 $6,588 $6,122 $6,091 2.00% $3,830 $3,395 $3,157 $3,235 6.13%
7 Berks Urologic SC10 $4,203 $4,633 $3,995 $3,582 5.78% $2,481 $2,565 $2,213 $2,191 4.41%
7 Berkshire Eye SC1, 10 $2,979 $2,894 $2,773 $2,828 1.78% $1,879 $1,753 $1,732 $1,702 3.47%
7 Bethlehem Endoscopy1, 10 $2,834 $2,768 $2,642 $2,480 4.76% $1,639 $1,578 $1,563 $1,397 5.78%
7 Center for Specialized1, 10 $5,637 $4,674 $4,766 $5,286 2.22% $3,705 $3,174 $3,199 $3,861 -1.35%
7 College Heights Endoscopy1, 10 $5,631 $5,560 $5,296 $5,484 0.89% $2,312 $2,256 $2,208 $2,380 -0.96%
7 Eastern PA Endoscopy1, 10 $4,908 $4,729 $4,847 $4,454 3.39% $2,972 $2,646 $2,758 $2,654 4.00%
7 Fairgrounds SC3, 7 $12,416 $8,384 $7,114 $3,904 NA $9,231 $7,515 $6,778 $3,416 NA
7 Keystone SC1, 10 $726 $663 $567 $639 4.56% $576 $587 $556 $554 1.34%
7 Mahoning Valley ASC1, 10, 13 $1,099 $1,184 $1,322 $1,308 -5.32% $684 $755 $788 $829 -5.85%
7 PA Eye & Ear SC10 $4,745 $4,692 $4,688 $4,789 -0.31% $3,720 $3,631 $3,530 $3,537 1.73%
7 Premier Podiatric SC1, 10 $325 $238 $266 $365 -3.67% $299 $201 $209 $281 2.18%
7 Progressive Laser Surgi1, 10, 13 $865 $1,042 $1,098 $1,251 -10.30% $753 $731 $776 $823 -2.84%
7 Progressive Surgical Inst1, 10, 13 $1,527 $1,381 $1,358 $1,312 5.46% $1,063 $836 $771 $812 10.29%
7 Proserpi-Schlechter1, 10 $272 $309 $305 $180 17.08% $273 $308 $305 $189 14.67%
7 Reading ASC1, 10 $10,703 $10,391 $9,693 $8,491 8.68% $5,471 $4,920 $4,736 $4,732 5.20%
7 Reading Endoscopy1, 10, 11 $1,436 $1,478 $1,461 $1,493 -1.28% $1,167 $1,307 $1,166 $1,123 1.28%
7 Reading SC/Spring Ridge1, 10 $20,693 $19,858 $19,435 $18,255 4.45% $12,495 $12,530 $12,264 $11,813 1.92%
7 SC of Allentown1, 10 $13,425 $14,308 $14,953 $13,776 -0.85% $9,568 $9,463 $10,609 $9,623 -0.19%
7 SC Pottsville1, 10 $3,377 $3,519 $3,372 $3,705 -2.95% $2,713 $2,725 $2,989 $3,207 -5.13%
7 Schuylkill Endoscopy1, 10 $3,885 $3,695 $3,538 $3,585 2.78% $2,086 $2,016 $2,008 $1,918 2.91%
See footnotes on page 26.

Financial Analysis 2013 • Volume Two 19
INDIVIDUAL AMBULATORY SURGERY CENTER DATA
Ambulatory Surgery Center
Operating Margin
FY13
Total Margin
FY13
3-yr Average Total Margin FY11-FY13
Medicare Share of NPR
FY13
Medical Assistance
Share of NPR FY13
Visits FY13
Statewide Average 24.94% 25.13% 25.73% 24.47% 4.32% 3,909
Hazleton ASC1, 10 43.74% 43.74% 43.83% 52.04% 8.05% 1,259
Hazleton Endoscopy1, 10, 13 -0.68% -0.68% -0.21% 24.42% 0.35% 1,554
Kingston Ophthalmology1, 10 41.63% 43.93% 43.11% 46.06% 0.03% 5,003
Mountain Laurel SC1, 10 37.24% 37.33% 32.84% 29.86% 6.92% 5,046
NEI AS1, 10 13.21% 13.21% 13.03% 66.06% 3.82% 15,143
North East SC1, 10 17.43% 17.43% 20.66% 16.66% 4.29% 6,866
Pocono ASC1, 10, 13 11.66% 12.73% 18.84% 23.26% 1.91% 8,688
Regional Hospital SC1, 7, 10, 13 80.53% 80.53% 57.73% 12.14% 1.55% 2,137
Renaissance Center1, 10 -15.52% -15.52% -21.45% 7.31% 0.00% 1,202
Riverview ASC1, 10 26.56% 26.56% 30.48% 23.10% 1.85% 5,833
Same Day Geisinger South7 23.22% 23.22% 20.53% 22.20% 17.71% 2,994
Scranton Endoscopy1, 10 64.32% 64.33% 64.84% 19.21% 0.00% 9,266
Surgical Specialty NE PA1, 10 -4.22% -4.22% 6.36% 29.56% 5.64% 2,457
Region 7 Average 35.75% 36.21% 35.77% 25.32% 2.78% 4,600
Berks Ambulatory SC1, 10 10.21% 10.21% 14.81% 3.75% 0.00% 501
Berks Digestive Health1, 10 41.08% 40.92% 46.30% 18.97% 0.02% 18,418
Berks Urologic SC10 41.57% 41.57% 44.04% 43.44% 3.10% 7,910
Berkshire Eye SC1, 10 37.02% 37.02% 38.07% 50.88% 1.04% 3,330
Bethlehem Endoscopy1, 10 42.17% 42.06% 41.85% 23.34% 0.98% 4,008
Center for Specialized 1, 10 34.28% 34.30% 33.78% 47.68% 1.46% 5,277
College Heights Endoscopy1, 10 58.95% 58.95% 58.90% 19.81% 0.06% 7,355
Eastern PA Endoscopy1, 10 39.45% 39.45% 42.17% 21.69% 1.69% 6,315
Fairgrounds SC3, 7 25.65% 25.65% 15.74% 21.54% 4.18% 6,653
Keystone SC1, 10 20.67% 20.67% 12.14% 13.51% 0.20% 493
Mahoning Valley ASC1, 10, 13 37.82% 37.82% 38.24% 61.96% 3.05% 4,449
PA Eye & Ear SC10 21.65% 21.65% 22.98% 36.71% 2.99% 4,359
Premier Podiatric SC1, 10 7.87% 7.87% 14.38% 28.91% 0.00% 225
Progressive Laser Surgi1, 10, 13 12.88% 12.88% 24.77% 40.18% 19.30% 738
Progressive Surgical Inst1, 10, 13 30.37% 30.37% 37.42% 47.96% 9.99% 1,824
Proserpi-Schlechter1, 10 -0.32% -0.32% -0.12% 0.00% 0.00% 186
Reading ASC1, 10 48.92% 52.88% 52.28% 12.96% 1.75% 7,769
Reading Endoscopy1, 10, 11 18.77% 18.79% 16.86% 23.30% 22.91% 2,810
Reading SC/Spring Ridge1, 10 39.62% 39.66% 37.89% 9.03% 3.10% 8,079
SC of Allentown1, 10 28.73% 28.79% 30.58% 16.62% 0.29% 8,626
SC Pottsville1, 10 19.67% 19.67% 17.94% 24.48% 4.91% 3,010
Schuylkill Endoscopy1, 10 46.31% 46.40% 45.12% 29.39% 0.00% 9,849
See footnotes on page 26.

20 Financial Analysis 2013 • Volume Two
INDIVIDUAL AMBULATORY SURGERY CENTER DATA
Region/ Ambulatory Surgery Center
Net Patient Revenue (NPR) (thousands)
3-yr Avg Change in NPR
FY10-FY13
Total Operating Expenses (TOE) (thousands)
3-yr Avg Change in TOE
FY10-FY13FY13 FY12 FY11 FY10 FY13 FY12 FY11 FY10
Statewide Average $4,239 $4,106 $4,063 $3,890 2.99% $3,204 $3,072 $3,060 $2,943 2.96%
7 State Hill SC1, 10 $1,247 $1,131 $812 $828 16.83% $1,103 $1,019 $730 $602 27.74%
7 Twin Rivers Endoscopy1, 10 $3,816 $4,148 $3,435 $3,148 7.07% $1,940 $1,924 $1,862 $1,584 7.51%
7 Valley Access/Eastern PA1, 10 $1,769 $1,780 $1,776 $1,614 3.20% $1,253 $1,283 $1,349 $1,256 -0.07%
7 Valley Access/Lehigh1, 10 $1,107 $1,161 $1,027 $1,104 0.09% $794 $837 $817 $825 -1.27%
7 Valley Eye SC1, 10 $5,513 $5,069 $4,777 $4,804 4.92% $4,493 $4,296 $4,937 $4,089 3.29%
7 Valley SC1, 10 $1,841 $2,252 $2,316 $2,433 -8.10% $1,155 $1,387 $1,234 $1,281 -3.26%
7 Wyomissing Surgical Serv1, 10 $2,342 $2,889 $2,938 $2,893 -6.35% $1,092 $1,112 $1,036 $1,015 2.52%
Region 8 Average $4,250 $3,925 $3,724 $3,599 6.02% $3,168 $2,852 $2,863 $2,807 4.28%
8 Abington Endoscopy3, 7, 13 $10,266 $2,837 $4,169 $4,260 47.00% $8,633 $2,787 $4,147 $4,246 34.44%
8 Abington SC10 $12,587 $14,693 $14,401 $14,644 -4.68% $12,075 $13,084 $13,059 $12,566 -1.30%
8 AFP SC1, 10 $908 $844 $913 $1,009 -3.36% $831 $738 $713 $815 0.67%
8 Ambulatory Endo SC/Bucks1, 10, 13 $1,637 $1,953 NR $2,209 -8.63% $1,355 $1,442 NR $2,204 -12.85%
8 ASC Bucks County7 $9,076 $8,239 $11,561 $11,632 -7.32% $3,997 $3,690 $6,654 $6,352 -12.36%
8 ASC St. Mary1, 3, 10 $8,360 $7,559 $804 NA NA $6,462 $6,014 $2,613 NA NA
8 Best Impression SC1, 10, 13 $171 $158 $174 $78 39.72% $132 $138 $125 $92 14.72%
8 Blue Bell SC1, 3, 7, 10 $5,859 $2,833 $6,164 $7,214 -6.26% $5,535 $2,620 $4,958 $4,573 7.01%
8 Brandywine SC1, 10, 13 $329 $338 $278 $321 0.81% $337 $331 $298 $301 4.03%
8 Brandywine Vly Endoscopy1, 10 $1,228 $1,368 $1,226 $1,079 4.62% $796 $754 $763 $867 -2.72%
8 Bucks County GI Endo SC1, 10 $2,285 $2,333 $2,466 $2,588 -3.90% $2,048 $1,856 $1,812 $1,848 3.60%
8 Bux-Mont Endoscopy1, 10 $2,181 $2,048 $2,191 $2,105 1.20% $1,351 $1,390 $1,517 $1,475 -2.81%
8 Childrens SC Malvern1, 3, 10 $4,828 $2,023 NA NA NA $3,238 $2,237 NA NA NA
8 CHOP ASC Exton7 $9,217 $8,647 $10,582 $10,248 -3.35% $3,608 $3,678 $5,177 $4,839 -8.48%
8 Cornerstone ASC1, 10 $2,641 $2,092 $1,760 $1,747 17.06% $1,649 $1,127 $991 $1,671 -0.44%
8 Crozer Endo3, 7 $2,803 $1,511 NA NA NA $2,009 $1,184 NA NA NA
8 Crozer Keystone Haverford2, 7 $2,590 $6,385 $6,357 $6,503 NA $1,562 $5,609 $5,522 $5,525 NA
8 Crozer SC at Brinton Lake2, 3, 7 $9,686 $3,780 $7,010 $7,655 NA $6,191 $2,663 $6,377 $6,940 NA
8 Del Valley Nephro&Hypert1, 10 $1,794 $1,797 $1,872 $1,713 1.58% $1,222 $1,189 $1,184 $1,130 2.73%
8 Del Valley Ortho&Spine SC1, 7, 10 $2,595 $2,725 $2,968 $3,440 -8.18% $2,593 $2,718 $2,963 $3,354 -7.56%
8 Delaware Valley Laser1, 7, 10 $2,577 $2,481 $2,048 $2,163 6.38% $2,395 $2,228 $1,614 $1,680 14.20%
8 Dermatologic/Drexel Hill1, 10 $541 $381 $732 $799 -10.75% $487 $516 $714 $797 -12.98%
8 Doylestown Hospital SC3 $5,138 $2,244 $4,537 $5,047 0.60% $3,557 $2,406 $4,836 $5,076 -9.98%
8 Einstein Montgomery SC1, 4, 10, 13 $1,694 NA NA NA NA $3,294 NA NA NA NA
8 Endoscopy Center1, 10 $1,945 $2,001 $1,956 $2,097 -2.42% $1,488 $1,525 $1,956 $1,555 -1.42%
8 Endoscopy Center of Bucks1, 10 $3,763 $3,719 $3,582 $3,456 2.96% $1,797 $1,558 $1,430 $1,394 9.65%
8 Endoscopy St Mary1, 10, 13 $6,807 $6,661 $6,385 $6,039 4.24% $3,157 $3,162 $2,968 $2,970 2.10%
8 Eye SC1, 10 $5,994 $5,945 $5,153 $5,136 5.57% $4,251 $4,108 $3,543 $3,483 7.35%
See footnotes on page 26.

Financial Analysis 2013 • Volume Two 21
INDIVIDUAL AMBULATORY SURGERY CENTER DATA
See footnotes on page 26.
Ambulatory Surgery Center
Operating Margin
FY13
Total Margin
FY13
3-yr Average Total Margin FY11-FY13
Medicare Share of NPR
FY13
Medical Assistance
Share of NPR FY13
Visits FY13
Statewide Average 24.94% 25.13% 25.73% 24.47% 4.32% 3,909
State Hill SC1, 10 11.51% 11.51% 10.57% 61.20% 0.50% 1,453
Twin Rivers Endoscopy1, 10 49.15% 49.16% 49.77% 24.11% 0.00% 5,046
Valley Access/Eastern PA1, 10 29.17% 29.17% 27.04% 60.76% 0.10% 1,080
Valley Access/Lehigh1, 10 28.30% 28.30% 25.71% 58.19% 0.23% 880
Valley Eye SC1, 10 20.94% 20.94% 12.82% 63.31% 1.32% 6,727
Valley SC1, 10 37.25% 37.26% 41.16% 24.47% 27.80% 2,995
Wyomissing Surgical Serv1, 10 53.41% 53.42% 60.38% 20.45% 7.86% 3,037
Region 8 Average 25.72% 25.79% 27.53% 22.32% 3.21% 3,548
Abington Endoscopy3, 7, 13 15.91% 15.91% 49.80% 14.55% 0.23% 6,237
Abington SC10 10.79% 10.84% 14.92% 20.42% 2.14% 11,968
AFP SC1, 10 8.39% 8.39% 14.34% 27.77% 0.96% 916
Ambulatory Endo SC/Bucks1, 10, 13 17.26% 17.26% NR 41.96% 6.34% 4,612
ASC Bucks County7 55.96% 55.96% 50.34% 0.00% 11.67% 11,017
ASC St. Mary1, 3, 10 22.71% 22.72% 9.83% 12.57% 3.04% 3,444
Best Impression SC1, 10, 13 22.78% 22.78% 21.38% 4.02% 0.00% 390
Blue Bell SC1, 3, 7, 10 5.53% 5.53% 11.74% 22.24% 0.88% 2,726
Brandywine SC1, 10, 13 -2.58% -2.58% -2.25% 0.00% 0.00% 435
Brandywine Vly Endoscopy1, 10 35.17% 35.18% 39.48% 10.53% 0.00% 2,394
Bucks County GI Endo SC 1, 10 10.40% 10.40% 19.31% 23.36% 6.99% 4,168
Bux-Mont Endoscopy1, 10 38.07% 38.07% 33.68% 21.35% 1.49% 4,144
Childrens SC Malvern1, 3, 10 32.93% 32.93% NA 0.00% 65.69% 2,737
CHOP ASC Exton7 60.85% 60.85% 56.19% 0.00% 11.49% 8,773
Cornerstone ASC1, 10 37.56% 37.56% 42.20% 40.40% 2.68% 1,165
Crozer Endo3, 7 28.31% 28.31% NA 13.29% 7.35% 1,965
Crozer Keystone Haverford2, 7 39.70% 39.70% 17.33% 34.08% 3.52% 1,335
Crozer SC at Brinton Lake2, 3, 7 36.09% 36.09% 25.62% 30.91% 5.85% 5,296
Del Valley Nephro&Hypert1, 10 31.88% 31.88% 34.19% 60.46% 0.22% 906
Del Valley Ortho&Spine SC1, 7, 10 0.08% 0.08% 0.18% 9.85% 13.01% 2,337
Delaware Valley Laser1, 7, 10 7.08% 7.08% 12.23% 54.01% 8.33% 3,100
Dermatologic/Drexel Hill1, 10 10.05% 10.05% -3.73% 58.20% 0.00% 2,056
Doylestown Hospital SC3 30.79% 30.79% 21.83% 32.85% 0.39% 2,698
Einstein Montgomery SC1, 4, 10, 13 -94.43% -94.43% NA 21.77% 0.47% 1,128
Endoscopy Center1, 10 23.49% 23.49% 15.82% 29.94% 1.19% 4,149
Endoscopy Center of Bucks1, 10 52.24% 52.24% 56.76% 19.57% 0.00% 5,407
Endoscopy St Mary1, 10, 13 53.62% 53.62% 53.24% 4.96% 0.00% 5,908
Eye SC1, 10 29.08% 29.08% 30.37% 52.80% 2.78% 5,163

22 Financial Analysis 2013 • Volume Two
INDIVIDUAL AMBULATORY SURGERY CENTER DATA
Region/ Ambulatory Surgery Center
Net Patient Revenue (NPR) (thousands)
3-yr Avg Change in NPR
FY10-FY13
Total Operating Expenses (TOE) (thousands)
3-yr Avg Change in TOE
FY10-FY13FY13 FY12 FY11 FY10 FY13 FY12 FY11 FY10
Statewide Average $4,239 $4,106 $4,063 $3,890 2.99% $3,204 $3,072 $3,060 $2,943 2.96%
8 Eye SC Chester1, 10 $4,334 $3,808 $3,476 $3,606 6.73% $2,978 $2,747 $2,641 $2,791 2.23%
8 Foundation/Ft Washington1, 10, 13 $2,891 $2,569 $2,139 $1,974 15.49% $2,616 $2,561 $1,845 $1,784 15.53%
8 Grand View Endoscopy Ctr $493 $519 $444 $426 5.26% $403 $417 $393 $314 9.54%
8 Holy Redeemer ASC10 $6,118 $6,101 $5,709 $6,369 -1.31% $4,478 $4,623 $4,475 $4,706 -1.62%
8 Huntingdon Valley SC1, 10, 13 $9,233 $13,311 $10,963 $9,827 -2.02% $6,665 $6,623 $6,279 $5,713 5.56%
8 Hypertension Nephrology1, 10 $1,783 $1,770 $1,869 $1,450 7.66% $1,107 $1,089 $1,138 $962 5.03%
8 Keystone Kidney Center1, 10 $1,669 $1,559 $1,623 $1,605 1.33% $1,193 $1,128 $1,104 $978 7.34%
8 Laser Spine SC1, 10 $30,296 $28,270 $10,377 $6,209 129.32% $19,916 $15,140 $5,880 $6,033 76.71%
8 Leonard Dzubow ASC1, 10 $429 $435 $421 $670 -12.02% $141 $175 $177 $181 -7.39%
8 Main Line Endoscopy/East1, 10 $3,007 $3,034 $2,934 $3,246 -2.46% $1,540 $1,409 $1,410 $1,548 -0.17%
8 Main Line Endoscopy/South1, 10 $1,211 $1,084 $1,032 $979 7.91% $713 $663 $586 $636 4.04%
8 Main Line Endoscopy/West1, 10 $4,643 $4,459 $4,343 $4,705 -0.45% $2,154 $1,962 $1,941 $2,099 0.87%
8 Main Line Fertility1, 2, 4, 10 $6,667 NA NA NA NA $6,599 NA NA NA NA
8 Main Line SC1, 10 $10,819 $9,874 $9,122 $8,811 7.59% $8,921 $8,093 $7,816 $7,617 5.71%
8 Main Line Spine SC1, 10, 13 $4,410 $4,662 $3,414 $3,129 13.64% $2,972 $3,285 $2,711 $2,442 7.23%
8 Manoa Diagnostic1, 10, 13 $1,674 $1,869 $1,858 $1,945 -4.64% $933 $945 $890 $848 3.37%
8 Montgomery SC1, 10 $2,186 $2,095 $2,152 $2,467 -3.81% $1,906 $1,924 $2,152 $2,306 -5.79%
8 New Britain SC1, 10 $6,422 $3,930 NA NA NA $5,619 $3,578 NA NA NA
8 Pain & SC/Langhorne1, 10, 11 $3,448 $3,202 $3,580 $2,931 5.88% $3,001 $2,874 $3,116 $2,487 6.89%
8 Paoli SC1, 10 $6,701 $6,068 $6,108 $5,940 4.27% $5,922 $5,328 $5,044 $4,937 6.66%
8 Penn Medicine Radnor Endo7 $2,291 $2,625 $3,492 $3,311 -10.27% $3,618 $4,179 $4,136 $4,008 -3.24%
8 Phila Cosmetic Surgery1, 10, 12 $42 NR NR $395 -29.79% $17 NR NR $426 -32.00%
8 Plaza SC1, 10, 13 $180 $198 $184 $249 -9.24% $159 $199 $183 $244 -11.64%
8 PMA Gastroenterology1, 10 $2,275 $2,150 $1,933 $2,289 -0.21% $2,003 $2,125 $2,016 $1,924 1.36%
8 Pottstown SC1, 10, 13 $1,758 $2,288 $2,106 $1,941 -3.14% $1,013 $1,799 $1,623 $1,525 -11.20%
8 Riddle SC1, 10 $13,785 $10,798 $7,923 NA NA $8,282 $6,880 $6,431 NA NA
8 RMA of Philadelphia SC1, 10, 13 $1,265 $875 NA NA NA $632 $557 NA NA NA
8 Sally Balin ASC1, 10 $345 $453 $401 $465 -8.59% $336 $444 $401 $464 -9.23%
8 Sam SC1, 4, 10 $407 NA NA NA NA $174 NA NA NA NA
8 SC Chester County1, 10 $1,670 $1,787 $2,199 $2,084 -6.63% $1,901 $2,042 $2,208 $7,162 -24.48%
8 SC Limerick1, 7, 10 $3,221 $3,040 $3,470 $4,950 -11.64% $2,868 $2,766 $3,115 $2,369 7.02%
8 SC of the Main Line1, 7, 10 $6,332 $7,226 $6,938 $5,505 5.01% $6,038 $6,718 $5,884 $4,643 10.01%
8 Springfield ASC1, 10 $3,808 $3,987 $3,912 $3,890 -0.70% $2,795 $2,918 $2,906 $2,934 -1.58%
8 Trevose Specialty Care SC1, 10, 13 $3,058 $3,185 $1,846 $1,970 18.40% $2,685 $3,150 $1,705 $1,824 15.73%
8 Tri-County Eye Surgery1, 10 $3,509 $3,170 $2,881 $2,651 10.79% $2,108 $1,870 $1,809 $1,660 8.99%
8 Turk’s Head SC1, 10 $7,383 $7,686 $7,160 $5,974 7.87% $5,995 $5,874 $5,653 $5,204 5.07%
See footnotes on page 26.

Financial Analysis 2013 • Volume Two 23
INDIVIDUAL AMBULATORY SURGERY CENTER DATA
Ambulatory Surgery Center
Operating Margin
FY13
Total Margin
FY13
3-yr Average Total Margin FY11-FY13
Medicare Share of NPR
FY13
Medical Assistance
Share of NPR FY13
Visits FY13
Statewide Average 24.94% 25.13% 25.73% 24.47% 4.32% 3,909
Eye SC Chester1, 10 31.30% 31.30% 28.01% 54.33% 0.06% 4,019
Foundation/Ft Washington1, 10, 13 9.53% 9.53% 7.60% 31.72% 0.00% 1,850
Grand View Endoscopy Ctr 18.22% 18.22% 16.61% 15.07% 1.77% 372
Holy Redeemer ASC10 26.80% 26.80% 24.28% 13.14% 0.00% 5,446
Huntingdon Valley SC1, 10, 13 27.81% 28.83% 41.83% 30.16% 0.00% 7,493
Hypertension Nephrology1, 10 37.89% 37.89% 38.49% 54.74% 0.18% 849
Keystone Kidney Center1, 10 28.50% 28.50% 29.41% 7.95% 0.99% 398
Laser Spine SC1, 10 34.26% 34.26% 40.62% 6.10% 0.00% 1,685
Leonard Dzubow ASC1, 10 67.04% 67.05% 61.65% 44.14% 0.00% 779
Main Line Endoscopy/East1, 10 48.78% 48.90% 51.49% 23.62% 0.06% 5,011
Main Line Endoscopy/South1, 10 41.15% 41.27% 41.10% 25.43% 0.00% 1,970
Main Line Endoscopy/West1, 10 53.61% 53.70% 55.00% 17.84% 0.06% 7,329
Main Line Fertility1, 2, 4, 10 1.03% 1.64% NA 0.00% 0.00% 1,230
Main Line SC1, 10 17.54% 17.54% 16.72% 43.17% 1.51% 7,378
Main Line Spine SC1, 10, 13 32.61% 32.61% 28.18% 28.14% 0.11% 6,284
Manoa Diagnostic1, 10, 13 44.26% 44.26% 48.75% 32.80% 0.00% 5,238
Montgomery SC1, 10 12.81% 13.12% 7.25% 73.14% 1.60% 2,158
New Britain SC1, 10 12.68% 12.68% NA 20.42% 0.00% 5,551
Pain & SC/Langhorne1, 10, 11 12.96% 13.06% 12.41% 38.95% 4.86% 5,245
Paoli SC1, 10 11.80% 11.14% 14.13% 18.64% 0.04% 4,486
Penn Medicine Radnor Endo7 -57.91% -57.91% -41.89% 20.32% 2.23% 3,453
Phila Cosmetic Surgery1, 10, 12 59.52% 59.52% NR 0.00% 0.00% 20
Plaza SC1, 10, 13 11.94% 11.94% 3.96% 0.00% 0.00% 87
PMA Gastroenterology1, 10 11.96% 11.96% 2.86% 20.12% 1.86% 4,263
Pottstown SC1, 10, 13 42.39% 42.39% 52.43% 32.96% 0.86% 4,228
Riddle SC1, 10 39.92% 39.92% 33.60% 19.32% 0.67% 5,683
RMA of Philadelphia SC1, 10, 13 49.99% 49.77% NA 0.00% 0.00% 1,724
Sally Balin ASC1, 10 2.73% 2.73% 1.60% 61.65% 0.00% 550
Sam SC1, 4, 10 57.36% 57.36% NA 33.11% 7.91% 196
SC Chester County1, 10 -13.82% -13.82% -8.74% 16.36% 0.00% 1,872
SC Limerick1, 7, 10 10.97% 10.97% 10.09% 29.00% 2.62% 1,901
SC of the Main Line1, 7, 10 4.64% 4.64% 9.05% 19.09% 0.34% 2,942
Springfield ASC1, 10 26.60% 26.60% 26.38% 22.36% 0.00% 6,828
Trevose Specialty Care SC1, 10, 13 12.20% 12.20% 6.78% 28.67% 3.97% 3,064
Tri-County Eye Surgery1, 10 39.94% 39.94% 39.48% 66.63% 1.15% 4,305
Turk’s Head SC1, 10 18.80% 20.33% 22.44% 23.31% 0.91% 5,408
See footnotes on page 26.

24 Financial Analysis 2013 • Volume Two
INDIVIDUAL AMBULATORY SURGERY CENTER DATA
Region/ Ambulatory Surgery Center
Net Patient Revenue (NPR) (thousands)
3-yr Avg Change in NPR
FY10-FY13
Total Operating Expenses (TOE) (thousands)
3-yr Avg Change in TOE
FY10-FY13FY13 FY12 FY11 FY10 FY13 FY12 FY11 FY10
Statewide Average $4,239 $4,106 $4,063 $3,890 2.99% $3,204 $3,072 $3,060 $2,943 2.96%
8 Valley Forge SC1, 3, 10, 13 $241 $204 $723 $1,041 -25.61% $532 $205 $720 $898 -13.56%
8 Valley Pain Center1, 10 $2,545 $2,791 $2,861 $3,290 -7.55% $2,219 $2,498 $2,455 $2,780 -6.73%
8 West Chester Endoscopy1, 10 $3,985 $3,517 $3,694 $3,816 1.48% $2,663 $2,259 $2,293 $2,360 4.29%
8 Wills Eye SC Plymouth Mtg10 $3,239 $3,156 $3,488 $3,590 -3.26% $2,966 $2,944 $3,234 $3,255 -2.96%
8 Wills SC Bucks County10 $3,951 $3,650 $3,971 $4,298 -2.69% $3,728 $3,468 $3,948 $4,061 -2.74%
Region 9 Average $3,786 $3,651 $3,423 $3,254 5.45% $3,283 $3,154 $3,102 $2,838 5.24%
9 American Access Care PA1, 10, 13 $4,781 $5,287 $4,652 $4,537 1.80% $4,582 $4,882 $4,920 $4,451 0.98%
9 American Access S Phila1, 4, 10, 13 $4,362 NA NA NA NA $4,366 NA NA NA NA
9 Clinical Nephrology Assoc1, 10 $1,423 $1,590 $1,730 $1,495 -1.60% $1,116 $1,167 $1,235 $1,172 -1.60%
9 Dermatologic/Philadelphia1, 10 $283 $189 $461 $514 -14.96% $307 $272 $504 $476 -11.87%
9 Drexel Digestive Health7 $1,725 $1,482 $1,886 $1,505 4.85% $1,409 $1,261 $1,230 $997 13.76%
9 Einstein SC7 $5,124 $5,255 $5,265 $5,570 -2.67% $4,656 $4,666 $5,089 $4,709 -0.37%
9 Endoscopy Ctr of PA Hosp2, 11 $1,178 $3,144 $3,314 $3,947 NA $1,029 $3,075 $2,662 $3,055 NA
9 Gastrointestinal Spec1, 10 $2,218 $2,420 $2,310 $2,289 -1.03% $2,203 $2,425 $2,319 $2,304 -1.47%
9 Grant SC1, 10 $2,531 $2,808 NA NA NA $1,755 $1,879 NA NA NA
9 HUP Reproductive Surgical $1,267 $964 $1,057 $815 18.52% $397 $734 $1,068 $1,037 -20.57%
9 Jefferson SC/Navy Yard1, 3, 10 $16,359 $13,068 $8,537 $4,431 NA $11,223 $9,300 $7,755 $3,781 NA
9 Liberty Eye SC1, 10 $2,834 $3,309 $3,170 $3,935 -9.33% $2,639 $2,559 $2,708 $2,971 -3.72%
9 Metropolitan Nephrology1, 10 $1,062 $987 $1,126 $1,023 1.26% $759 $757 $802 $774 -0.64%
9 Mt Airy AESC1, 10 $1,355 $1,443 $1,181 $1,306 1.24% $1,257 $1,190 $998 $1,305 -1.22%
9 PGC Endoscopy1, 10 $1,970 $1,847 $1,662 $1,668 6.02% $1,855 $1,845 $1,674 $1,696 3.14%
9 Philadelphia Surgical Ctr10 $2,162 $2,277 $1,827 $1,721 8.56% $2,283 $2,185 $1,894 $1,592 14.47%
9 Red Lion SC1, 10 $4,751 $5,047 $4,841 $4,288 3.60% $3,817 $3,413 $2,894 $2,281 22.44%
9 SC of Pennsylvania Hosp $5,635 $4,618 $5,201 $5,257 2.40% $5,454 $4,922 $5,168 $5,022 2.86%
9 Temple Univ/Podiatric ASC7 $60 $27 $15 $128 -17.62% $341 $379 $414 $441 -7.57%
9 Wills SC Northeast10 $3,510 $3,618 $3,483 $3,451 0.57% $3,429 $3,334 $3,299 $3,291 1.40%
9 Wills SC/Phila Stadium10 $4,035 $3,487 $4,090 $4,893 -5.85% $3,476 $3,219 $3,553 $4,118 -5.20%
9 Wills Surgical Ctr City11 $14,672 $13,807 $12,658 $12,307 6.41% $13,882 $12,759 $11,845 $11,278 7.70%
See footnotes on page 26.

Financial Analysis 2013 • Volume Two 25
INDIVIDUAL AMBULATORY SURGERY CENTER DATA
Ambulatory Surgery Center
Operating Margin
FY13
Total Margin
FY13
3-yr Average Total Margin FY11-FY13
Medicare Share of NPR
FY13
Medical Assistance
Share of NPR FY13
Visits FY13
Statewide Average 24.94% 25.13% 25.73% 24.47% 4.32% 3,909
Valley Forge SC1, 3, 10, 13 -120.80% -120.80% -24.79% 0.00% 0.00% 348
Valley Pain Center1, 10 12.80% 12.80% 12.58% 13.50% 0.00% 3,304
West Chester Endoscopy1, 10 33.46% 33.46% 37.09% 12.17% 0.00% 7,693
Wills Eye SC Plymouth Mtg10 8.43% 8.43% 7.48% 68.49% 2.00% 2,630
Wills SC Bucks County10 5.72% 5.72% 3.72% 53.78% 11.94% 2,992
Region 9 Average 14.99% 15.03% 13.99% 31.85% 9.39% 3,141
American Access Care PA1, 10, 13 4.16% 4.48% 2.64% 73.57% 2.34% 2,396
American Access S Phila1, 4, 10, 13 -0.10% -0.22% NA 70.82% 1.93% 2,370
Clinical Nephrology Assoc1, 10 21.57% 21.57% 25.83% 64.07% 0.59% 806
Dermatologic/Philadelphia1, 10 -8.31% -8.31% -16.07% 84.66% 0.00% 1,110
Drexel Digestive Health7 19.16% 19.16% 23.71% 14.49% 18.46% 2,138
Einstein SC7 18.07% 18.07% 17.66% 26.95% 26.37% 3,227
Endoscopy Ctr of PA Hosp2, 11 12.67% 12.67% 11.39% 18.98% 5.25% 2,420
Gastrointestinal Spec1, 10 0.68% 0.68% 0.01% 21.61% 0.52% 4,005
Grant SC1, 10 30.66% 30.66% NA 24.10% 24.76% 4,107
HUP Reproductive Surgical 72.88% 72.88% 43.02% 0.00% 0.37% 595
Jefferson SC/Navy Yard1, 3, 10 31.40% 31.40% 25.31% 5.08% 0.14% 4,947
Liberty Eye SC1, 10 6.87% 6.87% 15.12% 61.34% 18.65% 3,457
Metropolitan Nephrology1, 10 28.54% 28.54% 26.98% 64.39% 1.20% 592
Mt Airy AESC1, 10 7.19% 7.19% 13.42% 60.50% 16.23% 2,534
PGC Endoscopy1, 10 5.80% 5.80% 2.29% 19.60% 4.64% 3,871
Philadelphia Surgical Ctr10 -5.18% -5.18% -1.12% 13.42% 8.32% 4,991
Red Lion SC1, 10 19.65% 19.67% 30.93% 0.00% 51.36% 2,656
SC of Pennsylvania Hosp 16.37% 16.37% 11.70% 16.56% 13.72% 4,508
Temple Univ/Podiatric ASC7 -463.59% -463.59% -1007.16% 24.39% 15.13% 125
Wills SC Northeast10 2.30% 2.95% 5.34% 50.28% 3.54% 3,783
Wills SC/Phila Stadium10 13.96% 13.96% 11.82% 45.64% 5.45% 4,839
Wills Surgical Ctr City11 5.41% 5.41% 6.49% 44.60% 4.29% 9,624
See footnotes on page 26.

26 Financial Analysis 2013 • Volume Two
FOOTNOTES
1. The end of the fiscal year is not June 30. The data reflects the fiscal year that ended prior to June 30.
2. The data is less than 12 months; therefore, a three-year comparison is not appropriate for some of the measures.
3. Prior year(s) reflect less than 12 months of data; therefore, a three-year comparison is not appropriate for some of the measures.
4. This is the first reporting year for this facility. Often expenses are higher than operating revenue during the start-up period. Three-year comparisons are not appropriate for this facility.
5. The hospital has a specialty unit(s) such as psychiatric, rehabilitation, long-term care, skilled nursing, home health, etc., which are included in the data presented for the facility.
6. Extraordinary item(s) reported on audited financial statement was included in the calculation of total margin.
7. Balance sheet ratios are for the parent organization.
8. Acquired or merged with another licensed hospital during the FY13 reporting period.
9. Acquired or merged with another licensed hospital during the FY11 or FY12 reporting periods.
10. For-profit facility.
11. Facility is referred to by a different name, or it closed after the FY13 reporting period.
12. Facility failed to satisfy the financial filing requirements.
13. One or more of the required financial submissions was filed late.
14. Facility submitted incomplete or inaccurate data.
NR Information necessary to report or calculate this measure was not reported by the facility.
NA Not applicable.
Note: The above footnotes are applicable to all reports in PHC4’s Financial Analysis series.
Footnotes:
Financial Analysis 2013 • Volume Two 27
FOOTNOTES EXPLANATION OF TERMS & MEASURES
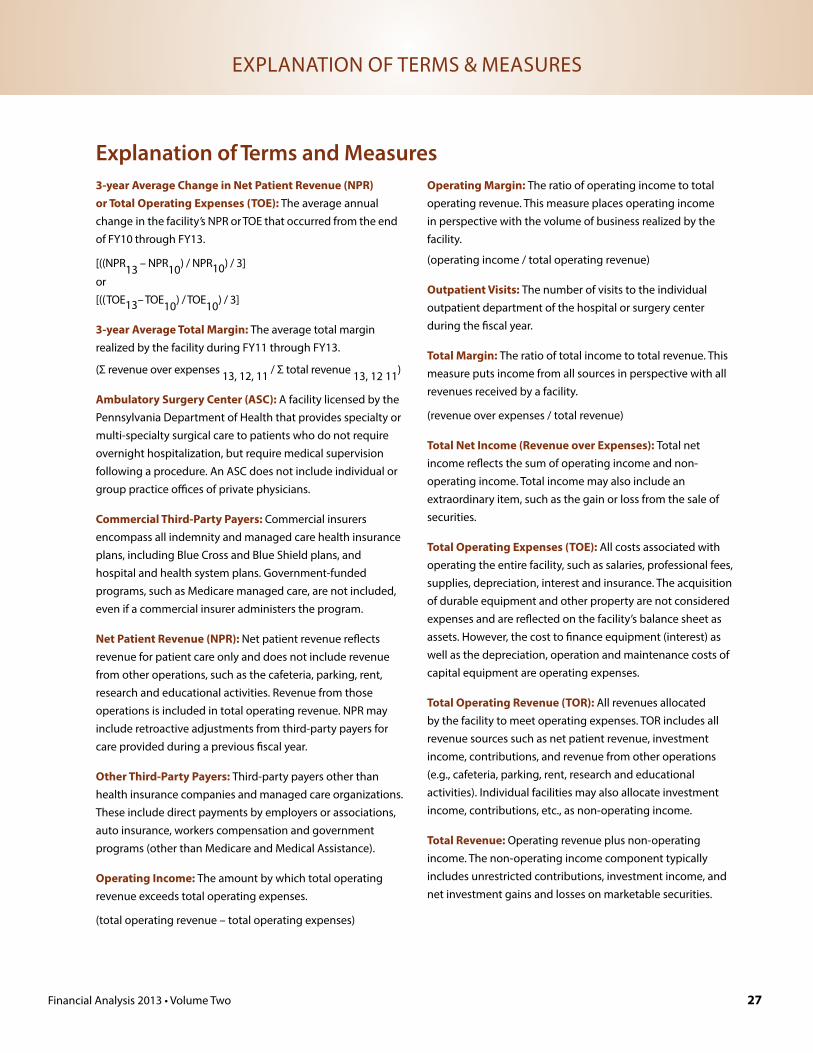
3-year Average Change in Net Patient Revenue (NPR) or Total Operating Expenses (TOE): The average annual change in the facility’s NPR or TOE that occurred from the end of FY10 through FY13.
[((NPR13 – NPR10) / NPR10) / 3]
or[((TOE13– TOE10) / TOE10) / 3]
3-year Average Total Margin: The average total margin realized by the facility during FY11 through FY13.
(Σ revenue over expenses 13, 12, 11 / Σ total revenue 13, 12 11)
Ambulatory Surgery Center (ASC): A facility licensed by the Pennsylvania Department of Health that provides specialty or multi-specialty surgical care to patients who do not require overnight hospitalization, but require medical supervision following a procedure. An ASC does not include individual or group practice offices of private physicians.
Commercial Third-Party Payers: Commercial insurers encompass all indemnity and managed care health insurance plans, including Blue Cross and Blue Shield plans, and hospital and health system plans. Government-funded programs, such as Medicare managed care, are not included, even if a commercial insurer administers the program.
Net Patient Revenue (NPR): Net patient revenue reflects revenue for patient care only and does not include revenue from other operations, such as the cafeteria, parking, rent, research and educational activities. Revenue from those operations is included in total operating revenue. NPR may include retroactive adjustments from third-party payers for care provided during a previous fiscal year.
Other Third-Party Payers: Third-party payers other than health insurance companies and managed care organizations. These include direct payments by employers or associations, auto insurance, workers compensation and government programs (other than Medicare and Medical Assistance).
Operating Income: The amount by which total operating revenue exceeds total operating expenses.
(total operating revenue – total operating expenses)
Operating Margin: The ratio of operating income to total operating revenue. This measure places operating income in perspective with the volume of business realized by the facility.
(operating income / total operating revenue)
Outpatient Visits: The number of visits to the individual outpatient department of the hospital or surgery center during the fiscal year.
Total Margin: The ratio of total income to total revenue. This measure puts income from all sources in perspective with all revenues received by a facility.
(revenue over expenses / total revenue)
Total Net Income (Revenue over Expenses): Total net income reflects the sum of operating income and non-operating income. Total income may also include an extraordinary item, such as the gain or loss from the sale of securities.
Total Operating Expenses (TOE): All costs associated with operating the entire facility, such as salaries, professional fees, supplies, depreciation, interest and insurance. The acquisition of durable equipment and other property are not considered expenses and are reflected on the facility’s balance sheet as assets. However, the cost to finance equipment (interest) as well as the depreciation, operation and maintenance costs of capital equipment are operating expenses.
Total Operating Revenue (TOR): All revenues allocated by the facility to meet operating expenses. TOR includes all revenue sources such as net patient revenue, investment income, contributions, and revenue from other operations (e.g., cafeteria, parking, rent, research and educational activities). Individual facilities may also allocate investment income, contributions, etc., as non-operating income.
Total Revenue: Operating revenue plus non-operating income. The non-operating income component typically includes unrestricted contributions, investment income, and net investment gains and losses on marketable securities.
Explanation of Terms and Measures

28 Financial Analysis 2013 • Volume Two
NON-COMPLIANT AMBULATORY SURGERY CENTERS
No SubmissionThe following ambulatory surgery centers did not comply with one or more of PHC4’s filing requirements and are not included in this report:
Associates SCBryn Mawr Med SpecialistsCarbon-Schuylkill EndoConyngham Valley SCKole Plastic SCNorthwood SCPhiladelphia Surgery CtrPremier SC PittsburghRhawn Street EndoscopyRidley Crossing SCValley ASCWestfield SCWilliamsport SC
Partial SubmissionThe following ambulatory surgery center did not meet a substantial portion of PHC4’s filing requirements:
Phila Cosmetic Surgery
Late SubmissionThe following ambulatory surgery centers submitted their annual financial data and/or the supporting audited financial statements late:
Abington EndoscopyAmbulatory Endo SC/BucksAmerican Access Care PAAmerican Access S PhilaBest Impression SCBrandywine SCCapital Surgery LaserCenter Same Day SurgeryCenter Surgical ArtsCommunity SCDelmont SCEinstein Montgomery SCEndoscopy St. MaryFoundation/Ft WashingtonGamma SCGeisinger Aest & CosmeticGreater Erie SCHazleton EndoscopyHuntingdon Valley SCLaurel SCLeader SCMahoning Valley ASCMain Line Spine SCManoa DiagnosticMcCandless EndoscopyMemorial Outpatient EndoMemorial SC YorkOphthalmology SCPeters Township SCPine Grove ASCPlaza SCPocono ASCPottstown SCProgressive Laser SurgiProgressive Surgical InstRegional Hospital SCRMA of Philadelphia SCSaint Vincent SC ErieSouth Hills SCSpartan Health SCSurgery & LaserTrevose Specialty Care SCTri-State SCUPMC Digestive Hlth EndoValley Forge SCWest Shore SC

Financial Analysis 2013 • Volume Two 29
NON-COMPLIANT AMBULATORY SURGERY CENTERS

Pennsylvania Health Care Cost Containment CouncilJoe Martin, Executive Director
225 Market Street, Suite 400, Harrisburg, PA 17101Phone: 717-232-6787 • Fax: 717-232-3821
www.phc4.org
For More InformationThe information contained in this report and other PHC4 publications is available online at www.phc4.org. Additional financial, hospitalization and ambulatory procedure health care data is available for purchase. For more information, contact PHC4’s Data Requests Unit at [email protected] or 717-232-6787.