FINANCIAL ANALYSIS 2011 - PHC4 · Financial Analysis 2011 • Volume Three a ... analyzing, and...
44
Pennsylvania Health Care Cost Containment Council November 2012 An Annual Report on the Financial Health of Pennsylvania’s Non-GAC Hospitals FINANCIAL ANALYSIS 2011 VOLUME THREE Rehabilitaon • Psychiatric • Long-Term Acute Care • Specialty
Transcript of FINANCIAL ANALYSIS 2011 - PHC4 · Financial Analysis 2011 • Volume Three a ... analyzing, and...

aFinancial Analysis 2011 • Volume Three
Pennsylvania Health Care Cost Containment CouncilNovember 2012
An Annual Report on the Financial Health of Pennsylvania’s Non-GAC Hospitals
FINANCIAL ANALYSIS 2011
VOLUME THREERehabilitation • Psychiatric• Long-Term Acute Care •
Specialty

b Financial Analysis 2011 • Volume Threeb
Table of ContentsKey Findings ............................................1
Introduction ............................................1
Overview ..................................................3
Rehabilitation ..........................................8
Psychiatric ............................................. 18
Long-Term Acute Care ........................ 28
Specialty ................................................ 38
Footnotes .............................................. 40
Explanation of Terms & Measures .....41
About PHC4The Pennsylvania Health Care Cost
Containment Council (PHC4) is an independent state agency charged with collecting, analyzing, and reporting in-formation that can be used to improve the quality and restrain the cost of health care in the state. It was created in the mid-1980s when Pennsylvania businesses and labor unions, in col-laboration with other key stakeholders, joined forces to enact market-oriented health care reforms. As a result of their years of effort, the General Assembly passed legislation (Act 89 of 1986) creating PHC4.
The primary goal is to empower purchasers of health care benefits, such as businesses or labor unions, as well as other stakeholders, with information they can use to improve quality and restrain costs. Nearly 100 organizations and individuals annually utilize PHC4’s special requests process to access and use data. More than 750,000 public reports on patient treatment results are downloaded from the PHC4 website each year. Today, PHC4 is a recognized national leader in public health care reporting.
It is governed by a 25-member board of directors representing business, labor, consumers, health care providers, insurers, and state government.
Non-Compliant Hospitals
Late Submission
The following hospitals submitted their annual financial data and/or the supporting audited financial statements late. • Girard• HavenBehavioral• HealthSouthErie• Kensington• Kindred/DelawareCounty• Kindred/SouthPhila• Kindred/WyomingValley• MontgomeryCtyES• SouthwoodPsych• ValleyForge

1Financial Analysis 2011 • Volume Three 1
INTRODUCTION
Key Findings• Thestatewideaverageoperatingmarginforthestate’srehabilitationhospi-
tals improved 3.76 percentage points from 10.37% in FY10 to 14.13% in FY11. The statewide average total margin increased 3.21 percentage points from 10.65% in FY10 to 13.86% in FY11.
• Statewide,thenumberofpatientsthatreceivedrehabcareincreased2.8%,and the number of rehab patient days increased 1.4% during FY11.
• Thefreestandingpsychiatrichospitalsasagroupposteda0.67percentagepoint decrease in the statewide average operating margin from 5.90% in FY10 to 5.23% in FY11. The statewide average total margin increased 0.19 of a percentage point from 4.55% in FY10 to 4.74% in FY11.
• TheMedicalAssistance(MA)programprovided54.9%ofthenetpatientrevenue received by the 19 psychiatric hospitals in Pennsylvania during FY11. Of all patients that received inpatient psychiatric care at GAC psychi-atric units, 23.2% were MA participants.
• Thestatewideaverageoperatingmarginforthelong-termacutecare(LTAC) hospitals decreased 0.26 of a percentage point from 6.23% in FY10 to 5.97% in FY11. The statewide average total margin decreased 0.14 of a percentage point from 4.93% in FY10 to 4.79% in FY11.
• LTAChospitalsreceived73.4%oftheirpatientrevenuefromMedicaredur-ing FY11.
IntroductionThe Pennsylvania Health Care Cost Containment
Council (PHC4) annually produces a series of reports that measure the financial health of Pennsylvania’s hos-pitals and ambulatory surgery centers.
This is the third volume of a three-volume series. Volume One, released in May 2012, focused on the finan-cial health of Pennsylvania’s general acute care (GAC) hospitals. Volume Two,releasedinSeptember2012,con-centrated on Pennsylvania’s ambulatory surgery centers (ASCs).Thisreport,Volume Three, focuses on Pennsylva-nia’s rehabilitation hospitals, psychiatric hospitals, state psychiatric hospitals, long-term acute care hospitals, and specialty hospitals (non-GAC hospitals). The total num-berofhospitalsandASCsthatoperatedinPennsylvaniaduring fiscal year 2011 (FY11) is listed in Table 1.
Facility TypeNumber of
Facilities
GeneralAcuteCareHospitals 168
RehabilitationHospitals 19
PsychiatricHospitals 19
StatePsychiatricHospitals 7
Long-TermAcuteCareHospitals 27
SpecialtyHospitals 6
AmbulatorySurgeryCenters 271
Total 517
TABLE 1Number of Facilities, FY11by Facility Type
2 Financial Analysis 2011 • Volume Three2
INTRODUCTION
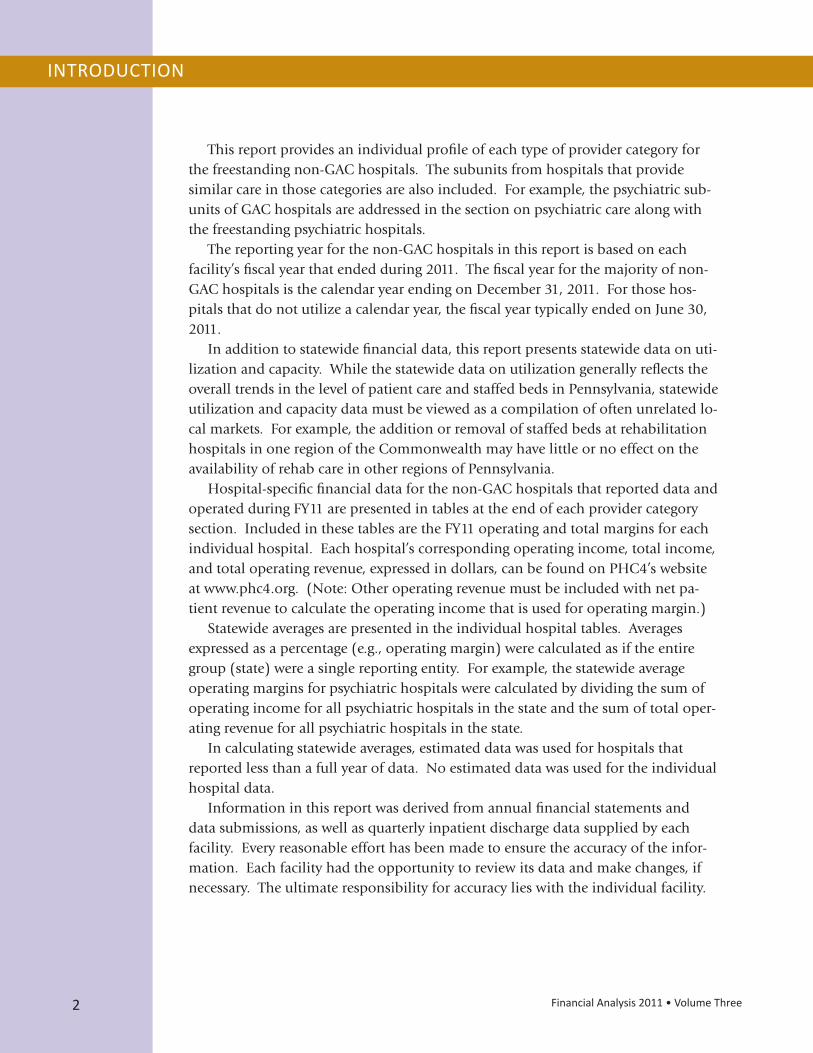
This report provides an individual profile of each type of provider category for the freestanding non-GAC hospitals. The subunits from hospitals that provide similar care in those categories are also included. For example, the psychiatric sub-units of GAC hospitals are addressed in the section on psychiatric care along with the freestanding psychiatric hospitals.
The reporting year for the non-GAC hospitals in this report is based on each facility’s fiscal year that ended during 2011. The fiscal year for the majority of non-GAC hospitals is the calendar year ending on December 31, 2011. For those hos-pitals that do not utilize a calendar year, the fiscal year typically ended on June 30, 2011.
In addition to statewide financial data, this report presents statewide data on uti-lization and capacity. While the statewide data on utilization generally reflects the overall trends in the level of patient care and staffed beds in Pennsylvania, statewide utilization and capacity data must be viewed as a compilation of often unrelated lo-cal markets. For example, the addition or removal of staffed beds at rehabilitation hospitals in one region of the Commonwealth may have little or no effect on the availability of rehab care in other regions of Pennsylvania.
Hospital-specific financial data for the non-GAC hospitals that reported data and operated during FY11 are presented in tables at the end of each provider category section. Included in these tables are the FY11 operating and total margins for each individual hospital. Each hospital’s corresponding operating income, total income, and total operating revenue, expressed in dollars, can be found on PHC4’s website at www.phc4.org. (Note: Other operating revenue must be included with net pa-tient revenue to calculate the operating income that is used for operating margin.)
Statewideaveragesarepresentedintheindividualhospitaltables.Averagesexpressed as a percentage (e.g., operating margin) were calculated as if the entire group (state) were a single reporting entity. For example, the statewide average operating margins for psychiatric hospitals were calculated by dividing the sum of operating income for all psychiatric hospitals in the state and the sum of total oper-ating revenue for all psychiatric hospitals in the state.
In calculating statewide averages, estimated data was used for hospitals that reported less than a full year of data. No estimated data was used for the individual hospital data.
Information in this report was derived from annual financial statements and data submissions, as well as quarterly inpatient discharge data supplied by each facility. Every reasonable effort has been made to ensure the accuracy of the infor-mation. Each facility had the opportunity to review its data and make changes, if necessary. The ultimate responsibility for accuracy lies with the individual facility.

3Financial Analysis 2011 • Volume Three 3
OVERVIEW
FIGURE 1Net Patient Revenue, FY11by Facility Type*
GAC93.05%
Rehabilitation1.66%Psychiatric
1.15%
LTAC1.06%
Specialty0.41%
ASC2.67%
FIGURE 2Discharges, FY11by Facility Type*
GAC94.69%
Rehabilitation1.55%
Psychiatric 2.73%
LTAC0.54%
Specialty0.49%
FIGURE 3Outpatient Visits, FY11by Facility Type*
GAC92.17%
Rehabilitation3.00%
Psychiatric 1.50%
LTAC0.25%
Specialty0.66%
ASC2.42%
OverviewGeneral acute care (GAC) hospitals (including their hospital-based subunits) are
the predominate providers of hospital-based health care in Pennsylvania. During fiscal year 2011 (FY11), GAC hospitals received 93.1% of the statewide net patient revenue (Figure 1). GAC hospitals treated 94.7% of the patients receiving inpa-
tientcare(Figure2).Similarly,the 39.7 million outpatient visits reported by the GAC hospitals represent 92.2% of the total outpatient visits to all hospitals and ambulatory surgery centers (ASCs)(Figure3).
The four types of non-GAC hospitals covered in this report treated 5.3% of the patients receiving inpatient care. They received 5.4% of the outpatient visits,withASCsaccountingforthe other 2.4%.
The figures and tables in this section, except for Figure 4 and Table 2, present a variety of in-formation by facility type. These figures and tables reflect all care provided at each type of facility. For example, the patient days for long-term acute care (LTAC) hos-pitals in Table 3 include medical-surgical plus the psychiatric care provided at the LTAC hospitals. In contrast, Figure 4 and Table 2 present patient days by type of care (e.g., psychiatric), regardless of where that care was delivered. For example, statewide psychiatric care includes services provided at freestanding psychiatric, GAC, LTAC, and specialty hospitals.
Table 3 displays the differences in the average revenue per day
*Excludesstatepsychiatrichospitals

4 Financial Analysis 2011 • Volume Three4
OVERVIEW
Facility TypeStaffed
BedsPatient
Days Discharges
Net Inpatient Revenue
(thousands)
Average Inpatient Revenue per Day
Average Inpatient
Revenue per Discharge
GeneralAcuteCareHospitals 36,711 8,966,854 1,715,593 $21,156,604 $2,359 $12,332
RehabilitationHospitals 1,760 418,981 28,104 $529,463 $1,264 $18,839
PsychiatricHospitals 2,282 656,941 49,453 $380,871 $580 $7,702
Long-TermAcuteCareHospitals 1,283 267,317 9,843 $389,346 $1,456 $39,556
SpecialtyHospitals 547 144,070 8,826 $70,081 $486 $7,940
Statewide 42,583 10,454,163 1,811,819 $22,526,366 $2,155 $12,433
*Excludesstatepsychiatrichospitals
TABLE 3Utilization and Net Inpatient Revenue, FY11by Facility Type*
FIGURE 4Patient Days, FY11by Type of Care
Medical-Surgical73.30%
Rehabilitation6.55%
Psychiatric *14.26%
Other5.89%
TABLE 2Patient Days, FY11by Type of Care
Type of Services Patient Days
Medical-Surgical 7,662,769
Rehabilitation 684,521
Psychiatric* 1,491,141
Other 615,732
Statewide * 10,454,163
and revenue per discharge at the different types of hospitals. While a number of factors affect the revenue that hospitals receive, the variation in the average revenue per day provides some indication of the differences in resources required to treat patients in the different facility settings. For example, the revenue per day at reha-bilitation hospitals is more than double the average for psychiatric hospitals. This exists, in large part, because rehabilitation hospitals generally provide care that is more resource intensive than psychiatric hospitals. In addition, Figure 5 reveals that the average age of patients treated at rehabilitation facilities is more than twice the average age of patients at psychiatric hospitals. Typically, older patients require more resources than younger patients being treated for the same condition.
Applying the differences in the average lengths of stay presented in Figure 6 to the variations in the average revenue per day results in large differences in the aver-age revenue per discharge across the different hospital settings. The average revenue

5Financial Analysis 2011 • Volume Three 5
OVERVIEW
TABLE 4Outpatient Visits and Net Outpatient Revenue, FY11by Facility Type*
Facility TypeOutpatient
Visits
Net Outpatient
Revenue(thousands)
Average Outpatient
Revenue per Visit
GeneralAcuteCareHospitals 39,652,170 $15,191,821 $383
RehabilitationHospitals 1,291,271 $119,934 $93
PsychiatricHospitals 645,686 $69,186 $107
Long-TermAcuteCareHospitals 107,745 $23,412 $217
SpecialtyHospitals 283,205 $89,760 $317
AmbulatorySurgeryCenters 1,040,919 $1,043,609 $1,003
Statewide 43,020,996 $16,537,721 $384
per discharge during FY11 ranged from $7,702 at psychiatric hospitals to $39,556 at LTAC hospitals. LTAC hospitals treat complex medical conditions that require continuous care.
There is also a wide variation in the average outpatient revenue per visit across all facilities (Table 4). As with inpatient care, a primary reason for the diversity in outpatient revenue per visit among the facility types is the variation in level of re-sources provided per visit. A patient may receive care as a series of visits comprised of relatively short treatments (e.g., psychotherapy) in a hospital outpatient setting, whileapatientatanASCmaybesubjecttoanentiresurgicalprocedureduringasingle visit. The average revenue per visit at GAC hospitals reflects reimbursements for a wide range of outpatient services.
5.23
14.9113.28
27.16
16.32
0
10
20
30
GAC Rehabilitation Psychiatric LTAC Specialty
days
FIGURE 6Average Length of Stay, FY11by Facility Type*
52.93
68.35
31.74
68.93
40.62
0
20
40
60
80
GAC Rehabilitation Psychiatric LTAC Specialty
year
s
FIGURE 5Average Inpatient Patient Age, FY11by Facility Type*
*Excludesstatepsychiatrichospitals
6 Financial Analysis 2011 • Volume Three6
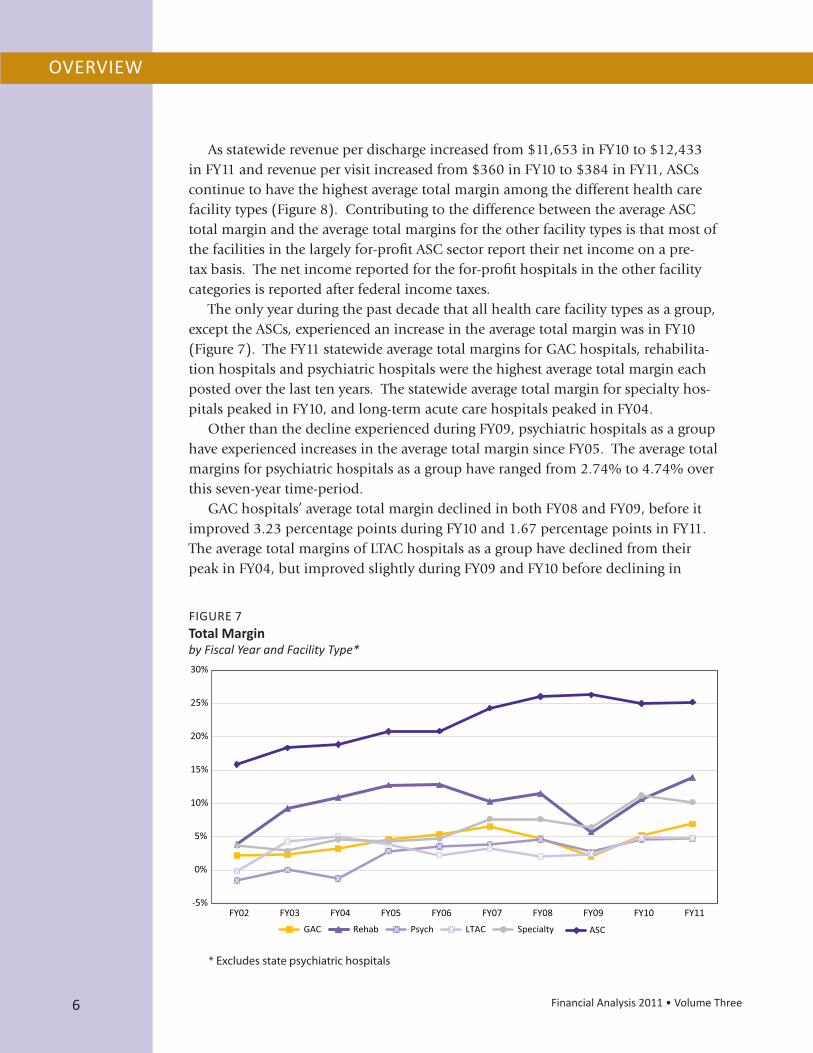
As statewide revenue per discharge increased from $11,653 in FY10 to $12,433 inFY11andrevenuepervisitincreasedfrom$360inFY10to$384inFY11,ASCscontinue to have the highest average total margin among the different health care facilitytypes(Figure8).ContributingtothedifferencebetweentheaverageASCtotal margin and the average total margins for the other facility types is that most of thefacilitiesinthelargelyfor-profitASCsectorreporttheirnetincomeonapre-tax basis. The net income reported for the for-profit hospitals in the other facility categories is reported after federal income taxes.
The only year during the past decade that all health care facility types as a group, excepttheASCs,experiencedanincreaseintheaveragetotalmarginwasinFY10(Figure 7). The FY11 statewide average total margins for GAC hospitals, rehabilita-tion hospitals and psychiatric hospitals were the highest average total margin each posted over the last ten years. The statewide average total margin for specialty hos-pitals peaked in FY10, and long-term acute care hospitals peaked in FY04.
Other than the decline experienced during FY09, psychiatric hospitals as a group have experienced increases in the average total margin since FY05. The average total margins for psychiatric hospitals as a group have ranged from 2.74% to 4.74% over this seven-year time-period.
GAC hospitals’ average total margin declined in both FY08 and FY09, before it improved 3.23 percentage points during FY10 and 1.67 percentage points in FY11. The average total margins of LTAC hospitals as a group have declined from their peak in FY04, but improved slightly during FY09 and FY10 before declining in
OVERVIEW
-5%
0%
5%
10%
15%
20%
25%
30%
FY02 FY03 FY04 FY05 FY06 FY07 FY08 FY09 FY10 FY11GAC Rehab Psych LTAC Specialty ASC
FIGURE 7Total Marginby Fiscal Year and Facility Type*
*Excludesstatepsychiatrichospitals

7Financial Analysis 2011 • Volume Three 7
6.93%
13.86%
4.74% 4.79%
10.18%
25.19%
0%
5%
10%
15%
20%
25%
30%
GAC Rehabilitation Psychiatric LTAC Specialty ASC
FIGURE 8Total Margin, FY11by Facility Type*
FIGURE 9Percent of Uncompensated Care, FY11by Facility Type*
2.72%
0.88%
1.42%
0.69%
3.38%
0.60%
0%
1%
2%
3%
4%
GAC Rehabilitation Psychiatric LTAC Specialty ASC
perc
ent o
f NPR
FY11. The statewide average total margins for rehabilitation hospitals ranged from 3.87% in FY02 to 13.86% in FY11 over the ten-year period.
Overthelasttenyears,thetotalmarginforASCsasagrouppeakedduringFY09.TheaveragetotalmarginforASCsincreasedeveryyearduringthelastdecade,exceptforFY10.TheaveragetotalmarginsforASCshaverangedfrom15.85%to26.30% over this ten-year period.
Uncompensated care as a percent of net patient revenue ranged from 0.69% to 3.38% among the various non-GAC hospital categories (Figure 9). There was a significant change in the percentage of uncompensated care provided by LTAC and specialty hospitals from FY10 to FY11. The change was influenced by the reclassifi-cation of Girard Medical Center’s facility type from an LTAC to a specialty hospital, and Girard’s significant amount of uncompensated care.
OVERVIEW
*Excludesstatepsychiatrichospitals
8 Financial Analysis 2011 • Volume Three8
REHABILITATION
HospitalPatient
DaysBed Days Available
Occupancy Rate Discharges Beds
Average Length of Stay
AlliedServices 21,325 49,275 43.28% 2,097 135 10.2
Children'sInstPgh 12,469 23,480 53.10% 419 64 29.8
CrichtonRehabCenter 9,522 14,235 66.89% 640 39 14.9
GeisingerHealthSouth 11,012 15,330 71.83% 915 42 12.0
GoodShepherdRehab 27,473 36,886 74.48% 1,890 102 14.5
HealthSouthAltoona 23,972 27,300 87.81% 1,740 80 13.8
HealthSouthErie 25,228 39,420 64.00% 1,846 108 13.7
HealthSouthHarmarville 40,942 73,730 55.53% 2,304 202 17.8
HealthSouthMechanicsburg 16,976 27,375 62.01% 1,315 75 12.9
HealthSouthNittany 11,594 26,645 43.51% 894 73 13.0
HealthSouthReading 15,201 21,900 69.41% 1,063 60 14.3
HealthSouthSewickley 11,042 16,060 68.75% 734 44 15.0
HealthSouthYork 20,041 32,850 61.01% 1,475 90 13.6
JohnHeinzRehab 27,711 33,580 82.52% 2,242 92 12.4
LancasterRehabHospital 17,607 21,535 81.76% 1,179 59 14.9
MageeRehab 28,570 35,040 81.54% 1,150 96 24.8
MainLineBrynMawrRehab 43,337 54,020 80.22% 2,841 148 15.3
MossRehab 39,912 71,905 55.51% 2,420 197 16.5
PennStateHersheyRehab 15,047 19,710 76.34% 940 54 16.0
TABLE 5Utilization and Capacity, FY11by Rehabilitation Hospital
Rehabilitation
Highlights
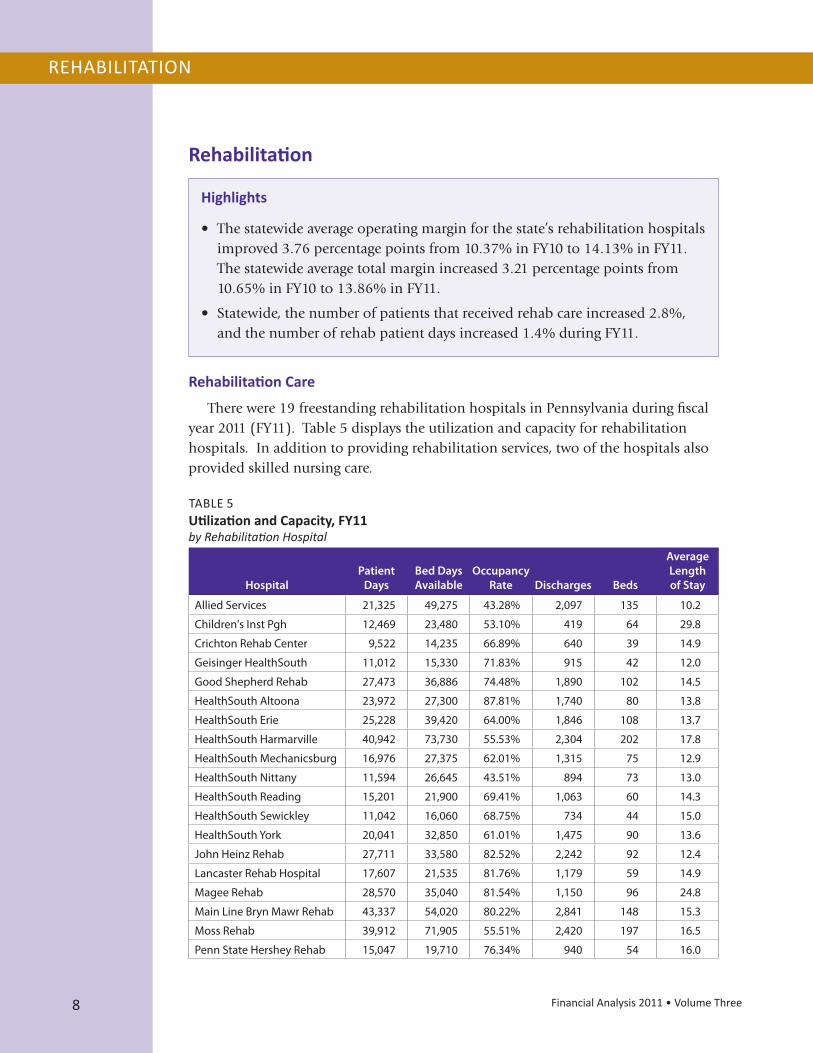
• Thestatewideaverageoperatingmarginforthestate’srehabilitationhospitalsimproved 3.76 percentage points from 10.37% in FY10 to 14.13% in FY11. The statewide average total margin increased 3.21 percentage points from 10.65% in FY10 to 13.86% in FY11.
• Statewide,thenumberofpatientsthatreceivedrehabcareincreased2.8%,and the number of rehab patient days increased 1.4% during FY11.
Rehabilitation Care
There were 19 freestanding rehabilitation hospitals in Pennsylvania during fiscal year 2011 (FY11). Table 5 displays the utilization and capacity for rehabilitation hospitals. In addition to providing rehabilitation services, two of the hospitals also provided skilled nursing care.

9Financial Analysis 2011 • Volume Three 9
REHABILITATION
FY02 FY03 FY04 FY05 FY06 FY07 FY08 FY09 FY10 FY11
Patient Days
RehabilitationHospitals 516,620 485,098 474,804 434,219 389,451 380,679 401,255 401,346 394,710 403,160
GACRehabUnits 349,544 357,726 368,195 329,993 312,871 304,191 292,948 287,478 280,269 281,361
Statewide 866,164 842,824 842,999 764,212 702,322 684,870 694,203 688,824 674,979 684,521
Discharges
RehabilitationHospitals 34,499 34,255 33,812 28,868 25,094 24,904 26,353 26,884 26,098 27,250
GACRehabUnits 38,684 37,713 37,899 31,577 27,942 27,097 25,386 24,315 23,423 23,672
Statewide 73,183 71,968 71,711 60,445 53,036 52,001 51,739 51,199 49,521 50,922
Beds
RehabilitationHospitals 1,803 1,757 1,827 1,734 1,577 1,656 1,712 1,664 1,718 1,699
GACRehabUnits 1,429 1,478 1,543 1,391 1,411 1,306 1,270 1,255 1,227 1,204
Statewide 3,232 3,235 3,370 3,125 2,988 2,962 2,982 2,919 2,945 2,903
Occupancy Rate
RehabilitationHospitals 78.55% 76.56% 72.29% 67.51% 67.66% 63.68% 65.31% 66.11% 63.84% 65.24%
GACRehabUnits 66.92% 66.25% 66.11% 63.71% 62.95% 63.57% 64.70% 64.69% 63.87% 64.19%
Statewide 73.40% 71.82% 69.46% 65.82% 65.48% 63.63% 65.05% 65.51% 63.85% 64.80%
Average Length of Stay
RehabilitationHospitals 15.0 14.2 14.0 15.0 15.5 15.3 15.2 14.9 15.1 14.8
GACRehabUnits 9.0 9.5 9.7 10.5 11.2 11.2 11.5 11.8 12.0 11.9
Statewide 11.8 11.7 11.8 12.6 13.2 13.2 13.4 13.5 13.6 13.4
TABLE 6Utilization and Capacity of Rehab Careby Facility Type
Rehabilitation hospitals provided care to 53.5% of the patients admitted for in-patient rehab care statewide in FY11. The remaining 46.5% received care at the re-habunitsthatoperatedaspartofageneralacutecare(GAC)hospital.Sixty(36%)of Pennsylvania’s GAC hospitals operated rehab units in FY11.
0
10
20
30
40
FY02 FY03 FY04 FY05 FY06 FY07 FY08 FY09 FY10 FY11
thou
sand
sRehabilitation Hospitals GAC Rehab Units
FIGURE 10Rehab Dischargesby Facility Type
In addition to treating the majority of the rehab patients in FY11, rehabilitation hospitals had more patientdaysandalongeraveragelengthofstay(ALOS)than GAC rehab units. During FY11, rehabilitation hospitals provided 58.9% of the statewide patient days of acute rehab care, compared to 41.1% from GAC rehabunits.TheALOSforrehabpatientsatrehabilita-tion hospitals was 14.8 days, compared to 11.9 days at GAC rehab units.
Trends in Rehabilitation Care
The number of patients that received rehab care at GAC rehab units and rehabilitation hospitals com-
10 Financial Analysis 2011 • Volume Three10
REHABILITATION
0
100
200
300
400
500
600
FY02 FY03 FY04 FY05 FY06 FY07 FY08 FY09 FY10 FY11
thou
sand
s
Rehabilita�on Hospitals GAC Rehab Units
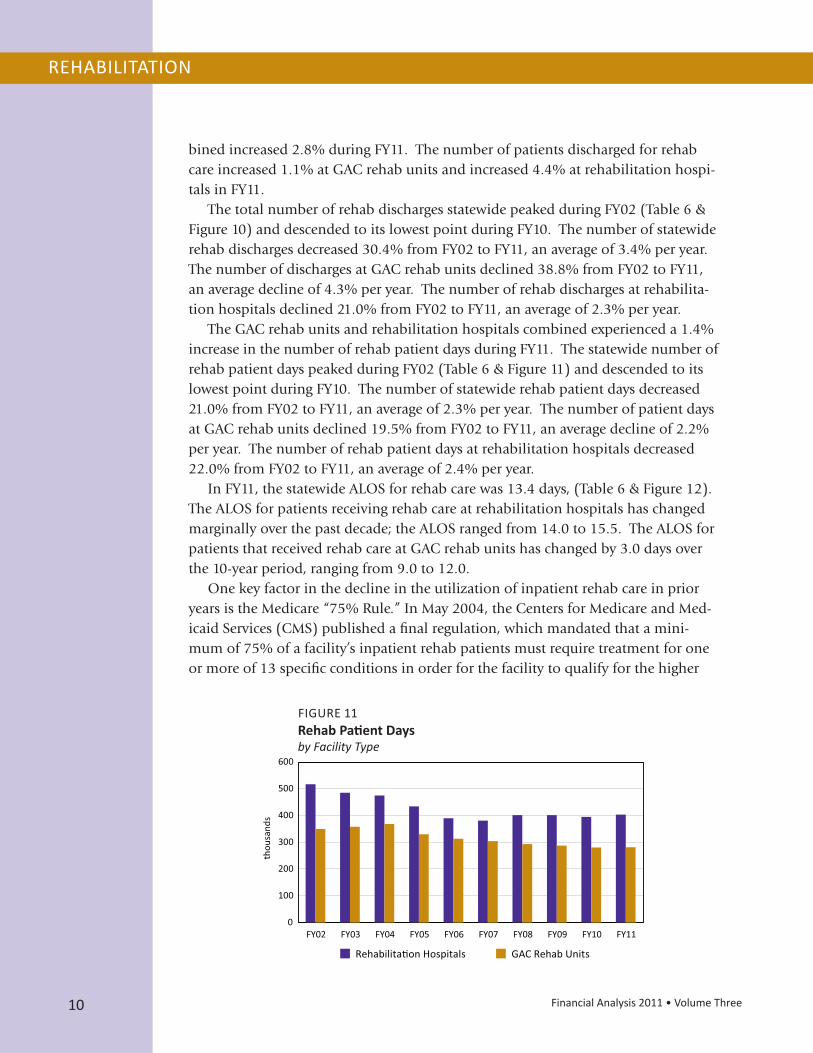
FIGURE 11Rehab Patient Daysby Facility Type
bined increased 2.8% during FY11. The number of patients discharged for rehab care increased 1.1% at GAC rehab units and increased 4.4% at rehabilitation hospi-tals in FY11.
The total number of rehab discharges statewide peaked during FY02 (Table 6 & Figure 10) and descended to its lowest point during FY10. The number of statewide rehab discharges decreased 30.4% from FY02 to FY11, an average of 3.4% per year. The number of discharges at GAC rehab units declined 38.8% from FY02 to FY11, an average decline of 4.3% per year. The number of rehab discharges at rehabilita-tion hospitals declined 21.0% from FY02 to FY11, an average of 2.3% per year.
The GAC rehab units and rehabilitation hospitals combined experienced a 1.4% increase in the number of rehab patient days during FY11. The statewide number of rehab patient days peaked during FY02 (Table 6 & Figure 11) and descended to its lowest point during FY10. The number of statewide rehab patient days decreased 21.0% from FY02 to FY11, an average of 2.3% per year. The number of patient days at GAC rehab units declined 19.5% from FY02 to FY11, an average decline of 2.2% per year. The number of rehab patient days at rehabilitation hospitals decreased 22.0% from FY02 to FY11, an average of 2.4% per year.
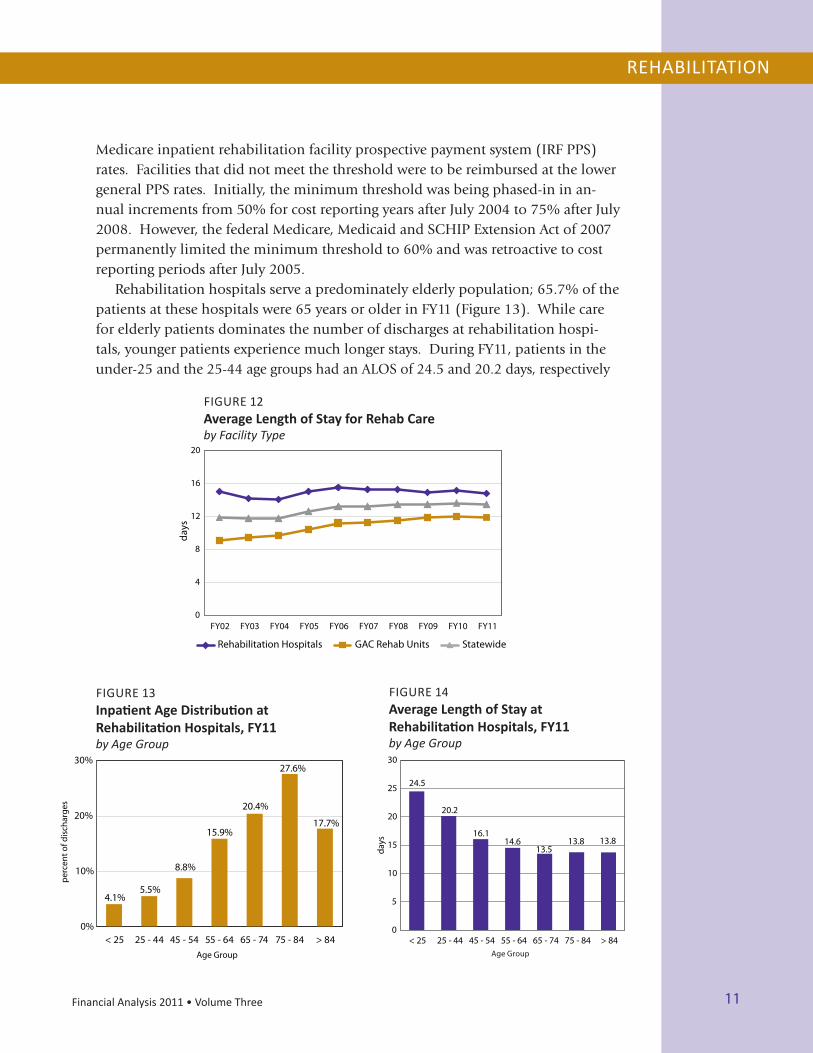
InFY11,thestatewideALOSforrehabcarewas13.4days,(Table6&Figure12).TheALOSforpatientsreceivingrehabcareatrehabilitationhospitalshaschangedmarginallyoverthepastdecade;theALOSrangedfrom14.0to15.5.TheALOSforpatients that received rehab care at GAC rehab units has changed by 3.0 days over the 10-year period, ranging from 9.0 to 12.0.
One key factor in the decline in the utilization of inpatient rehab care in prior years is the Medicare “75% Rule.” In May 2004, the Centers for Medicare and Med-icaidServices(CMS)publishedafinalregulation,whichmandatedthatamini-mum of 75% of a facility’s inpatient rehab patients must require treatment for one or more of 13 specific conditions in order for the facility to qualify for the higher
11Financial Analysis 2011 • Volume Three 11
REHABILITATION
24.5
20.2
16.114.6
13.513.8 13.8
0
5
10
15
20
25
30
< 25 25 - 44 45 - 54 55 - 64 65 - 74 75 - 84 > 84
days
Age Group
4.1%5.5%
8.8%
15.9%
20.4%
27.6%
17.7%
0%
10%
20%
30%
< 25 25 - 44 45 - 54 55 - 64 65 - 74 75 - 84 > 84
perc
ent o
f dis
char
ges
Age Group
FIGURE 13Inpatient Age Distribution at Rehabilitation Hospitals, FY11by Age Group
FIGURE 14Average Length of Stay at Rehabilitation Hospitals, FY11by Age Group
0
4
8
12
16
20
FY02 FY03 FY04 FY05 FY06 FY07 FY08 FY09 FY10 FY11
days
Rehabilitation Hospitals GAC Rehab Units Statewide
FIGURE 12Average Length of Stay for Rehab Careby Facility Type
Medicareinpatientrehabilitationfacilityprospectivepaymentsystem(IRFPPS)rates. Facilities that did not meet the threshold were to be reimbursed at the lower generalPPSrates.Initially,theminimumthresholdwasbeingphased-ininan-nual increments from 50% for cost reporting years after July 2004 to 75% after July 2008.However,thefederalMedicare,MedicaidandSCHIPExtensionActof2007permanently limited the minimum threshold to 60% and was retroactive to cost reporting periods after July 2005.
Rehabilitation hospitals serve a predominately elderly population; 65.7% of the patients at these hospitals were 65 years or older in FY11 (Figure 13). While care for elderly patients dominates the number of discharges at rehabilitation hospi-tals, younger patients experience much longer stays. During FY11, patients in the under-25andthe25-44agegroupshadanALOSof24.5and20.2days,respectively

12 Financial Analysis 2011 • Volume Three12
REHABILITATION
(Figure 14). In contrast, patients in the age groups over 65 had shorter stays of approximately 13.7 days on average.
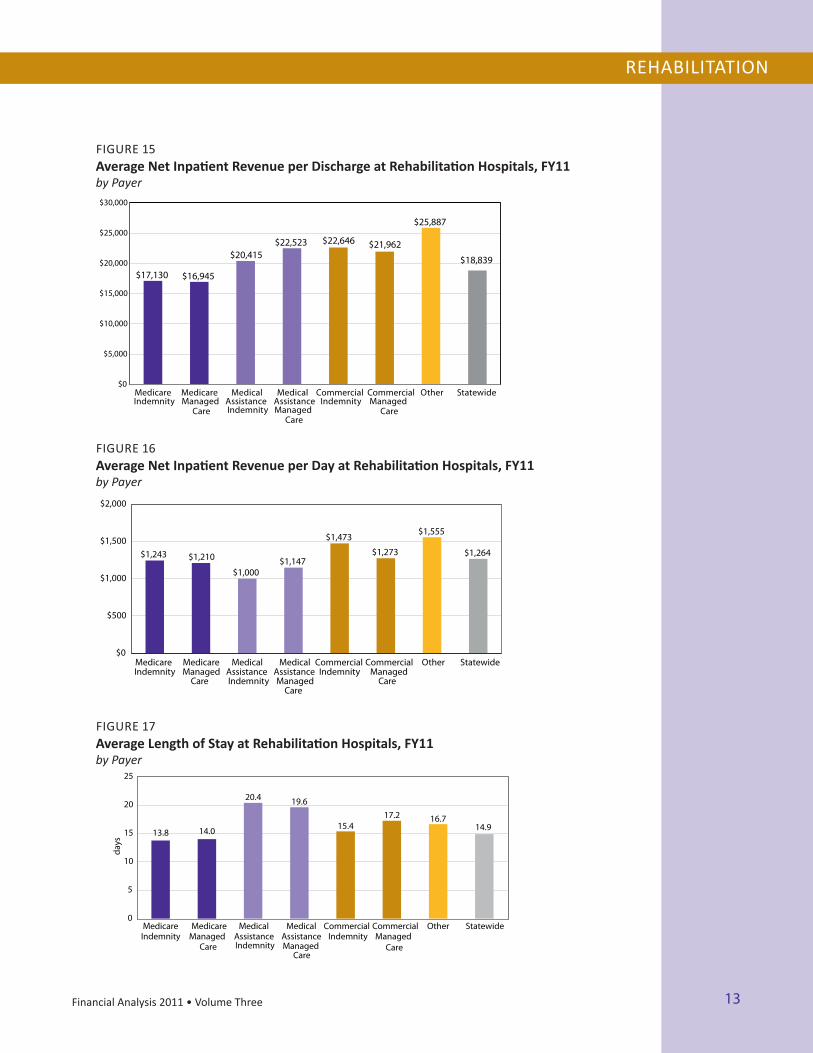
The revenue rehabilitation hospitals received per discharge and per day varied considerably by payer category (Figures 15 & 16). Part of this variation is attributable to the mix of patients and care covered by the different third-party payers and the variation of costs associated with treating those patients. The variations in the average patient age (Table7)andtheALOSbypayer(Figure17)indi-
Payer Average Age
Commercial 52.28
Medicare 76.14
MedicalAssistance 42.79
Other 55.32
Statewide 68.35
TABLE 7 Average Inpatient Age at Rehabilitation Hospitals, FY11 by Payer
cate the differences in the average level of care among the payers. Younger patients are more likely to be admitted for traumatic injuries, such as brain and spinal cord injuries, which typically have longer recovery periods. As a result, younger patients, on average, require longer lengths of stay.
Rehabilitation Hospitals – Financial Profile
Net patient revenue (NPR) increased 8.5% at rehabilitation hospitals from $598.7 million in FY10 to $649.4 million in FY11 (Table 8). Medicare provided 55.8% of the NPR at rehabilitation hospitals in FY11 (Figure 18). In FY11, state-wide operating revenue at the rehabilitation hospitals grew 9.4% as total discharges (rehab and skilled nursing care) at these hospitals increased 2.7%. The average inpatient revenue per discharge increased 6.9% from $17,618 in FY10 to $18,839 in FY11. The average inpatient revenue per day increased 8.8% from $1,161 in FY10 to $1,264 in FY11.
Even though the highest percent increases in revenue per day and revenue per discharge that rehabilitation hospitals experienced came from Medical Assistance, 53% of the $50.7 million growth in rehabilitation hospitals NPR resulted from revenue received from Medicare. The rehabilitation hospitals experienced a 4.6% increase in the number of discharges with Medicare as the payer. The 7.1% increase in the revenue per day from Medicare, coupled with the 4.6% increase in the num-ber of Medicare discharges, resulted in Medicare inpatient revenues increasing by 8.5% in FY11.
The increases in revenue per day and revenue per discharge from the Medical As-sistance (MA) program resulted in part from the passage of Pennsylvania Act 49 of 2010, which modernized MA payments. Prior to Act 49, MA payments to hospitals were based on the Diagnosis-Related Group (DRG) classification system, developed by the federal government for use with the Medicare program. The implementation of Pennsylvania Act 49 modernized the Commonwealth’s MA payment system by including the use of the All Patient Refined Diagnosis-Related Groups (APR DRGs) classification system.
13Financial Analysis 2011 • Volume Three 13
REHABILITATION
$17,130 $16,945
$20,415 $22,523 $22,646 $21,962
$25,887
$18,839
$0
$5,000
$10,000
$15,000
$20,000
$25,000
$30,000
MedicareIndemnity
MedicareManaged
Care
MedicalAssistanceIndemnity
MedicalAssistanceManaged
Care
CommercialIndemnity
CommercialManaged
Care
Other Statewide
FIGURE 15Average Net Inpatient Revenue per Discharge at Rehabilitation Hospitals, FY11by Payer
$1,243 $1,210
$1,000 $1,147
$1,473
$1,273
$1,555
$1,264
$0
$500
$1,000
$1,500
$2,000
MedicareIndemnity
MedicareManaged
Care
MedicalAssistanceIndemnity
MedicalAssistanceManaged
Care
CommercialIndemnity
CommercialManaged
Care
Other Statewide
FIGURE 16Average Net Inpatient Revenue per Day at Rehabilitation Hospitals, FY11by Payer
FIGURE 17Average Length of Stay at Rehabilitation Hospitals, FY11by Payer
13.8 14.0
20.4 19.6
15.417.2 16.7
14.9
0
5
10
15
20
25
MedicareIndemnity
MedicareManaged
Care
MedicalAssistanceIndemnity
MedicalAssistanceManaged
Care
CommercialIndemnity
CommercialManaged
Care
Other Statewide
days

14 Financial Analysis 2011 • Volume Three14
REHABILITATION
Act 49 provisions also created a new assessment on hospitals referred to as the Quality Care Assessment. The additional revenue from this assessment allowed the MA program to update hospital base rates, which had not been performed since 1989, and to provide additional disproportionate share and supplemental pay-ments to hospitals that are better aligned with patient treatment costs.
The increase in NPR from MA is predominately driven by changes brought about by Act 49, and is partly offset by the assessment that hospitals pay to the Common-wealth each year. The MA amounts in Table 8 do not reflect the additional costs of the assessment incurred by hospitals.
Outpatient and home health care at rehabilitation hospitals generated about one-fifth (18.5%) or $119.9 million of the $649.4 million in total NPR reported by the rehabilitation hospitals for FY11.
The 9.4% increase in total operating revenue for the rehabilitation hospitals outpaced the 4.9% increase in operating expenses during FY11 (Table 9). As a re-sult, the statewide average operating margin improved 3.76 percentage points from 10.37% in FY10 to 14.13% in FY11 (Figure 19). This increase in FY11 was followed by a 0.14 percentage point increase in the statewide operating margin in FY10.
Net Patient Revenue (thousands)
FY10 FY11
Commercial
Indemnity $68,840 $82,063
ManagedCare $97,067 $93,544
Total $165,907 $175,607
Medicare
Indemnity $271,530 $305,189
ManagedCare $64,311 $57,455
Total $335,841 $362,644
Medical Assistance
Indemnity $27,155 $27,113
ManagedCare $23,249 $27,491
Total $50,404 $54,604
Other $46,582 $56,542
Statewide $598,734 $649,397
TABLE 8Net Patient Revenue at Rehabilitation Hospitalsby Payer
Medicare55.8%
Medical Assistance
8.4%
Commercial27.0%
Other8.8%
FIGURE 18Net Patient Revenue at Rehabilitation Hospitals, FY11by Payer

15Financial Analysis 2011 • Volume Three 15
REHABILITATION
FY02 FY03 FY04 FY05 FY06 FY07 FY08 FY09 FY10 FY11
NetPatientRevenue $556,241 $562,271 $575,035 $549,165 $514,631 $532,349 $564,962 $584,647 $598,734 $649,397 TotalOperatingRevenue $606,514 $596,907 $606,827 $583,200 $547,486 $575,710 $600,282 $619,369 $635,778 $695,854 TotalOperatingExpenses $548,682 $524,222 $540,481 $511,814 $488,781 $523,738 $546,874 $556,021 $569,853 $597,554 OperatingIncome $57,831 $72,685 $66,346 $71,386 $58,705 $51,972 $53,408 $63,348 $65,925 $98,300 Non-operatingIncome* ($34,715) ($17,553) $1,174 $4,728 $14,252 $9,319 $18,569 ($29,174) $3,425 $735 RevenueoverExpenses $23,117 $55,132 $67,520 $76,114 $72,956 $61,291 $71,977 $34,174 $69,350 $99,035
*Includesnon-operatingincome,incometaxes,andextraordinaryitems.
TABLE 9Revenue, Expenses, and Income at Rehabilitation Hospitalsby Fiscal Year (thousands)
The statewide average total margin increased 3.21 percentage points from 10.65% in FY10 to 13.86% in FY11. The increase in FY11 was followed by a 4.95 percentage point increase in the statewide average total margin in FY10.
The 10.59% FY11 average operating margin for the non-profit rehabilitation hos-pitals was 8.91 percentage points below the 19.50% FY11 average operating margin for the for-profit rehabilitation hospitals. Investment and other non-operating gains generally drove the average total margin to 14.35% at the non-profit reha-bilitation hospitals; 3.76 percentage points above their average operating margin. The 13.09% average total margin for the for-profit hospitals, which are subject to income tax, was 6.41 percentage points below their average operating margin. The 14.35% average total margin for the non-profit hospitals was 1.26 percentage points higher than the 13.09% average total margin at the for-profit rehabilitation hospitals.
9.54%
12.18%10.93%
12.24%10.72%
9.03% 8.90%
10.23%
10.37%
14.13%
3.87%
9.28%10.89%
12.75% 12.80%
10.32%11.49%
5.70%
10.65%13.86%
0%
4%
8%
12%
16%
FY02 FY03 FY04 FY05 FY06 FY07 FY08 FY09 FY10 FY11
Operating Margin Total Margin
FIGURE 19Operating and Total Margins at Rehabilitation Hospitalsby Fiscal Year
16 Financial Analysis 2011 • Volume Three
REHABILITATION
Region/Rehabilitation Hospital
Net Patient RevenueNPR (millions)
3-yr Avg Change in NPR
FY08-FY11
Total Operating ExpensesTOE (millions)
3-yr Avg Change in TOE
FY08-FY11FY11 FY10 FY09 FY08 FY11 FY10 FY09 FY08
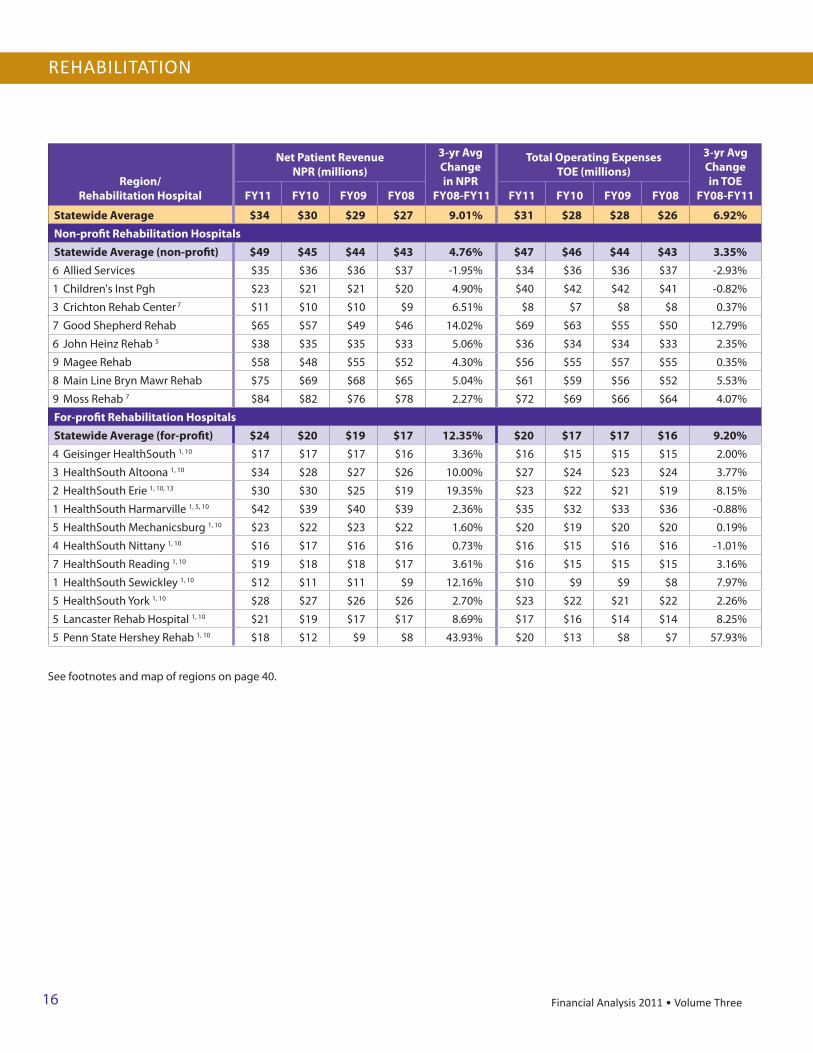
Statewide Average $34 $30 $29 $27 9.01% $31 $28 $28 $26 6.92%Non-profit Rehabilitation HospitalsStatewide Average (non-profit) $49 $45 $44 $43 4.76% $47 $46 $44 $43 3.35%6 AlliedServices $35 $36 $36 $37 -1.95% $34 $36 $36 $37 -2.93%
1 Children'sInstPgh $23 $21 $21 $20 4.90% $40 $42 $42 $41 -0.82%
3 CrichtonRehabCenter 7 $11 $10 $10 $9 6.51% $8 $7 $8 $8 0.37%
7 GoodShepherdRehab $65 $57 $49 $46 14.02% $69 $63 $55 $50 12.79%
6 JohnHeinzRehab5 $38 $35 $35 $33 5.06% $36 $34 $34 $33 2.35%
9 MageeRehab $58 $48 $55 $52 4.30% $56 $55 $57 $55 0.35%
8 MainLineBrynMawrRehab $75 $69 $68 $65 5.04% $61 $59 $56 $52 5.53%
9 MossRehab7 $84 $82 $76 $78 2.27% $72 $69 $66 $64 4.07%
For-profit Rehabilitation HospitalsStatewide Average (for-profit) $24 $20 $19 $17 12.35% $20 $17 $17 $16 9.20%4 GeisingerHealthSouth1, 10 $17 $17 $17 $16 3.36% $16 $15 $15 $15 2.00%
3 HealthSouthAltoona1, 10 $34 $28 $27 $26 10.00% $27 $24 $23 $24 3.77%
2 HealthSouthErie1, 10, 13 $30 $30 $25 $19 19.35% $23 $22 $21 $19 8.15%
1 HealthSouthHarmarville1, 5, 10 $42 $39 $40 $39 2.36% $35 $32 $33 $36 -0.88%
5 HealthSouthMechanicsburg1, 10 $23 $22 $23 $22 1.60% $20 $19 $20 $20 0.19%
4 HealthSouthNittany1, 10 $16 $17 $16 $16 0.73% $16 $15 $16 $16 -1.01%
7 HealthSouthReading1, 10 $19 $18 $18 $17 3.61% $16 $15 $15 $15 3.16%
1 HealthSouthSewickley1, 10 $12 $11 $11 $9 12.16% $10 $9 $9 $8 7.97%
5 HealthSouthYork1, 10 $28 $27 $26 $26 2.70% $23 $22 $21 $22 2.26%
5 LancasterRehabHospital1, 10 $21 $19 $17 $17 8.69% $17 $16 $14 $14 8.25%
5 PennStateHersheyRehab1, 10 $18 $12 $9 $8 43.93% $20 $13 $8 $7 57.93%
Seefootnotesandmapofregionsonpage40.

17Financial Analysis 2011 • Volume Three
REHABILITATION
Rehabilitation Hospital
Operating Margin
FY11
Total Margin
FY11
3-yr Average Total Margin FY09-FY11
Percent of Uncompensated
Care FY11
Medicare Share of NPR
FY11
Medical Assistance
Share of NPR FY11
Statewide Average 14.13% 13.86% 10.31% 0.88% 55.84% 8.41%Non-profit Rehabilitation HospitalsStatewide Average (non-profit) 10.59% 14.35% 9.13% 0.88% 45.70% 11.05%AlliedServices 8.20% 12.47% 7.07% 0.30% 81.62% 2.19%
Children'sInstPgh -7.50% 4.49% -10.99% 1.33% 7.68% 44.26%
CrichtonRehabCenter7 22.21% 22.21% 21.69% 0.83% 75.91% 9.01%
GoodShepherdRehab 4.16% 4.16% 2.04% 1.36% 37.57% 8.99%
JohnHeinzRehab5 9.16% 10.17% 5.15% 0.29% 74.79% 2.79%
MageeRehab 9.09% 22.52% 6.59% 1.11% 22.36% 13.61%
MainLineBrynMawrRehab 20.82% 21.66% 20.21% 1.17% 53.09% 0.99%
MossRehab7 15.98% 16.01% 16.77% 0.51% 39.93% 18.51%
For-profit Rehabilitation HospitalsStatewide Average (for-profit) 19.50% 13.09% 12.17% 0.86% 70.98% 4.47%GeisingerHealthSouth1, 10 24.41% 19.38% 19.07% 0.70% 70.82% 2.40%
HealthSouthAltoona1, 10 23.78% 18.12% 13.93% 0.79% 74.17% 3.83%
HealthSouthErie1, 10, 13 26.19% 15.32% 15.60% 1.77% 82.23% 5.54%
HealthSouthHarmarville1, 5, 10 23.13% 13.49% 12.69% 0.45% 56.65% 3.30%
HealthSouthMechanicsburg1, 10 18.77% 12.38% 9.98% 0.79% 78.80% 1.10%
HealthSouthNittany1, 10 10.58% 6.92% 5.17% 0.63% 74.88% 4.91%
HealthSouthReading1, 10 18.85% 11.03% 12.63% 1.38% 83.63% 3.80%
HealthSouthSewickley1, 10 20.00% 14.18% 13.37% 0.41% 57.91% 4.13%
HealthSouthYork1, 10 19.77% 11.57% 12.64% 0.61% 76.19% 4.06%
LancasterRehabHospital1, 10 19.38% 19.38% 19.03% 0.65% 73.03% 4.86%
PennStateHersheyRehab1, 10 -4.44% -4.44% -4.09% 1.32% 51.82% 13.57%
Seefootnotesandmapofregionsonpage40.

18 Financial Analysis 2011 • Volume Three18
PSYCHIATRIC
Psychiatric Hospitals
36.3%
State Psychiatric
Hospitals0.7%
GAC Psych Units 57.4%
Specialty & LTAC Psych Units
5.6%
Psychiatric Hospitals
32.5%
State Psychiatric Hospitals
26.2%
GAC Psych Units 34.7%
Specialty & LTAC Psych Units
6.6%
FIGURE 21Psychiatric Patient Days, FY11by Facility Type
FIGURE 20Psychiatric Discharges, FY11by Facility Type
Psychiatric
Psychiatric Care
Inpatient psychiatric care in Pennsylvania is provided by state psychiatric hos-pitals, freestanding psychiatric hospitals, general acute care (GAC) hospitals, spe-cialty hospitals, and long-term acute care (LTAC) hospitals. During fiscal year 2011 (FY11), there were 19 psychiatric hospitals in Pennsylvania that treated 36.3% of the patients admitted for inpatient psychiatric care statewide and provided 32.5% of the total patient days of acute psychiatric care (Figures 20 & 21).
Highlights
• Thefreestandingpsychiatrichospitalsasagroupposteda0.67percentagepoint decrease in the statewide average operating margin, from 5.90% in FY10 to 5.23% in FY11.
• Thestatewideaveragetotalmarginincreased0.19ofapercentagepoint,from 4.55% in FY10 to 4.74% in FY11.
• TheCommonwealth,throughthePennsylvaniaDepartmentofPublicWelfare (DPW), is the largest provider of psychiatric care in the state. DPW’s seven state psychiatric hospitals provided 26.2% of all patient days of psy-chiatric care during FY11. In addition, the Medical Assistance (MA) program provided 54.9% of the net patient revenue received by the 19 psychiatric hospitals in Pennsylvania during FY11. Of all patients receiving inpatient psychiatric care at GAC psychiatric units, 23.2% were MA participants.

19Financial Analysis 2011 • Volume Three 19
PSYCHIATRIC
0
5
10
15
20
25
30
35
FY02 FY03 FY04 FY05 FY06 FY07 FY08 FY09 FY10 FY11
days
Psychiatric Hospitals GAC Psych Units Specialty Psych Units LTAC Psych Units Statewide*
FIGURE 22Average Length of Stay for Psychiatric Careby Facility Type*
Theaveragelengthofstay(ALOS)atpsychiatrichospitalsduringFY11was13.3 (Table 10 & Figure 22). However, excluding long-term residential and drug andalcohol(D&A)careprograms,theALOSwas11.2days.Sixofthepsychiatrichospitals provided residential care, and three provided inpatient D&A care (Table 11). Residential care is typically a less intensive treatment that often follows acute psychiatric hospital care. Residential treatment is often utilized when community orfamily-basedoptionsarenotappropriateforthepatient.DuringFY11,theALOSat the psychiatric hospitals’ residential programs was 116.4 days.
The state psychiatric hospitals provide long-term inpatient care for individuals thatrequireintensivetreatment.SevenstatepsychiatrichospitalsoperatedinPenn-sylvania in FY11. Although state psychiatric hospitals provided 26.2% of statewide psychiatric patient days in FY11, they only discharged 1,011 patients, which is 0.7% ofthetotalpsychiatricdischargesfromallfacilities.TheALOSatthestatepsychiat-ric hospitals was 523.3 days during FY11.
In contrast, psychiatric units that operated as part of a GAC hospital provided relativelyshort-termacutepsychiatriccarewithanALOSof9.0daysduringFY11.Eighty-seven (52%) of the GAC hospitals in Pennsylvania operated psychiatric units, which include three D&A programs, during FY11. These GAC psychiatric units treated 57.4% of the total patients admitted for inpatient psychiatric care statewide and provided 34.7% of the total patient days of psychiatric care during FY11.
Four specialty hospitals in Pennsylvania provided some form of psychiatric care. Three hospitals provided acute psychiatric care, which represented only 20.6% of the total psychiatric care provided at specialty hospitals. The remaining 79.4% of psychiatric care at specialty hospitals was provided by D&A programs at three hos-
*Excludesstatepsychiatrichospitals

20 Financial Analysis 2011 • Volume Three20
PSYCHIATRIC
FY02 FY03 FY04 FY05 FY06 FY07 FY08 FY09 FY10 FY11
Patient Days
Psychiatric Hospitals 548,281 567,435 558,552 558,059 556,829 586,344 591,751 625,567 639,643 656,941 State Psychiatric Hospitals 855,179 772,491 773,443 761,065 718,962 675,186 642,444 582,684 565,482 529,083 GAC Psych Units 738,873 753,413 757,131 742,683 730,956 718,089 700,008 680,291 691,435 700,058 Specialty Psych Units 139,380 145,703 149,446 155,908 151,878 124,008 128,898 98,880 102,302 120,431 LTAC Psych Units 28,788 29,033 28,223 29,324 28,455 30,518 29,516 29,251 29,724 13,711 Statewide 2,310,501 2,268,075 2,266,795 2,247,039 2,187,080 2,134,145 2,092,617 2,016,673 2,028,586 2,020,224 Discharges
Psychiatric Hospitals 40,336 42,673 44,173 41,587 41,911 42,358 44,592 47,790 48,544 49,453 State Psychiatric Hospitals 1,955 1,674 1,634 1,637 1,741 1,479 1,346 1,257 1,111 1,011 GAC Psych Units 85,449 84,338 85,748 84,670 83,821 81,207 78,649 74,889 76,593 78,044 Specialty Psych Units 9,381 9,396 9,430 9,886 9,387 7,983 8,387 5,982 6,665 6,996 LTAC Psych Units 1,219 949 956 982 1,006 998 1,112 1,068 1,124 590 Statewide 138,340 139,030 141,941 138,762 137,866 134,025 134,086 130,986 134,037 136,094 Beds
Psychiatric Hospitals 1,896 1,938 1,958 1,965 1,941 2,040 2,055 2,142 2,289 2,282 State Psychiatric Hospitals 2,678 2,381 2,387 2,440 2,198 2,206 2,173 2,238 1,857 1,732 GAC Psych Units 3,068 2,982 2,920 2,853 2,790 2,762 2,643 2,559 2,652 2,603 Specialty Psych Units 524 531 550 558 545 455 453 395 395 464 LTAC Psych Units 112 112 112 112 113 113 99 98 107 56 Statewide 8,278 7,944 7,927 7,928 7,587 7,576 7,423 7,432 7,300 7,137 Patient Population
State Psychiatric Hospitals 2,215 2,164 2,142 2,120 1,916 1,848 1,710 1,627 1,584 1,472 Occupancy Rate
Psychiatric Hospitals 79.76% 79.76% 78.55% 80.98% 81.71% 79.02% 78.98% 78.78% 80.21% 81.41%State Psychiatric Hospitals 87.02% 88.67% 88.73% 85.07% 87.67% 83.85% 80.78% 77.78% 80.99% 79.52%GAC Psych Units 65.88% 69.71% 72.13% 73.32% 72.46% 72.69% 72.88% 73.90% 73.62% 73.58%Specialty Psych Units 72.85% 75.75% 75.92% 76.55% 76.35% 69.58% 76.65% 63.28% 70.96% 75.81%LTAC Psych Units 70.42% 71.02% 68.90% 71.73% 69.55% 73.99% 81.46% 81.78% 76.11% 67.08%Statewide 76.41% 78.30% 78.98% 79.09% 79.53% 77.47% 77.23% 75.93% 77.48% 77.61%Statewide w/o State* 71.30% 73.84% 74.72% 76.34% 76.07% 74.84% 75.76% 75.21% 76.21% 76.96%Average Length of Stay
Psychiatric Hospitals 13.6 13.3 12.6 13.4 13.3 13.8 13.3 13.1 13.2 13.3State Psychiatric Hospitals 437.4 461.5 473.3 464.9 413.0 456.5 477.3 463.6 509.0 523.3GAC Psych Units 8.6 8.9 8.8 8.8 8.7 8.8 8.9 9.1 9.0 9.0Specialty Psych Units 14.9 15.5 15.8 15.8 16.2 15.5 15.4 16.5 15.3 17.2LTAC Psych Units 23.6 30.6 29.5 29.9 28.3 30.6 26.5 27.4 26.4 23.2Statewide 16.7 16.3 16.0 16.2 15.9 15.9 15.6 15.4 15.1 14.8Statewide w/o State* 10.7 10.9 10.6 10.8 10.8 11.0 10.9 11.1 11.0 11.0
TABLE 10 Utilization and Capacity of Psychiatric Careby Facility Type
*Excludesstatepsychiatrichospitals
21Financial Analysis 2011 • Volume Three 21
PSYCHIATRIC
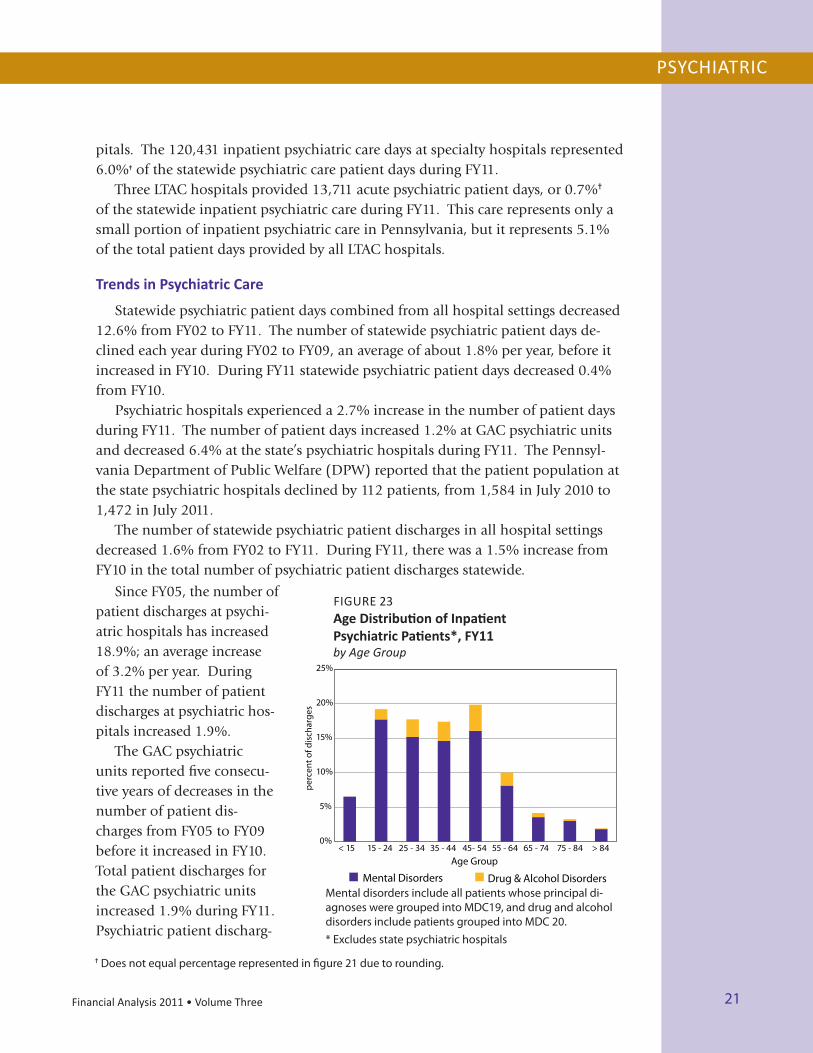
pitals. The 120,431 inpatient psychiatric care days at specialty hospitals represented 6.0%✝ of the statewide psychiatric care patient days during FY11.
Three LTAC hospitals provided 13,711 acute psychiatric patient days, or 0.7%✝ of the statewide inpatient psychiatric care during FY11. This care represents only a small portion of inpatient psychiatric care in Pennsylvania, but it represents 5.1% of the total patient days provided by all LTAC hospitals.
Trends in Psychiatric Care
Statewidepsychiatricpatientdayscombinedfromallhospitalsettingsdecreased12.6% from FY02 to FY11. The number of statewide psychiatric patient days de-clined each year during FY02 to FY09, an average of about 1.8% per year, before it increased in FY10. During FY11 statewide psychiatric patient days decreased 0.4% from FY10.
Psychiatric hospitals experienced a 2.7% increase in the number of patient days during FY11. The number of patient days increased 1.2% at GAC psychiatric units and decreased 6.4% at the state’s psychiatric hospitals during FY11. The Pennsyl-vania Department of Public Welfare (DPW) reported that the patient population at the state psychiatric hospitals declined by 112 patients, from 1,584 in July 2010 to 1,472 in July 2011.
The number of statewide psychiatric patient discharges in all hospital settings decreased 1.6% from FY02 to FY11. During FY11, there was a 1.5% increase from FY10 in the total number of psychiatric patient discharges statewide.
✝Doesnotequalpercentagerepresentedinfigure21duetorounding.
0%
5%
10%
15%
20%
25%
< 15 15 - 24 25 - 34 35 - 44 45- 54 55 - 64 65 - 74 75 - 84 > 84
perc
ent o
f dis
char
ges
Age Group
Mental Disorders Drug & Alcohol DisordersMentaldisordersincludeallpatientswhoseprincipaldi-agnosesweregroupedintoMDC19,anddrugandalcoholdisordersincludepatientsgroupedintoMDC20.
FIGURE 23Age Distribution of Inpatient Psychiatric Patients*, FY11by Age Group
*Excludesstatepsychiatrichospitals
SinceFY05,thenumberofpatient discharges at psychi-atric hospitals has increased 18.9%; an average increase of 3.2% per year. During FY11 the number of patient discharges at psychiatric hos-pitals increased 1.9%.
The GAC psychiatric units reported five consecu-tive years of decreases in the number of patient dis-charges from FY05 to FY09 before it increased in FY10. Total patient discharges for the GAC psychiatric units increased 1.9% during FY11. Psychiatric patient discharg-

22 Financial Analysis 2011 • Volume Three22
PSYCHIATRIC
HospitalPatient
Days
Bed Days
AvailableOccupancy
Rate Discharges Beds
Average Lengthof Stay (ALOS)
ALOS w/o Residential
& D&A
All Hospital Services (including Residential and Drug & Alcohol Treatment Programs)
BelmontCenter 48,637 53,655 90.65% 3,766 147 12.9 NA
BrookeGlenBehavioral 31,602 36,500 86.58% 3,193 146 9.9 NA
ClarionPsych 21,678 27,010 80.26% 1,707 74 12.7 NA
DevereuxBehavioralHlth 8,817 12,045 73.20% 391 33 22.5 NA
FairmountBehavioral 77,051 87,235 88.33% 6,184 239 12.5 12.0
FirstWyomingValley 33,783 39,055 86.50% 3,627 107 9.3 NA
FoundationsBehavioral 33,156 41,610 79.68% 1,024 114 32.4 16.3
Friends 60,053 79,935 75.13% 4,765 219 12.6 11.1
HavenBehavioral 9,199 12,060 76.28% 1,289 48 7.1 NA
HorshamClinic 62,244 75,190 82.78% 5,583 206 11.1 NA
KidsPeace 25,389 29,456 86.19% 1,884 96 13.5 NA
KirkbrideCenter 57,800 82,490 70.07% 3,313 226 17.4 6.9
MeadowsPsychCenter 21,770 25,561 85.17% 1,853 70 11.7 NA
MontgomeryCtyES 24,327 29,565 82.28% 2,362 81 10.3 10.9
PAPsychInstitute 20,213 27,010 74.84% 2,413 74 8.4 NA
Philhaven 37,584 44,372 84.70% 2,107 136 17.8 13.9
RoxburyTreatment 33,540 40,880 82.05% 2,566 112 13.1 10.8
SouthwoodPsych 36,692 47,960 76.51% 1,346 112 27.3 9.0
StJohnVianney 13,406 15,330 87.45% 80 42 167.6 3.8
Residential and Drug & Alcohol Treatment Programs
FairmountBehavioral 21,267 24,455 86.96% 1,525 67 13.9 NA
FoundationsBehavioral 18,264 21,900 83.40% 111 60 164.5 NA
Friends 7,378 9,855 74.87% 4 27 1,844.5 NA
KirkbrideCenter 49,981 56,210 88.92% 2,186 154 22.9 NA
MontgomeryCtyES 2,038 2,920 69.79% 318 8 6.4 NA
Philhaven 9,323 10,061 92.66% 72 37 129.5 NA
RoxburyTreatment 19,159 21,900 87.48% 1,237 60 15.5 NA
SouthwoodPsych 25,304 33,484 75.57% 77 68 328.6 NA
StJohnVianney 13,360 14,600 91.51% 68 40 196.5 NA
TABLE 11Utilization and Capacity, FY11by Psychiatric Hospital
NA-NotApplicable

23Financial Analysis 2011 • Volume Three 23
PSYCHIATRIC
FIGURE 24Net Patient Revenue at Psychiatric Hospitals, FY11by Payer
Medicare16.2%
Medical Assistance54.9%
Commercial22.6%
Other6.3%
es for LTAC and specialty hospitals combined decreased 2.6% in FY11. Inpatient psychiatric care has a younger age distribution than other types of hos-
pital-based care. The average age of inpatients treated at psychiatric hospitals was 31.7 years compared to a mean age of 52.9 years for all inpatients at GAC hospitals, 68.4 years at rehabilitation hospitals, and 68.9 years at LTAC hospitals. In FY11, discharges among patients age 15 through 54 made up 74.1% of inpatient psychiat-ric discharges, excluding state psychiatric discharges (Figure 23).
Psychiatric Hospitals – Financial Profile
The Commonwealth, through DPW, is the largest provider of psychiatric care. As previously mentioned, DPW’s seven state hospitals provided 26.2% of all patient days of psychiatric care during FY11. In addition, the Medical Assistance (MA) pro-gram administered by DPW provided 54.9% of the net patient revenue received by the 19 psychiatric hospitals in Pennsylvania during FY11 (Figure 24). MA partici-pants also comprised 23.2% of all patients that received inpatient psychiatric care at GAC psychiatric units in FY11. DPW also sponsors psychiatric care in a variety of other settings.
The Commonwealth directly underwrites 79.3% of the cost of the care provided at the state psychiatric hospitals. Of the remaining 20.7% of total expenses covered by third-party payers, patients and other sources; 11.5% are covered by MA, 6.2% by Medicare, and 3.0% are covered by private insurance, individuals and other sources.
As a group, psychiatric hospitals experienced a long history of negative or very small positive statewide average operating margins prior to FY05 (Figure 25). However, during the two-year period FY05 and FY06, they experienced a dramatic 9.08-point improvement in their combined operating margin. The statewide op-
erating margin increased 4.99 points during FY05 and an additional 4.09 points during FY06. The statewide operating margins improved because operating revenue grew a total of 11.7% during FY05 and FY06, while the total growth in expenses was held to 1.9% over the two-yearperiod(Table12).Sincestatewideutilizationlevelsat the psychiatric hospitals operating during FY05 and FY06 remained relatively constant, the growth in operat-ing revenue was primarily driven by increases in reim-bursement rates.
During FY11, the operating margin at psychiatric hos-pitals decreased 0.67 of a percentage point from 5.90% in FY10 to 5.23% in FY11. The statewide operating mar-gin declined because, as a group, the growth in operating expenses outpaced the increase in operating revenue. During FY11, statewide operating revenue increased

24 Financial Analysis 2011 • Volume Three24
PSYCHIATRIC
FY02 FY03 FY04 FY05 FY06 FY07 FY08 FY09 FY10 FY11
NetPatientRevenue $285,797 $297,816 $292,978 $315,600 $330,133 $357,768 $373,111 $403,582 $429,987 $450,057 TotalOperatingRevenue $297,000 $306,541 $303,161 $324,388 $338,594 $364,279 $383,325 $411,203 $439,728 $461,890 TotalOperatingExpenses $303,944 $304,742 $314,693 $320,517 $320,728 $343,536 $360,482 $393,341 $413,778 $437,712 OperatingIncome ($6,944) $1,798 ($11,532) $3,872 $17,866 $20,743 $22,843 $17,861 $25,950 $24,177 Non-operatingIncome* $2,302 ($1,685) $7,655 $5,702 ($5,745) ($6,844) ($5,121) ($6,311) ($5,369) ($1,537)RevenueoverExpenses ($4,642) $113 ($3,877) $9,574 $12,121 $13,899 $17,722 $11,550 $20,581 $22,640
TABLE 12Revenue, Expenses, and Income at Psychiatric Hospitals by Fiscal Year (thousands)
5.0%, while expenses rose 5.8%. Psychiatric hospitals’ statewide average total mar-gin increased 0.19 of a percentage point from 4.55% in FY10 to 4.74% in FY11.
The disparity in the average operating and total margins between the for-profit and non-profit psychiatric hospitals continued in FY11. The for-profit hospitals posted an average operating margin of 9.34%, compared to a negative 1.62% for thenon-profithospitals.Sincethefor-profithospitalsaresubjecttoincometaxes,the statewide average total margin for the for-profit hospitals was 6.79%.
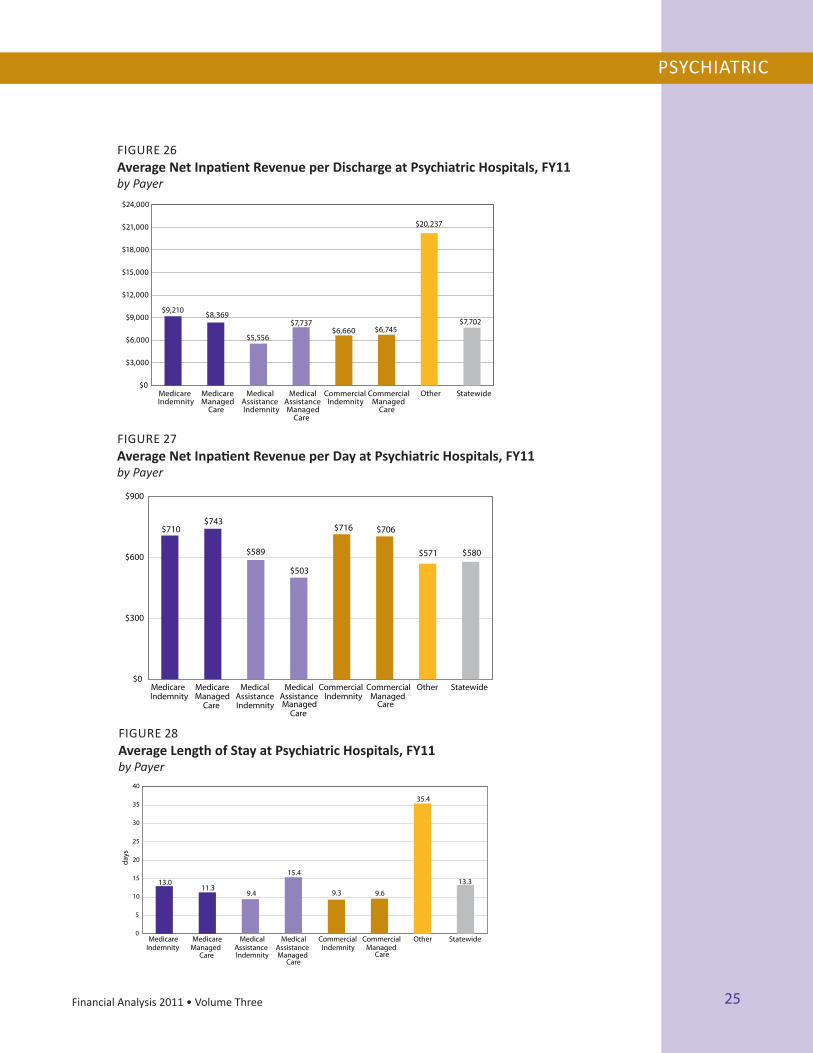
Among the psychiatric hospitals, the FY11 average revenue per discharge of $7,702 (Figure 26) was 2.9% higher than the FY10 average of $7,487. The average revenue per day for FY11 was $580 (Figure 27), compared to $568 in FY10. Patients covered by commercial indemnity plans, commercial managed care plans, and MA indemnityprogramhadashorterALOSthanthosecoveredbyotherpayertypes(Figure 28).
-2.34%
0.59%
-3.80%
1.19%
5.28% 5.69% 5.96%4.34%
5.90%5.23%
-1.55%0.04%
-1.27%
2.84%3.57% 3.80% 4.55%
2.74%
4.55% 4.74%
-8%
-4%
0%
4%
8%
12%
FY02 FY03 FY04 FY05 FY06 FY07 FY08 FY09 FY10 FY11
Operating Margin Total Margin
FIGURE 25Operating and Total Margins at Psychiatric Hospitals by Fiscal Year
*Includesnon-operatingincome,incometaxes,andextraordinaryitems.
25Financial Analysis 2011 • Volume Three 25
PSYCHIATRIC
$9,210 $8,369
$5,556
$7,737 $6,660 $6,745
$20,237
$7,702
$0
$3,000
$6,000
$9,000
$12,000
$15,000
$18,000
$21,000
$24,000
MedicareIndemnity
MedicareManaged
Care
MedicalAssistanceIndemnity
MedicalAssistanceManaged
Care
CommercialIndemnity
CommercialManaged
Care
Other Statewide
FIGURE 26Average Net Inpatient Revenue per Discharge at Psychiatric Hospitals, FY11by Payer
$710 $743
$589
$503
$716 $706
$571 $580
$0
$300
$600
$900
MedicareIndemnity
MedicareManaged
Care
MedicalAssistanceIndemnity
MedicalAssistanceManaged
Care
CommercialIndemnity
CommercialManaged
Care
Other Statewide
FIGURE 27Average Net Inpatient Revenue per Day at Psychiatric Hospitals, FY11by Payer
FIGURE 28Average Length of Stay at Psychiatric Hospitals, FY11by Payer
13.011.3
9.4
15.4
9.3 9.6
35.4
13.3
0
5
10
15
20
25
30
35
40
MedicareIndemnity
MedicareManaged
Care
MedicalAssistanceIndemnity
MedicalAssistanceManaged
Care
CommercialIndemnity
CommercialManaged
Care
Other Statewide
days

26 Financial Analysis 2011 • Volume Three
PSYCHIATRIC
Region/Psychiatric Hospital
Net Patient RevenueNPR (millions)
3-yr Avg Change in NPR
FY08-FY11
Total Operating ExpensesTOE (millions)
3-yr Avg Change in TOE
FY08-FY11FY11 FY10 FY09 FY08 FY11 FY10 FY09 FY08
Statewide Average $24 $23 $21 $22 2.64% $23 $22 $21 $21 2.88%Non-profit Psychiatric HospitalsStatewide Average (non-profit) $24 $23 $21 $21 4.67% $25 $24 $22 $22 4.57%9 BelmontCenter $39 $38 $37 $36 2.44% $39 $39 $38 $37 1.79%
8 DevereuxBehavioralHlth7 $6 $6 $5 $5 8.53% $6 $5 $5 $5 5.23%
7 KidsPeace1 $24 $22 $19 $18 11.40% $22 $22 $20 $20 3.73%
8 MontgomeryCtyES5, 13 $17 $16 $16 $15 4.00% $17 $16 $16 $16 3.18%
5 PAPsychInstitute $20 $18 $12 NA NA $31 $26 $19 NA NA
5 Philhaven5 $54 $52 $51 $48 3.93% $54 $52 $52 $50 2.75%
8 StJohnVianney5 $7 $6 $5 $3 38.98% $7 $7 $5 $5 15.14%
For-profit Psychiatric HospitalsStatewide Average (for-profit) $24 $23 $21 $23 1.61% $22 $21 $20 $21 1.77%8 BrookeGlenBehavioral1, 2, 10 $20 $30 $29 $28 NA $25 $28 $27 $26 NA
2 ClarionPsych1, 10 $17 $15 $13 $11 18.33% $10 $9 $8 $8 11.48%
9 FairmountBehavioral1, 5, 10 $44 $36 $34 $35 8.78% $37 $31 $30 $30 8.60%
6 FirstWyomingValley1, 3, 7, 10 $21 $20 $13 $17 8.22% $17 $17 $12 $17 1.93%
8 FoundationsBehavioral1, 5, 10 $27 $25 $23 $19 13.52% $25 $23 $21 $19 11.30%
9 Friends1, 5, 10 $37 $37 $41 $44 -5.35% $40 $40 $42 $42 -1.44%
7 HavenBehavioral1, 3, 10, 13 $8 $2 $3 NA NA $8 $3 $6 NA NA
8 HorshamClinic1, 10 $43 $35 $34 $32 11.08% $40 $34 $33 $32 8.02%
9 KirkbrideCenter5, 10 $19 $15 $16 $19 -0.29% $17 $17 $15 $17 -1.32%
4 MeadowsPsychCenter1, 10 $14 $21 $18 $17 -6.53% $14 $15 $14 $14 0.61%
5 RoxburyTreatment1, 5, 10 $18 $14 $11 $11 21.10% $12 $11 $9 $8 17.37%
1 SouthwoodPsych1, 5, 10, 13 $16 $17 $16 $15 2.72% $15 $15 $15 $16 -1.94%
Region/State Psychiatric Hospital
Net Patient RevenueNPR (millions)
3-yr Avg Change in NPR
FY08-FY11
Total Operating ExpensesTOE (millions)
3-yr Avg Change in TOE
FY08-FY11FY11 FY10 FY09 FY08 FY11 FY10 FY09 FY08
Statewide Average $10 $11 $10 $9 3.83% $49 $51 $47 $49 0.57%7 AllentownState2, 11 $3 $9 $10 $8 NA $9 $36 $39 $38 NA
6 ClarkSummitState $12 $13 $13 $11 3.12% $50 $49 $49 $48 1.04%
4 DanvilleState $10 $10 $9 $7 11.58% $40 $39 $37 $34 6.38%
8 NorristownState $10 $11 $11 $10 2.76% $81 $82 $82 $81 0.20%
1 TorranceState $10 $10 $8 $8 6.17% $66 $60 $53 $42 18.78%
2 WarrenState $10 $9 $10 $8 7.91% $43 $44 $46 $44 -0.58%
7 WernersvilleState $14 $12 $12 $11 8.86% $58 $46 $46 $44 10.34%
Seefootnotesandmapofregionsonpage40.

27Financial Analysis 2011 • Volume Three
PSYCHIATRIC
Psychiatric Hospital
Operating Margin
FY11
Total Margin
FY11
3-yr Average Total Margin FY09-FY11
Percent of Uncompensated
Care FY11
Medicare Share of NPR
FY11
Medical Assistance
Share of NPR FY11
Statewide Average 5.23% 4.74% 4.06% 1.42% 16.17% 54.90%Non-profit Psychiatric HospitalsStatewide Average (non-profit) -1.62% 1.29% -1.23% 1.67% 14.36% 53.57%BelmontCenter 3.09% 3.09% 2.03% 1.02% 24.69% 54.26%
DevereuxBehavioralHlth7 8.13% 8.13% 5.57% 1.60% 0.00% 75.27%
KidsPeace1 4.96% 4.96% 1.45% 0.61% 0.00% 72.40%
MontgomeryCtyES5, 13 2.03% 4.06% 1.27% 6.40% 21.11% 50.86%
PAPsychInstitute -29.36% -29.46% -36.55% 3.22% 26.77% 35.12%
Philhaven5 -0.41% 6.51% 4.79% 0.75% 10.02% 57.23%
StJohnVianney5 13.38% 21.09% 6.52% 0.00% 0.00% 0.00%
For-profit Psychiatric HospitalsStatewide Average (for-profit) 9.34% 6.79% 7.09% 1.27% 17.24% 55.69%BrookeGlenBehavioral1, 2, 10 -23.65% -12.44% -0.29% 1.49% 21.18% 54.05%
ClarionPsych1, 10 41.62% 22.93% 21.85% 1.28% 14.12% 61.21%
FairmountBehavioral1, 5, 10 15.34% 15.36% 16.41% 0.81% 18.12% 64.40%
FirstWyomingValley1, 3, 7, 10 20.94% 12.25% 11.15% 0.76% 17.76% 50.73%
FoundationsBehavioral1, 5, 10 7.34% 4.05% 4.35% 0.33% 0.00% 60.52%
Friends1, 5, 10 -5.58% -2.55% -1.00% 1.58% 30.97% 50.17%
HavenBehavioral1, 3, 10, 13 -1.97% -1.75% -18.76% 3.75% 35.83% 30.64%
HorshamClinic1, 10 8.83% 4.87% 3.69% 1.39% 20.14% 43.54%
KirkbrideCenter5, 10 15.72% 9.74% 4.56% 3.74% 3.19% 95.56%
MeadowsPsychCenter1, 10 3.67% 2.02% 11.45% 0.53% 26.45% 45.17%
RoxburyTreatment1, 5, 10 30.00% 16.53% 14.15% 1.33% 18.21% 30.00%
SouthwoodPsych1, 5, 10, 13 3.65% 3.30% 5.82% -0.06% 0.00% 75.45%
State Psychiatric Hospital
Percent of Expenses not
covered by NPR FY11
Medicare Share of NPR
FY11
Medical Assistance
Share of NPR FY11
Statewide Average 79.27% 30.30% 56.32%AllentownState2, 11 60.48% 34.04% 57.20%
ClarkSummitState 75.76% 29.06% 57.80%
DanvilleState 75.69% 32.05% 54.47%
NorristownState 86.47% 26.91% 63.95%
TorranceState 84.65% 28.40% 54.17%
WarrenState 74.67% 32.18% 53.01%
WernersvilleState 74.90% 31.69% 54.47%
Seefootnotesandmapofregionsonpage40.

28 Financial Analysis 2011 • Volume Three28
LONG-TERM ACUTE CARE
LTAC Hospital GAC Hospital
GoodShepherd/Bethlehem LehighValley/Muhlenberg
Kindred/DelawareCounty MercyFitzgerald
Kindred/Easton Easton
Kindred/HeritageValley HeritageValleyBeaver
Kindred/WyomingValley Wilkes-BarreGeneral
LifeCare/ChesterCounty ChesterCounty
LifeCare/Pgh-Alle-Kiski Alle-Kiski
SelectSpecialty/CampHill HolySpirit
SelectSpecialty/Danville Geisinger/Danville
SelectSpecialty/Harrisburg PinnacleHealth
SelectSpecialty/Johnstown ConemaughValleyMemorial
SelectSpecialty/Laurel LatrobeArea
SelectSpecialty/Mckeesport UPMCMcKeesport
SelectSpecialty/UPMC UPMCPresbyShadyside
SelectSpecialty/York York
*Ahospital-within-a-hospitalisalicensedlong-termacutecarehospitalthatoperateswithinaseparately-licensedgen-eral acute care hospital.
TABLE 13 Long-Term Acute Care Hospitals Operating as a Hospital-within-a-Hospital*, FY11
Long-Term Acute Care
dependency on mechanical ventilation, that require con-tinuous acute care. LTAC pa-tients are not medically ready for rehabilitation care, or they still need a higher level of care than what is provided by a skilled nursing facility or home health care. The aver-agelengthofstay(ALOS)atLTAC hospitals was 27.2 days during FY11 (Table 14).
Most of the care provided at LTAC hospitals is medical-surgical (med-surg). During FY11, 94.2% of the patient days at LTAC hospitals were med-surg. Three LTAC hospitals provided inpatient psychiatric care, represent-ing 5.1% of statewide LTAC patient days during FY11.
Long-Term Acute Care
There were 27 long-term acute care (LTAC) hospitals in Pennsylvania during fiscal year 2011 (FY11). LTAC hospitals provide specialized acute care to medically complex patients. Patients are commonly admitted directly from a general acute care (GAC) hospital intensive care unit with complex medical conditions, such as
Highlights
• The statewide average operating margin for the long-term acute care (LTAC) hospitals decreased 0.26 of a percentage point, from 6.23% in FY10 to 5.97% in FY11. The statewide average total margin decreased 0.14 of a percentage point, from 4.93% in FY10 to 4.79% in FY11.
• LTAChospitalsreceived73.4%oftheirpatientrevenuefromMedicarepatientsduring FY11.
• InFY11,themeanageofpatientsadmittedtoLTACfacilitieswas68.9years,while the average age of inpatients at general acute care hospitals was 52.9 years.

29Financial Analysis 2011 • Volume Three 29
LONG-TERM ACUTE CARE
FY02 FY03 FY04 FY05 FY06 FY07 FY08 FY09 FY10 FY11
Patient Days
Med-surg 204,031 248,835 250,617 263,586 272,568 269,318 273,078 261,160 263,694 251,753
Psychiatric 28,788 29,033 28,223 29,324 28,455 30,518 29,516 29,251 29,724 13,711
SkilledNursing 0 0 0 3,284 4,068 0 0 0 0 1,853
Statewide 232,819 277,868 278,840 296,194 305,091 299,836 302,594 290,411 293,418 267,317
Discharges
Med-surg 6,760 8,707 8,753 8,778 9,383 9,332 9,415 9,326 9,529 9,195
Psychiatric 1,219 949 956 982 1,006 998 1,112 1,068 1,124 590
SkilledNursing 0 0 0 290 382 0 0 0 0 58
Statewide 7,979 9,656 9,709 10,050 10,771 10,330 10,527 10,394 10,653 9,843
Beds
Med-surg 770 957 1,026 1,046 1,117 1,151 1,217 1,225 1,214 1,187
Psychiatric 112 112 112 112 113 113 99 98 107 56
SkilledNursing 0 0 0 22 23 0 0 0 0 40
Statewide 882 1,069 1,138 1,180 1,253 1,264 1,316 1,323 1,321 1,283
Occupancy Rate
Med-surg 73.64% 73.51% 68.31% 70.29% 68.34% 64.61% 62.48% 58.53% 60.03% 59.32%
Psychiatric 70.42% 71.02% 68.90% 71.73% 69.55% 73.99% 81.46% 81.78% 76.11% 67.08%
SkilledNursing 0.00% 0.00% 0.00% 54.28% 77.92% 0.00% 0.00% 0.00% 0.00% 49.49%
Statewide 73.23% 73.24% 68.37% 70.20% 68.57% 65.46% 63.93% 60.26% 61.34% 59.59%
Average Length of Stay
Med-surg 30.2 28.6 28.6 30.0 29.1 28.9 29.0 28.0 27.7 27.4
Psychiatric 23.6 30.6 29.5 29.9 28.3 30.6 26.5 27.4 26.4 23.2
SkilledNursing 0.0 0.0 0.0 11.3 10.6 0.0 0.0 0.0 0.0 31.9
Statewide 29.2 28.8 28.7 29.5 28.3 29.0 28.7 27.9 27.5 27.2
Outpatient Visits
Statewide 61,850 118,399 115,745 114,108 111,295 107,464 96,084 181,291 179,461 107,745
TABLE 14Utilization and Capacity at Long-Term Acute Care Hospitalsby Type of Care
Trends in Long-Term Acute Care
The first LTAC hospital in Pennsylvania began operating in FY94; by FY00, there were 14 LTAC hospitals statewide. Between FY00 and FY03, Pennsylvania averaged three new hospitals per year. Between FY03 and FY09, the number of new LTAC hospitals increased by an average of one hospital per year. During FY11, the total number of LTAC hospitals (27) operating in Pennsylvania remained the same as in FY10 and FY09. Between FY10 and FY11, one LTAC hospital opened and another LTAC hospital changed its services to a specialty hospital and later merged into a GAC hospital.

30 Financial Analysis 2011 • Volume Three30
HospitalPatient
DaysBed Days Available
Occupancy Rate Discharges Beds
Average Length of Stay
GoodShepherdPenn/Philadelphia 9,612 13,870 69.30% 315 38 30.5
GoodShepherd/Bethlehem 10,622 11,680 90.94% 399 32 26.6
Kindred/DelawareCounty 6,803 14,235 47.79% 235 39 28.9
Kindred/Easton 6,984 11,315 61.72% 275 31 25.4
Kindred/Havertown 12,315 20,805 59.19% 478 57 25.8
Kindred/HeritageValley 8,721 12,775 68.27% 340 35 25.7
Kindred/NorthShore 8,210 26,280 31.24% 306 72 26.8
Kindred/Philadelphia 13,452 18,980 70.87% 428 52 31.4
Kindred/Pittsburgh 10,177 22,995 44.26% 367 63 27.7
Kindred/SouthPhiladelphia 3,738 21,228 17.61% 116 58 32.2
Kindred/WyomingValley 8,415 13,140 64.04% 330 36 25.5
LifeCare/ChesterCounty 8,879 14,235 62.37% 281 39 31.6
LifeCare/Mechanicsburg 4,285 10,404 41.19% 169 68 25.4
LifeCare/Monroeville 4,981 13,311 37.42% 195 87 25.5
LifeCare/Pittsburgh-Alle-Kiski 7,257 10,220 71.01% 241 28 30.1
LifeCare/Pittsburgh 27,883 36,500 76.39% 1,011 100 27.6
LifeCare/Suburban 9,012 13,964 64.54% 304 68 29.6
SelectSpecialty/CampHill 8,269 11,315 73.08% 328 31 25.2
SelectSpecialty/Danville 5,169 10,950 47.21% 205 30 25.2
SelectSpecialty/Erie 10,848 18,250 59.44% 434 50 25.0
SelectSpecialty/Harrisburg 9,728 13,870 70.14% 355 38 27.4
SelectSpecialty/Johnstown 10,112 14,235 71.04% 407 39 24.8
SelectSpecialty/Laurel 7,785 14,600 53.32% 327 40 23.8
SelectSpecialty/Mckeesport 7,857 10,950 71.75% 296 30 26.5
SelectSpecialty/UPMC 8,138 11,680 69.67% 274 32 29.7
SelectSpecialty/York 5,388 8,395 64.18% 203 23 26.5
SpecialCare 15,023 24,455 61.43% 594 67 25.3
TABLE 15Utilization and Capacity, FY11by Long-Term Acute Care Hospital
LONG-TERM ACUTE CARE
The total number of patient days at LTAC hospitals peaked during FY06 (Figure 29). From FY02 to FY03, the number of med-surg patient days and discharges at LTAC hospitals increased 22.0% and 28.8%, respectively. From FY03 to FY11, uti-lization has leveled off with med-surg patient days and discharges increasing only 1.2% and 5.6%, respectively. During FY11, med-surg patient days and discharges decreased 4.5% and 3.5%, respectively.
One factor that previously facilitated the growth of LTAC hospitals is that many of the facilities utilize space within an existing GAC hospital (Table 13). During

31Financial Analysis 2011 • Volume Three 31
LONG-TERM ACUTE CARE
0
50
100
150
200
250
300
350
FY02 FY03 FY04 FY05 FY06 FY07 FY08 FY09 FY10 FY11
thou
sand
s
FIGURE 29Patient Days at Long-Term Acute Care Hospitalsby Fiscal Year
0.6%1.6%
3.4%
10.1%
19.0%
25.7%27.0%
12.6%
0%
5%
10%
15%
20%
25%
30%
<25 25-34 35-44 45-54 55-64 65-74 75-84 >84
perc
ent o
f dis
char
ges
Age Group
FIGURE 30Inpatient Age Distribution at Long-Term Acute Care Hospitals, FY11by Age Group
FY11, there were 15 LTAC hospitals that occupied space within a GAC hospital. Many new facilities lease space from a GAC hospital; capital requirements are con-siderably less than constructing a new freestanding facility. The Medicare, Medic-aid,andSCHIPExtensionAct(MMSEA)of2007andamendments(describedinthe next section of this report, Long-Term Acute Care Hospitals – Financial Profile) may have prompted the stagnant growth in the number of new LTAC hospitals and/or beds from FY09 to FY11.
Another reason for the growth in the number of LTAC facilities in prior years is that they provided a more cost-effective setting for the GAC hospitals to transfer Medicare patients that require extended acute care to LTAC hospitals. Under the MedicareProspectivePaymentSys-tem,orPPS,GAChospitalsreceiveda predetermined fee based on the average cost to treat patients in a diagnosis-related group (DRG). If a patient required acute care for an extended period of time, the GAC hospital could have avoided the additional costs associated with the extended stay by discharging the patient to an LTAC hospital. As discussed later in this section, there have been some changes to the Medicare payment system, which may reduce the incentive for LTAC hospitals to accept patients from their host GAC hospital.
The mean age of patients admit-ted to LTAC facilities during FY11 was 68.9 years. The age distribution of patients receiving care at LTAC hospi-tals is indicative of extended care fa-cilities, which serve a predominately elderly population. Patients age 55 through 84 accounted for 71.7% of the discharges at the LTAC hospitals in FY11 (Figure 30). Consistent with

32 Financial Analysis 2011 • Volume Three32
LONG-TERM ACUTE CARE
the age distribution of LTAC patients, 73.4% of net patient revenue (NPR) was re-ceived from Medicare patients during FY11 (Figure 31). In contrast, the average age of inpatients at GAC hospitals in Pennsylvania was 52.9 years, and GAC hospitals received an average of 43.8% of their total inpatient NPR from Medicare.
Four LTAC hospitals represent the statewide total of 107,745 outpatient visits during FY11. One of the four facilities reported 82.7% of the total outpatient visits. Most of the outpatient care is not directly related to the hospitals’ inpatient LTAC services, but reflects the broader spectrum of care provided by each facility’s affili-ated health system, such as rehab outpatient services.
Long-Term Acute Care Hospitals – Financial Profile
LTAC hospitals have transitioned from a cost-based Medicare reimbursement systemtoaLong-TermCareHospitalProspectivePaymentSystem(LTCHPPS).Changes to the Medicare reimbursement system have had a major effect on the financial health of Pennsylvania’s LTAC hospitals. As previously mentioned, these hospitals received 73.4% of their patient revenue from treating Medicare patients during FY11.
ConcurrentwiththemovetoLTCHPPSinFY03,LTAChospitalsasagroupbegan to post positive operating and total margins in FY03 after five consecutive years of negative margins. Not only did these margins move into positive terri-tory in FY03, the statewide operating margin improved 5.43 points from a negative 0.25% in FY02 to 5.18% in FY03 (Figure 32). The statewide operating margin rose another 2.58 points in FY04 to 7.76% before falling for four consecutive years to
Medicare73.4%
Medical Assistance
1.4%
Commercial23.5%
Other1.7%
FIGURE 31Net Patient Revenue at Long-Term Acute Care Hospitals, FY11by Payer
2.31% in FY08. In FY09, the statewide operating margin began to increase to 3.46% and again in FY10 to 6.23%. In FY11, the statewide operating margin decreased 0.26 of a percentage point to 5.97%.
In previous Reports to the Con-gress, the Medicare Payment Advisory Commission (MedPAC) estimated that LTAC hospitals experienced negative or small positive margins from treating Medicare patients under the pre-2003 cost-based Medicare reimbursement system. In MedPAC’s March 2012 report,followingtheswitchtothePPSsystem, national Medicare margins increased to 5.2% in 2003, 9.0% in

33Financial Analysis 2011 • Volume Three 33
LONG-TERM ACUTE CARE
-0.25%
5.18%
7.76%6.62%
3.72%
3.09%2.31%
3.46%
6.23% 5.97%
-0.21%
4.33%5.11%
3.91%
2.26%
3.20%
2.07% 2.40%
4.93% 4.79%
-4%
-2%
0%
2%
4%
6%
8%
10%
FY02 FY03 FY04 FY05 FY06 FY07 FY08 FY09 FY10 FY11
Operating Margin Total Margin
FIGURE 32Operating and Total Margins at Long-Term Acute Care Hospitalsby Fiscal Year
2004 and 11.9% in 2005. The national Medicare margin fell to 9.8% in 2006, 4.8% in 2007 and 3.5% in 2008, before it increased to 5.6% in 2009 and 6.4% in 2010.
Medicare revenues and utilization were also affected by regulatory changes that established limits on the percentage of a facility’s patients that are reimbursed at the LTCHPPSrates.PatientsadmittedtoLTACfacilitiesabovethoselimitswerereim-bursedatthegenerallylowerPPSratesforGAChospitals.
InAugust2004,theCentersforMedicareandMedicaidServices(CMS)pub-lished a final rule that would limit the percentage of patients that are eligible for LTCHPPSratesatfacilitiesthatoperateasahospital-within-a-hospital(anLTACfacility leasing space on the campus of a GAC hospital, or “HWH”). The limit ap-plied to patients transferred from the host hospital to its tenant HWH. The limit was to be phased in over a three-year period from 75% after October 2005 to 25% after October 2007. Certain exceptions to the “25% Rule” can increase the thresh-old to 50% for rural areas and markets dominated by a single GAC hospital.
InMay2007,CMSexpandedthe“25%Rule”tolimitthepercentageofdis-chargesreimbursedundertheLTCHPPSfromanyhospitaltransferringpatientstoan LTAC hospital, not just host GAC hospitals. This new layer of restrictions was to be phased in over three years starting with cost reporting years beginning after July 2007.
TheMMSEAof2007frozetheimplementationofthe“25%Rule”forthreeyears.Insteadoftransitioningto25%,CMSregulationssetthelimitforadmissionsfrom any single hospital at 50% for cost reporting years between December 29, 2007andDecember29,2010.TheMMSEAalsopreventedCMSfromimplement-ing the “25% Rule” beyond HWH to freestanding LTAC hospitals for three years.
34 Financial Analysis 2011 • Volume Three34
LONG-TERM ACUTE CARE
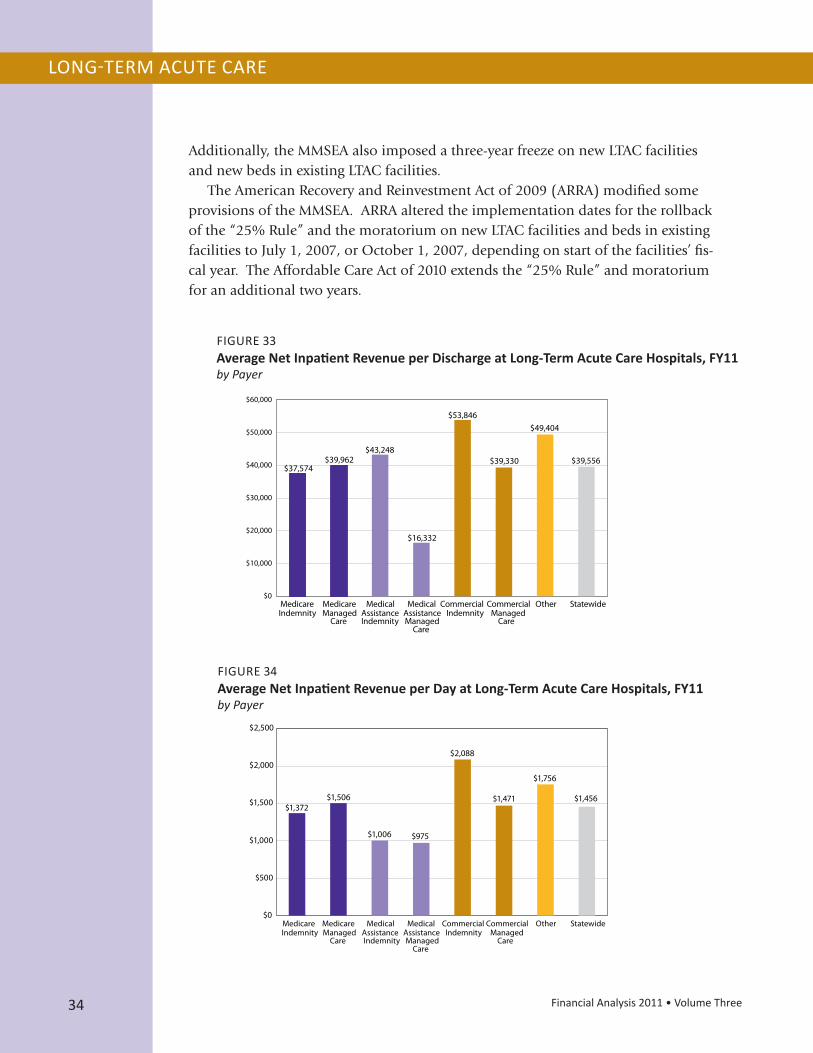
Additionally,theMMSEAalsoimposedathree-yearfreezeonnewLTACfacilitiesand new beds in existing LTAC facilities.
The American Recovery and Reinvestment Act of 2009 (ARRA) modified some provisionsoftheMMSEA.ARRAalteredtheimplementationdatesfortherollbackof the “25% Rule” and the moratorium on new LTAC facilities and beds in existing facilities to July 1, 2007, or October 1, 2007, depending on start of the facilities’ fis-cal year. The Affordable Care Act of 2010 extends the “25% Rule” and moratorium for an additional two years.
$37,574 $39,962
$43,248
$16,332
$53,846
$39,330
$49,404
$39,556
$0
$10,000
$20,000
$30,000
$40,000
$50,000
$60,000
MedicareIndemnity
MedicareManaged
Care
MedicalAssistanceIndemnity
MedicalAssistanceManaged
Care
CommercialIndemnity
CommercialManaged
Care
Other Statewide
FIGURE 33Average Net Inpatient Revenue per Discharge at Long-Term Acute Care Hospitals, FY11by Payer
$1,372 $1,506
$1,006 $975
$2,088
$1,471
$1,756
$1,456
$0
$500
$1,000
$1,500
$2,000
$2,500
MedicareIndemnity
MedicareManaged
Care
MedicalAssistanceIndemnity
MedicalAssistanceManaged
Care
CommercialIndemnity
CommercialManaged
Care
Other Statewide
FIGURE 34Average Net Inpatient Revenue per Day at Long-Term Acute Care Hospitals, FY11by Payer
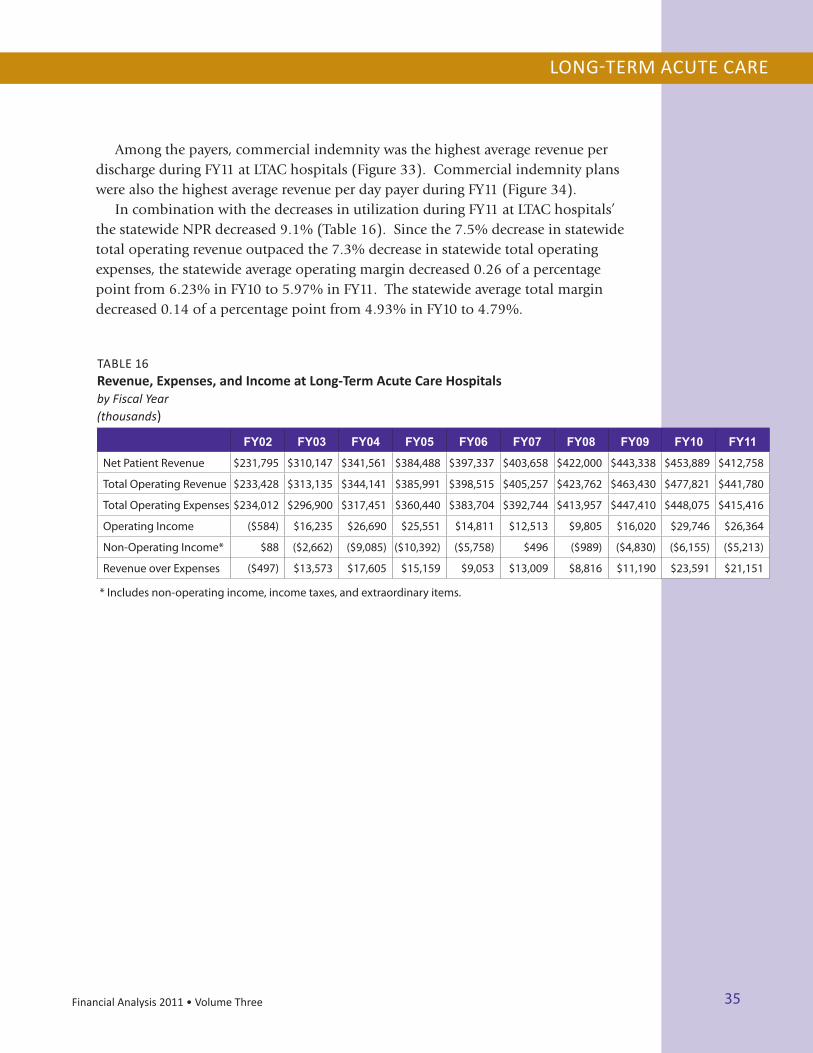
35Financial Analysis 2011 • Volume Three 35
LONG-TERM ACUTE CARE
FY02 FY03 FY04 FY05 FY06 FY07 FY08 FY09 FY10 FY11
NetPatientRevenue $231,795 $310,147 $341,561 $384,488 $397,337 $403,658 $422,000 $443,338 $453,889 $412,758
TotalOperatingRevenue $233,428 $313,135 $344,141 $385,991 $398,515 $405,257 $423,762 $463,430 $477,821 $441,780
TotalOperatingExpenses $234,012 $296,900 $317,451 $360,440 $383,704 $392,744 $413,957 $447,410 $448,075 $415,416
OperatingIncome ($584) $16,235 $26,690 $25,551 $14,811 $12,513 $9,805 $16,020 $29,746 $26,364
Non-OperatingIncome* $88 ($2,662) ($9,085) ($10,392) ($5,758) $496 ($989) ($4,830) ($6,155) ($5,213)
RevenueoverExpenses ($497) $13,573 $17,605 $15,159 $9,053 $13,009 $8,816 $11,190 $23,591 $21,151
*Includesnon-operatingincome,incometaxes,andextraordinaryitems.
TABLE 16Revenue, Expenses, and Income at Long-Term Acute Care Hospitalsby Fiscal Year(thousands)
Among the payers, commercial indemnity was the highest average revenue per discharge during FY11 at LTAC hospitals (Figure 33). Commercial indemnity plans were also the highest average revenue per day payer during FY11 (Figure 34).
In combination with the decreases in utilization during FY11 at LTAC hospitals’ thestatewideNPRdecreased9.1%(Table16).Sincethe7.5%decreaseinstatewidetotal operating revenue outpaced the 7.3% decrease in statewide total operating expenses, the statewide average operating margin decreased 0.26 of a percentage point from 6.23% in FY10 to 5.97% in FY11. The statewide average total margin decreased 0.14 of a percentage point from 4.93% in FY10 to 4.79%.
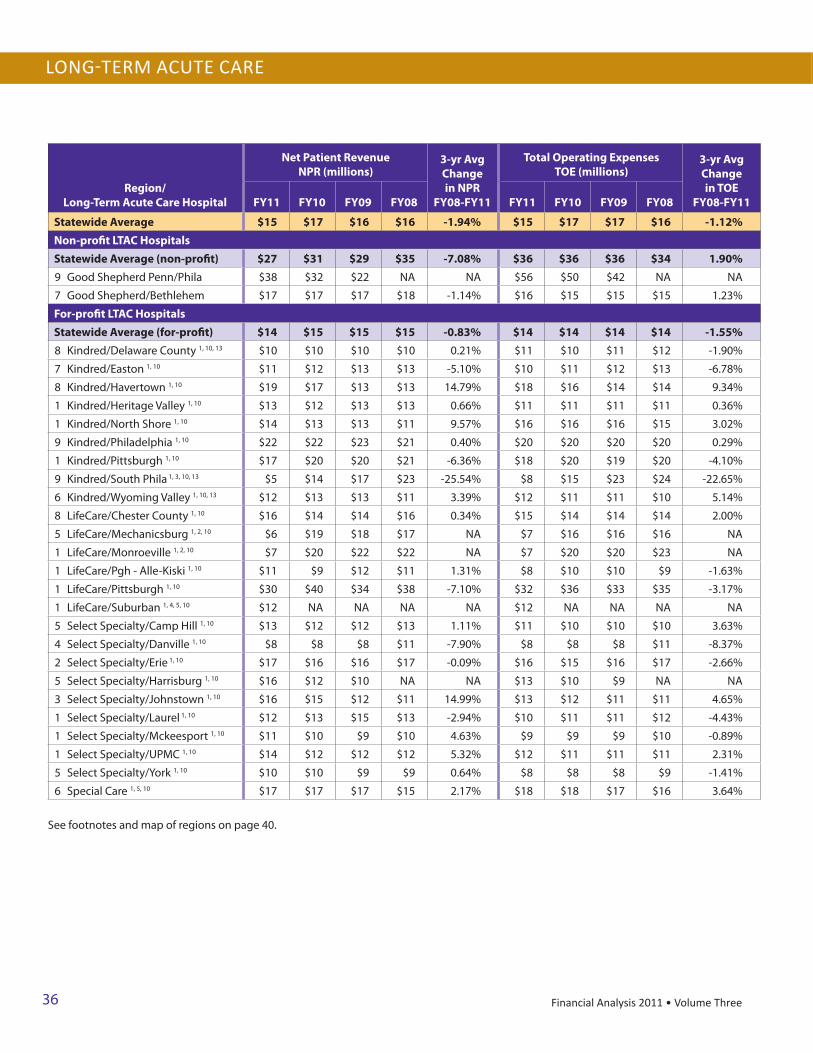
36 Financial Analysis 2011 • Volume Three
LONG-TERM ACUTE CARE
Seefootnotesandmapofregionsonpage34.
Region/Long-Term Acute Care Hospital
Net Patient RevenueNPR (millions)
3-yr Avg Change in NPR
FY08-FY11
Total Operating ExpensesTOE (millions)
3-yr Avg Change in TOE
FY08-FY11FY11 FY10 FY09 FY08 FY11 FY10 FY09 FY08
Statewide Average $15 $17 $16 $16 -1.94% $15 $17 $17 $16 -1.12%Non-profit LTAC HospitalsStatewide Average (non-profit) $27 $31 $29 $35 -7.08% $36 $36 $36 $34 1.90%9 GoodShepherdPenn/Phila $38 $32 $22 NA NA $56 $50 $42 NA NA
7 GoodShepherd/Bethlehem $17 $17 $17 $18 -1.14% $16 $15 $15 $15 1.23%
For-profit LTAC HospitalsStatewide Average (for-profit) $14 $15 $15 $15 -0.83% $14 $14 $14 $14 -1.55%8 Kindred/DelawareCounty1, 10, 13 $10 $10 $10 $10 0.21% $11 $10 $11 $12 -1.90%
7 Kindred/Easton1, 10 $11 $12 $13 $13 -5.10% $10 $11 $12 $13 -6.78%
8 Kindred/Havertown1, 10 $19 $17 $13 $13 14.79% $18 $16 $14 $14 9.34%
1 Kindred/HeritageValley1, 10 $13 $12 $13 $13 0.66% $11 $11 $11 $11 0.36%
1 Kindred/NorthShore1, 10 $14 $13 $13 $11 9.57% $16 $16 $16 $15 3.02%
9 Kindred/Philadelphia1, 10 $22 $22 $23 $21 0.40% $20 $20 $20 $20 0.29%
1 Kindred/Pittsburgh1, 10 $17 $20 $20 $21 -6.36% $18 $20 $19 $20 -4.10%
9 Kindred/SouthPhila 1, 3, 10, 13 $5 $14 $17 $23 -25.54% $8 $15 $23 $24 -22.65%
6 Kindred/WyomingValley1, 10, 13 $12 $13 $13 $11 3.39% $12 $11 $11 $10 5.14%
8 LifeCare/ChesterCounty1, 10 $16 $14 $14 $16 0.34% $15 $14 $14 $14 2.00%
5 LifeCare/Mechanicsburg1, 2, 10 $6 $19 $18 $17 NA $7 $16 $16 $16 NA
1 LifeCare/Monroeville1, 2, 10 $7 $20 $22 $22 NA $7 $20 $20 $23 NA
1 LifeCare/Pgh-Alle-Kiski1, 10 $11 $9 $12 $11 1.31% $8 $10 $10 $9 -1.63%
1 LifeCare/Pittsburgh1, 10 $30 $40 $34 $38 -7.10% $32 $36 $33 $35 -3.17%
1 LifeCare/Suburban1, 4, 5, 10 $12 NA NA NA NA $12 NA NA NA NA
5 SelectSpecialty/CampHill1, 10 $13 $12 $12 $13 1.11% $11 $10 $10 $10 3.63%
4 SelectSpecialty/Danville1, 10 $8 $8 $8 $11 -7.90% $8 $8 $8 $11 -8.37%
2 SelectSpecialty/Erie 1, 10 $17 $16 $16 $17 -0.09% $16 $15 $16 $17 -2.66%
5 SelectSpecialty/Harrisburg1, 10 $16 $12 $10 NA NA $13 $10 $9 NA NA
3 SelectSpecialty/Johnstown1, 10 $16 $15 $12 $11 14.99% $13 $12 $11 $11 4.65%
1 SelectSpecialty/Laurel 1, 10 $12 $13 $15 $13 -2.94% $10 $11 $11 $12 -4.43%
1 SelectSpecialty/Mckeesport1, 10 $11 $10 $9 $10 4.63% $9 $9 $9 $10 -0.89%
1 SelectSpecialty/UPMC1, 10 $14 $12 $12 $12 5.32% $12 $11 $11 $11 2.31%
5 SelectSpecialty/York1, 10 $10 $10 $9 $9 0.64% $8 $8 $8 $9 -1.41%
6 SpecialCare1, 5, 10 $17 $17 $17 $15 2.17% $18 $18 $17 $16 3.64%
Seefootnotesandmapofregionsonpage40.
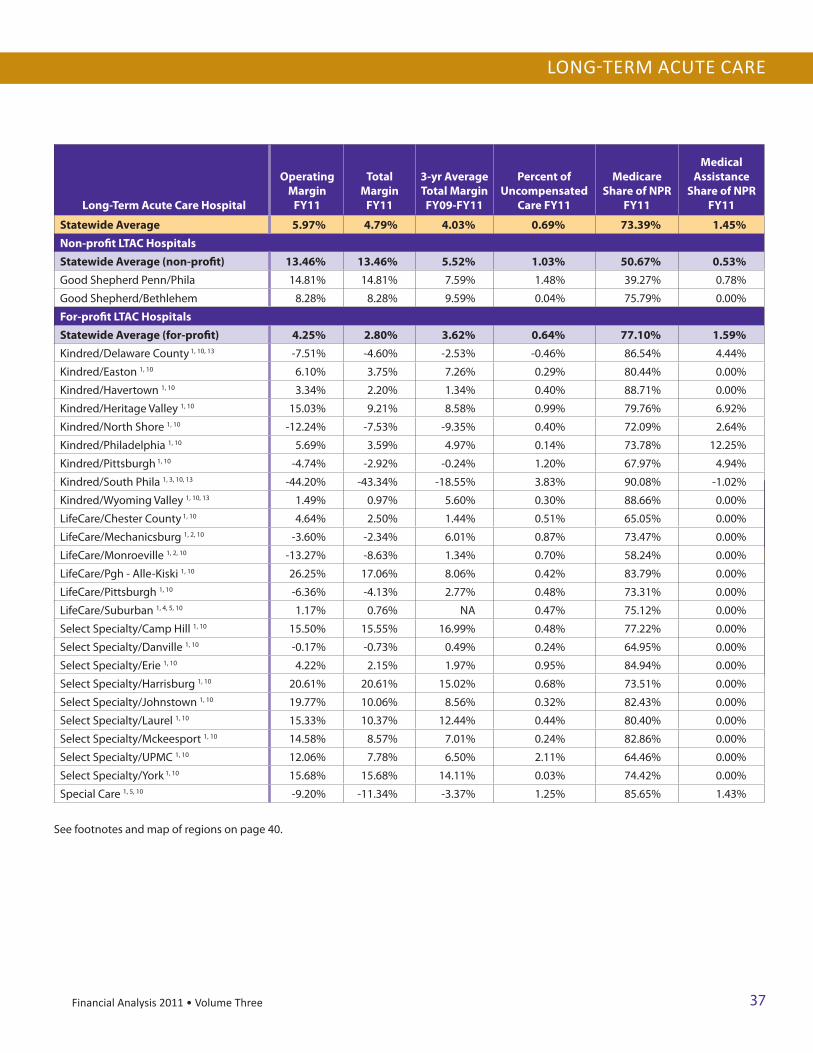
37Financial Analysis 2011 • Volume Three
LONG-TERM ACUTE CARE
Specialty Hospital
Operating Margin
FY11
Total Margin
FY11
3-yr Average Total Margin FY09-FY11
Percent of Uncompensated
Care FY11
Medicare Share of NPR
FY11
Medical Assistance
Share of NPR FY11
Statewide Average 5.61% 10.18% 9.44% 3.38% 23.24% 36.74%Children'sHomePgh 0.47% 6.93% -0.69% 1.94% 0.00% 76.27%
DivineProvidence 9.29% 13.51% 12.91% 1.75% 31.51% 3.57%
Eagleville5 3.12% 13.79% 11.28% 1.04% 29.99% 52.23%
Girard2, 8, 11, 13 -2.79% -2.29% -0.64% 12.37% 3.56% 95.47%
Kensington5, 13 2.59% 2.59% 0.69% 8.26% 12.36% 76.72%
ValleyForge1, 5, 10, 13 7.32% 6.81% 0.31% 1.18% 8.89% 64.78%
Seefootnotesandmapofregionsonpage34.
Long-Term Acute Care Hospital
Operating Margin
FY11
Total Margin
FY11
3-yr Average Total Margin
FY09-FY11
Percent of Uncompensated
Care FY11
Medicare Share of NPR
FY11
Medical Assistance
Share of NPR FY11
Statewide Average 5.97% 4.79% 4.03% 0.69% 73.39% 1.45%Non-profit LTAC HospitalsStatewide Average (non-profit) 13.46% 13.46% 5.52% 1.03% 50.67% 0.53%GoodShepherdPenn/Phila 14.81% 14.81% 7.59% 1.48% 39.27% 0.78%
GoodShepherd/Bethlehem 8.28% 8.28% 9.59% 0.04% 75.79% 0.00%
For-profit LTAC HospitalsStatewide Average (for-profit) 4.25% 2.80% 3.62% 0.64% 77.10% 1.59%Kindred/DelawareCounty 1, 10, 13 -7.51% -4.60% -2.53% -0.46% 86.54% 4.44%
Kindred/Easton1, 10 6.10% 3.75% 7.26% 0.29% 80.44% 0.00%
Kindred/Havertown1, 10 3.34% 2.20% 1.34% 0.40% 88.71% 0.00%
Kindred/HeritageValley1, 10 15.03% 9.21% 8.58% 0.99% 79.76% 6.92%
Kindred/NorthShore1, 10 -12.24% -7.53% -9.35% 0.40% 72.09% 2.64%
Kindred/Philadelphia1, 10 5.69% 3.59% 4.97% 0.14% 73.78% 12.25%
Kindred/Pittsburgh 1, 10 -4.74% -2.92% -0.24% 1.20% 67.97% 4.94%
Kindred/SouthPhila1, 3, 10, 13 -44.20% -43.34% -18.55% 3.83% 90.08% -1.02%
Kindred/WyomingValley1, 10, 13 1.49% 0.97% 5.60% 0.30% 88.66% 0.00%
LifeCare/ChesterCounty 1, 10 4.64% 2.50% 1.44% 0.51% 65.05% 0.00%
LifeCare/Mechanicsburg1, 2, 10 -3.60% -2.34% 6.01% 0.87% 73.47% 0.00%
LifeCare/Monroeville1, 2, 10 -13.27% -8.63% 1.34% 0.70% 58.24% 0.00%
LifeCare/Pgh-Alle-Kiski1, 10 26.25% 17.06% 8.06% 0.42% 83.79% 0.00%
LifeCare/Pittsburgh1, 10 -6.36% -4.13% 2.77% 0.48% 73.31% 0.00%
LifeCare/Suburban1, 4, 5, 10 1.17% 0.76% NA 0.47% 75.12% 0.00%
SelectSpecialty/CampHill1, 10 15.50% 15.55% 16.99% 0.48% 77.22% 0.00%
SelectSpecialty/Danville1, 10 -0.17% -0.73% 0.49% 0.24% 64.95% 0.00%
SelectSpecialty/Erie1, 10 4.22% 2.15% 1.97% 0.95% 84.94% 0.00%
SelectSpecialty/Harrisburg1, 10 20.61% 20.61% 15.02% 0.68% 73.51% 0.00%
SelectSpecialty/Johnstown1, 10 19.77% 10.06% 8.56% 0.32% 82.43% 0.00%
SelectSpecialty/Laurel1, 10 15.33% 10.37% 12.44% 0.44% 80.40% 0.00%
SelectSpecialty/Mckeesport1, 10 14.58% 8.57% 7.01% 0.24% 82.86% 0.00%
SelectSpecialty/UPMC1, 10 12.06% 7.78% 6.50% 2.11% 64.46% 0.00%
SelectSpecialty/York 1, 10 15.68% 15.68% 14.11% 0.03% 74.42% 0.00%
SpecialCare1, 5, 10 -9.20% -11.34% -3.37% 1.25% 85.65% 1.43%
Seefootnotesandmapofregionsonpage40.

38 Financial Analysis 2011 • Volume Three38
SpecialtySpecialtyhospitalsprovideuniquetypesorcombinationsofpatientcarethatdo
not fall under the other categories of non-general acute care hospitals. There were six specialty hospitals during fiscal year 2011 (FY11). In lieu of an analysis of the trends in utilization and financial health of this very diverse category of facilities, this section presents a brief summary of each of the facilities, based on data avail-able at the end of FY11.
The Children’s Home of Pittsburgh is a pediatric specialty hospital which serves children from birth to age 21. It provides short-term transitional care from hospital to home for premature and high-risk infants who have passed the life-threatening stage of their illness, but continue to require medical monitoring, care and super-vision. For FY11, the hospital reported 15 staffed medical-surgical beds and 286 dischargeswithanaveragelengthofstay(ALOS)of16.5days.
A non-profit hospital, the Children’s Home of Pittsburgh has had several years of operating and total losses due, in part, to lower patient volume and an increased cost structure after relocating to a new facility. During FY11, the hospital improved its operating margin from a negative 11.01% in FY10 to a positive 0.47% in FY11 and total margin from a positive 0.98% in FY10 to 6.93% in FY11.
DivineProvidenceHospitalisanon-profithospitalaffiliatedwiththeSusque-hannaHealthSysteminLycomingCounty.Thehospitaloperateda31-bedinpa-tient psychiatric unit and provides outpatient diagnostic and treatment services and home health services. During FY11, Divine Providence reported 207,285 outpatient and home health care visits. Outpatient and home health care represented about 94.1% of the hospital’s total net patient revenue in FY11.
SPECIALTY
Region/Specialty Hospital
Net Patient RevenueNPR (millions)
3-yr Avg Change in NPR
FY08-FY11
Total Operating ExpensesTOE (millions)
3-yr Avg Change in TOE
FY08-FY11FY11 FY10 FY09 FY08 FY11 FY10 FY09 FY08
Statewide Average $27 $27 $25 $21 9.27% $26 $26 $24 $20 9.88%1 Children'sHomePgh $7 $7 $6 $4 26.47% $9 $9 $9 $9 2.10%
4 DivineProvidence $81 $82 $77 $71 4.75% $78 $75 $68 $62 8.48%
8 Eagleville5 $29 $26 $25 $26 3.49% $29 $26 $25 $27 2.32%
9 Girard2, 8, 11, 13 $23 $44 $49 $52 NA $24 $44 $50 $52 NA
9 Kensington5, 13 $7 $6 $7 $7 2.44% $7 $7 $7 $8 -1.04%
8 ValleyForge1, 5, 10, 13 $13 $11 $10 $11 4.10% $12 $11 $12 $11 2.27%
Seefootnotesandmapofregionsonpage40.

39Financial Analysis 2011 • Volume Three 39
Eagleville Hospital, a non-profit hospital, had provided inpatient drug and alco-hol (D&A) treatment as well as geriatric psychiatric services in Montgomery County during FY11. The hospital reported 326 staffed beds, 36 of which are acute psychi-atricbeds.TheoverallALOSatEaglevilleduringFY11was21.9days.
Eagleville Hospital reported an operating margin of 3.12% and a total margin of 13.79% for FY11, largely as a result of a $2.4 million transition grant from the state and federal governments. The purpose of this grant is to offset reductions in fund-ing from the Medicaid program.
Girard Medical Center, a non-profit hospital, operated as a freestanding hospital providing psychiatric services in Philadelphia County for a portion of FY11 before it latermergedintoStJosephHospital.BothhospitalsarepartoftheNorthPhiladel-phiaHealthSystem.Previously,Girardoperatedasalong-termacutecarehospital.
Girard’s outpatient care represented 46.2% of its patient revenue with 60,279 outpatient visits in FY11. The hospital received 95.5% of its total net patient rev-enue from the Medical Assistance (MA) program. The hospital reported 51 acute psychiatricstaffedbedsandpatientsALOSof29.4daysinFY11.
Kensington Hospital is a 38-bed hospital in Philadelphia that primarily provides D&A treatment. Kensington, a non-profit hospital, received about 76.7% of its pa-tient revenue from the MA program, excluding state grants. The hospital reported 8,019 outpatient visits in FY11, and outpatient care represented about 17.5% of its patient revenue.
The Valley Forge Medical Center and Hospital is an 86-bed for-profit facility in Montgomery County that provided inpatient rehabilitative programs to patients with D&A dependencies and other addictive illnesses. During FY11, 64.8% of its patient revenue was MA.
SPECIALTY
Specialty Hospital
Operating Margin
FY11
Total Margin
FY11
3-yr Average Total Margin
FY09-FY11
Percent of Uncompensated
Care FY11
Medicare Share of NPR
FY11
Medical Assistance
Share of NPR FY11
Statewide Average 5.61% 10.18% 9.44% 3.38% 23.24% 36.74%Children'sHomePgh 0.47% 6.93% -0.69% 1.94% 0.00% 76.27%
DivineProvidence 9.29% 13.51% 12.91% 1.75% 31.51% 3.57%
Eagleville5 3.12% 13.79% 11.28% 1.04% 29.99% 52.23%
Girard2, 8, 11, 13 -2.79% -2.29% -0.64% 12.37% 3.56% 95.47%
Kensington5, 13 2.59% 2.59% 0.69% 8.26% 12.36% 76.72%
ValleyForge1, 5, 10, 13 7.32% 6.81% 0.31% 1.18% 8.89% 64.78%
Seefootnotesandmapofregionsonpage40.
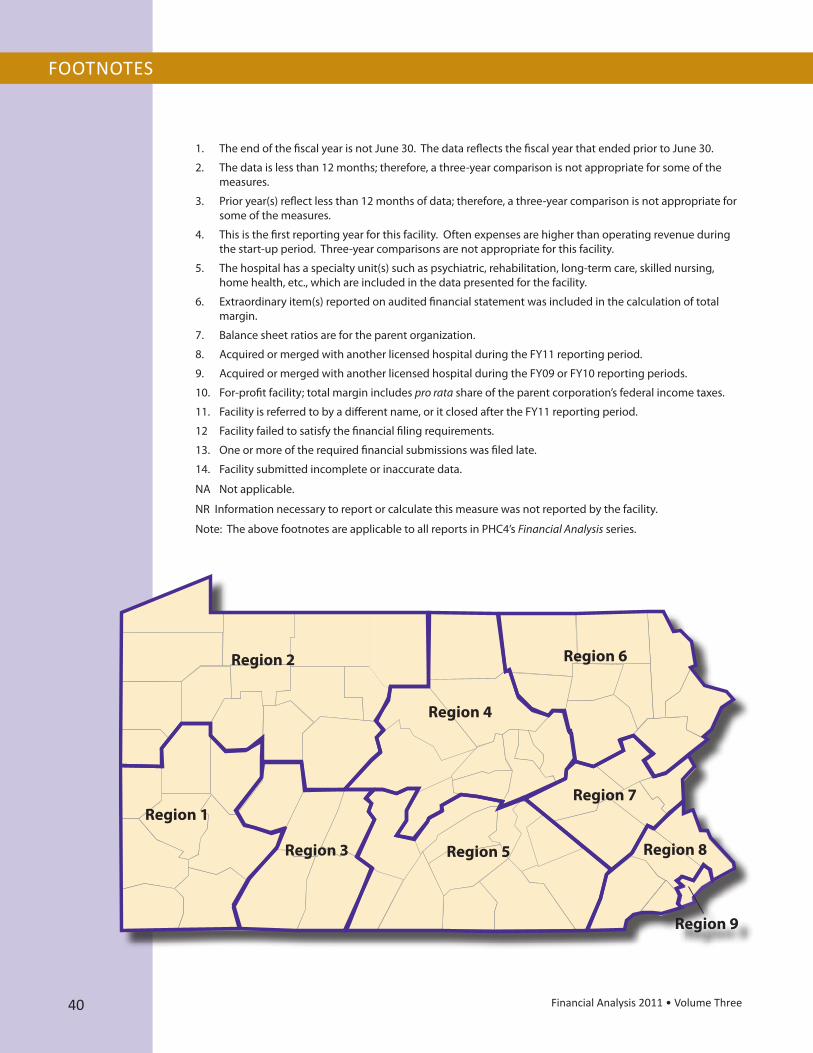
40 Financial Analysis 2011 • Volume Three40
FOOTNOTES
1. TheendofthefiscalyearisnotJune30.ThedatareflectsthefiscalyearthatendedpriortoJune30.
2. Thedataislessthan12months;therefore,athree-yearcomparisonisnotappropriateforsomeofthemeasures.
3. Prioryear(s)reflectlessthan12monthsofdata;therefore,athree-yearcomparisonisnotappropriateforsome of the measures.
4. Thisisthefirstreportingyearforthisfacility.Oftenexpensesarehigherthanoperatingrevenueduringthestart-upperiod.Three-yearcomparisonsarenotappropriateforthisfacility.
5. Thehospitalhasaspecialtyunit(s)suchaspsychiatric,rehabilitation,long-termcare,skillednursing,homehealth,etc.,whichareincludedinthedatapresentedforthefacility.
6. Extraordinaryitem(s)reportedonauditedfinancialstatementwasincludedinthecalculationoftotalmargin.
7. Balancesheetratiosarefortheparentorganization.
8. AcquiredormergedwithanotherlicensedhospitalduringtheFY11reportingperiod.
9. AcquiredormergedwithanotherlicensedhospitalduringtheFY09orFY10reportingperiods.
10. For-profitfacility;totalmarginincludespro ratashareoftheparentcorporation’sfederalincometaxes.
11. Facilityisreferredtobyadifferentname,oritclosedaftertheFY11reportingperiod.
12 Facilityfailedtosatisfythefinancialfilingrequirements.
13. Oneormoreoftherequiredfinancialsubmissionswasfiledlate.
14. Facilitysubmittedincompleteorinaccuratedata.
NA Notapplicable.
NRInformationnecessarytoreportorcalculatethismeasurewasnotreportedbythefacility.
Note:TheabovefootnotesareapplicabletoallreportsinPHC4’sFinancial Analysis series.
Region 7
Region 5
Region 4
Region 6
Region 9
Region 3
Region 1
Region 2
Region 8

41Financial Analysis 2011 • Volume Three
EXPLANATION OF TERMS & MEASURES
3-year Average Change in Net Patient Revenue (NPR) or Total Operating Expenses (TOE): The average annual change in thefacility’sNPRorTOEthatoccurredfromtheendofFY08throughFY11.
[((NPR11 –NPR08)/NPR08) / 3]
or
[((TOE11–TOE08)/TOE08) / 3]
3-year Average Total Margin: TheaveragetotalmarginrealizedbythefacilityduringFY09throughFY11.
(Σrevenueoverexpenses11, 10, 09/Σtotalrevenue 11, 10, 09)
Ambulatory Surgery Center (ASC): A licensed facility by thePennsylvaniaDepartmentofHealththatprovidesspecialtyormulti-specialty surgical care to patients who do not require overnighthospitalization,butrequiremedicalsupervisionfollowingaprocedure.AnASCdoesnotincludeindividualorgrouppracticeofficesofprivatephysiciansordentists.
Commercial Third-Party Payers:Commercialinsurersencompassallindemnityandmanagedcarehealthinsuranceplans, includingBlueCross and Blue Shield plans, and hospital and health systemplans.Government-fundedprograms,suchasMedicaremanagedcare,arenotincludedevenifacommercialinsureradministerstheprogram.
Discharges: The total number of patients released from the hospital duringthefiscalyear.
Long-Term Acute Care (LTAC) Hospital: A licensed acute carehospital by the Pennsylvania Department of Health that providesmedicalservices forpatientsthatrequireextended lengthsofacutecareinpatientstay.
Managed Care: Managedcare includesall licensedHMO,PPO,andPOSplansthatrequiresomeformofpre-authorizationorlimitcaretoin-networkproviders.
Net Patient Revenue (NPR):Netpatientrevenuereflectsrevenueforpatientcareonlyanddoesnotincluderevenuefromotheroperations,suchasthecafeteria,parking,rent,researchandeducationalactivities.Revenuefromthoseoperationsisincludedintotaloperatingrevenue.NPRmayincluderetroactiveadjustmentsfromthird-partypayersforcareprovidedduringapreviousfiscalyear.
Occupancy Rate: The average daily inpatient occupancy rate forstaffedbeds. Theoccupancyrate reflects thepercentof thestaffedbedsthatareoccupiedonaverage,onasingleday.
(patientdays/beddaysavailable)
Other Third-Party Payers: Third-party payers other than healthinsurancecompaniesandmanagedcareorganizations.Theseincludedirectpaymentsbyemployersorassociations,autoinsurance,workerscompensation,andgovernmentprograms(otherthanMedicareandMedicalAssistance).
Operating Income: Theamountbywhich totaloperating revenueexceedstotaloperatingexpenses.
(totaloperatingrevenue–totaloperatingexpenses)
Operating Margin: The ratio of operating income to total operating revenue. Thismeasureplacesoperatingincomeinperspectivewiththevolumeofbusinessrealizedbythefacility.
(operatingincome/totaloperatingrevenue)
Outpatient Visits:Thenumberofvisits tothe individualoutpatientdepartmentofthehospitalorsurgerycenterduringthefiscalyear.
Patient Days:Thetotalnumberofdayspatientsstayedinthehospitalduringthefiscalyear.
Percent of Uncompensated Care: This is the ratio of uncompensated care (charity care and bad debt) to the total care provided bythe hospital. Charity care is the care a hospital provides withoutcharge because the patient is unable to compensate the hospital through third-party coverage or the patient’s own resources. BadDebtrepresentstheforegonerevenueforcareinwhichthehospitalinitiallyanticipatedpayment,extendedcredittothepatient,butlaterdetermined it tobeuncollectable. Thisratecanbeusedtoexpressuncompensated care as a percent of total charges or as an estimate of thepercentoftotalnetpatientrevenue
(charitycarecharges+baddebtcharges)/totalcharges
Psychiatric Hospital: A licensed institution certified by thePennsylvania Department ofWelfare to operate as a hospital thatprovides short-term acute psychiatric services on an inpatientbasis. Psychiatrichospitalsmayalsooffer long-termresidentialandoutpatientprograms.Acutepsychiatriccareisrenderedinresponseto severe psychiatric conditions requiring intensive or extensiveinterventiontobringthepatient’ssymptomsundercontrol.
Rehabilitation Hospital: A licensed inpatient facility by thePennsylvaniaDepartmentofHealth,whichisoperatedfortheprimarypurposeofassistinginthephysicalrehabilitationofpersonsthroughanintegratedprogramofmedicalandotherservices.Rehabilitationhospitalsmayalsoofferoutpatientservices.
Staffed Beds: The number of beds at the hospital that are set up and staffedattheendofthefiscalyear.
Specialty Hospital: A licensed facility by the PennsylvaniaDepartment ofHealth that provides specific types of inpatient andoutpatient settings of care, such as drug and alcohol.
Total Margin:Theratiooftotalincometototalrevenue.Thismeasureputsincomefromallsourcesinperspectivewithallrevenuesreceivedbyafacility.
(revenueoverexpenses/totalrevenue)
Total Net Income (Revenue over Expenses): Total net income reflects the sum of operating income and non-operating income.Totalincomemayalsoincludeanextraordinaryitem,suchasthegainor loss from the sale of securities.
Total Operating Expenses (TOE):Allcostsassociatedwithoperatingthe entire facility, such as salaries, professional fees, supplies,depreciation, interest, insurance andbaddebts. The acquisition ofdurableequipmentandotherpropertyarenotconsideredexpensesandarereflectedonthefacility’sbalancesheetasassets. However,thecosttofinanceequipment(interest)aswellasthedepreciation,operationandmaintenancecostsofcapitalequipmentareoperatingexpenses.
Total Operating Revenue (TOR): All revenues allocated by thefacility tomeet operating expenses. Includes revenue sources suchas net patient revenue, investment income, contributions, andrevenuefromotheroperations(e.g.,cafeteria,parking,rent,researchand educational activities). Individual facilities may also allocateinvestmentincome,contributions,etc.,asnon-operatingincome.
Total Revenue: Operatingrevenueplusnon-operatingincome.Thenon-operating income component typically includes unrestrictedcontributions, investment income, and net investment gains andlossesonmarketablesecurities.
FOR MORE INFORMATIONThe information contained in this report and other PHC4 publications is available online at www.phc4.org. Additional financial, hospitalization and ambulatory procedure health care data is available for purchase. For more information, contact PHC4’s Data Requests Unit at [email protected] or 717-232-6787.
Pennsylvania Health Care Cost Containment CouncilJoeMartin,ExecutiveDirector
225MarketStreet,Suite400,Harrisburg,PA17101Phone:717-232-6787•Fax:717-232-3821
www.phc4.org