Impact of accounting information systems on organizational ...

Journal of Accounting and Economics 37 (2004) 167–201
Financial accounting information,organizational complexity and corporate
governance systems$
Robert Bushmana, Qi Chenb, Ellen Engelc,*, Abbie Smithc
aKenan-Flagler Business School, University of North Carolina-Chapel Hill, Chapel Hill,
NC 27599-3490, USAbFuqua School of Business, Duke University, Durham, NC 27708, USA
cGraduate School of Business, University of Chicago, Chicago, IL 60637, USA
Received 10 August 2000; received in revised form 18 July 2003; accepted 28 September 2003
Abstract
We posit that limited transparency of firms’ operations to outside investors increases
demands on governance systems to alleviate moral hazard problems. We investigate how
ownership concentration, directors’ and executive’s incentives, and board structure vary with:
(1) earnings timeliness, and (2) organizational complexity measured as geographic and/or
product line diversification. We find that ownership concentration, directors’ and executives’
equity-based incentives, and outside directors’ reputations vary inversely with earnings
timeliness, and that ownership concentration, and directors’ equity-based incentives increase
ARTICLE IN PRESS
$Formerly titled ‘‘The Sensitivity of Corporate Governance Systems to The Timeliness of Accounting
Earnings.’’ We thank an anonymous referee and Jerry Zimmerman (the editor) for challenging us to
sharpen the theoretical foundations of the paper. We also appreciate comments from Ray Ball, Sudipta
Basu, Bill Beaver, Judy Chevalier, Thomas Hemmer, Bob Kaplan, Randy Kroszner, Darius Palia, Canice
Prendergast, Cathy Schrand, Ross Watts and seminar participants at CUNY-Baruch, UC-Berkeley,
University of Chicago, Harvard Business School, University of Illinois-Chicago, London Business School,
University of Minnesota, University of Rochester, University of Texas- Austin, the 1999 Big Ten Faculty
Consortium, 1999 Stanford Summer Camp, 1999 Burton Summer Workshop at Columbia, 2000 European
Finance Association Annual Meetings and the 2000 AAA Annual Meetings. We thank Hewitt Associates
for providing ProxyBase data, and the Graduate School of Business at the University of Chicago, Fuqua
School of Business at Duke University, and Kenan-Flagler Business School, University of North
Carolina-Chapel Hill for financial support. Finally, we appreciate the research assistance of Xia Chen,
Darin Clay, Kathleen Fitzgerald and Rebecca Glenn.
*Corresponding author. Tel.: +1-773-834-0966; fax: +1-773-834-3976.
E-mail address: [email protected] (E. Engel).
0165-4101/$ - see front matter r 2003 Elsevier B.V. All rights reserved.
doi:10.1016/j.jacceco.2003.09.005

with firm complexity. However, board size and the percentage of inside directors do not vary
significantly with earnings timeliness or firm complexity.
r 2003 Elsevier B.V. All rights reserved.
JEL classification: G30; M41; J33
Keywords: Corporate governance; Corporate transparency; Earnings timeliness; Organizational com-
plexity; Diversification
1. Introduction
In the U.S. and in other economies with strong legal protection of outsideshareholders’ rights, transparency of a firm’s operations and activities to outsideinvestors disciplines managers to act in shareholders’ interests.1 We posit that limitedcorporate transparency increases demands on corporate governance systems toalleviate moral hazard problems resulting from a more severe information gapbetween managers and shareholders, ceteris paribus. We consider two factors thatlimit corporate transparency to varying degrees across large public U.S. companies:(1) relatively uninformative financial accounting systems characterized by theinability of firms’ GAAP earnings to explain changes in shareholder value in a timelyfashion (low earnings timeliness) and, (2) firm complexity due to extensivegeographic and/or line of business diversification.
We develop and test two sets of hypotheses concerning how corporate governancesystems vary with the diversification of firms and the timeliness of their earnings. Ourfirst set of hypotheses predicts that corporate governance systems of diversified firmsand firms with relatively low earnings timeliness are characterized by a relativelystrong link between stock price performance and the wealth of executives anddirectors, and by high ownership concentration, to provide incentives to increaseshareholder value through monitoring and other costly activities. Our second set ofhypotheses concerns how the composition of the board of directors varies with thediversification of firms and the timeliness of their earnings. We predict that, in orderto enable highly effective board monitoring, the boards of diversified firms and firmswith low earnings timeliness have a relatively high percentage of outside directorswith (1) a strong reputation as an outside director, and (2) expertise in the firm’smain industry. We also explore how board size and the percentage of directors whoare insiders vary with diversification and the timeliness of earnings, but make nodirectional predictions.
Our hypotheses build on prior research concerning the determinants of corporategovernance structures. In a seminal paper, Demsetz and Lehn (1985) conjecture thatthe scope for moral hazard is greater for managers of firms with more volatileoperating environments. They document that ownership concentration is increasing
ARTICLE IN PRESS
1We use the term corporate transparency to refer to the clarity of the activities and performance of the
firm to outsiders.
R. Bushman et al. / Journal of Accounting and Economics 37 (2004) 167–201168

in stock return volatility, consistent with the idea that benefits of ownershipconcentration increase in response to the difficulty of monitoring managers involatile environments. Himmelberg et al. (1999) extend Demsetz and Lehn (1985) byconsidering additional firm attributes that proxy for the scope of managerialdiscretion, such as research and development, advertising, and intangible assetintensities. In related research, Smith and Watts (1992) document that firms’ growthopportunities, as measured by book-to-market ratios, are associated with benefits toimposing risk on managers via bonus plans and stock option grants.
Consistent with this literature, we adopt the perspective that observed governancestructures represent optimal contracting arrangements endogenously determined byfirms’ contracting environments.2 We extend this literature by expanding thecharacterization of the scope for moral hazard to explicitly consider monitoringtechnology and organizational complexity. This extension flows naturally fromHimmelberg et al. (1999). Using panel data, they document that a significant fractionof the cross-sectional variation in managerial equity ownership is explained byunobserved firm heterogeneity not captured by their proxies for the scope of moralhazard. We posit monitoring technology and organizational complexity as twoimportant components of the scope for moral hazard that can be extracted from this‘‘unobserved’’ firm heterogeneity and studied independently, while controlling forcomponents considered in previous research.
With respect to monitoring technology, we conjecture that inherent limitations offirms’ information systems in generating information relevant for monitoringmanagerial behavior influence governance structure formation by affecting the cost-benefit trade-off underlying governance mechanism configurations. Financialaccounting systems are a logical starting point for investigating properties ofinformation systems important for addressing moral hazard problems. Auditedfinancial statements prepared under Generally Accepted Accounting Principles(GAAP) produce extensive, credible, low cost information that forms the foundationof the firm-specific information set available for addressing agency problems. Inmonitoring top managers, boards and outside investors cannot simply rely on stockprice changes to provide necessary information about the source of changes to firmvalue. For example, agency models generally imply that managers should be heldaccountable for controllable events and not uncontrollable events, while stockreturns aggregate the implications of all events. The accounting system facilitatesboards’ efforts to separate controllable from uncontrollable events. As anillustration, managers often submit budgets to the board and then make periodicreports explaining variances from budget, presumably aiding boards in separatingcontrollable from uncontrollable events (e.g., Zimmerman, 2002, Chapter 6).
ARTICLE IN PRESS
2As noted by Hermalin and Weisbach (2002), governance research struggles with the issue of whether to
interpret results as deriving from an equilibrium or out-of-equilibrium phenomenon. While some papers
directly address the equilibrium issue (e.g., Himmelberg et al., 1999; Core et al., 1999), that is not our
intention here. Thus, for example, we do not ask whether an optimal board should have 10% insider
directors or 50% (see, e.g., Byrd and Hickman, 1992; Brickley et al., 1994). Instead, we posit optimality,
and predict that in equilibrium relatively opaque firms will utilize relatively more costly monitoring and
specialized information gathering.
R. Bushman et al. / Journal of Accounting and Economics 37 (2004) 167–201 169

We proxy for the intrinsic governance usefulness of accounting information withearnings timeliness, which, paralleling Basu (1997) and Ball et al. (2000), we define asthe extent to which current GAAP earnings incorporate current economic income orvalue-relevant information. While accounting reports used internally to monitormanagers may utilize methods that differ from GAAP, our premise is that earningstimeliness proxies for inherent limitations of any transactions-based accountingsystem to capture relevant information in a timely fashion, and that the usefulness ofthese internal financial reporting systems to the board depends on earningstimeliness. We predict that where the timeliness of financial accounting informationis relatively low, firms will substitute towards relatively more costly monitoring andspecific information gathering activities to at least partially compensate for lowtimeliness of the accounting information.3
While we posit earnings timeliness as an inherent property of firms’ informationsystems that impacts governance choices, it is important to ask whether timelinessreally is a distinct characteristic, rather than simply a byproduct determined by theset of fundamental firm characteristics examined in previous research as governancedeterminants. We examine this directly and conclude that timeliness is a distinctcharacteristic. We find that a small portion of the cross-sectional variation in ourtimeliness metric is explained by firm characteristics found to be linked withgovernance structures in prior work including firms’ growth opportunities, returnvolatility, size, the number of years a firm is public, CEO tenure, industry andgeographic diversification, and past performance.
We also investigate the relation between organizational complexity and govern-ance structures. While the construct ‘‘organizational complexity’’ could encompass awide range of organizational design features (see, e.g., Brickley et al., 1997, Chapters8–10), we operationalize it with two measures of diversification. We utilize segmentrevenue information to compute Hirfindahl-Hirschman indices measuring with-infirm industry and geographic concentration. Our premise is that firms competing inmultiple industries and/or multiple geographic regions face more complexoperational and informational environments, and therefore, benefit more fromcostly monitoring activities and specific information than firms with tighter industryand geographic focus.
On the basis of a cross-section of 784 firms in the Fortune 1000, we find substantialsupport for the predicted negative relation between the ‘‘strength’’ of corporategovernance systems and the timeliness of earnings, after controlling for other factors,including growth opportunities, return volatility, firm size, the number of years afirm is public, CEO tenure, whether the CEO or Chairman of the Board is thefounder, past performance, and membership in the banking or utility industries. Aspredicted, we find that concentrated shareholdings, and the stock price-wealth link
ARTICLE IN PRESS
3This prediction parallels results demonstrating that traders increase costly, private information
gathering and processing activities as the precision of accounting disclosures shrinks (e.g., Verrecchia,
1982). It is also consistent with evidence that incentive plans rely relatively more on non-accounting
performance measures where financial accounting information is more limited (Bushman et al., 1996;
Ittner et al., 1997; Hayes and Schaefer, 2000), and that ownership concentration across countries varies
inversely with the quality of a country’s accounting disclosures (La Porta et al., 1998).
R. Bushman et al. / Journal of Accounting and Economics 37 (2004) 167–201170

of inside directors and the top five executives vary inversely with the timeliness ofearnings. We also document the predicted negative relation between the reputationof outside directors and the timeliness of earnings. However, we fail to document asignificant negative relation between the stock price-wealth link of outside directorsand the timeliness of earnings unless we exclude the dummy variables for banks andutilities, and fail to find that the percentage of outside directors with expertise in thefirm’s main industry, the percentage of directors who are insiders, or board size varysignificantly with the timeliness of earnings.
Our results concerning the predicted positive relation between the ‘‘strength’’ ofcorporate governance systems and firm diversification are mixed. We document that,as predicted, the stock price-wealth link of inside and outside directors increases withline of business diversification, and the stock-price wealth link of specific outsideshareholders (i.e., ownership concentration) increases with geographic diversifica-tion. The other predicted relations between diversification and the stock price wealthlinks and the composition of the board are not supported.
The remainder of this paper is organized as follows. Section 2 further discusses therole of earnings timeliness and organizational complexity in influencing governancemechanism choices. Section 3 describes our governance variables and developshypotheses concerning their sensitivity to the timeliness of accounting numbers andorganizational complexity. Section 4 describes control variables, sample, and data.Section 5 describes our empirical design, results and sensitivity analyses. Issuesrelating to the possibility of reverse causality in our model are discussed in Sections 6and 7, presents a summary and discussion of implications of the paper.
2. Measuring governance value of accounting numbers and organizational complexity
Section 2.1 discusses the timeliness of earnings as a measure of accounting’sgovernance value and describes its construction. Section 2.2 further develops ourapproach to measuring organizational complexity.
2.1. Earnings timeliness as a measure of the governance usefulness of accounting
information
We conjecture that the extent to which current accounting numbers capture theinformation set underlying current changes in value (i.e., earnings timeliness, asdefined in our study) is a fundamental determinant of their governance value todirectors and investors. Directors monitor managerial and firm performance, ratifymanagerial decisions, provide managerial incentives, and aid in strategic planningactivities (e.g., strategy development, succession planning). To carry out these duties,directors demand information to help them understand both how and why equityvalues are changing. For example, the detailed accounting system facilitates boards’efforts to separate controllable from uncontrollable events to aid in the managerialevaluation process. Outside investors and financial analysts who monitor firm andmanagerial performance also demand such information. Stock prices provide
ARTICLE IN PRESSR. Bushman et al. / Journal of Accounting and Economics 37 (2004) 167–201 171

information about overall changes in equity value. Accounting systems, by collectingand summarizing the financial effects of firms’ investment, operating, and financingactivities, convey information about the underlying sources of changes in equityvalue.
Earnings timeliness measures the extent to which current earnings capture theinformation set underlying contemporaneous changes in stock price. However, weacknowledge that the nature of this measure raises conceptual issues about ourhypothesis that earnings timeliness is a determinant of governance choices. Inparticular, if stock prices efficiently reflect all information available to marketparticipants, is not the information also available to residual claimants and theboard? And if so, why would firms need costly monitoring mechanisms or specificknowledge gathering to substitute for low earnings timeliness? Why not just usestock price directly, or simply extract the information included in stock price? Wedraw on economic theory to address these questions in support of our hypotheses.
The detailed information set reflected in stock price is not freely available to theboard and residual claimants. Grossman and Stiglitz (1980) demonstrate that fullyrevealing stock prices are incompatible with costly information collection activitiesof investors. In an equilibrium where private information collection and processingactivities are costly, prices cannot be fully revealing. This implies that boards andothers cannot extract the underlying information from price.
However, one could argue that even if prices are not invertible back to themarket’s underlying information set, managers and directors have direct access to allthis information. Is this the case? Research documents a significant relation betweenchanges in stock price and subsequent investment decisions (e.g., Morck et al., 1990;Baker et al., 2001). One potential explanation for this is that stock pricecommunicates new information to a firm’s managers that is then incorporated intoinvestment decision (see Morck et al., 1990 for a discussion of competinghypotheses).4 But, even if a firm’s managers know the entire information set, thisdoes not imply that the board of directors knows it, and so board structure mayrespond to low earnings timeliness as the board seeks to close the information gapbetween them and top management.5 In addition, even if the board knows the entireinformation set, it is not necessarily the case that residual claimholders know it, andso costly monitoring activities may respond to low earnings timeliness as residualclaimholders attempt to compensate for the information gap between them and boththe firm’s executives and board of directors.
Finally, stock price formation is a complex process and the aggregated nature ofinformation impounded in price potentially limits its governance usefulness (e.g.,Paul, 1992). As a result, utilizing stock price as a substitute information source for
ARTICLE IN PRESS
4A number of recent theory papers formally derive equilibria supporting a strategy directing role of
stock price (see Dow and Gorton, 1997; Subrahmanyam and Titman, 1999; Dye and Sridhar, 2001).5Evidence in Frankel and Li (2001) suggests that earnings timeliness captures the extent of information
asymmetry between managers and the market. Specifically, they find that the ability of insider trading
activity to predict future stock returns—their measure of information asymmetry—is negatively related to
the R2 from a price on earnings and book value regression, after controlling for analyst following and the
extent of voluntary disclosure.
R. Bushman et al. / Journal of Accounting and Economics 37 (2004) 167–201172

poor accounting numbers is likely to involve substantial error and to requireextensive sophistication, knowledge, and effort on the part of board members. Thus,consistent with our hypotheses, costly governance mechanisms characterized bystrong equity-based incentives for outside shareholders, directors, and executives, aswell as a relatively knowledgeable, capable, and highly motivated board are likelydemanded when earnings timeliness is low.
Our timeliness metric aggregates three firm-specific metrics. The first two metricsare based on firm-specific regressions of annual earnings on contemporaneous stockreturns over a period of at least 8 years beginning in 1985 and ending in 1994 asfollows:
EARNt ¼ a0 þ a1NEGt þ b1RETt þ b2NEGt � RETt þ et; ð1Þ
EARNt is ‘‘core’’ earnings of a given firm in year t, defined as earnings beforeextraordinary items, discontinued operations, and special items, deflated by thebeginning of year market value of equity.6 RETt is the 15-month stock return ending3 months after the end of fiscal year t: NEGt is a dummy variable equal to 1 if RETt
is negative and 0 otherwise.7 This specification allows b1 to capture the speed withwhich good news in a firm’s stock returns is reflected in earnings, while b1 þ b2
captures the speed with which bad news is reflected in earnings.Our first metric is b1; which measures the relative speed with which firms’ earnings
reflects good news.8 We expect low values of b1 for firms with severe delays in theiraccounting recognition of value-enhancing activities and outcomes. Our secondmetric of the timeliness of earnings is R2 from Eq. (1), which, as observed by Ballet al. (2000), is decreasing in the lag with which earnings capture the news reflected instock returns.
Our third metric is R2 from Eq. (2):
RETt ¼ a0 þ b1EARNt þ b2DEARNt þ et; ð2Þ
where RET and EARN are defined as before, and DEARNt is the change in coreearnings from year t � 1 to year t; deflated by the market value of equity at thebeginning of year t: As with Eq. (1), the estimation is conducted over a period of atleast 8 years beginning in 1985 and ending in 1994. Eq. (2) allows stock prices to varywith both levels and changes in earnings. R2 from Eq. (2) measures the ‘‘percentage’’of all value relevant information captured by the level and change in annual
ARTICLE IN PRESS
6Managers are likely to have high levels of discretion in the timing of recognizing special items relative
to their discretion in the timing of core earnings. To the extent that managers’ ability and incentives to
manipulate bottom line earnings vary with corporate governance structures, the use of core earnings is less
likely to lead to a violation of our assumption that the timeliness of earnings is exogenous under GAAP.
Section 6 further discusses the potential impact of earnings management activities on our earnings
timeliness measures.7Allowing the intercept and slope to vary with the sign of stock returns is patterned after Basu (1997)
and Ball et al. (2000). For sample firms that do not have any negative stock returns during the estimation
period for model (1) (i.e., NEG=0 for all observations), we drop NEG and NEG � RET from the
specification of Eq. (1).8Although it also might be interesting to consider b2 as a metric, it is not practical as a large number of
sample firms have no negative annual stock returns during the estimation period.
R. Bushman et al. / Journal of Accounting and Economics 37 (2004) 167–201 173

earnings, and is expected to decrease in the lag with which earnings captures changesin equity value.
Throughout the paper, we refer to the slope estimate from Eq. (1) (i.e., b1) asREV SLOPE; R2 from Eq. (1) as REV R2; and R2 from Eq. (2) as ERC R2: Wedevelop a composite index for these three individual metrics (REV SLOPE;REV R2; and ERC R2) as our primary metric of the timeliness of earnings.9 Wecalculate the percentile rank for each firm in the sample for each of the three metrics.The composite timeliness metric for a given firm, EARN TIMELY ; is computed asthe average of all three percentile rank values. Due to data limitations, we are unableto estimate Eq. (2) for 39 firms.10 To maximize sample size, in these case we use thepercentile rank for each firm in the sample for ERC R2 only as the timeliness metric.Our results are not sensitive to this decision.11
We close this section by addressing a critical interpretative issue with ourtimeliness metric. As discussed above, our timeliness metric embeds two R2
measures, with higher R2 interpreted as more timely accounting information. Theissue is how does one interpret an R2 of one? Does this imply that, rather than beingmore useful, earnings information is actually superfluous? The answer is no. Whilestock price changes provide overall information about changes in firm value,information from the accounting system aids directors and investors in under-standing the source of changes in firm value. For example, stock price changescommingle events under the control of managers with events that are not, whileagency theory counsels that managers should be held accountable for controllableevents and not uncontrollable events. The accounting system facilitates boards’efforts to separate controllable from uncontrollable events through analysis ofbudget variances and other techniques. Thus, even if disaggregated accountinginformation explained 100% of the variance in returns, accounting would not besuperfluous to governance as stock price is not a sufficient statistic for the detailedinformation necessary to separate controllable from uncontrollable events.
2.2. Measures of organizational complexity
We focus on two aspects of organizational complexity: industry and geographicconcentration. Existing research rarely incorporates industry and geographic
ARTICLE IN PRESS
9We do not use the slope from Eq. (2) because we expect different timing problems to have opposing
effects on the slope from Eq. (2). For example, we expect the ‘‘smoothing’’ of the recognition of holding
gains on assets in place over the lives of the assets to increase the slope in model 2 (analogous to positive
effects of the persistence in earnings on ERCs documented in the prior literature). In contrast, we expect
distortions in earnings resulting from mismatching of revenues and expenses to decrease the slope in
Eq. (2).10We require the estimation for both Eqs. (1) and (2) to have degree of freedom of at least 6, which
requires at least 9 years of observations for estimating Eq. (1) and 8 years for Eq. (2).11The use of a composite involving percentile ranks can mitigate potential measurement error in the
timeliness metrics (Greene, 2000). Using the ranks of the timeliness metrics mitigates measurement error in
the metrics only if the rank is determined by ‘‘timeliness’’ rather than the measurement error in metrics. In
sensitivity analysis we also conduct our estimations using the first principal component of the earnings
timeliness metrics. These analyses are discussed in Section 5.2.
R. Bushman et al. / Journal of Accounting and Economics 37 (2004) 167–201174

diversification together as part of the same research design (exceptions includeBushman et al., 1995; Bodnar et al., 1998; Duru and Reeb, 2002; Denis et al., 2002).We reason that while industry and geographic diversification differ along manydimensions, they both impose significant operational and informational complexity.In this section, we first describe the nature of the complexities imposed by theseorganizational designs, and then discuss existing research that bears on our researchdesign.
Multi-industry firms confront the possibilities that capital will be inefficientlyallocated within the firm (e.g., Stein, 1997), that diverse firms reduce CEO focus anddemand high levels of managerial talent, and that unrelated segments can haveconflicting operational styles or corporate cultures. Managers of individual businesssegments are also shielded from takeover pressure (Cusatis et al., 1993) and lesslikely to receive powerful equity incentives (Schipper and Smith, 1983, 1986).Finally, combining diverse operations creates information aggregation problems thatcan result in substantial information asymmetries within the firm (Habib et al.,1997), or between firm insiders and outside investors by suppressing the activities ofinformation intermediaries (Gilson et al., 2001). While diversified firms in the U.S.must disclose segment data, this information can suffer from problems associatedwith segment identification, cost allocations, and transfer pricing schemes (e.g.,Givoly et al., 1999).
Similar to multi-industry firms, multinational firms face a complex managerialdecision-making environment that generates a range of monitoring difficulties. Suchfirms face cultural and legal diversity across markets and must develop, coordinate,and maintain organizations that span international boundaries. Informationcomplexities arise due to geographic dispersion, multiple currencies, high auditingcosts, differing legal systems, and cultural and language differences (Reeb et al.,1998; Duru and Reeb, 2002; Denis et al., 2002). Operational complexities can arise asfirms act to arbitrage institutional restrictions such as tax codes and financialrestrictions (Bodnar et al., 1998). For example, firms may employ complex transferpricing schemes to shift profits to low tax jurisdictions that can complicate efforts byshareholders and board members to understand firms’ foreign operations.
While we hypothesize that organizational complexity associated with diversifica-tion causes costly governance responses, some have suggested that diversification is aresult of firms’ governance structures (see Denis et al., 1997; Anderson et al., 1998).Prior studies document that firms diversified across industry segments or geographicregions tend to have lower values than portfolios of similar focused firms (e.g., Bergerand Ofek, 1995; Lamont and Polk, 2002; Lang and Stulz, 1994; Servaes, 1996; Deniset al., 2002).12 A related literature documents increases in performance followingrestructuring events such as spinoffs and carve-outs (e.g., Schipper and Smith, 1983,1986; Comment and Jarrell, 1995; John and Ofek, 1995; Daley et al., 1997).
ARTICLE IN PRESS
12 It is an open question as to whether diversification causes value losses. Campa and Kedia (1999) and
Graham et al. (2002) argue that the method used to estimate diversification discounts may produce
spurious discounts. Errunza and Senbet (1984) find that geographic diversification is associated with
higher values.
R. Bushman et al. / Journal of Accounting and Economics 37 (2004) 167–201 175

Under the view that firms’ existing governance structures are not optimallyconfigured (see also footnote 2), one may argue that weak governance structuresallow firm managers to engage in value-destroying diversification behavior. Existingevidence does not seem to support this argument, however. For example, Rose andShepard (1997) document that CEOs of diversified firms are paid more than CEOs offocused firms, and that this wage premium is more consistent with an abilitymatching story than an entrenchment story.13 Denis et al. (1997) find no evidencethat existing governance structures are correlated with estimated diversificationdiscounts, and Anderson et al. (1998) find no evidence that failures of internalgovernance mechanisms are associated with the decision to diversify. While we takethe equilibrium view that firms’ governance structures are optimally configured inresponse to their operating environments (given the costs of changing), what weclassify as costly governance structures are often perceived as ‘‘strong’’ governancestructures under the alternative, out-of-equilibrium view (for example, higher equity-based compensation plans). Therefore, if weak governance causes diversification, itshould work against us finding evidence that costly monitoring is associated withdiversified firms.
To measure within-firm industry (IND CONCENTRATION) and geographicsegment concentration (GEOG CONCENTRATION), we use the CompustatBusiness Industry Segment File to compute revenue-based Hirfindahl-Hirschman indices, calculated as the sum of the squares of each segment’s salesas a percentage of the total firm sales.14 IND CONCENTRATION andGEOG CONCENTRATION are average values of the Hirfindahl-Hirschmanindices over the years 1989–1993. Higher values of GEOG CONCENTRATION
and IND CONCENTRATION indicate more geographic and industry concentra-tion, respectively. These measures decrease (nonlinearly) with the number ofsegments, holding constant variance of segment size, and increase with variance ofsegment size, holding number of segments constant. Thus, a two-segment firm withequal segment sales is less concentrated than a two-segment firm with unequalsegment sales. These measures have an upper bound of 1 (a single segment) and alower bound of 0.1 (for a ten-segment firm with equal revenue in each segment).
3. Predictions and description of governance variables
This section develops hypotheses concerning the sensitivity of governancestructures to the timeliness of earnings and organizational complexity, and describes
ARTICLE IN PRESS
13Contrary to CEO entrenchment explanations for industry diversification, Rose and Shepard (1997)
find that the compensation premium for diversification is invariant to CEO tenure and that incumbents
who diversify their firms earn less than newly hired CEOs at already diversified firms.14Prior research uses various metrics to capture diversification including number of reported segments
(Denis et al., 1997), dummy variables for multi-segments (Anderson et al., 1998), factor analysis of
multiple measures (Duru and Reeb, 2002), entropy measures (Bushman et al., 1995) and variations of
Hirfindahl-Hirschman indices (Rose and Shepard, 1997).
R. Bushman et al. / Journal of Accounting and Economics 37 (2004) 167–201176

our governance variables.15 Sections 3.1–3.3 concern the stock price-wealth links ofspecific outside investors, directors, and executives, respectively. Section 3.4 dealswith the composition of the board.
3.1. Equity-based monitoring incentives of outside shareholders
In the spirit of Demsetz and Lehn (1985), we predict that the lower the timelinessof earnings and higher organizational complexity, the higher the concentration ofstock ownership by outside shareholders.
Our measures of ownership concentration are: (1) The average value of stock heldby individual outside investors (STKVAL SHLDR), computed as total market valueof outstanding common stock at the end of fiscal year 1994 minus the value of sharesheld by officers and directors as a group, divided by the number of commonshareholders; (2) The average percentage of stock held by individual outsideinvestors (STK% SHLDR), computed as the reciprocal of the number of commonstockholders as of fiscal year end 1994;16 (3) The percentage of stock held byinstitutions (%INST ); and (4) The percentage of stock held by blockholders owning5% or more of the firms’ shares (%BLOCK).
We compute a composite variable (SHLDR CONC) representing the averagewithin-sample percentile of STKVAL SHLDR; STK% SHLDR; %INST and%BLOCK : Each of the four individual metrics is sorted in ascending order beforecomputing the percentile values. Hence, high values of SHLDR CONC representrelatively large average shareholdings by individual outside shareholders.17
3.2. Equity-based incentives of inside and outside directors
Stock ownership directly links directors’ financial incentives with those of outsideshareholders. We predict that the stockholdings of inside directors will be relativelylarge in firms with limited accounting information and organizational complexitydue to greater benefits of providing inside directors with equity-based incentives toact in the shareholders’ interests. We also predict that the stockholdings of outsidedirectors in these firms will be large to provide the outside directors with powerfulfinancial incentives to engage in costly policing and advising activities for the benefitof the shareholders.
To capture directors’ equity-based incentives, we include the average value andpercentage of outstanding shares of common stock held by individual insidedirectors (STKVAL INDIR and STK% INDIR) and by individual outside directors(STKVAL OUTDIR and STK% OUTDIR). We compute composite variables tocapture the strength of equity-based incentives of inside (INDIR INCENTIVES)
ARTICLE IN PRESS
15Appendix A provides details concerning data sources and computation of all governance variables.16 Ideally we would exclude the number of officers and directors from the denominators of
STKVAL SHLDR and STK% SHLDR. However, the number of officers and directors is likely small
relative to the total number of common stockholders.17We also conduct principal components analyses for each grouping of governance metrics as an
alternative way to summarize the data in the individual metrics. We discuss these analyses in Section 5.2.
R. Bushman et al. / Journal of Accounting and Economics 37 (2004) 167–201 177

and outside directors (OUTDIR INCENTIVES). Each composite variable repre-sents the average within-sample percentiles of the percentage or value of shares heldby the corresponding group. In all cases, high values of the composite variablesrepresent relatively large shareholdings.
3.3. Executive compensation
We predict that as the timeliness of accounting earnings declines and organiza-tional complexity increases, executive compensation packages will include both ahigher proportion of equity-based incentives and a higher proportion of long-termincentives relative to total incentives to better align incentives. A similar prediction ismade by Duru and Reeb (2002) relative to industry and geographic diversification.
To capture the structure of incentive packages of the top five officers, we includethe percentage of the value of all their incentive plans represented by equity-basedplans (EQINC TOT) and by long-term plans (LTINC TOT). We compute the valueof all incentive plans during a year as the combined value of options and restrictedstock granted that year as well as long-term performance plan payouts and annualbonus payments during the year from the ProxyBase dataset of Hewitt Associateswhich compiles information from annual individual firm proxy statements.EQINC TOT is the percentage of total incentives represented by grants of stockoptions and restricted stock, and LTINC TOT is the percent of managers’ totalincentive plans represented by grants of options and restricted stock plus anypayouts from long-term performance plans (excludes annual bonus payments). Foreach measure we use the average of the ratio across the top five officers of a firm ineach year 1994–97, and then average over the 4 years to minimize distortionsassociated with non-annual option grant frequencies. We compute a compositevariable (EXEC INCENTIVES) as the average of the percentiles of EQINC TOT
and LTINC TOT : Both EQINC TOT and LTINC TOT are sorted in ascendingorder before computing percentiles so that high values of EXEC INCENTIVES
represent relatively high importance of long-term and equity-based incentive plansand relatively low importance of short-term bonus plans.
3.4. Board structure
We consider four aspects of board structure: (1) The percentage of directors whoare insiders (%INDIR), defined as directors who are officers, retired officers, orrelatives of officers of the sample firm; (2) Board size, measured as the total numberof directors on the board (# DIR); (3) Outside director industry expertise, computedas the percentage of outsiders with executive experience in the same Fama andFrench (1997) industry grouping as the sample firm (% EXPERT); and (4) Theaverage number of other boards on which outside directors serve (#OTH BOARD).In considering the determinants of these four aspects, we recognize the possibilitythat boards perform multiple roles including hiring, firing and compensating topmanagers, ratifying decisions, and strategic planning (see, e.g., Adams, 2000). Thisintroduces ambiguity into predictions regarding the effects of timeliness and
ARTICLE IN PRESSR. Bushman et al. / Journal of Accounting and Economics 37 (2004) 167–201178

organizational complexity on optimal board structures, in particular with respect to%INDIR and # DIR:
3.4.1. The percentage of directors who are insiders
An important question of board composition concerns the ideal combination ofoutside and inside members. Outsiders are more independent of a firm’s CEO, butare potentially less informed regarding firm projects than insiders. Insiders are betterinformed regarding firm projects, but have potentially distorted incentives derivingfrom their lack of independence from the firm’s CEO. Some argue that boardsshould be represented mostly by outsiders. Jensen (1993) advocates boards with theCEO as the only inside member. Weisbach (1988) finds a stronger associationbetween prior performance and the probability of CEO resignation for companieswith outsider-dominated boards than for companies with insider-dominated boards,and Borokhovich et al. (1996), Byrd and Hickman (1992) and Brickley et al. (1994)suggest a positive relation between the fraction of outsiders on the board and firmvalue. On the other hand, Bhagat and Black (1999), and Klein (1998) suggest thatadding insiders on the board may improve firm performance for some firms.18
Our premise in this paper is that the optimal mix of inside versus outside directorsmay depend on the timeliness of earnings and organizational complexity. On the onehand, low earnings timeliness and high organizational complexity can increase thescope for moral hazard by making firms’ operations less transparent to the boardand outsiders. In this case, firms with relatively low earnings timeliness and highorganizational complexity should have a relatively higher proportion of outsidedirectors. On the other hand, low accounting timeliness and high organizationalcomplexity increase the demand for additional information acquisition by the board.In this case, firms with relatively low earnings timeliness and high organizationalcomplexity have a relatively higher proportion of insider directors. Unfortunately,these predictions go in opposite directions, undermining our ability to makeunambiguous predictions about how %INDIR relates to earnings timeliness andorganizational complexity. Thus, the question of which of these two conflictingforces is more powerful is ultimately an empirical question.
3.4.2. Board size
Concerning board size, smaller boards have the advantage of lower coordinationcosts and less free riding among board members, but the disadvantage of feweradvisors and monitors of management. Jensen (1993) advocates small size boards,and Yermack (1996) and Eisenberg et al. (1998) document an inverse associationbetween board size and firm value, holding firm size constant. In contrast, Agrawaland Knoeber (1999) argue for larger size boards in firms where information isotherwise difficult to obtain, and Adams and Mehran (2002) find that banking firmswith larger boards perform better (we add a control for banking firms).
ARTICLE IN PRESS
18Recent theory work on this issue include Raheja (2001) and Hermalin and Weisbach (1998). See
Hermalin and Weisbach (2002) and John and Senbet (1998) for reviews of the literature on boards.
R. Bushman et al. / Journal of Accounting and Economics 37 (2004) 167–201 179

As with %INDIR; it is difficult to make unambiguous predictions relative to# DIR: It is quite plausible that low timeliness and organizational complexity wouldlead firms to smaller board size. In this case, firms would be willing to give up thepotential knowledge contribution of an additional director in order to increasecooperation and reduce free-riding. It is also possible that complex firms with lowtimeliness would utilize more directors as a response to a demand for specificinformation.
3.4.3. Outside director industry expertise
We predict that firms with relatively low earnings timeliness and highorganizational complexity will have a relatively higher percentage of outsidedirectors with industry expertise. The idea is that these firms have a higher demand foroutside directors with complementary knowledge to help managers with specializeddecision problems (Fama and Jensen, 1983). There is one caveat to our predictions.Because we measure director expertise as the percentage of outsiders with executiveexperience in the same Fama and French (1997) industry grouping, our measure ofboard member expertise is likely noisy for multi-industry segment firms.
3.4.4. Quality (reputation) of outside directors
Fama and Jensen (1983) suggest that board effectiveness is enhanced by outsidedirectors with labor market incentives to develop reputations as experts in decisioncontrol. Following Shivdisani (1993), we measure the reputation of outside directorswith the average number of other boards on which outside directors serve(#OTH BOARD).19 We predict that in response to a demand for costly monitoring,firms with relatively low earnings timeliness and high organizational complexity willutilize outside directors with relatively higher reputations.
4. Control variables, sample, and data
4.1. Control variables
We include a number of variables in our cross-sectional regression models tocontrol for factors affecting governance structures documented in prior studies.Many of these variables have been used in prior research as determinants ofgovernance choice. We acknowledge the possibility that earnings timeliness may bedetermined by these variables, which are the true determinants of governancechoices. In Section 5.1, we explore this possibility by examining the relation betweentimeliness and these control variables.
Prior studies show that firms’ growth opportunities explain cross-sectionaldifferences in governance configurations. We use several proxies for investment
ARTICLE IN PRESS
19A large number of other boards may also indicate that directors are too busy and perhaps of low
quality. To address this concern, we rerun all of our analysis eliminating firms where the average number
of other boards is greater than 4 and obtain qualitatively similar results.
R. Bushman et al. / Journal of Accounting and Economics 37 (2004) 167–201180

opportunities, including the ratio of the book value of equity to the market value ofequity (BTM), sales growth (GROWTH SALE), research and development expensesscaled by net sales (RD SALES) and advertising expenses scaled by net sales(AD SALES). We use principal component analysis to compute a compositemeasure of these four variables, GROWTH ; using the first principal componentwhich captures a substantial portion of the variance in these variables.
We include two variables motivated by Demsetz and Lehn (1985)—the standarddeviation of stock returns (STD RET) and the market value of equity (MV ).Demsetz and Lehn (1985) document a significant relation between these factors andownership concentration. We expect a positive association between our governancestructure variables and STD RET ; consistent with greater volatility increasingdemand for costly monitoring. We include MV to control for the impact of variousunspecified differences relating to size (e.g., information environment, marginalproduct of manager effort).
Prior research finds that board composition and managerial ownership depend onpast performance (see Hermalin and Weisbach, 2002; Himmelberg et al., 1999; Kole,1996). We use prior period return on equity (ROE) to proxy for performance history.We also consider the number of years the CEO has been a director of the firm(CEO TENURE), an indicator variable for whether the CEO is a founder of the firm(see Finkelstein and Hambrick, 1989; Klein, 1998), and the number of years a firmhas been public (FIRM AGE).
With the exception of STD RET ; FIRM AGE and FOUNDER; all of the controlvariables are measured as the average over the period of 1989–1993. FIRM AGE ismeasured by the number of years a firm has been on CRSP as of year end 1994 andSTD RET is estimated over the same period used to estimate models (1) and (2) inSection 2.2. FOUNDER is a dummy variable that takes a value of one if the CEO orChairman of the Board in place during 1994 is also a founder of the firm and zerootherwise. Founder status was determined by review of individual firm proxystatement biographies of CEOs and Chairmen of the Board. Finally, to control forthe role of regulation in the formation of governance systems (e.g., Demsetz andLehn, 1985; Denis et al., 1997; Anderson et al., 1998; Kole and Lehn, 1999; Gillanet al., 2003), we include dummy variables for utilities and banks. Regulation mayimpact a firm’s governance structure due to additional third-party monitoring likeregulatory bank audits, which may systematically influence optimal governancestructures for these firms.
It is possible that a low relative earnings timeliness value could simply capturesituations where alternative sources of public information vary across firms. As asensitivity check, we thus consider an additional variable to capture alternative sourcesof public information: the number of analyst long-term earnings growth rate forecastsfor the firm from the Zacks database. These analyses are discussed in Section 5.2.
4.2. Sample and data
We select our sample from the Fortune 1000 firms included on ProxyBase, adatabase derived from firms’ annual proxy statements maintained by Hewitt
ARTICLE IN PRESSR. Bushman et al. / Journal of Accounting and Economics 37 (2004) 167–201 181

Associates. We obtain data for fiscal year 1994 from ProxyBase on the number ofdirectors, the number of inside and outside directors, and directors’ stock ownership.We also use ProxyBase to obtain the structure of compensation packages of the topfive officers for 1994 through 1997. We obtain the percentage of stock held byofficers and directors as a group (as reported in proxy statements for fiscal year 1994)from Compact Disclosure. We collect data from proxy statements for fiscal 1994concerning the FOUNDER status of CEO or Chairman of the board, backgroundsof outside directors, and current and prior employers. We assess whether outsidedirectors have industry-specific expertise by examining director biographies in proxystatements to determine whether they have served as an executive of another firm ina given sample firm’s industry. For this analysis, we assign firms to industries on thebasis of the classification scheme reported in Fama and French (1997).20 We requiresample firms to have data on annual earnings and the market value of equity onCompustat and monthly stock return data on the CRSP database for at least 8 yearsduring the period 1985 through 1994 to allow computation of the firm-specifictimeliness variables. All other financial data are from Compustat.
Table 1 describes the industry membership of the 784 sample firms with completedata assigned on the basis of 4-digit SIC codes and the Fama and French (1997)industry classification scheme. 45 industries are represented by sample firms, with 26industries represented by at least ten firms. Utilities (97 firms), banks (81 firms),insurance (45 firms), retail (42 firms), chemicals (33 firms), wholesale (33 firms),computers (31 firms), machinery (30 firms), petroleum and natural gas (29 firms),business supplies (28 firms), and business services (25 firms) are each represented byat least 25 firms.
Table 2 includes summary statistics for our metrics for the timeliness of earningsand organizational complexity. The mean and median levels of the ERC R2 are 0.37and 0.35, respectively, while the mean and median levels of REV R2 are 0.33 and0.29, respectively. REV SLOPE; the slope on positive returns in Eq. (2), has a mean(median) value of 0.04 (0.03). Mean values of IND CONCENTRATION andGEOG CONCENTRATION are 0.65 and 0.81, respectively, suggesting greatergeographic concentration than industry concentration. Table 2 also summarizes thesample distribution of other firm characteristics considered in our governanceestimations, including the market value of equity (MV ), the standard deviation of15-month stock returns (STD RET), firm age (FIRM AGE), the book-to-marketratio (BTM), sales growth (GROWTH SALE), the ratios of research anddevelopment and advertising to net sales (RD SALES and AD SALES; respectively)ROE of prior years, CEO tenure (CEO TENURE) and CEO founder information(FOUNDER). Finally, Table 2 summarizes the sample distribution of all ourgovernance variables. Table 2 reveals that all model variables display a fair amountof variation across sample firms.
ARTICLE IN PRESS
20We make one change to the Fama and French (1997) industry classification scheme; we classify SIC
code 7372 (Prepackaged Software) as Computers rather than Business Services.
R. Bushman et al. / Journal of Accounting and Economics 37 (2004) 167–201182

5. Empirical design and results
In Section 5.1, we examine relations between earnings timeliness and other firmcharacteristics. Section 5.2 presents empirical results on the relation betweengovernance variables and our metrics for earnings timeliness and organizationalcomplexity.
5.1. Relations between earnings timeliness and other firm characteristics
We take the perspective in this paper that earnings timeliness has a direct effect ongovernance choices that is distinct from the effects of other firm characteristics. It isthus logical that we begin our empirical analysis by directly examining the extent towhich our timeliness metric is distinct from other fundamental firm characteristics.Univariate correlations reported in Table 3, panel A show that the three timelinessmeasures are significantly correlated among themselves at the 1% level. Panel A alsoreveals that the individual and composite earnings timeliness metrics are eachsignificantly negatively correlated with the growth opportunities composite variable,
ARTICLE IN PRESS
Table 1
Industry membership of sample firmsa
Industry No. of firms Industry No. of firms
Agriculture 1 Measuring and control equipment 10
Aircraft 5 Medical equipment 16
Alcoholic beverages 3 Nonmetallic mining 4
Apparel 8 Personal services 1
Automobiles and trucks 20 Petroleum and natural gas 29
Banking 81 Pharmaceutical products 14
Business services 25 Precious metals 2
Business supplies 28 Printing and publishing 14
Candy and soda 3 Recreational products 6
Chemicals 33 Restaurants, hotel, motel 9
Computers 31 Retail 42
Construction material 19 Rubber and plastic products 5
Construction 13 Shipbuilding, railroad equipment 6
Consumer goods 22 Shipping containers 4
Defense 2 Steel works, etc. 14
Electrical equipment 11 Telecommunications 16
Electronic equipment 22 Textiles 10
Entertainment 2 Tobacco products 2
Fabricated products 1 Trading 5
Food products 17 Transportation 21
Healthcare 2 Utilities 97
Insurance 45 Wholesale 33
Machinery 30Total 784
a Industries are defined on the basis of 4-digit SIC codes using the industry groupings identified in Fama
and French (1997). The only departure from the Fama and French industry groupings is our classification
of SIC code 7372 as Computers rather than Business Services.
R. Bushman et al. / Journal of Accounting and Economics 37 (2004) 167–201 183

ARTICLE IN PRESS
Table 2
Sample distribution of model variablesa
Variable Nobs Mean Std. dev. Q1 Median Q3
Earnings timeliness metrics:
EARN TIMELY 784 0.50 0.22 0.33 0.50 0.67
ERC R2 784 0.37 0.23 0.17 0.35 0.55
REV R2 745 0.33 0.21 0.16 0.29 0.47
REV SLOPE 745 0.04 0.15 �0.01 0.03 0.09
Organizational complexity:
GEOG CONCENTRATION 784 0.81 0.27 0.61 1.00 1.00
IND CONCENTRATION 784 0.65 0.28 0.40 0.63 0.99
Other firm characteristics:
MV ($ millions) 784 3347.85 7048.44 480.38 1083.08 2978.03
STD RET 784 0.41 0.24 0.25 0.35 0.47
FIRM AGE 783 30.07 17.98 22.00 24.00 39.00
BTM 784 0.78 0.69 0.38 0.61 0.95
GROWTH SALE 784 0.09 0.13 0.03 0.06 0.12
RD SALES 784 0.02 0.06 0 0 0.02
AD SALES 784 0.01 0.03 0 0 0.01
ROE 784 0.10 1.18 0.07 0.11 0.15
CEO TENURE 778 12.14 9.20 5.0 10.0 17.0
FOUNDER 784 0.14 0.35 0 0 0
Governance structure metrics:
Outside shareholder incentives
STKVAL SHLDR (in $thousands) 776 268.11 445.35 62.80 151.31 308.34
STK% SHLDR 753 0.19 0.22 0.03 0.10 0.26
%INST 782 0.53 0.20 0.38 0.56 0.68
%BLOCK 782 0.22 0.22 0.06 0.16 0.32
Board of director stock-based incentives
STKVAL INDIR (in $ millions) 780 37.90 235.17 3.04 9.06 21.91
STK% INDIR 780 0.02 0.04 0.00 0.01 0.02
STKVAL OUTDIR (in $ millions) 783 10.85 80.09 0.18 0.72 3.36
STK% OUTDIR 783 0.00 0.02 0 0 0
Executives stock-based incentives
LTINC TOT 779 0.57 0.22 0.43 0.60 0.72
EQINC TOT 779 0.49 0.24 0.32 0.51 0.67
Board structure
#OTH BOARD 757 2.08 1.16 1.17 2.00 2.83
% EXPERT 756 0.08 0.14 0.00 0.00 0.13
%INDIR 784 0.22 0.12 0.13 0.20 0.28
# DIR 784 11.22 3.30 9.00 11.00 13.00
aSee Appendix A for variable definitions.
R. Bushman et al. / Journal of Accounting and Economics 37 (2004) 167–201184

GROWTH ; and the firm size variable, LOG MV and significantly positivelycorrelated with the organizational complexity variables, IND CONCENTRATION
and GEO CONCENTRATION : These correlations are quite intuitive—one mightexpect firms with high growth opportunities and less industry and geographicconcentration to have low earnings timeliness.
In Table 3, panel B, we report results from multiple regressions of compositetimeliness (EARN TIMELY ) on the various firm characteristics to determine how
ARTICLE IN PRESS
Table 3
Analyses of earnings timeliness metricsa
Panel A: Correlation between earnings timeliness metrics and firm characteristics
ERC R2 REV R2 REV SLOPE EARN TIMELY
ERC R2 1.000
REV R2 0.407��� 1.000
REV SLOPE 0.373��� 0.268��� 1.000
EARN TIMELY 0.799��� 0.737��� 0.724��� 1.000
GROWTH �0.088�� �0.084�� �0.177��� �0.134���
BTM �0.045 0.017 �0.018 �0.027
GROWTH SALE �0.038 �0.042 �0.139��� �0.079��
RD SALE �0.166��� �0.071�� �0.120��� �0.124���
AD SALE �0.045 �0.061� �0.054 �0.071��
STD RET �0.033 0.050 �0.060� �0.009
LOG MV �0.058� �0.137��� �0.118��� �0.136���
GEOG CONCENTRATION 0.126��� 0.128��� 0.118��� 0.145���
IND CONCENTRATION 0.159��� 0.114��� 0.096��� 0.160���
FIRM AGE �0.025 �0.028 0.071� �0.003
ROE 0.101��� �0.015 �0.082�� 0.011
Panel B: Multiple regressions of composite earnings timeliness metric on firm characteristics
Dependent variable: EARN TIMELY
(1) (2) (3) (4)
Intercept 0.383 (10.01)��� 0.401 (9.99)��� 0.259 (4.47)��� 0.283 (4.73)���
LOG MV �0.019 (�3.22)����0.019 (�3.20)����0.019 (�2.99)����0.018 (�2.95)��
STD RET �0.017 (�0.47) �0.007 (�0.19) �0.025 (�0.68) �0.018 (�0.49)
GROWTH �0.100 (�1.37) — �0.010 (�1.29) —
BTM �0.017 (�1.08) — �0.013 (�1.09)
GROWTH SALE �0.077 (�1.13) — �0.090 (�1.31)
RD SALE �0.324 (�2.20)�� — �0.275 (�1.83)�
AD SALE 0.128 (0.46) — 0.229 (0.82)
FIRM AGE 0.001 (1.36) 0.001 (1.09)
ROE 0.009 (1.35) 0.007 (1.08)
GEOG CONCENTRATION 0.038 (1.18) 0.035 (1.07)
IND CONCENTRATION 0.117 (3.84)��� 0.120 (3.96)���
Adjusted R2 0.014 0.018 0.037 0.041
No. of obs. 784 784 784 784
���, ��, � indicate significant at less than the 1%, 5%, 10% level, respectively.aSee Appendix A for variable definitions.
R. Bushman et al. / Journal of Accounting and Economics 37 (2004) 167–201 185

distinct earnings timeliness is from these characteristics that have been considered inprior governance studies. We include an extensive list of fundamental characteristicsdiscussed in Section 4.1 including growth opportunities, return volatility, firm size,industry and geographic concentration, past performance, and the number of years afirm is public. Panel B reveals that firm size and industry concentration aresignificantly associated with timeliness, consistent with the univariate correlations.Overall, however, the vector of firm characteristics explains a small portion of thecross-sectional variation in EARN TIMELY ; with adjusted R2 ranging from 0.014to 0.041 across specifications. The inability to explain the cross-sectional variation inEARN TIMELY with firm characteristics previously linked with governance factorsis consistent with the idea that timeliness is distinct relative to these otherfundamental firm characteristics. Thus, we posit that earnings timeliness captures aninherent property of the firm’s information environment, and leave further analysisof this premise to future research.
5.2. Primary model and regression results
We now present our primary model to test our main hypotheses of the associationbetween governance structures and the information environment and organizationalcomplexity of the firm.
Specifically, we estimate the following cross-sectional regression models:
DEP VAR ¼ aþ b1EARN TIMELY þ b2GEOG CONCENTRATION
þ b3IND CONCENTRATION þ d1GROWTH
þ d2LOG MV þ d3STD RET þ d4FIRM AGE þ d5ROE
þ d6CEO TENURE þ d7FOUNDER þ d8UTILITY
þ d9FINANCIAL þ e: ð3Þ
DEP VAR represents (1) the four variables for board structure, and the compositevariables for (2) equity-based incentives of outside shareholders, (3) equity-basedincentives of inside or outside directors, or (4) the composition of executivecompensation plans. For each DEP VAR variable whose value is bounded betweenzero and one, we apply a logistic transformation before estimating the model.21
Appendix A includes detailed descriptions of all variables.Our main interest is in the coefficients on the earnings timeliness and
organizational complexity metrics (i.e., b1; b2; and b3 in Eq. (3)). As discussed inSection 3.1, we predict bio0 (for i ¼ 1 through 3) for the models incorporating thegovernance metrics related to outside shareholder concentration (SHLDR CONC),board and officer incentives (INDIR INCENTIVES and OUTDIR INCENTIVES),and executive incentives (EXEC INCENTIVES) to reflect the hypothesized negative
ARTICLE IN PRESS
21Specifically, we use the formula log DEP VAR=ð1� DEP VARÞ� �
to transform each composite
metric. The transformation is designed to convert the bounded distribution into an unbounded one, and is
similar to that conducted by Demsetz and Lehn (1985) and Himmelberg et al. (1999) in a similar setting.
The reported results for the transformed variables are similar to results using the variables before
conducting the transformation.
R. Bushman et al. / Journal of Accounting and Economics 37 (2004) 167–201186

relation between costly governance and metrics for the timeliness of earnings andgeographic and industry concentration (i.e., the inverse of organizational complex-ity). Further, since high values of the board structure variables % EXPERT and#OTH BOARD represent governance systems that facilitate costly monitoringactivities by investors and directors, we predict bio0 (for i ¼ 1 through 3) for thesevariables as well. As discussed earlier, we do not make unambiguous predictionsfor coefficient estimates on EARN TIMELY ; GEOG CONCENTRATION; orIND CONCENTRATION relative to board characteristics %INDIR and # DIR dueto the possibility of offsetting forces deriving from the multiple board roles ofmonitoring and specific knowledge acquisition.
Table 4 reports that consistent with our predictions, EARN TIMELY issignificantly negatively related to three of the four composite governancevariables. These negative coefficients are statistically different from zero foroutside shareholder concentration (SHLDR CONC), executive incentive struc-ture (EXEC INCENTIVES), and insider directors’ equity holdings(INDIR INCENTIVES) at the 1%, 5% and 10% levels of significance, respec-tively.22 While negative, the coefficient on EARN TIMELY is not statisticallydifferent from zero in the model of OUTDIR INCENTIVES: In untabulatedestimations of Eq. (3) that exclude the regulated industry controls, we find thatEARN TIMELY is negative and significant for all four composite governancemetrics, suggesting that utilities and banks have high timeliness and low use ofalternative costly monitoring mechanisms. Is the low use of costly monitoring inthese businesses because of high timeliness or because of regulatory monitoring? Ourdesign cannot distinguish between these alternatives.
Table 4 documents a significant negative relation between organization com-plexity metrics and three of the four governance composites. In particular,IND CONCENTRATION is negatively related to inside director’s incentive(INDIR INCENTIVES) (at below the 1% level in a two-sided test), and outsidedirectors’ incentive (OUTDIR INCENTIVES) (at below the 10% level) whileGEOG CONCENTRATION is significantly negatively associated withSHLDR CONC (at below the 1% level).23 Neither organizational complexitymeasure is significantly associated with EXEC INCENTIVES:24 We observe thatIND CONCENTRATION and GEOG CONCENTRATION do not appear to beequally important across the governance choices (i.e., only one of the two variables is
ARTICLE IN PRESS
22We remove significant outliers determined by absolute values of Cook’s distance greater than one and
studentized residuals greater than three.23Denis et al. (1997) find a negative relation between the fractional ownership of officers and directors as
a group and an alternative measure of diversification, the number of industry segments. While our
multivariate analyses document a negative relation between IND CONCENTRATION and fractional
ownership of officers and directors as a group, we observe a positive, but insignificant univariate
correlation (untabulated) between these two measures.24 In a related study, Duru and Reeb (2002) find that both industry and geographic diversification are
correlated with the higher equity incentives for executives. We get similar results before controlling for
banks and utilities, but with these controls find that more geographic diversification leads to higher equity
incentives while more industry diversification leads to lower equity incentives.
R. Bushman et al. / Journal of Accounting and Economics 37 (2004) 167–201 187

ARTIC
LEIN
PRES
S
Table 4
Summary statistics from regressions of composite governance variables on earnings timeliness, organizational complexity measures and various control
variables
DEP VAR ¼ aþ b1EARN TIMELY þ b2GEOG CONCENTRATION þ b3IND CONCENTRATION
þ d1GROWTH þ d2LOG MV þ d3STD RET þ d4FIRM AGE þ d5ROE
þ d6CEO TENURE þ d7FOUNDER þ d8UTILITY þ d9FINANCIAL þ e
(1) (2) (3) (4)
SHLDR CONC INDIR INCENTIVES OUTDIR INCENTIVES EXEC INCENTIVES
EARN TIMELY �0.43 (�3.68)��� �0.29 (�1.63)� �0.13 (�0.59) �0.56 (�2.38)��
GEOG CONCENTRATION �0.43 (�4.05)��� 0.07 (0.41) 0.24 (1.22) �0.34 (�1.58)
IND CONCENTRATION �0.15 (�1.48) �0.54 (�3.49)��� �0.37 (�1.92)� 0.33 (1.66)
GROWTH 0.06 (2.25)�� 0.02 (0.43) 0.12 (2.45)�� 0.10 (1.99)��
LOG MV �0.11 (�5.35)��� 0.001 (0.04) �0.12 (�3.06)��� 0.22 (5.48)���
STD RET 0.21 (1.82)� 0.60 (3.38)��� �0.22 (�1.01) 0.65 (2.78)���
FIRM AGE �0.01 (�4.26)��� �0.01 (�4.47)��� �0.02 (�5.62)��� �0.00 (�0.31)
ROE 0.02 (0.72) �0.004 (�0.13) �0.06 (�1.60) �0.21 (�3.04)���
CEO TENURE 0.002 (0.62) 0.04 (10.08)��� �0.00 (�0.62) �0.02 (�2.65)���
FOUNDER �0.02 (�0.21) 0.64 (5.39)��� 0.38 (2.60)�� �0.18 (�1.13)
UTILITY �1.14 (�12.86)��� �1.62 (�11.88)��� �1.17 (�6.95)��� �0.99 (�5.59)���
FINANCIAL �0.02 (�0.27) 0.17 (1.41) 0.41 (2.78)�� �0.11 (�0.72)
Adjusted R2 0.40 0.46 0.21 0.15
No. of obs. 773 764 772 765
DEP VAR=variables reflecting composite corporate governance used as dependent variables in the above regression analyses. See Appendix A for descriptions
and measurement information for specific DEP VAR composites and all other model variables. Summary statistics include coefficient estimates with t-statistics
in parentheses. ���, ��, and � indicate significance level for a two-sided test at less than the 1%, 5% and 10% level, respectively.
R.
Bu
shm
an
eta
l./
Jo
urn
al
of
Acco
un
ting
an
dE
con
om
ics3
7(
20
04
)1
67
–2
01
188

significant in each model). Our theory does not distinguish between the twoorganizational complexity metrics with respect to governance structures nor does itoffer predictions on which would dominate for a particular governance choice—bothof these issues are left for future research.
We also observe in Table 4 that a number of control variables are significantlyrelated to the four governance structure composites. We highlight the significantpositive relation between return volatility (STD RET ) and three of the governancechoices—shareholder concentration, inside director incentives and executiveincentives. The positive relation between STD RET and SHLDR CONC isconsistent with the findings in Demsetz and Lehn (1985). Other influential controlvariables include size (LOG MV ), growth opportunities (GROWTH), FIRM AGE;and CEO TENURE; FOUNDER and regulation (UTILITY ).
Table 5 presents the results of Eq. (3) with the four board structure variables asdependent variables. Table 5 documents that consistent with predictions,#OTH BOARD is negatively associated with both EARN TIMELY andIND CONCENTRATION at the 5% and 1% levels, respectively, suggesting thatfirms with low earnings timeliness and operations in multiple industries have outsidedirectors with high reputations. We also find a negative and significant relationbetween % EXPERT and GEO CONCENTRATION at below the 1% level,suggesting that firms with greater geographic diversification have more outsidedirectors with industry expertise. We do not find the predicted negative relationbetween % EXPERT and EARN TIMELY : Recall that in contrast to thepredictions for the models involving board structure variables %EXPERT and#OTH BOARD; we do not offer a prediction on the other two board structurevariables, %INDIR and # DIR with respect to earnings timeliness and organiza-tional complexity due to the opposing predictions from theory. Our results reflect theopposing predictions from theory—we do not find statistically significant relationsbetween %INDIR and # DIR and the earnings timeliness metric and eitherorganizational complexity metric.
Tables 4 and 5 also reveal that both %INDIR and INDIR INCENTIVES increasein FOUNDER and CEO TENURE; consistent with the theory in Hermalin andWeisbach (1998) that founding CEOs or CEOs with long tenures have largebargaining power in determining board composition. It is also intuitive thatINDIR INCENTIVES would be higher for a firm FOUNDER and a long tenureCEO (Table 4, Column 2), as the CEO is likely to have accumulated more stockholdings in these cases. Consistent with Adams and Mehran (2002), we alsodocument that banks (FINANCIAL) have more outside directors (column 3) andlarger boards (column 4) than non-banks.
For completeness, Table 6 reports the results of estimating Eq. (3) with theindividual governance measures underlying the governance composites used inTable 4. These analyses allow us to determine which individual governance variablescontribute to the significant coefficients in the models using governance composites.For convenience of comparison, we also include the coefficients on the compositevariables. Following predictions on the composite measures, we expect that all of theindividual governance variables will be negatively related to EARN TIMELY ;
ARTICLE IN PRESSR. Bushman et al. / Journal of Accounting and Economics 37 (2004) 167–201 189

ARTIC
LEIN
PRES
S
Table 5
Summary statistics from regressions of board structure variables on earnings timeliness, organizational complexity measures and various control variables
DEP VAR ¼ aþ b1EARN TIMELY þ b2GEOG CONCENTRATION þ b3IND CONCENTRATION
þ d1GROWTH þ d2LOG MV þ d3STD RET þ d4FIRM AGE þ d5ROE
þ d6CEO TENURE þ d7FOUNDER þ d8UTILITY þ d9FINANCIAL þ e
(1) (2) (3) (4)
Pred. sign #OTH BOARD % EXPERT Pred. sign %INDIR # DIR
EARN TIMELY (�) �0.09 (�2.04)�� �0.001 (�0.01) (?) �0.03 (�0.66) 0.00 (0.38)
GEOG CONCENTRATION (�) �0.04 (�1.02) �0.05 (�2.90)��� (?) �0.05 (�1.29) 0.04 (1.18)
IND CONCENTRATION (�) �0.10 (�2.73)��� 0.03 (1.59) (?) �0.05 (�1.20) �0.01 (�0.43)
GROWTH �0.02 (�2.55)�� 0.004 (0.88) �0.002 (�0.23) �0.02 (�2.11)��
LOG MV 0.07 (10.25)��� �0.01 (�2.05)�� �0.002 (�0.29) 0.08 (12.04)���
STD RET �0.03 (�0.75) 0.06 (3.13)��� 0.14 (3.26)��� �0.12 (�2.82)���
FIRM AGE 0.002 (2.65)��� �0.001 (�3.41)��� �0.00 (�0.93) 0.001 (1.77)�
ROE 0.00 (0.27) �0.00 (�0.19) 0.01 (1.52) �0.01 (�1.36)
CEO TENURE �0.004 (�3.55)��� �0.001 (�1.53) 0.01 (7.27)��� �0.00 (�0.40)
FOUNDER �0.08 (�2.73)��� 0.03 (2.51)��� 0.18 (5.95)��� �0.04 (�1.56)
UTILITY �0.08 (�2.53)�� �0.04 (�2.45)�� �0.00 (�0.05) 0.01 (0.38)
FINANCIAL �0.02 (�0.75) �0.03 (�2.03)�� �0.08 (�2.85)��� 0.23 (8.44)���
Adjusted R2 0.29 0.13 0.19 0.33
No. of obs. 750 749 776 775
DEP VAR=variables reflecting board structure used as dependent variables in the above regression analyses. See Appendix A for descriptions and
measurement information for specific DEP VAR variables and all other model variables. Summary statistics include coefficient estimates with t-statistics in
parentheses. ���, ��, and � indicate significance level for a two-sided test at less than the 1%, 5% and 10% level, respectively.
R.
Bu
shm
an
eta
l./
Jo
urn
al
of
Acco
un
ting
an
dE
con
om
ics3
7(
20
04
)1
67
–2
01
190

ARTIC
LEIN
PRES
S
Table 6
Summary statistics from regressions of individual and composite governance variables on earnings timeliness, organizational complexity measures and various
control variables
DEP VAR ¼ aþ b1EARN TIMELY þ b2GEOG CONCENTRATION þ b3IND CONCENTRATION
þ d1MV þ d2STD RET þ d3FIRM AGE þ d4BTM þ d5GROWTH SALE þ d6ROE
þ d7CEO TENURE þ d8FOUNDER þ d9UTILITY þ d10FINANCIAL þ e
DEP VAR Pred. sign EARN TIMELY GEOG CONCENTRATION IND CONCENTRATION Adj. R2
Outside shareholder concentration
SHLDR CONC (�) �0.43 (�3.68)��� �0.43 (�4.05)�� �0.15 (�1.48) 0.40
STKVAL SHLDR (�) �0.12 (�2.81)��� �0.15 (�3.81)��� �0.05 (�1.51) 0.33
STK% SHLDR (�) �0.04 (�1.32) �0.07 (�2.71)��� �0.03 (�1.25) 0.67
%INSTN (�) �0.16 (�3.64)��� �0.11 (�2.86)��� �0.03 (�0.82) 0.20
%BLOCK (�) �0.06 (�1.47) �0.05 (�1.42) �0.01 (�0.40) 0.26
Board and officer incentives
INDIR INCENTIVES (�) �0.29 (�1.63)� 0.07 (0.41) �0.54 (�3.49)��� 0.46
STKVAL INDIR (�) �0.04 (�1.02) 0.01 (0.22) �0.11 (�3.38)��� 0.44
STK% INDIR (�) �0.07 (�2.26)�� 0.00 (0.01) �0.07 (�2.54)��� 0.61
OUTDIR INCENTIVES (�) �0.13 (�0.59) 0.24 (1.22) �0.37 (�1.92)� 0.21
STKVAL OUTDIR (�) �0.02 (�0.55) 0.04 (0.95) �0.08 (�2.08)�� 0.20
STK% OUTDIR (�) �0.03 (�0.77) 0.05 (1.44) �0.06 (�1.76)� 0.37
Executive incentives
EXEC INCENTIVES (�) �0.56 (�2.38)�� �0.34 (�1.58) 0.33 (1.66)� 0.15
LTINC TOT (�) �0.09 (�1.95)� �0.08 (�1.87)� 0.05 (1.28) 0.14
EQINC TOT (�) �0.09 (�1.95)� �0.06 (�1.56)� 0.09 (2.38)�� 0.12
DEP VAR=variables reflecting composite and individual corporate governance used as dependent variables in the above regression analyses. See Appendix A
for descriptions and measurement information for specific DEP VAR variables and all other model variables. Summary statistics include coefficient
estimates with t-statistics in parentheses. Coefficients and t-statistics for variables other than EARN TIMELY, GEOG CONCENTRATION and
IND CONCENTRATION are not tabulated for ease of presentation.���, ��, and � indicate significance level for a two-sided test at less than the 1%, 5% and 10% level, respectively.
R.
Bu
shm
an
eta
l./
Jo
urn
al
of
Acco
un
ting
an
dE
con
om
ics3
7(
20
04
)1
67
–2
01
191

IND CONCENTRATION and GEOG CONCENTRATION: Although the full setof control variables is included in the estimation, Table 6 reports only the coefficientson the earnings timeliness and organization complexity variables for ease ofpresentation.
Results in Table 6 show that in the governance categories involvingoutside shareholder concentration (SHLDR CONC) and executive incen-tives (EXEC INCENTIVES), the coefficients on EARN TIMELY andGEOG CONCENTRATION are negative and significant in each individualgovernance metric estimation except for EARN TIMELY in the models withSTK% SHLDR and %BLOCK and GEOG CONCENTRATION in the model with%BLOCK : Not surprisingly, the coefficients on IND CONCENTRATION in theestimations for individual governance metrics underlying the outside shareholderconcentration and executive incentives composites parallel those of the compositemetrics. In particular, IND CONCENTRATION is insignificantly related with theindividual outside shareholder concentration metrics, and significantly positivelyrelated with the EQINC TOT metric. Table 6 also shows that, consistent with thenegative and significant coefficients on IND CONCENTRATION in the estimationsof INDIR INCENTIVES and OUTDIR INCENTIVES; the coefficients onIND CONCENTRATION for all individual governance metrics are significantlynegative.
We test the sensitivity of the use of average percentile ranks in developingcomposite measures of earnings timeliness and governance metrics. As an alternativemechanism to summarize the multiple variables for the earnings timeliness andgovernance structure constructs, we conduct principal components analyses usingthe various measures for each construct.25 We find that the first principal componentfrom the three earnings timeliness metrics explains more than half of the variation inthe three measures and is the only component with an eigenvalue greater than one.Similarly, the first principal component of the inside and outside director incentivesand executive incentive variables explains a large proportion of the variance and isthe only component with an eigenvalue greater than one. We find two importantprincipal components in analyzing the shareholder concentration metrics—the firstand second principal component have eigenvalues greater than one and collectivelyexplain approximately 70% of the variation in the four underlying shareholderconcentration metrics.26 We re-estimate the governance models underlying Eq. (3)
ARTICLE IN PRESS
25We use average percentile ranks to develop a composite earnings timeliness measure in our main
analysis in order to maximize sample size. Due to data limitations (too few bad news observations for 39
firms), we are unable to estimate Eq. (2) to produce the REV R2 and REV SLOPE metrics. We compute
the percentile rank composite for these firms from the ERC R2 metric only. These 39 firm observations,
however, are lost using a principal components approach. We observe that the univariate correlation
between the percentile rank composite and the first principal component of the earnings timeliness
variables is highly significant (r ¼ 0:96; p-valueo0.001) and report as sensitivity analyses the results using
a principal components approach.26The first principal component draws approximately equally between the variables STKVAL SHLDR,
STK% SHLDR and %BLOCK while the second principal component draws primarily from the %INSTN
variable suggesting that institutional holdings are distinct from the other measures of shareholder
concentration.
R. Bushman et al. / Journal of Accounting and Economics 37 (2004) 167–201192

using the metrics from our principal components analyses in place of the compositegovernance and earnings timeliness metrics reported in Table 4. We estimate fivemodels—we employ the first principal component for (1) inside director incentives,(2) outside director incentives and (3) executive incentives and estimate modelusing both the first and second principal component for the shareholderconcentration variables. The coefficients on the earnings timeliness variable in theseestimations (not tabulated) are qualitatively similar to those reported in Table 4 forshareholder concentration and executive incentive estimations while the coefficienton the earnings timeliness metric loses significance in the inside director incentivesmodel. In particular, the coefficient on the first principal component of earningstimeliness is significant for the models using the first and second principal componentfor shareholder concentration (at the 10% and 1% levels of significance,respectively) and in the executive incentive model (at the 5% significance level).Given that the significance of EARN TIMELY in the inside director incentivesmodel was only marginally significant in Table 4 (p-value=0.10), we conclude thatthe use of the alternative aggregation approach does not significantly alter ourresults.
We also re-estimated Eq. (3) after including an additional control variablecapturing other aspects of the firms’ information environment: the number ofanalyst long-term earnings growth forecasts for the firm obtained from Zack’sdatabase. Univariate correlations (not tabulated) show that the number ofanalyst forecasts is significantly negatively correlated with EARN TIMELY andGEOG CONCENTRATION: The results of the estimations with the additionalinformation environment control (not tabulated) reveal that the coefficients onEARN TIMELY ; GEOG CONCENTRATION and IND CONCENTRATION aresimilar in sign and significance in each governance structure regression to thosereported in Tables 4 and 5.
6. Issues of reverse causality
While accounting information systems per se may directly influence governancechoices, we must acknowledge the possibility that governance structures alsoinfluence the properties of accounting numbers through accounting policy choicesand earnings management activities.27 One econometric solution to this questionwould involve using an instrumental variable technique. This, however, does notappear to be a fruitful approach in this case, as it is not obvious what to use as a
ARTICLE IN PRESS
27Studies addressing governance and earnings management or manipulation include Healy (1985),
Gaver and Gaver (1995) and Holthausen et al. (1995) which address the impact of executive bonus plan
structures on earnings manipulation, Warfield et al. (1995) which examine the impact of ownership
structures on discretionary accrual levels and the magnitude of earnings response coefficient and Dechow
et al. (1996) which finds that firms with alleged GAAP violations are more likely to have boards dominated
by insiders.
R. Bushman et al. / Journal of Accounting and Economics 37 (2004) 167–201 193

reasonable instrument. As documented in Table 3, only a small amount of the cross-sectional variation in earnings timeliness is explained by a wide range of firmcharacteristics. While we could use any or all of these variables as an instrument(e.g., two-stage least square), it would result in throwing out over 95% of the cross-sectional variation in timeliness (recall that the explanatory power of the earningstimeliness models using various firm characteristics in panel B of Table 3 rangedfrom 0.014 to 0.041).
While we cannot definitively rule out reverse causality, we note that our timelinessmetrics are based on ‘‘core’’ earnings, defined as earnings before special items,extraordinary items and discontinued operations. While it is of course possible tomanipulate core earnings, the focus on core earnings excludes discretionary accrualswithin special items, extraordinary items and discontinued operations, which arearguably outlets for earnings management activity.
Further, it is not clear how much discretion managers have over earningstimeliness. As shown in Table 3, earnings timeliness is relatively insensitive to a widerange of important firm characteristics. Even if executives were significantlymanipulating earnings, it is not clear if this would impact earnings timeliness. Ifmarginal sophisticated investors see through earnings management, then earningsmanagement unlikely impacts timeliness. In this instance, our timeliness compositemetric, EARN TIMELY ; could also be impacted if earnings management introducesnoise in earnings. If they are being fooled, then earnings management could increaseearnings timeliness as investors are fooled into thinking that current earnings aremore informative than they really are. In the end, it is not clear how or if earningsmanagement impacts earnings/returns relations estimated over long time periods.
7. Summary and implications
This paper investigates how ownership concentration, equity incentives ofdirectors, executive compensation and board structure vary with inherent limitationsof firms’ information systems and with firms’ organizational complexity. We adoptthe perspective that observed governance structures represent optimal contractingarrangements endogenously determined by firms’ contracting environments. Weproxy for the intrinsic governance usefulness of accounting information withearnings timeliness, defined as the extent to which current accounting earningsincorporate current economic income or value-relevant information. We empiricallydocument that only a small portion of the cross-sectional variation in earningstimeliness can be explained by firms’ growth opportunities, return volatility, size,industry and geographic diversification, and past performance. Our inability toexplain the cross-sectional variation in earnings timeliness is consistent with the ideathat timeliness is distinct from other fundamental firm characteristics. We captureorganizational complexity by utilizing segment revenue information to computeHirfindahl-Hirschman indices measuring within firm industry and geographicconcentration.
ARTICLE IN PRESSR. Bushman et al. / Journal of Accounting and Economics 37 (2004) 167–201194

We explore cross-sectional relations between corporate governance systems andboth earnings timeliness and organizational complexity of 784 firms in the Fortune1000. As predicted, we find that ‘‘strong’’ governance systems characterized by highownership concentration, strong directors’ and executives’ equity-based incentives,and the strong reputation (i.e., quality) of outside directors, vary inversely with thetimeliness of earnings. In addition, we find some evidence that ownershipconcentration and directors’ equity-based incentives increase, as predicted, withfirm complexity. However, board size and the percentage of inside directors do notvary significantly with either the timeliness of earnings or firm complexity.
We acknowledge that caution should be exercised in inferring causality. While wetake extensive efforts to address alternative explanations, it is possible that ourtimeliness and complexity metrics are picking up the effects of omitted correlatedvariables or that the direction of causality should be reversed.
This paper extends the capital market and stewardship literatures in accounting(see, e.g., Bushman and Smith, 2001). Most existing research into the stewardshiprelevance and research into the value relevance of accounting have proceededindependently. We explore whether the relative importance of accounting numbersin equity valuation appears to ‘‘matter’’ in the determination of corporategovernance systems of large public companies in the U.S. Although causal inferencesare problematic, associations between measures of the usefulness of accountingnumbers in valuation and governance structures are a necessary (although notsufficient) condition for concluding that governance structures are influenced by thelimitations of accounting numbers for valuation purposes.
Finally, our evidence supports the notion that the firm-specific timeliness metricscapture meaningful differences across large public U.S. companies in theinformation properties of accounting numbers. This provides a basis for using suchfirm-specific metrics to investigate other economic consequences of the informationproperties of accounting, such as voluntary disclosures, corporate signaling, analystactivity, corporate investment decisions, financing choices, and the cost of debt andequity capital.
Appendix A. Model variable measurement
Dependent variables: (All the dependent variables are calculated at their 1994 valuesexcept for LTINC TOT and EQINC TOT which are averaged over 1994–1997).
Outside shareholder concentration:STKVAL SHLDR : (market value of common stock �value of stock held
by officers and directors)/(number of commonshareholders at 1994 fiscal year end).
STK% SHLDR : 1/(number of common shareholders at 1994 fiscalyear end);
%INST : (number of shares held by institutions)/(total numberof common shares outstanding at 1994 fiscal year end);
ARTICLE IN PRESSR. Bushman et al. / Journal of Accounting and Economics 37 (2004) 167–201 195

%BLOCK percentage of the firms’ shares held by over 5%blockholder;
SHLDR CONC : average of percentile ranks of STKVAL SHLDR;STK% SHLDR; %INST, and %BLOCK (ascend-ing);
Board and officer incentives:STKVAL INDIR : (average number of common shares owned by each
inside director)�(stock price at 1994 fiscal year end);STK% INDIR : (average number of shares owned by each inside
director)/(total number of common shares outstand-ing at 1994 fiscal year end);
INDIR INCENTIVES : average of percentile ranks of STKVAL INDIR
(ascending) and STK% INDIR (ascending);STKVAL OUTDIR : (average number of common shares owned by each
outside director)�(stock price at 1994 fiscal yearend);
STK% OUTDIR : (average number of shares owned by each outsidedirector)/(total number of common shares outstand-ing at 1994 fiscal year end);
OUTDIR INCENTIVES : average of percentile ranks of STKVAL OUTDIR
and STK% OUTDIR (ascending);
Executive incentives:LTINC TOT : (value of grants of long-term incentives)/(value of
grants of long-term incentives plus annual bonuses);Long-term incentives include grants of restrictedstock and stock options and amounts under long-term incentive plans. Values of grants of all long-term incentives are obtained from the ProxyBasedataset of Hewitt Associates which obtains informa-tion from annual firm proxy statements and reflectaverage annual values over the years 1994 through1997.
EQINC TOT : (value of grants of equity-based incentives)/(value ofgrants of long-term incentives plus annual bonuses);Equity-based incentives include grants of restrictedstock and stock options. Values of grants of equity-based incentives are obtained from the ProxyBasedataset of Hewitt Associates which obtains informa-tion from annual firm proxy statements and reflectaverage annual values over the years 1994 through1997. Value of grants of long-term incentives (indenominator) are as described with LTINC TOT
above.
ARTICLE IN PRESSR. Bushman et al. / Journal of Accounting and Economics 37 (2004) 167–201196

EXEC INCENTIVES : average of percentile ranks of LTINC TOT (ascend-ing) and EQINC TOT ; (ascending);
Board structure:OTH BOARD : (total number of other boards outside directors serve
on)/(number of outside directors);% EXPERT : (number of expert outside directors)/(number of
outside directors), where a director is coded as expertif he has had experience as an executive in the sameindustry);
%INDIR : (number of inside directors)/# DIR;# DIR: total number of directors.Note: Rank values of governance metrics are used in the estimations involvingindividual governance measures (Table 6) for comparability with governancecomposite measures.
Measures of earnings timeliness:ERC R2 : R2 of the firm-specific regression of 15-month
(ending 3 months after fiscal year end) stock returnon the level of and change in annual core earnings,both deflated by market value of equity at thebeginning of the period. Each regression starts from1985 and has at least 8 years of observations. Fishertransformation of the R2 is used in the regressionestimations. The percentile ranking, Rank ERC R2;(ascending) of the Fisher transformed ERC R2 isincluded in EARN TIMELY (composite);
REV R2 : R2 of the firm-specific regression of annual earningsdeflated by price at the beginning of the period on (1)15-month (ending 3 months after fiscal year end)stock return and (2) an interactive variable of the 15-month stock return times a dummy variable=1 ifthe 15-month stock return is negative. Each regres-sion starts from 1985 and has at least 8 years ofobservations. Fisher transformation of the R2 is usedin the regression estimations. The percentile ranking,Rank REV R2; (ascending) of the Fisher trans-formed REV R2 is included in EARN TIMELY
(composite);REV SLOPE : The estimated coefficient on the 15-month positive
stock return from the model described in REV R2above. The percentile ranking, Rank REV SLOPE;(ascending) is included in EARN TIMELY (compo-site);
EARN TIMELY : average of Rank ERC R2; Rank REV R2 andRank REV SLOPE;
ARTICLE IN PRESSR. Bushman et al. / Journal of Accounting and Economics 37 (2004) 167–201 197
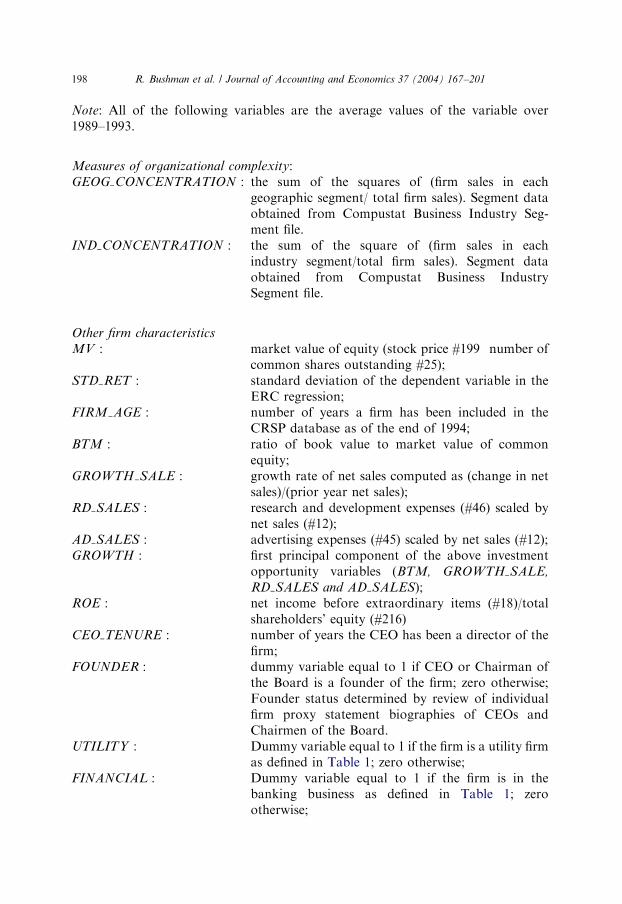
Note: All of the following variables are the average values of the variable over1989–1993.
Measures of organizational complexity:GEOG CONCENTRATION : the sum of the squares of (firm sales in each
geographic segment/ total firm sales). Segment dataobtained from Compustat Business Industry Seg-ment file.
IND CONCENTRATION : the sum of the square of (firm sales in eachindustry segment/total firm sales). Segment dataobtained from Compustat Business IndustrySegment file.
Other firm characteristics
MV : market value of equity (stock price #199�number ofcommon shares outstanding #25);
STD RET : standard deviation of the dependent variable in theERC regression;
FIRM AGE : number of years a firm has been included in theCRSP database as of the end of 1994;
BTM : ratio of book value to market value of commonequity;
GROWTH SALE : growth rate of net sales computed as (change in netsales)/(prior year net sales);
RD SALES : research and development expenses (#46) scaled bynet sales (#12);
AD SALES : advertising expenses (#45) scaled by net sales (#12);GROWTH : first principal component of the above investment
opportunity variables (BTM, GROWTH SALE,
RD SALES and AD SALES);ROE : net income before extraordinary items (#18)/total
shareholders’ equity (#216)CEO TENURE : number of years the CEO has been a director of the
firm;FOUNDER : dummy variable equal to 1 if CEO or Chairman of
the Board is a founder of the firm; zero otherwise;Founder status determined by review of individualfirm proxy statement biographies of CEOs andChairmen of the Board.
UTILITY : Dummy variable equal to 1 if the firm is a utility firmas defined in Table 1; zero otherwise;
FINANCIAL : Dummy variable equal to 1 if the firm is in thebanking business as defined in Table 1; zerootherwise;
ARTICLE IN PRESSR. Bushman et al. / Journal of Accounting and Economics 37 (2004) 167–201198

References
Adams, R., 2000. The dual role of corporate boards as advisors and monitors of management: theory and
evidence. Working paper, Federal Reserve Bank of New York.
Adams, R., Mehran, H., 2002. Board structure and banking firm performance. Working paper, Federal
Reserve Bank of New York.
Agrawal, A., Knoeber, C., 1999. Outside directors, politics, and firm performance. Working Paper, North
Carolina State University.
Anderson, R., Bates, T., Bizjak, J., Lemmon, M., 1998. Corporate governance and firm diversification.
Working paper, Washington and Lee University.
Baker, M., Stein, J., Wurgler, J., 2001. When does the market matter? Stock prices and the investment of
equity-dependent firms. NBER Working Paper 8750.
Ball, R., Kothari, S.P., Robin, A., 2000. The effect of international institutional factors on properties
of accounting earnings. Journal of Accounting and Economics 29, 1–51.
Basu, S., 1997. The conservatism principle and the asymmetric timeliness of earnings. Journal of
Accounting and Economics 24, 3–37.
Berger, P., Ofek, E., 1995. Diversification’s effect on firm value. Journal of Financial Economics 37,
39–65.
Bhagat, S., Black, B., 1999. The uncertain relationship between board composition and firm performance.
Business Lawyer 54, 921–963.
Bodnar, G., Tang, C., Weintrop, J., 1998. Both sides of corporate diversification: the value impacts of
geographic and industrial diversification. Working Paper, Wharton School.
Borokhovich, K., Parrino, R., Trapani, T., 1996. Outside directors and CEO selection. Journal of
Financial and Quantitative Analysis 31, 337–355.
Brickley, J., Coles, J., Terry, R., 1994. Outside directors and the adoption of poison pills. Journal
of Financial Economics 35, 371–390.
Brickley, J., Smith, C., Zimmerman, J., 1997. Managerial Economics and Organizational Architecture.
McGraw-Hill Companies, New York.
Bushman, R., Smith, A., 2001. Financial accounting information and corporate governance. Journal of
Accounting and Economics 32, 237–333.
Bushman, R., Indjejikian, R., Smith, A., 1995. Aggregate performance measures in business unit manager
compensation: the role of intrafirm interdependencies. Journal of Accounting Research 33 (Suppl.),
101–128.
Bushman, R., Indjejikian, R., Smith, A., 1996. CEO Compensation: the role of individual performance
evaluation. Journal of Accounting and Economics 21, 161–193.
Byrd, J., Hickman, K., 1992. Do outside directors monitor managers? Evidence from tender offer bids.
Journal of Financial Economics 32, 195–207.
Campa, J., Kedia, S., 1999. Explaining the diversification discount. Working paper, New York University.
Comment, R., Jarrell, G., 1995. Corporate focus and stock returns. Journal of Financial Economics 37,
67–87.
Core, J., Holthausen, R., Larcker, D., 1999. Corporate governance, chief executive officer compensation,
and firm performance. Journal of Financial Economics 51 (3), 371–406.
Cusatis, P., Miles, J., Woolridge, R., 1993. Restructuring through spin-offs: the stock market evidence.
Journal of Financial Economics 33, 293–311.
Daley, L., Mehrotra, V., Sivakumar, R., 1997. Corporate focus and value creation—evidence from
spinoffs. Journal of Financial Economics 45, 257–281.
Dechow, P., Sloan, R., Sweeney, A., 1996. Causes and consequences of earnings manipulations: an
analysis of firms subject to enforcement actions by the SEC. Contemporary Accounting Research 13,
1–36.
Demsetz, H., Lehn, K., 1985. The structure of corporate ownership: causes and consequences. Journal of
Political Economy 93, 1155–1177.
Denis, D.J., Denis, D.K., Sarin, A., 1997. Agency problems, equity ownership, and corporate
diversification. Journal of Finance 52, 135–160.
ARTICLE IN PRESSR. Bushman et al. / Journal of Accounting and Economics 37 (2004) 167–201 199

Denis, D.J., Denis, D.K., Yost, K., 2002. Global diversification, industrial diversification, and firm value.
Journal of Finance 57, 1951–1980.
Dow, J., Gorton, G., 1997. Stock market efficiency and economic efficiency: is there a connection? Journal
of Finance 52, 1087–1129.
Duru, A., Reeb, D., 2002. Geographic and industrial corporate diversification: the level and structure of
executive compensation. Journal of Accounting Auditing and Finance 17, 1–24.
Dye, R., Sridhar, S., 2001. Strategy-directing disclosures. Working paper, Northwestern University.
Eisenberg, T., Sundgren, S., Wells, M., 1998. Larger board size and decreasing firm value in small firms.
Journal of Financial Economics 48, 35–54.
Errunza, V., Senbet, L., 1984. International corporate diversification, market valuation and size adjusted
evidence. Journal of Finance 34, 727–745.
Fama, E., French, K., 1997. Industry costs of equity. Journal of Financial Economics 43, 153–193.
Fama, E., Jensen, M., 1983. Separation of ownership and control. Journal of Law and Economics 26,
301–325.
Finkelstein, S., Hambrick, D., 1989. Chief executive compensation: a study of the intersection of markets
and political processes. Strategic Management Journal 10, 121–134.
Frankel, R., Li, X., 2001. The characteristics of a firm’s information environment and the predictive ability
of insider trades. Working paper 4218-01, MIT Sloan Scholl of Management.
Gaver, J., Gaver, K., 1995. Compensation policy and the investment opportunity set. Financial
Management 24, 19–32.
Gillan, S., Hartzell, J.C., Starks, L.T., 2003. Industries, investment opportunities, and corporate
governance structures. Working paper, University of Delaware and University of Texas.
Gilson, S., Healy, P., Noe, C., Palepu, K., 2001. Analyst specialization and conglomerate breakups.
Journal of Accounting Research 39, 565–582.
Givoly, D., Hayn, C., D’Souza, J., 1999. Measurement errors and information content of segment
reporting. Review of Accounting Studies 4 (1), 15–43.
Graham, J., Lemmon, M., Wolf, J., 2002. Does corporate diversification destroy value? Journal of Finance
57, 695–720.
Greene, W., 2000. Econometric Analysis. MacMillan, New York, NY.
Grossman, S.J., Stiglitz, J.E., 1980. The impossibility of informationally efficient markets. American
Economic Review 70, 393–408.
Habib, M., Johnsen, D.B., Naik, N., 1997. Spinoffs and information. Journal of Financial Intermediation
6 (2), 153–176.
Hayes, R., Schaefer, S., 2000. Implicit contracts and the explanatory power of top executive compensation
for future performance. RAND Journal of Economics 31, 273–293.
Healy, P., 1985. The effect of bonus schemes on accounting decisions. Journal of Accounting and
Economics 7, 85–113.
Hermalin, B., Weisbach, M., 1998. Endogenously chosen boards of directors and their monitoring of the
CEO. American Economic Review 88, 96–118.
Hermalin, B., Weisbach, M., 2003. Boards of directors as an endogenously determined institution: a
survey of the economic literature. Economic Policy Review 9, 7–26.
Himmelberg, C., Hubbard, R., Palia, D., 1999. Understanding the determinants of managerial ownership
and the link between ownership and performance. Journal of Financial Economics 53, 353–384.
Holthausen, R., Larcker, D., Sloan, R., 1995. Annual bonus schemes and the manipulation of earnings.
Journal of Accounting and Economics 19, 29–74.
Ittner, C., Larcker, D., Rajan, M., 1997. The choice of performance measures in annual bonus contracts.
The Accounting Review 72, 231–255.
Jensen, M., 1993. The modern industrial revolution, exit, and the failure of internal control systems.
Journal of Finance 48 (3), 831–880.
John, K., Ofek, E., 1995. Asset sales and increase in focus. Journal of Financial Economics 37,
105–126.
John, K., Senbet, L.W., 1998. Corporate governance and board effectiveness. Journal of Banking and
Finance 22, 371–401.
ARTICLE IN PRESSR. Bushman et al. / Journal of Accounting and Economics 37 (2004) 167–201200

Klein, A., 1998. Affiliated directors: puppets of management or effective directors? Working paper #CLB-
98-010, New York University Center for Law and Business.
Kole, S., 1996. Managerial ownership and firm performance: incentives or rewards? Advances in Financial
Economics 2, 119–149.
Kole, S., Lehn, K., 1999. Deregulation and the adaptation of governance structure: the case of the U.S.
airline industry. Journal of Financial Economics 52, 79–117.
Lamont, O., Polk, C., 2002. Does diversification destroy value? Evidence from the industry shocks.
Journal of Financial Economics 63, 51–77.
Lang, L., Stulz, R., 1994. Tobin’s Q, Corporate diversification and firm performance. Journal of Political
Economy 102, 1248–1280.
La Porta, R.F., Lopez-de-Silanes, A.S., Vishny, R., 1998. Law and finance. Journal of Political Economy
106, 1113–1155.
Morck, R., Vishny, R., Shleifer, A., 1990. The stock market and investment: Is the market a sideshow?
Brookings Papers on Economic Activity 2, 157–215.
Paul, J., 1992. On the efficiency of stock-based compensation. Review of Financial Studies 5, 471–502.
Raheja, C.G., 2001. The Interaction of insiders and outsiders in monitoring: a theory of corporate boards.
Working Paper, New York University.
Reeb, D., Kwok, C.Y., Baek, Y., 1998. Systematic risk of the multinational corporation. Journal of
International Business Studies 29 (Second Quarter), 263–279.
Rose, N., Shepard, A., 1997. Firm diversification and CEO compensation: managerial ability or executive
entrenchment. Rand Journal of Economics 28, 489–514.
Schipper, K., Smith, A., 1983. Effects of recontracting on shareholder wealth: the case for voluntary spin-
offs. Journal of Financial Economics 12, 437–467.
Schipper, K., Smith, A., 1986. A comparison of equity carve-outs and seasoned equity offerings: share
price effects and corporate restructuring. Journal of Financial Economics 15, 153–186.
Servaes, H., 1996. The value of diversification during the conglomerate merger wave. Journal of Finance
51, 1201–1225.
Shivdisani, A., 1993. Board composition, ownership structure, and hostile takeovers. Journal of
Accounting and Economics 16, 167–198.
Smith, C., Watts, R., 1992. The investment opportunity set and corporate financing, dividend, and
compensation policies. Journal of Financial Economics 32, 263–292.
Stein, J., 1997. Internal capital markets and the competition for corporate resources. The Journal of
Finance 52, 111–133.
Subrahmanyam, A., Titman, S., 1999. The going-public decision and the development of financial
markets. Journal of Finance 54, 1045–1082.
Verrecchia, R., 1982. The use of mathematical models in financial accounting. Journal of Accounting
Research 20, 1–55.
Warfield, T., Wild, J., Wild, K., 1995. Managerial ownership, accounting choices, and informativeness of
earnings. Journal of Accounting and Economics 20, 55–100.
Weisbach, M., 1988. Outside directors and CEO turnover. Journal of Financial Economics 20, 431–460.
Yermack, D., 1996. Higher valuation of companies with a small board of directors. Journal of Financial
Economics 40, 185–212.
Zimmerman, J., 2002. Accounting for Decision Making and Control. Irwin/McGraw Hill Publishing
Company, New York, NY.
ARTICLE IN PRESSR. Bushman et al. / Journal of Accounting and Economics 37 (2004) 167–201 201