Finance
79
Solutions Guide for Case Studies in Finance Written by Dr. Michael J. Seiler Associate Professor of Finance Hawaii Pacific University
-
Upload
marwan-mikdady -
Category
Documents
-
view
146 -
download
5
description
Case studies in Finance. with solution manual
Transcript of Finance

Solutions Guide
for
Case Studies in Finance
Written by
Dr. Michael J. SeilerAssociate Professor of Finance
Hawaii Pacific University

Case 1Insider Trading
Purpose: This case discusses a new and potentially alarming trend in the area of illegal insider trading. The Internet is giving people a false sense of anonymity which does not discourage them from sharing private corporate information. This case also makes students aware of how easy it is becoming to gain access to illegal inside information and how to avoid breaking securities law when the information comes to them.
1. This question is not as straightforward as it may seem on the surface. But an acceptable definition is as follows: Information becomes public when a company representative officially makes an announcement via a major media.
2. Absolutely anyone can come into contact with inside information. You do not have to work for the firm to have private information. In fact, it seems that private information is often readily volunteered these days.
3. If someone conveys to you information that could be useful in making buy or sell decisions, that information would be illegal to trade upon. Private information only becomes illegal trading when (1) you actually trade on the information, or when (2) you convey the information to someone else and they trade on the information. No matter how long the chain of passing along information gets, if you are identified as one of the links in the chain, in the eyes of the court you are just a guilty as the one who eventually trades.
4. For some reason people think the Internet is a secure place to discuss secretive issues. Despite reports that your employer monitors your e-mail and Internet usage, and despite the fact that the persons responsible for sending out the “I love You” virus were tracked down on the other side of the world in a matter of days, people still think there is no way to learn of the Internet user’s identity.
5. If you come in contact with non-public information, the best thing to do is ignore it. You can’t help what you hear, but you can control what you do, or do not do, with the information.
2

Case 2The Tobacco Industry
Purpose: Everyone knows that ethics are a part of business decision making. In classroom discussions, students find the unethical hypothetical debate to be rather clear-cut. However, in the real world, when ethical decisions hurt one party to help another, there are no easy answers. This case centers around the tobacco industry's alleged increase in nicotine levels in cigarettes in an attempt to induce addiction amongst smokers. This case also addresses the government's role in regulating smoking in the work place.
Ethics questions are possibly the most difficult to answer. One must consider all sides of the argument and attempt to remain objective. Instead of stating my personal opinions, I will try to objectively present both sides of each argument.
1. Any time a consumer purchases a product he/she has a right to know the ingredients of the product. If tobacco companies alter nicotine levels (either with the intent to induce addiction or without) without notifying consumers, most people feel this would be extremely unethical.
2. As long as customers know what they are smoking, the practice of providing high or low nicotine cigarettes is generally deemed acceptable by most. The alcoholic beverage industry sells various types of beers based on the level of alcohol or the fullness of the beer, etc. Hence, it is reasonable to allow tobacco firms to market different strengths of cigarettes. Since nicotine is argued by the tobacco industry to be the source of flavor, cigarette manufacturers could easily justify the need for various nicotine levels.
3. Fine print warnings on the side of cigarette packs have been frowned upon because they are hard to notice and even harder to read. Most people do not read their product's container, although in the case of cigarettes, most people are fully aware of the inherent dangers of smoking.
4. Smokers will argue that they have a right to engage in an activity that does not affect others. Non-smokers will argue that smoking in not one such activity.
5. The government will never agree to help pay for the installation of ventilation systems for smokers. Therefore, a problem will most surely rise when small business owners argue that the smoking ban will adversely affect their business relative to other forms of ownership. This is a major problem because 90% of all firms are small businesses.
6. The result that small businesses (and large businesses to a lesser extent) will find employing smokers too costly will surely cause firms to prefer non-smokers over smokers, everything else constant. This is discrimination, pure and simple.
There is a difference, however, between unwarranted and warranted discrimination. Warranted discrimination is based on an economic or otherwise rational reason for preferring one type of worker over another. This is clearly a case of warranted
3

discrimination. As economically rational as it may be, law suits are sure to be a result of the ban.
4
Case 3Connect Cable Contractors
Purpose: This case allows students to work on the typical small business situation where no existing model or framework is available. That is, the student cannot just plug numbers into an existing formula. They must devise a plan themselves that will get the job done.
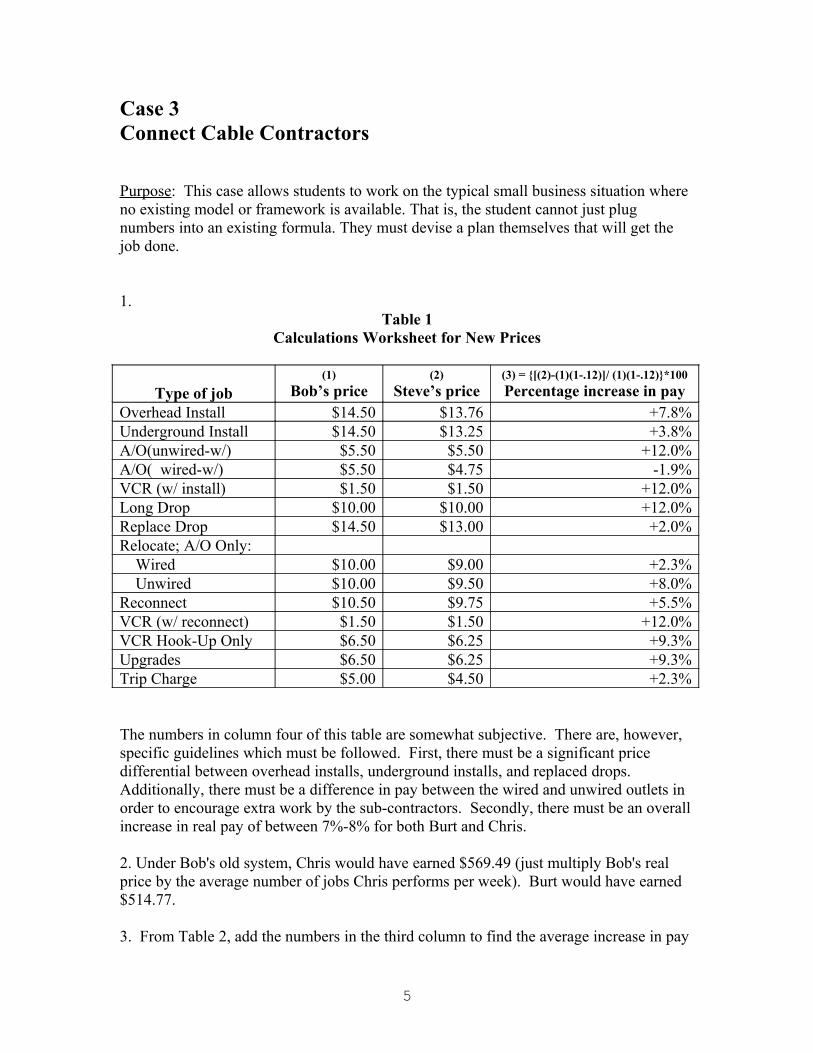
1.Table 1
Calculations Worksheet for New Prices
Type of job(1)
Bob’s price(2)
Steve’s price(3) = {[(2)-(1)(1-.12)]/ (1)(1-.12)}*100
Percentage increase in payOverhead Install $14.50 $13.76 +7.8%Underground Install $14.50 $13.25 +3.8%A/O(unwired-w/) $5.50 $5.50 +12.0%A/O( wired-w/) $5.50 $4.75 -1.9%VCR (w/ install) $1.50 $1.50 +12.0%Long Drop $10.00 $10.00 +12.0%Replace Drop $14.50 $13.00 +2.0%Relocate; A/O Only: Wired $10.00 $9.00 +2.3% Unwired $10.00 $9.50 +8.0%Reconnect $10.50 $9.75 +5.5%VCR (w/ reconnect) $1.50 $1.50 +12.0%VCR Hook-Up Only $6.50 $6.25 +9.3%Upgrades $6.50 $6.25 +9.3%Trip Charge $5.00 $4.50 +2.3%
The numbers in column four of this table are somewhat subjective. There are, however, specific guidelines which must be followed. First, there must be a significant price differential between overhead installs, underground installs, and replaced drops. Additionally, there must be a difference in pay between the wired and unwired outlets in order to encourage extra work by the sub-contractors. Secondly, there must be an overall increase in real pay of between 7%-8% for both Burt and Chris.
2. Under Bob's old system, Chris would have earned $569.49 (just multiply Bob's real price by the average number of jobs Chris performs per week). Burt would have earned $514.77.
3. From Table 2, add the numbers in the third column to find the average increase in pay
5

per week for Chris. Doing this yields an answer of $41.02. From Table 3, Burt's increase in pay per week under the new system would be $38.43.
Table 2Calculations Worksheet for Increases in Weekly Earnings
Under the New Pricing System for Chris
Type of jobAverage number ofeach job per week
Dollar increasein pay per job
Total dollar increaseIn pay per type of job
Overhead Install 8.1 $0.99 $8.02Underground Install 7.6 $0.49 $3.72A/O(unwired-w/) 18.5 $0.66 $12.21A/O( wired-w/) 9.9 -$0.09 -$0.89VCR (w/ install) 11.9 $0.18 $2.14Long Drop 3.7 $1.20 $4.44Replace Drop 0.9 $0.24 $0.22Relocate; A/O Only: Wired 0.8 $0.20 $0.16 Unwired 8.4 $0.70 $5.88Reconnect 7.2 $0.51 $3.67VCR (w/ reconnect) 3.8 $0.18 $0.68VCR Hook-Up Only 0.0 $0.53 $0.00Upgrades 1.0 $0.53 $0.53Trip Charge 2.4 $0.10 $0.24
Table 3Calculations Worksheet for Increases in Weekly Earnings
Under the New Pricing System for Burt
Type of jobAverage number ofeach job per week
Dollar increasein pay per job
Total dollar increaseIn pay per type of job
Overhead Install 11.8 $0.99 $11.68Underground Install 1.6 $0.49 $0.79A/O(unwired-w/) 17.6 $0.66 $11.62A/O( wired-w/) 11.6 -$0.09 -$1.04VCR (w/ install) 11.6 $0.18 $2.09Long Drop 4.6 $1.20 $5.52Replace Drop 2.8 $0.24 $0.68Relocate; A/O Only: Wired 0.4 $0.20 $0.08 Unwired 3.4 $0.70 $2.38Reconnect 6.8 $0.51 $3.47VCR (w/ reconnect) 2.8 $0.18 $0.51VCR Hook-Up Only 0.0 $0.53 $0.00
6

Upgrades 1.0 $0.53 $0.53Trip Charge 1.2 $0.10 $0.12
4. Multiplying the $41.02 by 52, results in a forecasted increase in pay per year for Chris of $2,133.04. Burt's annual increase in pay would be $2,000 ($38.43 times 52).
5. Since Chris had 19 of the 20 week's records, the analysis is almost as accurate as possible. Burt, on the other hand, only kept records for 5 out of 20 weeks, thus extrapolating those few weeks into predictions concerning the rest of the year may led to a low level of reliability.
6. By hiring more sub-contractors, each person would save money because they would not have to cover nearly as large of a geographic area. Also, since the contractors would not have to spend as much time traveling, they could opt to install more additional outlets and perform other additional jobs that in the past they would bypass due to time constraints imposed by the time windows.
If the work load for which Steve is responsible does not increase as additional workers are hired, it is probable that as the same sized pie is cut into more pieces, each worker will be earning less. Thus, the answer to this question depends on the relative strength of these two competing effects.
7. Only data dating back to January of this year has been used to perform the analysis because this is when the new time windows were invoked. Using data before this period would be good in that a larger sample of weeks would lead to more reliable results, everything else constant. The problem with using data prior to January is that since the windows have been in use, the number of jobs each sub-contractor performs has been greatly altered.
While it is clear that only post January data should be used, there still exist other biases in the numbers. For example, the data used in this study is for winter. While the cable industry is not extremely seasonal, there are fluctuations associated with people spending winters in the south.
8. The reason for asking this question is to provoke the students to generate suggestions instead of just responding to the suggestions made in the case. One of the reasons why Bob lost the contract was because his workers were not happy and this dissatisfaction showed in their work. Therefore, it is important that Steve ensures that the sub-contractors are paid fairly. Steve should, therefore, perform periodic analyses to see that each sub-contractor continues to make more than they did under Bob's contract and more importantly that they get the same percentage raise.
7

Case 4IBP
Purpose: The purpose of this case is to provide students with the practice of constructing a Balance Sheet.
IBP's Balance Sheet
Assets
Current Assets Cash and cash equivalents $ 27,254 Marketable securities 1,400 Accounts receivable 599,999 Inventories 405,418 Deferred income tax benefits 51,781 Prepaid expenses 10,983Total Current Assets 1,096,815
Property, plant, and equipment Land and improvements 106,492 Buildings and stockyards 544,711 Equipment 1,096,571 1,747,774Accumulated depreciation and amortization (843,937) 903,837Construction in progress 168,256
Net Property, plant, and equipment 1,072,093
Other assetsGoodwill 724,089Other 115,099Total other assets 839,096
Total Assets $3,008,096
8

Liabilities and Stockholder's Equity
Current Liabilities Accounts payable and accrued expenses $ 565,517 Notes payable to banks 140,967 Federal and State income taxes 152,122 deferred income taxes 1,818 other 5,388Total current liabilities 865,812
Total Long-term Obligations 575,522
Deferred credits and other liabilitiesdeferred income taxes 17,037other 148,811
Total deferred credits and other liabilities 165,848
Commitments and ContingenciesStockholders' Equity
Preferred stock 0Common stock, $.05 par value per share 4,750Additional paid-in capital 405,278Retained earnings 1,067,725Other (16,456)Treasury stock (60,383)
Total Stockholder's Equity 1,400,914
Total Liabilities and Stockholder's Equity $3,008,096
9

Case 5Chrysler
Purpose: The purpose of this case is to familiarize students with the calculations and interpretation of basic financial ratio analysis.
1. This year Last year LiquidityNet Working Capital $9,527 $8,321Current Ratio 1.48 1.44Quick Ratio (Acid Test) 1.26 1.26
ActivityInventory Turnover 9.29 11.32Average Age of Inventory .026 .031Average Collection Period 13.56 11.68Fixed Asset Turnover 4.22 4.72Total Asset Turnover .99 1.05
DebtDebt Ratio 80% 78%Times Interest Earned 4.47 7.22
ProfitabilityGross Profit Margin 22% 27%Net Profit Margin 3.9% 6.7%Return on Total Assets 3.8% 7.1%Return on Equity 18.9% 32.7%
2. Liquidity
Chrysler has lower than average liquidity ratios. Their inventory levels appear to be in line with industry standards, but their current assets are a bit too low relative to their liabilities.
ActivityChrysler's inventory and asset turnover ratios are much higher than the industry
average, which is good. This may be due in part to their fast collection period.
Debt The debt ratio seems to be right in line with industry figures, but the times interest
earned ratio is lower than average. Still, the number is high enough to relieve concern over Chrysler's ability to meet its debt obligations.
10

ProfitabilityGross and Net Profit Margins are slightly lower than average. Returns are lower
as well. But, the differences are small enough not to cause concern.
3. The answer to this question is much deeper than the knowledge that can be gained by performing a financial analysis. But, based on the analysis, Chrysler was not in any financial trouble nor were they out performing their competitors to the extent that attention should be drawn to them.
4. Kerkorian held a large stake in Chrysler's common stock. Whenever rumors surface that a company is undergoing a merger or acquisition, the stock price of that company tends to increase. It is possible that Kerkorian intended to sell his holdings of Chrysler and just wanted the stock's price to be higher when he did sell. Therefore, he could fake a buyout and sell his holdings at a higher price.
11

Case 6Moog
Purpose: The purpose of this case is to have students practice constructing the Consolidated Statement of Earnings.
MOOGConsolidated Statement of Earnings
Net Sales $704,378Cost of Sales $493,235Gross Profit $211,143
Research and Development $26,461 Selling, general and administrative $110,679 Interest $32,054 Other ($64)
Earnings Before Income Taxes $42,013Income Taxes $14,075Net Earnings $27,938Net Earnings Per Share Basic $2.13 Diluted $2.11
12

Case 7Kate Myers
Purpose: The time value of money is a fundamental concept that must be understood by all business students. This case emphasizes the important variables to consider when saving for a down payment on a house and shows how these variables should dictate the actions of an individual.
1. Let, PV = $98,000,n = 8 years,i = 4%.
Solving for future value via a calculator yields $134,119.77. 20% of this amount is Kate's required down payment.
($134,119.77)(.20) = $26,823.95.
2. Let, FV = $26,823.95, the answer from question 1,i = .6666% (8%/12), the monthly return from the Merrill Lynch account,n = 96, (8*12), 8 years times 12 payments per year.
Solving for payment yields an answer of $200.38 per month.
3. This is the same procedure as question 2 with the exception that the compounding frequency has changed.
Let,FV = $26,823.95, the answer from question 1,i = 8%, the annual return from the Merrill Lynch account,n = 8, 8 years of payments.
Solving for payment yields an answer of $2,521.85 per year. This amount is greater than 12 times the monthly payment because when Kate deposits funds at the end of each month, those funds are earning interest throughout the year, while funds deposited only at year's end are not accumulating interest.
For example, (12)($200.38) = $2,404.50.
$2,521.85 - $2,404.50 = $117.35. This additional amount represents the interest that the eleven $200.38 deposits would accrue throughout the year.
4-5. A table will better represent the sensitivity analysis performed in questions 4 and 5.
13

The calculations are the same as those from question 2.
Home
AppreciationReturn on Merrill
Lynch accountEnd-of-Month
Required Deposit2% 4% $203.372% 8% $171.552% 12% $143.59
4% 4% $237.554% 8% $200.384% 12% $167.73
6% 4% $276.656% 8% $233.366% 12% $195.34
This sensitivity analysis clearly demonstrates the relationship among the three
variables. (1) The more Lakewood home prices appreciate, the more Kate will have to raise to make a down payment in the future. (2) The greater the return on her Merrill Lynch account, the lower the monthly deposit required.
14

Case 8Quilici Family
Purpose: The time value of money is a fundamental concept that must be understood by all business students. This case emphasizes the important variables to consider when saving up for a child's education and shows how these variables should dictate the actions of an individual striving to achieve this goal.
1. A simple future value calculation is necessary to determine the amount of tuition and living expenses per year when Brady is ready to attend.
StanfordTo find the future costs of tuition,Let,
n = 13,i = 5%,PV = $20,000.
Solve for FV. FV = $37,712.98
To find the future costs of living expenses,Let,
n = 13,i = 3%,PV = $6,000.
Solve for FV. FV = $8,811.20
Total Expenses = $37,712.98 + $8,811.20 = $46,524.18
UNCTo find the future costs of tuition,Let,
n = 13,i = 5%,PV = $2,500.
Solve for FV. FV = $4,714.12
To find the future costs of living expenses, the calculation is the same as above by assumption.Let,
15

n = 13,i = 3%,PV = $6,000.
Solve for FV. FV = $8,811.20
Total Expenses = $4,714.12 + $8,811.20 = $13,525.32
2. Stanford tuition
Year 1: $37,712.98 (1.05)0 = $37,712.98Year 2: $37,712.98 (1.05)1 = $39,598.63Year 3: $37,712.98 (1.05)2 = $41,578.56Year 4: $37,712.98 (1.05)3 = $43,657.49
living expensesYear 1: $8,811.20 (1.03)0 = $8,811.20Year 2: $8,811.20 (1.03)1 = $9,075.54Year 3: $8,811.20 (1.03)2 = $9,347.80Year 4: $8,811.20 (1.03)3 = $9,628.24
Total ExpensesYear 1: $37,712.98 + $8,811.20 = $46,524.18Year 2: $39,598.63 + $9,075.54 = $48,674.17Year 3: $41,578.56 + $9,347.80 = $50,926.36Year 4: $43,657.49 + $9,628.24 = $53,285.73
UNC
tuitionYear 1: $4,714.12 (1.05)0 = $4,714.12Year 2: $4,714.12 (1.05)1 = $4,949.83Year 3: $4,714.12 (1.05)2 = $5,197.32Year 4: $4,714.12 (1.05)3 = $5,457.18
living expensesYear 1: $8,811.20 (1.03)0 = $8,811.20Year 2: $8,811.20 (1.03)1 = $9,075.54Year 3: $8,811.20 (1.03)2 = $9,347.80Year 4: $8,811.20 (1.03)3 = $9,628.24
Total ExpensesYear 1: $4,714.12 + $8,811.20 = $13,525.32Year 2: $4,949.83 + $9,075.54 = $14,025.37
16

Year 3: $5,197.32 + $9,347.80 = $14,545.12Year 4: $5,457.18 + $9,628.24 = $15,085.42
3. To determine the monthly payment to cover college expenses, the present value (i.e. at the time Brady starts college) of the four year expenses must be calculated. Using the answers from question 2, combine both costs and find the present value keeping in mind that the stream of payments to Brady is a monthly annuity.
Stanford
Year 1 Year 2 Year 3 Year 4FV $46,524.18 $48,674.17 $50,926.36 $53,285.73i 1 1 1 1n 156 168 180 192PMT ??? $124.99 $112.65 $101.94 $92.57
Adding all four amounts yields: $432.15
UNC
Year 1 Year 2 Year 3 Year 4FV $13,525.32 $14,025.3
7$14,545.12 $15,085.42
i 1 1 1 1n 156 168 180 192PMT ??? $36.34 $32.46 $29.11 $26.21
adding all four amounts yields: $124.12
4. This is the same problem as number three with the exception that the interest rate is different. The only adjustment is in the interest rate used.
i = 10/12 = .833333333
Stanford
Year 1 Year 2 Year 3 Year 4FV $46,524.18 $48,674.17 $50,926.36 $53,285.73i .8333 .8333 .8333 .8333n 156 168 180 192PMT ??? $146.33 $133.79 $122.87 $113.27
17

Adding all four amounts yields: $516.26
UNC
Year 1 Year 2 Year 3 Year 4FV $13,525.32 $14,025.3
7$14,545.12 $15,085.42
i .8333 .8333 .8333 .8333n 156 168 180 192PMT ??? $42.54 $38.55 $35.09 $32.07
Adding all four amounts yields: $148.25
5. There is clearly a positive relationship between the amount the parents must invest and the increases in future tuition and living expenses.
18

Case 9WalMart
Purpose: The purpose of this case is to teach the student to calculate actual returns for an individual stock from past stock price and dividend data. The risk of the company will also be determined as proxied by the standard deviation. The student must then calculate the required rate of return on the stock to determine if the stock is over or under-valued.
1. To calculate the quarterly returns, the following formula should be used:
where,kt = return during period t,Pt = price of asset at time t,Pt-1 = price of asset at time t-1,Dt = dividends received throughout the quarter.
June 2002:($55.01 - $61.22 +$0.08) / $61.22 = -10.01%
March 2002:($61.22 - $57.41 +$0.08) / $57.41 = 7.25%
December 2001:($57.41 - $49.32 +$0.07) / $49.32 = 16.55%
September 2001:($49.32 - $48.54 +$0.07) / $48.54 = 1.75%
June 2001:($48.54 - $50.16 +$0.07) / $50.16 = -3.09%
March 2001:($50.16 - $52.69 +$0.07) / $52.69 = -4.67%
December 2000:($52.69 - $47.67 +$0.06) / $47.67 = 10.66%
2. The standard deviation is a measure of dispersion about a mean. In an investing context, it refers to a measure of total risk. To calculate the standard deviation, use any calculator or spreadsheet, such as Excel. The standard deviation is 9.36%.
P
D+P-P=k1-t
t1-ttt
19

3. Assuming Beta = 1.2; Rf = 5.25%; Rm = 12.2%, the required rate of return can be determined by employing CAPM.kj = Rf + [bj x (km - Rf)] = 5.25% + 1.2 (12.2% - 5.25%) = 5.25% + 8.34% = 13.59%
4. If WalMart had an expected rate of return of 14%, Marv should buy WalMart's stock because it is expected return an amount in excess of what is required based on its risk level. As long as WalMart is expected to return a rate of greater than 13.59%, Marv should buy the stock. In a perfectly efficient market, the expected return always equals the required rate of return.
5. The time period studied here is very short. Returns considered over such a short time period are not as reliable because the sample size is much too small. Furthermore, the economy goes in cycles. Therefore, while WalMart may have performed well or poorly in the short-run is not necessarily indicative of their long-run performance. A better performance time period would be over the last ten years or more. That way we would be able to observe how WalMart performed during both expansions and contractions in the economy.
20

Case 10Intel
Purpose: The purpose of this case is to teach the student to calculate actual returns for an individual stock from past stock price and dividend data. The risk of the company will also be determined as proxied by the standard deviation. The student must then calculate the required rate of return on the stock to determine if the stock is over or under-valued.
1. The expected return on a portfolio is equal to the weighted average of the return from each component in the portfolio. Mathematically,
Year 1 ( 6.2)(.20) + ( 0.1)(.35) + (-4.2)(.45) = - .62% 2 ( 7.8)(.20) + ( 2.8)(.35) + ( 6.6)(.45) = 5.51% 3 ( 6.9)(.20) + (-1.9)(.35) + (12.2)(.45) = 6.21% 4 (-4.1)(.20) + ( 2.9)(.35) + ( 7.8)(.45) = 3.71% 5 ( 8.9)(.20) + ( 7.7)(.35) + ( 4.3)(.45) = 6.41% 6 (10.2)(.20) + (15.1)(.35) + (-2.1)(.45) = 6.38% 7 (15.3)(.20) + (19.3)(.35) + ( 8.4)(.45) = 13.60% 8 ( 9.2)(.20) + (14.2)(.35) + (10.2)(.45) = 11.40%
2. With Intel included,
Year 1 (.714)(-0.62) + (.2857)( 4.8) = .93% 2 (.714)( 5.51) + (.2857)(10.2) = 6.85% 3 (.714)( 6.21) + (.2857)(11.3) = 7.66% 4 (.714)( 3.71) + (.2857)(18.1) = 7.83% 5 (.714)( 6.41) + (.2857)( 6.6) = 6.46% 6 (.714)( 6.38) + (.2857)(-1.8) = 4.04% 7 (.714)(13.60) + (.2857)( 2.7) = 10.48% 8 (.714)(11.40) + (.2857)(10.9) = 11.26%
3. The standard deviation of a portfolio is equal to the square root of: the sum of each term minus the average return quantity squared divided by n-1.Mathematically,
kw =k jj
n
j=1p Σ
21

The average return = 52.6/8 = 6.58%
The terms (xi - x)2, are generated as follows:(-.62 - 6.58)2 + (5.51 - 6.58)2 + ... + (11.4 - 6.58)2 = 133.94
[(133.94)/(8-1)]1/2 = 4.374% = σp
4. Using the same equation, the standard deviation with Intel included = 3.322% = σp
5. The beta of a portfolio is equal to the weighted average of the betas for each asset.
Without Intelbp = (.2)(.7) + (.35)(1.6) + (.45)(1.0) = 1.15
With Intelbp = (.714)(1.15) + (.286)(1.1) = 1.14
6. Beta tends not to be constant over time. For the eight year period under consideration, it would be unlikely that each firm's beta would be the same year after year. When betas vary, however, they do not normally jump around. Instead, there will normally be a gradual trend. For shorter periods of time, beta can be assumed to be stable.
7. Standard deviation is a measure of total risk, whereas beta is a measure of systematic risk. In portfolio theory, beta is the relevant measure because with proper diversification, all unsystematic risk can be removed. Therefore, investors are not compensated for taking unsystematic or diversifiable risk.
1-n
)k-k(=
2i
n
1=ik
Σσ
ii
n
= 1ip bw=b Σ
22

Case 11Amber Plank
Purpose: Interest rates affect everyone in the economy whether it be on an individual level or through the workplace. This case gives one such example to which all students can relate.
1. Default risk, liquidity, tax considerations, and time to maturity.
2. A Yield Curve shows the yield to maturity for similar (same risk, liquidity, and tax considerations) types of bonds, but with different times to maturity at a specific point in time.
3. The Expectations Hypothesis states that today's long-term rates are an average of future short-term rates. Therefore, if rates in the future are expected to increase, then today's yield curve will be upward sloping. Based on Table 1,
Time To Maturity
Today's Long-term Rates
FutureShort-term Rates
1 year 7.0% 7.0% (same)2 years 7.5% 8.0%3 years 8.0% 9.0%4 years 8.5% 10.0%5 years 8.6% 9.0%
Today's short-term rate is already given, so no calculation is needed.
To calculate the second year's short-term rate, solve the equation: (7 + x)/2 = 7.5%. Here x = 8%
To calculate the third year's short-term rate, solve the equation: (7 + 8 + x)/3 = 8.0%. Here x = 9%
To calculate the fourth year's short-term rate, solve the equation: (7 + 8 + 9 + x)/4 = 8.5%. Here x = 10%
To calculate the fifth year's short-term rate, solve the equation: (7 + 8 + 9 + 10 + x)/5 = 8.6%. Here x = 9%
4. The Liquidity Preference Hypothesis states that today's long-term rates are an average of future short-term rates PLUS a premium, or reward, for holding a less liquid asset. Exactly how much the premium amounts to is unknown. Moreover, the premium
23

changes over time. For this reason, each student will likely have a different set of future short-term interest rate forecasts. There should, however, be consistency between their answers to questions 3 and 4. The answers to question 4 should be lower than those for question 3 because the "liquidity premiums" need to be removed from all of the estimates. For example,
Time To Maturity
Today's Long-term Rates
FutureShort-term Rates
1 year 7.0% 7.0% (same)2 years 7.5% 8.0 – 0.25 = 7.75%3 years 8.0% 9.0 – 0.50 = 8.50%4 years 8.5% 10.0 – 0.75 = 9.25%5 years 8.6% 9.0 – 1.00 = 8.00%
5. The Market Segmentation Hypothesis states that Supply and Demand in different term to maturity markets are responsible for determining interest rates and these markets are separate from each other. For example, insurance companies invest primarily in long-term markets because of the maturity matches with their liabilities or pay-outs, whereas banks tend to invest short-term so as to match short-term deposits. Unfortunately, this hypothesis does little in the way of inferring future short-term rates from today's long-term rates.
24

Case 12Fruit of the Loom
Purpose: The purpose of this case is to introduce students to bond rating systems and to show them the effect it has on the corporation.
1. Pecking Order refers to the chain of priority that stakeholders in a company have on the company's assets. The order is as follows: senior debenture holders, junior debenture holders, preferred stockholders, and finally, common stockholders. This order represents which investor group has first through last claim when it comes to receiving coupon or dividend payments and even in the event of collecting in liquidation.
2. The 8.875% bonds received a downgrade because it effectively slipped down in the Pecking Order. This is important because these bondholders cannot receive coupon payments or the return of principle in the event of maturity or default until all of the other debt holders receive their money first. This lowers the probability that these bondholders will receive their promised payments which effectively increases the risk of the bonds. Higher risk translates into a lower bond rating.
3. As the case states, since this represents a mere shuffling within the pecking order, Fruit of the Loom's overall corporate credit rating remained at BB-. Therefore, it is unlikely that the stock price will be affected. Moreover, even if the overall company were to be downgraded, financial studies have shown that rating companies take time to make changes to corporate bond ratings. Therefore, by the time a rating change has been made, the change was already anticipated by the stock market, and therefore, its effect is already imbedded into the stock's price.
4. Capital structure and level of Earnings Per Share (EPS) will definitely affect a corporation's bond ratings. However, what the question did not include is the volatility in EPS. Firms with more stable earnings, like utility companies, can afford to take on more debt than firms in a less stable industry, like the technology sector, and still have the same bond rating. It is all a function of the probability of default.
25

Case 13Nations Bank
Purpose: The purpose of this case is to calculate a stock's price using its past dividends as an indicator of future dividend growth rates. The student must determine the stock's required rate of return (CAPM) and future expected dividend growth rate and use the Gordon Growth Model to calculate a current price.
1. The equation for CAPM is kj = Rf + [bj x (Rm - Rf)]
where,kj = required return on asset j,Rf = risk-free rate of return,bj = beta coefficient for asset j,Rm = market return.
kj = 6% + 1.75(10% - 6%)kj = 13%
2. The equation for the Gordon Growth Model is,
where, P0 = price of the common stock,D1 = per share dividend expected at the end of year 1,D0 = most recently paid dividend,Ks = required return on common stock,g = growth rate in dividends.
To calculate g, we have to assume that future dividend payments will grow at a constant rate into the future forever. This constant rate can be estimated by examining the average growth rate in the past. On a calculator,
Let,PV = $ .86,FV = $2.00,n = 8.
Solve for i. i = the average growth rate. In this case i = g = 11.13%.
g)-k(
g)+(1D=g)-k(
D=Ps
0
s
10
26

Plugging this growth rate into the Gordon Growth Model,
P0 = $2.00(1 + .1113) = $118.86.13 - .1113
3. This time,Let,
PV = $1.42,FV = $2.00,n = 5.
Solve for i. i = g = 7.09%.
Plugging this growth rate into the Gordon Growth Model,
P0 = $2.00(1 + .0709) = $36.24.13 - .0709
4. The Gordon Growth Model, or any other dividend based pricing model, has major drawbacks in that we are not sure what the true future growth rate in dividends is. As we have just demonstrated, depending on the period we consider, the stock's price can fluctuate wildly.
5. The required rate of return calculation has an enormous effect on the stock's price using these types of models. If we assume that Nations Bank's required rate of return on its common stock is 12% instead of 13%, the Gordon Growth Model will yield a price of
P0 = $2.00(1 + .0709) = $43.62.12 - .0709
This value is not much different, but consider the result when the growth rate in dividends is near the required rate of return on the common stock as is the case from 1987-1995.
P0 = $2.00(1 + .1113) = $255.47.12 - .1113
In general, the calculated stock price will be extremely sensitive to the required rate of return when the required rate of return is close to g.
6. This would be an example of a zero growth stock. The stream of payments would be constant (annuity) and they would last forever (perpetuity). When this special case occurs, a simplified equation can be used.
P0 = D1/Ks = $2.00/.13 = $15.38
27

7. The further out into the future the dividend payments are received, the less valuable they are in today's dollars. Using a dividend amount of $1.00 and a discount rate of .13, the present value of these three dividends are $.88, $.29, and $.000004922, respectively.
28

Case 14AMR - American Airlines
Purpose: The purpose of this case is to help the student to understand the behavior of bonds. For example, they will learn of the relationship between interest rates and time to maturity (TTM) and the sensitivity of a bond's price to TTM.
1. To calculate the price of the bond, use the equation:
where,B0 = value of the bond at time zero,I = annual bond coupon payment,I/2 = semi-annual bond coupon payment,PVIFAkd/2,2n = present value of the coupon payments,M = par value of bond,PVIFkd/2,2n = present value of par which will be received by the bondholder when
the bond matures.
Plugging into the equation,
B0 = $100/2 x 12.642 + $1,000 x .377= $632.10 + $377= $999.10 ≈ $1,000
Because this method of looking up values in a table suffers from rounding errors, the amount is slightly different from $1,000, but when a calculator is used, the answer is exactly $1,000.
Using a calculator, Let,
FV = $1,000,PMT = $50,i = 5% (10%/2 because we want the interest rate per period),n = 20 (10 years times 2 payments per year),
PV = ??? = $1,000
),P V I F(M+),P V I F A(2
I=B nknk0 dd 22 2/2/
29

When the maturity is increased to 20 and 30 years, the answers also come out to be $1,000.
2-4. The answers from questions 2 through 4 are better represented in a table. The calculation procedure is the same as that shown in question 1.
Interest ratesMaturity 8% 10% 12%10 years $1,135.90 $1,000 $885.3020 years $1,197.93 $1,000 $849.5430 years $1,226.23 $1,000 $838.39
5. As the time to maturity increases, the sensitivity of a bond's price to changes in interest rates increases. It is not actually the time to maturity that is driving the bond's sensitivity. It is the bond's duration. The longer a bond's duration, the more sensitive its price will be to changes in interest rates.
6. Whenever the current market interest rate equals the coupon rate, bonds will sell at par. The time to maturity will have nothing to do with the price of the bond in this very specific situation.
30

Case 15Mirage Resorts
Purpose: When interest rates decrease after the issuance of a corporate bond, the firm may find it advantageous to recall the issue and refund the old bonds with new bonds that have a lower coupon rate. The student is given information necessary for the refunding analysis. They must decide if and when the old issue should be refunded with a new issue.
1. Floatation Costs:$120,000 + [(.004 + .003)($40,000,000)] = $400,000
2. Initial Investment:
Floatation Costs $400,000
Overlapping interest before taxes (.11)(2/12)($40,000,000) $733,333minus taxes (.35)($733,333) $256,666after taxes $476,667
Call Premium before taxes ($1,110 - $1,000)(40,000 bonds) $4,400,00
0minus taxes (.35)($4,400,000) $1,540,00
0after taxes $2,860,000
Unamortized discount on old bond [(7/20)($40,000,000-$39,065,000)(.35)] ($114,538)
Unamortized floatation cost of old bond [(7/20)($200,000)(.35)] ($24,500)
Initial Investment $3,597,629
3. Annual cash flows from the old issue:
Interest costs before taxes (.11)($40,000,000) $4,400,00
31

0minus taxes ($4,400,000)(.35) $1,400,00
0after taxes $3,000,000
Tax savings from amortization of F.C. [($200,000)/(20)] x (.35) ($16,363)
Tax savings from amortization of discount [($935,000)/(20)] x (.35) ($3,500)
Total annual after tax cash flow $2,980,137
4. Annual cash flows from the new issue:
Interest costs before taxes (.085)($40,000,000) $3,400,00
0minus taxes ($3,400,000)(.35) $1,190,00
0after taxes $2,210,000
Tax savings from amortization of F.C. [($400,000)/(13)] x (.35) ($10,769)
Total annual after tax cash flow $2,199,231
5. Annual cash flow savings:
$2,980,137 - $2,199,231 = $780,906
6. Present value of annual cash flow savings:
($780,906 ) x PVIFAk=6%,n=13
($780,906 ) x 8.853 = $6,913,361
7. Mirage Resorts should refund the bond issue because the present value of the savings exceeds the costs involved with issuing the new bonds.
$6,913,361 - $3,597,628 = $3,315,733
8. Interest rates, in general, have decreased over this seven year period. Therefore, it
32

makes sense that new bond issues can have lower coupon rates, everything else constant. Mirage is wise to invest in new hotels/projects independent of current interest rates because a firm cannot just stop investing because they feel interest rates are too high. Interest rates are somewhat unpredictable, especially the further out in time you try to predict them.
9. There are several factors that affect the refunding decision. The movement in the interest rates is likely the most important. A small change in interest rates causes a large change in the annual cash flow from a new issue. Also, the after-tax cost of debt (which is used to calculate the present value of the annual cash flows) is extremely critical. Try assuming the after-tax cost of debt is only 5% and you will see that the present value of the savings has increased to $7,335,831. Finally, the floatation costs, both fixed and variable, will affect the refunding decision. The greater the floatation costs, the less likely the firm will be to refund the old issue.
33

Case 16eBay
Purpose: The degree of efficiency in the stock market is an area of debate that has gone on for as long as the stock market has been open. Assumed knowledge of inefficiencies are the building blocks on which some investors base their entire trading strategies. No single study or a single case will ever resolve this issue. However, this case provides an account of events that will invoke plenty of discussion amongst students concerning the degree of market efficiency.
1. The fact that the first public announcement of a relevant piece of information caused an immediate and non-over reacting effect in a stock's price is consistent with an efficient market.
2. Either (1) no investors were aware of the crash until the public announcement at 12:01 P.M. or (2) investors did not anticipate that the reaction would be enough to make selling or short selling stocks worth while. That is, the profit derived from such actions would not exceed transaction costs.
If no investors were aware of the crash until it was publicly announced at 12:01 P.M., then there is no way they could have reacted to the news. The fact that millions of people use the site each day coupled with the fact that it was down for four hours before the stock price reacted makes this explanation extremely difficult to believe.
If the second explanation was the case, why would investors not fully anticipate the adverse affect this would have on eBay's stock price? One possible explanation is that web sites do go down from time to time. In addition to being normal, when an outage does occur, the eBay backup system is supposed to work within two or three hours, not right away. Maybe investors felt the site would be up and running again very soon. This explanation is weak as well.
If you are a person who still holds on to the notion that the Semi-Strong form of the Efficient Market Hypothesis (EMH) holds all the time, ask yourself this question, "If the Dow Jones NewsWire reported the crash 15 minutes earlier or 15 minutes later, would the announcement effect have been any different?" No one can say with 100% certainty, but we have to believe that it wasn't the 12:01 P.M. that made the stock price drop so immediately, but instead it was the fact that the announcement was made over the Dow Jones NewsWire.
3. Any person who was aware of the eBay web site crash before 12:01 P.M. and who anticipated that this news would result in a severe drop in eBay's stock price could have avoided losing money by selling their shares in eBay or could have made money in the stock market by short selling shares of eBay's common stock.
34

Case 17Aether Systems
Purpose: The purpose of this case is to have students work through the Variable Growth Model. Along the way, they will have to use the Gordon Growth Model. An additional wrinkle is thrown in here. The stream of dividends will not start right way.
1. Starting with the dividend of $2.50, simply multiply by (1 + i)n
t = 10 $2.50(1.09)0 = $2.50t = 11 $2.50(1.09)1 = $2.73t = 12 $2.50(1.09)2 = $2.97t = 13 $2.50(1.09)3 = $3.24t = 14 $2.50(1.09)4 = $3.53t = 15 $2.50(1.09)5 = $3.85
2. $3.85(1.04)/(.13-.04) = $44.45. This represents the present value equivalent at time t = 15 of all the dividends starting at time t = 16 and going through to infinity.
3. Discounting all 6 amounts, then adding them together yields a (t = 0) stock price of $11.17.
$2.50 /(1.13)10 = $0.74$2.73 /(1.13)11 = $0.71$2.97 /(1.13)12 = $0.69$3.24 /(1.13)13 = $0.66$3.53 /(1.13)14 = $0.64$3.85 /(1.13)15 = $0.62$44.45/(1.13)15 = $7.11 $11.17
4. Since the intrinsic value of $11.17 is greater than the market price of $10, this represents a buy signal. Shares should be purchased up until the point where the present value of the dividends is exactly equal to the trading price of the stock.
35

Case 18NetJ.com
Purpose: This solution reflects the environment that existed when the case was originally written. This case addresses a growing, and to many, alarming trend in the U.S. stock market. Many corporations today are considered “ghost firms” who command a high stock price, but deliver nothing in return.
1. There have been a number of firms that have gone public based on the promise of future success. The Internet is the primary launching pad for such companies. While the World Wide Web has been around for years, it wasn’t until recently that its potential uses have been recognized.
Companies being created in this industry have convinced investors that they can be successful in a short period of time. More importantly, they have convinced investors that they have an immediate need for cash in order to be successful.
Every investor would like to own the next McDonalds, WalMart or MicroSoft before everyone else in the market identifies it as a star. As such, investors are willing to buy up the newcomers hoping that somewhere in the basket of firms will be the golden egg.
2. The answer to this question extends the answer from the first. The price of any asset is the present value of all future benefits the asset generates. It is not the current earnings that are attracting investors. It is the potential to generate earnings in the future.
3. While there certainly are drawbacks to merging with this type of firm, the primary benefit is avoiding the extremely lengthy and expensive IPO process. If a private firm can circumvent the process, it can achieve all the benefits of going public, while mitigating many of the disadvantages.
4. The answer to this question is elusive to say the least. Many have argued that we are resting on the largest bubble ever. Others say the Internet has brought about profit potential never seen before by any market. As such, proponents argue the current price levels are justified by the continued economic expansion and prosperous times that lie ahead.
36

Case 19OTCBB
Purpose: This solution reflects the environment that existed when the case was originally written. The purpose of this case is to introduce students to some of the risk factors to consider when investing in one type of market versus another. It is not only the asset class that matters. It is also the market in which each asset trades that matters.
1. Investors have enjoyed such a tremendous run-up in stock prices in recent years that many think they can do no wrong. Investors understand the concept of the risk-return tradeoff, but have not experienced its downward bite for several years now. For this reason, many investors view high-risk companies as high-return companies. Instead they should remember that high-risk companies have the potential for extremely low and even negative returns as well. Therefore, riskier is definitely not necessarily better.
2. Many would argue that if investors wish to trade in the OTCBB market for any reason, Datek might as well be the firm to offer the brokerage service. If they don’t someone else will. Others will argue on the side of ethics and say that if one market was found to be inferior to another, then a brokerage firm should not offer the sale of those stocks.
3. This question dates back to the Great Depression. In 1933, the Securities and Exchange Commission (SEC) was created to ensure full disclosure of relevant company information to the public. While the SEC still has regulatory control over the OTCBB market (For example, it could halt trading, it oversees illegal insider trading, etc.), OTCBB stocks certainly do not enjoy the same level of market efficiency that the NASDAQ and organized exchanges do.
4. If we assume that Matt wishes to invest in highly speculative stocks, there are still plenty of high risk/expected return opportunities available in other markets. This is not to say that Matt should not invest in OTCBB stocks, only that he must seriously consider the extensive limitation of such a market compared to other markets in which he could invest.
37

Case 20Pittston
Purpose: This solution reflects the environment that existed when the case was originally written. This case introduces students to an increasingly popular way firms are accessing the hot IPO market. It also addresses several managerial compensation and conflict of interest concerns that arise.
1. The fundamentals of financial valuation would state that since the management of the two has remained completely the same, none of the merger/divestiture reasons should apply here. While it may be a stretch, it could be argued that the introduction of new stockholders might increase monitoring and therefore reduce the potential for agency costs.
Perhaps we need look no further than the psychology of market participants. Many would argue that we are currently experiencing an irrational stock market bubble. If this is correct, firms are exploiting it wisely by representing their “bubble” divisions separately from the rest of their firm, which is rationally priced. As such, the rational parent price plus the irrational tracking division price sum to an amount greater than the price of the two when trading under one ticker symbol.
2. The reason why there are so many more tracking stocks in the technology sector is likely due to the fact that this is where most firms believe the “bubbles” exist. Firms, or divisions, in this sector do not have to show any success today to have an astronomically high stock price. So if investors are willing to pay higher prices for operations in this industry, firms should feel free to accept them.
3. It should not take a market slowdown to attract the attention of the potentially severe drawbacks associated with tracking stocks. Yet, it is human nature to let the good times roll when things are going well. Like any problem, it will not go away by ignoring it. Instead, it will probably get worse because the tracking stock trend is on the rise.
4. The board should maximize the value of both stocks since their position is designated as such. Of course, the concept of “agency cost” would not exist if management acted in accordance with what they were hired to do…maximize the firm’s value as opposed to their own.
5. This is a question that requires a very involved answer. While future research in the area of financial management will certainly provide a better, more complete answer, the short answer today might include making sure management has the same percentage or absolute ownership in both stocks. There will also likely have to be established some legal boundaries on the allocation of the conglomerate’s corporate resources between the parent and the tracking division. These are just a few of the issues to consider.
38

Case 21Vanguard
Purpose: This case discusses the too often swept under the rug problems associated with index mutual fund investing. In most classes, students are explained the concept of index investing, but are never told of the tax related dangers.
1. While I understand Vanguard’s desire to maintain the fund’s objective, it is unacceptable to manage their portfolio with a complete disregard for the tax ramifications it will have on their clients.
The problem is that mutual funds report performance based on pre-tax total returns. For this reason, they are not affected when their clients are stuck with a huge tax bill. They simply blame it on small investor sentiment and move on.
2 & 3. There is an old adage on Wall Street that says, “If you want to know what to do, do the exact opposite of what the small investor does.” Stated another way, money chases performance, it does not drive it.
Small investors are known for jumping on the bandwagon – usually long after it is a good idea to do so. By the time the market makes a large enough run up to catch sufficient media attention, it is usually time for a correction. This is when the uninformed investor gets in.
The problem with being a disciplined mutual fund investor is that the people whose funds have been pooled with yours are typically very poor market timing decision makers. This affects you because in bad times, they will pull all their money out, the fund will be forced to sell off shares, and you will be left with a huge tax bill.
4. This is a tough problem to correct. Let’s illustrate through an example. Assume a mutual fund buys General Motors (GM) for $20 per share. They hold the stock for 40 years and eventually have to sell it for liquidity purposes. At that time, the stock is trading for $300. The tax basis is only $20, so the realized capital gain is $280 ($300 - $20). Logically, that amount should be pro rated and allocated to each investor who owned shares in the mutual fund during the 40 years. However, this does not work from a practical perspective.
How will the mutual fund locate the investor who bought 38 years ago and sold all her shares 35 years ago? Where will they mail the notice? Has the person passed away in the last 35 years? If so, does their estate now owe the taxes?
Now consider you are that old investor. You are now 95 years old living on a fixed and extremely tight budget. Will you have the money to pay a tax bill on an investment you owned 35 years ago? Will you ever remember even owning the mutual fund?
Since there is no reasonable way to locate many of the historical investors and because it would seem unreasonable to ask them to pay ancient tax bills even if you could find them, this is not how taxes are determined. Instead, they are spread out over the current mutual fund shareholders. The implicit argument being made is that the fund is
39

using new money over time to purchase new shares. Moreover, you, the new investor, will likely cash out before those issues are ever sold. So, in a way, you are in turn sticking the tax burden to the next generation of investors. The idea is that it will all balance out in the long run.
Unfortunately, for you in the short run, events like drops in the stock market cause investors to panic and pull out funds. This sticks you with an unfairly high portion of the historical tax bill. In short, no system is perfect.
5. The Simpsons have a long term buy and hold strategy. Since the mutual fund and the investors within the fund are messing up the profitability of their strategy, they should seriously consider investing their money directly into stocks.
Presumably, their portfolio value is large enough to create a well-diversified portfolio on their own. As such, they can sell off the shares and use the proceeds accordingly. Another option is to maintain their Vanguard account and devote new money strictly to purchasing individual shares.
40

Case 22Florida Power & Light
Purpose: At some point in time, firms will be faced with the decision to either replace or fix up a piece of machinery, a building, or any other physical asset. This case makes the student consider the cost and intangible advantages and disadvantages associated with the two alternatives.
1. Alternative 1
Initial investment Cost of asset $80,00
0 Installation costs $5,00
0Total cost of installation $85,000Change in net working capital $20,000Total Initial Investment $105,000
Alternative 2
Initial investment Cost of asset $100,000 Installation costs $5,000Total cost of installation $105,000 Proceeds from sale of old asset ($10,000
) Tax on sale of asset $4,000Total after-tax proceeds ($6,000)Change in net working capital $15,000Total Initial Investment $114,000
2. Net after-tax cash flows: All cash flows are in units of $1,000.
Alternative 1
YearNet increase
in profits Depreciation
Taxable increase in
profitsNet profit
before taxesOperating net
cash flows1 $650 $16.0 $634.0 $253.6 $396.4
41

2 $425 $25.6 $399.4 $159.8 $265.23 $317 $15.2 $301.8 $120.7 $196.34 $220 $9.6 $210.4 $84.2 $135.85 $129 $9.6 $119.4 $47.8 $81.26 $0 $4.0 -$4.0 -$1.6 $1.6
Alternative 2
YearNet increase
in profits Depreciation
Taxable increase in
profitsNet profit
before taxesOperating net
cash flows1 $350 $20 $330 $132.0 $218.02 $350 $32 $318 $127.2 $222.83 $350 $19 $331 $132.4 $217.64 $350 $12 $338 $135.2 $214.85 $350 $12 $338 $135.2 $214.86 $0 $5 -$5 -$2.0 $2.0
3. Alternative 1
Proceeds from sale of asset $5,000 Taxes on sale ($2,000
)After-tax proceeds $3,000Change in net working capital $20,000Additional year 5 cash flow $23,000
Alternative 2
Proceeds from sale of asset $10,000 Taxes on sale ($4,000
)After-tax proceeds $6,000Change in net working capital $15,000Additional year 5 cash flow $21,000
4. The present value of each cash flow is found by discounting each future cash flow at 10%. The stream of cash flows for each project is:
Alternative 1
42

Year Net cash flow0 ($105,000)1 $396,4002 $265,2403 $196,2804 $135,8405 $81,240 + $23,0006 $1,600
The net present value of this stream at 10% is $780,446.86.
Alternative 2
Year Net cash flow0 ($114,000)1 $218,0002 $222,8003 $217,6004 $214,8005 $214,800 + $21,0006 $2,000
The net present value of this stream at 10% is $726,053.64.
Since the NPV of alternative 1 is higher than the NPV of alternative 2, Paul should chose to renew the existing reactimeter instead of replacing it with a new one.
5. Many computer experts would argue that a new computer which is built for expanded memory is better than an old computer that has been expanded. A bigger issue to consider is the fact that our analysis is based on numerous assumptions. For example, we are assuming that five years from now we will be able to sell the renewed or new reactimeter for $5,000 and $10,000, respectively. Since these two amounts are so far off into the future, how certain are we?
Another example is our estimates concerning the increase in profitability for both alternatives. If any of these very large amounts are wrong, our decision may change. The further out into the future we try to predict, the less accurate we will be.
6. The NPV's of the two alternatives are only separated by $54,393.22. While this sounds like a large difference, when we consider the magnitude of the cash flows, it really is not. With such a small amount separating the two choices, Paul is more likely to allow the qualitative issues to weigh on his decision.
43

Case 23Southwest Airlines
Purpose: This basic case requires that the student calculate the payback period, the internal rate of return, the modified internal rate of return, and the net present value of a proposed project. The student must chose to either accept or reject the project based on the above criteria which will conflict. They therefore must also decide which criteria has priority over the others.
NPV = -$2,637,560
NPV is the present value of all future net cash flows associated with a project minus the initial investment. If the NPV is greater than 0, the firm will increase its value by accepting the project. In this case, the NPV is negative which means that if the firm accepts the project, the overall value of Southwest will decrease by $2.637 million.
2. The IRR is the discount rate that makes the present value of the future net cash flows equal to the initial investment. The calculated solution is 4.77%. This measure differs from the NPV methods in two major ways. First, IRR is a percentage, while NPV is a dollar amount. Managers often prefer to think in terms of percentages instead of absolute dollars. Second, IRR assumes that when the cash flows are received year after year, they can be reinvested at the IRR. The NPV method assumes these intermediate cash flows can be reinvested at the discount rate.
3. The Payback Period is the number of years it takes to recoup the project's initial investment.
PP = 4 years + 0.9/2.1PP = 4.43 years
4. Since the project's payback period is less than the 5 year maximum, based on PP, the project should be accepted. However, because the calculated IRR is below the hurdle rate, the IRR criterion indicates that the project should not be accepted. Finally, the NPV of the project is negative. Therefore, based on NPV, it should not be accepted. When the criteria conflict, the NPV should be most trusted - followed by the IRR, then PP.
5. Conflicts between the PP and either NPV or IRR can occur at any time. This is because PP suffers from three mathematical flaws. It does not consider the timing of the cash flows, the time value of money, and any cash flows beyond the payback period.
1. )(1.1
$0.5+
)(1.1
$1.3+
)(1.1
$2.1+...+
)(1.1
$6.3+
)(1.1
$4.5+-$20.8=NPV
76521
44

Both IRR and NPV take into consideration these concepts. However, IRR may lead to the wrong accept/reject decision if the projects under consideration are mutually exclusive and if any of the future net cash flows are negative or if the magnitude of the cash flows from one project are greatly different from the magnitude of the cash flows from other projects.
6. MIRR is similar to IRR in that it expresses a project's attractiveness in terms of a percentage. The difference is that like the NPV, MIRR assumes that the project's intermediate cash flows are re-invested at the discount rate. This assumption is methodologically preferred. MIRR is found by taking the future value of each intermediate cash flow to a terminal point (the last year of the project). It compounds based on the discount rate as shown below.
Year Net Cash flow
Future Value of Net Cash flow
0 -$20.81 $4.5 $7.97 (n=6, i=10%)2 $6.3 $10.15 (n=5, i=10%)3 $5.2 $7.61 (n=4, i=10%)4 $3.9 $5.19 (n=3, i=10%)5 $2.1 $2.54 (n=2, i=10%)6 $1.3 $1.43 (n=1, i=10%)7 $0.5 $.050 (n=0, i=10%)
Sum = $35.59
Plugging into a calculator, Let,
FV = $35.39,PV = -$20.8,n = 7.
Solve for i. i = 7.98%. This is the project's MIRR.
7. With normal cash flows, the MIRR will always fall between the discount rate and the IRR. Why? When the IRR is below the discount rate, MIRR assumes the intermediate cash flows are returning a higher amount (discount rate) than the IRR. Conversely, when the IRR exceeds the discount rate, IRR is actually over estimating the true yield. MIRR maintains that the IRR is too high and assumes that the intermediate cash flows are returning a level only equal to the discount rate.
45

Case 24Acclaim Entertainment
Purpose: This case considers a firm's decision to accept or reject multiple proposed projects. Both independent and mutually exclusive projects will be considered. Further, the projects will have unequal lives. Therefore, it is necessary to understand the concept of annualized net present value.
1. Payback Period is defined as the time required to recover a project’s initial investment.
SCEPP = 1 + $6,000/$10,000 = 1.60 years
NintendoPP = $40,000/$44,000 = .91 years
Sega
PP = $40,000/$41,000 = .98 years
Assuming a required payback period of 1 year, Nintendo would be the preferred carrier of Mortal Combat since it has the shortest PP – less than 1 year.
2. NPV is defined as the present value of all future net cash flows minus the initial investment. When the NPV is greater than 0, investing in the project will add value to the firm. Mathematically,
Where CFt is the net cash flow during the given year and k is the appropriate discount rate. Using a discount rate of 10%,
SCENPV = $3,613
NintendoNPV = $13,223
..I- I)k+( 1
C F=N P Vt
tn
= 1tΣ
46

SegaNPV = $15,154
Based on NPV, Mortal Combat should be sold through the Sega system because the NPV under Sega is the greatest amount.
3. Internal Rate of Return (IRR) is the discount rate that forces the NPV to equal zero. The higher IRR, the better. If the IRR exceeds the company's hurdle rate, the project should be accepted. IRR can be solved through trial and error, by using an approximation formula, or via a calculator. The calculator provides the most accurate answer. Therefore, the following solutions were obtained from a financial calculator.
SCEIRR = 17.04%
Nintendo IRR = 38.82%
SegaIRR = 39.80%
Based on IRR, all three have acceptable IRRs. The highest is Sega.
4. With mutually exclusive projects, only zero or one project can be chosen. With independent projects, any number of projects can be selected. In this case Acclaim could sell through none, one, two, or all three companies. Based on the payback period criterion, Nintendo and Sega would be chosen because both have payback periods under the required 1 year maximum while SCE does not.
Based on NPV, all three carriers would be used since they all have a positive NPV. Similarly, all three marketers have an IRR in excess of Acclaim's hurdle rate of 10%.
5. Since the life of Mortal Combat is projected to be different under each of the three hardware systems, the traditional NPV measure will possibly lead to the wrong accept/reject decision. Instead, the Annualized Net Present Value (ANPV) measure should be used. ANPV is calculated by dividing the NPV by the present value interest factor of an annuity at a given discount rate and for a given number of years (i.e. the life of the project). Mathematically,
SCEANPV = NPV/PVIFAk=10%;n=4
= $3,613/3.170 = $1,140
)PVIFA(NPV
=ANPVnk,
47

NintendoANPV = NPV/PVIFAk=10%;n=2
= $13,223/1.736 = $7,617
SegaANPV = NPV/PVIFAk=10%;n=3 = $15,154/2.487 = $6,093
Based on ANPV, the decision has changed. It is now clear that Nintendo is the hardware company through which Acclaim should distribute Mortal Combat. Without considering this more appropriate measure, Acclaim would have lost money by choosing the wrong interactive hardware company (Sega).
48

Case 25Philip Morris
Purpose: This case considers a firm's decision to accept or reject multiple proposed projects. The projects in question are not of similar risk. Therefore, traditional net present value techniques cannot be used. Instead, the use of Risk Adjusted Discount Rates (RADRs) and Certainty Equivalents are necessary.
1. To calculate the NPV of the Gourmet Hazel Nut,
The NPV of the Post Blueberry Morning is
Since the projects are independent and both have a positive NPV, both projects should be accepted.
2. Using the RADR of 12%, the NPV of the Gourmet Hazel Nut,
With the more appropriate RADR, the Gourmet Hazel Nut is no longer a positive NPV project and should therefore be rejected.
3.
Year Net cash flowGourmet Hazel Nut
C.E. Certain cash flow
0 -$4,000,000 1.00 -$4,000,0001 $1,000,000 .80 $800,0002 $1,200,000 .70 $840,0003 $750,000 .60 $450,0004 $950,000 .50 $425,000
$47,534=)(1.10
$206,000...++
)(1.10
$1,000,000+0-$4,000,00=NPV
71
349,31$=)(1.10
$519,000+...+
)(1.10
$803,000+0-$2,500,00=NPV
71
$167,098=)(1.12
$206,000+...+
)(1.12
$1,000,000+0-$4,000,00=NPV
71−
49

5 $880,000 .40 $352,0006 $500,000 .30 $150,0007 $206,000 .20 $41,200
The NPV of the certain net cash flows is calculated by discounting these cash flows at the risk-free rate of 5%.
Year Net cash flow Post Blueberry Morning
C.E. Certain cash flow
0 -$2,500,000 1.00 -$2,500,0001 $803,000 .95 $762,8502 $521,000 .90 $468,9003 $235,000 .85 $199,7504 $400,000 .80 $320,0005 $498,000 .75 $373,5006 $612,000 .70 $428,4007 $519,000 .65 $337,350
NPV = -$2,500,000 + $762,850 +...+ $337,350 = $390,750
On a certainty equivalents basis, only Post Blueberry Morning has a positive NPV.
4. Certainty equivalents can be defined as the percentage of the cash flow in each period that the manager would be willing to accept if the amount was 100% certain. For example, the manager might be indifferent between receiving a somewhat uncertain $100 two years into the future or a certain $80 two years into the future.
5. Certainty equivalents adjust cash flows for risk and time separately. RADRs do not. They lump the adjustment in together. RADRs are easier to interpret conceptually, but can be less accurate.
1-$1,320,80=)(1.05
$41,200...++
)(1.05
$800,000+0-$4,000,00=NPV
71
50

Case 26Computerized Business Systems
Purpose: The purpose of this case is to find the weighted average cost of capital (WACC) for a firm. The WACC is an essential number to determine because it is the appropriate discount rate used in net present value (NPV) calculations for all similar-risk, equal-life projects.
1. The Cost of Preferred Stock:
where,kp = cost of preferred stock,Dp = annual preferred stock dividend,Np = net proceeds from the preferred stock issue.
here,Dp = $100 * 11% = $11.00Np = $95.50,
Therefore, kp = $11.00/$95.50 = 11.5%. Since preferred stock dividends are paid from after-tax earnings, this is the after-tax cost of preferred stock.
2. The Cost of Long-Term Debt: kd = cost of long-term debt. Two methods can be used to find kd.
(1) The first is the calculator method:Let,
PV = $970 ($1005 - $35)FV = $1,000PMT = $45 [($1,000 * 9%)/2)]N = 40 (20 * 2)
where,PV = Present Value (the amount the firm receives upon issuing the debt),FV = Future Value (the amount the firm returns to the bondholder when the bond
matures),PMT = Payment (this is the amount the bondholder receives at the end of every
six month period until the bond matures),N = number of periods in which a coupon payment was received.
After plugging these four variables into a financial calculator, solve for "i," the interest
N
D = k
p
pp
51

rate. Doing so will yield an answer of 4.667%. This is the interest rate on a semi-annual basis. To annualized it, simply multiply by two to yield a before tax cost of debt of 9.334%.
(2) The second method is to employ a formula such as the following and use financial tables to generate the answer:
PV = PMT(PVIFAk%,40) + FV(PVIFk%,40)
Here, PVIFAk%,40 is the present value interest factor of an annuity for 40 6-month periods at an interest for which we are trying to solve. PVIFk%,40 is the present value interest factor. This portion of the equation will convert the bond's par value from $1,000 20 years into the future to its present value equivalent. Under either method, the answer should be the same. One problem does arise, however, with the second method. Most financial tables do not list non-integer interest rates.
Coupon payments are deducted from corporate earnings before taxes are paid. Therefore, to find the after-tax cost of long-term debt, we must multiply Kd by (1-t), where t = the corporate tax rate.
ki = 9.334 * (1 - .40) = 5.6%.
3. Cost of Retained Earnings:Since the dividends in this case are expected to grow at a constant rate into the
future, the constant growth (Gordon Growth) model should be used.
where,kre = cost of retained earnings,D1 = next year's dividend,P0 = current price of the stock,g = growth rate in dividends,D0 = most recent dividend paid.
Funds from retained earnings have already been exposed to corporate taxes, so no adjustment is needed.
4. Cost of Common Stock:The same formula as was used in question 3, is used here, with one minor
alteration. When new common stock is issued, the full $68.25 is not received. After
g + P
g)+(1D = g + P
D = k0
0
0
1re
13.63% = .10 + 68.25
2.25(1.10) = k re
52

floatation costs, the company only receives $62.75. Plugging into the equation:
Again, no tax adjustment is needed.
5. The WACC can be defined by the following equation:
where,wa = weight of each type of fund,ka = after-tax cost of each type of fund.
To calculate the weights of each type of fund, simply divide each proportion by the sum of all the four sources.
Asset Class Market Value WeightLong-term Debt $33,400,000 / $92,400,000 = .36147Preferred Stock $7,000,000 / $92,400,000 = .07575Common Stock $42,000,000 / $92,400,000 = .45455Retained Earnings $10,000,000 / $92,400,000 = .10823
Applying the formula,
WACC = (.36147)(5.6%) + (.07575)(11.5%) + (.45455)(13.94%) + (.10823)(13.63%) = 10.71%
6. The same procedure is used again except now the weights will be slightly altered.
Asset Class Book Value WeightLong-term Debt $35,000,000 / $90,000,000 = .38888Preferred Stock $5,000,000 / $90,000,000 = .05555Common Stock $40,000,000 / $90,000,000 = .44444Retained Earnings $10,000,000 / $90,000,000 = .11111
So, WACC = (.38888)(5.6%)+(.05555)(11.5%)+(.44444)(13.94%)+(.11111)(13.63%)
13.94% = .10 + 62.75
2.25(1.10) = k n
kw + kw + kw + kw = kw=W A C C = k rrnnppiiaa
A
= 1aa ∑
53

WACC = 10.52%, using book values.
7. Using target ratios,WACC = (.35)(5.6%) + (.05)(11.5%) + (.40)(13.94%) + (.20)(13.63%)
WACC = 10.84%, using target ratios. The firm's target ratio will not be exactly maintained because when a firm goes to the financial markets to raise funds, they usually do so by issuing only one type of security. This choice is primarily a function of floatation costs.
8. In the industry, market weights are typically preferred because financial managers are concerned more with market values. Book values are usually preferred by the accounting department. Finally, target weights are more of an idealistic goal, but it is not attempted or expected to be the exact percentage of weight for each type of funds. The financial manager wants only to stay relatively close to the target weights over time.
9.
Using market weights:
NPV = $188.48. Therefore, the company should buy the CBS system. Yes, the discount rate makes a big difference. It will cause us to accept or reject the project depending on which rate we use. This is why we need to be as accurate as possible when calculating the WACC.
WACC NPV10.84% -$2,460.1810.71% $188.4810.52% $4,101.40
..II-k ) + ( 1
C F = N P Vt
tn
= 1t∑
)(1.1071
$10,000 + ... +
)(1.1071
$80,000 + $480,000- = NPV
111 10)1071.1(
000,80$+
54

Case 27McLeodUSA
Purpose: The goal of any firm is to maximize shareholder wealth. To do so, they must determine their optimal capital structure. This case is important not only because it gives students a chance to approach this very elusive optimization problem, but also because ALL firms must decide on the level of debt they will carry.
1.
DebtRatio
(1)Expected
EPS
(2)Standard Deviation
of EPS
(3) = (2)/(1)Coefficient of
Variation0% $0.38 $0.21 0.55
10% $0.43 $0.26 0.6020% $0.49 $0.33 0.6730% $0.55 $0.45 0.8240% $0.60 $0.62 1.0350% $0.52 $0.84 1.6260% $0.41 $1.08 2.63
2. The formula is stated as follows:
DebtRatio
(1)Expected
EPS
(2)Estimated
Required Return
(3) = (1)/(2)Estimated
Stock Price0% $0.38 10.3% $3.69
10% $0.43 10.6% $4.0620% $0.49 11.4% $4.3030% $0.55 12.2% $4.5140% $0.60 13.4% $4.4850% $0.52 16.7% $3.1160% $0.41 20.6% $1.99
k
EPS = P
s0
3. The Gordon Growth model for pricing stocks is as follows:
g + k
DPS = P
s0
55

In order for the two equations to be equal to each other, the following two conditions must hold:
EPS = DPS, andg = 0.
It is almost never the case that a firm will pay out all of its earnings in dividends. Certainly it is not possible in the long-run (which is the way these models value a stock - by finding the present value of all future dividends) to have a 100% payout ratio.
Concerning the g = 0 assumption, "g" refers to the growth rate in dividends. It is extremely unlikely that a company would never increase the dividend payment. Therefore, this model is an over-simplification of reality.
4. Based on the zero-growth valuation model, McLeod's optimal level of debt is 30% because this is the amount of debt that results in the greatest expected stock price.
5. Clearly the two models do not agree as to the optimum amount of debt that McLeod should employ. Although the goals of profit maximization and stock price maximization are highly positively correlated in the long-run, they certainly do not have to be in the short-run. There many ways managers can maximize short-term profits at the expense of long-run performance (and therefore stock price).
Since the goal of every corporation is to maximize stockholder wealth, achieving the highest stock price should be the focus of McLeod. A note of caution should be taken here, however, since we have just learned, from question 3, that this expected stock price estimation is not without its flaws.
56

Case 28Lancaster Colony
Purpose: The purpose of this case is to discuss the different dividend payment policy alternatives and how they might affect stockholders.
1. The Residual Theory of Dividends states that all available cash flow should be invested in projects with a positive net present value. Then any money left over should be paid out to stockholders in the form of a dividend so that no free cash flow (FCF) is left. Since we are not given an investment opportunity set in the case, it is not possible to say with 100% certainty that Lancaster is not following this policy. However, given the stable and steady increase in dividend payments, it is certainly unlikely to be the policy chosen by Lancaster.
2. A Constant Payout Ratio means the company will keep the ratio "DPS divided by EPS" at the exact same level each year. Table 1 shows that although the number has been consistent and stable over the last 5 years, it certainly is not the same. Moreover, there are several drawbacks associated with the Constant Payout Ratio policy and it is therefore not often used by firms.
3. The Fixed-Dollar or "Regular" dividend payment policy maintains that the firm would pay the exact same dollar amount every dividend payment period and would only increase the dividend payment when it was very certain that the new, higher dividend could be sustained in the long-run as subsequent dividend cuts send a severely negative signal to the market. In the case of Lancaster Colony, the dividend payment amount is clearly different each year so this policy is not being followed.
4. The Low-Regular-and-Extra Dividend policy holds that the firm will pay the same dollar dividend over the first three quarters (dividends in the US are typically paid every quarter, not just at year's end), then pay a fourth quarter dividend that is at least the same as, but likely higher than that paid for each of the first three quarters. The amount of the year end dividend is a function of how well the company has done during the year and also a function of their investment opportunity set in the near future.
Although the data given in the case does not breakdown dividend payments by quarter, it is very likely that Lancaster follows this policy coupled with the very conscience decision to ensure that the annual amount of dividends continues to increase each year. We can also safely assume that both the firm's investment opportunity set and how well they performed have also been taken into consideration given that their dividends do not always increase at the same rate or by the same dollar amount.
5-6. If Lancaster cut its dividend for the first time in 39 years, it would certainly send a negative signal to the market causing the stock price to drop. However, Lancaster could mitigate this reaction by coupling their dividend cut announcement with an explanation that the reason for the cut is to allow the company to earn an even greater rate of return
57

by investing in internal projects that are highly profitable. Even still, the investor base or investor composition might change from income seeking conservatives to more aggressive growth-oriented investors. This will cause extra volatility in Lancaster's stock as investors buy and sell their shares to transfer ownership.
58

Case 29Anheuser-Busch
Purpose: The Baumol Model is used to determine the optimal amount of cash a business should keep on hand to minimize the tradeoff between non-interest bearing cash and the opportunity costs associated with not having ample cash on hand.
1.
ECQ is used to minimize the costs associated with the tradeoff between keeping cash on hand (that does not earn interest) and making sure the firm does not have a liquidity problem.
2. $2,000,000/$37,796.45 = 52.92 times per year. In practice, Anheuser will round off and liquidate funds once a week.
3. $37,796.45/2 = $18,898.23. Again this assumes the cash will be used on a continuous and smooth basis. In practice, salary expenses typically cause cash outflows to be extremely lumpy.
4. The total cost associated with managing the funds is given by the following formula:
TC = (conversion costs)(# of conversions) + (opportunity costs)(average cash balance)
TC = ($25)(52.92) + (.07)($18,898.23)= $1,323.00 + $1,322.88= $2,645.88
You can be sure this is the minimum amount because the two components of the cost are equal. Stated another way, the TC equation will determine the minimum total costs by considering the tradeoff between keeping unproductive cash balances on hand and transaction costs associated with liquidating money market accounts.
5. Safety stock is very important because when a firm runs out of money, it cannot purchase inventory to produce its goods. It cannot pay its employees. It cannot meet its
form) malcosts(deciy opportunit
cash) for andcosts)(dem sion(2)(conver = ECQ
$37,796.45 = .07
,000,000)(2)(25)($2 = ECQ
59

debt payment obligations. For all these reasons, safety stock is added to the ECQ as a fudge factor or as a security against unexpected cash needs. The chosen level of safety stock for each firm is a function of the penalties associated with not being able to meet their financial obligations. The more severe the penalty, the more safety stock the firm should keep on hand.
60

Case 30Pepsi
Purpose: The cash conversion cycle measures the amount of time that a firm's cash is tied up and is therefore wasting company resources. Students will learn how to reduce the cash conversion cycle to save a firm money.
Let,AAI = Average Age of Inventory,ACP = Average Collection Period,APP = Average Payment Period,CCC = Cash Conversion Cycle,OC = Operating Cycle.
OC = AAI + ACP = APP + CCC
1. OC = AAI + ACP = 42 + 39 = 81 days
OC = 81 = APP + CCC = 29 + CCC CCC = 52 Days
Financing needs = (total annual outlays)/(365) x CCC = ($28,000,000)/(365) x 52 = $3,989,041
2. OC = AAI + ACP = 42 + 27 = 69 days
OC = 69 = APP + CCC = 29 + CCC CCC = 40 Days
Financing needs = (total annual outlays)/(365) x CCC
= ($28,000,000)/(365) x 40 = $3,068,493
3. To calculate the annual cost savings, we need to use the answers from questions 1 and 2. Pepsi is charged 12% for short-term funds. Therefore, to determine their annual cost to cover their CCC, simply multiply the answer from 1 and 2 by .12.
Old System $3,989,041 x .12 = $478,685
Bar Code System $3,068,493 x .12 = $368,219
Annual Savings = $478,685 - $368,219 = $110,466
61

4. The bar code system will cost $50,000 to implement. Therefore, it should be used because an additional profit of $60,466 ($110,466 - $50,000) will result.
5. Even if the bar code system did work out to be more expensive, we still have ignored the reduction in labor costs. These savings, while extremely difficult to estimate, will far exceed any additional cost of financing.
6. The cash conversion cycle is the amount of time the firm's cash is tied up. That is, the firm has paid for the goods, but has yet to receive payment for the goods. The lower the cash conversion cycle, the better because short-term funds cannot be used for otherwise productive resources. Cash conversion cycles are very different from industry to industry. Manufacturing firms tend to have longer cash conversion cycles because their average age of inventory tends to be much greater. Service firms, on the other hand, tend to have very short and even negative cash conversion cycles.
7. There are three ways to speed up the cash conversion cycle. A firm can increase its average payment period or decrease either its average collection period or its average age of inventory. In most cases, the production process is naturally as stream-lined as possible. Great strides can be made, however, by considering different terms of sales procedures for both accounts receivable and accounts payable.
62

Case 31Inn-Room Safe
Purpose: Firms have numerous options to consider when establishing their policy on accounts receivable. Should discounts be given to buyers who pay within 10 or 15 days? When should accounts be due even when no discount is offered? These questions are important to a business because if their terms of sale are favorable, buyers will buy through them. If the terms of sale are too favorable, they will be losing money by having their funds tied up at disadvantageous rates of return. This delicate tradeoff directly affects a firm's profit from operations.
1. Additional profit contribution from increased sales
([1.07 x 1,700] – 1,700) x ($234 - $157) = $9,163
2. Cost of marginal investment in accounts receivable Average investment under proposed plan:($157 x 1,819) / (360/14) = $11,106.01.
Average investment under proposed plan:($157 x 1,700) / (360/23) = $17,051.94
.12 x ($17,051.94 - $11,106.01) = $713.51
3. Cost of marginal bad debtsBad debt expense under new plan:
(.005 x $234 x 1,819) = $2,128.23(.008 x $234 x 1,700) = $3,182.40
$1,054.17
4. Cost of cash discount(.02 x .70 x $234 x 1,819) = ($5,959.04)
5. Net profit from implementation of proposed plan$9,163.00 + $713.51 + $1,054.17 - $5,959.04 = $4,971.64
6. Inn-Room should consider the fact that all of these forecasts about what conditions will be like under the newly proposed accounts receivable policy are just estimates. Inn-Room should take the calculations further and perform a sensitivity analysis to determine how much results might change if their estimates are off. It is important to recognize that
63

small changes in assumption inputs can result in large changes in the bottom line.
64
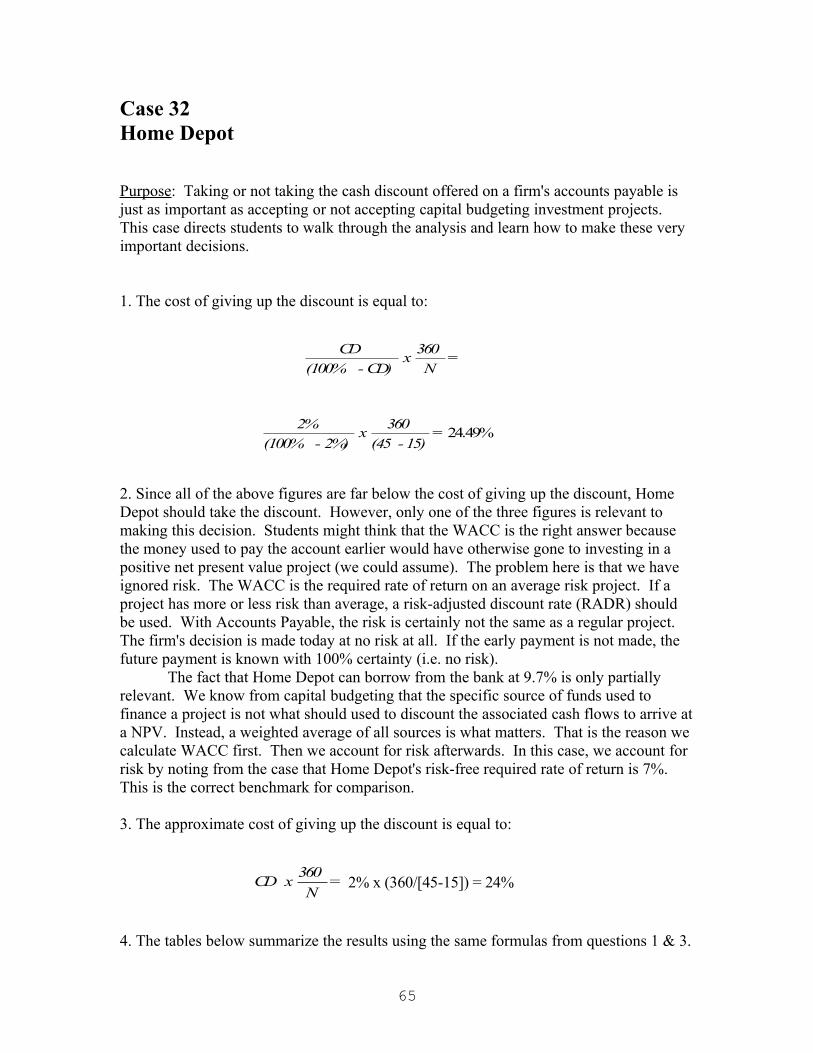
Case 32Home Depot
Purpose: Taking or not taking the cash discount offered on a firm's accounts payable is just as important as accepting or not accepting capital budgeting investment projects. This case directs students to walk through the analysis and learn how to make these very important decisions.
1. The cost of giving up the discount is equal to:
2. Since all of the above figures are far below the cost of giving up the discount, Home Depot should take the discount. However, only one of the three figures is relevant to making this decision. Students might think that the WACC is the right answer because the money used to pay the account earlier would have otherwise gone to investing in a positive net present value project (we could assume). The problem here is that we have ignored risk. The WACC is the required rate of return on an average risk project. If a project has more or less risk than average, a risk-adjusted discount rate (RADR) should be used. With Accounts Payable, the risk is certainly not the same as a regular project. The firm's decision is made today at no risk at all. If the early payment is not made, the future payment is known with 100% certainty (i.e. no risk).
The fact that Home Depot can borrow from the bank at 9.7% is only partially relevant. We know from capital budgeting that the specific source of funds used to finance a project is not what should used to discount the associated cash flows to arrive at a NPV. Instead, a weighted average of all sources is what matters. That is the reason we calculate WACC first. Then we account for risk afterwards. In this case, we account for risk by noting from the case that Home Depot's risk-free required rate of return is 7%. This is the correct benchmark for comparison.
3. The approximate cost of giving up the discount is equal to:
4. The tables below summarize the results using the same formulas from questions 1 & 3.
= N
360 x
CD) - (100%
CD
24.49% = 15)-(45
360 x
2%) - (100%
2%
= N
360 x CD 2% x (360/[45-15]) = 24%
65

ACTUAL Costs
1% 2% 3%30 days 24.24
%48.98
%74.23%
45 days 12.12%
24.49%
37.11%
60 days 8.08% 16.33%
24.74%
ESTIMATED Costs
1% 2% 3%30 days 24.00
%48.00
%72.00%
45 days 12.00%
24.00%
36.00%
60 days 8.00% 16.00%
24.00%
Approximation Method Error
1% 2% 3%30 days 0.24% 0.98% 2.23%45 days 0.12% 0.49% 1.11%60 days 0.08% 0.33% 0.74%
As can be seen from the table, the larger the cash discount, the greater the error
when using the approximation formula. Also, the fewer the number of days between the cash discount period and the total credit period, the less accurate the approximation formula.
66

Case 33Hasbro
Purpose: Leasing has become an extremely viable alternative to the traditional purchasing of machinery, buildings, and even land. All manufacturing firms have the opportunity to lease or buy some of their assets. This case will provide the information necessary for the student to determine which option is preferred for a given situation. The calculations for this type of decision are quite lengthy.
1. Each lease payment is deductible for tax purposes. Therefore, the after-tax cost can be calculated as
$7,000 x (1-.4) = $4,200.
During the last year, however, the company will purchase the machinery at a price of $6,000. The five year after-tax cash flows are shown in the table below.
Year After-tax Cash flow
1 $4,2002 $4,2003 $4,2004 $4,2005 $10,200
2. To find the amount of interest paid per year, a table is beneficial.
Year Payment BeginningBalance
Payment EndingBalancePrinciple Interest
1 $7,514 $30,000 $5,114 $2,400 $24,8862 $7,514 $24,886 $5,523 $1,991 $19,3633 $7,514 $19,363 $5,965 $1,549 $13,3984 $7,514 $13,398 $6,442 $1,072 $6,9565 $7,514 $6,956 $6,958 $556 $0
3. Depreciation expenses are equal to the MACRS rates times the purchase price of the machinery.
Year Depreciation Expense1 $30,000 x .20 = $6,0002 $30,000 x .32 = $9,600
67

3 $30,000 x .19 = $5,7004 $30,000 x .12 = $3,6005 $30,000 x .12 = $3,600
4. The total tax shield is equal to the sum of the maintenance expense, depreciation expense, and interest expense each year multiplied by the tax rate (.40).
Year Maintenance expense
Depreciation expense
Interest expense
Total Tax Shield
1 $1,000 $6,000 $2,400 $3,7402 $1,000 $9,600 $1,991 $5,0363 $1,000 $5,700 $1,549 $3,3004 $1,000 $3,600 $1,072 $2,2695 $1,000 $3,600 $556 $2,062
5. Total after-tax net cash flows are equal to the payments of $7,514 plus the maintenance costs minus each year's tax shield as shown in question 4.
Year Total after-tax net cash flow
1 $4,7742 $3,4783 $5,2144 $6,2455 $6,452
6. To find the present value, use a discount rate of 5% [(8%)(1 - .4)]. The present value of the five net after-tax cash outflows associated with purchasing the machinery is equal to $22,398. The present value of the five net after-tax cash outflows associated with leasing the machinery is equal to $22,885. Since these figures reflect the present costs associated with both alternatives, we would want the one with the lower present cost. Therefore, Hasbro should purchase the machinery instead of leasing it.
7. If putting a down payment on an asset is a problem, leasing is advantageous because it allows the lessee to finance 100% of the asset. Leasing can also be an advantage if the asset you need is in an area that is associated with quick obsolescence, such as computer technology. Of course, once you have entered into a lease, if the asset becomes obsolescent, you still have to lease it for the remainder of the contract.
In the event your firm goes bankrupt, the lessor only has a legal right to recover three years of lease payments (and of course, they get their asset returned to them). Finally, not all assets (land, for example) are depreciable unless they are leased.
Disadvantages associated with leasing include an unpublished interest rate that the lessee is being charged. You must calculate it to be sure it is not too high. The salvage
68

value at the end of the lease belongs to the lessor. The longer the lease, everything else constant, the lower will be the savage value. Finally, if you are locked into a lease and you desire to make asset improvements, it is common that restrictions will be imposed by the lease.
8. The factor that will determine Hasbro's decision concerning whether or not to buy the machinery at the end of the lease will most likely be the success of Maxie's sales. If the doll does well, Hasbro will be more likely to either roll the lease over or purchase the machinery for future production needs.
69

Case 34Microsoft
Purpose: This basic options case helps students read and understand how options behave with respect to such factors as time, stock price, exercise price, and volatility of the underlying common stock. The student will also learn the basics of how a put option can be used to hedge risk.
1. An investor should buy put options when they need protection against downward movements in a stock's price because long put positions make money when stock prices decrease. Each options contract is written on 100 shares of common stock. Therefore, 5 put contracts should be purchased. Since Chris feels the downward movement will take place tomorrow, he should buy the nearest maturing put option (i.e. December). Doing so will allow him to hedge at the lowest possible cost.
2. a) To develop the hedge will cost: $750 ($1.50 x 500). Since the stock price ($93) exceeds the exercise price ($90), Chris will not exercise the put option. Technically, the option still has some value, but this value will decrease dramatically as it just went out of the money with only a few days to expiration. From a practical standpoint, it is considered to be zero.
On the up side, Chris' holding of common stock went up in value by $2,000 [($93-$89) x 500}. Overall, he made $1,250 and his new wealth position is $45,750. b) If the stock price decreases to $85, Chris will make money on the put options, but lose on the stock. His put options will be worth roughly $2,500 [($90-$85) x 500]. His underlying shares lost $2,000. With the same options cost of $750, Chris lost $250 from the announcement. His new wealth position is down to $44,250.
3. No matter which trading cycle options are on, they will always be offered in the current and following month and also on the next two natural months in the trading cycle. Since December options contracts had not expired by December 15, options are available with maturities in December, January, April, and July. On January 1, options will be trading with maturities in January, February, April, and July.
4. The nearer the option is to its expiration, the greater the trading volume in that option tends to be. Also, the greater the time to maturity of an option, the greater the value of the option. Volatility also has a positive relationship with option prices. The above relationships hold for both puts and calls.
5. Volume tends to be higher when the strike price is above the current stock price because stock prices tend to increase over time.
6. The further out of the money an option is the cheaper the price should be. This
70

follows since the further out of the money an option is the lower the probability it will ever be exercised. Conversely, the further in the money an option is the more expensive the price should be because it will most likely be exercised. In fact, in-the-money American options, by definition, can be exercised immediately for a positive payoff.
71

Case 35REITs
Purpose: This case introduces a type of security that is too often ignored in finance. It is important to make students aware of REITs because they have repeatedly been shown to warrant inclusion in mixed-asset portfolios.
1. For commercial properties, rents are determined based on supply and demand in the local economy. When the economy is good, businesses flourish and office space is demanded. This higher demand allows the building owners to keep rents at a very high level as firms are competing for space. The REITs that own these building are therefore receiving higher revenues and are thus more profitable.
When the economy is bad, businesses trim down or even go out of business, which frees up office space. The widely available space gives renters (lessees) the upper hand. Landowners compete for tenants by lowering rents. These lower rents mean lower revenues for REIT shareholders.
2. REITs have historically returned 7.0%-8.0% in dividends and a more modest 3%-5% in capital gains. Due to tax consequences, the individuals who own REITs are same investor class as those who own utility stocks – retirees.
Tax-exempt institutional investors, like pension funds, also own REITs. Since they do not pay taxes, all they care about is total return, not whether the total return came from dividends or capital gains. REITs have been shown to generate sufficient returns on a risk-adjusted basis to warrant inclusion in mixed-asset portfolios.
3. The correlation between asset classes is typically measured by examining indexes (benchmarks). For example, to calculate the correlation between large cap stocks and REITs, the S&P 500 would be compared to the NAREIT (National Association of Real Estate Investment Trusts) index. In 1998-1999, technology stocks soared in value which caused their weight to be very high in the S&P 500 index. So as the technology stocks went through the roof, they drug the S&P 500 index along with them. REITs, on the other hand, continued their steady returns. Conversely, after the technology stocks crashed, so too did the S&P 500.
The appearance, therefore, is that REITs had a low correlation with the stocks in the S&P 500. The reality was that REITs had a low correlation with technology stocks and a much higher correlation with the other stocks in the market which showed the same general return pattern throughout that REITs did.
Do to these extreme events, it is likely that REITs will be observed to have a higher correlation in the future.
4. While it is impossible to measure directly or with a high degree of accuracy, the total market value of all commercial real estate in the United States is around $5 trillion. Half of this is owned directly by corporations, leaving the other half available for ownership. Currently, only $250 billion of this real estate is controlled by REITs. Since the average
72

REIT has roughly a 40% debt ratio, the total market capitalization of all REITs sums to $141.8 billion. Thus, only a small percentage (approximately 10%) of commercial real estate is securitized.
Given that there are numerous property types (Apartments, Industrial, Office, Retail, Warehouse, etc.), the ability of a portfolio manager to find enough REITs to make a significant rebalance in a portfolio is dubious. Moreover, while it is far beyond the scope of this simple case, REITs are not exactly unsecuritized real estate. Thus, using them as substitutes can be misleading. Several researchers have found them to be so different that they should be considered a separate asset class.
73

Case 36HOLDRs
Purpose: This case introduces a new type of security that is being traded on the American Stock Exchange. It is important to make students aware of new offerings as quickly as possible not only because they will soon be entering the work force, but also because they may want to use them in their portfolios.
1. When a firm like Merrill Lynch offers a new security, it is usually out of customer demand, or at least perceived customer demand. Like any product, however, if consumers are not interested in buying it, HOLDRs would stop trading and eventually go away. For this reason, a firm offering a new security should feel very confident that it will have staying power.
2. Day traders are defined as traders who enter and exit trades within one trading session (day). Since UITs, like mutual funds, only calculate their price once each day, day traders would not include them as part of their portfolio. HOLDRs, however, have intrinsic price changes as soon as any of their underlying securities change in price. As such, they can and likely will be used by day traders who wish to speculate on the direction of a particular industry.
3. UITs are no different from any other area of finance. Competition causes increased efficiency which is ultimately better for consumers. An analogy can be drawn from the former telecommunications industry. When the monopoly was broken up and competitors were allowed to offer long distance services, prices dropped precipitously. With the advent of HOLDRs, which offer several advantages to investors, watch for UITs to improve upon the transparency and availability of price data.
4. No. HOLDRs are diversified only within a particular industry. Portfolio theory clearly maintains that to remove all unsystematic risk, diversification across industry sectors in necessary. Therefore, if an investor were to purchase the HOLDR of only one industry, his portfolio would not be fully diversified.
74

Case 37Reynolds
Purpose: Merger mania is alive and well. In the mid 1980's and now again, firms are joining forces for all types of strategic reasons. Students should be made aware of the factors that contribute to merger and acquisition activity and how these activities affect industries and the overall economy.
1. One of the main reasons is to reduce competition by making the competitors part of the same company.
2. It is the job of the regulators to prevent firms from having absolute or virtual monopolies. This is good for us as customers because monopoly firms eventually raise prices once they drive out all competitors who can offer the same product at reduced prices.
3. There are several reasons why firms merge: economies of scale and scope, growth, diversification, tax benefits, greater access to the capital markets, to tap into unused debt potential, to remove inefficient management, to gain market share, to gain prestige by being seen as a larger company, to be listed on a larger exchange, and many other synergistic reasons.
4. To avoid a takeover attempt, firms have the following colorfully named options: seek a white knight, take a poison pill, use a shark repellent, send greenmail, organize a leveraged recapitalization, or save at least the management by having them pull the cords on their golden parachutes.
5. The ways to raise capital for mergers and acquisitions include leveraged buyouts (LBO), a management buyout (MBO), a cash offer to tender shares, leveraged ESOPs, and stock swaps.
6. Research has shown that the target of a takeover or merger receives a substantial premium for their shares while bidding firms have zero and even insignificantly negative returns from winning the bidding war. At first glance this seems unreasonable, but there are several explanations that shed light on this surprising result.
(1) Takeover firms must gain voting control in order to elect their own managers. This means owning shares of the target's common stock. In order to entice current target stockholders to sell, a premium must be paid to them.
(2) The bidding firm must have some value creation potential otherwise the merger would not be on the table in the first place. Target firm stockholders understand this and also know that their shares are needed to make the deal happen. Therefore, they simply want their piece of the pie.
(3) Finally, it can be argued that the feeding frenzy that eventually results from a few sharks swimming around in bloody chum-filled waters turns into a free-for-all where
75

rational pricing gives way to the "winner's curse".
76

Case 38Adaptec
Purpose: This case introduces the fundamentals of a corporate spin-off. Most introductory courses do not discuss corporate spin-offs. However, today more so than ever, students already own stocks before they get into class. So, students receive statements in the mail related to their common stock ownership that discuss concepts of which they are completely unaware. The purpose of this case is to create that basic awareness.
1. Brian does not have to do anything to own these shares in the new company, Roxio, because effectively, he already owns them. That is, Roxio is currently a wholly-owned subsidiary of Adaptec, which Brian owns. The analogy is if you take a whole pie and cut a piece out of it, the person who owned the whole pie should now own the piece of pie and the remainder of the pie as well. Cutting a pie into many pieces does not make its total size larger or smaller.
2. 100 x 0.1646 = 16.46 shares.
3. The leftover or fraction of a share, 0.46, cannot be owned by Brian because it is not possible to own fractional shares in a common stock. The Adaptec statement reads, “The transfer agent will not deliver any fractional shares of Roxio common stock in connection with the spin-off. Instead, the transfer agent will aggregate all fractional shares and sell them on behalf of those holders who otherwise would be entitled to receive a fractional share. Such holders will then receive a cash payment in an amount equal to their pro rata share of the total net proceeds of that sale.”
4. Tax consequences may vary. In this case, the Information Statement for Adaptec reads, “Adaptec has received an opinion from Pricewaterhouse Coopers LLP that the distribution of its shares of Roxio common stock to the holders of its common stock will be tax-free to Adaptec and its stockholders for United States federal income purposes.”
77

Case 39Roxio
Purpose: This case is an extension of the Adaptec case. This case opens the door to the discussion of corporate spin-offs and may best be used as a conversation/discussion starter in class as opposed to an assignment.
1. Roxio’s desire to operate independently is not much different from most other firms. Roxio states their reasons for the separation by saying, “The separation will allow us to have our own business and strategic opportunities. After the separation, we will be able to implement a marketing strategy that focuses on our business. Furthermore, our business and engineering resources will be dedicated solely to our business… the motivation of our employees and the focus of our management team will be strengthened and our ability to attract and retain qualified personnel will be enhanced. As a separate company, we will have direct access to the capital markets, and we believe that securities analysts will be more likely to provide research coverage of our business.”
2. There are several potential new risks. (1) Roxio will be operating under a new brand which does not already carry wide brand name recognition. This could hurt sales. (2) Departure from Adaptec’s infrastructure and implementation of their own new structure could hurt efficiency. (3) Roxio may be required to indemnify Adaptec for tax liabilities associated with the distribution of Roxio common stock. (4) There is a potential increase in stock return volatility due to difficulty in pricing new shares as well as operating a smaller business whose sales are reliant on a few large customers within similar markets. (5) Ability to raise capital is limited as Roxio is a small firm. Moreover, smaller firms often find it more expensive to raise funds because of economies of scale. (6) Many of the new Roxio board members still own a substantial number of shares (or options to buy shares) in Adaptec. This can cause actual or perceived conflicts of interest at least until all connections to Adaptec have been severed. (7) Roxio stock has never been traded before. They plan to list on the NASDAQ, but if they are unable to meet the listing requirements, they will be forced to list on the lower perceived quality OTCBB. This may result in a lack of analyst coverage, institutional ownership, and low trading volume.
3. Yes. Because of prior executive compensation requirements, Adaptec will continue to hold 190,941 of the 16,309,059 total Roxio shares.
4. It is extremely unlikely that Roxio will plan to pay a dividend in the foreseeable future. The primary reason is the growth orientation of Roxio. A primary benefit of being publicly listed is to gain access to the capital markets. For this reason, it makes no sense for Roxio to distribute cash when they are trying so hard to raise cash through the issuing of securities.
78

Case 40Tyco
Purpose: As the world continue to become more globally oriented, it is important for students to understand the ramifications of being a multinational firm. This case is a first step in that direction.
1. The following table will be used to demonstrate the weighted average cost of capital:
Source of funds After-tax cost Amount Weight Weighted costEquity 11.4% $6,500,000 44.8% 5.11%Debt 5.6% $6,500,000 44.8% 2.51%Working Capital 6.0% $1,500,000 10.4% 0.62%
WACC = 8.24%
2. Sales x 17% = profits
$35,000,000 x .17 = $5,950,000 per year for the next four years.
PV = $5,950,000 x PVIFAk=8.24%,n=4 Using a calculator, the present value is
PV = $19,602,333
3. If the dollar were to appreciate or strengthen relative to the guilder, the sales revenue in guilders would be worth less in terms of U.S. dollars. Therefore, profits from foreign sales would decrease.
4. From a financial viewpoint, the foreign exchange rate risk could be hedged by using futures or forward contracts. A short position would be taken by Tyco so that if the dollar strengthened, it would reduce the profits in the spot market, but cause offsetting gains by making money in the futures/forwards market.
5. From a production standpoint, Tyco could purchase more input components with guilders or sell more units in dollars. They could also finance future cash flow needs with guilders instead of dollars. Western Europe's financial markets are not nearly as risky as markets in other parts of the world.
79