FinalPresentation
26
Elongation Factor IV Connor Stewart & Eric Newman Laboratory of Biochemistry, Bellingham Washington http://myhome.sunyocc.edu/~weiskirl/ parts_of_all_cells.htm
-
Upload
eric-newman -
Category
Documents
-
view
3 -
download
0
Transcript of FinalPresentation

Elongation Factor IV
Connor Stewart & Eric Newman
Laboratory of Biochemistry, Bellingham Washington
http://myhome.sunyocc.edu/~weiskirl/parts_of_all_cells.htm

Elongation Factor IV / Lep A•High level of conservation
-Found in all sequenced prokaryotes and nearly all eukaryotes
•Name change from Lep A to Elongation factor 4 (EF4)-Named Leading peptidase A due to it’s location on the Lep operon
-EF4 back-translocase function during elongation found using 32P labeling
•Stored on E. coli periplasmic membrane- 1/5 Cytoplasm/Membrane
-Unique C terminal domain (CTD)
•G protein based
-Uncoupled ribosome dependent GTPase activity
-turnover rate similar to EF-GPECH, MARKUS. KARIM, ZHALA. ET AL. (2010). P.N.A.S. VOL. 108(8), 3199-3203.
QIN, YAN. POLACEK, NORBERT. ET (2006). CELL VOL. 127(4), 721-733.

EF4 & EF-G Homology
QIN, YAN. POLACEK, NORBERT. ET (2006). CELL VOL. 127(4), 721-733.
• Strong homology between domains I, II, and III and V of EF-G
• Domain configuration conserved from Yeast through Humans
• EF-G, EF-Tu, IF2 all share homology with EF-4
• EF-4 retains 55-68% amino acid identity among bacterial orthologs
• EF-G retains 58-70% amino acid identity

Visualized in PyMOL
90o

GAGNON G., MATTHIEU. LIN, JINZHONG. ET AL. (2014) SCIENCE, VOL.345(6197), 684-687.
EF-4 Bound to Ribosome
• Competitive binding with EFG
• CTD inserts into A-site and connects to post translational complex
-last 44 residues not visible

Function •Released during unfavorable conditions
-High ionic strength, low temperatures. Addition of Mg2+ changes ratio from 5/1 to 1/5 membrane/cytoplasm
-Addition of [2-5] Mg2+ reduces GFP synthesis by 40%
-Active GFP from 50% - 25%
-EF4 addition brings GFP synthesis to 120%
-Active GFP maintained at 50%
•Catalyzes the back-translocation reaction on post-translocation state ribosomes.
-Reverses EF-G catalyzed transition, giving EF-G a second chance at correct t-RNA translocation
-Re-mobilizes stuck ribosomes
GAGNON G., MATTHIEU. LIN, JINZHONG. (2014) SCIENCE, VOL.345(6197), 684-687. PECH, MARKUS. KARIM, ZHALA. (2010). P.N.A.S. VOL. 108(8), 3199-3203.

Mechanism•Competes with Elongation Factor G
-EF4 has no EFG domain IV backstop and reduces post – pre conformation energy barrier.
Preferentially binds to Post-Ribosomal Complex
-Pb2+ cleavage of engineered pre and post ribosomal complexes
-17.8% of PRE complexes cleaved, 82.2% of POST cleaved
-Addition of EF4 brought POST cleavage back to PRE levels
-shifts tRNA from E&P sites to P&A
•Back ratcheting re-opens A-site giving EFG a second chance- 32P labeling of Amino Acids, one codon length back
GAGNON G., MATTHIEU. LIN, JINZHONG. ET AL. (2014) SCIENCE, VOL.345(6197), 684-687.

Transformation Efficiency Volume Colonies Transformation efficiency
100 µL Native E. coli 0 0 colonies/µg
50 µL 0 0 colonies/µg
100 µL 2 1000 colonies/µg
200 µL 0 0 colonies/µg

Cell Optical Density during Incubation
0 25 50 75 100
0.15
0.20
0.25
0.30
0.35
0.40
0.45
0.50
0.55
Opt
ical
Den
sity
Time (min)
Optical Density (A.U.) of incubating cells as a function of time (minutes).
• Incubated at 15oC overnight with IPTG for overexpression

Chromatography Elution Curve
0 2 4 6 8 10 12 14 16 18 20
0
5
10
15
20
25
30
Abs
orba
nce
(A.U
.)
Protein Fraction
• Absorbance at 280 nm of affinity chromatography elution fractions.
• Fractions 2-4 were diluted 1/100 for absorbance readings.
• The values displayed for fractions 2-4 account for this dilution.

Dialysis
EF-4 precipitated during dialysis
Procedure Modification:
• Centrifuged on Eppendorf minispin® at 12,000 x g
• Absorbance was measured at 280 nm and supernatant was used for future analysis.

Bradford Assay
0 2 4 6 8 10 12 14 16 18 20 220.0
0.1
0.2
0.3
0.4
0.5
0.6
0.7
0.8
Abs
orba
nce
(A.U
.)
BSA (g)
Linear Fit Parameters: m = 0.03701b = 0.03395R2 = 0.98832
• Bradford Assay standard curve. Absorbance (A.U.) taken at 595 nm plotted as a function of bovine serum albumin (BSA) µg with a linear fit.
• A 40 µg point was excluded to maintain the linear fit.
• Mass extinction coefficient of 3.56 L/(g∙cm).
• Literature Value: 0.593 L/(g∙cm)
• Protein concentration 0.57µg/µL

#1 #2 #3 #4 #5 #6 #7 #8 #9 #10
SDS-PAGE
• #1 Cell Lysate Supernatant• #2 Crude Cell Lysate• #3 Purified Lysate with Aggregate • #4 Chromatography High-speed flow through• #5 Chromatography Fraction 1• #6 Purified Cell Lysate• #7 Molecular Weight Ladder• #8 Chromatography Rinse 2• #9 Chromatography Rinse 1• #10 Dialysis Buffer

0.0 0.2 0.4 0.6 0.8 1.0
20
40
60
80
100
Mol
ecul
ar W
eigh
ts (
kDa)
Relative Migration
Log(y) = 2.23 + (-2.77)x1 + (3.56)x2 + (-2.2)x3
R2 = 0.994
Relative Mobility
• Experimental M.W.: 69 kDa
• EF4 molecular weight: 67.393 kDa
Relative Migration of protein standards against log10 molecular weights.

Determination of Unknown ETranslation Factor
Molecular Weight (kDa)
Isoelectric Point (pI)
Mass extinction coefficient (L∙g-1∙cm-
1)
IF2 98.2 4.97 0.280
IF3 21.3 9.54 0.209
EF-Tu 44.1 5.6 0.465
EF-G 78.4 5.43 0.784
EF-4 67.4 5.68 0.593
RRF 21.4 7.03 0.139
RF1 41.3 5.40 0.521
RF3 60.4 5.91 0.691
• Mass extinction coefficient of 3.56 L/G∙cm.
• M.W.: 69 kDa
• Aggregation

Determination of Unknown E
•Gel electrophoresis: 69 kDa
•1.6 kDa off of the Literature value (2.4%)
• Walter D., Justin. Littlefield, Peter. Delbecq, Scott. Prody, Gerry. Spiegel P, Clint. (2010). Expression, purification, and analysis of unknown translation factors from Escheria coli: A synthesis approach. Biochemistry and Molecular Biology Education. Volume 38(1), 17-22

Fluorimetry
300 325 350 375 4000
500
1000
1500
2000
2500
Inte
nsity
(A
.U)
Wavelength

Fluorimetry
0 1 2 3 4 5 61500
1600
1700
1800
1900
2000
2100
2200
2300
2400
R2 = 0.99458.7x + 2200
R2 = 0.953y = -182x + 2688
R2 = -0.755y = 22.0x + 1600
Inte
nsity
(A
.U.)
Urea (M)

Fluorimetry Thermodynamics
• ΔGo' = 16 kJ/mol
•Tertiary structure
2.5 3.0 3.5 4.0 4.5 5.0
-10000
-8000
-6000
-4000
-2000
0
2000
4000
6000
Gib
bs F
ree
Ene
rgy
(J/m
ol)
Urea (M)
R2 = 0.824y = -4663x + 16280
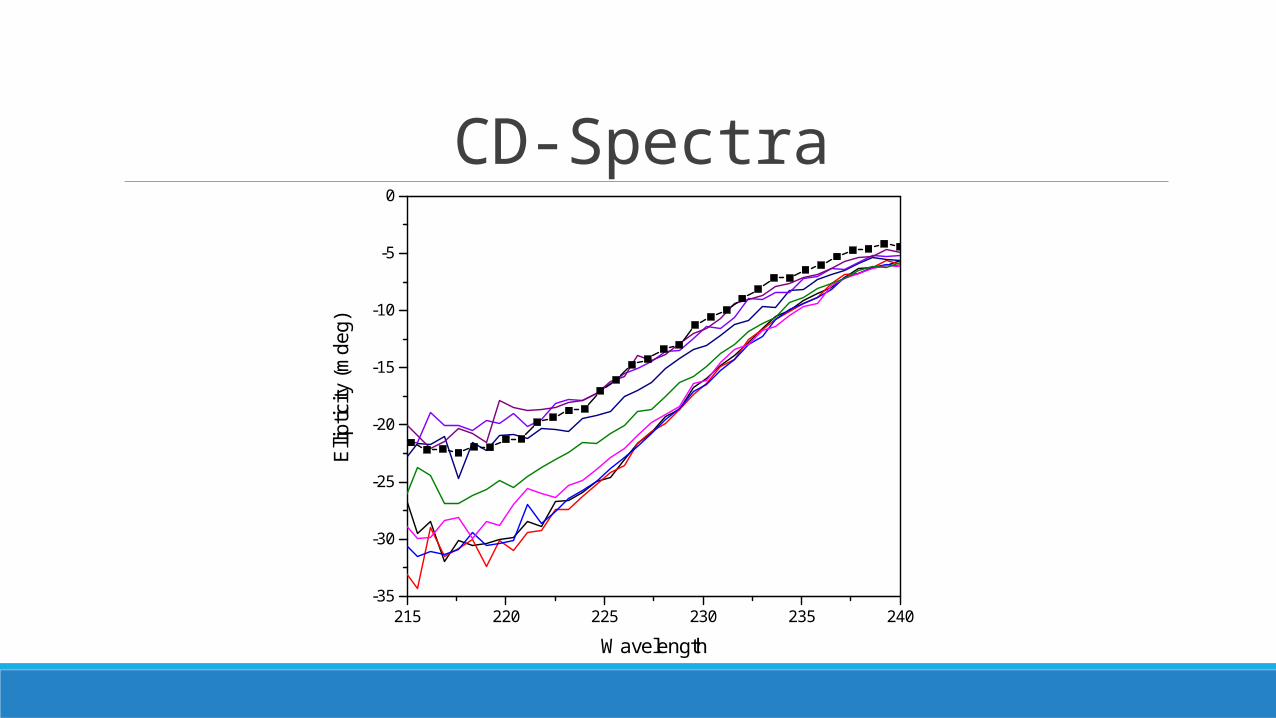
CD-Spectra
215 220 225 230 235 240-35
-30
-25
-20
-15
-10
-5
0
Elli
ptic
ity (
mde
g)
Wavelength

CD-Spectra
40 45 50 55 60-30
-28
-26
-24
-22
-20
-18
Temperature (oC)
R2 = 0.969y = 1.19x - 80.9
R2 = 0.543y = -0.134x - 12.4
R2 = -0.656y = 0.0630x - 31.6
Elli
ptic
ity (
mde
g)

CD Thermodynamics
0.00308 0.00310 0.00312 0.00314 0.00316
-4
-2
0
2
4
6
ln(K
eq)
1/T (K-1)
R2 = 0.971y = -103904x + 323.98
• Possible source of error: low protein concentration
ΔH 860 kJ/mol
ΔS 2.7 kJ/mol
ΔGo’ 61 kJ/mol

Further Studies Aggregation
• We feel the precipitation of our protein may have skewed some of our results and experiments.
• Experiments to determine more stable conditions for EF4
• More accurate information would most likely be achieved by performing experiments in a higher ionic environment and/or a lower temperature.
Mechanism to explore• Binding to periplasmic membrane
• Types of interactions with and conformation changes to the ribosome.

Acknowledgements
•Gerry Prody
•Clint Spiegel
•Michelle Wuerth
•Marcus Carlson
Thank You

Questions?

QIN, YAN. POLACEK, NORBERT. ET AL. (2006). CELL VOL. 127(4), 721-733.