FinalPaperS2015-CornellTech-Planning
65
PHASE II PLANNING CORNELL TECH INITIATIVES Basak Akman, Caterina Brescia, Justin Horst, Jennie Li, Rachel Liu, Kevin Mootoo, Ilia Savin, Erin Tou Spring 2015
-
Upload
ilia-savin -
Category
Documents
-
view
227 -
download
1
Transcript of FinalPaperS2015-CornellTech-Planning

PHASE II PLANNING
CORNELL TECH INITIATIVES Basak Akman, Caterina Brescia, Justin Horst, Jennie Li, Rachel Liu, Kevin Mootoo, Ilia Savin, Erin Tou Spring 2015

EXECUTIVE SUMMARY The Planning Team is a project team within Cornell University Sustainable Design (CUSD). As part of
the New York City Tech Campus project, the Planning Team is focused on developing the master plan
for Phase II of the Tech Campus, which is set to be open in 2038.
This semester, the team worked on two major research areas, which culminated in two main
deliverables. The first area was researching alternative energies that can power the Tech Campus
through sustainable measures. This research, along with research from last semester, was synthesized
into a flexible master spreadsheet which can evaluate the efficacy of each alternative energy, and their
total impact in terms of energy savings and cost savings. The Planning Team also researched ways to
make the Tech Campus more resilient and interactive. Afterwards, the Planning team created a new site
plan and rendering for the Tech Campus that incorporates the various ideas and recommendations.
Altogether, the Planning Team focused on ensuring that the Tech Campus will become a beacon of
sustainability, innovation, and collaboration.
PHASE II PLANNING | CORNELL TECH INITIATIVES | SPRING 2015 2
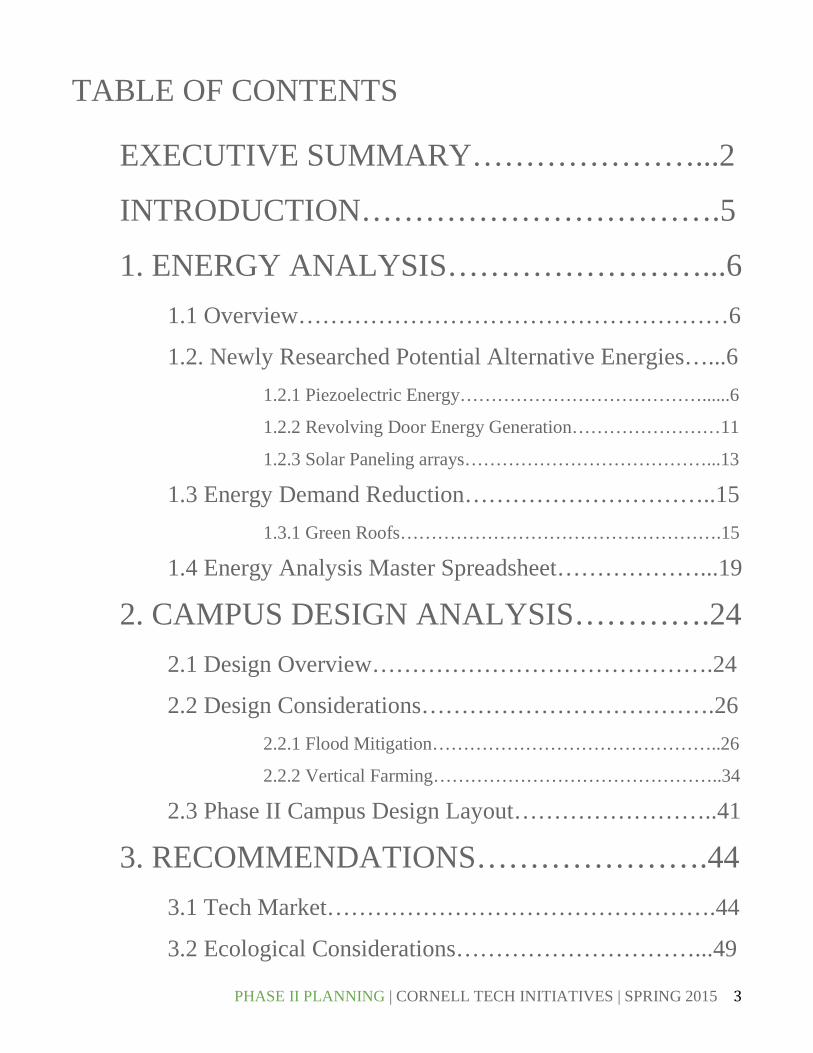
TABLE OF CONTENTS
EXECUTIVE SUMMARY…………………...2
INTRODUCTION…………………………….5
1. ENERGY ANALYSIS……………………...6
1.1 Overview………………………………………………6
1.2. Newly Researched Potential Alternative Energies…...6
1.2.1 Piezoelectric Energy…………………………………......6
1.2.2 Revolving Door Energy Generation……………………11
1.2.3 Solar Paneling arrays…………………………………...13
1.3 Energy Demand Reduction…………………………..15
1.3.1 Green Roofs…………………………………………….15
1.4 Energy Analysis Master Spreadsheet………………...19
2. CAMPUS DESIGN ANALYSIS………….24
2.1 Design Overview…………………………………….24
2.2 Design Considerations……………………………….26 2.2.1 Flood Mitigation………………………………………..26
2.2.2 Vertical Farming………………………………………..34
2.3 Phase II Campus Design Layout……………………..41
3. RECOMMENDATIONS………………….44 3.1 Tech Market………………………………………….44
3.2 Ecological Considerations…………………………...49
PHASE II PLANNING | CORNELL TECH INITIATIVES | SPRING 2015 3

3.3 Cornell Bike-Share Program………………………....52
4. CONCLUSIONS………………………….55
WORKS CITED……………………………..56
APPENDICES……………………………….59 I. Campus Area Calculations…………………………….59
II. Piezoelectric Energy Calculations…………………….60
III. Green Roof Energy Calculations…………………….61
IV. Research Supported Design Features………………..62
V. Decision Matrix Scoring Criteria……………………..65
PHASE II PLANNING | CORNELL TECH INITIATIVES | SPRING 2015 4

INTRODUCTION
The previous CUSD Planning Team focused on establishing the groundwork needed to plan Phase II of
the Tech Campus. Campus Requirements, design constraints, and zoning regulations were all
researched. In addition, the previous Planning Team studied how the Tech Campus would impact the
surrounding community. The team’s final deliverables included preliminary research on alternative
energies and sustainable design practices as well as an initial site plan.
The goal of the spring 2015 Planning Team was to continue where the previous team left off, with a
focus on improving the energy analysis research and developing new campus design recommendations.
In-depth research was conducted on the viability of various forms renewable energy as well as methods
of decreasing the environmental impact of buildings. The technical findings from this research are
summarized in a flexible master spreadsheet, which is easily manipulated to account for changes in
inputs. This is a tool that can be useful for developers in making energy-based design decisions. The
campus design analysis has formulated three major recommendations which can feasibly be
incorporated into the Master Plan of Phase II. Other research identified possible design iterations that
could be feasible in the future, but may require significant additional funding or technological
capabilities. Lastly, it is assumed that the exact site plan and design for Phase II is not set in stone. There
is still plenty of time to incorporate new ideas. The design created by the Planning Team adheres to the
design principles set for the Tech Campus and holds many merits that may be valuable for future
planning considerations.
PHASE II PLANNING | CORNELL TECH INITIATIVES | SPRING 2015 5

1. ENERGY ANALYSIS
1.1. Overview
According to EIS, Phase II is projected to have more than double the energy demand of Phase I of the
Tech Campus. To maintain Cornell’s dedication to sustainability, it is imperative to minimize the
amount of energy that is supplied by non-renewable resources. To do this, the energy sub-team of the
Planning Team researched various alternative energies, ranging from traditional alternatives like solar
power, to more unconventional methods like piezoelectric energy generation. For each alternative,
certain questions and factors were researched or estimated, such as: “how much energy can it supply?”
“How cost-effective is it?” “How easy is it to implement into the campus?” Constraints and limitations
of each alternative are also noted in this section. Finally, all of the alternatives were placed into a master
spreadsheet that allows the user to control parameters for each alternative and compare the results. The
flexibility of this tool allows it to be utilized to make decisions on which energy alternative to invest in
and how it will impact the overall energy demand and supply for the Tech Campus.
1.2. Newly Researched Potential Alternative Energies
1.2.1 Piezoelectric Energy
1.2.1.1 Introduction
Piezoelectric energy generation is achieved by transforming the energy of applied forces, specifically
pressurization, into electrical energy. Piezoelectric surfaces, such as piezoelectric tiles, are used to
harvest this energy. The force applied to these surfaces can come from a variety of sources, including
human footsteps, bicycles, and even cars. Piezoelectric tiles placed in high-traffic locations can generate
sustainable energy that can be used for a variety of on-site purposes (such as lighting nearby
streetlamps) or fed back into the electrical grid for general use. A college campus is an ideal situation
for piezoelectric energy generation because there is a high density of people per unit area, and thousands
of students use the same routes to travel from class to class, creating many efficient locations for
positioning piezoelectric tiles. Also, piezoelectric tiles do not compete for area with any other
sustainable technology. For example, green roofs and rooftop solar panels utilize the same space, but no
other technology would utilize the surface of pathways and hallways; this area is an untapped resource
in sustainable energy generation potential.
PHASE II PLANNING | CORNELL TECH INITIATIVES | SPRING 2015 6

1.2.1.2 Methodology
Determining the best use of piezoelectric tiles began with an examination of the various technologies
available to us. Piezoelectric energy collection is a relatively new field, so the number of companies
manufacturing the tiles is small. Currently, there are only two piezoelectric tile manufacturers that seem
capable of meeting our needs (of successful implementation, durability of product, etc.): Pavegen and
Energy Floors. We determined that we should base our piezoelectric solution and calculations on
Pavegen’s products for several reasons. First of all, Pavegen products are modular, which is preferable
to the custom piezoelectric solutions offered by Energy Floors. Secondly, the durability of Pavegen
products seems to be superior: they are completely waterproof and have a lifespan of twenty years in a
high-use situation. Thirdly, Pavegen products include feedback mechanisms that would improve user
experience; these include integrated lights that illuminate when the tile is stepped on and wireless data
collection that tracks tile usage and energy generation. Both of these features have the potential to
remind pedestrians of their contribution to sustainability. Finally, Pavegen uses large amounts of
recycled materials in its products (including recycled aluminum for the tile’s frame and recycled car
tires for the non-slip surface), which demonstrates commitment to sustainability.
Figure 1. Pavegen's piezoelectric modules
1.2.1.3 Data Collection
The next step was to examine case studies of piezoelectric implementation and relevant research in the
field. Some examples included piezoelectric floors at subway stations in Japan (Company, 2008) and a
PHASE II PLANNING | CORNELL TECH INITIATIVES | SPRING 2015 7

piezoelectric dance floor at a club in London (Energy Floors Home, 2015). These case studies
demonstrated the potential for piezoelectric energy to power applications; at the subway stations, enough
energy was generated to run ticket machines, display screens, and some lighting, and at the club, the
dance floor provided up to 60 percent of the total energy need (for lighting, sound system, etc.).
Research we examined included tests of piezoelectric road surface technology by students at Stanford
University (Garland, 2013) and a research group in Israel (Henderson, 2009). These case studies
indicated that the focus should be on collecting energy from pedestrians rather than vehicular
transportation, because the technology to collect piezoelectric energy from vehicles is not in full
production yet and because piezoelectric road surfaces are not durable enough (the Stanford research
findings indicated that a piezoelectric road surface would be able to pay for itself in 12 years, but due to
durability issues, it would not last nearly that long; the technology may be cost-effective in the future,
but it is not feasible now). The most useful source of information that was studied was the journal
article “Modelling Piezoelectric Energy Harvesting Potential in an Educational Building”, which was an
analysis of potential piezoelectric implementation in a building at Macquarie University in Sydney,
Australia (Li & Vladimir Strezov, 2014). Due to the similarity of this study to the situation on the
Cornell Tech Campus (it is an analysis on a college campus that is also based on Pavegen tile
technology), we were able to use it to draw conclusions about the effectiveness of piezoelectric energy
generation on our campus. These findings will be discussed below.
1.2.1.4 Analysis
Based on the data collected from research and manufacturers of piezoelectric tiles, calculations were
performed to determine the feasibility of piezoelectric power generation on the Cornell Tech Campus
using Pavegen technology. The first step was to determine the optimal placement of the tiles; this is
usually accomplished through a pedestrian flow analysis, but given that the campus is not constructed
yet and that the physical layout of the campus has not been completely determined, this kind of analysis
is not really possible. Generally, piezoelectric tiles are most efficient and have the shortest payback
period in high-traffic locations, which include areas such as building entryways, hallways, direct routes
between important points (such as an entryway and an elevator bank), gym floors, event spaces, and
other “choke points” where many people are forced to move through the same area. Due to lack of
knowledge about campus specifics, the piezoelectric implementation analysis from Macquarie
University was used as a basis for the calculations. This also led to the decision to limit the calculations
to indoor spaces (at least at first) because the Macquarie study was conducted in a campus building and
did not discuss the possibility of outdoor piezoelectric implementation; Pavegen tiles are weather-proof,
PHASE II PLANNING | CORNELL TECH INITIATIVES | SPRING 2015 8

so outdoor applications are possible, but the plan was to determine indoor feasibility and then move on
to outdoor calculations if necessary.
The Macquarie University study determined that utilizing 3.1% of the floor space in a roughly 172,000
ft2 building for piezoelectric energy generation would be optimal; this conclusion was based on a
pedestrian flow analysis. The Cornell Tech Campus calculations are based on the assumption that 3.1%
utilization of total floor space for piezoelectric energy generation is applicable to Cornell’s campus
buildings too; although no flow analysis could be conducted for Cornell, it seems likely that 3.1% would
be similar enough to the true value to use it as the basis for a reasonable estimate. The decision was also
made to limit the usage of piezoelectric tiles to the ground floors of Cornell Tech Campus buildings (at
least for preliminary calculations), because the number of students on the ground floor of an academic
building would result in higher energy generation and a shorter payback period for the tiles. The total
area of all ground floor levels in Cornell Tech Campus is roughly 140,016 ft2, and 3.1% of that value is
approximately 4,340 ft2. Based on an area of 2.901 ft2 per piezoelectric tile, 1,496 piezoelectric tiles
would be used on the Tech Campus. However, the square footage of piezoelectric tiles utilized is not
the only consideration to take into account when determining energy generation: the number of students
using the area is also important. In order to incorporate both piezoelectric tile area and number of
students into the final calculation, a new unit of measurement was created: pedestrian density (the
number of students on the campus per unit area of piezoelectric flooring). Given that the Macquarie
University analysis estimated an energy output of 9,888 kWh/yr with a pedestrian density of 7.325
students/ ft2 piezoelectric tile (38,753 students on campus/5,290.462 ft2 piezoelectric tile), and given that
the Cornell Tech Campus would have a pedestrian density of 0.738 students/ ft2 piezoelectric tile (3,203
students on campus/4340.492 ft2 piezoelectric tile), the energy output of the Cornell Tech Campus
piezoelectric system would be 996.224 kWh/yr (7.325/9,888=0.738/x, where x=# of kWh/yr for the
Cornell Tech Campus piezoelectric system).
Table 1. Potential energy generated by piezoelectric tiles
# of
Students
Area of
Piezoelectric Tile
(ft2)
Pedestrian Density
(students/ ft2 of tile)
Annual Energy
Output (kWh/yr)
PHASE II PLANNING | CORNELL TECH INITIATIVES | SPRING 2015 9
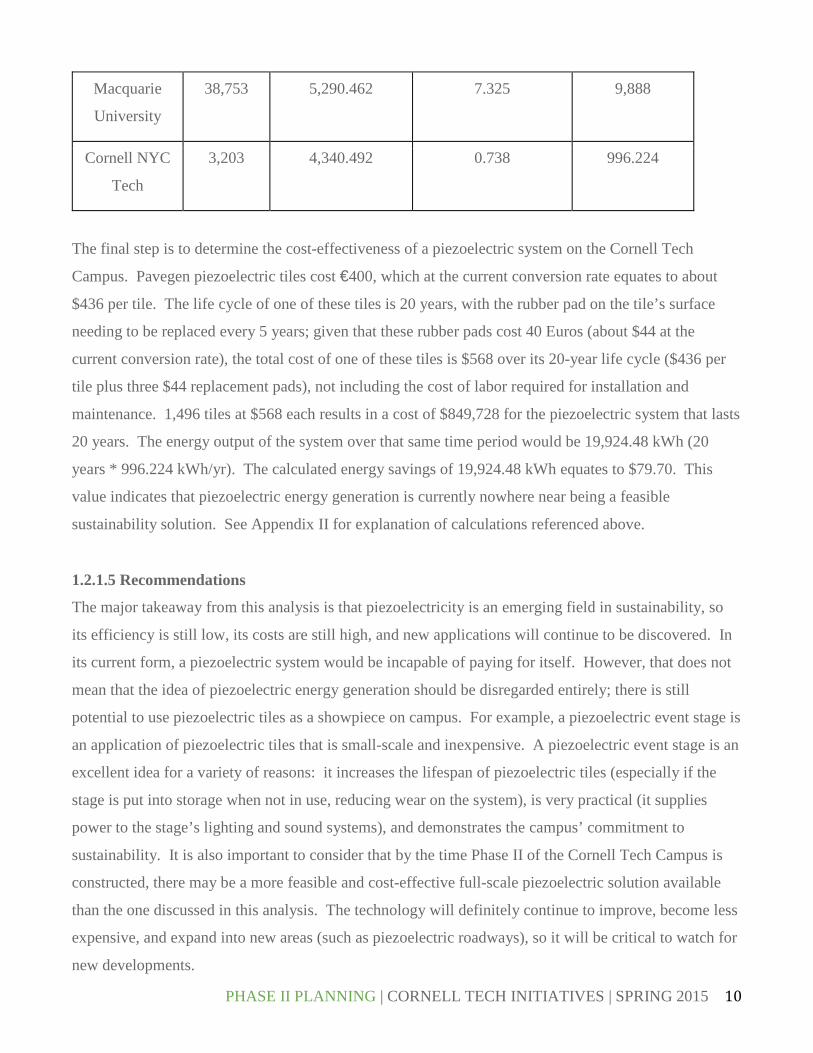
Macquarie
University
38,753 5,290.462 7.325 9,888
Cornell NYC
Tech
3,203 4,340.492 0.738 996.224
The final step is to determine the cost-effectiveness of a piezoelectric system on the Cornell Tech
Campus. Pavegen piezoelectric tiles cost €400, which at the current conversion rate equates to about
$436 per tile. The life cycle of one of these tiles is 20 years, with the rubber pad on the tile’s surface
needing to be replaced every 5 years; given that these rubber pads cost 40 Euros (about $44 at the
current conversion rate), the total cost of one of these tiles is $568 over its 20-year life cycle ($436 per
tile plus three $44 replacement pads), not including the cost of labor required for installation and
maintenance. 1,496 tiles at $568 each results in a cost of $849,728 for the piezoelectric system that lasts
20 years. The energy output of the system over that same time period would be 19,924.48 kWh (20
years * 996.224 kWh/yr). The calculated energy savings of 19,924.48 kWh equates to $79.70. This
value indicates that piezoelectric energy generation is currently nowhere near being a feasible
sustainability solution. See Appendix II for explanation of calculations referenced above.
1.2.1.5 Recommendations
The major takeaway from this analysis is that piezoelectricity is an emerging field in sustainability, so
its efficiency is still low, its costs are still high, and new applications will continue to be discovered. In
its current form, a piezoelectric system would be incapable of paying for itself. However, that does not
mean that the idea of piezoelectric energy generation should be disregarded entirely; there is still
potential to use piezoelectric tiles as a showpiece on campus. For example, a piezoelectric event stage is
an application of piezoelectric tiles that is small-scale and inexpensive. A piezoelectric event stage is an
excellent idea for a variety of reasons: it increases the lifespan of piezoelectric tiles (especially if the
stage is put into storage when not in use, reducing wear on the system), is very practical (it supplies
power to the stage’s lighting and sound systems), and demonstrates the campus’ commitment to
sustainability. It is also important to consider that by the time Phase II of the Cornell Tech Campus is
constructed, there may be a more feasible and cost-effective full-scale piezoelectric solution available
than the one discussed in this analysis. The technology will definitely continue to improve, become less
expensive, and expand into new areas (such as piezoelectric roadways), so it will be critical to watch for
new developments.
PHASE II PLANNING | CORNELL TECH INITIATIVES | SPRING 2015 10

1.2.2 Revolving Door Electricity Generation
1.2.2.1 Introduction
Another form of sustainable energy generation that utilizes pedestrians as a power source is an energy-
generating revolving door. This energy solution seemed very well-suited to a college campus for two
major reasons. First of all, it has a nearly 100% energy capture rate; other than a small number of
ordinary doors that must be provided for handicap accessibility, all doors on campus could be energy-
generating revolving doors, which would be powered by the vast majority of students entering or leaving
the buildings. This is different from piezoelectric tiles, which do not cover all available floor space and
therefore are incapable of capturing all available pedestrian energy; the pedestrian flow analysis
conducted before any piezoelectric tile installation is essentially a method of increasing the probability
that pedestrian footsteps will land on the tiles, but with revolving doors, no flow analysis is necessary
because doorways act as choke points through which all students must pass. The other reason that
harnessing the energy of revolving doors would be effective on the Tech Campus is that there is always
a large amount of travel between buildings on any college campus; many students switch buildings
hourly as they move between classrooms, dining halls, and dorms, which would lead to an above-
average amount of energy generation.
1.2.2.2 Methodology and Data Collection
The first step to determining feasibility was to examine the different products available for purchase.
There is currently only one: the NRG+ Tourniket revolving door produced by Boon Edam. Revolving
door energy generation is extremely specialized, and therefore no other options are currently being
produced. The next step was to gather information about the product, which Boon Edam provided in
response to an email inquiry. An NRG+ Tourniket revolving door costs approximately $50,000, and
installation would take 2-3 days for two workers. These doors are also not able to connect to the electric
grid; the energy they generate is used to run the doors’ internal systems, including security, remote
locking, and LED lighting (the current model of the door generates 10W of power for each pedestrian
who walks through it, which is sufficient to meet these needs). Boon Edam assured that over the next
several years, an improved model of the door would be produced that would offer more options,
potentially including electrical grid connection and power export capabilities.
PHASE II PLANNING | CORNELL TECH INITIATIVES | SPRING 2015 11
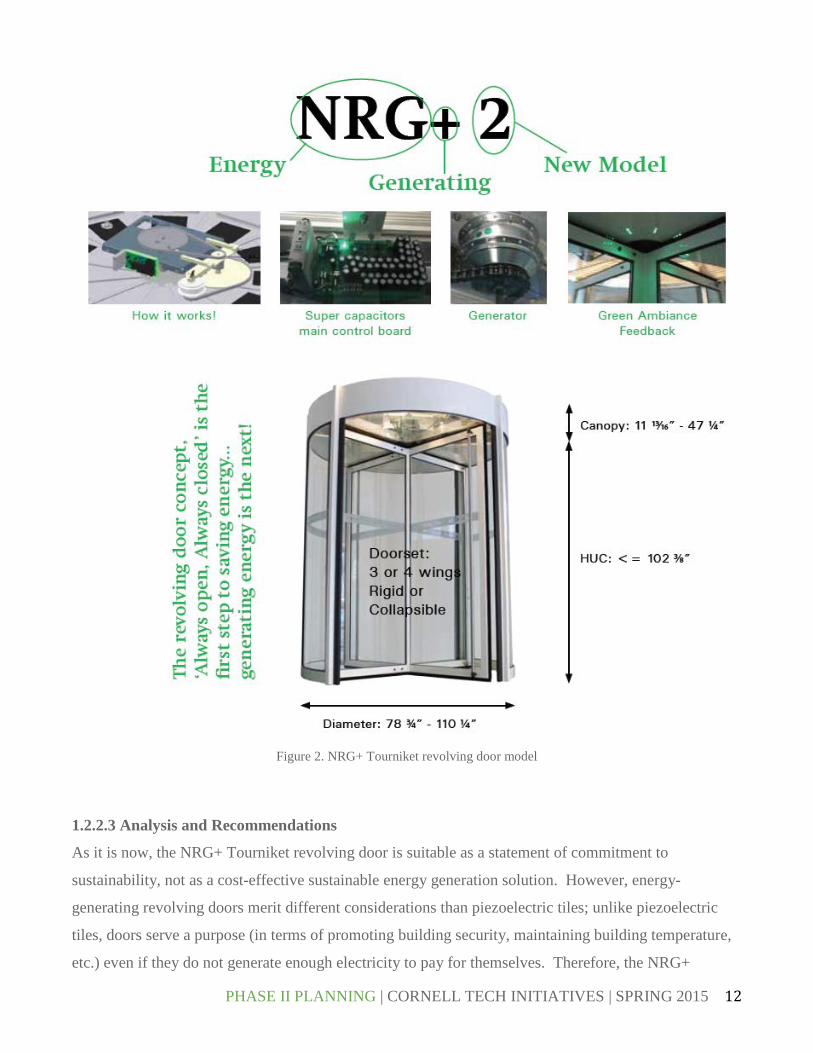
Figure 2. NRG+ Tourniket revolving door model
1.2.2.3 Analysis and Recommendations
As it is now, the NRG+ Tourniket revolving door is suitable as a statement of commitment to
sustainability, not as a cost-effective sustainable energy generation solution. However, energy-
generating revolving doors merit different considerations than piezoelectric tiles; unlike piezoelectric
tiles, doors serve a purpose (in terms of promoting building security, maintaining building temperature,
etc.) even if they do not generate enough electricity to pay for themselves. Therefore, the NRG+
PHASE II PLANNING | CORNELL TECH INITIATIVES | SPRING 2015 12

Tourniket remains a strong candidate for utilization on campus. It sends a strong message of
commitment to sustainability (some of the door’s interior LED lights are green, providing a reminder of
the technology at work, and each door contains 23% recycled content), and the door’s low energy use
and recycled materials meet LEED requirements. The doors also have all of the features required by a
modern urban university campus, including a secure locking mechanism and the capability to be locked
remotely. Due to all of these features, there are benefits to using these doors even given their inability to
export power to the grid. It will also be worth paying attention to future iterations of the technology
produced by Boon Edam and other door manufacturers; it is possible that by the time Phase II of the
Tech Campus is constructed, there will be an energy-generating revolving door on the market that can
act as a cost-effective component of the campus’ sustainable energy generation plan.
1.2.3 Solar Paneling Arrays
1.2.3.1 Introduction
Solar panel technology continues to grow as one of the leading sustainable technologies. It’s used
frequently for both commercial and residential purposes. With respect to the Tech Campus, it is assumed
that all rooftops should be equipped with either a solar-panel array or a green rooftop if funding allows
for it.
1.2.3.2 Methodology and Assumptions
When analyzing the implementation of solar panel arrays into the Tech Campus, many assumptions
needed to be made. For rooftop arrays, it was assumed that only 90% of each rooftop would hold Solar
Panels, leaving room for maintenance and other infrastructure needs. Cost estimation depends on
numerous factors according to an employee from the company Solar-City. For example, the size of the
system changes the cost of the entire array, if the array is split up (across multiple rooftops), it becomes
a more complex project. Different states have different regulations and incentives. The geographical
location also affects the demand logic and thus the price. Due to the difficulty of estimating the cost of
each array, a cost of $0.50 per watt was applied for this analysis (Clean Technica, 2015). In addition,
maintenance costs are difficult to estimate, so they were left out of the analysis.
1.2.3.4 Floating Solar Array
The CUSD Tech Solar Team plans on designing a floating solar array on the South-Eastern side of
Roosevelt Island to provide supplementary power to the Tech Campus.
PHASE II PLANNING | CORNELL TECH INITIATIVES | SPRING 2015 13
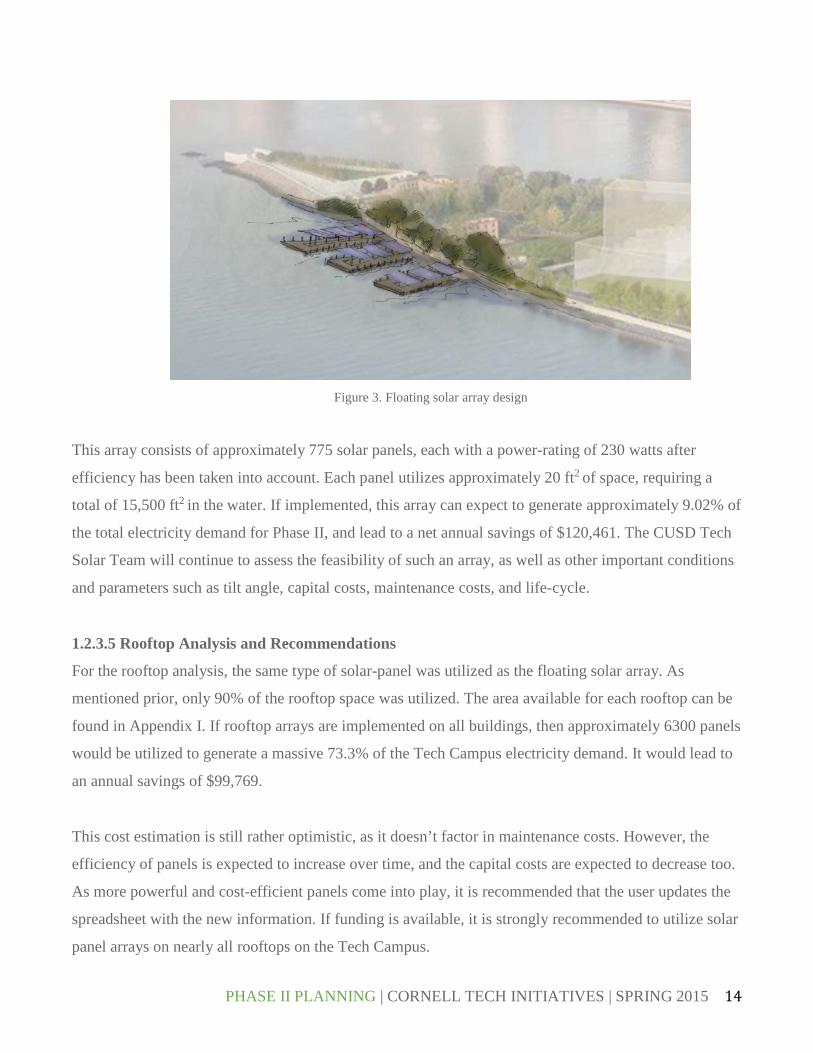
Figure 3. Floating solar array design
This array consists of approximately 775 solar panels, each with a power-rating of 230 watts after
efficiency has been taken into account. Each panel utilizes approximately 20 ft2 of space, requiring a
total of 15,500 ft2 in the water. If implemented, this array can expect to generate approximately 9.02% of
the total electricity demand for Phase II, and lead to a net annual savings of $120,461. The CUSD Tech
Solar Team will continue to assess the feasibility of such an array, as well as other important conditions
and parameters such as tilt angle, capital costs, maintenance costs, and life-cycle.
1.2.3.5 Rooftop Analysis and Recommendations
For the rooftop analysis, the same type of solar-panel was utilized as the floating solar array. As
mentioned prior, only 90% of the rooftop space was utilized. The area available for each rooftop can be
found in Appendix I. If rooftop arrays are implemented on all buildings, then approximately 6300 panels
would be utilized to generate a massive 73.3% of the Tech Campus electricity demand. It would lead to
an annual savings of $99,769.
This cost estimation is still rather optimistic, as it doesn’t factor in maintenance costs. However, the
efficiency of panels is expected to increase over time, and the capital costs are expected to decrease too.
As more powerful and cost-efficient panels come into play, it is recommended that the user updates the
spreadsheet with the new information. If funding is available, it is strongly recommended to utilize solar
panel arrays on nearly all rooftops on the Tech Campus.
PHASE II PLANNING | CORNELL TECH INITIATIVES | SPRING 2015 14

1.3. Energy Demand Reduction
1.3.1 Green Roof
1.3.1.1 Introduction
Green roofs are a revolutionary way of applying the concepts of sustainability in the underutilized space
of rooftops in urban environments. There are many environmental and energy benefits, making the hard
infrastructure of the rooftop more efficient. Also, the vegetation can serve as retreat for office workers or
apartment residents and even non-accessible green roofs can create a more pleasing view for
surrounding neighbors and provide a safe habitat for wildlife in an urban environment.
Green roofs consist of a waterproofing membrane, growing medium (soil) and vegetation overlying a
traditional roof. There are two types: intensive and extensive. Intensive green roofs are elevated parks
that contain trees, walk away and benches along with the structural support, irrigation, drainage and
protection layers. Extensive green roof are lighter and require less maintenance, but they exist only for
their environmental benefits and don’t function as accessible rooftop gardens.
The application of a layer of vegetation on rooftops provides many environmental benefits to the
building itself and its surrounding area. The plants and soil can function as a sponge, mitigating water
runoff and sewer overflows, by absorbing and filtering water that would otherwise wash through
polluted streets. Also, green roof plants can remove air particles and produce oxygen, improving the air
quality of the area.
In terms of energy, the use of heat energy during the evapotranspiration process of the plants contributes
to reduce Urban Heat Island Effect. This is very common in urban environment where there is an excess
of reflective and impermeable surfaces. This effect increases temperatures in these areas, amplifying the
demand for air conditioning and, therefore, energy consumption. Green roofs have the ability to
maintain a stable surface temperature, remaining at air temperature of cooler while traditional rooftops
can reach to 90º F above air temperature. The vegetation insulates the building from intense temperature
and can minimize heat gain. Therefore, the use of green roof can reduce the uncomfortable effects of
Urban Heat Islands and help to achieve a more sustainable energy usage.
PHASE II PLANNING | CORNELL TECH INITIATIVES | SPRING 2015 15
The initial costs of green roof are significantly higher than traditional rooftops, but long-term benefits
can outweigh these costs. The roof membrane is protected from harsh weather and ultraviolet radiation,
so it has its lifespan is extended and it demands less frequent replacement than typical rooftops.
The utilization of green rooftops can bring many environmental, energy and economic benefits. They
provide a much more efficient usage of an otherwise non-functional structure. For the Cornell Tech
campus, they work as an effective way to translate the mission and goals of developing a sustainable and
green space.
1.3.1.2 Methodology and Data Collection
The energy savings were estimated using the estimated areas for the rooftops of buildings of Phase II
(Appendix I: Campus Area Calculations) and an energy calculator developed by the Green Building
Research Laboratory, of Portland State University (Portland State University, n.d.). This module is part
of the standard release of the US Department of Energy's EnergyPlus.
The model takes into consideration the underlying EnergyPlus building energy simulation code that
accounts for internal and environmental loads on the building, mechanical/HVAC equipment schedules
and efficiencies.
1.3.1.3 Analysis
For the energy saving estimation, it was considered that the rooftops of Cornell Tech campus would be
covered with semi-intensive green roofs, which are the most common type of green roof in the US and
internationally (United States General Services Administration, 2011). With this, a few assumptions
were made:
● It was assumed that the growing media depth was 6 inches (semi-intensive green roofs vary from
4-6 inches)
● The Leaf Area Index (LAI), which varies from 0 to 5, was assumed to be 2.5
● The roof was not modeled to be irrigated
● The green roof covers 100% of every rooftop
The following table presents the energy savings for the two Residential towers. A more detailed
table with the estimation from every building of Phase II can be found in Appendix III: Green roof
energy analysis calculations.
PHASE II PLANNING | CORNELL TECH INITIATIVES | SPRING 2015 16

Table 2. Green roof potential energy savings
Annual Energy
Savings (kWh)
Gas Savings
(Therms)
Cost/Savings
in Electricity
Cost/Savings in
Electricity
Total Energy
Savings
1st
Residential
Tower
2121.5 147.5 $169.72 $41.30 $211.02
2nd
Residential
Tower
2009.0 139.7 $160.72 $39.11 $199.83
Sum 4130.5 287.2 $330.44 $80.41 $410.85
The values for energy and gas savings were calculated by comparing the green roof to the conventional
black roofs. From the analysis, the Energy savings are not very significant in comparison to the overall
demand of Phase II buildings (see Table 6) and that there is no gas savings for the non-residential
buildings (Appendix III). This means that the buildings are spending more in heating and cooling that if
they were using black roofs. After further research, it was concluded that this is a plausible outcome that
can happen because of the wet layer that covers the building. The green roof must allow water and air to
be stored so the vegetation can grow healthy. Because of the water is not a good insulator, it is possible
that there is heat loss in the winter months. Also, in the summer, dry green roof soil can store heat and
increase cooling needs.
In terms of costs, the utilization of green rooftops does not contribute significantly in reducing the
spending of energy. Also, the initial costs of average of $20/ ft2 (Peck, 2003). In comparison to the
average of $2/ft2 and maintenance costs represent a very significant increase from traditional black
rooftops.
PHASE II PLANNING | CORNELL TECH INITIATIVES | SPRING 2015 17

1.3.1.4 Conclusions
From the energy analysis, it can be concluded that green rooftops do not have a significant energy
impact and have a higher costs than traditional rooftops, but there are many environmental factors that
vary from the simulation and other benefits must be taken into consideration.
In terms of energy consumption, the application of green rooftops in the totality of the buildings in
Phase II represent some savings in electricity, but increased demand in natural gas. This is a plausible
outcome that is highly dependent of the conditions in which the buildings are constructed and the energy
simulation is not an entirely accurate measurement. As observed in Appendix III, the amount of energy
consumed by the green roof varies by type of building, for office use or residential use. The tables
above considered that every rooftop will be covered with green roof vegetation, but optimal use of
energy can be achieved by application of the technology in specific buildings. Also, current data about
the buildings of Phase II are not complete, so as they are developed, the input for energy analysis
become more accurate and the actual energy consumption can be achieved.
Another negative aspect of green roof is the initial expenses, which is significantly greater than the
traditional black rooftops. However, long-term economic benefits must be considered. The extra layer of
vegetation functions as a protection for the rooftop membrane, extending its lifespan to 40 years, in
comparison to about 17 years for a conventional roof (United States General Services Administration,
2011). This means that this membrane will demand less frequent replacement or maintenance costs.
Also, green roofs allow the management of storm water runoff, reducing sewage overflow issues.
Moreover, the air quality improvements and the opportunity given for the building occupants to enjoy a
green space are non-quantifiable benefits that count towards green roofing.
Overall, the energy analysis is a preliminary study of how green roof can be applied to the Tech
Campus. Although the results showed small benefits and increase in costs, this technology have great
potential to be improved as the project is developed and the industry grows to drop the prices.
1.3.1.5 Recommendations
This study was a preliminary analysis of the application of green roof technology in every building of
Cornell Tech campus Phase II. It showed small benefit in electrical energy savings and higher gas
demands for non-residential buildings. Still, this does not mean that green roofing should not be
considered, as there are many factors that must be taken into account when designing such a technology
PHASE II PLANNING | CORNELL TECH INITIATIVES | SPRING 2015 18
that has yet to be confirmed. Currently, the very initial concepts of each building are still rough
estimates. As the project is developed over time, the technology is bound to be more effective. Also,
non-quantifiable benefits such as air improvement and the providing of a green space for the campus
occupants are important facts that must be considered. The utilization of a green rooftop is a very
effective visual representation of the mission of Cornell Tech in providing a sustainable and green space
within the heavily urbanized area of New York City.
1.4. Energy Analysis Master Spreadsheet
1.4.1 Overview
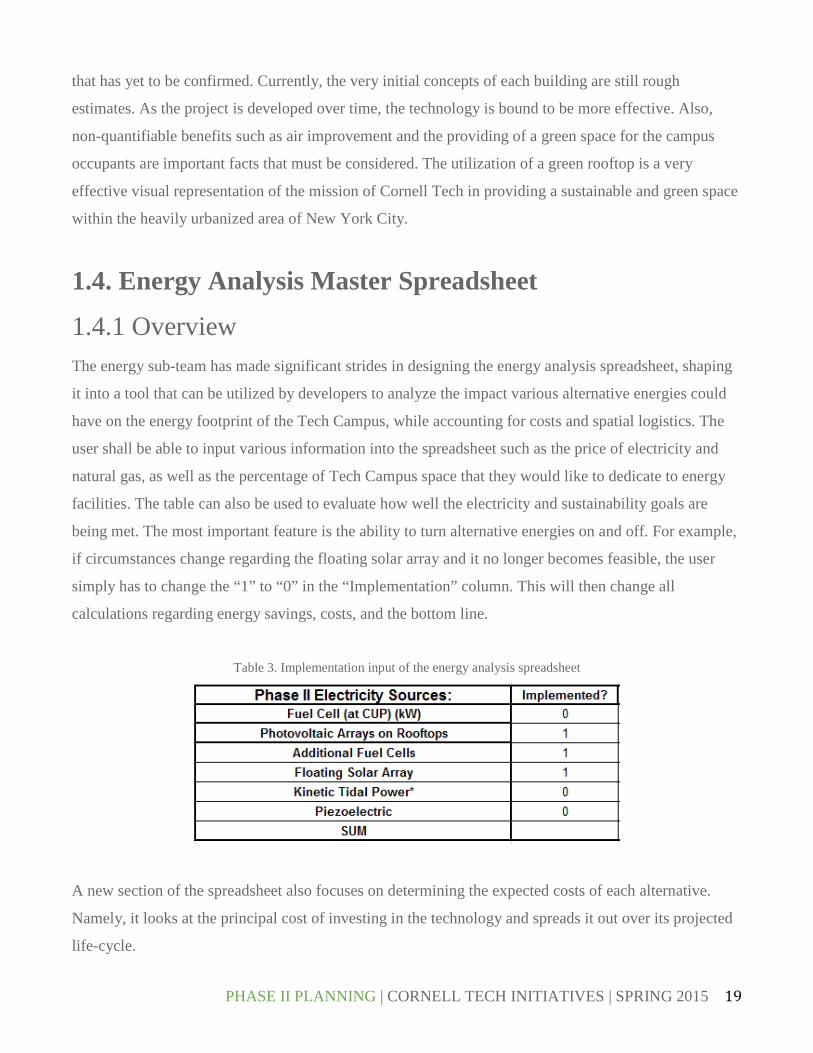
The energy sub-team has made significant strides in designing the energy analysis spreadsheet, shaping
it into a tool that can be utilized by developers to analyze the impact various alternative energies could
have on the energy footprint of the Tech Campus, while accounting for costs and spatial logistics. The
user shall be able to input various information into the spreadsheet such as the price of electricity and
natural gas, as well as the percentage of Tech Campus space that they would like to dedicate to energy
facilities. The table can also be used to evaluate how well the electricity and sustainability goals are
being met. The most important feature is the ability to turn alternative energies on and off. For example,
if circumstances change regarding the floating solar array and it no longer becomes feasible, the user
simply has to change the “1” to “0” in the “Implementation” column. This will then change all
calculations regarding energy savings, costs, and the bottom line.
Table 3. Implementation input of the energy analysis spreadsheet
A new section of the spreadsheet also focuses on determining the expected costs of each alternative.
Namely, it looks at the principal cost of investing in the technology and spreads it out over its projected
life-cycle.
PHASE II PLANNING | CORNELL TECH INITIATIVES | SPRING 2015 19

Table 4. Energy Cost Analysis
It then compares the costs to the projected savings that this technology will generate. While not all
technologies will have positive cost-to-savings ratios, it’s important to consider that there are other
benefits and incentives to having the sustainable technology. In addition, this section currently does not
factor in variables such as depreciation, tax incentives, and salvage costs. The summation of these costs
make up the “infrastructure cost” in the final economic analysis tables and in Appendix III.
1.4.2 Best Estimated Results
To demonstrate a comprehensive use of the spreadsheet, we will examine “best-case” scenario and
analyze the results. In this scenario there will be no main Fuel Cell at the CUP. However, solar panel
arrays for all buildings except the residential buildings will be turned on. For the two residential
buildings, there will be two green roofs instead, which will contribute to a reduction in the energy
demand. There will be 10 smaller fuel cells that provide auxiliary power. Piezoelectric tiling is turned
off (or not implemented) due to its large capital costs. The spreadsheet input will reflect these values:
Table 5. Best estimations for electricity and gas
The $2.80 price of natural gas is the NYC value as of May 2015. 1% of space dedicated to energy
facilities was chosen arbitrarily. Lastly, the two goals reflect information found in LEED and EIS
respectively.
PHASE II PLANNING | CORNELL TECH INITIATIVES | SPRING 2015 20
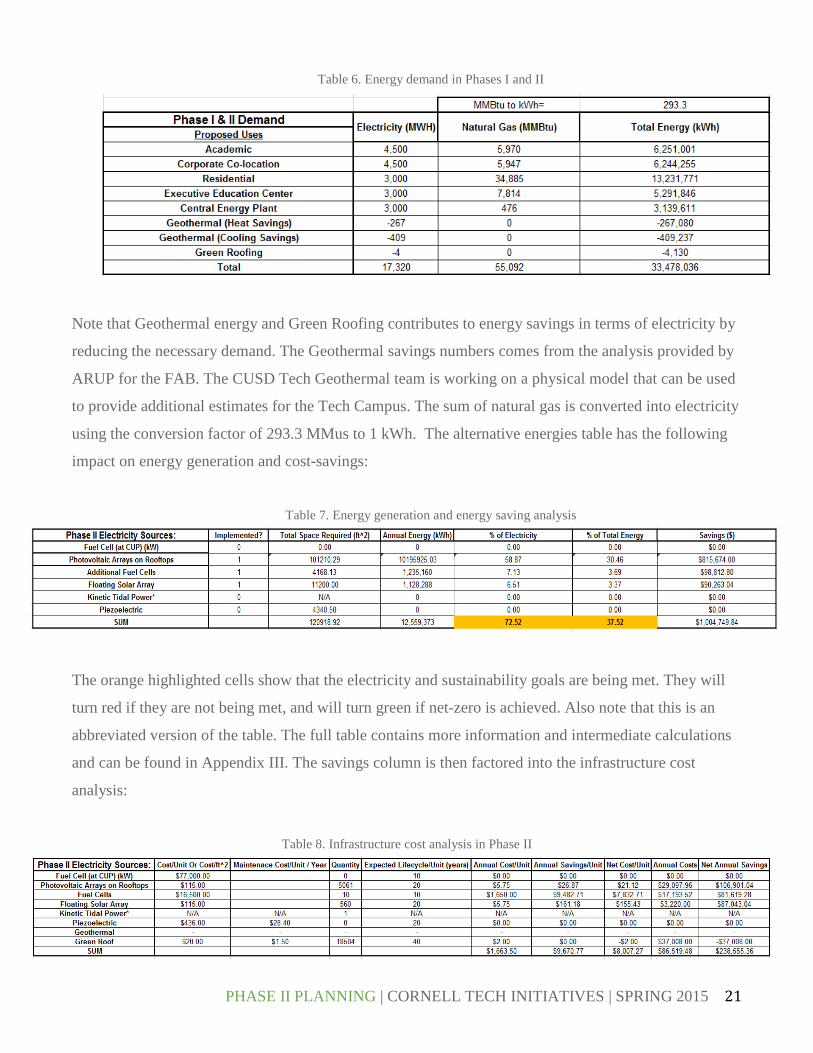
Table 6. Energy demand in Phases I and II
Note that Geothermal energy and Green Roofing contributes to energy savings in terms of electricity by
reducing the necessary demand. The Geothermal savings numbers comes from the analysis provided by
ARUP for the FAB. The CUSD Tech Geothermal team is working on a physical model that can be used
to provide additional estimates for the Tech Campus. The sum of natural gas is converted into electricity
using the conversion factor of 293.3 MMus to 1 kWh. The alternative energies table has the following
impact on energy generation and cost-savings:
Table 7. Energy generation and energy saving analysis
The orange highlighted cells show that the electricity and sustainability goals are being met. They will
turn red if they are not being met, and will turn green if net-zero is achieved. Also note that this is an
abbreviated version of the table. The full table contains more information and intermediate calculations
and can be found in Appendix III. The savings column is then factored into the infrastructure cost
analysis:
Table 8. Infrastructure cost analysis in Phase II
PHASE II PLANNING | CORNELL TECH INITIATIVES | SPRING 2015 21

Note that the costs of geothermal energy or the Kinetic Tidal Power have not yet been calculated. In
addition, because options like the Fuel Cell at the CUP and Piezoelectric energy have been turned off,
their net annual savings values are $0.00.
The sum of the infrastructure costs column is collected and factored into the Cost/Energy analysis tables.
Along with the input data provided for price, the following table summarizes the most important
information:
Table 9. Energy Summary
The yellow and pink sections of the table reflect the electricity and natural gas demands and prices. The
orange column adds in the net annual cost of infrastructure. Lastly, the light-green section shows the
annual savings from the alternative energies. The final green section shows the total annual cost Cornell
can expect to spend on the Tech Campus.
Of course, these estimates represent a single scenario of the spreadsheet. Ideally, the developers will be
able to change parameters, variables, costs, and other factors to see where and what to invest in. Future
work on the spreadsheet includes adding in additional information into the infrastructure costs tab.
specifically, taxes, depreciation of assets, and subsidized costs (via incentive-programs) can alter the
projected costs. New information and research can always be implemented to reflect new updated
PHASE II PLANNING | CORNELL TECH INITIATIVES | SPRING 2015 22

values, or new alternative energies. Overall, the spreadsheet is flexible, and can be a useful design
decision-making tool.
PHASE II PLANNING | CORNELL TECH INITIATIVES | SPRING 2015 23

2. CAMPUS DESIGN ANALYSIS
2.1 Design Overview
2.1.1 Design Principles and Methodology
The Cornell Tech Campus is located on the south end of Roosevelt Island, south of the Ed Koch
Queensboro Bridge. Located in the East River between Manhattan and Queens, the campus has
convenient access to the other two New York boroughs as well as a diverse waterfront. The campus’s
commitment to sustainability and integration into its surroundings are detailed in the following six key
design principles.
2.1.2 Six Design Guidelines1
1. River to River Campus Vision: In order to maintain the sights from the island and its proximity
to Manhattan and Queens, the campus strives to maintain a river-to-river view. The goal of this
design is for people on the banks of Manhattan to be able to see across the East River to Queens
despite the campus’s presence on Roosevelt Island. This guideline also incorporates the
promenade into the overall design of the campus.
2. Diversity of Active Open Spaces: Various open spaces will extend throughout the campus. These
publicly accessible spaces work to bring together the island’s community as well as facilitating
movement throughout the campus.
3. Symbiosis Between Indoor and Outdoor Spaces: The ground floor of the buildings will have
amenities that facilitate movement both inside and outside the building.
4. North-South Pedestrian Spine: There will be a central pedestrian path that runs from the north
end of the campus to the south end. This will be the main circulation path through the campus
and ensures interaction between campus users. This central path also makes navigation and way-
finding through the campus easier for visitors.
5. Optimization of Campus Buildings for Use and Performance: Academic and corporate co-
location buildings will be placed along the pedestrian spine in order to facilitate connections
between the building users. In Phase I, the residential and Executive Education Center buildings
will be constructed on the far north end of the campus in order to maximize natural light.
1 Project description from EIS PHASE II PLANNING | CORNELL TECH INITIATIVES | SPRING 2015 24
6. Livable and Sustainable Campus: In an effort to create a livable and sustainable campus, the
campus design intends to increase pedestrian traffic, maintain the island’s view of the adjacent
boroughs, and utilize various forms of renewable energy sources.
2.1.3 Implementation
These guidelines have been addressed and implemented into the master plan for Phase II. These
pathways intersect a central pedestrian spine runs from the north end to the south end of the campus.
Narrower pathways run across the main pathway and the buildings placed along the central spine are
oriented to maximize solar exposure as well as maintain the river-to-river sights of the island. The
proposed design for Phase II of the campus includes one main plaza in the center of the campus as well
as a secondary open space on the southeast corner of the campus. These spaces serve to assist in way-
finding as well as to provide ample amount of public green space. The central space in the center of
Phase II is a highly versatile area that can be utilized for a variety of both formal and informal activities.
Its positioning and size makes it an ideal location for campus events, including the highly anticipated
Tech Market, which is an event that will allow companies and students to network and share ideas.
The Cornell Tech Campus strives to be sustainable in its energy usage as well as design. All the
buildings on campus are expected to be LEED Silver and the campus as a whole aims to achieve LEED
certification in Neighborhood Development. In efforts to reach this level of sustainability, we have
proposed a bike share program that will run through the campus and can be utilized across the entire
island. Additionally, urban heat sources have been addressed in the proposal for vertical farming and
solar rooftops. These innovative building designs not only have a positive impact on the environment,
but they also can reduce building heating and cooling costs.
In planning Phase II of the campus, the ecological impact of construction as well as long-term
environmental impacts on the campus have been evaluated. Assessment of the effects of the urban
environment on the ecology of an area has led us to find that the urban environment poses a threat to
bird populations and migratory patterns. Fortunately, minimizing bird collisions with buildings can be
achieved through careful selection of building material. On the converse side of this urban-ecological
relationship, we have also looked at the natural environment’s effect on the campus. The largest risk
factor that the campus faces is flooding. Proposed solutions for increasing flood resilience include
elevating the buildings or constructing amphibious buildings, which would float if the island were to be
submerged.
PHASE II PLANNING | CORNELL TECH INITIATIVES | SPRING 2015 25

2.2 Design Considerations
2.2.1 Flood Mitigation
2.2.1.1 Introduction
Roosevelt Island is situated on the East River, a tidal strait with strong currents and high tide variations
averaging -1.5 ft to 2.7 ft throughout the day. It is classified as Zone B in NYC’s Flood Risk Map,
vulnerable to flooding from a Category 2 hurricane (13-16.6 ft storm surge) or higher. The FEMA Flood
Insurance Rate Map (see Figure 5) classifies it as Zone X and demarcates the boundaries of a 100-year
and 500-year flood. A 100-year flood, shown in blue, would inundate the perimeter esplanade. The 500-
year floodplain, indicated in black, covers another 50 feet inland, affecting the perimeter loop road as
well as several peripheral portions of the site. As the site is topographically elevated along its central
NW-SE axis, functions situated along this axis are less vulnerable to flooding.
Figure 5. Flood Insurance Rate Map (Cornell University Facilities Services, 2012)
The risk associated with short-term flooding events is compounded by significant predicted sea level
rises in the East River, which would result in more permanent inundation of significant portions of
Roosevelt Island. The New York City Panel on Climate Change (NPCC) 2015 Report predicts a sea
level rise of 4.8 ft (90th percentile) by 2080, relative to the 2000-2004 base period (see Table 10 below)
PHASE II PLANNING | CORNELL TECH INITIATIVES | SPRING 2015 26

(New York City Panel on Climate Change, 2015). This has severe implications on the recurrence
intervals of 100-year floods – Global Climate Models (GCMs) predict that by the 2080’s, the current
100-year flood level is likely to occur every 15 to 35 years (increasing this to a 6.6% annual likelihood).
At a worst case scenario of rapid ice melt, this 100-year flood level will also engulf almost the entire
island (Cornell University Facilities Services, 2012).
Table 10. NYC sea level rise projections (New York City Panel on Climate Change, 2015)
Figure 6. Cornell NYC Tech Floor Elevation Memo (Cornell University Facilities Services, 2012)
General insurance and code design criteria require all permanent construction to be at least 1 foot above
the 100-year flood line, thus being the equivalent of a 13.265 ft elevation on our site. Considering site
elevation, infrastructural constraints, flood data and sea level projections, the Cornell NYC Tech Floor
Elevation Memo (Feb 2012) identifies several preliminary strategies for flood mitigation.
PHASE II PLANNING | CORNELL TECH INITIATIVES | SPRING 2015 27

Firstly, a minimum first floor (main level) elevation is set at 24 ft. Secondly, building programs should
be arranged according to ‘flood-ability’. Critical resources and infrastructure should be place above 24 ft
elevation, while all mechanical systems located below the 24 ft elevation should be flood proof. The
campus’ main electricity provider requires all primary utility gear to be located above Category 3 Storm
levels, i.e. 20 ft. Thirdly, provisions should be made for shelter-in-place and power “islanding”, in
addition to the generation of early evacuation emergency plans. Fourth, campus design should consider
elevated walkways to connect buildings, and providing access to higher ground (Cornell University
Facilities Services, 2012).
This semester’s research focused on two developing two strategies for the mitigation of flooding risks.
Firstly, as an extension the concept of programming buildings according to ‘flood-ability’, the strategic
designation of building functions specific to the campus in order to minimize damage in the event of a
flood was studied. Secondly, the feasibility of applying amphibious building design to the campus was
studied as a strategy of adapting to the predicted future of higher and more severely fluctuating sea
levels or more highly recurring flood events.
Amphibious buildings are able to float on the surface of rising floodwater rather than succumb to
inundation. Under normal circumstance, a hollow concrete foundation retains a home’s connection to
the ground by resting firmly on the earth. During flooding, the buoyant substructure displaces water to
provide flotation as needed, and a vertical guidance system (mooring posts) allows it to return to the
same position upon descent (see Figure 3). It is critical that during flooding debris does not get trapped
beneath the structure, as this would affect the structure’s ability to return to the same position (ICAADE,
2015).
PHASE II PLANNING | CORNELL TECH INITIATIVES | SPRING 2015 28

Figure 7. Amphibious Building Design (BACA Architects, 2013)
2.2.1.2 Methodology
For a study of site conditions and flooding risk, the Floor Elevation Recommendation Site Design
Memorandum published by Cornell University Facilities Services was referenced.
Case studies from the Netherlands, UK and Thailand were researched online. In the Netherlands, the
Dutch ministries of Traffic and Water Management and Housing, Spatial development and Environment
initiated an experiment in flood-resilient development on 15 designated “EMAB”2 sites. The “De
Gouden Kust” project in Maasbommel in 2005 included the design and construction of 32 amphibious
houses. The houses successfully withstood a flooding event on January 12, 2011, in which water levels
rose by more than 7 meters (23 ft) (Factor Architecten, 2011). Elements of this project were studied as
precedent, based on what information was available. However, available information was insufficient to
conduct a detailed study and cost-benefit analysis based on specific construction materials and
techniques. Engineering and structural details of the design and construction of amphibious buildings are
to be published in a book by Chris Zevenbergen and Elizabeth English, “Amphibious Building Design
and Construction” (CRC Press) in November 2015. The First International Conference on Amphibious
Architecture, Design & Engineering organized by the same authors will be held in Bangkok, Thailand,
in August 2015. As such, a framework for analysis is described based on an adaptation of Anderson’s
study of the feasibility of developing an amphibious building neighborhood in San Francisco’s Redwood
City (Anderson, 2014). Analysis focuses on the academic and corporate co-location buildings because of
2 Experiment Met Aangepaste Bouwvormen (Experiments with Alternative Building) PHASE II PLANNING | CORNELL TECH INITIATIVES | SPRING 2015 29

their shorter heights of 4 to 6 stories, which would make them likelier candidates for amphibious
building design.
2.2.1.3 Analysis
Based on the Archimedes Principle, the up-thrust on a submerged object is equal and opposite in
direction to the weight of fluid displaced.
The formula applied to calculate the height of the portion of an amphibious building that would be
submerged in the event of a flood is U = G / (A x P), where U is the vertical drop below the waterline
(ft), G is the weight of the building, comprising dead load and live load (kN), A is the building footprint
(ft2), and P is the density of w ater (kN /ft3).
2.2.1.4 Building Footprints and Heights
For the proposed campus design, footprint areas of the second and third academic buildings are
estimated at 175,000 ft2 and 245,000 ft2. Footprint areas of the second and third corporate co-location
buildings are estimated at 170,000 ft2 and 230,000 ft2.
According to Cornell University’s Physical Facilities, the academic and corporate co-location buildings
are each 4-6 stories in height. Based on this information, a conservative (low) and a high estimate of
building size for each building type was created: Table 11. Buildings footprints and heights.
Academic Building Corporate Co-Location Building
Low estimate Footprint: 175,000 ft2
Height: 4 stories
Footprint: 170,000 ft2
Height: 4 stories
High estimate Footprint: 245,000 ft2
Height: 6 stories
Footprint: 230,000 ft2
Height: 6 stories
2.2.1.5 Determining Dead Load
According to the American Society of Civil Engineers (ASCE), dead loads include self-weight of all
items of permanent nature that will act continuously throughout the service life of the building. Material
PHASE II PLANNING | CORNELL TECH INITIATIVES | SPRING 2015 30

load values are provided in terms of pounds per square foot (lb/ft2) and pounds per cubic foot (lb/ft3),
depending on the material. Most of the values are given in pounds per square foot because the depth
value of the material is included in the load whereas certain values are given in terms of pounds per
cubic foot in order to accommodate varying thicknesses of materials. The weight of the materials can be
calculated by multiplying the area of each material (ft2) by its material load (lb/ft2). The sum of these
values should then be converted to kilonewtons for the purpose of this equation, to produce the total
dead load in kN.
The materials of construction and fixed service equipment vary widely between buildings. As such, the
2006 International Building Code refrains from providing an estimated dead load for non-residential
buildings.3 (International Code Council, 2006) For the purpose of this feasibility study, the typical floor
and roof dead load of 47 lb/ft2 taken from Ochschorn will be used, which converts to 0.209 kN/ft2
(Ochschorn, 2009).
2.2.1.6 Determining Live Load
The live load is produced by the use and occupancy of the building or other structure that does not
include construction or environmental loads, such as wind load, snow load, rain load, earthquake load,
flood load, or dead load. For academic buildings, the minimum uniformly distributed live load is 40
lb/ft2 for classrooms, 80 lb/ft2 for corridors above the first floor, and 100 lb/ft2 for first-floor corridors.
(American Society of Civil Enginners (ASCE), 2002). Multiplying the average values (70 lb/ft2 for the
first floor and 60 lb/ft2 for subsequent floors) by the corresponding floor area would provide an estimate
of the live load of an academic building. This converts to 0.311 kN/ft2 for the first floor and 0.267 kN/ft2
for subsequent floors.
For the corporate co-location buildings, the minimum uniformly distributed live load is 50 lb/ft2 for
offices, 80 lb/ft2 for corridors above the first floor, and 100 lb/ft2 for lobbies and first-floor corridors
(American Society of Civil Enginners (ASCE), 2002). Multiplying the average values (75 lb/ft2 for the
first floor and 65 lb/ft2 for subsequent floors) by the corresponding floor area would provide an estimate
of the live load of a corporate co-location building. This converts to 0.334 kN/ft2 for the first floor and
3 The academic and corporate co-location buildings fall within occupancy category III. PHASE II PLANNING | CORNELL TECH INITIATIVES | SPRING 2015 31
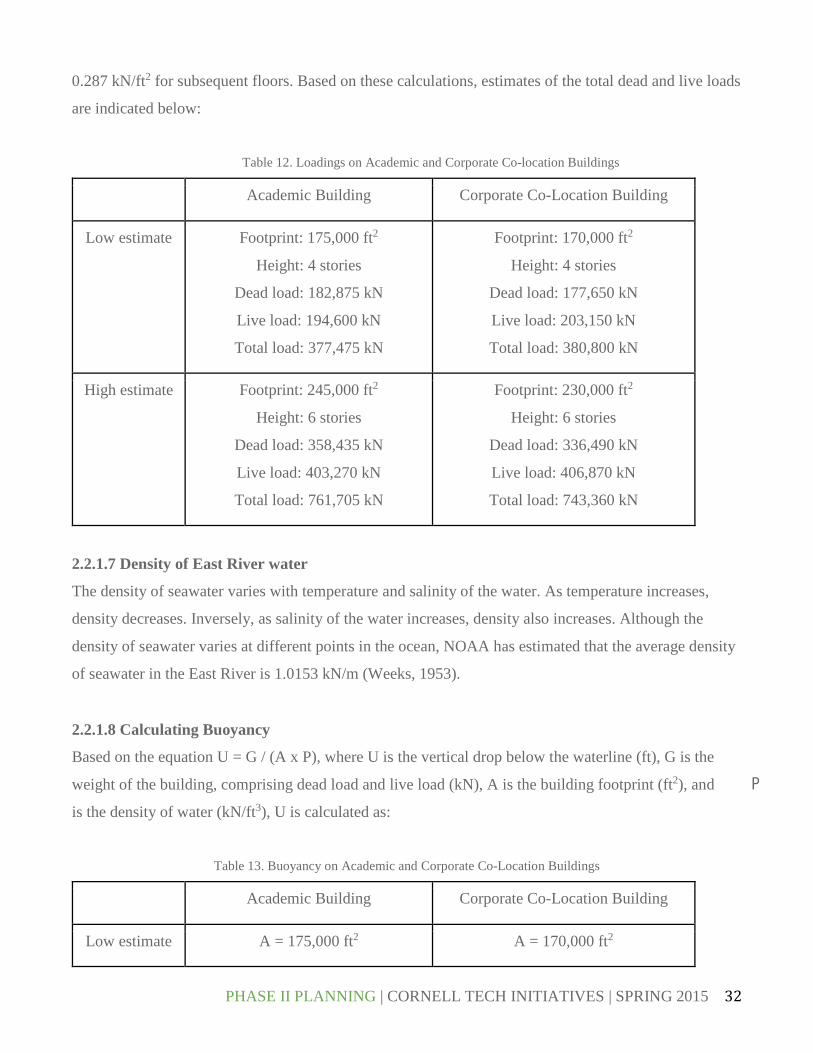
0.287 kN/ft2 for subsequent floors. Based on these calculations, estimates of the total dead and live loads
are indicated below:
Table 12. Loadings on Academic and Corporate Co-location Buildings
Academic Building Corporate Co-Location Building
Low estimate Footprint: 175,000 ft2
Height: 4 stories
Dead load: 182,875 kN
Live load: 194,600 kN
Total load: 377,475 kN
Footprint: 170,000 ft2
Height: 4 stories
Dead load: 177,650 kN
Live load: 203,150 kN
Total load: 380,800 kN
High estimate Footprint: 245,000 ft2
Height: 6 stories
Dead load: 358,435 kN
Live load: 403,270 kN
Total load: 761,705 kN
Footprint: 230,000 ft2
Height: 6 stories
Dead load: 336,490 kN
Live load: 406,870 kN
Total load: 743,360 kN
2.2.1.7 Density of East River water
The density of seawater varies with temperature and salinity of the water. As temperature increases,
density decreases. Inversely, as salinity of the water increases, density also increases. Although the
density of seawater varies at different points in the ocean, NOAA has estimated that the average density
of seawater in the East River is 1.0153 kN/m (Weeks, 1953).
2.2.1.8 Calculating Buoyancy
Based on the equation U = G / (A x P), where U is the vertical drop below the waterline (ft), G is the
weight of the building, comprising dead load and live load (kN), A is the building footprint (ft2), and P
is the density of water (kN/ft3), U is calculated as:
Table 13. Buoyancy on Academic and Corporate Co-Location Buildings
Academic Building Corporate Co-Location Building
Low estimate A = 175,000 ft2 A = 170,000 ft2
PHASE II PLANNING | CORNELL TECH INITIATIVES | SPRING 2015 32
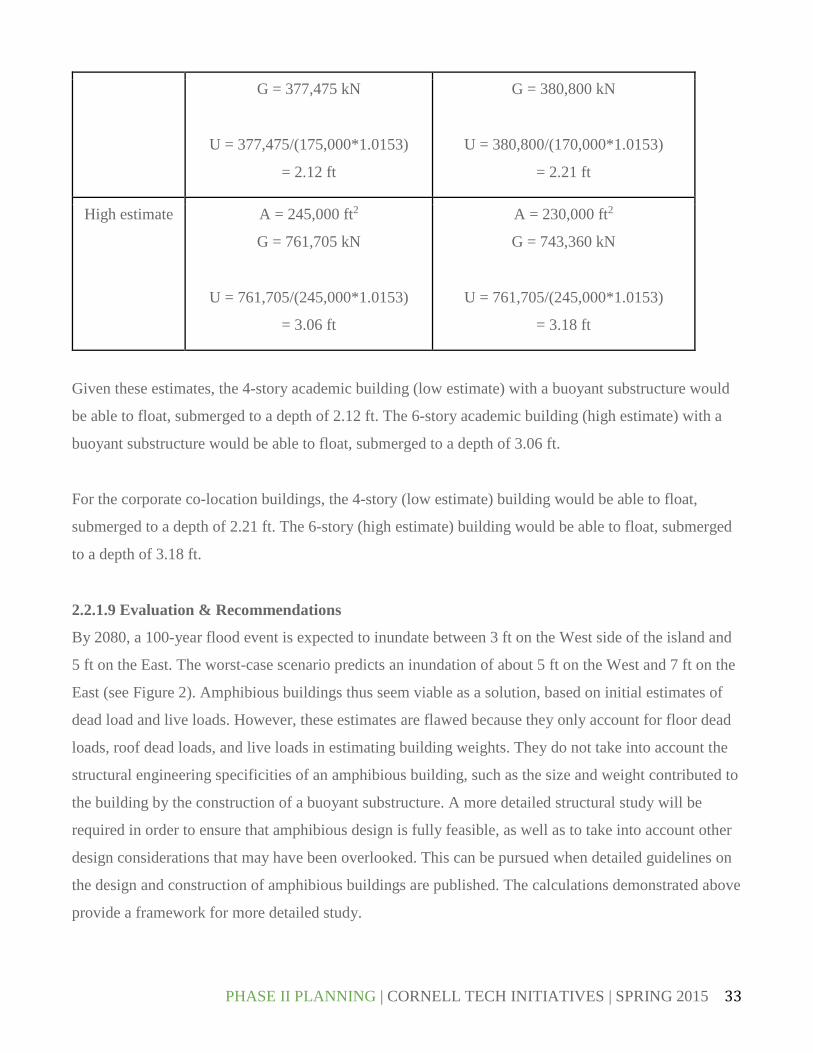
G = 377,475 kN
U = 377,475/(175,000*1.0153)
= 2.12 ft
G = 380,800 kN
U = 380,800/(170,000*1.0153)
= 2.21 ft
High estimate A = 245,000 ft2
G = 761,705 kN
U = 761,705/(245,000*1.0153)
= 3.06 ft
A = 230,000 ft2
G = 743,360 kN
U = 761,705/(245,000*1.0153)
= 3.18 ft
Given these estimates, the 4-story academic building (low estimate) with a buoyant substructure would
be able to float, submerged to a depth of 2.12 ft. The 6-story academic building (high estimate) with a
buoyant substructure would be able to float, submerged to a depth of 3.06 ft.
For the corporate co-location buildings, the 4-story (low estimate) building would be able to float,
submerged to a depth of 2.21 ft. The 6-story (high estimate) building would be able to float, submerged
to a depth of 3.18 ft.
2.2.1.9 Evaluation & Recommendations
By 2080, a 100-year flood event is expected to inundate between 3 ft on the West side of the island and
5 ft on the East. The worst-case scenario predicts an inundation of about 5 ft on the West and 7 ft on the
East (see Figure 2). Amphibious buildings thus seem viable as a solution, based on initial estimates of
dead load and live loads. However, these estimates are flawed because they only account for floor dead
loads, roof dead loads, and live loads in estimating building weights. They do not take into account the
structural engineering specificities of an amphibious building, such as the size and weight contributed to
the building by the construction of a buoyant substructure. A more detailed structural study will be
required in order to ensure that amphibious design is fully feasible, as well as to take into account other
design considerations that may have been overlooked. This can be pursued when detailed guidelines on
the design and construction of amphibious buildings are published. The calculations demonstrated above
provide a framework for more detailed study.
PHASE II PLANNING | CORNELL TECH INITIATIVES | SPRING 2015 33

Similarly, the cost of constructing an amphibious building relative to a standard one is difficult to
estimate without an understanding of the technical details of design and construction. When details are
made available, a quantitative cost-benefit analysis can be conducted. General criteria by which a cost-
benefit analysis between different flood mitigation engineering strategies can be conducted is advised as
follows: design costs, construction costs, maintenance costs, potential savings in physical flood damage,
potential savings in program disruption (halting activities, evacuating affected areas).
Lastly, to avoid damage, building functions should be programmed according to their “flood-ability”,
with more robust and durable functions situated on the ground floor. This could include public spaces
such as atriums, or recreational facilities such as multi-purpose recreational courts. The more critical
functions and infrastructure such as laboratories with expensive equipment, and emergency power
generators, should be located on higher floors.
2.2.2 Vertical Farming
2.2.2.1 Introduction
Vertical farming is a system of commercial farming whereby plants, animals, fungi and other life forms
are cultivated for food, fuel, fiber or other products or services by artificially stacking them vertically
above each other (Adenaeuer, 2014). It consist growing crops on multiple levels within high-rise
buildings in urban areas. It is a more efficient way of producing food using less land, as it enables
production of crops all year round using less water, utilizing less agro-chemicals and reduce the adverse
environmental factors of traditional farming. With food being cultivated in urban areas, the financial and
environmental costs to import food into towns and cities are significantly reduced.
There are many ways vertical farms can be cultivated. They can be grown using hydroponics, where
plants grow in water or a growing medium that delivers nutrients directly from absorption from the
roots; aeroponics, which uses a mist to deliver the nutrients to the plant root; aquaponics, in which fish
are raised and their water is used as nutrients for the crops. The photosynthesis is brought by artificial
light and augmented by natural light.
By growing crops indoors in a controlled environment, the use of pesticide, herbicides and fungicides
can be kept to a minimum level. Also, recycling techniques ensure reduced usage of water and
reintroduction of bio-waste into the system as fertilizer or even bio-fuel.
PHASE II PLANNING | CORNELL TECH INITIATIVES | SPRING 2015 34

2.2.2.2 Data Collection
Vertical farming is still an emerging concept that have been under development in the past few decades.
There are several models and some actual examples of its application in cities that are lacking of land,
such as in Singapore and Japan.
A successful example of urban farming is the Pasona Group office building in Tokyo, Japan (Kono
Designs, n.d.). 20% of their 215,000 square foot office area is dedicated to grow a variety of vegetables
and fruits such as papaya, passion fruit, tomatoes, and lettuce. They utilize a mix of hydroponic and soil
based farming under very specific climate controlled conditions that are not only comfortable for
humans but also for the plants. The vegetables and fruits are picked and eaten right away by the workers
so there is no transport or cost related lag. The goal is not only to grow food for the employees, but to
aspire to encourage young people to consider agriculture and to re-invigorate rural areas.
Figure 8. Vertical Farming in Pasona office in Tokyo, Japan
PHASE II PLANNING | CORNELL TECH INITIATIVES | SPRING 2015 35
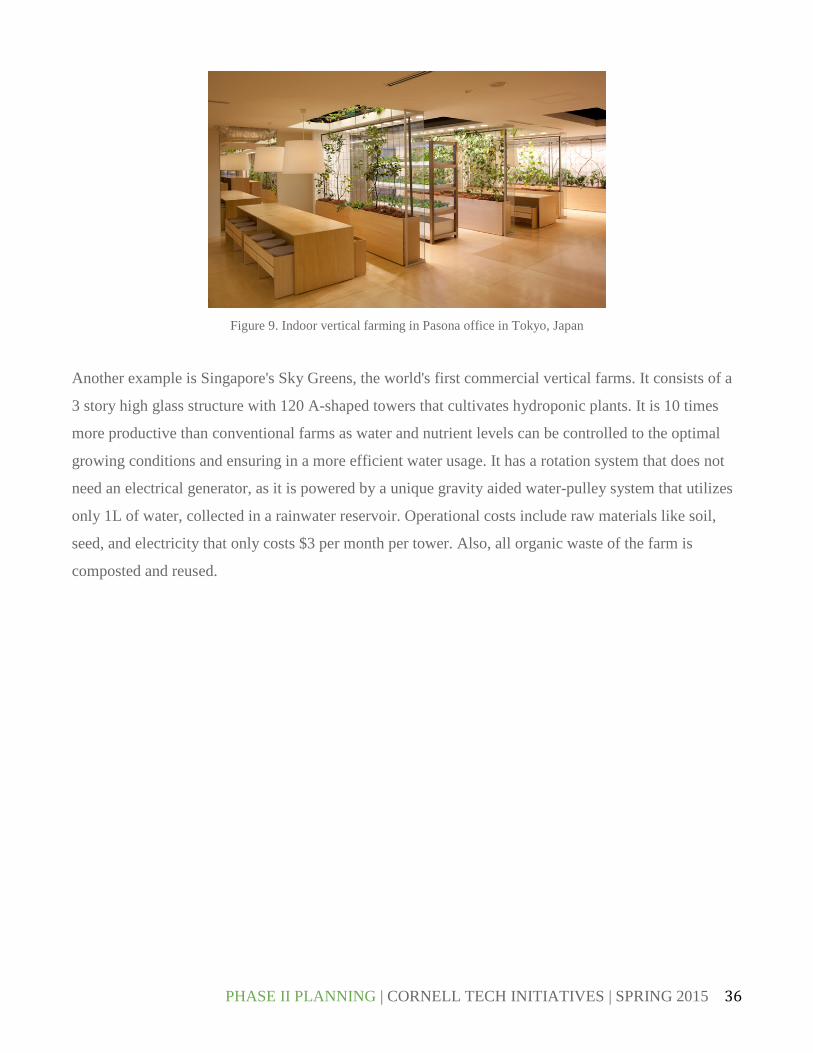
Figure 9. Indoor vertical farming in Pasona office in Tokyo, Japan
Another example is Singapore's Sky Greens, the world's first commercial vertical farms. It consists of a
3 story high glass structure with 120 A-shaped towers that cultivates hydroponic plants. It is 10 times
more productive than conventional farms as water and nutrient levels can be controlled to the optimal
growing conditions and ensuring in a more efficient water usage. It has a rotation system that does not
need an electrical generator, as it is powered by a unique gravity aided water-pulley system that utilizes
only 1L of water, collected in a rainwater reservoir. Operational costs include raw materials like soil,
seed, and electricity that only costs $3 per month per tower. Also, all organic waste of the farm is
composted and reused.
PHASE II PLANNING | CORNELL TECH INITIATIVES | SPRING 2015 36
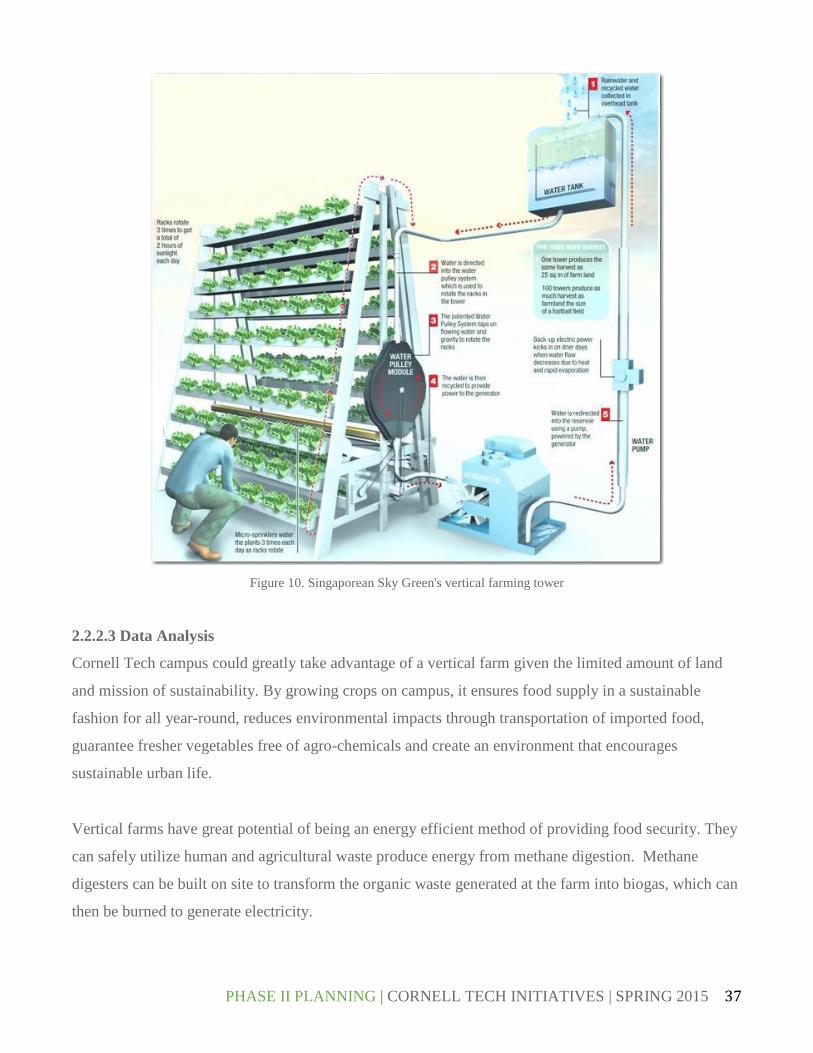
Figure 10. Singaporean Sky Green's vertical farming tower
2.2.2.3 Data Analysis
Cornell Tech campus could greatly take advantage of a vertical farm given the limited amount of land
and mission of sustainability. By growing crops on campus, it ensures food supply in a sustainable
fashion for all year-round, reduces environmental impacts through transportation of imported food,
guarantee fresher vegetables free of agro-chemicals and create an environment that encourages
sustainable urban life.
Vertical farms have great potential of being an energy efficient method of providing food security. They
can safely utilize human and agricultural waste produce energy from methane digestion. Methane
digesters can be built on site to transform the organic waste generated at the farm into biogas, which can
then be burned to generate electricity.
PHASE II PLANNING | CORNELL TECH INITIATIVES | SPRING 2015 37
One concern on Cornell Tech Campus is the environmental conditions demanded by the plants. In Sky
Green's example, the vertical farm takes advantage of the abundant natural heating and light of the
country. Singapore has a year-round temperature of around 86 degrees Fahrenheit and the farm is in an
open area designated by the government as an agro-technology park, away from the shadow of city
skyscrapers. Cornell Tech is located within New York City and the buildings are, conceptually, low-rise.
A solution could be to reproduce the Japanese' Pasona Group example, in which the climate conditions
where the vegetables and fruits are cultivated are controlled specifically for their growth.
To fulfill the demands of plant growth, a very important concern is the costs for maintaining the
adequate conditions. To ensure the healthy growth of vegetables and fruits all year round in a location
under the shadow of nearby buildings, there must be LED lights. Their use of these lights makes energy
costs one of the major costs of vertical farming. However, the development of LED lights makes it
possible for a vertical farm to operate without the need for sunlight, which can drastically reduce costs
as the technology improves. Recently, Philips has been collaborating with Green Sense Farms (GSF)
(Clean Technica, 2015) to create a "light recipe" light, designed specifically for vertical urban farming
and customized to provide the adequate wavelengths for plant's needs.
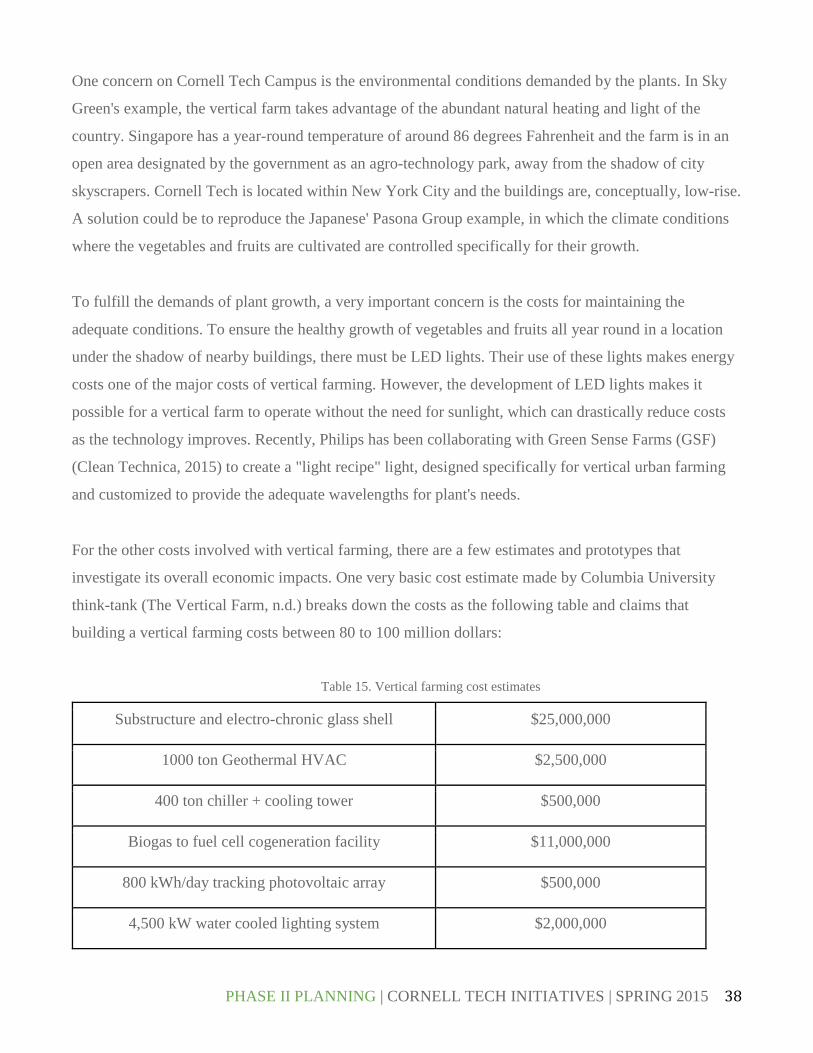
For the other costs involved with vertical farming, there are a few estimates and prototypes that
investigate its overall economic impacts. One very basic cost estimate made by Columbia University
think-tank (The Vertical Farm, n.d.) breaks down the costs as the following table and claims that
building a vertical farming costs between 80 to 100 million dollars:
Table 15. Vertical farming cost estimates
Substructure and electro-chronic glass shell $25,000,000
1000 ton Geothermal HVAC $2,500,000
400 ton chiller + cooling tower $500,000
Biogas to fuel cell cogeneration facility $11,000,000
800 kWh/day tracking photovoltaic array $500,000
4,500 kW water cooled lighting system $2,000,000
PHASE II PLANNING | CORNELL TECH INITIATIVES | SPRING 2015 38

Energy infrastructure and automation systems $35,000,000
Living machine- based water recycling system $500,000
Floating garden hydroponic system $1,700,000
Office and laboratory facilities $5,000,000
From this estimate, the total Building Cost for vertical farming is around $83.7 million. Adding in the
costs associated with annual operation and maintenance of a vertical farm, brings the total of this
endeavor to over $100 million.
Another cost estimation in "Up, up and Away. The Economics of Vertical Farming” models a 37 floors
high building in Berlin (Adenaeuer, 2014).
Figure 11. Model of building to estimate vertical farming costs
They concluded that it would yield approximately 3,500 tons of fruits and vegetables, which is 516
times more than expected from a footprint area of .25 hectare due to stacking and multiple harvests (see
table 16). According to Adenaeuer et al., their simulation would require about € 200 million, or $223
million. Furthermore, the authors do a market opportunity investigation and conclude that, for now,
vertical farming is a technology that is feasible for high-purchasing power mega cities and nations with
limited resources. Still, to understand every economic, environmental and social benefits of vertical
PHASE II PLANNING | CORNELL TECH INITIATIVES | SPRING 2015 39

farming and to make it a more possible option for the identified countries, there must be further research
to achieve more efficient production techniques.
Table 16. Vertical farming yield estimates
2.2.2.4 Summary
Vertical farming consists of growing crops on multiple level in high-rise buildings in urban cities. It
provides to the residents fresh and free of agro-chemicals produce and reduction of carbon footprint.
Also, it is a sustainable practice because the waste produced can be reintroduced to the system as
fertilizer or even biofuel.
Current agricultural practices are extremely energy and land-use intensive. Industrial farming result in
land degradation, water contamination, fertilizer runoff, biodiversity loss, excessive water production
and fossil fuel combustion. Vertical farming represents a technological innovation for alternative energy
sourcing in an urban environment.
Cornell Tech campus could greatly benefit from an indoor vertical farming, similar to the Pasona office
in Tokyo, since both are located within skyscrapers and have similar weather conditions. One of the
major concerns of this technology is the elevated costs to implement and the energy required to
illuminate artificially to grow the crops. It is an emerging practice that is still currently under research,
but there are promising studies on developing cheaper and more efficient LED lighting designed
specifically for vertical farming.
PHASE II PLANNING | CORNELL TECH INITIATIVES | SPRING 2015 40

2.2.2.5 Recommendations
There are no systems that encompasses all the benefits of vertical farming in an urban environment.
Even though it is still an emerging technology, with high implementation and maintenance costs, it is a
promising and sustainable practice that should be taken into consideration for the Cornell Tech Campus.
There are success of example farms that demonstrate that this is a feasible method to ensure sustainable
food and energy consumption. It not only reduces the carbon footprint and provides fresher and
healthier produce for the residents, but the concept itself would be a great representation for the Tech
Campus mission to promote sustainable development.
2.3 Phase II Campus Design Layout
Figure 12. Plan View of the Campus Design Layout of the Tech Campus
2.3.1 Introduction
The campus design was done through careful considerations of where the Tech Campus was situated
relative to both Roosevelt Island and NYC. The experience of the individual who steps into the campus
abides to the guiding principles.
PHASE II PLANNING | CORNELL TECH INITIATIVES | SPRING 2015 41
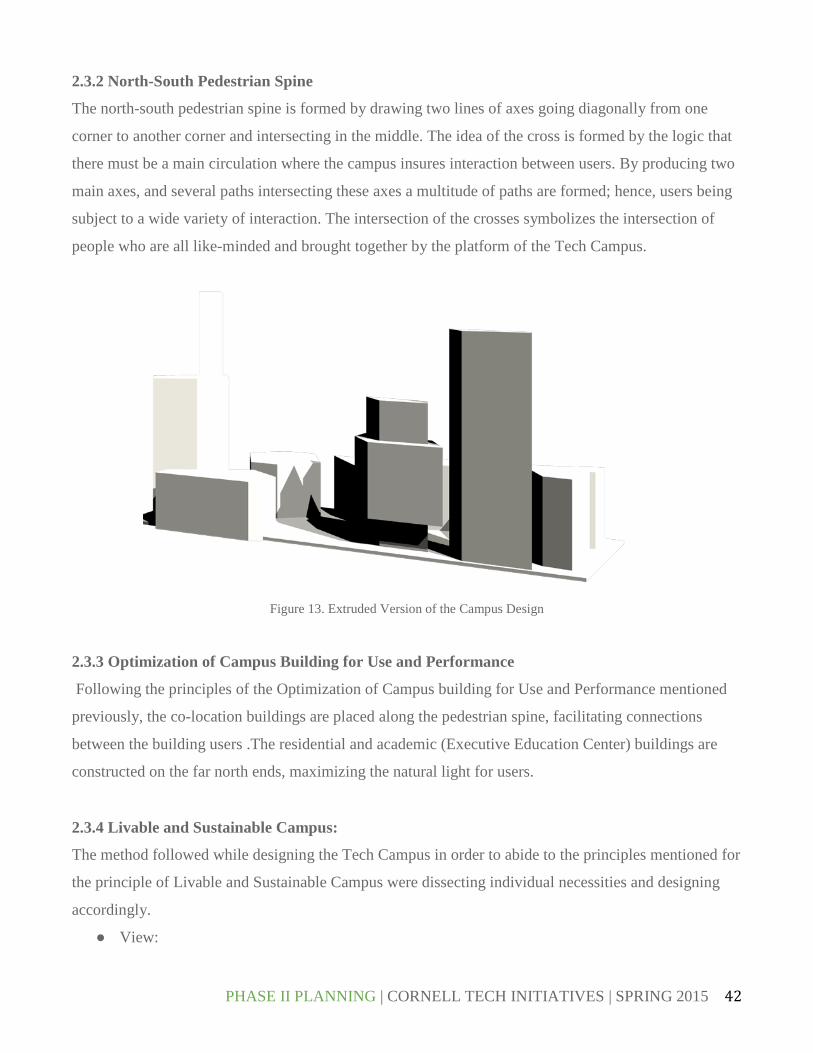
2.3.2 North-South Pedestrian Spine
The north-south pedestrian spine is formed by drawing two lines of axes going diagonally from one
corner to another corner and intersecting in the middle. The idea of the cross is formed by the logic that
there must be a main circulation where the campus insures interaction between users. By producing two
main axes, and several paths intersecting these axes a multitude of paths are formed; hence, users being
subject to a wide variety of interaction. The intersection of the crosses symbolizes the intersection of
people who are all like-minded and brought together by the platform of the Tech Campus.
Figure 13. Extruded Version of the Campus Design
2.3.3 Optimization of Campus Building for Use and Performance
Following the principles of the Optimization of Campus building for Use and Performance mentioned
previously, the co-location buildings are placed along the pedestrian spine, facilitating connections
between the building users .The residential and academic (Executive Education Center) buildings are
constructed on the far north ends, maximizing the natural light for users.
2.3.4 Livable and Sustainable Campus:
The method followed while designing the Tech Campus in order to abide to the principles mentioned for
the principle of Livable and Sustainable Campus were dissecting individual necessities and designing
accordingly.
● View:
PHASE II PLANNING | CORNELL TECH INITIATIVES | SPRING 2015 42
The two main pedestrian axes are crossed by diagonal walkways. These walkway not only provide
maximum pedestrian traffic but also a way to open up viewports. These viewports are designed in such a
method that a pedestrian wherever in the pathway can look at both sides of New York City and enjoy the
landscape that they are placed in.
● Buildings:
While some buildings were inevitably kept true to their forms, as seen from Figure 13, the corporate co-
location building was elevated in order to create a more open space. Not only did the elevation provide
an open space but it also formed a greater view for the individual. Hence increasing the atmosphere and
sense of being in the center of a great landscape created by Manhattan and Queens.
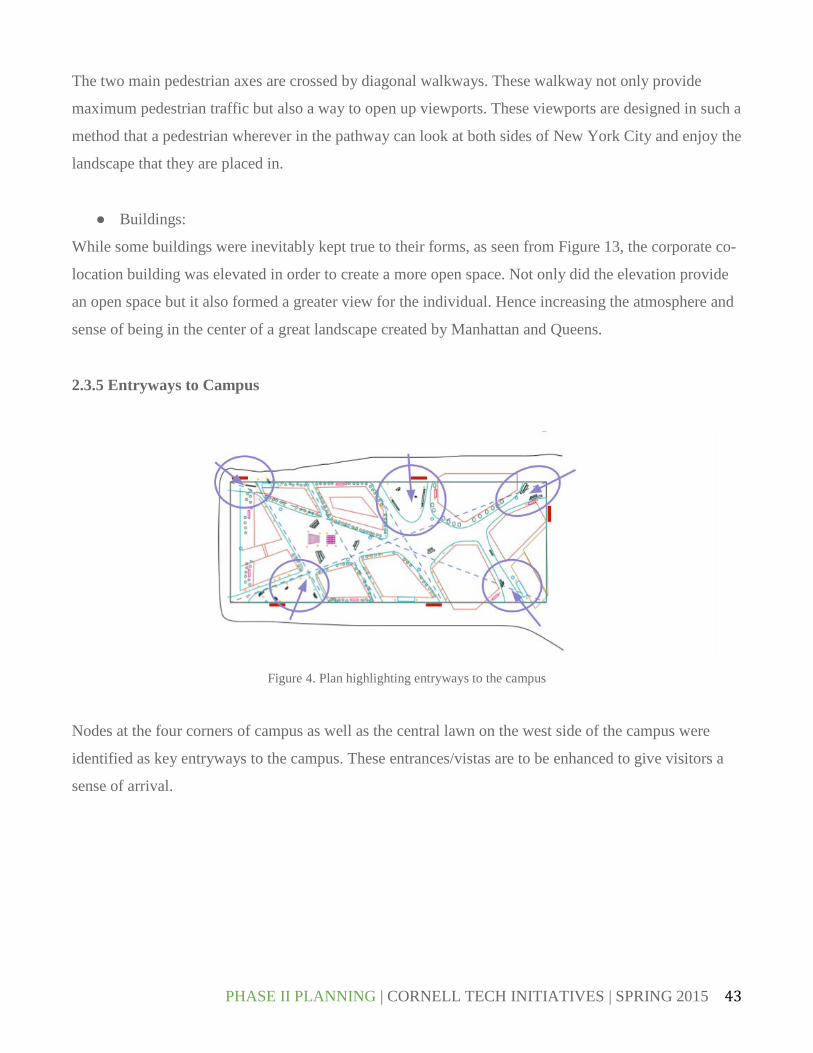
2.3.5 Entryways to Campus
Figure 4. Plan highlighting entryways to the campus
Nodes at the four corners of campus as well as the central lawn on the west side of the campus were
identified as key entryways to the campus. These entrances/vistas are to be enhanced to give visitors a
sense of arrival.
PHASE II PLANNING | CORNELL TECH INITIATIVES | SPRING 2015 43

3. RECOMMENDATIONS
3.1 Tech Market
3.1.1 Introduction
The Tech Market will be an event that showcases cutting edge work done by selected individuals and
groups, engaging researchers, faculty members, graduate students, tech companies, startups and
potential investors. The event draws individuals from all around NYC to present ideas that could be
potential investments or potential inspirations to other researchers. The collaborative and visionary idea
that became the Tech Market represents the ideology of the Tech Campus.
Figure 14. Site map of the placement of Tech Campus within several hotspots in NYC
PHASE II PLANNING | CORNELL TECH INITIATIVES | SPRING 2015 44

Figure 15. Plan view of the design of the Tech Market
3.1.2 Objectives of Tech Market
Tech Market will provide the Tech Campus community a platform to interact share and form new ideas.
In order to create this platform there must be a design that will create physical spaces where both
individuals can showcase research or ideas and groups can form discussion topics. The greater objective
of the Tech Market is to make the Tech Campus the hub of innovation in research.
3.1.3 Time and Location
The Tech Market will be held in Tech Plaza, Tech Walk and Flexible Use Plaza. It will take place per
semester. The reason behind this decision is that the event will take a great amount of preparation in
order to bring together key researchers, faculty members and start-up technology companies (Fig. 14)
from NYC in order to present the most interesting amount of information for the event to be successful.
3.1.4 Design
The design of the Tech Market is based on the idea that the Market will form a circulation of presenting
and sharing ideas. To accommodate this necessity three design concepts have been formed:
PHASE II PLANNING | CORNELL TECH INITIATIVES | SPRING 2015 45

Figure 16. Stage portrayed conceptually of the formulation of the modular rectangles (left), Steps when the modules are
placed in its regular method. (right)
3.1.4.1 Stage
There will be a main stage placed in the center of the Tech Plaza and two secondary stages placed in the
Flexible Use Plaza and Campus Lawn.
● Design:
The design of the stage is based on the idea of making the stage as interactive as the Tech Market.
Therefore, square modules make the body of the stage yet can be moved or added for a more interactive
space between the presenter and the object. By doing so the square modules can be taken apart and
placed on top of another in order to decrease the amount of space needed for storage making it
environmentally convenient. Moreover the material is made out of possible recycled material or wood
that can be recycled.
● Impact
The stage not only will be a key part of the Tech Market, but also will impact the Tech Campus as a way
for individuals to communicate and present ideas on a day to day basis. By doing so the campus
becomes a friendlier, communicative and sharing environment that form an interdisciplinary idea cloud.
PHASE II PLANNING | CORNELL TECH INITIATIVES | SPRING 2015 46

Figure 17. Steps portrayed conceptually of the formulation of the modular rectangles (left), Steps when the modules are
placed in its regular method. (right)
3.1.4.2 Steps
There will be the main steps placed in the center of the Tech Plaza and two secondary steps placed in the
Flexible Use Plaza and Campus Lawn.
● Design:
The design of the steps is based on the idea of making the steps as interactive as the Tech Market.
Therefore, rectangular modules make the body of the stage yet can be moved or added for a more
interactive space between the audience and the object. By doing so the rectangle modules can be taken
apart and placed on top of another in order to decrease the amount of space needed for storage making it
environmentally convenient. Moreover the material is made out of possible recycled material or wood
that can be recycled.
● Impact
The steps not only will be a key part of the Tech Market, but also will impact the Tech Campus as a way
for individuals to relax while communicating and presenting ideas on a day to day basis. By doing so the
campus becomes a friendlier, communicative and sharing environment that forms an interdisciplinary
idea cloud. The steps will function as an architectural monument forming and representing the idea of
the Tech Campus as a place to change, interact and mold ideas producing more developed and novel
ones.
PHASE II PLANNING | CORNELL TECH INITIATIVES | SPRING 2015 47
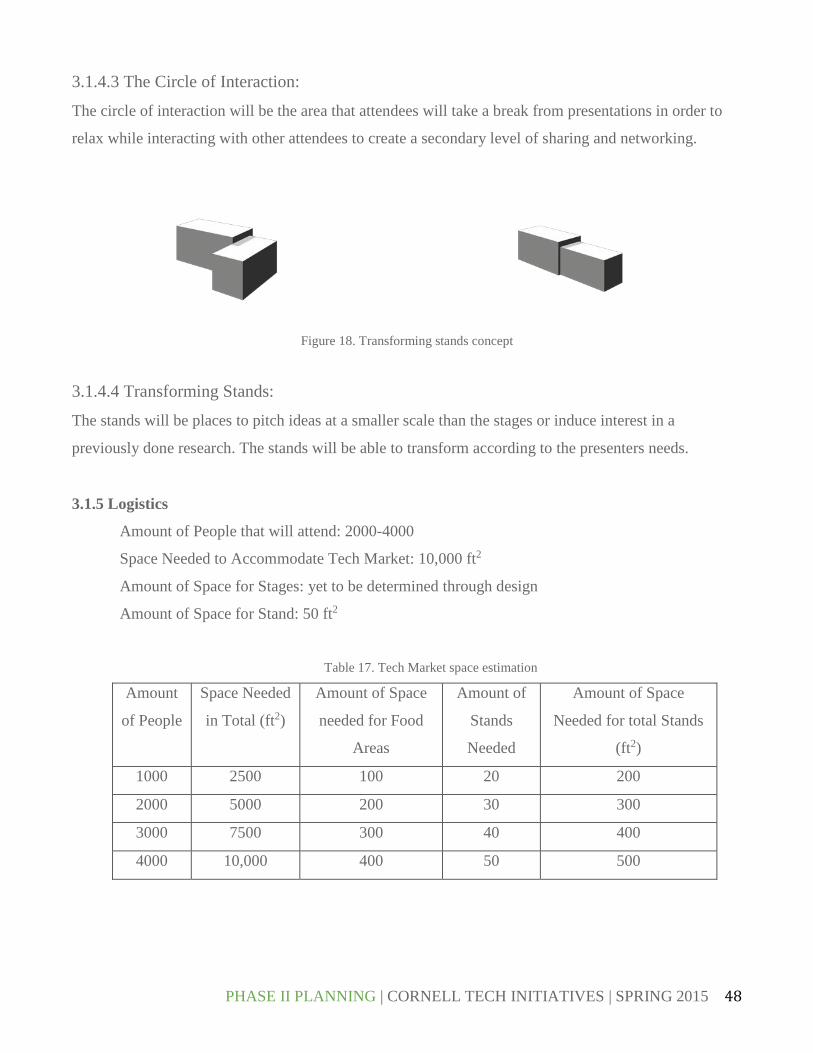
3.1.4.3 The Circle of Interaction:
The circle of interaction will be the area that attendees will take a break from presentations in order to
relax while interacting with other attendees to create a secondary level of sharing and networking.
Figure 18. Transforming stands concept
3.1.4.4 Transforming Stands:
The stands will be places to pitch ideas at a smaller scale than the stages or induce interest in a
previously done research. The stands will be able to transform according to the presenters needs.
3.1.5 Logistics
Amount of People that will attend: 2000-4000
Space Needed to Accommodate Tech Market: 10,000 ft2
Amount of Space for Stages: yet to be determined through design
Amount of Space for Stand: 50 ft2
Table 17. Tech Market space estimation
Amount
of People
Space Needed
in Total (ft2)
Amount of Space
needed for Food
Areas
Amount of
Stands
Needed
Amount of Space
Needed for total Stands
(ft2)
1000 2500 100 20 200
2000 5000 200 30 300
3000 7500 300 40 400
4000 10,000 400 50 500
PHASE II PLANNING | CORNELL TECH INITIATIVES | SPRING 2015 48
3.2 Ecological Considerations
3.2.1 Introduction
Bird Collisions into buildings are the second- leading cause of death for birds after habitat loss,
accounting for an estimated 90,000 deaths each year in New York City alone. Birds cannot differentiate
between glass and the sky. This results in them often crashing into buildings. Since New York is a major
stopover for migrating birds on the Atlantic flyway, new designs need to be conscious of their impact on
urban and migrating bird populations (Sheppard, 2011). With the Cornell Tech Campus aiming to be a
leader in sustainability and on the cutting edge of design, it is imperative that the campus be planned to
serve as a solution to, rather than add to the problem of bird collisions. Many bird friendly design
techniques also serve to benefit other initiatives on campus. For instance, techniques such as bringing
vegetation closer to buildings or installing decorative facades and external shades reduce energy use
within the building by shading the interior. Additionally, bird-friendly design qualifies for LEED credit,
adding to the overall total of the campus.
3.2.2 Data Collection
According to the American Bird Conservatory (ABC) and the New York City Audubon, the causes
behind collisions are due to two main factors, windows and lighting. Glass causes virtually all collisions
with buildings, as glass often reflects the surrounding environment, and mirrored glass, which is often
used in modern architecture, poses a significantly higher threat. Studies have shown that glass that
reflects shrubs and trees causes more collisions than glass that reflects pavement or grass (ABC), and a
study in Manhattan found that a 10% increase in the area of reflective and transparent glass on a
building facade correlated with a 19% increase in the number of fatal collisions in the spring and a 32%
increase in the fall.
Indoor vegetation and windowed atriums should be avoided since they act as ‘Death Traps’, since often
times a bird will be attracted to the vegetation and then hit glass trying to fly into it. Green roofs also
pose a problem for bird collisions, as they often serve as habitat. Windows located adjacent to green
roofs tend to result in a number of collisions as well. There are a number of successful techniques used
in previous projects that greatly reduce or entirely eliminate collisions. These techniques include:
PHASE II PLANNING | CORNELL TECH INITIATIVES | SPRING 2015 49

I. Installing Facades or Exterior shades
II. Utilizing Awnings and Overhangs
III. Patterned Glass
IV. Opaque or Translucent Glass
V. Internal Shades
VI. Window Films and Decals
The table is borrowed from the American Bird Conservatory’s Bird Friendly Building Guidelines
Booklet, which summarizes costs and benefits of various strategies used on past retrofitting projects.
Table 18. Comparison of different retrofit options
Currently, the design for the campus has been rendered in such a way that it is very hazardous to birds,
made largely of reflective glass around where birds tend to fly the most. Even in the rendering,
neighboring vegetation is reflected off of the structures, acting as a hazard to passing birds.
PHASE II PLANNING | CORNELL TECH INITIATIVES | SPRING 2015 50
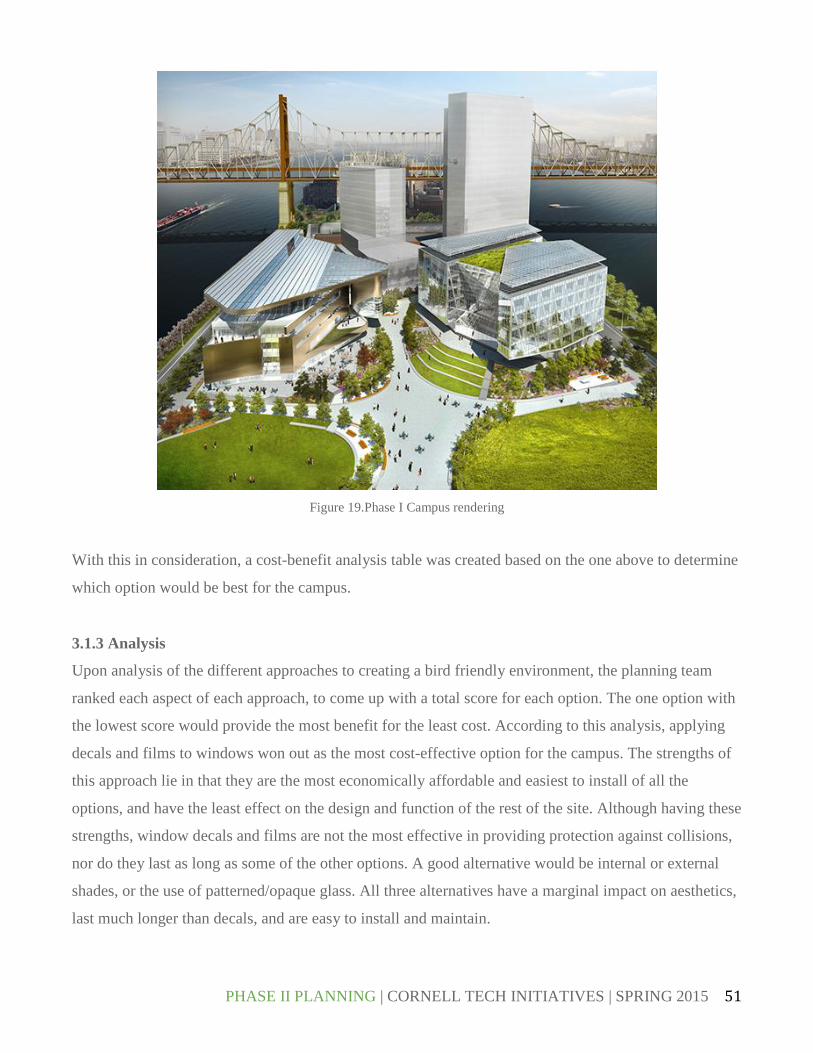
Figure 19.Phase I Campus rendering
With this in consideration, a cost-benefit analysis table was created based on the one above to determine
which option would be best for the campus.
3.1.3 Analysis
Upon analysis of the different approaches to creating a bird friendly environment, the planning team
ranked each aspect of each approach, to come up with a total score for each option. The one option with
the lowest score would provide the most benefit for the least cost. According to this analysis, applying
decals and films to windows won out as the most cost-effective option for the campus. The strengths of
this approach lie in that they are the most economically affordable and easiest to install of all the
options, and have the least effect on the design and function of the rest of the site. Although having these
strengths, window decals and films are not the most effective in providing protection against collisions,
nor do they last as long as some of the other options. A good alternative would be internal or external
shades, or the use of patterned/opaque glass. All three alternatives have a marginal impact on aesthetics,
last much longer than decals, and are easy to install and maintain.
PHASE II PLANNING | CORNELL TECH INITIATIVES | SPRING 2015 51
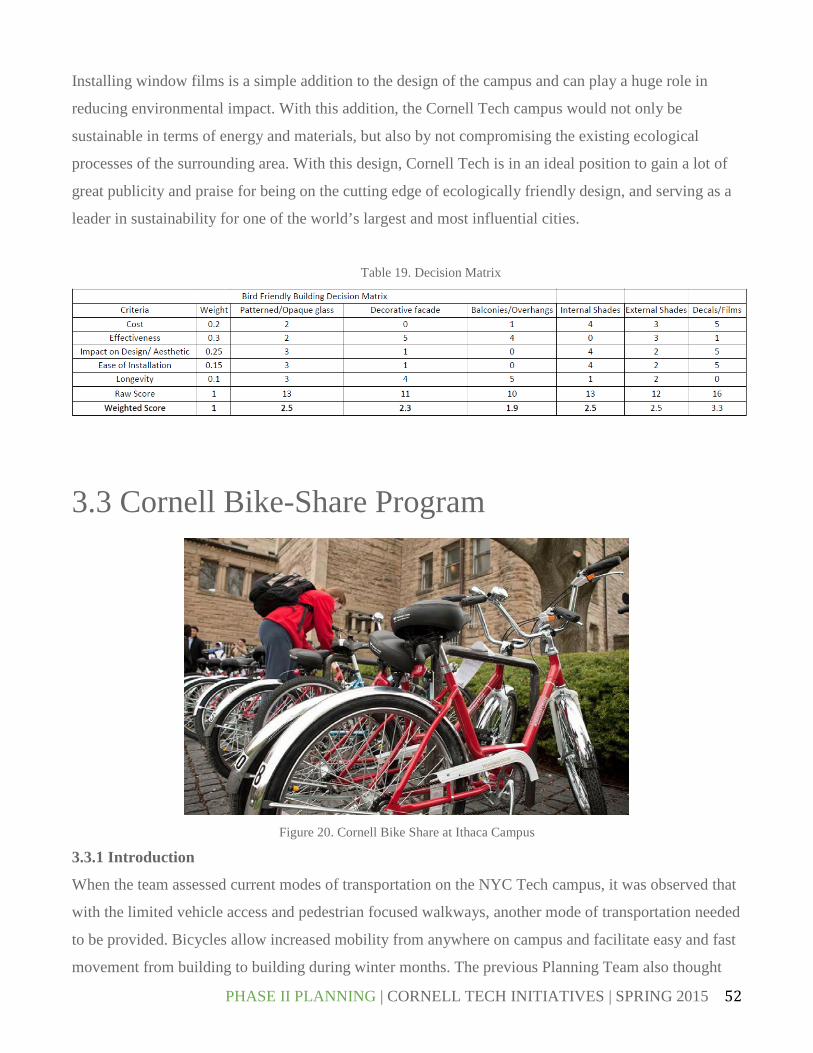
Installing window films is a simple addition to the design of the campus and can play a huge role in
reducing environmental impact. With this addition, the Cornell Tech campus would not only be
sustainable in terms of energy and materials, but also by not compromising the existing ecological
processes of the surrounding area. With this design, Cornell Tech is in an ideal position to gain a lot of
great publicity and praise for being on the cutting edge of ecologically friendly design, and serving as a
leader in sustainability for one of the world’s largest and most influential cities.
Table 19. Decision Matrix
3.3 Cornell Bike-Share Program
Figure 20. Cornell Bike Share at Ithaca Campus
3.3.1 Introduction
When the team assessed current modes of transportation on the NYC Tech campus, it was observed that
with the limited vehicle access and pedestrian focused walkways, another mode of transportation needed
to be provided. Bicycles allow increased mobility from anywhere on campus and facilitate easy and fast
movement from building to building during winter months. The previous Planning Team also thought
PHASE II PLANNING | CORNELL TECH INITIATIVES | SPRING 2015 52
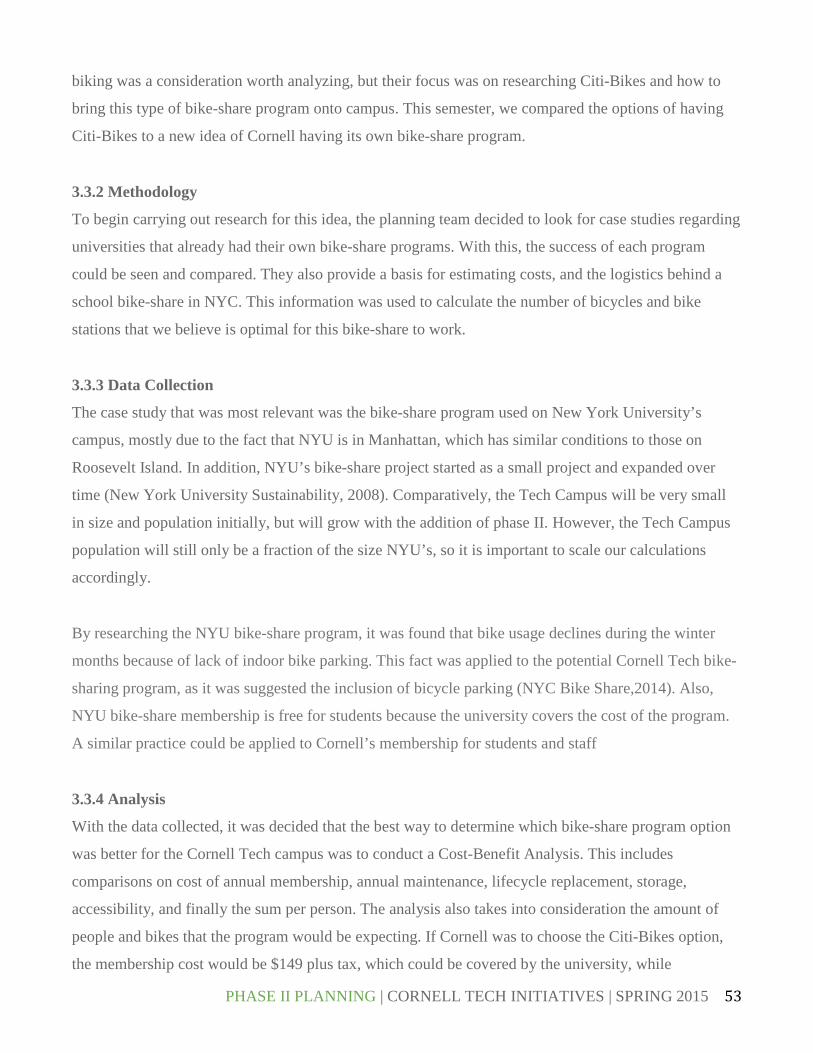
biking was a consideration worth analyzing, but their focus was on researching Citi-Bikes and how to
bring this type of bike-share program onto campus. This semester, we compared the options of having
Citi-Bikes to a new idea of Cornell having its own bike-share program.
3.3.2 Methodology
To begin carrying out research for this idea, the planning team decided to look for case studies regarding
universities that already had their own bike-share programs. With this, the success of each program
could be seen and compared. They also provide a basis for estimating costs, and the logistics behind a
school bike-share in NYC. This information was used to calculate the number of bicycles and bike
stations that we believe is optimal for this bike-share to work.
3.3.3 Data Collection
The case study that was most relevant was the bike-share program used on New York University’s
campus, mostly due to the fact that NYU is in Manhattan, which has similar conditions to those on
Roosevelt Island. In addition, NYU’s bike-share project started as a small project and expanded over
time (New York University Sustainability, 2008). Comparatively, the Tech Campus will be very small
in size and population initially, but will grow with the addition of phase II. However, the Tech Campus
population will still only be a fraction of the size NYU’s, so it is important to scale our calculations
accordingly.
By researching the NYU bike-share program, it was found that bike usage declines during the winter
months because of lack of indoor bike parking. This fact was applied to the potential Cornell Tech bike-
sharing program, as it was suggested the inclusion of bicycle parking (NYC Bike Share,2014). Also,
NYU bike-share membership is free for students because the university covers the cost of the program.
A similar practice could be applied to Cornell’s membership for students and staff
3.3.4 Analysis
With the data collected, it was decided that the best way to determine which bike-share program option
was better for the Cornell Tech campus was to conduct a Cost-Benefit Analysis. This includes
comparisons on cost of annual membership, annual maintenance, lifecycle replacement, storage,
accessibility, and finally the sum per person. The analysis also takes into consideration the amount of
people and bikes that the program would be expecting. If Cornell was to choose the Citi-Bikes option,
the membership cost would be $149 plus tax, which could be covered by the university, while
PHASE II PLANNING | CORNELL TECH INITIATIVES | SPRING 2015 53

maintenance and storage costs would be covered by the Citi-Bikes program (citibike, 2015). The
lifecycle replacement cost is $80 dollars per bike which would bring the total to $229 dollars. This sum
was found to be smaller than the Cornell bike-shares’, but this does not necessarily mean the program is
cheaper. By having its own bike-share program, Cornell would have to pay for storage, lifecycle
replacement and maintenance costs, but the size of the bike-share would be much smaller than the Citi-
Bikes option. With Citi-Bikes it is calculated that every student get a free annual bike membership
which brings the total cost to $238,400. On the other hand, Cornell’s bike-share number will not be
multiplied by number of students but only by number of bikes proposed which is an initial number of
eighty bicycles. This brings the Cornell bike-share total to $31,760 which is significantly cheaper than
Citi-Bikes, yet in terms of accessibility, Citi-Bikes is the better option. This analysis and data will allow
the team to make an informed decision on which is the preferred option for the site.
Table 20. Bike Share Cost-Benefit-Analysis
Regarding bicycle storage, two options are being proposed. In Type A, fifty parking spaces for bikes
would exist in the parking garages (100 spaces total), with thirty bikes that can be checked out at each
station (60 total). In Type B, there would be forty parking spaces for each of the 3 bike hubs (120 spaces
total), with 25 bikes that can be checked out at each station (75 total). Each of these bike hubs will be
double decker parking 132 feet long, 12 feet across (1584 ft2) per station for bikes.
Although indoor parking is essential when operating a bike-share program in cities with winter
conditions such as those in New York City, indoor parking has not been designed or outlined as of yet.
The reasoning for not including internal residential building parking spaces is because residents are not
expected to bring many of their own bikes once they realize that Cornell Tech has a system of their own
PHASE II PLANNING | CORNELL TECH INITIATIVES | SPRING 2015 54

(or the Citi-Bike system). However, as the program matures, it is recommended that one indoor parking
hub be added in each building.
3.3.5 Recommendations
The Planning Team concluded and recommends that Cornell Tech implements its own bike-share
program instead of bringing Citi-Bikes on to Roosevelt Island. Although Citi-Bikes increases
accessibility as students can take the bicycles on and off the island, Cornell’s bike-share could be further
developed in order to have parking along the whole island increasing possible users and making the
program more successful. With Cornell’s own bike-share, the university would also be promoting health
and sustainability as cycling on campus counts towards LEED credit (Park A Bike, n.d.).
4. CONCLUSIONS
Over the course of a year, the Planning Team has done extensive research in many different areas. The
major recommendations mentioned in Section 3 are valid design options that stand on their own.
However, planning an entire college campus requires understanding and designing many systems and
then synthesizing them into a cohesive Master Plan. The site plans that were created this semester still
need to undergo vigorous review and refinement. Getting feedback from architecture and planning
professors would be invaluable to the designs moving forward. Likewise, a similar review from
engineering professors would be applicable to the Master Energy Spreadsheet. Additional information
and research can always be added into the spreadsheet to improve its accuracy and flexibility. Future
work should be concentrated in areas that were not addressed this semester, including building design,
construction, and waste management. Lastly, as the other CUSD Tech teams continue to make
advancements in their research and designs, the Planning Team must continue to evaluate and
incorporate their work and findings into the final designs. The unified efforts of all Cornell Tech Teams
will contribute greatly in designing a state-of-the-art, sustainable, and interactive campus.
PHASE II PLANNING | CORNELL TECH INITIATIVES | SPRING 2015 55

WORKS CITED
Adenaeuer, C. B. (2014). Up, Up and Away! The Economics of Vertical Farming. Journal of Agricultural Studies, 2(1).
American Association of Landscape Architects. (n.d.). Chicago City Hall Green Roof. Retrieved 04 01, 2015, from Asla: http://www.asla.org/meetings/awards/awds02/chicagocityhall.html
American Society of Civil Engineers (ASCE). (2002). Minimum Design Loads for Buildings and Other Structures. Retrieved May 8, 2015, from Public Resource Org: https://law.resource.org/pub/us/cfr/ibr/003/asce.7.2002.pdf
Anderson, H. C. (2014, June). Living With A Rising Bay (Master's Thesis). Retrieved April 01, 2015, from California Polytechnic State University: http://digitalcommons.calpoly.edu/cgi/viewcontent.cgi?article=2318&context=theses
BACA Architects. (2013). Amphibious House. Retrieved April 20, 2015, from BACA Architects: http://www.baca.uk.com/index.php/living-on-water
BloombergBusiness. (2015). Energy & Oil Prices. Retrieved from http://www.bloomberg.com/energy/
Boon Edam. (n.d.). NRG+ Tourniket. Retrieved from Boon Edam: http://www.boonedam.com/en/product/energy-generating-revolving-door/nrg-tourniket
citibike. (2015). Pricing. Retrieved from https://www.citibikenyc.com/pricing
Clean Technica. (n.d.). Retrieved 5 5, 2015, from http://cleantechnica.com/2014/05/10/philips-and-green-sense-partner-for-led-farming-rd/
Company, E. J. (2008, January 11). Demonstrating Experiment of the "Power-Generating Floor" at Tokyo Station. Retrieved May 17, 2015, from http://www.jreast.co.jp/e/development/press/20080111.pdf
ConEdison. (2015). electric rates & tariffs. Retrieved from http://www.coned.com/rates/elec.asp
Cornell University. (n.d.). Bike Share Photo. Retrieved from http://www.gradschool.cornell.edu/sites/gradschool.cornell.edu/files/Big%20Red%20Bikes.jpg
Cornell University Facilities Services. (2012). Site Design Memorandum. Cornell NYC Tech Campus, Ithaca.
Digital NYC. (2015). NYC's Hub for Tech and Startups. Retrieved from http://www.digital.nyc/
Energy Floors Home. (2015, May 17). Retrieved from Energy Floors: Energy is Everywhere: http://www.sustainabledanceclub.com/
Factor Architecten. (2011, February). Project Review: Floating Homes 'De Gouden Kust'. Retrieved April 1, 2015, from Radboud University Nijmegen: http://ftp.cs.ru.nl/toinesmits/course%20material%20IWM%202011/project%20review%20Maasbommel%202011.pdf
PHASE II PLANNING | CORNELL TECH INITIATIVES | SPRING 2015 56

FuelCell Energy. (2013). 1.4 Megawatts DFC1500. Retrieved from http://www.fuelcellenergy.com/assets/PID000152_FCE_DFC1500_r7_hires.pdf
FuelCell Energy. (2013). 2.8 Megawatts DFC3000. Retrieved from http://www.fuelcellenergy.com/assets/PID000156_FCE_DFC3000_r3_hires.pdf
FuelCell Energy. (2013). 300 KiloWatts DFC300. Retrieved from http://www.fuelcellenergy.com/assets/PID000155_FCE_DFC300_r1_hires.pdf
FuelCell Energy. (2013). FuelCell Energy Products and Services. Retrieved from http://www.fuelcellenergy.com/products-services/products/300-kw-dfc300/
Garland, R. (2013). Piezoelectric Roads in California. Stanford University. Retrieved May 17, 2015, from http://large.stanford.edu/courses/2012/ph240/garland1/
Green Roof Technology. (n.d.). Retrieved 4 1, 2015, from http://www.greenrooftechnology.com/green-roofs-explained#how-much-does-a-green-roof-cost
Gross, T. J., Poche, A. J., & Ennis, K. C. (2011). Beyond Demonstration: The Role of Fuel Cells in DoD's Energy Strategy. LMI.
Henderson, T. (2009, August 4). Energy Harvesting Roads in Israel. Energy Harvesting Journal. Retrieved May 17, 2015, from http://www.energyharvestingjournal.com/articles/1589/energy- harvesting-roads-in-Israel
ICAADE. (2015). Amphibious Architecture. Retrieved May 1, 2015, from International Conference on Amphibious Architecture, Design & Engineering: http://www.icaade2015.com
International Code Council. (2006). International Building Code 2006. Retrieved May 5, 2015, from International Code Council: http://www2.iccsafe.org/states/newjersey/nj_building/pdfs/nj_bldg_chapter16.pdf
Kono Designs. (n.d.). Kono Designs Urban Farm. Retrieved 5 5, 2015, from http://konodesigns.com/portfolio/Urban-Farm/
Li, X., & Vladimir Strezov. (2014). Modelling Piezoelectric Energy Harvesting Potential in an Educational Building. Energy Conversion and Management, 85, 435-442. Retrieved May 17, 2015, from http://www.sciencedirect.com/science/article/ pii/S0196890414005159
Micali, M. (2011). Life Cycle Considerations of Solar Energy Technologies. Washington Internships for Students of Engineering.
New York City Panel on Climate Change. (2015). New York City Panel on Climate Change 2015 Report. New York: Annals of the New York Academy of Sciences.
New York University Sustainability. (2008). NYU Bike Share Pilot Program. Retrieved from https://www.nyu.edu/sustainability/campus.projects/greengrants/new.php?id=52
New York University Sustainability. (n.d.). About the NYU Bike-share. Retrieved from http://www.nyu.edu/sustainability/campus.projects/bike.share/about.php
PHASE II PLANNING | CORNELL TECH INITIATIVES | SPRING 2015 57

NYC Bike Share. (2014). NYCBS February 2014 Monthly Report. New York City: Citi Bike.
Ochschorn, J. (2009). Structural Elements for Architects and Builders. Retrieved May 8, 2015, from Cornell University: https://courses.cit.cornell.edu/arch264/calculators/example2.1/index.html
Office of Energy Efficiency & Renewable Energy. (2014). Reducing the Cost and Improving the Durability and Performance of Fuel Cells. Retrieved from Energy.Gov: http://energy.gov/eere/fuelcells/accomplishments-and-progress
Park A Bike. (n.d.). LEED Credits for Bicycle Parking. Retrieved from http://www.parkabike.com/leed-credits-for-bicycle-parking
Peck, S. a. (2003). Design Guidelines for Green Roofs. Canada Mortgage and Housing Corporation and the Ontario Association of Architects.
Portland State University. (n.d.). Green Roof Energy Calculator. Retrieved April 10, 2015, from Green Building Research Laboratory: http://greenbuilding.pdx.edu/GR_CALC_v2/grcalc_v2.php#retain
Sheppard, C. (2011). Bird Friendly Building Design. The Plains, VA: American Bird Conservatory.
Sky Greens Vertical Farming. (n.d.). Retrieved 5 5, 2015, from http://www.skygreens.com/
Streetsblog. (2008, May 21). Students Launch NYU Bike-Share. Retrieved from STREETSBLOG NYC: http://www.streetsblog.org/2008/05/21/students-launch-nyu-bike-share/
The Vertical Farm. (n.d.). Retrieved 5 5, 2015, from http://www.verticalfarm.com/
U.S Green Building Council. (2015). Retrieved from LEED: http://www.usgbc.org/leed
United States General Services Administration. (2011). The Benefits and Challenges of Green Roof on Public and Commercial Buildings. Washington DC: General Services Administration.
Weeks, S. (1953). Density of Sea Water at Tide Stations Atlantic Coast. Retrieved May 10, 2015, from National Oceanic and Atmospheric Administration: http://docs.lib.noaa.gov/rescue/cgs_specpubs/QB275U35no279rev1953.pdf
PHASE II PLANNING | CORNELL TECH INITIATIVES | SPRING 2015 58

APPENDICES
APPENDIX I-CAMPUS AREA CALCULATION
EIS provided rough estimates for the approximate square footage of each building for Phase I and II. In
addition, they estimated the maximum amount of floors each building type would have. To provide
conservative estimates, the total area of each building was divided by the maximum number of floors.
This quotient represents the approximated area for each floor of a building as well as the rooftop. These
values are used in the Green roof, solar panel, and piezoelectric energy calculations.
Table 21. Floor square footage estimations
PHASE II PLANNING | CORNELL TECH INITIATIVES | SPRING 2015 59
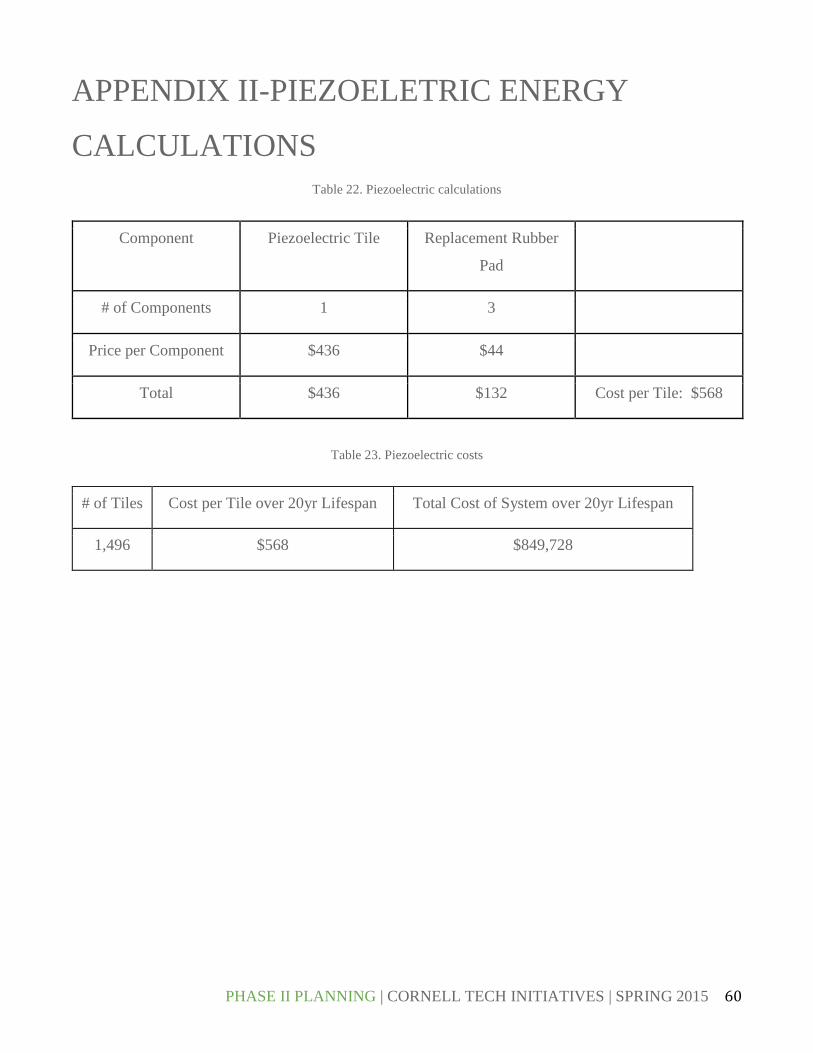
APPENDIX II-PIEZOELETRIC ENERGY
CALCULATIONS
Table 22. Piezoelectric calculations
Component Piezoelectric Tile Replacement Rubber
Pad
# of Components 1 3
Price per Component $436 $44
Total $436 $132 Cost per Tile: $568
Table 23. Piezoelectric costs
# of Tiles Cost per Tile over 20yr Lifespan Total Cost of System over 20yr Lifespan
1,496 $568 $849,728
PHASE II PLANNING | CORNELL TECH INITIATIVES | SPRING 2015 60

APPENDIX III-GREEN ROOF ENERGY
CALCULATIONS
The following tables are estimations obtained from the Calculator developed by the Green Building
Research Laboratory, at Portland State University (http://greenbuilding.pdx.edu/index.php).
For the this estimation, it was considered that the rooftops of Cornell Tech campus would be covered
with semi-intensive green roofs, which are the most common type of green roof in the US and
internationally (UNITED STATES GENERAL SERVICES ADM REFERENCE, 2011). With this, a
few assumptions were made:
● It was assumed that the growing media depth was 6 inches (semi-intensive green roofs vary from
4-6 inches)
● The Leaf Area Index (LAI), which varies from 0 to 5, was assumed to be 2.5
● The roof was not modeled to be irrigated
● The green roof covers 100% of every rooftop
The following table present the energy and gas savings for every building in Phase II:
Table 24. Energy analysis of Green Roofs
PHASE II PLANNING | CORNELL TECH INITIATIVES | SPRING 2015 61

APPENDIX IV-RESEARCH-SUPPORTED
DESIGN FEATURES
The following information is a comprehensive look at design features which have research- supported benefits. This section was helpful in forming a basis for the campus plan, and it ensured that campus planning decisions were not made arbitrarily.
Cognitive Mapping Cognitive mapping is the process of creating a mental map of a space; our campus should be designed to make this process easy for new students and people who have never been on campus before.
● Mental maps are formed based on: ○ Landmarks ○ Paths
● Landmarks could be art (like sculpture), exhibition pieces (like an exhibition of some new sustainable technology), social areas (like outdoor plazas), etc.
● A good landmark: ○ Is visible (relatively tall or out in the open) ○ Is distinctive and unique ○ Is near path intersections or destinations (like entrances to buildings)
● Large signs with campus maps on them are useful; another possibility is to use a scale model of campus as a 3D map (a college near my house had a local sculptor cast a 5x5 foot scale model of the campus in bronze, which helps people understand even better than a 2D map)
● A good path: ○ Offers views of the surrounding area and interesting features (the NYC skyline for
instance) ○ Is easy to follow (grid- or line-based path systems are easier than radial- or web-based
systems; simpler is better) ○ Keeps the destination in sight (if you can see at least part of the building you are walking
to from the path, it is an assurance that you are going in the right direction) Social Interaction The features of a space can facilitate social interaction. Campuses are supposed to be social spaces, and people will interact much more if social space is provided for them. Outdoor social space is preferable.
● Good outdoor social space:
PHASE II PLANNING | CORNELL TECH INITIATIVES | SPRING 2015 62

○ Is divisible; for example, having many loose chairs is better than having many benches fixed in place (people like having the freedom to make a circle of chairs with their friends and form their own “territory” within a public space)
○ Has shelter; sun umbrellas, awnings, and even trees can offer shelter in different forms (from either sun or rain)
○ Has water and nature present (this is especially important in the middle of a large city, where there is not a lot of nature to be found elsewhere)
○ Offers some areas that feel somewhat secluded or are at least out of major sightlines; people do not like to feel as if they are being watched while they socialize (the presence of trees and landscape features can help with this problem)
○ Offers sightlines to interesting things (like the NYC skyline) and has seating that faces these features
○ Has a lot of natural light; this is why shadow mapping is important (buildings should be positioned so social spaces are not in shadow throughout the day)
● Good solutions to provide social space are: ○ Urban plazas ○ Parks ○ A combination of the two (urban plazas with a lot of natural features, which might be the
best choice in order to make use of our limited space) Safety Safety must always be in mind during the design process, especially in a large city like NYC. A space can be designed to be “defensible”, which allows the students themselves to contribute to their own safety and report threats to campus security.
● Good “defensible” space: ○ Has built-in ways to get help in a threatening situation (Blue Light phones are the most
common solution on college campuses) ○ Is visible; most crimes happen in places that are out of sight (making sure that all paths
are visible from inside the buildings/all plazas and parks are visible from the paths) ○ Has surveillance in key areas (security cameras and police patrols) ○ Is well-lit, especially at night
Other Design Notes Some design suggestions do not fit into any of the categories above, but they are still important.
● Small spaces can be made to seem larger with intentional obstructions ○ If we want to make the small tech campus seem larger, making the paths curve around
objects and buildings will make the area seem more expansive ● A campus should seem like a unified whole
PHASE II PLANNING | CORNELL TECH INITIATIVES | SPRING 2015 63

○ This can be done with boundaries (for example, Harvard encloses its campus with arches and gates; even though these gates are open to the surrounding city, they give a sense that the campus is enclosed in some way)
○ A unification of design features can also produce a sense of “oneness”; this could be common materials (like using glass and steel on all buildings), common features (like using a certain type of streetlights all through the campus), a color scheme, etc.
PHASE II PLANNING | CORNELL TECH INITIATIVES | SPRING 2015 64
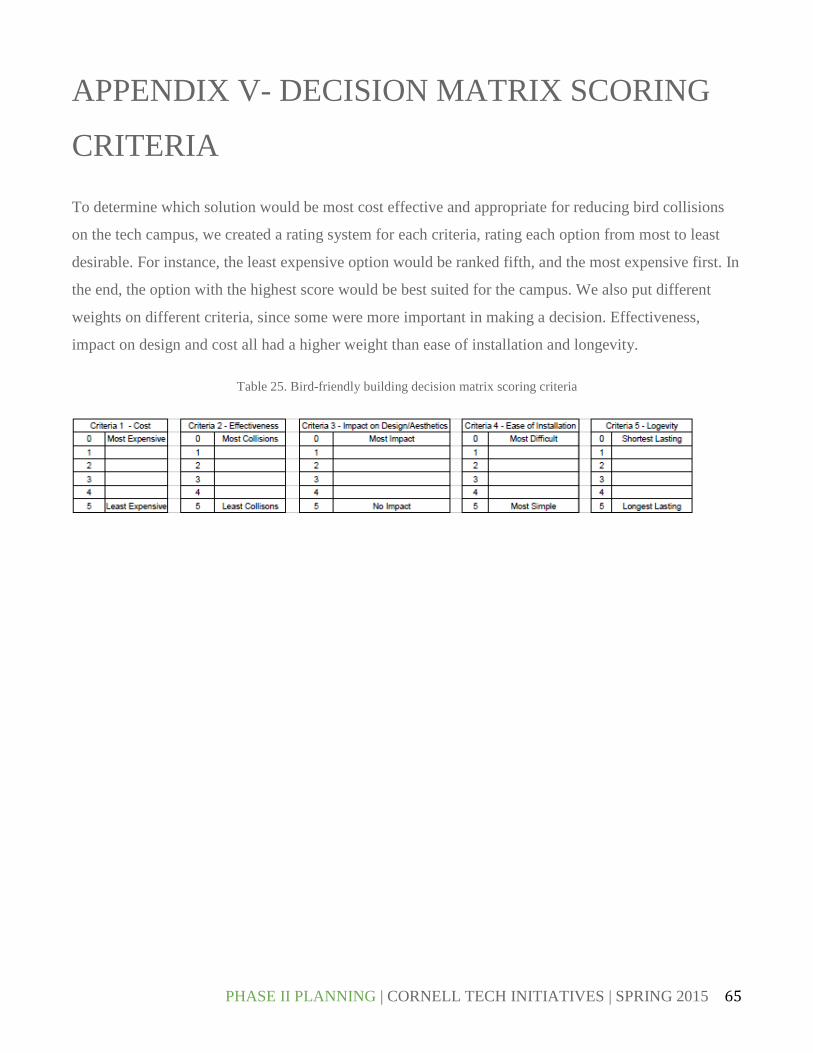
APPENDIX V- DECISION MATRIX SCORING
CRITERIA
To determine which solution would be most cost effective and appropriate for reducing bird collisions
on the tech campus, we created a rating system for each criteria, rating each option from most to least
desirable. For instance, the least expensive option would be ranked fifth, and the most expensive first. In
the end, the option with the highest score would be best suited for the campus. We also put different
weights on different criteria, since some were more important in making a decision. Effectiveness,
impact on design and cost all had a higher weight than ease of installation and longevity.
Table 25. Bird-friendly building decision matrix scoring criteria
PHASE II PLANNING | CORNELL TECH INITIATIVES | SPRING 2015 65