Final Thesis v45 Oliver Pemble 2016
80
The Development of Ion- Selective Membranes for use in Multisensory Skin Patches by Oliver Pemble A dissertation submitted to the Faculty of Science, Engineering and Food Science in partial fulfilment of the requirements for the degree of Masters of Analytical Chemistry: Analysis of Pharmaceutical Compounds University College Cork October 2016 Supervisors: Dr. Van Ahn Dam and Dr. Marcel Zevenbergen Academic Supervisor: Dr. Eric Moore Head of Department: Professor Justin Holmes University College Cork
-
Upload
oliver-pemble -
Category
Documents
-
view
28 -
download
2
Transcript of Final Thesis v45 Oliver Pemble 2016

The Development of Ion-
Selective Membranes for use
in Multisensory Skin Patches
by
Oliver Pemble
A dissertation submitted to the Faculty of Science, Engineering and Food
Science in partial fulfilment of the requirements for the degree of
Masters of Analytical Chemistry: Analysis of Pharmaceutical Compounds
University College Cork
October 2016
Supervisors: Dr. Van Ahn Dam and Dr. Marcel Zevenbergen
Academic Supervisor: Dr. Eric Moore
Head of Department: Professor Justin Holmes
University College Cork

2

3
Acknowledgements
I would like to thank my supervisors Dr Van Anh Dam and Dr Marcel Zevenbergen for all
their help and support throughout my placement with imec in the Netherlands and the ion and
gas sensors team for providing new perspectives on current project work. I also wish to thank
the supervisor for the master’s course, Dr Eric Moore, for organising many engaging
workshops, talks and tours with local industries and companies and enabling our class to
acquire the relevant skills to pursue careers with such industries. Armed with the knowledge
gained from this course, I feel confident to broaden my horizons and seek out a career in
science.
I would like to thank my fellow classmates in the Analytical Chemistry course for always
having each other’s backs and creating a great sense of camaraderie between all of us. I wish
them all the best for the future.
Finally, I would like to express my deepest gratitude to my family for their moral support and
guidance over the past year, for allowing me to rant when times were tough and for always
making me laugh and forget my troubles. You guys are the best.

4
Declaration of Originality
I hereby declare that this thesis is my own work, in partial fulfilment of the requirements of the
Master of Analytical Chemistry degree. It is based on research carried out with imec
Netherlands in the Holst Centre, High Tech Campus, Eindhoven, Netherlands between April
2016 and September 2016.
Oliver Pemble
Date:

5
Abstract
This paper describes the fabrication and testing of a disposable generic electrochemical sensing
platform that utilizes multiple ion-selective electrodes fabricated on flexible substrates by using
screen printing and drop casting techniques, for continuous monitoring of the ionic composition
of fluids (biological or environmental). The analytes of interest are potassium and sodium ions,
the concentrations of which in biological fluids act as indicators to the subject’s health and
wellbeing and are particularly relevant to conditions such as cystic fibrosis and hyponatremia.
The flexible form factor could be ultimately incorporated into a skin patch device which would
assess the salt content in sweat that could provide information on dehydration. Specifically,
this work focuses on the assessment of the lifetime and stability of the ion selective electrodes
in relation to the potential established at the membrane by the ions of interest. For the
miniaturisation process the conventional internal filling electrolyte is replaced by hydrogel
preloaded with KCl (0.1 M) to stabilize the contact between the AgCl electrode and the
hydrogel. The selectivity of the sensor towards the ion of choice was achieved by
functionalising the electrode with an ion-selective membrane that contains a relevant
ionophore. The properties of a range of electrodes prepared using different ionophores and
membrane compositions were investigated.
Sensors fabricated initially using polyvinylchloride (PVC) based membranes displayed a
Nernstian sensitivity of approx. 55-59 mV per decade ion concentration, see Graph 1 and
Graph 2. Stability and lifetime tests were carried out on PVC based sensors by continuous and
non-continuous measurement of the average potential across the ion selective membrane over
a period of time. After 8 days of continuous measuring, the potential of a K+ sensor that was
submerged in a solution containing KCl (0.01 M) and NaCl (0.1 M), showed a linear drift of
approx. 40 mV, i.e. corresponding to a drift rate of 5 mV/day. Over a period of 6 weeks a K+
sensor, which was stored in moist conditions and was calibrated once every week showed the
sensitivity of approx. 25 mV per decade ion concentration.
The implementation of siloprene-based membranes was also investigated with a focus on
ionophore concentration and number of layers to be drop cast and how they affect the
sensitivity and stability of the sensors. An optimised membrane composition ratio of 0.63:100
stock solution to siloprene was developed alongside the ideal number of layers (7.5 µL + 7.5
µL) on the sensor.

6
Table of Contents
Acknowledgements .................................................................................................................... 3
Declaration of Originality .......................................................................................................... 4
Abstract ...................................................................................................................................... 5
Table of Contents ....................................................................................................................... 6
List of Figures ............................................................................................................................ 8
List of Tables ............................................................................................................................. 9
List of Graphs .......................................................................................................................... 10
Chapter 1: Introduction ........................................................................................................ 11
1.1 Title of Project ........................................................................................................... 11
1.2 Background ............................................................................................................... 11
1.2.1 Ion-selective electrode applications and advantages ......................................... 11
1.2.2 Wearable Devices .............................................................................................. 12
1.3 Objectives .................................................................................................................. 14
1.4 Scope ......................................................................................................................... 15
Chapter 2: Electrochemical Background ............................................................................ 16
2.1 Nernst Equation ......................................................................................................... 16
2.2 Difference between activity and concentration ......................................................... 17
2.3 Exchange Current ...................................................................................................... 19
2.4 Electrodes .................................................................................................................. 19
2.4.1 Silver/Silver Chloride Reference Electrode ....................................................... 20
2.4.2 Ion-Selective Electrode ...................................................................................... 21
2.5 Phase Boundary Potential.......................................................................................... 25
2.5.1 Phase boundaries as explained by an extraction experiment ............................. 26
2.6 Ion-Selective Electrode Characterisation ................................................................. 28
2.6.1 Calibration.......................................................................................................... 28
2.6.2 Detection Limit .................................................................................................. 28
2.6.3 Potential Drift..................................................................................................... 29
2.6.4 Precision ............................................................................................................. 29
2.6.5 Selectivity .......................................................................................................... 31
2.6.6 Screen Printing ................................................................................................... 32
2.7 Ion-Selective Membranes .......................................................................................... 33
2.7.1 Membrane Fabrication ....................................................................................... 33
2.7.2 Immobilised Valinomycin Molecule for K+ Sensor .......................................... 33

7
2.7.3 Sodium Ionophore IV ........................................................................................ 35
2.8 Sweat ......................................................................................................................... 35
2.9 Reproducibility, stability and lifetime ....................................................................... 36
2.9.1 Potassium sensors .............................................................................................. 36
2.9.2 Solid contact potassium selective electrodes – A Review Table ....................... 38
2.9.3 Sodium sensors .................................................................................................. 40
2.9.4 Solid contact sodium selective electrodes – A Review Table ........................... 41
Chapter 3: Experimental Materials and Methods .............................................................. 42
3.1 Formulation of the ion-selective membrane.............................................................. 43
3.1.1 Stock Solutions .................................................................................................. 43
3.1.2 Ion-selective membranes ................................................................................... 44
3.1.3 Hydrogel ............................................................................................................ 46
3.2 Ion-selective electrode miniaturisation ..................................................................... 47
3.3 Drop-casting method ................................................................................................. 48
3.4 Flexible sensor stick .................................................................................................. 49
3.5 Sensor Calibration ..................................................................................................... 50
Chapter 4: Results and Discussions...................................................................................... 51
4.1 Characterisation of the sensor ................................................................................... 51
4.2 Continuous measurement of the sensor ..................................................................... 57
4.2.1 3.8 days .............................................................................................................. 57
4.2.2 11.8 days ............................................................................................................ 61
4.3 Non-continuous measurement of the sensor ............................................................. 63
4.3.1 Sensitivity over 42 days ..................................................................................... 63
4.3.2 Device 2 sensitivity ............................................................................................ 65
4.3.3 Device 3 Sensitivity ........................................................................................... 66
4.3.4 Device 4 Sensitivity ........................................................................................... 67
4.3.5 All Test Comparison .......................................................................................... 68
4.4 Siloprene-based sensors ............................................................................................ 71
4.4.1 Measurements within 1 day ............................................................................... 72
Chapter 5: Conclusions and Future Work .......................................................................... 74
5.1 Conclusion ................................................................................................................. 74
5.2 Future Work .............................................................................................................. 75
References ................................................................................................................................ 77

8
List of Figures
Figure 1: “SWEATCH” device. .............................................................................................. 13
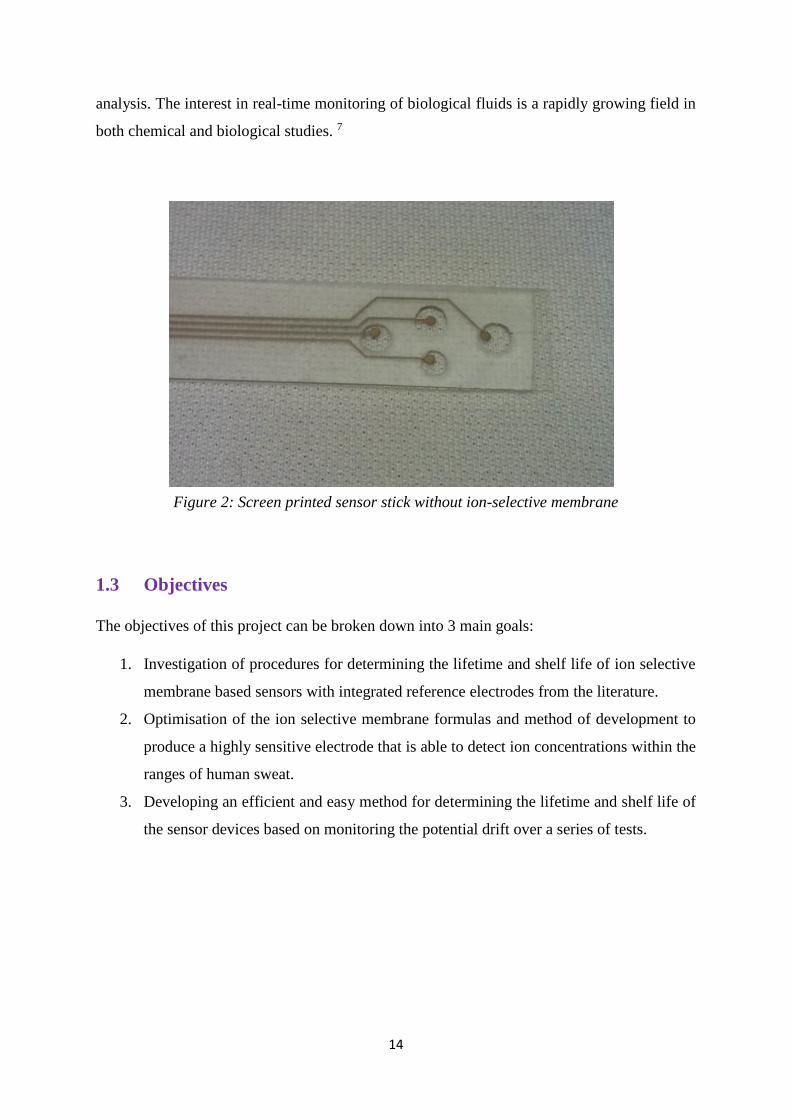
Figure 2: Screen printed sensor stick without ion-selective membrane .................................. 14
Figure 3: CRISON 50 44 reference electrode ......................................................................... 20
Figure 4: Ion Selective Electrode diagram .............................................................................. 22
Figure 5: A typical calibration set-up for a sensor. ................................................................. 31
Figure 6: Valinomycin and Lysine substituted Valinomycin ................................................. 34
Figure 7: Valinomycin ............................................................................................................ 44
Figure 8: Sodium Ionophore IV…...…………………………………………………………44
Figure 9: KTBC (tetrakis(4-chlorophenyl) borate) ................................................................. 44
Figure 10: Polyvinyl Chloride (PVC) ..................................................................................... 45
Figure 11: Di(2-ethylhexyl) sebacate (DOS) .......................................................................... 45
Figure 12: Hydroxyethyl cellulose (HEC) .............................................................................. 46
Figure 13: Triethylene glycol (TEG) ...................................................................................... 46
Figure 14: Miniaturisation of a conventional ISE onto a flexible substrate ........................... 47
Figure 15: Layers are drop-cast onto the flexible substrate .................................................... 48
Figure 16: Schematic of the flexible sensor stick with 4 electrode sites ................................ 49
Figure 17: Diagram of the general set up of a calibration measurement ................................ 50
Figure 18: OP-30 Na Sensor (siloprene/DCM) drop-cast and measured on the same day ..... 72
Figure 19: OP-30 Na Sensor (siloprene/DCM) measured on the day after ............................ 72

9
List of Tables
Table 1: Required ranges for potassium ions in common biological fluids ............................ 37
Table 2: Review of current solid contact potassium selective electrode research .................. 38
Legend for Table 2 ................................................................................................................. 39
Table 3: Required ranges for sodium ions in common biological fluids ................................ 40
Table 4: Review of current solid contact sodium selective electrode research ....................... 41
Legend for Table 4 ................................................................................................................. 41
Table 5: OP-13 Calibration slopes and R values..................................................................... 53
Table 6: OP-13 all series slopes .............................................................................................. 55
Table 7: all series errors .......................................................................................................... 55
Table 8: OP-13 all series percentage errors ............................................................................ 55
Table 9: OP-13 all series error deviations ............................................................................... 56
Table 10: OP-13 all series percentage error deviations ........................................................... 56
Table 11: OP-24 all devices rate of drifts ............................................................................... 57
Table 12: OP-24 before and after continuous measurement slopes ........................................ 59
Table 13: OP-4 all devices rate of drifts ................................................................................. 61
Table 14: OP-4 calibration before continuous measurement .................................................. 62
Table 15: OP-3 all devices slopes over 6 weeks ..................................................................... 63
Table 16: OP-3 device 2 slopes and offsets ............................................................................ 65
Table 17: OP-3 device 3 slopes and offsets ............................................................................ 66
Table 18: OP-3 device 4 slopes and offsets ............................................................................ 67
Table 19 and 20: Ratios for the siloprene-based sensors........................................................ 71

10
List of Graphs
Graph 1: OP-13 calibration series .......................................................................................... 52
Graph 2: OP-13 calibration slopes.......................................................................................... 52
Graph 3: OP-13 device 1 ........................................................................................................ 53
Graph 4: OP-13 device 2 ........................................................................................................ 54
Graph 5: OP-13 device 3 ........................................................................................................ 54
Graph 6: OP-13 device 4 ........................................................................................................ 55
Graph 7: OP-24 continuous measurement over 4 days .......................................................... 57
Graph 8: OP-24 before continuous measurement................................................................... 58
Graph 9: OP-24 after continuous measurement ..................................................................... 58
Graph 10: OP-4 continuous measurement over 12 days ........................................................ 61
Graph 11: OP-4 calibration before continuous measurement ................................................ 62
Graph 12: OP-3 non continuous measurement slopes(sensitivities) ...................................... 63
Graph 13: OP-3 device 2 all tests ........................................................................................... 65
Graph 14: OP-3 device 3 all tests ........................................................................................... 66
Graph 15: OP-3 device 4 all tests ........................................................................................... 67
Graph 16: OP-3 test 1 ............................................................................................................. 68
Graph 17: OP-3 test 2 ............................................................................................................. 68
Graph 18: OP-3 test 3 ............................................................................................................. 69
Graph 19: OP-3 test 4 ............................................................................................................. 69
Graph 20: OP-3 test 5 ............................................................................................................. 70
Graph 21: OP-3 test 6 ............................................................................................................. 70
Graph 22: OP-3 test 7 ............................................................................................................. 71

11
Chapter 1: Introduction
1.1 Title of Project
The Development of Ion-Selective Membranes for use in Multisensory Skin Patches.
1.2 Background
This project was undertaken alongside the imec ion and gas sensors group over a period of 6
months under the supervision of Dr Marcel Zevenbergen and Dr Van Anh Dam. The imec team
is currently researching and developing a miniaturized, flexible multi-ion sensing wearable
device. The device is designed to simultaneously detect and quantify multiple ion
concentrations using volumes on a micro scale. Functionalising ion-selective membranes onto
the device enables customisable ion sensing detection of multiple analytes at once. The current
system is able to measure K+, Na+, Cl- NO3- and pH after thorough calibration and sensitivity
tests.
1.2.1 Ion-selective electrode applications and advantages
Ion selective electrodes (ISEs) are used in a wide variety of applications for determining the
concentrations of analyte ions in aqueous solutions:
Food processing and regulation: K in fruit juice and wine making, Ca in beer and dairy
products, NO3 and NO2 in meat preservatives.
Agriculture: NH4, Cl, K, NO3, I in soils and fertilizers.
Water quality: F in drinking water and CN, S, Cl NO3 in lakes and rivers for pollution
control.
Clinical analysis: Ca, K, Cl, Na in blood, plasma, sweat and serum.
The number of applications for ISEs in various industries has been steadily growing over the
past few decades. 1,2 They have many advantages that enable them to be used in different
environments and conditions, some of these advantages include:
Compared to many other analytical techniques, they are relatively easy to use and
inexpensive.
They can be manufactured with robust and durable materials that can be used in the
field or laboratory environments.

12
With frequent calibration, they are able to determine the concentrations of ions with
high precision and accuracy. This is especially useful compared to other analytical
techniques that may require complex instrumentation to achieve such accurate data.
In favourable conditions when measuring in dilute aqueous solutions, interfering ions
do not affect the selectivity of the sensor.
They are useful in medical and biological applications since they measure the activity
of the analyte ion and not the concentration directly.
As mentioned above, applications for such a sensor device include food quality analysis,
determination of bodily fluids for clinical diagnostics and ion concentration determination in
water samples. For the purposes of this project, we will be focusing on the application of
integrating the sensor with a sweat patch to measure transferable ion concentrations.
1.2.2 Wearable Devices
Presently, commercial wearable devices are only able to detect an individual’s vital signs and
physical activities such as heart rate and number of steps taken (pedometer). These sensors do
not display molecular information which can provide insight into their general health and
wellbeing. The monitoring of human sweat is a non-invasive method to accessing physiological
information. Currently sweat analysis is used in clinical diagnostics, athletic performance
monitoring and drug use detection. 3 Monitoring hydration levels is of the utmost importance
to athletes and sports enthusiasts because a deficit of fluid can impair general performance and
increase the reliance on carbohydrates. 4 However, these applications require separate sample
collection and analysis and does not create a profile based on real-time sweat secretion. A
wearable device that functions as a sweat monitoring sensor can achieve this. 5
It is also important to note that a wearable device needs to be able to withstand everyday stress
from physical activity and frequent usage. Human body temperature changes and rate of
perspiration will contribute to the accuracy of the overall sensing system. This particular aspect
of the device is not investigated in this study but it may affect future work based off data from
this project.

13
Recently, there has been research into developing a platform for the harvesting and analysis of
sweat via a wearable device. Glennon et al 6 have created a “SWEATCH” device for this
purpose. It is a watch-based platform that can collect sweat through a sampling orifice which
then passes over a sodium-selective electrode and reference electrode. The movement of the
liquid is entirely driven by capillary force; the flow rate can be altered by changing the width
of the microfluidic channels. The data that is collected is accessed remotely though wireless
Bluetooth connectivity.
Figure 1: “SWEATCH” device. Type (a) with vertical arrangement and “Pod” type platform.
1: sweat harvesting device in 3d-printed platform base, 2: fluidic sensing chip, 3: electronic
data logger and battery, and 4: 3d-printed upper casing 6
The device was able to achieve near Nernstian response with an average slope of 58.03±3.458
mV/decade Na+. 6 This is the ideal type of response for such a system and the platform is
somewhat similar to the work that the ion and gas sensors group at imec is undergoing. Indeed,
this is just one example of the many areas of research into a wearable device system for sweat
14
analysis. The interest in real-time monitoring of biological fluids is a rapidly growing field in
both chemical and biological studies. 7
Figure 2: Screen printed sensor stick without ion-selective membrane
1.3 Objectives
The objectives of this project can be broken down into 3 main goals:
1. Investigation of procedures for determining the lifetime and shelf life of ion selective
membrane based sensors with integrated reference electrodes from the literature.
2. Optimisation of the ion selective membrane formulas and method of development to
produce a highly sensitive electrode that is able to detect ion concentrations within the
ranges of human sweat.
3. Developing an efficient and easy method for determining the lifetime and shelf life of
the sensor devices based on monitoring the potential drift over a series of tests.

15
1.4 Scope
The main focus of this project is to develop a method to determine both the lifetime of the
sensor when it is in use, and the shelf life of the sensor when it is not in use. We will look at
the calibration curves of each sensor both before and after a series of tests and compare each
result to identify the extent of potential drift. Through continuous and non-continuous
measurements of a range of standard solutions one can determine the rat of drift or deterioration
of the membrane. Based on these results, one can alter the formulation of the membrane
composition by changing reagent concentrations and changing the amount of membrane
solution that is used in making the sensors. The fabrication of the sensor sticks will not be the
main focus as the gas and ion sensor team have developed an optimised procedure for the
screen-printing method.

16
Chapter 2: Electrochemical Background
2.1 Nernst Equation
Potentiometry is an electroanalytical technique that measures the voltage or potential of a
sample solution between 2 electrodes at zero current. The electrodes and the composition of
the analyte remain unchanged since zero current flows through the cell. This makes
potentiometry a useful quantitative method.
Le Châtelier’s principle tells us that changing the concentrations of reactant or product for any
chemical reaction can shift the equilibrium to favour a certain outcome. The Nernst equation
describes the net driving force for a reaction and how it is expressed by its dependence on
reactant concentration. 8
Consider the half reaction:
𝑎𝐴 + 𝑛𝑒− ⇌ 𝑏𝐵
The Nernst equation for this reaction is expressed as:
𝐸 = 𝐸0 −𝑅𝑇
𝑛𝐹ln
𝛼𝐵𝑏
𝛼𝐴𝑎
Where E0 = Standard Reduction Potential (αA = αB = 1), R = Gas Constant (8.314 J/(K mol),
T = Temperature (K), n = Number of electrons involved in the half reaction, F = Faraday
constant (9.649x10⁴C/mol), αi = Activity of species i.
The logarithmic term ln𝛼𝐵
𝑏
𝛼𝐴𝑎 can also be expressed as the reaction quotient Q.
Q has the same functionality as the equilibrium constant but pure solids, pure liquids and
solvents are omitted from Q because they have activities that are equal or close to unity. If all
activities are in unity, then Q = 1 and lnQ = 0 therefore E = E0.

17
Converting the natural logarithm in the above equation to base 10 and setting the reaction
conditions to room temperature (298 K) we can express the Nernst Equation in its most useful
form:
𝐸 = 𝐸0 −0.05916
𝑛log 𝑄
Where the potential is given in JC-1 = V. The potential changes by 59.16/n mV for each factor-
of-10 change in Q.
2.2 Difference between activity and concentration
Activity of an ion is the effective concentration, that is, the portion of ions that are free to react.
The reaction in this case is the ions coming into contact with the membrane surface. The
difference between the activity and concentration is expressed as the Activity Coefficient.
Generally, the activity is always numerically less than the concentration because the ions also
take part in inter-ionic interactions within the solution. These interactions can prevent the
movement of some ions and reduce the likelihood of them reaching the membrane surface. As
the concentration increases the activity becomes proportionately less but in practice the inter
ionic interactions are negligible. 8
Potentiometric sensors measure the activity of ions and not necessarily the concentration. By
using the activity coefficient, we can calculate the concentration from a potentiometric
measurement. The activity coefficient is the ratio of the activity divided by the concentration.
It is a variable factor that depends on the ionic strength of the solution and the valency and
ionic radius of the analyte ion. It is possible to calculate the activity coefficient from the
following formulas and incorporating ionic strength:
Ionic Strength: 𝐼 = 1
2∑ 𝑐𝑖𝑧𝑖
2𝑛𝑖=1
Where c is the concentration in moles and Z is the valency.
Activity: 𝛼𝐶 = 𝛾𝑖[𝐶]
Where αC is the activity of the ion C, γi is the activity coefficient, [C] is the concertation of
analyte ion C.

18
The Debye-Hückel limiting law can be used to calculate the activity coefficient γ:
ln 𝛾𝑖 = −𝑧𝑖
2𝑞2𝜅
8𝜋𝜀𝑟𝜀0𝑘𝐵𝑇
Where zi is the charge number of the ion, q is the elementary charge, κ is the inverse of Debye
length, εr is relative permittivity, ε0 is the permittivity in free space, kB is Boltzmann’s constant
and T is temperature.
ln 𝛾𝑖 = −𝑧𝑖
2𝑞3𝑁𝐴
12⁄
4𝜋(𝜀𝑟𝜀0𝑘𝐵𝑇)3
2⁄√
𝐼
2
Where NA is Avogadro’s number.
ln 𝛾𝑖 = −𝐴𝑧𝑖2√𝐼
Where a is a constant that depends on temperature. However, there is a simpler equation that
can be used:
log 𝛾𝑖 =−0.51𝑧𝑖
2√𝐼
1 + 3.3𝑑𝐶√𝐼
Where dC is the effected diameter of the analyte ion. 9
The most significant revelation from this equation is that the mean activity coefficient is
dependent on ionic strength I and not concentration of the ions within the ionic solution. The
above equation for Log(γi) is ideal for experimental measurements with low concentrations.
Ions that produce larger charges cause deviations from the overall Debye-Hückel theory due to
the simple nature of the model. Because of this, several assumptions are made for the model
which can give rise to limitations:
Composition of the solvent will affect electrolyte ion. Water molecules are polarisable.
Ion-solvent interactions are generally ignored in the Debye-Hückel theory.
Electrolytes not fully dissociating because they are weaker. Using a dissociation
constant one can calculate the extent of how much a particular electrolyte will
dissociate. By calculating this value, corrects may be made for the activity coefficient.
The assumption that ions are spherical and are not polarised, the charge remains
homogenous throughout. Many ions such as the sulphite ion SO32- are not spherical and
can be polarised due to the polyatomic structure.
19
Ion association may take place within ions of larger size and higher charge due to
complete dissociation.
The behaviour of an electrolyte ion deviates considerably from that of an ideal solution.
Utilizing the activity of the ion instead of the concertation we can fully understand the nature
of the ion. 8
2.3 Exchange Current
The voltage at equilibrium as described by the Nernst equation is dynamic with no net current
throughout the electrode. However, leakage currents at the reference and indicator electrodes
cause redox reactions at the sites. The reactions do not change the composition of the
electrolytes they are both occurring at the same rate. The exchange current density is a term
that expresses the dynamic flow of electrons in these redox reactions, i.e. the current at
equilibrium, the rate of reaction at reversible potential. At reversible potential the system is at
equilibrium and the forward and reverse rates of reaction are the same. The exchange current
density is the rates of reaction between the electrode and the electrolyte and can give insight
into the properties of a material.
2.4 Electrodes
As established above, the use of electrodes to determine the voltages of analytes to provide
chemical information is called potentiometry. Analytes are electroactive species that can either
donate or accept electrons at an electrode.
A typical set up of a potentiometric sensor consists of an indicating electrode submerged in an
analyte for exchanging ion/electrons with the ions of interest. This half-cell is then connected
to another half-cell by a salt bridge which maintains electronic neutrality within the internal
circuit. The second half cell has a fixed concentration and therefore a constant potential, the
reference electrode. The overall cell voltage is the difference between the constant potential of
the reference and the variable potential of the indicating electrode. It should be noted that the
electrode responds to the activity of the analyte ion and not specifically the concentration but
they are related as shown in section 2.2.

20
2.4.1 Silver/Silver Chloride Reference Electrode
Silver/Silver chloride (Ag/AgCl) is a widely-used type of reference electrode because of its
simplicity, ease of use, stability and non-toxicity. It is constructed as a thin tube containing
solution with high KCl concentration and a Ag/AgCl electrode dipped in. There exists a double
junction that further separates the analyte solution and the inner KCl, minimising their contact.
Unlike the Standard Hydrogen Electrode (SHE) it does not require H2 gas or a prepared
platinum surface that could easy be contaminated by many solutions.
The standard reduction potential for a typical Ag/AgCl system is shown below:
AgCl(s) + e- ⇌ Ag(s) + Cl- Eo = +0.222 V
E(saturated in KCl) = +0.197 V
The electrode contains an air inlet at the top which allows the electrolyte slowly though the
porous salt bridge plug that comes into contact with the analyte solution. A problem that can
arise is that the plug can get clogged which causes a slow electrical response from the electrode
and it will take longer for the signal to plateau. This can be solved by replacing the porous plug
with a free flowing capillary system, allowing quicker response times and swift signal
generation.
Figure 3: CRISON 50 44 reference electrode with internal 3 M KCl gel electrolyte and
lithium acetate electrolyte in salt bridge 10

21
2.4.2 Ion-Selective Electrode
Ion-selective electrodes are, as the name suggests, electrodes that can selectively detect and
measure a specific ion in an analyte or sample. Most ion-selective electrodes can be categorized
into the following classes: 8
Glass membranes for species such as H+ and other monovalent cations.
Solid-State electrodes based on inorganic crystalline compounds.
Liquid-based electrodes that use hydrophobic polymer membranes that are covered in
liquid ion exchanger.
Compound electrodes with analyte selective membranes enclosed by membranes that
separate the specific analyte from other components.
Ion-selective electrodes have the following advantages over conventional ion sensing methods:
Short response time.
Non-contaminating.
Linear response to Log[C+] over a range within the instrumental limits.
Non-destructive.
Unaffected by turbulence.
Can be used inside living cells when on the micro scale.
22
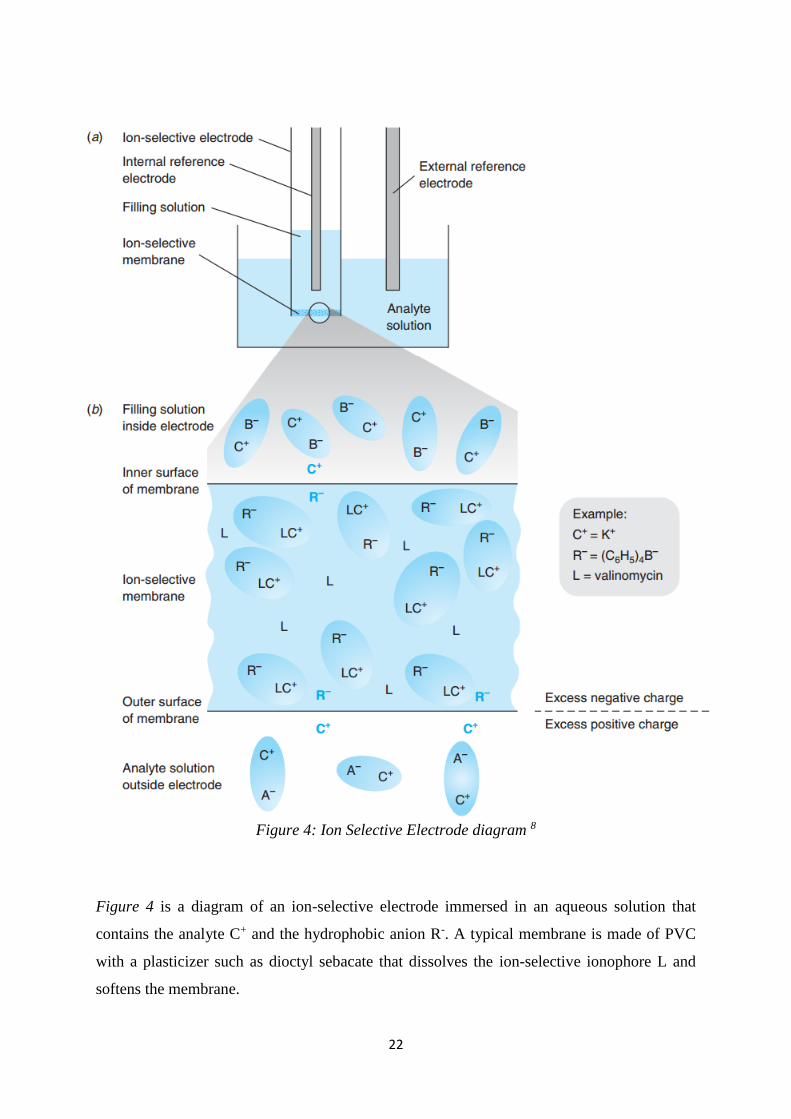
Figure 4: Ion Selective Electrode diagram 8
Figure 4 is a diagram of an ion-selective electrode immersed in an aqueous solution that
contains the analyte C+ and the hydrophobic anion R-. A typical membrane is made of PVC
with a plasticizer such as dioctyl sebacate that dissolves the ion-selective ionophore L and
softens the membrane.

23
Figure 4 shows a liquid based ion-selective electrode. The ion-selective membrane consists of
a hydrophobic organic polymer mixed with a viscous organic solution containing an ion
exchanger and a ligand that can selectively bind the analyte cation. On the inside of the
electrode is the filling solution containing the ions C+ and B- and on the outside is the analyte
solution containing the same ions. The voltage is the electric potential difference across the
ion-selective membrane, which is measured between internal and external reference electrodes.
As the concentration or activity of C+ ions change, so does the voltage measured between the
electrodes. By measuring this voltage and using the Nernst equation one can find the activity
of C+ ions and subsequently the concentration.
One of the key aspects of the ion-selective membrane model is the ionophore ligand denoted
by L. The ionophore has the ability to selectively bind to the analyte. The ligand L is chosen
based on its high affinity to the analyte cation C+ (high sensitivity) and relative low affinity
towards other ions (high selectivity). For example, the ionophore chosen for the K+ ion is
Valinomycin, the natural antibiotic. Ideally the ligand L will only bind to the desired ion
however real electrode will always have some affinity to other ions. To avoid interference from
these other ions a hydrophobic ion R- is incorporated to initiate charge neutrality.
Inside the membrane, we can see the analyte ion C+ is bound to the Ligand L in the complex
LC+ and is at equilibrium with the free C+ ions which can freely diffuse through the interface.
The anion R- cannot leave the membrane due to its hydrophobicity and A- cannot enter the
membrane because it is not organically soluble. If a few C+ ions diffuse into the analyte aqueous
phase there exists a net positive charge. The imbalance of charge generates the difference in
potential.
The C+ ion driving force for diffusing into the aqueous solution is solvation of the ion with
water. When the C+ ion leaves the membrane, a build-up of positive charge in the water close
to the membrane is observed. This separation of charge creates a potential difference over the
membrane. This potential difference is called Eouter. This energy can be expressed in terms of
Gibbs free energy difference:
∆𝐺 = −𝑛𝐹𝐸𝑜𝑢𝑡𝑒𝑟
Where n is the charge of the ion and F is the Faraday constant.

24
The net change of free energy for the diffusion of the ion across the membrane must be equal
to 0 at equilibrium. Similarly, the action of C+ diffusing into a region of activity from the
membrane αm to the outer solution α0 has the free energy change of:
∆𝐺 = ∆𝐺𝑠𝑜𝑙𝑣𝑎𝑡𝑖𝑜𝑛 − 𝑅𝑇 ln𝛼𝑚
𝛼𝑜
Where ΔGsolvation is the free energy change in the solvent. We can make these 2 equations equal
to each other at equilibrium combining the ΔG due to the transfer between the 2 phases and
difference in activity and the ΔG due to the imbalance in charge:
∆𝐺𝑠𝑜𝑙𝑣𝑎𝑡𝑖𝑜𝑛 − 𝑅𝑇 ln𝛼𝑚
𝛼𝑜+ (−𝑛𝐹𝐸𝑜𝑢𝑡𝑒𝑟) = 0
If we solve for Eouter we can find the electric potential difference across the point between the
membrane and aqueous solutions:
𝐸𝑜𝑢𝑡𝑒𝑟 =∆𝐺𝑠𝑜𝑙𝑣𝑎𝑡𝑖𝑜𝑛
𝑛𝐹−
𝑅𝑇
𝑛𝐹ln
𝛼𝑚
𝛼𝑜
From this we can find the potential difference between the boundary of the inner filling solution
and the membrane. The equation is simply:
𝐸𝑖𝑛𝑛𝑒𝑟 = 𝐸𝑜𝑢𝑡𝑒𝑟 − 𝐸
Unlike Eouter, which depends on the C+ activity, Einner is constant due to the constant activity of
C+ in the inner filling solution. However, the activity of the ion in the membrane αm is almost
constant due to the high concentration of LC+ being in equilibrium with free L and C+ in the
membrane. As mentioned above, the R- ion is poorly soluble in water and cannot leave the
membrane. In order for a C+ ion to diffuse into the aqueous phase it must leave behind one R-
ion, as a result very small amounts of C+ can diffuse freely. This means that as soon as a tiny
amount of C+ ions leaves the membrane to enter the aqueous phase, any further diffusion is
prevented by the net positive charge near the surface of the membrane. This can be expressed
in the following equation for the potential difference between the inner and outer solutions:
𝐸 = 𝐸𝑜𝑢𝑡𝑒𝑟 − 𝐸𝑖𝑛𝑛𝑒𝑟 = (∆𝐺𝑠𝑜𝑙𝑣𝑎𝑡𝑖𝑜𝑛
𝑛𝐹−
𝑅𝑇
𝑛𝐹ln
𝛼𝑚
𝛼𝑜) − 𝐸𝑖𝑛𝑛𝑒𝑟
By combining the constant terms into one we get the simplified equation:
𝐸 = 𝑐𝑜𝑛𝑠𝑡𝑎𝑛𝑡 + (𝑅𝑇
𝑛𝐹ln 𝛼𝑜)

25
Therefore, the potential difference across the membrane depends on the activity of the analyte
in the outer aqueous solution. Simplifying further by converting ln to Log and inserting the
values of R, T and F at 25 oC we get:
𝐸 = 𝑐𝑜𝑛𝑠𝑡𝑎𝑛𝑡 +0.05916
𝑛log 𝛼𝑜
With αo being the activity of the ion in the unknown outer solution. If the analyte is an anion,
then the value of n is negative. The above equation shares some similarities with the Nernst
Equation. 8
2.5 Phase Boundary Potential
As proved above the potential across the membrane between the aqueous and hydrophobic
sensing phase is dependent on the logarithmic activity of the analyte ion in the outer aqueous
phase. This potential is known as the phase boundary potential. There is no experimental
method to directly determine the phase boundary potential, we determine the Electromotive
Force (EMF) instead. The EMF is the difference in the electrical potential between the ISE and
the reference electrode. EMF is a sum of 2 components:
1. Phase boundary potentials at all interfaces of the electrochemical cell. There are
numerous phase boundary potentials present along the path from the metal of the
connector of an ISE though the electrode, sample and reference electrode. The interface
types include metal-metal, metal-salt, salt-liquid and liquid-liquid.
2. Drop in voltage based on Ohm’s law. A drop in voltage between the working electrode
and reference electrode caused by the electrolyte conductivity, distance between the
electrode and the magnitude of the current. By Ohm’s law, the drop in voltage is a
product of the resistance and the current. 11
The second component that effects EMF is not applicable to ion-selective potentiometry as it
is nearly almost always performed under currentless conditions and the Ohmic drop is
negligibly small. Therefore, the EMF in an ion-selective potentiometric measurement is the
sum of all phase boundary potentials.
ISEs operate above their detection limits to measure electrical potential which is typically
referred to as Electromotive Force (EMF). The EMF response is directly related to potential
difference across the phase boundary between the sample and the hydrophobic phases.
Considering this we must first look at the significance of the phase boundary between an

26
ionophore-doped hydrophobic phase and an aqueous sample phase. One must understand the
potential across the phase boundary is relevant to the response to the ion of interest and the
selectivity.
2.5.1 Phase boundaries as explained by an extraction experiment 12
Consider an aqueous KCl solution equilibrated with insoluble organic phase containing an
electrically neutral ionophore for K+ such as Valinomycin. The phase boundary potential
depends on the concentration of KCl in the aqueous phase. During equilibrium, some KCl will
be present in the organic phase. With low concentrations of KCl in the system the potassium
ions within the organic phase will be bound to the ionophore in the form of a complex and there
will be an excess of free ionophore. The concentration of [K+] ions that are not bound to the
ionophore in the organic phase is very low relative to the concentration of the ionophore
complexes. The concentration of these free K+ ions can be calculated from the formation
constant of the ionophore-potassium complex [LK+]:
𝛽1:1 =[𝐿𝐾+]
[𝐿][𝐾+]
[𝐾+] =[𝐿𝐾+]
[𝐿]𝛽1:1
As the concentration of KCl in the aqueous phase increases, the concentration of the complex
[LK+] increases and in turn the concentration of free ionophore decreases in the organic phase.
From this we can see that the ratio of free ionophore to complexed ionophore changes and that
the concentration of free K+ in the organic phase depends on the activity of K+ in the aqueous
phase. Within the range of an excess of ionophore the phase boundary potential does not depend
on the concentration of K+ ions in the aqueous phase. The excess of ionophore facilitates the
phase transfer of the K+ ion into the organic phase and in doings so increases the concentration
of KCl in the same phase. The independence of the phase boundary potential to the K+
concentration in the aqueous phase means that it cannot be the basis of a sample EMF for an
ISE. Merely doping the organic phase with an ionophore does not make the ISE suitable for
potentiometric measurements. 12-13 12
To keep the activity of the analyte ion in the hydrophobic sensing phase sample independent,
one must add a hydrophobic ion with an opposing charge to the organic phase alongside the
electrically neutral ionophore. With the case for the K+ analyte ion, such an ion could be a
tetraphenylborate derivative such as tetrakis(4-chlorophenyl) borate (KTBC). Due to the need

27
for electroneutrality the total concentration of potassium ions in the organic phase is equal to
the concentration of the hydrophobic anion in the same phase. If the hydrophobic anion is the
only anion present in the organic phase, then the K+ ion concentration is not dependent on the
concentration of KCl in the aqueous phase. The hydrophobic anion also prevents the transfer
of Cl- ions into the organic phase, the equilibrium constant Kex expresses the distribution of
KCl between the 2 phases:
𝐾𝑎𝑞+ + 𝐶𝑙𝑎𝑞
− ⇌ 𝐾𝑜𝑟𝑔+ + 𝐶𝑙𝑜𝑟𝑔
−
𝐾𝑒𝑥 = 𝛼𝐾𝑜𝑟𝑔
+ 𝛼𝐶𝑙𝑜𝑟𝑔−
𝛼𝐾𝑎𝑞+ 𝛼𝐶𝑙𝑎𝑞
−
If the hydrophobic anion is not present in the organic phase, then the concentrations of K+ and
Cl- in the organic phase are equal. However, when the concentration of K+ ions are high in the
organic phase the activity of Cl- in the same phase is very low. Le Châtelier’s principle shows
that a high concentration of K+ in the organic phase drives the transfer of Cl- ions into the
aqueous phase.
The hydrophobic counter-ion to the analyte ion is commonly referred to as an ionic site and is
necessary for the function of ISE that are based around electrically neutral ionophores. 13 Ionic
sites that are used with an optimised ratio of electrically neutral ionophores improves the ISE
selectivity. For the organic phase to contain a significant concentration of free ionophore, the
concentration of ionic sites needs to be relatively low. From this we can conclude that a
Nernstian response for an ISE requires the ionic sites and ionophore to buffer the analyte ion
during the sensing phase. 12
The 2 main factors for the fabrication of an ISE are to ensure that the activity of the analyte ion
within the hydrophobic sensing phase does not depend on the sample composition and is
constant, and that all measured EMF contributions are sample independent. Once these factors
are taken into account there will be a desired Nernstian response from the analyte ion.

28
2.6 Ion-Selective Electrode Characterisation
2.6.1 Calibration
Calibration is the process of determining the response of a system or device to a known
concentration of the desired analyte to allow the determination of the unknown concentration
of the same analyte in a sample. The calibration curve is made by measuring the electrode
response in a series of standard solutions containing analyte, usually increasing or decreasing
concentration in increments of 10. The result is a line curve with the average potential on the
y-axis and the concentration of the analyte standard on a logarithmic x-axis. The slope or
gradient of the line fitted through the potential-log[analyte] dependence equates to the
sensitivity of the electrode. The theoretical Nernstian slope at room temperature is roughly 59
mV per decade change in ion activity and hence concentration. However, practically the slope
is usually lower than the theoretical value due to the inability to meet ideal conditions.
Therefore, the measured slope of the calibration curve for a monovalent ion is within the range
of 50-55 mV per decade of ion activity. Once the slope and the offset of the calibration curve
is determined, inserting the potential measured in an unknown sample into the equation of the
calibration curve, the concentration of the analyte ion can be calculated.
2.6.2 Detection Limit
Each ion selective electrode has a detection limit which is essentially the concentration/activity
of an analyte/ion can be accurately detected. It is represented on the calibration curve as the
point of intersection where the concentration is so low or so high that any changes to the
concentration below or above that point produce a negligible response from the electrode. One
can use a calibration curve to determine the activity/concentration of an analyte ion from a
linear curve with a R2 value of 1 where the data closely fits the regression line. However, if the
activity/concentration is too high or too low the curve of the line starts to deviate exponentially
from the ideal value of R2=1. In these areas the use of the line formula to determine the
activity/concentration of the analyte ion is inaccurate, hence this is the limit the ion can be
detected at.

29
2.6.3 Potential Drift
Potential drift is the slow change or deviation of a measured potential between the reference
electrode and the indicating electrode over time. Initial measurement of an electrolyte solution
causes large changes in the value of the measured potential. When the indicating electrode
immerses in measuring analyte, the electrode potential will gradually change as the ions in
solution begin to equilibrate with those entering the ion-selective membrane. Once an
equilibrium condition is met the equilibrium potential is used to calculate the ion concentration.
The time it takes for the electrode potential to reach equilibrium is called the response time.
Response time is affected by the type of electrode, the magnitude of which the ion
concentrations differ after changing, temperature, presence of interfering ions and static
condition of the solution (if the solution is being stirred). With continuous immersion of the
electrode in the analyte solution over a long period of time a drift from this equilibrium
condition can occur. The drift may be caused by various additional potentials from the liquid
junctions within the electrode itself or evaporation of the solvent in which the analyte is
dissolved and hence increasing the overall concentration. Other factors that can cause potential
drift are electrode contamination and degradation during measuring and storage that can cause
loss of sensitivity.
2.6.4 Precision
The measure of the reproducibility of a method or mechanism. As with any analytical process
it is unlikely that any 2 measurements of the exact same procedure will give the same results
due to a certain amount of variation. The expression of this random variation is precision. Given
a series of measurements of the same sample, the precision of the method is the standard
deviation of the mean value. It is important to know the precision of the measurements in order
to determine if the results are significantly different or similar and how close they are to the
true value, the accuracy. For example, if the mean values for the results of the exact same 2
measurements differ by more than double the standard deviation they are statistically different
by 66%. If the same number of measurements are performed several times more, the new mean
values can be expected to be within the standard deviation of the initial 66 cases out of 100.
Therefore, if a particular analytical method has a standard deviation of 5% assuming there are
not systematic errors, we can expect that 95% of the measurements give a result that is within
10% of the true value.

30
The accuracy and precision of ISE measurements can be highly variable and are dependent on
several factors. Any error in measurement will cause an error in the concentration as the
measured voltage is proportional to activity and hence concentration. The concentration is
logarithmically dependant on the slope of the calibration line. Mono-valent ions generally have
a slope of about 55 mV per decade concentration so an error of 1 mV will cause approximately
4% error in the concentration. At the lower end of the range of concentration the slope is lower
in value and the graph descends into non-linear data points. This causes greater percentages of
error for concentration at low concentrations. Therefore, it is important to use a system that can
measure millivolts precisely and accurately to minimise the error. This is factored in with the
use of a multiplexer and adequate computer software that is able to display the data concisely.
The most important factors in acquiring the most accurate results possible are controlling the
liquid junction potential of the reference electrode and controlling the drift of the electrode. In
controlling these factors, the measured voltage will be reproducible.
The factors that affect the accuracy of the results are the presence of interfering ions, the
difference in ionic strength between the standards and the sample and any variation of the slope
at different points of the curve. It is highly unlikely that the slope of the calibration curve will
be the same along the range of standard solution measurements. If the overall slope is used in
the calculation of sample concentration, it will give different concentrations to those calculated
using the individual slope between the two points where the sample voltage lies. Using a range
of standards and frequently calibrating the sensor is the best way to ensure that the results will
be accurate and reproducible.
31
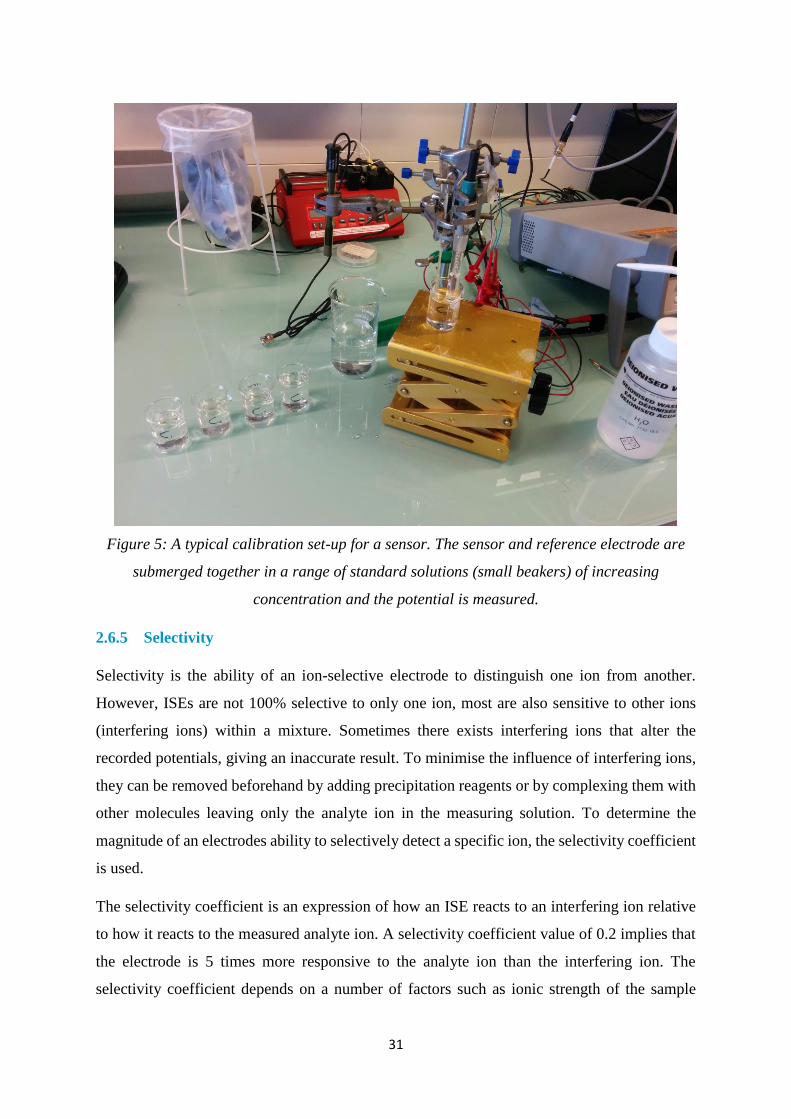
Figure 5: A typical calibration set-up for a sensor. The sensor and reference electrode are
submerged together in a range of standard solutions (small beakers) of increasing
concentration and the potential is measured.
2.6.5 Selectivity
Selectivity is the ability of an ion-selective electrode to distinguish one ion from another.
However, ISEs are not 100% selective to only one ion, most are also sensitive to other ions
(interfering ions) within a mixture. Sometimes there exists interfering ions that alter the
recorded potentials, giving an inaccurate result. To minimise the influence of interfering ions,
they can be removed beforehand by adding precipitation reagents or by complexing them with
other molecules leaving only the analyte ion in the measuring solution. To determine the
magnitude of an electrodes ability to selectively detect a specific ion, the selectivity coefficient
is used.
The selectivity coefficient is an expression of how an ISE reacts to an interfering ion relative
to how it reacts to the measured analyte ion. A selectivity coefficient value of 0.2 implies that
the electrode is 5 times more responsive to the analyte ion than the interfering ion. The
selectivity coefficient depends on a number of factors such as ionic strength of the sample

32
solution, temperature and the ratio of ions within the solution. The coefficient is denoted by
KA,B with A being the analyte ion and B being the interfering ion. When KA,B is equal to 1 there
is an equal response to both ions A and B. Another name for the selectivity coefficient is the
Nikolski-Eisenman coefficient, which can be used in an extension of the Nernst Equation to
relate the potential to the activities of the analyte and interfering ions.
For the Nernst equation: 8
𝐸 = 𝐸0 −0.05916
𝑛log 𝑄
Log(Q) is replaced with: 8
log 𝛼𝑥 + [𝐾𝑥,𝑦(𝛼𝑦)𝑍𝑥𝑍𝑦 + 𝐾𝑥,𝑧(𝛼𝑧)
𝑍𝑥𝑍𝑧 +] … 𝑒𝑡𝑐
Where Kx,y is selectivity coefficient for ion y of an electrode sensitive to primary ion x, Kx,z is
selectivity coefficient for ion z of an electrode sensitive to primary ion x, αx is the activity of
primary ion x, αy and αz is the activity of interfering ions y and z respectively, Zx is the charge
on the primary ion x, Zy and Zz is the charge of the interfering ions y and z respectively.
A membrane shows significantly good selectivity when the selectivity coefficient is just below
the value of 1. Selectivity is not only a main characteristic of ISEs but it is also used to
determine the stabilities and stoichiometries of ionophore complexes for their use in specific
applications.
2.6.6 Screen Printing
The main advantage of screen printed sensors from a manufacturing perspective is the ability
to reproducibly fabricate large numbers of sensors by relatively simple and low cost
techniques.14 The printing process is fast, inexpensive and suitable for mass production. Screen
printing has indeed played an important role in the development of sensors over the years for
example, the fabrication of microfluidic paper based sensors by Zhihong et al. They determined
that paper was an ideal matrix for electrochemical devices, providing a thin mechanically
stabilized film that directs analyte fluids to the surface of electrodes. The utilization of the
screen printing method allowed them to create sensors with relative ease. 15 16, 16b, 17

33
2.7 Ion-Selective Membranes
2.7.1 Membrane Fabrication
Hydrophobic polymers such as PVC are generally used as substrates for the fabrication of the
ion selective membrane. The polymer is capable of producing thin films of sufficient
permeability and in combination with the ionophore and the plasticizer, creates ionic mobility
across the membrane. During its use, the plasticizer and ionophore ligand may continuously
migrate out of the membrane.
To meet the demand for portable sensing devices with small sample volumes, low cost and
easy maintenance we need to overcome several limitations facing the fabrication of ion-
selective electrode devices. The ISE liquid contact filling solutions are sensitive to temperature
and pressure and therefore are at risk of evaporation. Also the differences of ionic strengths
between the sample and the inner filling solution can cause rapid changes in osmotic pressure
and large changes in volume. 18
2.7.2 Immobilised Valinomycin Molecule for K+ Sensor 19
Valinomycin is an appropriate choice for a ligand in a K+ sensor as it exhibits very high affinity
towards the ion. It is potent antibiotic that can act as a K+ ionophore which induces K+
conductivity in cell membranes. As it does not have any residual charge, it is a natural neutral
ionophore. Highly selective for potassium ions over sodium ions, it functions as a potassium
transporter. Valinomycin facilitates the movement of potassium ions through lipid membranes
with an electrochemical potential gradient. 20
The ionophore is used in the creation of the potassium selective membrane alongside other
membrane components such as a plasticizer and a polymer matrix. However, some difficulties
have arisen with this composition of the K+ membrane, the ligand and plasticizer are observed
to leach out of the membrane and cause inaccurate results due to potential drift.
Considering this problem, Pepi et al. 19 has sought to create a stabilised K+ ion selective
membrane using lysine-substituted Valinomycin that is covalently bound to an insoluble solid
polymeric substrate. They have found that this membrane has improved stability within an ISE
and the lifetime has extended because the ligand does not leach out of the membrane.
Additionally, they have a method to determine the optimum concentration of the ligand within
the membrane to reproduce the solution consistently.

34
The use of Valinomycin allows for improved potassium ion selectivity which is imparted to
the Ion-selective sensor. They incorporate the use of lysine derivative of Valinomycin that is
covalently bonded through the primary amine group of the lysine to a carboxyl group present
on an insoluble organic solid polymer substrate. The covalently linked Valinomycin ligands
can be applied with conventional ISEs if they are immobilised to a polymer within a conductive
membrane. Substituting Lysine in place of Valine in Valinomycin provides a side chain
through which the molecule can be immobilised.
Figure 6: Valinomycin and Lysine substituted Valinomycin 19
The mechanism that binds K+ ions to Valinomycin is similar to that of water. Free potassium
is surrounded by the oxygen atoms in H2O and the same is observed in Valinomycin with the
6 oxygen atoms in the Valine groups. The ring structure of the molecule allows it to coordinate
into the most favourable orientation and provides a polar interior to accommodate the
potassium ion. The size of the Valinomycin ring is larger than the ionic radius of K+ and the
ligand can wrap around the cation and a high selectivity for K+ is achieved. Consequently, the
molecule then also creates a non-polar lipophilic exterior.
Potassium ions are the most abundant physiological metal ions present in the body and they
have various crucial roles in biology. They maintain suitable pH equilibrium and cellular
osmotic pressure and throughout the nervous system they are involved in different sensory
transduction cascades. 21 Potassium has roles in the biological processes that are associated
with the regulation of nerve transition, blood pressure, kidney function and muscle contraction.
An imbalance of potassium can trigger certain diseases and conditions such as hypertension,
anorexia, strokes, diabetes, heart disease and renal disease. 11 With these significances of
potassium ions in mind, it is crucial that accurate analytical techniques are available to detect
and quantify these ions.

35
2.7.3 Sodium Ionophore IV
2,3:11,12-DIDECALINO-16-CROWN-522 (Sodium Ionophore IV) is an ideal ionophore of
choice to reversibly bind to sodium ions. It has a high affinity towards sodium due to the same
basic mechanism described in the previous Valinomycin section. This ionophore also provides
an interior polar ring structure that allows for the accommodation of a Na+ ion.
2.8 Sweat
Human sweat consists of a complex mixture of numerous ions and trace substances and can
provide physiological information. The complexity of sweat means that in order to detect and
quantify components, simultaneous, multiplexed and integrated measurements are required to
ensure complete accuracy. 5
There exists a relationship between the concentrations of specific ions in sweat and conditions
that lead to diseases. Ions such as sodium and potassium are among the most important
electrolytes present in the body. 23 Excessive loss of Na and K can lead to hyponatremia, muscle
cramps or dehydration. Hyponatremia is the most common electrolyte disorder and is caused
by serum sodium levels dipping below 135 mmol per L. Total serum sodium level is affected
by the total exchangeable sodium and potassium levels in biological fluids, blood, sweat etc.
Patients with acute hyponatremia likely need treatment in the intensive care unit with
hypertonic saline solution to prevent any permanent neurologic injury. 24 The relationship
between total serum sodium levels and exchangeable ions is shown in the following equation:
[𝑁𝑎]𝑠 =[𝑁𝑎]𝑒 + [𝐾]𝑒
𝑇𝐵𝑊
Where [Na]s is serum sodium level, [Na]e is exchangeable sodium level, [K]e is exchangeable
potassium level and TBW is total body water content.
One of the main symptoms of dehydration is excess levels of chloride and sodium in sweat.
The average sodium sweat concentration in humans is roughly 35 mmol L-1 and average
chloride sweat concentration is 30 mmol L-1 with variables including diet, genetic
predisposition and sweat rate. 25
Monitoring the concentration of chloride ions in sweat can confirm or deny the diagnostic of
Cystic Fibrosis. If the sweat chloride concentration exceeds 60 mmol L-1 it indicates the
presence of the expressed recessive gene that leads to the disorder. 26

36
A flexible sensor that can incorporate a quality of detection for clinical purposes must be able
to perform accurately and consistently over a long period of time. As with any sensing system,
a minimal drift from consecutive tests is ideal and inspires confidence in the abilities of the
sensor. Both the stability of the sensor during analysis and the lifetime when it is not being
used (shelf-life) need to be studied to optimise the sensors capabilities.
2.9 Reproducibility, stability and lifetime
Typically for analytical devices or electrochemical biosensors the definition of reproducibility
is the measure of the drift in a series of tests or observations over a specified period of time,
generally determined within a usable range of analyte concentrations. 27
The stability of operation of a sensor varies considerably depending on preparation, design,
chemical environment and physical conditions. Operational stability can be determined
optimally with known analyte concentrations, continuous or sequential contact between the
sensor and analyte and ideal lab conditions such as temperature, pressure and pH. Knowing the
rate limiting step for the sensor is important for knowing the stability. For the assessment of
storage stability significant considerations include the state of storage, i.e. wet or dry, presence
of additives, atmospheric pressure and temperature etc. 27
It is important to distinguish between the lifetime of storage (shelf-life) and operational lifetime
and to take into account the various conditions in each. Also, it is important to specify the mode
of assessment of lifetime, i.e. by referring to the initial sensitivity test using a linear
concentration range for a calibration curve. D.R. Thévenot et al states that the definition of
lifetime tL is:
“The storage or operational time necessary for the sensitivity, within the linear concentration
range, to decrease by a factor of 10” 27
To determine the lifetime in storage, one must compare the sensitivities of different sensors
from the same production method after different storage times under identical conditions.
2.9.1 Potassium sensors
The last decade has seen researchers and scientists focusing on the development of solid state
potassium ion selective electrodes with conducting polymers as the material for solid contact.
There are 2 main types of conducting polymers that have been studied, polypyrroles and
polythiophenes. Based on these groups, different methods of fabrication have been tested with

37
specific selective membranes. For the purposes of this review we will consider the most
important sensor characteristics to be stability, potassium selectivity and response time. A
stable potential is crucial for tests that require the electrode to stay in contact with the sample
for long periods of time. Potential stability is particularly important for reproducibility without
frequent calibration and response time is important for ease of use and commercialisation. For
biological fluids such as sweat, selectivity to other ions such as sodium and chloride must be
considered also. Due to the fact that most modern sensors have a lower limit of detection far
lower than typical levels in biological samples we shall consider this characteristic of little
importance. The required ranges for potassium ions in common biological samples are given
in Table 1. 28
The required operating range for potassium ions in sweat is 2.5-6 mmol L-1. This means an ion
selective electrode must be able to measure potential approximately between -50 mV and -100
mV in order to detect the ion in a sample of sweat.
Specimen Reference Range (mmol L-1)
(normal adult range)
Analytical Range (mmol L-1)
(required operating range to
measure values relevant to
clinical practice)
Saliva 10.9 – 25.5 2 – 25
Sweat 4 – 7 2.5 – 6 6
Blood 3.5 – 5.1 2 – 10
Urine 25 – 125 5 – 170
Table 1: Required ranges for potassium ions in common biological fluids
An overview of relevant research into solid-contact potassium ion-selective membrane
electrodes is given in the Table 2. The majority of research into potassium selective membranes
utilises Valinomycin as an ionophore and PVC as a base for the membrane. The focus on
potassium selective membranes for this project will also be based around Valinomycin and
PVC solutions. Their effectiveness as reagents is proved by their popularity with other research
groups.

38
2.9.2 Solid contact potassium selective electrodes – A Review Table 28
Table 2: Review of current solid contact potassium selective electrode research
Internal
Contact
Selective
Membrane
Sensitivity
(mV/decade)
[lin range M]
Baseline Drift Selectivity
[interfering ion]
Response
Time (s)
Authors
PPy/FeCN Va, PVC, DOS 59.1 ± 0.8
[N.S.]
-2.0 mV/h (0.03
ideally*)
Slight O2
interference
N.S. Gyurcs´anyi et
al.29
PEDOT/
PSS
Va, PVC, DOP 39
[10−2.5 − 10−1]
N.S -2.3 [Na+],
FIM
N.S. Odijk et al.30
CB:Gr
(3:1)
Va, PVC,
KTpCIBP, o-NPOE
59.1 ± 0.02
[10−6.5 − 10−1]
<1 µV/h
(50 hours)
Insensitive to O2,
CO2 and light
N.S. Paczosa-
Bator31
PPy/CbD PVC/ ocac 51 ± 2
[10−6 − 10−1]
N.S.
(only stable
slope)
-2 [Na+],
MPM
t95 < 14.2 Zine et al.32
PPy/TPB PVC/ dbc N.S.
[10−3 − 10−1]
1 mV/day -1.39 [Na+],
-2.76 [Ca2+],
FIM
< 5 Pandey et al.33
PEDOT/
PSS
Va, PVC, DOS 56.2 ± 0.7
[10−4 − 10−1]
N.S. N.S. N.S. V´azquez et
al.34
POT MMA-DMA/ocac 59.2
[10−7 − N.S.]
N.S. (2.7 mV/h
for Ag-ISE)
N.S. N.S. Chumbimuni-
Torres
et al.35
PEDOT/
PSS
Va, PVC, DOS 58.8 ± 0.8
[10−6 − 10−1]
N.S −5.3 ± 0.06 [Mg2+],
−5.8 ± 0.06 [Ca2+],
−5.5 ± 0.07 [Ba2+]
N.S Michalska and
Maksymiuk36
Gc CwNT, Va, PVC 51.9 ± 0.6
[10−6 − 10−1]
SD of 4.4 mV −3.6 [Na+],
−3.6 [Ca2+],
N.S. Mousavi et al.37
CwNT,
ODA
Va, nBA 57.2 ± 1.2
[10−6 − 10−2]
0.19 mV/h
(24 hours)
−5.0 ± 0.1 [Na+],
−2.0 ± 0.1 [NH+4],
−5.7 ± 0.1 [Ca2+]
< 10 Rius-Ruiz et
al.38
Cc Va, PVC, DOS 59.9 ± 0.7
[10−5 − 10−1]
0.36 mV/day
(42 days)
N.S N.S Mattinen et
al.39
Gr Va, PVC, DOS 60.0 ± 1.8
[10−7 − 10−1]
SD of 4 mV
(3 weeks)
−3.5 ± 0.2 [Na+],
−3.7 ± 0.3 [Ca2+]
N.S. Jaworska et
al.40
FCB Va, PVC, DOP 59.9 ± 1.0
[10−6 − 10−1]
0.11 mV/h N.S. 4.2 Ivanova et al. 41

39
N.S.: not specified. PPy: polypyrrole,
POT: polythiophenes PEDOT: polythiophenes
FeCN: hexacyanoferrate, PSS: poly(sodium4-styrenesulfonate),
TPB: tetraphenylborate, SSA: 1-Hydroxy-4-sulfobenzoic acid,
CwNT: carbon walled nanotubes, ODA: octadecylamine,
Cc: carbon cloth, Gr: graphene,
Gc: glassy carbon, (F)CB: (fullerene) carbon black,
El-21: resin, CIM: Colloid-Imprinted mesoporous carbon,
Cobalt: salt of [Co(phen)3](T P F P B)2), CbD: cobaltabis(dicarbollide),
Va: valinomycin, PVC: polyvinylchloride,
DOS: Dioctyl sebacate, nBA: nbutyl acrylate,
dbc: dibenzo-18-crown-6, SD: standard deviation,
ocac: 1,3-(di-4-oxabutanol)-calix[4]arene-crown-5,
MMA-DMA: metyl methacrylate-decyl methacrylate,
KTpCIBP: potassium tetrakis(4-chlorophenyl) borate,
o-NPOE: o-nitrophenyl octyl ether, SSM: separate solution method,
FIM: fixed interference method (interferent of 10mM),
DOP: bis(2-ethylhexyl)phthalate, MPM: matched potential method. 28
*After 1-year storage and extensive conditioning procedures.
**All relevant cations in blood were accurately determined by the sensor, with a commercial
electrolyte analyser as reference.
Legend for Table 2
40
2.9.3 Sodium sensors
Specimen Reference Range (mmol L-1)
(normal adult range)
Analytical Range (mmol L-1)
(required operating range to
measure values relevant to
clinical practice)
Saliva 2 – 21 42 1 – 25
Sweat 20 – 100 6 10 – 120
Blood 135 – 145 24 125 – 150
Urine <30 24 20 – 40
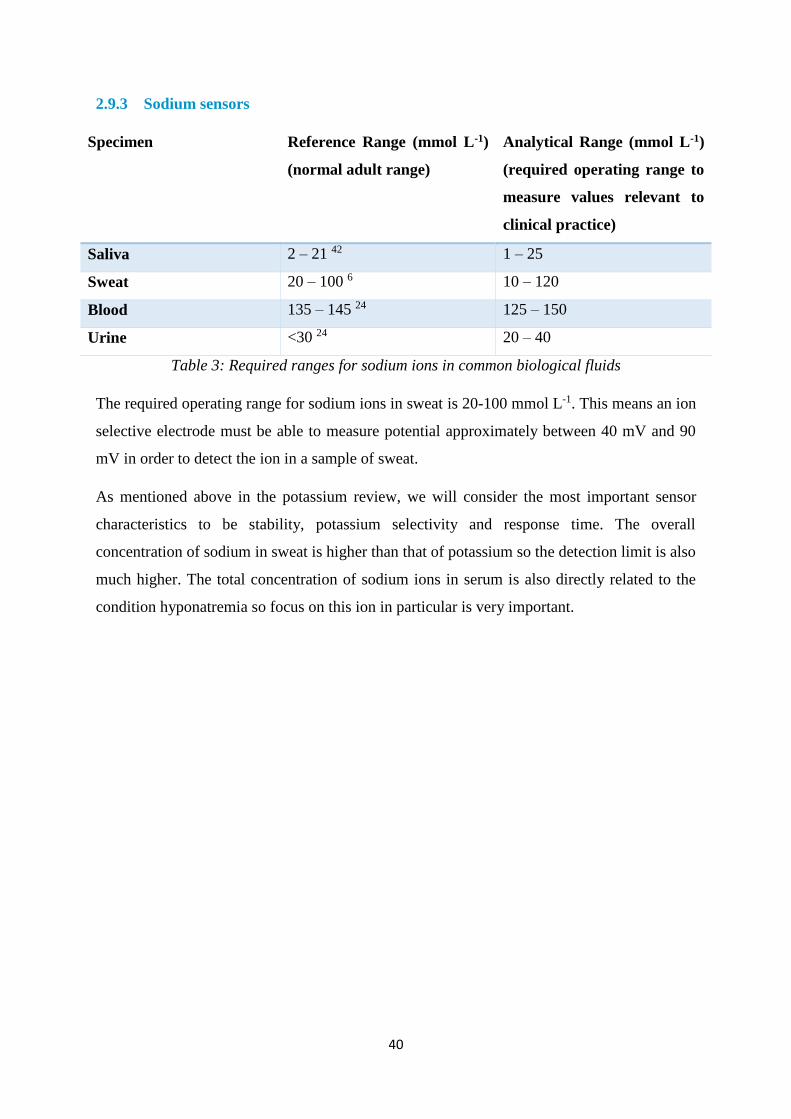
Table 3: Required ranges for sodium ions in common biological fluids
The required operating range for sodium ions in sweat is 20-100 mmol L-1. This means an ion
selective electrode must be able to measure potential approximately between 40 mV and 90
mV in order to detect the ion in a sample of sweat.
As mentioned above in the potassium review, we will consider the most important sensor
characteristics to be stability, potassium selectivity and response time. The overall
concentration of sodium in sweat is higher than that of potassium so the detection limit is also
much higher. The total concentration of sodium ions in serum is also directly related to the
condition hyponatremia so focus on this ion in particular is very important.

41
2.9.4 Solid contact sodium selective electrodes – A Review Table
Table 4: Review of current solid contact sodium selective electrode research
PUR: Polyurathane, PB: Prussian Blue
CCF: commercial carbon fibres TCNQ: 7,7,8,8-tetracyanoquinodimethane
MWCNT: Multi-walled carbon nanotubes NaxWO3: Sodium-tungstan-bronze
AuNPs: Gold nanoparticles Na-IV: sodium ionophore IV
LAc: Lipoic acid LAm: Lipoic amide
PEDOT: polythiophenes PSS: poly(sodium4-styrenesulfonate),
HHCAE: hydrophilic high-capacity anion-exchange membrane (fumion FAA-3 ionomer)
Na-X: 4-tert-Butylcalix[4]arene-tetraaceticacid tetraethyl ester
N.S: not specified
Legend for Table 4
Internal
Contact
Selective
Membrane
Sensitivity
(mV/decade)
[lin range M]
Baseline Drift Selectivity
[interfering ion]
Response
Time (s)
Authors
PUR
Ag/AgCl-
Paper
Va, (HHCAE) 56.6 ± 1.0
[10-0.7 - 10-3.1]
N.S. N.S. N.S. Hu et al. 43
CCF/
MWCNT
Na-X 59.2 ± 0.6
[10-3 - 10-1]
-0.4 ± 0.3 mV/h
(4.5 hours)
-2.3 [K+]
-2.3 [Mg2+]
-2.5 [Li+]
-2.6 [Ca2+]
N.S. Parrilla
et al. 44
PEDOT/PB Na-X/PVC 55.5
[10-5 - 10-1]
-0.04 ± 0.01
mV/min
(4 hours)
N.S. N.S. Matzeu
et al. 45
NaxWO3 HCl 54.6 ± 0.6
[N.S.]
-0.1 mV/min -8.2 [Na+]
-8.7 [K+]
-8.7 [Ca2+]
-8.1 [Mg2+]
40 Cisternas
et al. 46
AuNPs/LAc-
LAm
Na-X/PVC 33.23 ± 2.5
[10-5 - 10-2.5]
0.02 ± 0.008
mV/min
Removed by
preconditioning
N.S. Matzeu
et al. 47
TCNQ Na-IV/PVC 58.68
[10-6 - 10-1]
9.1 ± 1.1 µV/h
(172 hours)
-3.0 [K+]
-3.2 [NH4+]
-3.9 [Ca2+]
-4.1 [Mg2+]
4-5 Paczosa-
Bator et
al. 48
PEDOT/PSS Na-X/PVC 57.59 ± 1.47
[10-1 - 10-6]
5 µV
(14 hours)
-3.7 [K+]
-1.4 [Ca2+]
N.S. Jasinski
et al. 49

42
Summary
At imec, K+ and Na+ selective sensors were developed due to their physiological importance in
the diagnosis of various conditions such as hyponatremia and dehydration. In earlier study, the
ionophores Valinomycin and Na ionophore IV were chosen for the potassium and sodium ion-
selective membranes due to their high selectivity for K+ and Na+, respectively. Plasticized PVC
was selected for immobilization of the ionophores due to its ability to create thin, permeable
films which allow for sufficient mobility for ionic species. Composition of the PVC based
potassium and sodium selective membranes and their thickness were successfully optimized to
achieve the sensitivity close to the Nernstian value for both potassium and sodium ions [V.A.T.
Dam, M. Zevenbergen, P. van Schaijk, Flexible ion sensors for bodily fluids, Proceeding
Eurosensors XXX, September 2016].
The objective of this project is to investigate the lifetime of PVC-based ion selective electrodes
through continuous and non-continuous measurement of the electrode potential. Siloprene will
also be investigated as a base for an ion-selective membrane without a plasticizer. The
formulation of the ion selective membrane solutions will also be assessed further and optimised
to give the best sensitivity and response.
Ultimately the information gained through this project will be used in the implementation of
the ion-selective electrodes onto a wearable sensing platform to analyse human sweat. The goal
of the gas and ion sensors group is to create a non-invasive, easy to use and cheap wearable
device in the form of a skin patch that can measure multiple ions at the same time from sweat
collected on the skin. This information may be of great use to clinical professionals or
individuals with a keen interest in sports and exercise.
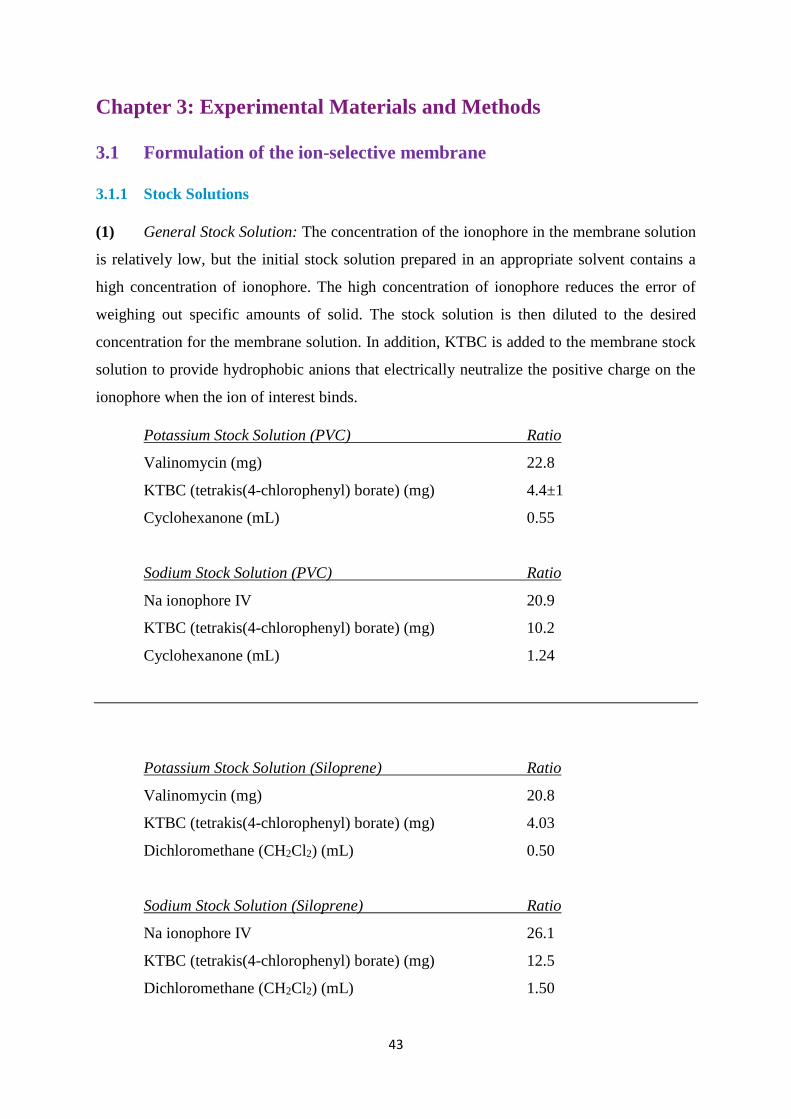
43
Chapter 3: Experimental Materials and Methods
3.1 Formulation of the ion-selective membrane
3.1.1 Stock Solutions
(1) General Stock Solution: The concentration of the ionophore in the membrane solution
is relatively low, but the initial stock solution prepared in an appropriate solvent contains a
high concentration of ionophore. The high concentration of ionophore reduces the error of
weighing out specific amounts of solid. The stock solution is then diluted to the desired
concentration for the membrane solution. In addition, KTBC is added to the membrane stock
solution to provide hydrophobic anions that electrically neutralize the positive charge on the
ionophore when the ion of interest binds.
Potassium Stock Solution (PVC) Ratio
Valinomycin (mg) 22.8
KTBC (tetrakis(4-chlorophenyl) borate) (mg) 4.4±1
Cyclohexanone (mL) 0.55
Sodium Stock Solution (PVC) Ratio
Na ionophore IV 20.9
KTBC (tetrakis(4-chlorophenyl) borate) (mg) 10.2
Cyclohexanone (mL) 1.24
Potassium Stock Solution (Siloprene) Ratio
Valinomycin (mg) 20.8
KTBC (tetrakis(4-chlorophenyl) borate) (mg) 4.03
Dichloromethane (CH2Cl2) (mL) 0.50
Sodium Stock Solution (Siloprene) Ratio
Na ionophore IV 26.1
KTBC (tetrakis(4-chlorophenyl) borate) (mg) 12.5
Dichloromethane (CH2Cl2) (mL) 1.50
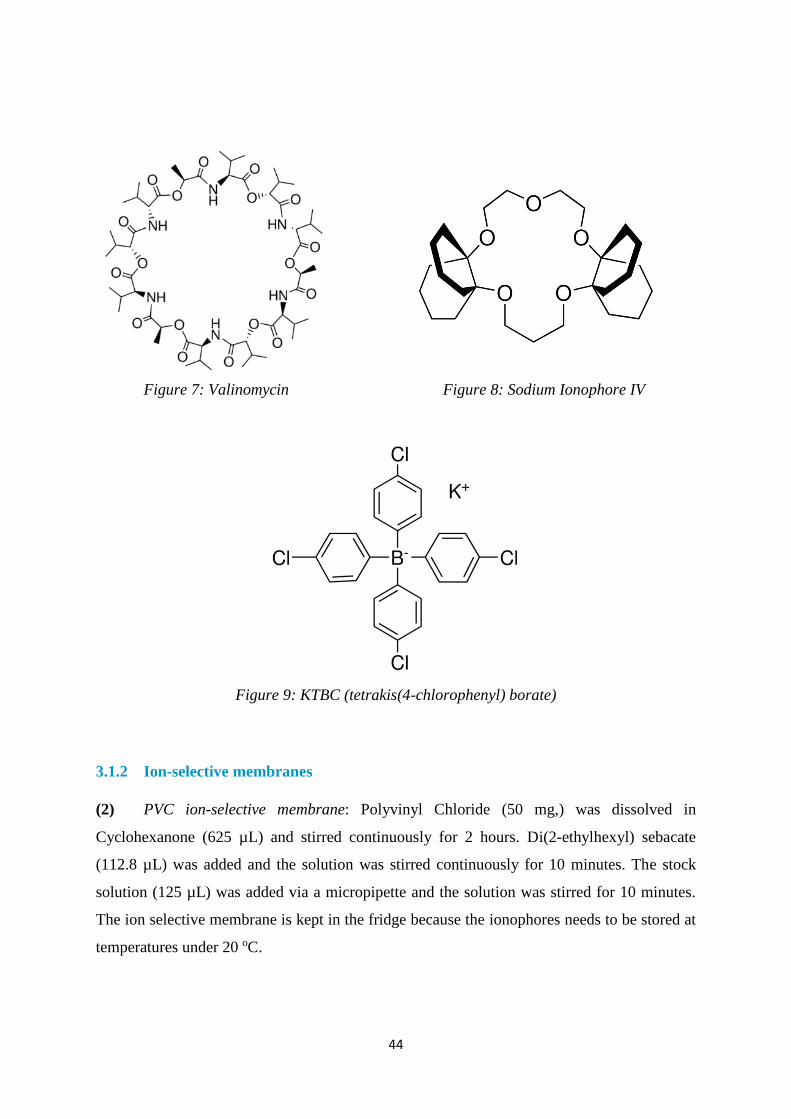
44
Figure 7: Valinomycin Figure 8: Sodium Ionophore IV
Figure 9: KTBC (tetrakis(4-chlorophenyl) borate)
3.1.2 Ion-selective membranes
(2) PVC ion-selective membrane: Polyvinyl Chloride (50 mg,) was dissolved in
Cyclohexanone (625 µL) and stirred continuously for 2 hours. Di(2-ethylhexyl) sebacate
(112.8 µL) was added and the solution was stirred continuously for 10 minutes. The stock
solution (125 µL) was added via a micropipette and the solution was stirred for 10 minutes.
The ion selective membrane is kept in the fridge because the ionophores needs to be stored at
temperatures under 20 oC.

45
(3) Siloprene ion-selective membrane: Siloprene K1000 (100 mg,) and the siloprene
crosslinking agent (10 mg) were weighed out on an electronic balance by careful use of a
micropipette and dissolved in CH2Cl2 (874 µL) and stirred continuously for 30 mins. The stock
solution (126 µL) was added via micropipette and the solution was stirred continuously for 10
minutes. The ion selective membrane is kept in the fridge because the ionophores needs to be
stored at temperatures under 20 oC.
Ion-selective Membrane (PVC) Ratio
Stock Solution (µL) 125
Polyvinyl Chloride (PVC) (mg) 50
(DOS) (µL) 113
Cyclohexanone (µL) 625
Ion-selective Membrane (Siloprene) Ratio
Stock Solution (µL) 126
Siloprene K1000 (mg) 100
Siloprene crosslinking agent (mg) 10
Dichloromethane (CH2Cl2) (µL) 874
Figure 10: Polyvinyl Chloride (PVC)
Figure 11: Di(2-ethylhexyl) sebacate (DOS)

46
3.1.3 Hydrogel
(4) Hydrogel-1 (2% HEC, 0.1 M KCl in DI water). Potassium Chloride (48.4 mg) was
dissolved in deionized water (5 mL). Triethylene glycol (1.85 mL) was added and the solution
was stirred continuously and heated at 45-50 oC for 40 minutes. Hydroxyethyl cellulose (196
mg) was added and the mixture was stirred continuously for 1 hour until the solution became
very viscous.
Hydrogel-1 (2% HEC, 0.1 M KCl in DI water) Ratio
Potassium Chloride (mg) 48.4
Hydroxyethyl cellulose (HEC) (mg) 196
Triethylene glycol (TEG) (mL) 1.85
Deionized Water (mL) 5
Figure 12: Hydroxyethyl cellulose (HEC)
Figure 13: Triethylene glycol (TEG)

47
3.2 Ion-selective electrode miniaturisation
Figure 14: Miniaturisation of a conventional ISE onto a flexible substrate

48
The miniaturisation of a conventional ion-selective electrode into a system that operates on a
flexible substrate is a process that replaces certain aspects of the sensor with more convenient
alternatives. The internal electrolyte is replaced by a HEC hydrogel that has been doped with
KCl solution and the membrane is replaced by an ion-selective membrane solution that is
allowed to dry on the hydrogel. The two phases do not mix so a phase boundary still remains
between an aqueous layer and a hydrophobic layer.
Once a stock solution has been made, a membrane solution can be made in less than an hour.
This paired with the fact that the ion selective membranes are high customizable means that
many different and unique sensor samples can be made in one day.
3.3 Drop-casting method
Figure 15: Layers are drop-cast onto the flexible substrate

49
1. The screen-printed electrode on a flexible substrate was selected and the amount of
reagent to be deposited was calculated based on the diameter of the well on the
substrate. The diameter was either 2 mm or 3 mm.
2. Using a micro pipette, the hydrogel was deposited into the well to fill approximately
80% of the total volume and ensuring the Ag/AgCl electrode is fully covered by the
gel. The gel was then left for 20 min to settle while ensuring it does not fully dry out.
3. The ion selective membrane was then deposited on top of the hydrogel layer ensuring
it is completely covered. By using the end of the pipette tip the membrane was spread
over the rim of the surface. The sensor was stored in humid conditions to prevent the
hydrogel layer from drying out fully. The amount of membrane solution deposited and
the number of membrane layers was dependant on the solvent used when making the
membrane solution.
It should be noted that the drop-casting method for a siloprene-based membrane was very
temperamental due to the volatile solvent dichloromethane. The solvent was observed to
evaporate very quickly so the spreading step was carried out hastily.
3.4 Flexible sensor stick
Figure 16: Schematic of the flexible sensor stick with 4 electrode sites
Each printed Ag/AgCl electrode may by modified with ion-selective membranes for potassium
or sodium sensing or with the hydrogel solution for an integrated reference electrode. The
electrodes are screen printed on a DEK HORIZON 03i printer from silver chloride conducting
paste and the material on which the electrodes are printed on is thermoplastic polyurethane.

50
Each Ag/AgCl electrode has a diameter of 1 mm and is contained within a well of 2 or 3 mm
diameters.
3.5 Sensor Calibration
Figure 17: Diagram of the general set up of a calibration measurement
The sensors were calibrated by measuring the potential of the ion-selective electrode against a
commercial reference electrode (CRISON 50 44) in a series of standard solutions. Each
electrode on the sensor stick was connected to a channel and fed through a multiplexing unit
that compressed the channels into a single signal that is processed by a voltmeter. The software
used to analyse the potentiometric data was LabVIEW. One calibration test for a single sensor
took 40 mins to 1 hour to finish. The data from the test was processed and plotted using
Microsoft Office Excel 2016.

51
Chapter 4: Results and Discussions
4.1 Characterisation of the sensor
The performance of the flexible ion selective membrane was evaluated by measuring the
potential difference between the ion selective electrode and reference electrode upon changes
of activity of the analyte ion by using a series of standard solutions of varied concentrations
from 1 – 10-4 M. It should be noted that the reference electrode was not conditioned before
starting the calibration procedures. During non-use, the reference electrode was submerged in
KCl solution (3 M).
A calibration of the flexible sensor was performed by measuring the EMF versus time in
seconds and changing the activity of the analyte ion by swapping out standard solutions of
differing concentrations. During the changing period, the reference electrode and membranes
were washed with de-ionised water and patted down with standard lab tissue. At no point was
the surface of the membrane allowed to touch the reference electrode or the inside of the beaker
that contained the standard solution.
The sensor in Graph 1 demonstrated a response time of about 10 seconds. This sensor contains
4 ion selective electrodes which all show a linear range from 10-4 M to 1 M KCl and display
Nernstian behaviour of about 54 mV per decade of KCl concentration (see Graph 1 and Graph
2). This response is appropriate for monitoring physiological parameters in sweat during
exercise. Potassium concentration during sweating progressively decreases when the body
begins to burn proteins instead of carbohydrates due to the depletion of sugars in the transition
from aerobic to anaerobic states.

52
Graph 1: OP-13 calibration series
Graph 2: OP-13 calibration slopes
-200
-150
-100
-50
0
50
100
0 500 1000 1500 2000 2500 3000 3500 4000 4500
Po
ten
tial
(m
V)
Time (s)
OP-13 K+ sensor (PVC/cyclohexanone) 4 layers (4 x 3μL) [3mm]
Device 1
Device 2
Device 3
Device 4
-200
-150
-100
-50
0
50
100
-4 -3.5 -3 -2.5 -2 -1.5 -1 -0.5 0
Ave
rage
Po
ten
tial
(m
V)
Log10[KCl]
OP-13 K+ sensor (PVC/cyclohexanone) 4 layers (4 x 3μL) [3mm]
Device 1
Device 2
Device 3
Device 4

53
Device 1 y = 56.587x + 46.1 R² = 0.9996
Device 2 y = 53.012x + 46.034 R² = 0.9995
Device 3 y = 53.331x + 54.689 R² = 0.9997
Device 4 y = 55.9x + 41.83 R² = 0.9997
Table 5: OP-13 Calibration slopes and R values
This ranges covers the typical levels of potassium in sweat which fall within 0.2 to 6 mM.50 As
seen from the figure above, the sensor was able to function for over 4000s (approx. 66 min)
and maintains a reproducible level of response. This timeframe is ideal for a general physical
workout in which a substantial amount of sweat can be produced to be detected by the sensor.
The selectivity of the sensor was achieved by functionalizing the electrode with an ion-selective
membrane that is doped with an ionophore molecule specific to the analyte ion to be measured.
In the case of potassium sensing the ionophore of choice was Valinomycin. By utilizing this
ion-selective membrane we are able to avoid any interferences that might occur from other
cations that are present in sweat such as Na+ and NH4+.
The repeatability and reproducibility of the response of a single sensor was evaluated by
performing several calibration plots from each series. The following data shows the statistical
accuracy of each device relative to the Nernstian value at room temperature, 58.5 mV/decade:
Graph 3: OP-13 device 1
Series 1y = 54.664x + 39.892
R² = 0.9998
Series 2y = 56.294x + 45.777
R² = 0.9996
Series 3y = 56.459x + 45.79
R² = 0.9996
Series 4y = 58.517x + 52.006
R² = 0.9986-200
-150
-100
-50
0
50
100
-4.5 -4 -3.5 -3 -2.5 -2 -1.5 -1 -0.5 0 0.5
Ave
rage
Po
ten
tial
(m
V)
Log10[KCl]
OP-13 Device 1 All Series
Device 1 Series 1
Device 1 Series 2
Device 1 Series 3
Device 1 Series 4

54
Graph 4: OP-13 device 2
Graph 5: OP-13 device 3
Series 1y = 52.056x + 42.804
R² = 0.9998
Series 2y = 53.481x + 47.229
R² = 0.9994
Series 3y = 53.266x + 46.734
R² = 0.9993
Series 4y = 53.45x + 47.983
R² = 0.9995
-200
-150
-100
-50
0
50
100
-4.5 -4 -3.5 -3 -2.5 -2 -1.5 -1 -0.5 0 0.5
Ave
rage
Po
ten
tial
(m
V)
Log10[KCl]
OP-13 Device 2 All Series
Device 2 series 1
Device 2 series 2
Device 2 series 3
Device 2 series 4
Series 1y = 52.923x + 52.839
R² = 0.9999
Series 2y = 54.159x + 56.153
R² = 0.9996
Series 3y = 53.51x + 56.049
R² = 0.9994
Series 4y = 53.047x + 54.661
R² = 0.9995-200
-150
-100
-50
0
50
100
-4.5 -4 -3.5 -3 -2.5 -2 -1.5 -1 -0.5 0 0.5
Ave
rage
Po
ten
tial
(m
V)
Log10[KCl]
OP-13 Device 3 All Series
Device 3 series 1
Device 3 series 2
Device 3 series 3
Device 3 series 4
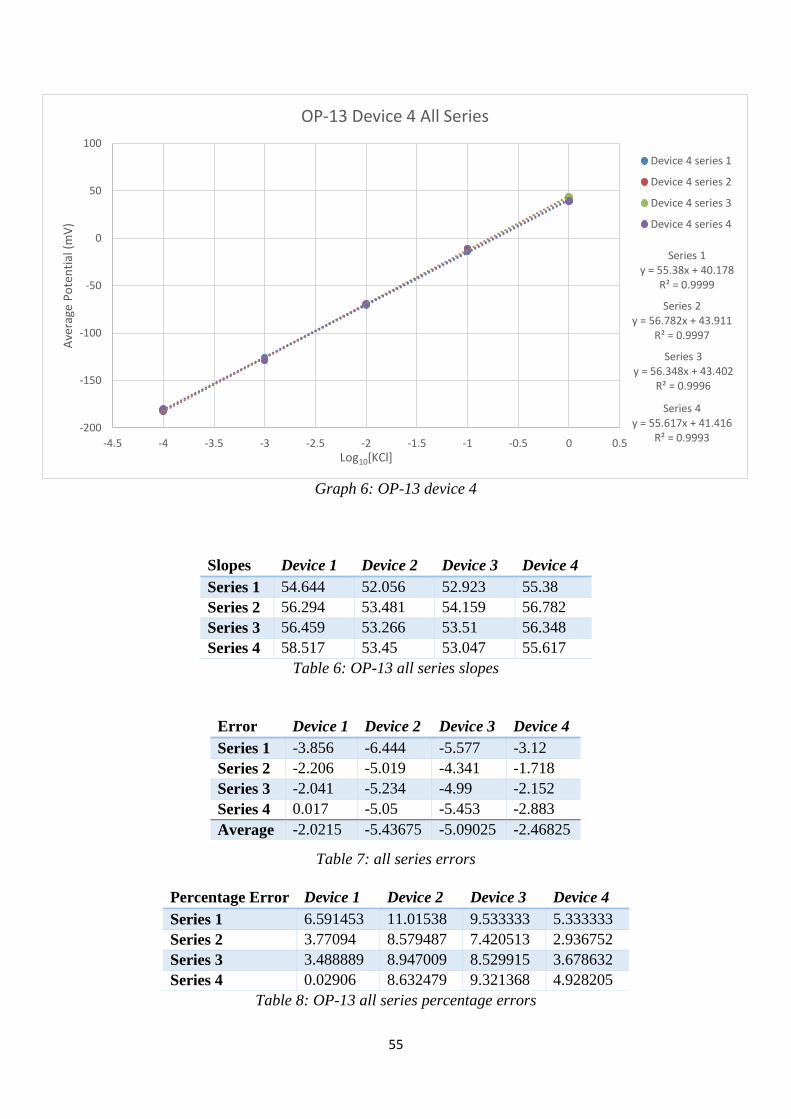
55
Graph 6: OP-13 device 4
Slopes Device 1 Device 2 Device 3 Device 4
Series 1 54.644 52.056 52.923 55.38
Series 2 56.294 53.481 54.159 56.782
Series 3 56.459 53.266 53.51 56.348
Series 4 58.517 53.45 53.047 55.617
Table 6: OP-13 all series slopes
Table 7: all series errors
Percentage Error Device 1 Device 2 Device 3 Device 4
Series 1 6.591453 11.01538 9.533333 5.333333
Series 2 3.77094 8.579487 7.420513 2.936752
Series 3 3.488889 8.947009 8.529915 3.678632
Series 4 0.02906 8.632479 9.321368 4.928205
Table 8: OP-13 all series percentage errors
Error Device 1 Device 2 Device 3 Device 4
Series 1 -3.856 -6.444 -5.577 -3.12
Series 2 -2.206 -5.019 -4.341 -1.718
Series 3 -2.041 -5.234 -4.99 -2.152
Series 4 0.017 -5.05 -5.453 -2.883
Average -2.0215 -5.43675 -5.09025 -2.46825
Series 1y = 55.38x + 40.178
R² = 0.9999
Series 2y = 56.782x + 43.911
R² = 0.9997
Series 3y = 56.348x + 43.402
R² = 0.9996
Series 4y = 55.617x + 41.416
R² = 0.9993-200
-150
-100
-50
0
50
100
-4.5 -4 -3.5 -3 -2.5 -2 -1.5 -1 -0.5 0 0.5
Ave
rage
Po
ten
tial
(m
V)
Log10[KCl]
OP-13 Device 4 All Series
Device 4 series 1
Device 4 series 2
Device 4 series 3
Device 4 series 4

56
Error Deviation Device 1 Device 2 Device 3 Device 4
Series 1 1.8345 4.4225 3.5555 1.0985
Series 2 0.1845 2.9975 2.3195 0.3035
Series 3 0.0195 3.2125 2.9685 0.1305
Series 4 2.0385 3.0285 3.4315 0.8615
Table 9: OP-13 all series error deviations
Percent Error Deviation Device 1 Device 2 Device 3 Device 4
Series 1 3.135897 7.559829 6.077778 1.877778
Series 2 0.315385 5.123932 3.964957 0.518803
Series 3 0.033333 5.491453 5.074359 0.223077
Series 4 3.484615 5.176923 5.865812 1.47265
Table 10: OP-13 all series percentage error deviations
The average results for 4 series yielded slope values of 56.587 mV/decade (Device 1), 53.012
mV/decade (Device 2), 53.331 mV/decade (Device 3) and 55.9 mV/decade (Device 4) (3.29%
RSD) and intercept values of 46.1 mV (Device1), 46.034 mV (Device 2), 54.689 mV (Device
3) and 41.83 mV (Device 4) (11.45% RSD). Each sensor that was tested was characterised and
calibrated to the same degree and standards.
From a practical and analytical perspective, these values are evidence of some limitations and
some of the most attractive features of potentiometry in real life scenarios. One of the features
of this technique is the Nernstian Response, the constant value of the sensitivity. For large scale
determinations outside the ideal conditions of the lab, a method that possess a known sensitivity
and is virtually independent of operational parameters can reduce the functional complexity
and minimize the uncertainty of results. However, considerations such as temperature and
pressure should be focused on in the future when developing for real life applications. A change
in temperature from lab a lab environment (298 K) to human body temperature (310 K) should
give a slope variation of about 4% according to the Nernst Equation.
One of the limitations of this current system is the variability in the intercept. A common
problem for wearable potentiometric devices is the need for constant and regular calibration.
Rius-Ruiz et al demonstrated that a one-point calibration procedure for a quick, decentralized
measurement of K+ ions in saliva was sufficient to provide reliable results. 38 Whether this
calibration can be performed at the final stages of manufacture and can be reliably used later
depends on the shelf life of the sensor.

57
4.2 Continuous measurement of the sensor
4.2.1 3.8 days
Graph 7: OP-24 continuous measurement over 4 days
Device 1 Device 2 Device 3
Formula of line y = 0.141x + 33.66 y = 0.133x + 34.16 y = 0.144x + 32.94
R2 value R² = 0.964 R² = 0.945 R² = 0.974
Rate of drift 0.141 mV/hour 0.133 mV/hour 0.144 mV/hour
Total drift 14.53 mV 13.7 mV 11.65 mV
Table 11: OP-24 all devices rate of drifts
A PVC-based sodium sensor with 3 channels (3 mm diameter) and 4 layers (3 µL each) was
tested on its lifetime by measuring the EMF upon changes of activity of the analyte ion by
submerging it in NaCl solution (0.01 M) for 4 days. Graph 7 shows the steady drift in voltage
over time. The cause of the noise that is observed at 75 hours remains unexplained but it is
likely due to movement of equipment and disturbing the sample solution. The sensitivity of the
sensor was evaluated before and after the 4-day continuous test, the results are displayed in
Graph 8 and Graph 9.

58
Before:
Graph 8: OP-24 before continuous measurement
After:
Graph 9: OP-24 after continuous measurement
-40
-20
0
20
40
60
80
100
120
140
160
-3.5 -3 -2.5 -2 -1.5 -1 -0.5 0 0.5
Ave
rage
Po
ten
tial
(m
V)
Log10[NaCl]
OP-24 Na+ sensor PVC/Cyclohexanone Calibration 1 - 4 x 3 μL Layers
Device 1
Device 2
Device 3
-20
0
20
40
60
80
100
120
140
160
-3.5 -3 -2.5 -2 -1.5 -1 -0.5 0 0.5
Ave
rage
Po
ten
tial
(m
V)
Log10[NaCl]
OP-24 Na+ sensor PVC/Cyclohexanone Calibration 2 - 4 x 3 μL Layers
Device 1
Device 2
Device 3

59
91.5 hours Sensitivity Before
(mV/decade[Na+])
Sensitivity After
(mV/decade[Na+])
Device 1 54.15 45.59
Device 2 52.26 47.81
Device 3 51.87 49.14
Table 12: OP-24 before and after continuous measurement slopes
The calibration graphs show that the sensitivity of the devices still remain within the range of
detection for sodium ions in human sweat (20-100 mmol/L). However, the value of the
sensitivity factors and the offset after the continuous measurement indicate that the devices are
not as accurate as they appear to be.
The values for the sensitivity of the devices before the continuous test are 54.15
mV/decade[Na+] (Device 1), 52.26 mV/decade[Na+] (Device 2) and 51.87 mV/decade[Na+]
(Device 3) (0.99% RSD) and after the continuous test are 45.59 mV/decade[Na+] (Device 1),
47.81 mV/decade[Na+] (Device 2) and 49.14 mV/decade[Na+] (Device 3) (1.46% RSD). The
relative standard deviation of the sensitivity values before and after are 4.28% (Device 1),
2.23% (Device 2) and 1.36% (Device 3).
The offset values for the devices before continuous testing are 142.27 (Device 1), 135.22
(Device 2) and 134.54 (Device 3) (3.49% RSD) and after continuous testing are 124.61 (Device
1), 131.98 (Device 2) and 135.28 (Device 3) (4.46% RSD). The relative standard deviation of
the offset values before and after continuous testing are 8.83% (Device 1), 1.62% (Device 2)
and 0.37% (Device 3).
From Table 15 it is seen that there is a small but definite decrease in sensitivity following the
continuous submersion of the sensor in the sample solution. The percentage decrease of
sensitivity for each device are 15.8% (Device 1), 8.5% (Device 2) and 5.3% (Device 3).
The average rate of drift for the sensor is 0.14 mV/hour. There are several causes to the
potential drift; the solvent from the sample solution evaporating and increasing the
concentration of the overall solution, liquid seeping into a small gap between the membrane
and the hydrogel and the plasticizer leaching out of the membrane. The first two causes can be
avoided by perfecting the preparation and testing methods, ensuring the membrane forms a

60
tight seal over the hydrogel during dropcasting and completely covering the sample solution
with aluminium foil during the continuous test to avoid evaporation of the volatile solvent. The
plasticizer is a component in PVC-based ISEs that has undergone much evaluation. 51
A challenge facing the application of PVC-based ISEs in real samples is the deterioration of
membrane performance over time. The primary reason for this deterioration is the leaching of
plasticizer components into the sample, which impact the lifetime of PVC materials.
The use of highly lipophilic plasticizers is a way to overcome these challenges. Incorporating
long alkyl chain in plasticizers increases their lipophilicity which has a direct impact on the
retention of the components of the membrane.
The sensor is still functional but the drift in data must be accounted for in order to achieve the
same level of accuracy as when it was first created. Continuous measurement is not an accurate
simulation of how the sensors will ultimately function but it provides valuable insight into the
stability of the sensor. The results cannot be interpreted as a direct comparison for the
functionality as a wearable device because conditions such as temperature, physical strain and
compatibility are all ideal in a lab setting. This set of data is relatively novel as there is little in
the literature that present experiments involving continuous measurements of an ion-selective
membrane based sensor. With this in mind, there is still much to be studied regarding this
particular method, a full description of potential future work will be discussed in Chapter 5.

61
4.2.2 11.8 days
Graph 10: OP-4 continuous measurement over 12 days
Table 13: OP-4 all devices rate of drifts
A PVC-based potassium sensor with 3 channels (3 mm diameter) and 4 layers (3 µL each) was
tested on its lifetime by measuring the EMF upon changes of activity of the analyte ion by
submerging it in KCl solution (0.01 M) for 12 days. Graph 10 shows the steady drift in voltage
over time. Note that devices 3 and 4 broke on day 8 and device 2 broke halfway through day
9. The manner in which these devices broke was by dislodgement of the ion-selective
membrane from the flexible sensor stick.
The sensor was calibrated before the continuous measurement but due to the membranes
breaking off the flexible substrate, it was deemed unnecessary to calibrate the sensor
afterwards. The sensitivity of the sensor stick was evaluated before the continuous
measurement and the results are shown in Graph 11.
Device 2 Device 3 Device 4
Formula of line y = 4.60x + 5.86 y = 4.62x + 1.31 y = 4.61x + 5.29
R2 value R² = 0.986 R² = 0.988 R² = 0.970
Rate of drift 4.60 mV/day 4.62 mV/day 4.61 mV/day
Total drift 47.90 mV 47.55 mV 46.65 mV

62
Graph 11: OP-4 calibration before continuous measurement
Calibration Before Slope
Device 2 55.78
Device 3 55.52
Device 4 55.81
Table 14: OP-4 calibration before continuous measurement
The average rate of drift for this sensor was 0.19 mV/hour. This value is comparably similar to
the average rate of drift for the continuous measurement over 3.8 days by 21.43% RSD. One
must take into account that this similarity is only valid for the first 8 days, as seen in Graph 10,
the potentials beyond that point are not applicable due to the sensor breaking.
Despite being formulated for the intent of measuring different ions, both membrane solutions
for OP-4 and OP-24 are the exact same. The use of a different ionophores may have affected
the overall rate of drift for either sensor as the values are significantly different by 21.43%
RSD. Valinomycin exhibits the ability to selectively bind to K+ ions over Na+ ions for
spontaneous transfer by use of a ring system. Sodium Ionophore IV uses the same mechanism
for Na+ only but it is unknown if it affects K+ in the same way as there is very little information
on 2,3:11,12-DIDECALINO-16-CROWN-5. It was observed that the limit of detection for
sodium ions was below 0.001 M NaCl, any concentration lower and the potential began to
plateau. The potassium membrane was able to detect K+ concentration below 0.001 M KCl
-150
-100
-50
0
50
100
150
-4.5 -4 -3.5 -3 -2.5 -2 -1.5 -1 -0.5 0 0.5
Ave
rage
Po
ten
tial
(m
V)
Log10[KCl]
OP-4: All Devices Calibration Before
Device 2
Device 3
Device 4
63
with no plateau. This difference in calibration range could be the reason why the potassium
sensor was seen to drift at a faster rate than the sodium sensor. The calibration graphs are
objectively different as the potassium sensor has 5 data points and the sodium sensor has only
4 due to the aforementioned plateau behaviour. Further study of the difference between the 2
ionophores is required to come to definitive conclusions.
4.3 Non-continuous measurement of the sensor
4.3.1 Sensitivity over 42 days
Graph 12: OP-3 non-continuous measurement slopes(sensitivities)
OP-3 Slopes Device 2 Device 3 Device 4
31-05-16 56.21 56.41 56.72
08-06-16 56.78 56.78 56.21
13-06-16 57.22 57.06 56.63
20-06-16 50.15 49.75 -
27-06-16 45.37 47.72 48.70
05-07-16 42.60 41.12 42.96
12-07-16 36.38 32.45 30.1
Table 15: OP-3 all devices slopes over 6 weeks
A PVC-based potassium sensor with 3 channels (3 mm diameter) and 4 layers (3 µL each) was
calibrated 7 times over 42 days. During the period in which the sensors were not in use, they
were stored in humid conditions to prevent the membrane from drying out completely. The
0
10
20
30
40
50
60
70
0 2 4 6 8 10 12 14 16 18 20 22 24 26 28 30 32 34 36 38 40 42 44
Sen
siti
vity
(m
V/d
ecad
e[K
+ ])
Number of Days
OP-3 K+ sensor (PVC/cyclohexanone) 4 layers (4 x 3μL) [3mm]
Device 2
Device 3
Device 4

64
calibration procedure was the same as described in section 4.1 and the standard sample
solutions were freshly prepared for each test. Graph 12 shows the average slopes of each test
per day, the sensitivity of each device is seen to decrease as time passes. On the 4th test, device
4 was unresponsive but it returned to normalcy on the next test.
The general decrease in sensitivity during storage could be due to the leaching of the plasticizer
out of the membrane despite the sensor not being continuously submerged in a sample solution.
It is possible that the humid and moist conditions in which the sensor is stored draws out the
plasticizer through its polar groups. This further justifies the use of highly lipophilic plasticizers
which will increase retention within the solution.
Another possible explanation for the decrease in sensitivity could be that the action of
measuring the sensor itself contributes to the degradation. It was observed on day 35 that the
metal contact that is connected to the voltmeter showed signs of wear. It is unlikely that this is
the core reason for the potential drift however as this type of physical damage will affect the
signal and noise of the calibration graph.
The sensitivities of each device on each day are shown in Graphs 13, 14 and 15. The graphs
show the large difference in each day and the change that occurs with each calibration. From
Graph 13, Graph 14 and Graph 15 a pattern is observed from the slope values and the offset
values. The slope values for each device generally remain the same for the 1st 3 tests and then
they start to decrease numerically and the trendlines gradually get flatter. The offset values are
seen to drastically increase on the 2nd and 3rd tests causing the position of the trendline to be
higher on the graph. After the 3rd test, the offset values decrease numerically and the positions
of the trendlines shift down the vertical axis.

65
4.3.2 Device 2 sensitivity
Graph 13: OP-3 device 2 all tests
Day Slope Offset
1 56.21 65.61
9 56.78 100.27
14 57.22 110.56
21 50.15 93.52
28 45.37 75.34
35 42.59 51.82
42 36.38 29.87
Table 16: OP-3 device 2 slopes and offsets
Slope RSD = 16.47%
Offset RSD = 37.99%
-200
-150
-100
-50
0
50
100
150
-4.5 -4 -3.5 -3 -2.5 -2 -1.5 -1 -0.5 0 0.5
Ave
rage
Po
ten
tial
(m
V)
Log10[KCl]
OP-3 K+ sensor (PVC/cyclohexanone) 4 layers (4 x 3μL) [3mm] Device 2 All Tests
Device 2 Test 1
Device 2 Test 2
Device 2 Test 3
Device 2 Test 4
Device 2 Test 5
Device 2 Test 6
Device 2 Test 7

66
4.3.3 Device 3 Sensitivity
Graph 14: OP-3 device 3 all tests
Day Slope Offset
1 56.41 66.59
9 56.78 102.13
14 57.06 109.19
21 49.75 87.12
28 47.72 64.95
35 41.12 33.99
42 32.45 29.54
Table 17: OP-3 device 3 slopes and offsets
Slope RSD = 19.06%
Offset RSD = 44.22%
-200
-150
-100
-50
0
50
100
150
-4.5 -4 -3.5 -3 -2.5 -2 -1.5 -1 -0.5 0 0.5
Ave
rage
Po
ten
tial
(m
V)
Log10[KCl]
OP-3 K+ sensor (PVC/cyclohexanone) 4 layers (4 x 3μL) [3mm] Device 3 All Tests
Device 3 Test 1
Device 3 Test 2
Device 3 Test 3
Device 3 Test 4
Device 3 Test 5
Device 3 Test 6
Device 3 Test 7
67
4.3.4 Device 4 Sensitivity
Graph 15: OP-3 device 4 all tests
Day Slope Offset
1 56.716 69.234
9 56.21 95.918
14 56.63 103.03
28 48.692 60.67
35 42.966 46.326
42 30.1 29.514
Table 18: OP-3 device 4 slopes and offsets
Slope RSD = 21.84%
Offset RSD = 41.99%
-200
-150
-100
-50
0
50
100
150
-4.5 -4 -3.5 -3 -2.5 -2 -1.5 -1 -0.5 0 0.5
Ave
rage
Po
ten
tial
(m
V)
Log10[KCl]
OP-3 K+ sensor (PVC/cyclohexanone) 4 layers (4 x 3μL) [3mm] Device 4 All Tests
Device 4 Test 1
Device 4 Test 2
Device 4 Test 3
Device 4 Test 5
Device 4 Test 6
Device 4 Test 7

68
4.3.5 All Test Comparison
The following graphs further show the difference between each device with each test over the
weeks. The changes in offsets and slopes indicate that each device is deteriorating in relatively
the same way and the same rate.
Graph 16: OP-3 test 1
Graph 17: OP-3 test 2
-200
-150
-100
-50
0
50
100
-4.5 -4 -3.5 -3 -2.5 -2 -1.5 -1 -0.5 0 0.5
Ave
rage
Po
ten
tial
(m
V)
Log10[KCl]
OP-3 Test 1
Test 1Device 2
Test 1Device 3
Test 1Device 4
-150
-100
-50
0
50
100
150
-4.5 -4 -3.5 -3 -2.5 -2 -1.5 -1 -0.5 0 0.5
Ave
rage
Po
ten
tial
(m
V)
Log10[KCl]
OP-3 Test 2
Test 2Device 2
Test 2Device 3
Test 2Device 4

69
Graph 18: OP-3 test 3
Graph 19: OP-3 test 4
-150
-100
-50
0
50
100
150
-4.5 -4 -3.5 -3 -2.5 -2 -1.5 -1 -0.5 0 0.5
Ave
rage
Po
ten
tial
(m
V)
Log10[KCl]
OP-3 Test 3
Test 3Device 2
Test 3Device 3
Test 3Device 4
-150
-100
-50
0
50
100
150
-4.5 -4 -3.5 -3 -2.5 -2 -1.5 -1 -0.5 0 0.5
Ave
rage
Po
ten
tial
(m
V)
Log10[KCl]
OP-3 Test 4
Test 4Device 2
Test 4Device 3
Test 4Device 4

70
Graph 20: OP-3 test 5
Graph 21: OP-3 test 6
-150
-100
-50
0
50
100
-4.5 -4 -3.5 -3 -2.5 -2 -1.5 -1 -0.5 0 0.5
Ave
rage
Po
ten
tial
(m
V)
Log10[KCl]
OP-3 Test 5
Test 5Device 2Test 5Device 3Test 5Device 4
-150
-100
-50
0
50
100
-4.5 -4 -3.5 -3 -2.5 -2 -1.5 -1 -0.5 0 0.5
Ave
rage
Po
ten
tial
(m
V)
Log10[KCl]
OP-3 Test 6
Test 6Device 2
Test 6Device 3
Test 6Device 4

71
Graph 22: OP-3 test 7
4.4 Siloprene-based ion-selective membrane
Figure 18 and Figure 19 show a sodium sensitive Siloprene-based sensor with the following
concentration ratios:
Table 19 and 20: Ratios for the siloprene-based sensors
As seen in the figures the signal is very noisy and after a day of storage the sensitivity is lost
significantly. The sensor was drop-cast and measured on the same day, a total of 3 hours was
given between the casting and testing. Device 3 was the only device to display somewhat
Nernstian behaviour on day 1. From this data one can conclude that the correct thickness of
layers is 7.5 µL + 7.5 µL for maximum sensitivity, but the noise remains to be the same
throughout all devices. The optimised membrane composition ratio of 0.63:100 stock solution
to siloprene was developed alongside the ideal number of layers on the sensor.
Stock 0.3
Siloprene K1000 47.6
K11 4.76
CH2Cl2 0.652
Na Ionophore 26.06
KTBC 12.5
CH2Cl2 1.5
-150
-100
-50
0
50
-4.5 -4 -3.5 -3 -2.5 -2 -1.5 -1 -0.5 0 0.5
Ave
rage
Po
ten
tial
(m
V)
Log10[KCl]
OP-3 Test 7
Test 7Device 2Test 7Device 3Test 7Device 4

72
4.4.1 Measurements within 1 day
Figure 18: OP-30 Na Sensor (siloprene/DCM) drop-cast and measured on the same day
Figure 19: OP-30 Na Sensor (siloprene/DCM) measured on the day after

73
The signal of the sensitivity graphs is significantly noisy due to the waiting time between drop-
cast. The time between casting was too long and therefore the membrane was not homogenous
and the conductivity was too high.
Clearly there needs to be further study in the use of siloprene-based membranes, there exists
many complications regarding the fabrication and formulation however. Both Siloprene K1000
and K11 crosslinking agent are volatile and evaporate at room temperature. This creates a
difficultly in accurately measuring out the correct ratios for the desired concentration. One must
work swiftly to accurately weigh a volatile liquid. Consequently, the solvent dichloromethane
is also very volatile. This allows for faster sensor fabrication as the solvent evaporates off the
stick almost instantly but it also creates a difficulty in accurately measuring the amount of
liquid used.
The advantage of using siloprene over PVC is that there is no need for a plasticizer as the regent
acts as one once combined with the crosslinking agent. However there still exists many
complications for the fabrication and much future work is needed to fairly accept or reject the
concept of a siloprene-based ion selective membrane.

74
Chapter 5: Conclusions and Future Work
5.1 Conclusion
The formulation of a PVC-based ion-selective membrane solution for its use on a flexible
substrate has been optimised and is successfully customisable for a specific ion of potassium
or sodium. Using this formula, a miniaturised electrode sensor stick was prepared and has been
shown to have reproducible and promising results with an ideal Nernstian response. This is a
step further to the implementation of ion-selective membranes on a flexible substrate for non-
invasive sweat analysis. The optimised formula will be functionalised onto a customisable
sensing platform such as a wearable skin patch, the mechanics of which will be discussed by
the gas and ion sensors group.
A single sensor device having PVC-based ion-selective electrodes for potassium and sodium
was able to give statistically accurate and reproducible data for the analysis of ion
concentrations within the time span of 1 hour. This time period is the ideal length for a single
athletic workout in which enough sweat can be produced from a human for analysis. This is a
Further step to the implementation of ion-selective membranes for non-invasive sweat analysis.
Upon establishing the method of development for the sensor device, further sensors were made
following the same procedure. The sensors are still unable to function correctly if they are
stored in dry conditions as the membrane dries out and sensitivity is lost.
The average lifetime of the sensor based off the continuous measurement tests was found to be
roughly 4 days. It was shown that the sensor was functioning at sub-Nernstian standards after
3.8 days of continuous measurement. After a period of 7 days the membrane layers began to
break and dislodge from the flexible substrate. The loss of sensitivity is unclear at the breaking
point but the whole sensor is rendered essentially non-functional. This result is in contrast to
that of the non-continuous measurement, which remained at sub-Nernstian levels in a span of
at least 5 weeks. The sensor was able to function correctly and accurately when tested once a
week for 5 weeks. For the commercial application of a wearable ion sensor, testing sweat ion
content once a week is an agreeable regime for health monitoring. This rate of usage is
particularly applicable to sports conscious individuals who attend training at least once a week.

75
5.2 Future Work
The continuous measurement tests were carried out with only one ion-selective membrane per
sensor stick. For the sensor to be ultimately incorporated onto a wearable sweat patch device,
it must be able to detect multiple ions at the same time. Therefore, for any future work it would
be advantageous to test the lifetime of multiple ion-selective membrane solutions at the same
time. The ideal number of layers and membrane composition has been established on their own,
so the next step will be to incorporate multiple sensing membranes onto one device. A further
pursuit would be to integrate a reference electrode as part of the overall sensor stick. This is
simply done by normally drop-casting the hydrogel in the electrode well but not covering it
with an ion-specific membrane solution. However, there will be some limitations to this
approach, particularly ensuring that the hydrogel does not dissolve when the stick is submerged
in a sample solution.
The fabrication of the sensors sticks in this project were done so by hand and precautions were
taken to make sure they were all made in the exact same way. However, the prospect of human
error is guaranteed. This can be avoided and regulated by using an automated machine system
for the drop-casting procedure. The automated system must be calibrated before each procedure
as the viscosity of the hydrogels and membrane solutions differ significantly. By using such a
system, one can track exactly how much solution is used in each of the 4 wells on a single stick.
Furthermore, it has the potential to produce sensor sticks on a greater scale which would allow
for more tests to be carried out.
The working lifetime and shelf life of the sensor are 2 of the most important factors of the
sensor. The next step in future studies would be to determine how to improve these factors.
This could be through changing the formulation of the ion-selective membrane, introducing an
external feature that prevents degradation or altering the overall size and construction of the
sensor stick. As outlined in Chapter 1, there has been many interesting developments in the
manufacture of a wearable device for ion analysis. 6 One feature of the “SWEATCH” device
that could be implemented in the future could be the use of capillary force as a method of
sample intake. It is a simple, yet effective method of collecting enough sample fluid for an
accurate and reproducible result and it would be interesting to see if it can be applied to the
imec sensor.
The siloprene-based sensors require more calibration tests and formulation changes in order to
create the optimal ratio for maximum sensitivity and signal strength. Only then can tests be

76
carried out to evaluate the lifetime and shelf life of the sensors created with these membrane
solutions. The main challenge lies with the reagents that are used to create the membrane
solution. The key chemicals are highly volatile and evaporate at room temperature. In order to
create a reproducible formula for the membrane solution, one must first develop a method that
ensures the reagents are handled in the correct manner. Perhaps an automated system similar
to that proposed for the drop-casting method. In any case, siloprene-based ion selective
membranes need to be studied in greater detail for future work.

77
References
1. Bailey, P. L., The Application of Ion-Selective Electrodes to Industrial Monitoring. In Meß-
und Automatisierungstechnik: Technologien, Verfahren, Ziele INTERKAMA-Kongreß 1980, Ernst, D.;
Thoma, M., Eds. Springer Berlin Heidelberg: Berlin, Heidelberg, 1980; pp 15-24.
2. Light, T. S., Industrial use and applications of ion selective electrodes. J. Chem. Educ. 1997,
74 (2), 171-177.
3. Sonner, Z.; Wilder, E.; Heikenfeld, J.; Kasting, G.; Beyette, F.; Swaile, D.; Sherman, F.; Joyce,
J.; Hagen, J.; Kelley-Loughnane, N.; Naik, R., The microfluidics of the eccrine sweat gland, including
biomarker partitioning, transport, and biosensing implications. Biomicrofluidics 2015, 9 (3), 031301.
4. Barr, S. I., Effects of Dehydration on Exercise Performance. Canadian Journal of Applied
Physiology 1999, 24 (2), 164.
5. Gao, W.; Emaminejad, S.; Nyein, H. Y.; Challa, S.; Chen, K.; Peck, A.; Fahad, H. M.; Ota, H.;
Shiraki, H.; Kiriya, D.; Lien, D. H.; Brooks, G. A.; Davis, R. W.; Javey, A., Fully integrated wearable
sensor arrays for multiplexed in situ perspiration analysis. Nature 2016, 529 (7587), 509-14.
6. Glennon, T.; O'Quigley, C.; McCaul, M.; Matzeu, G.; Beirne, S.; Wallace, G. G.; Stroiescu, F.;
O'Mahoney, N.; White, P.; Diamond, D., ‘SWEATCH’: A Wearable Platform for Harvesting and
Analysing Sweat Sodium Content. Electroanalysis 2016, 28 (6), 1283-1289.
7. G. Matzeu, L. F., D. Diamond, Sens. Actuators B, Sens. Actuators B Chem. 2015.
8. Harris, D. C., Quantitative Chemical Analysis. W. H. Freeman and Company 2010, 8th Edition.
9. Atkins, P. W., Physical Chemistry. New York: WH Freeman 1994, 5th Edition.
10. CRISON, pH redox and ISE electrodes. CRISON manufactures 2008.
11. Autolab, M., Ohmic Drop Part 1 – Basic Principles. Autolab Application Note EC03 1 July
2011, Metrohm Autolab B.V.
12. Philippe Buhlmann, L. D. C., Ion-Selective Electrodes With Ionophore-Doped Sensing
Membranes. Supramolecular Chemistry: From Molecules to Nanomaterials 2012, Supramolecular
devices.
13. Bühlmann, P.; Umezawa, Y.; Rondinini, S.; Vertova, A.; Pigliucci, A.; Bertesago, L., Lifetime
of Ion-Selective Electrodes Based on Charged Ionophores. Analytical Chemistry 2000, 72 (8), 1843-
1852.
14. Patel, N. G.; Meier, S.; Cammann, K.; Chemnitius, G. C., Screen-printed biosensors using
different alcohol oxidases. Sensors and Actuators B: Chemical 2001, 75 (1–2), 101-110.
15. Nie, Z.; Nijhuis, C. A.; Gong, J.; Chen, X.; Kumachev, A.; Martinez, A. W.; Narovlyansky,
M.; Whitesides, G. M., Electrochemical sensing in paper-based microfluidic devices. Lab on a Chip
2010, 10 (4), 477-483.
16. (a) Collier, W. A.; Lovejoy, P.; Hart, A. L., Estimation of soluble L-lactate in dairy products
using screen-printed sensors in a flow injection analyser. Biosensors and Bioelectronics 1998, 13 (2),
219-225; (b) Rippeth, J. J.; Gibson Td Fau - Hart, J. P.; Hart Jp Fau - Hartley, I. C.; Hartley Ic Fau -

78
Nelson, G.; Nelson, G., Flow-injection detector incorporating a screen-printed disposable amperometric
biosensor for monitoring organophosphate pesticides. (0003-2654 (Print)).
17. White, S. F.; Tothill, I. E.; Newman, J. D.; Turner, A. P. F., Development of a mass-producible
glucose biosensor and flow-injection analysis system suitable for on-line monitoring during
fermentations. Analytica Chimica Acta 1996, 321 (2–3), 165-172.
18. Lindner, E.; Gyurcsányi, R. E., Quality control criteria for solid-contact, solvent polymeric
membrane ion-selective electrodes. Journal of Solid State Electrochemistry 2009, 13 (1), 51-68.
19. Patents, G., https://www.google.com/patents/US4973394. 1990.
20. http://agscientific.com/blog/index.php/2012/06/28/9-things-you-dont-want-to-miss-on-
valinomycin/. accessed 2016.
21. (a) Ueyama, H.; Takagi, M.; Takenaka, S., A Novel Potassium Sensing in Aqueous Media with
a Synthetic Oligonucleotide Derivative. Fluorescence Resonance Energy Transfer Associated with
Guanine Quartet−Potassium Ion Complex Formation. Journal of the American Chemical Society 2002,
124 (48), 14286-14287; (b) He, F.; Tang, Y.; Wang, S.; Li, Y.; Zhu, D., Fluorescent Amplifying
Recognition for DNA G-Quadruplex Folding with a Cationic Conjugated Polymer: A Platform for
Homogeneous Potassium Detection. Journal of the American Chemical Society 2005, 127 (35), 12343-
12346.
22. http://www.chemicalbook.com/ProductChemicalPropertiesCB6113050_EN.htm Chemical
Book accessed 2016.
23. Schwartz, I. L.; Thaysen, J. H., EXCRETION OF SODIUM AND POTASSIUM IN HUMAN
SWEAT. Journal of Clinical Investigation 1956, 35 (1), 114-120.
24. Buffington, M. A.; Abreo, K., Hyponatremia: A Review. Journal of intensive care medicine
2016, 31 (4), 223-36.
25. American College of Sports, M.; Sawka, M. N.; Burke, L. M.; Eichner, E. R.; Maughan, R. J.;
Montain, S. J.; Stachenfeld, N. S., American College of Sports Medicine position stand. Exercise and
fluid replacement. Medicine and science in sports and exercise 2007, 39 (2), 377-90.
26. Rosenstein, B. J.; Cutting, G. R., The diagnosis of cystic fibrosis: A consensus statement. The
Journal of Pediatrics 1998, 132 (4), 589-595.
27. Thévenot, D. R.; Toth, K.; Durst, R. A.; Wilson, G. S., Electrochemical biosensors:
recommended definitions and classification1. Biosensors and Bioelectronics 2001, 16 (1–2), 121-131.
28. van de Velde, L.; d'Angremont, E.; Olthuis, W., Solid contact potassium selective electrodes
for biomedical applications – a review. Talanta 2016.
29. Gyurcsányi, R. E.; Rangisetty, N.; Clifton, S.; Pendley, B. D.; Lindner, E., Microfabricated
ISEs: critical comparison of inherently conducting polymer and hydrogel based inner contacts. Talanta
2004, 63 (1), 89-99.
30. Odijk, M.; van der Wouden, E. J.; Olthuis, W.; Ferrari, M. D.; Tolner, E. A.; van den
Maagdenberg, A. M. J. M.; van den Berg, A., Microfabricated solid-state ion-selective electrode probe
for measuring potassium in the living rodent brain: Compatibility with DC-EEG recordings to study
spreading depression. Sensors and Actuators B: Chemical 2015, 207, Part B, 945-953.

79
31. Paczosa-Bator, B., Ion-selective electrodes with superhydrophobic polymer/carbon
nanocomposites as solid contact. Carbon 2015, 95, 879-887.
32. Zine, N.; Bausells, J.; Vocanson, F.; Lamartine, R.; Asfari, Z.; Teixidor, F.; Crespo, E.; de
Oliveira, I. A. M.; Samitier, J.; Errachid, A., Potassium-ion selective solid contact microelectrode based
on a novel 1,3-(di-4-oxabutanol)-calix[4]arene-crown-5 neutral carrier. Electrochimica Acta 2006, 51
(24), 5075-5079.
33. Pandey, P. C.; Singh, G.; Srivastava, P. K., Electrochemical Synthesis of Tetraphenylborate
Doped Polypyrrole and Its Applications in Designing a Novel Zinc and Potassium Ion Sensor.
Electroanalysis 2002, 14 (6), 427-432.
34. Vázquez, M.; Bobacka, J.; Ivaska, A.; Lewenstam, A., Small-volume radial flow cell for all-
solid-state ion-selective electrodes. Talanta 2004, 62 (1), 57-63.
35. Chumbimuni-Torres, K. Y.; Rubinova, N.; Radu, A.; Kubota, L. T.; Bakker, E., Solid Contact
Potentiometric Sensors for Trace Level Measurements. Analytical Chemistry 2006, 78 (4), 1318-1322.
36. Michalska, A.; Maksymiuk, K., All-plastic, disposable, low detection limit ion-selective
electrodes. Analytica Chimica Acta 2004, 523 (1), 97-105.
37. Mousavi, Z.; Teter, A.; Lewenstam, A.; Maj-Zurawska, M.; Ivaska, A.; Bobacka, J.,
Comparison of Multi-walled Carbon Nanotubes and Poly(3-octylthiophene) as Ion-to-Electron
Transducers in All-Solid-State Potassium Ion-Selective Electrodes. Electroanalysis 2011, 23 (6), 1352-
1358.
38. Rius-Ruiz, F. X.; Crespo, G. A.; Bejarano-Nosas, D.; Blondeau, P.; Riu, J.; Rius, F. X.,
Potentiometric Strip Cell Based on Carbon Nanotubes as Transducer Layer: Toward Low-Cost
Decentralized Measurements. Analytical Chemistry 2011, 83 (22), 8810-8815.
39. Mattinen, U.; Rabiej, S.; Lewenstam, A.; Bobacka, J., Impedance study of the ion-to-electron
transduction process for carbon cloth as solid-contact material in potentiometric ion sensors.
Electrochimica Acta 2011, 56 (28), 10683-10687.
40. Jaworska, E.; Lewandowski, W.; Mieczkowski, J.; Maksymiuk, K.; Michalska, A., Critical
assessment of graphene as ion-to-electron transducer for all-solid-state potentiometric sensors. Talanta
2012, 97, 414-419.
41. Ivanova, N. M.; Podeshvo, I. V.; Goikhman, M. Y.; Yakimanskii, A. V.; Mikhelson, K. N.,
Potassium-selective solid contact electrodes with poly(amidoacid) Cu(I) complex, electron-ion
exchanging resin and different sorts of carbon black in the transducer layer. Sensors and Actuators B:
Chemical 2013, 186, 589-596.
42. Physiology, Essentials of Human Physiology.
http://humanphysiology.tuars.com/program/section6/6ch4/s6ch4_6.htm 2016.
43. Hu, J.; Stein, A.; Bühlmann, P., A Disposable Planar Paper-Based Potentiometric Ion-Sensing
Platform. Angewandte Chemie International Edition 2016, 55 (26), 7544-7547.
44. Parrilla, M.; Ferré, J.; Guinovart, T.; Andrade, F. J., Wearable Potentiometric Sensors Based
on Commercial Carbon Fibres for Monitoring Sodium in Sweat. Electroanalysis 2016, 28 (6), 1267-
1275.

80
45. Matzeu, G.; O'Quigley, C.; McNamara, E.; Zuliani, C.; Fay, C.; Glennon, T.; Diamond, D., An
integrated sensing and wireless communications platform for sensing sodium in sweat. Analytical
Methods 2016, 8 (1), 64-71.
46. Cisternas, R.; Kahlert, H.; Scholz, F.; Wulff, H., Direct contact tungsten bronze electrodes for
calibration-free potentiometric pH measurements. Electrochemistry Communications 2015, 60, 17-20.
47. Matzeu, G.; Zuliani, C.; Diamond, D., Solid-Contact Ion-Selective Electrodes (ISEs) based on
Ligand Functionalised Gold Nanoparticles. Electrochimica Acta 2015, 159, 158-165.
48. Paczosa-Bator, B.; Pięk, M.; Piech, R., Application of Nanostructured TCNQ to Potentiometric
Ion-Selective K+ and Na+ Electrodes. Analytical Chemistry 2015, 87 (3), 1718-1725.
49. Jasiński, A.; Urbanowicz, M.; Guziński, M.; Bocheńska, M., Potentiometric Solid-Contact
Multisensor System for Simultaneous Measurement of Several Ions. Electroanalysis 2015, 27 (3), 745-
751.
50. Guinovart, T.; Bandodkar, A. J.; Windmiller, J. R.; Andrade, F. J.; Wang, J., A potentiometric
tattoo sensor for monitoring ammonium in sweat. Analyst 2013, 138 (22), 7031-7038.
51. Carey, C., Plasticizer Effects in the PVC Membrane of the Dibasic Phosphate Selective
Electrode. Chemosensors 2015, 3 (4).


![找到【LAXIA3-V45】软件 find the [lexia-3 v45]software.](https://static.fdocuments.in/doc/165x107/6158cf44007ff071b13588e4/laxia3-v45.jpg)