Final Thesis - Catherine Mahony (11377841)
75
i An exploratory analysis of the financial performance and characteristics of the grocery retail industry in three major economies between the period 2011-2015. Submitted in partial fulfilment of the requirements of the Masters in International Management, School of Business, Trinity College Dublin. Prepared By: Catherine Mahony (Bachelor of Business Studies) Supervisor: Mr. Gerard McHugh July 2016
-
Upload
katie-mahony -
Category
Documents
-
view
1.170 -
download
3
Transcript of Final Thesis - Catherine Mahony (11377841)

i
An exploratory analysis of the financial performance and
characteristics of the grocery retail industry in three major
economies between the period 2011-2015.
Submitted in partial fulfilment of the requirements of the Masters in International Management,
School of Business, Trinity College Dublin.
Prepared By: Catherine Mahony (Bachelor of Business Studies)
Supervisor: Mr. Gerard McHugh
July 2016

i
I have read the University’s code of practice on plagiarism. I hereby certify this material, which I
now submit for assessment on the programme of study leading to the award of MSc.
(International Management) is entirely my own work and has not been taken from the work of
others, save and to the extent that such work has been cited within the text of my work.
Student ID Number: 11377841
Name of Candidate: Catherine Mahony
Signature of Candidate: Catherine Mahony
Date: 24th July 2016

ii
Abstract
This paper acts as an exploratory analysis in order to gain greater understanding of the financial
performance and characteristics of the grocery retail industry in three major economies for the
period 2011 to 2015. Starting in September, I will begin my career within this industry, to be
specific, in Lidl’s finance and accounting department. Therefore, this dissertation serves the
purpose of a developmental project as well as an interesting investigation. To attain an overview
of the industry, it was important to consider the historical development of the industry from the
year 1912 to the present. The changes in trends, format and structure has led us to the fast-paced,
constantly changing, highly competitive and concentrated grocery retail industry that we know
today. Incumbents in the industry fight hard to maintain market share and increasingly tight
margins, and as such, incumbents are interested in the next wave of development to stay ahead. A
present day competitive analysis of the industry was conducted using Porter’s five forces
framework. This further enhances understanding of the industry, its profitability and where it is
likely to go in the future. High buyer/retailer power is a key characteristic of the industry, as is
high competitive rivalry and a lack of substitutes. Signs indicate that the battle will only intensify
in the future. This was beneficial as it provides a theoretical proxy for what we might expect to
see from the quantitative financial analysis such as tight margins indicative of the industry and the
competitive atmosphere. To add depth to the literature and further enhance understanding of the
industry, a high-level quantitative exploration of the financial performance of three grocery retail
companies in the US, EU and the UK over a five year period using certain financial metrics was
carried out. Using the DuPont analysis as a guide, it was possible to assess the declining returns of
both assets and equity for the industry as a whole which was unsurprisingly due to declining
margins and increased leverage. We can see that margins are small at 2% on average and asset
turnover is high for this industry, these financial observations reiterate the literature based on this
industry’s characteristics. What was surprising was that the large decline in the 2015 figures was
largely impacted by the UK numbers and therefore, a cross-jurisdictional analysis provided
greater depth. Explanations are put forward but are not exhaustive. The aim of the research is to
provide an overview of the industry and its financial performance, and present observations for
the sample data, however, further research is invited that would build on the findings through an
in-depth financial analysis.
iii
Acknowledgements
I would firstly like to thank my supervisor Mr. Gerard McHugh for providing excellent guidance
in terms of the research topic chosen, his constant feedback during regular meetings, and for
providing his much-appreciated expertise in this area of research. I would like to thank my family,
friends and classmates for supporting me throughout the MSc and dissertation preparation.
Finally, the input of various lectures in a myriad of disciplines throughout the year helped shape
this thesis.
iv
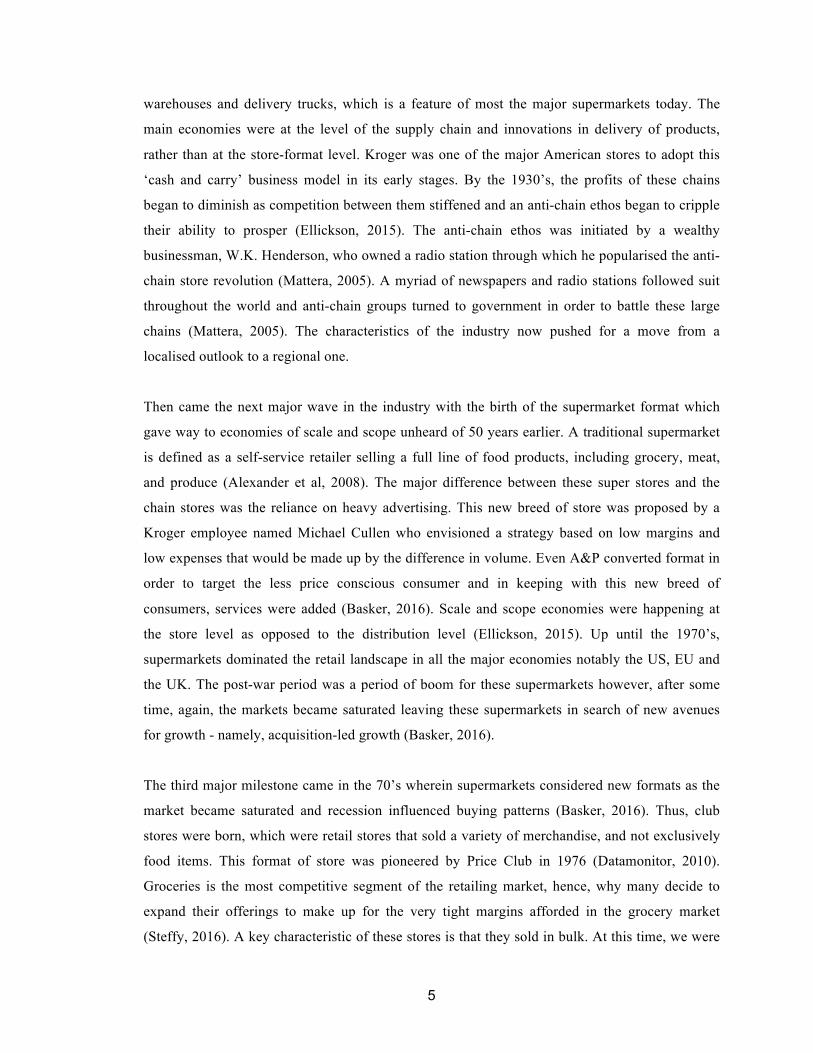
TABLE OF CONTENTS
Declaration ………………………………………………………………………………….……..i
Abstract ……………………………………………………………………………………….…..ii
Acknowledgements ………………………………………………………………………..…...…iii
Tables of Contents ….……………….………...……………………………………………..……iv
List of Tables and Figures………………………………………………………………………....vi
1.0 INTRODUCTION…………………………………………………….……………..……..…1
1.1 Rationale for Research…………………………………………………….....………..1
1.2 Literature Focus………………………....……...……………………………..…….…1
1.3 Method, measures and analysis……………………….………………………..……...2
2.0 LITERATURE FOCUS …………………………………………………….………..……....4
2.1 The historical development of the multinational grocery and general
merchandise retailers 1912-2016. ………….…………………………………………....4
2.1.1 The four major eras in grocery retail format………………….…..……......5
2.1.2 The consolidation wave…………....………........…………………….…….7
2.1.3 A fifth era? - The destructive entry of the German discounters………….…7
2.1.4 On the cusp of a new development - A move towards an online-only grocery
market………....……………………....………...……….…………….……..…...8
2.2 A competitive analysis of the grocery retail industry…………………………….10
2.2.1 Threat of new entrants…………...………...……….………….……..……10
2.2.2 Power of suppliers/retailers as buyers..……….………………..…………12
2.2.3 Power of buyers: end-consumers….………………………………….…...14
2.2.4 Power of substitutes.…………………....………………………..………..15
2.2.5 Competitive rivalry……………………....……………………...…………16
3.0 METHODOLOGY…………………………………………………………………………. 20
3.1 Method, measures and rationale………………………………………...…………20
3.2 An introduction to the sample companies chosen for analysis……...........………21
3.2.1 UK-domiciled companies……...…………………...……………...………21

v
3.2.2 US-domiciled companies……………………………………….……….…24
3.2.3 EU-domiciled companies……………………………….…………………27
4.0 FINDINGS AND ANALYSIS……………………………………………………………….31
4.1 Return on Equity (ROE) ………………………...…………………………………31
4.2 Return on assets (ROA) ……………………………………………………………34
4.3 DuPont Analysis……………………………………….……………………………36
4.3.1 Gross Profit Percentage………………………………….……………..…36
4.3.2 Net profit margin…………………………………………………….…….40
4.3.3 Asset Turnover………………………………………………….…….……43
4.3.4 Leverage………...………………………………………...…………….…44
5.0 CONCLUSION………………………………………………………………………………48
REFERENCES ………………………………………………………………………….………51
APPENDICES……………………………………………………………………………………64
Appendix 1: Abbreviations…………………………………………...………………………………........64 Appendix 2: Graphical representation of industry averages across all thirteen financial metrics chosen as part of the sample and by jurisdiction averages…………….………………………….…65

vi
List of Tables
Table 1: 3.1: Market capitalisation (2016 approx.), profitability (2015) and turnover (2015) for
each company chosen for sample
Table 2: 4.1: A summary of the findings from the DuPont analysis
List of Figures
Figure 1: 2.1: The evolution of the grocery retail industry
Figure 2: 2.2: The Largest Contributors to Grocery Sales Growth 2015-2020
Figure 3: 2.3: A five forces analysis of the grocery retail industry
Figure 4: 3.1: Great Britain Grocery Market Share 2016. Kantarworldpanel.com, 2016)
Figure 5: 4.1: Return on equity for industry sample
Figure 6: 4.2: Return on Equity by jurisdiction
Figure 7: 4.3: Average ROE by company
Figure 8: 4.4: Return on assets for industry sample
Figure 9: 4.5: Return on assets by jurisdiction
Figure 10: 4.6: Gross Profit Percentage for industry sample
Figure 11: 4.7: Revenue growth for industry sample
Figure 12: 4.8: Gross Profit percentage by jurisdiction
Figure 13: 4.9: Net Profit Margin for industry sample
Figure 14: 4.10: Net profit margin by jurisdiction
Figure 15: 4.11: Represents an increase in Tesco’s cost of sales and finance costs, and a reduction
in revenue. Thus, affecting profit margins
Figure 16: 4.12. Asset Turnover for industry sample
Figure 17: 4.13: Leverage for the industry sample has increased
Figure 18: 4.14: Leverage by jurisdiction
Figure 19: 4.15: UK leverage including all companies over a five year period. In 2015, all UK-
domiciled companies increased leverage, especially Tesco

1
INTRODUCTION
1.1 Rationale for research
The aim of this paper is to gain greater understanding of the financial performance and
characteristics of the grocery retail industry in three major economies for the period between 2011
and 2015. There are three main motivations behind choosing the outlined topic. Perhaps the most
pertinent and arguably, the most important reason is my general and professional interest in the
areas of finance and accounting. I am interested in this particular industry as I will begin my
career with Lidl in September. Conducting research on the retail grocery industry in three of the
main economies will give me a greater understanding of the competitive landscape of the industry
as a whole before entering it. Having a base knowledge of the industry will hopefully allow me to
further my career with the company. Therefore, this dissertation not only acts as an interesting
investigation, but also as a developmental project. As a result, I chose to conduct an exploratory
analysis in order to understand the industry, its characteristics and its financial performance.
Through the literature we know that the industry is fast-paced, constantly changing, highly
competitive and concentrated. A brief overview of a range of financial metrics for the industry
sample gives greater insight into financial performance and a cross-jurisdictional analysis allows
us to spot any interesting similarities and/or differences between different economies.
1.2 Literature focus
To ensure a full understanding of the grocery retail industry, I will present a brief history of the
industry from the year 1912 to the present day. We have seen a massive increase in scale and
scope due to the ‘consolidation wave’, increased internationalisation, lower prices with the
emergence of discounters, decreased supplier power and constantly changing consumer shopping
preferences. For the purpose of later analysis, the focus is on three of the major economies, the
United States (US), the European Union (EU) and the United Kingdom (UK) and as a sample are
considered to be indicative of the wider industry as a whole. In an industry characterised by low
growth, tight margins and fierce competition, the incumbents are constantly searching for new
ways of selling things and new models of efficiency. Hence why we have seen changes in store
formats and the expansions of many major players overseas in search of greater growth
opportunities as mature markets fail to supply sufficient returns. I would argue that we are at the

2
cusp of a new change within the industry and in light of this, it is important to gain a greater
understanding of where the industry has come from to get to where it is today.
A present competitive analysis of the grocery retail industry further enhances understanding of the
industry. To do this I will use Porter’s five forces framework as my tool of analysis. Porter (2008)
set out to explain two things with this framework. Firstly, why profitability in one industry
differed to that of another. We know this to be the result of the ‘risk and return’ phenomenon.
Whereby, margins in the oil extraction industry are much greater than that in the grocery industry
due to the challenges and risks involved. Ultimately, grocery retailers take on very little risk when
disseminating commodities around the world, therefore, the margins for the incumbents come out
to about 2%. Secondly, Porter (2008) tries to explain using his framework, where the industry is
likely to go in the future. Competitive rivalry within the grocery retail industry is high and there is
nothing on the horizon to say that the industry is going to become any less competitive in the
future. In fact, it could get worse as those few companies that dominate in each economy become
even more entrenched in battle. The purpose of these two chapters is to gain greater understanding
of the grocery retail industry, how it has evolved and its competitive nature. The literature also
indicates what we might expect from an analysis of the industry’s financial performance such as
tight margins, high asset turnover etc.
1.3 Methodology, measures and analysis
Within the methodology section, I will present a brief introduction to each of the nine companies
chosen for my research as well as a brief outline of the steps taken during the quantitative
exploration of the grocery retail industry’s financial performance. I have limited the sample to
three companies from each of the three main economies, the EU, US, UK. The top three chosen
are representative of between 45%-55% of the total grocery market and in the top four in terms of
sales in their respective jurisdictions and therefore, are considered to be representative of the
industry as a whole. My method of investigation used for this dissertation is primary research.
Data gathered from the annual reports of the sample group from the period between 2011 and
2015 were presented in excel under the three main financial statements. From this it was possible
to put together a range of financial metrics and industry averages. Gathering the information first
hand constituted as a proactive approach that allowed for greater analysis, understanding and
personal development. Initially, a total of eleven financial metrics were chosen for analysis which
included:

3
I. Revenue growth
II. Return on assets
III. Return on equity
IV. Net profit margin
V. Gross profit Percentage
VI. Leverage
VII. Asset turnover
VIII. Borrowing/ Borrowings + Equity
IX. Liabilities/ Liabilities +Equity
X. Cash flow/ Net income
XI. Receivable collection period
From this list, the most meaningful measures were chosen and presented as part of the findings
and analysis section. The high level financial analysis conducted adds depth to the literature, not
only exemplifying an extremely competitive industry, but also how different jurisdictions operate
similarly or differently. The decreasing trends in the industry proved to be an interesting topic to
explore further and thus, a DuPont analysis was chosen to do so. This section offers broad
industry trends that supports the literature, as well as economy-specific findings, and in some
cases, company-specific effects on the overall results. The aim of this paper is to provide an
overview of the grocery retail industry, its performance and and its characteristics that provides
understanding as someone entering the industry and opens up a pathway for further investigation
and analysis.

4
2.0 LITERATURE FOCUS
2.1 The historical development of the multinational grocery and general merchandise
retailers 1912-2016.
Many of the major players in the grocery retail industry today thread the line between department
store and grocery store due to their size and range of goods and services offered wherein, food is
only one segment of their operations. For the purpose of this paper, the focus will be on large
grocery retailers that sell food and other unrelated goods, often referred to as one-stop-shops. This
definition yields a market we refer to as “big-box” grocery retailers consisting of various different
retail formats from traditional supermarkets to supercenters, and the recent introduction of the
German discounters.
The aim of this chapter is to highlight important historical trends that occurred within this
industry and were pivotal in its evolution to the competitive battlefield that it is today. Explosive
growth has been a result of the introduction of different formats and grocery retail concepts which
have altered the basis of competition over the years.
2.1.1 The four major eras in grocery retail format
According to Ellickson (2015), there have been four major eras in the evolution of the grocery
retail industry with the first being the localised chain store revolution led by the Great Atlantic
and Pacific Tea Company (A&P) which introduced the idea of the ‘economy’ grocery store back
in 1912. Prior to major grocery stores, meat was bought from the butchers and bread was bought
from the baker. Time conscious consumers longed for an efficient system that hailed a ‘one-stop-
shop’. When A&P set up the first economy store format, the features of standardisation and scale
came into play in the industry. A more straight forward logistics and supply chain system meant
cost savings from the company which was then passed on to the consumers. Furthermore, they
pioneered the idea of backward integration in the industry by owning their own network of
5
warehouses and delivery trucks, which is a feature of most the major supermarkets today. The
main economies were at the level of the supply chain and innovations in delivery of products,
rather than at the store-format level. Kroger was one of the major American stores to adopt this
‘cash and carry’ business model in its early stages. By the 1930’s, the profits of these chains
began to diminish as competition between them stiffened and an anti-chain ethos began to cripple
their ability to prosper (Ellickson, 2015). The anti-chain ethos was initiated by a wealthy
businessman, W.K. Henderson, who owned a radio station through which he popularised the anti-
chain store revolution (Mattera, 2005). A myriad of newspapers and radio stations followed suit
throughout the world and anti-chain groups turned to government in order to battle these large
chains (Mattera, 2005). The characteristics of the industry now pushed for a move from a
localised outlook to a regional one.
Then came the next major wave in the industry with the birth of the supermarket format which
gave way to economies of scale and scope unheard of 50 years earlier. A traditional supermarket
is defined as a self-service retailer selling a full line of food products, including grocery, meat,
and produce (Alexander et al, 2008). The major difference between these super stores and the
chain stores was the reliance on heavy advertising. This new breed of store was proposed by a
Kroger employee named Michael Cullen who envisioned a strategy based on low margins and
low expenses that would be made up by the difference in volume. Even A&P converted format in
order to target the less price conscious consumer and in keeping with this new breed of
consumers, services were added (Basker, 2016). Scale and scope economies were happening at
the store level as opposed to the distribution level (Ellickson, 2015). Up until the 1970’s,
supermarkets dominated the retail landscape in all the major economies notably the US, EU and
the UK. The post-war period was a period of boom for these supermarkets however, after some
time, again, the markets became saturated leaving these supermarkets in search of new avenues
for growth - namely, acquisition-led growth (Basker, 2016).
The third major milestone came in the 70’s wherein supermarkets considered new formats as the
market became saturated and recession influenced buying patterns (Basker, 2016). Thus, club
stores were born, which were retail stores that sold a variety of merchandise, and not exclusively
food items. This format of store was pioneered by Price Club in 1976 (Datamonitor, 2010).
Groceries is the most competitive segment of the retailing market, hence, why many decide to
expand their offerings to make up for the very tight margins afforded in the grocery market
(Steffy, 2016). A key characteristic of these stores is that they sold in bulk. At this time, we were

6
witnessing computerisation, otherwise known as the ‘information age’ and scanning registers
were introduced in stores (Ellickson, 2015). Stores became larger as it became possible to hold
more products and therefore, inventory management systems and logistics gained greater traction
and became a point of differentiation for many (Basker, 2016).
From 1988 onwards, we saw the introduction of the supercenters which were an important and
rapidly growing big-box grocery retail format. Supercenters are typically larger than 180,000
square feet, combining both a large supermarket and a large mass-merchandiser within the same
store (Hanner et al, 2015). There was a supercentre boom between 2000 and 2014. In the US
alone, between 1992 and 2013, supercenters saw a 10.5-fold increase in sales, while traditional
department stores revenues fell by roughly 20% (Hortacsu & Syverson, 2015).. Therefore, the
industry has seen a major shift in the way that stores selling multiple varieties of merchandise
operate, with a shift from the traditional service-oriented department store toward a lower-cost
model that in some ways borrows the logistics techniques of the wholesale sector (Hortacsu &
Syverson, 2015). According to Hanner et al’s (2015) research, during the period between 2004
and 2009, the number of supercenters increased by 53%, while during that same period, the
revenue of supermarkets declined by almost 10%. This is exemplary of the change in composition
of grocery retail outlets.
The fourth and final stage according to Ellickson (2015) came when firms like Walmart formed
the first truly multinational chain stores, in light of the globalisation era. The common thread
throughout the industry’s evolution is the push for greater variety at the lowest possible prices.
Expansion, expansion, expansion. The expansion of variety and store size was the trend for many
years, however, we began to see geographic expansion at an unprecedented rate in the 1990’s
which has continued today to form grocery retailers that operate globally (Dries et al, 2004). We
now see a highly competitive, concentrated and dynamic industry characterised by scale and
constant price reductions (Smith, 2006). Important to note here is that the sequence of
development is the same in Europe and the UK however, they happened slightly later. Another
important point to make is that these stages are characterised by a dominant model but does not
mean that previous models become extinct.

7
2.1.2 The consolidation wave
Competition in the food retail market is intense and due to the evolution of different store formats,
traditional grocery retailers are feeling the pressure. Due to this competition and changing
consumer preferences, many firms in the industry are considering their strategic moves with
M&A being a popular strategy adopted for a myriad of purposes including entry into new
markets, leveraging sourcing capabilities and in order to manufacture greater earnings growth.
Thus, there has been a wave of consolidation in the industry over the past 10+ years that has
changed the industry forever (Duff & Phelps, 2016). As the industry faced a more value-
conscious consumer post-recession, cost reduction was on the fore-front of all the leading grocers’
mindset and subsequently led to increased consolidation. According to Aufreiter et al (1999)
much of the consolidation was infact driven by a need to ‘nourish the corporate ego’ and
following the mantra of ‘bigger means better’. The leading players in the industry had an appetite
for scale, and M&A was the avenue through which to achieve economies of scale for these cost-
focused firms in a hugely competitive industry (Blackbook, 2009). Although M&A activity may
seem attractive to many firms, this activity leaves the industry exposed to antitrust enforcement as
the Federal Trade commision and the European Commision address any anti-competitive
behaviour. The industry has become increasingly concentrated over the years and various
enforcement agencies must monitor collusion and the formation of superpowers that will put
smaller retailers and consumers at a disadvantage (Corstjens & Vanderheyden, 2010). In mature
markets such as the US, Europe and the UK, where the grocery retail market is highly centralised,
M&A transactions are likely to face limitations and restrictions (Blackbook, 2009). We are now
experiencing a complete turnaround whereby firms are scaling back from the trend of the mega
mergers that existed from the late 1990’s onwards largely due to more stringent authority
oversight as well as the emergence of a new store format (McTaggart, 2012).
2.1.3 A fifth era? - The destructive entry of the German discounters
It is no surprise that the global economic crisis that occurred in the late 2000’s impacted retail
commerce, and grocery retail was no exception. Buying behaviour changed as consumers sought
good quality, ethical business practises, simplicity and fair prices (Stefanska & Bilinska-
Reformat, 2015). The aggressive discount grocery store concept or format was formed in the 60’s
in Germany but flourished in Europe at a time when disposable income eroded considerably
(Wortmann, 2004). The discount, no frills approach adopted by German retailers was popularised

8
by firms such as Aldi and Lidl who became vastly popular in Western countries as they ramped
up store openings and saw double digit sales growth at the time of the recession (Shah, 2014). The
destructive arrival of these hard-discounters altered the dynamics of the industry significantly.
The success of this new format has become a major source of concern for traditional supermarkets
and supercentres, leading to reduced sales increases and in some cases, the demise of the entire
business. The German discounters offer a simple store format, with minimum product variations
and average quality products at rock-bottom prices which suited the position of their target
consumers who are now rejecting the ‘big weekly shop’ model that was popular for many years
(Wortmann, 2004). In Ireland, German retailers are increasing their market share faster than any
of the other major competitors. According to figures released by retail analysts, Kantar
WorldPanel, the German retailers have a combined market share in Ireland of 22%, in touching
distance of the market leader Supervalu which has a market share of 23% (Pope, 2016). Lidl and
Aldi are a ‘market share-grabbing nightmare’ for grocery retailers in Europe as a whole. In 2014,
the two combined managed to command 10% of the very competitive grocery market in the UK
(Souza, 2016), while in the same period, the UK’s biggest supermarket, Tesco, saw its market
share fall to a 10-year low (Salmon, 2015). The US market are also under threat with Aldi already
breaking into the market and a well-publicised large scale expansion happening for Lidl in the
next few years (Souza, 2016). For many years we saw the rise of supercenters and greater product
variety, now we are seeing a drawback from that. The on-going internationalisation plans set out
by these firms indicates that they remain confident that this new format will play a major role in
the industry for the foreseeable future (mass grocery retail, 2009). What is interesting to note is
that speculators find that these German discounters are likely to absorb the rise in food prices and
inflation post-brexit decision because they have the leanest supply chain in retail and sufficient
economies of scale (Williem de Jongste, 2016).
2.1.4 On the cusp of a new development - A move towards an online-only grocery market
While different store formats and the internationalisation of grocery retailers have impacted the
industry, so too have major trends such as access to technology. Technology has always, and will
always continue to be a force shaping the structure of the grocery retail industry from the
beginning of the barcode, to self-service checkouts and now the emergence of online shopping.
With many of the former giants and winners in the industry struggling to continue business and
some experiencing fatal blows, some commentators argue that the decline of these former giants
is due to the prediction that sales will move fully online and physical stores will become

9
completely outdated. E-commerce has been given considerable attention since the boom and
subsequent bust of the ‘dotcom bubble’ (Hortacsu & Syverson, 2015) and the idea of online-only
shopping has created a buzz within the industry (Duff & Phelps, 2016). Digital is considered the
best way to communicate effectively with consumers. The ‘death of retail’ has yet to be fully
realised in the grocery retail industry but is a constant point of conversation and worry for the
stores themselves as they try to expand and create an effective online platform. E-commerce will
continue to be a force shaping the industry well into the future as consumer demand for online
grocery sales has increased drastically over the last number of years. A handful of firms have
entered the online-only grocery business including Groceryworks.com and Instacart (Duff &
Phelps, 2016). According to Hortacsu & Syverson (2015), grocery retailers are unlikely to meet
their demise any time soon but will rather evolve into a hybrid organisation that combines
physical stores with an online platform. All of the major grocery retailers in the sample chosen for
this dissertation have made considerable investments in developing their online presence and
continue to do so as they see its future in the industry to be of paramount importance. To this date,
the changes in format over the years has had a bigger impact on the makeup of the industry than
e-commerce has. Shopping tends to be a social process and therefore, the demise of physical
formats is uncertain (Hortacsu & Syverson, 2015).
A summary of the grocery retail industry’s evolution is presented in figure 1 below.
10
(Figure 2.1 The evolution of the grocery retail industry)
Through an understanding of the evolution and expansion of the industry over the past 100 years,
it is possible to see how the industry has grown to what it is today which is an intensely
competitive sector. A review of the industry shows how fast paced the industry is and unforgiving
to those unwilling to change with shopper preferences. Incumbents in the industry try to anticipate
the next step and change in the structure of the industry in order to stay one step ahead of
competitors, hence why data analytics and reward schemes have been beneficial to these retailers.
As such, it is important to present a competitive analysis of the industry.
2.2 A competitive analysis of the grocery retail industry
To conduct a competitive analysis of the grocery retail industry, I have chosen to use Porter's five
forces framework. This industry analysis model allows us to analyse the profitability of the
industry and where it is likely to go in the future (Porter, 2008).
2.2.1 Threat of new entrants
The threat of new entrants into the grocery retail industry is low due to the fact that the industry
has transformed over the years into a concentrated, supercentre-dominated business. One trend
that has become abundantly clear through the decades of evolution in the industry is the
decreasing number of independent retailers. The large incumbents have established an intricate
supply chain system, they have invested heavily in marketing and have large scale operations in
place that are not easily replicated by new, much smaller entrants. It is clear that the entry and exit
of firms into a specific industry plays an important role in stimulating economic growth, as well
as influencing the competitive process of that industry in the long run (Hanner et al, 2015).
Hanner et al (2015) found that new firm entrants into the industry are unlikely to gain substantial
market share despite the fact that it is relatively easy to enter this market. The fierce competition
and dominance of the major players make it extremely difficult for these firms to do well.
Between their sample period, 2004-2009, they found that new entrants capture less that 5% of the
US market's revenue share (Hanner et al, 2015). What is more, due to the fierce competition and
the never ending price cutting, margins in this industry are low and unattractive for new entrants.

11
Market growth is put down to market expansion by incumbent brands rather than the entry of new
ones (Igami, 2011). Due to stiff competition, incumbents are increasingly looking to further
geographic markets in search of growth. According to IGD’s 2016 forecasts the value of the
global grocery market is likely to see an increase of about a third over the next five years. This is
in large part due to the increasing prosperity of lower-middle income markets. Since 2010,
grocery sales in low income economies have grown by 70%, and are expected to double by 2020
(IGD.com, 2016). The expected growth in these markets is why threat of entry from these mature
market giants into emerging and low income economies is likely to be high. According to the
world bank, countries such as India, China and the US, are likely to contribute considerably to
grocery sales over the next few years (Figure 2). Tesco and Wal mart have both failed to
successfully launch their stores in China, a market that clearly represents huge potential, and
companies domiciled in the EU and UK have found it difficult to penetrate the US market due to
intense competition from incumbent players. Therefore, although entry is desired due to the size
and future potential of the market, it is not without difficulty and entry modes will need to be
reconsidered.
From the point of view of the handful of large retailers that dominate certain mature markets, as
they enter into untapped territory, evidence shows that they impact significantly on the survival of
these smaller retailers, forcing price reductions and improved efficiency. Anti-competition
regulators are under pressure to protect these smaller firms as many criticise that the big stores are
driving out the smaller ones (Igami, 2011). Borraz et al (2014) had similar findings through the
various empirical studies that they conducted, stating that the introduction of supercenters in a
particular area drastically increases the likelihood of the smaller retailers going out of business in
that area. If independent retailers manage to spot a niche in the market, it is likely that they will
only be granted a short time to flourish until the conventional giants overshadow their vision
using their robust supply chain capabilities (Duff & Phelps, 2016).

12
(Figure 2.2: The Largest Contributors to Grocery Sales Growth 2015-2020. The World Bank, IGD
Research, 2015)
In conclusion, for independent, small-scale retailers, entering the market is relatively easy
however, scale poses as a major barrier and the structure of the industry makes it unattractive for
any firms hoping to enter, thus, profitability is likely to be high in the industry.
2.2.2 Power of suppliers/retailers as buyers
Buyer power of the major supermarket chains over suppliers is substantial leaving the suppliers
with low supplier power. As previously mentioned, the industry is highly concentrated and market
concentration usually equates to market power (Burt & Sparks, 2003). The fear now is that these
retailers have too much power in the market that is being exploited at the expense of the suppliers.
The level of power that these retailers have depends on their relationship with their supplier which
Dobson & Chakraborty (2008) argue is based on bilateral bargaining as opposed to a situation
whereby the retailers would pay their suppliers a ‘market price’ for a product. Important factors
that also need to be considered is relative size and the availability of substitute suppliers. As a
result of the highly concentrated industry in many of the mature markets, the leading retailers
have market share that is significant enough to allow them to dominate their relationships with
their suppliers as they occupy the role of the ‘critical customer’ (Dobson & Chakraborty, 2008).
When suppliers are economically dependent on these retailers whereby a loss of their business

13
could have catastrophic implications for their bottom line, these suppliers are left with very little
bargaining power or they run the risk of having their contracts terminated. These grocery retailers
typically stock a wide variety of product lines, especially since the introduction of supercentres,
thus, the loss of one product line is unlikely to impact them (Smith, 2006). Retailers tend to stay
away from long-term contracts and maintain relationships with a wide range of suppliers to ensure
an agile supply chain and ease of switching (Marketline.com, 2013). Another feature of the
present day grocery market is the rise of private-label goods which extends producer substitution
by devaluing the supplier's particular product and assists these leading retailers in their ability to
exercise considerable buyer power over suppliers (Smith, 2006). If it is a case whereby a
particular supplier offers superior services in terms of efficiency or quality, or customers are
particularly loyal to a particular brand, then the supplier would hold power of their own.
However, this is documented by many as an unlikely scenario in this particular industry.
Furthermore, the pressure that these firms are under due to the level of competitive intensity in the
industry to keep their costs at a minimum means that they will start cutting costs in areas that they
have control over, notably, their suppliers. As part of the consolidation phenomenon, many of
these large retailers participated in backwards integration in order to scale up and capture the
profit being made by these suppliers, as was necessary given the cost structure of the industry
(Smith, 2006). These conditions put the large chains in an advantageous position to negotiate rock
bottom prices and is one way in which they can exercise their buyer power. The substantial power
that rests in the hands of the retailers can be good news for consumers as price reductions are
passed on to them and increased supplier competition is likely to lead to improved quality and
efficiency (Hattersley et al, 2013). However, the pressure placed on suppliers to the grocery retail
industry to keep costs low can also lead to ‘suppression of investment’ whereby shortcuts are
taken so that these suppliers can operate at such a low cost (Dobson & Chakraborty, 2008). Sotgiu
and Gielens (2015) noted that while it is unlikely, retailer-initiated price cuts can benefit certain
supplier brands as demand can increase substantially. This was the case in 2010 when Walmart
initiated a ‘soda war’ by reducing the preferred manufacturer price of various brands such as
Coca-Cola and Pepsi, forcing competitors to follow suit. Demand was so strong for these brands
that the suppliers could barely keep up supply. The power imbalance has shed light on supplier
welfare, as many feel they are being squeezed too far by the large giants (Bloom & Perry, 2015).
The fear going forward and a basis of further contemplation for competition authorities is the
increasing buyer power of these large retailers that dominate the market in the major economies
that leads to further consolidation and a subsequent reduction in smaller retailers (Dobson &

14
Chakraborty, 2008). As a result of exploitation concerns that proliferate the global grocery retail
industry, many governments have been called to bring about more stringent regulatory
frameworks that monitors the supplier-supercentre relationship leading to a myriad of formal
investigations into the abuse of power. This means a move away from self-regulated markets that
assume perfect competition (Burch et al, 2013). Many retailers have a CSR initiative that will
outline how well they treat their suppliers as a way to increase their consumer loyalty and
credibility amongst fierce competition in the face of changing market conditions, as opposed to a
dislike for exerting power over suppliers. Power has inevitably become highly centralised in the
hands of the dominant retailers who have the ability to take advantage of this self-regulatory
environment at the expense of the independent grocery brands (Burch et al, 2013). In this case,
low supplier power enhances profitability for the retailers in the industry.
2.2.3 Power of buyers: end-consumers
Individually, customers that shop in these supermarkets tend to have virtually no bargaining
power. If we focus solely on grocery purchases, the proportion of consumers’ total income that is
spent on them is sizeable. Based on 2014 data, in the US, households spend 6.5% of their total
income on food, while in the UK, 8.7% is spent on food, and in various other countries in Europe
such as Germany, Italy and France grocery expenditure accounts for over 10% of their annual
income (bls.gov.uk, 2015). Presently, just four nationally operating supermarket chains control 75
percent of all sales in the United Kingdom. This is not only the case in the UK, but the US also,
whereby a small number of large firms dominate the entire market (Plumer, 2015). This level of
concentration, in large part as a result of the ‘consolidation wave’, has implications for consumers
as mentioned above. Consumers have low switching costs as they fluidly move from one retailer
to another. Loyalty is a problem area for these large retailers and some try to retain consumers
through reward-schemes and other initiatives. Most of the large retailers will compete on price,
attempting to constantly undercut each other, but finding new points of differentiation becomes
increasingly important to keep consumers shopping with them. Bargaining power in this industry
is low because there is little the customer can do to alter the selling patterns of a grocery store,
and the revenue provided by a particular consumer is minimal for these retailers
(Marketline.com2013). However, it is important to note that while this is the case for an
individual consumer, the consumer base as a whole has the ability to drive trends and demand
higher quality and/or lower prices (Briggs & Goldman, 2006). As customer preferences
amalgamate, retailers must tap into that in order to stay ahead of the competition. This is why

15
access to big data is big business in this industry as failure to notice trends quickly is not tolerated
in this sector. Due to low-moderate buyer power, profitability improves for the incumbent
retailers.
2.2.4 Power of substitutes
If we consider a substitute to be something that is outside the industry, there are very few real
substitutes for grocery stores. As economies have become richer, we have seen a shift towards
eating out in restaurants which acts as a potential substitute for this industry. The 2015 census
bureau report showed that, in the US, consumer spend on eating out in restaurants and bars
overtook grocery sales for the first time ever showing a shift in consumer eating habits (Jamrisko,
2015). Likewise, in the UK and Europe, the casual dining sector is booming as consumers look
for efficiency and affordability. Furthermore, economic conditions and consumer preferences are
likely to be favourable for the restaurant sector into the future according to Ernst & Young’s
Restaurant and Casual Dining Insight Report 2014 (Gerrard & Cartmell, 2014). However, despite
this trend, the threat is quite weak. Restaurants and takeaways tend to be considered as an
accompaniment rather than a total alternative (Marketline.com, 2013).
The superstores we see today are offering a greater variety of goods and services that are not
solely focused on food items. If we consider the fact that you can buy a TV in Tesco, it begs the
question of whether home stores such as Harvey Norman act as substitute stores or just as a niche
version of that. One might argue that smaller convenience stores act as a substitute however, there
are two arguments in the way that would consider this to be a very weak substitute. Firstly, most
of the large supercentre stores have entered the convenience store realm of business. Secondly, it
can also be described as just another segment of the same industry, another format that has
evolved in the evolution process. A possible alternative for this industry that could cause a major
threat in the future is subsistence agriculture whereby individuals farm their own produce.
Currently, this is an uncommon practise in today’s world due to a lack of land space, access to
machinery, and high costs in terms of money and time. However with the ever-growing number
of health conscious consumers, this could pose significant substitution concerns for the future
(Marketline.com, 2013).

16
2.2.5 Competitive rivalry
Grocery retailers face stiff competition with each store fighting intensely for market share. In
order to avoid the cut-throat price competition, they have tried to expand their goods and services
range in order to gain loyalty in an industry that has seen a steady decline in the ability to create a
loyal consumer base.
The patterns of evolution explained above have been accompanied by a number of changes in the
structure of the market. Firstly, scale and scope dynamics have played a major role in driving
competitive structure in this industry. The scale of operations in grocery retail has increased
dramatically over the years, especially since the emergence of supercenters and warehouse clubs
(Ellickson, 2015). Economies of scale and scope in logistics, procurement and other operations is
of paramount importance due to the highly competitive nature of the industry and the pressure to
keep costs at an absolute minimum.
It is a common realisation that the sector is oligopolistic in structure. The ‘circle of growth’ is
driven by scale whereby increased scale leads to greater efficiencies, increased sales and market
share, which leads to greater investment ie expansions and so on and so forth. As this continues it
acts as a serious barrier to entry (Burt & Sparks, 2003). Ellickson (2013) examines the role of
investment in determining the equilibrium structure of the supermarket industry. Rather than
inviting more players into the market, larger markets encourage additional sunk investment by the
players already incumbent in the market, thus, limiting the number of firms that can profitably
enter these large markets. This model is relevant to the grocery competition discussion due to the
fact that geographic markets in the US, UK and Europe are consistently dominated by a small
number of major chains rather than just one chain who has the monopoly advantage, making the
competition in this industry more complicated. He looks at the outcome of this investment as a
way to consistently increase product variety and the one-stop-shop idea, which has become the
strategic focus of the industry and the basis of competition. Ellickson (2013) concludes that the
main incumbents in the industry form a natural oligopoly through increasing the size of their
stores and operations in order to compete head to head with other rivals, thus, making it very
difficult for smaller firms to compete. Dobson, Waterson and Chu (1998) observe essentially the
same pattern. Growth and market concentration at a national level increases organizational scale,
which provides lower unit costs through greater buying power. As a consequence sales and profits
increase, providing the capital and scope to invest in attractive customer facilities or in price

17
reductions. The potential arises for what Dobson, Waterson and Chu (1998) term a 'virtuous
circle' of growth dominated by one or two organizations, whose lower unit costs enable them to
assume market leadership. Smaller retailers find it hard to compete as they have to match prices
but with a higher cost margin thus, causing a huge number of exits from the market and a reduced
number of entrants. Hanner et al (2015) builds on these findings by giving empirical evidence of
how the set of important players in the industry rarely changes over the intermediate run.
As firms have become larger, the industry has become more concentrated, another element of the
change in market structure over the years. This concentration happened at a regional level up until
the 80’s (ellickson, 2015). With this comes questions of market power abuse on the part of the
incumbent grocery retailers (Basker, 2016). The very forces that contributed to the construction of
the oligopolistic market that we see today could lead to a strengthening of one or two
organisations and thus, a duopolistic market if authorities do not take this threat seriously.
Cotterill (1986) found that grocery prices tended to rise with increased retailer concentration. This
concentration of retailers acts as a significant barrier to entry and raises concerns over the
diminishing supplier power in the industry.
Various trends, changes in consumer preferences and shifts in store concepts including the
increasing popularity of the German discounters in recent years has led to increased competition
in the food retail space (Duff & Phelps, 2016). German discount retailers pose a threat for many
of the traditional store formats as they aggressively grab market share and push for greater
operational efficiency and lower prices. Many supermarkets and supercenters try to compete
directly with them by adopting the same format and as such, run the risk of cannibalising their
core business as a conventional supermarket or supercenter (Duff & Phelps, 2016). Although
supermarkets and discounters emphasise different consumer benefits and thus, target different
segments, there is considerable overlap which means the two different store format experience
considerable interformat competition. Not to mention the intraformat competition that occurs
between those following the same business model (Clereen et al, 2010). The fierce competition
between those operating the same format, along with naivety as to the severity of the threat posed
by these German retailers, allowed these discounters to enter various markets in Europe, expand
quickly and eat up market share at an alarming rate (Clereen et al, 2010).
The fierce competition in the market benefits customers in terms of lower prices, higher quality
products, greater selection and a more efficient shopping experience (Stanikunas, 2010). Glandon

18
and Jaremski (2014) focused their research on the prevalence of price reduction and ‘sales’ as a
way to attract consumers in the sector, acting as a testament to the loss-leader strategy and
exemplifying the competitiveness in the industry. The idea of ‘everyday low prices’ came about
with the introduction of Walmart in the US whereby temporary price reductions were superseded
by the idea that high quality produce can be affordable. This was further cemented by the
introduction of the German retailers some years later (Glandon & Jaremski, 2014). According to
Glandon & Jaremski (2014), for those firms not following a low cost strategy, many are forced to
partake in sales promotions in response to competition from these low-cost retailers. From their
study, firms in close proximity to the opening of a Walmart -like store would increase the
frequency of sales on particular products in order to compete, thus showing a strategic response to
the entry of this low-cost retailer (Glandon & Jaremski, 2014).
In conclusion, the structural characteristics of the grocery industry are conducive to market
concentration and it is often assumed that as a consequence there is a competition problem
(Smith, 2006). This has resulted in price wars, a significant power imbalance between the few
large retailers and the suppliers, reduced buyer power in terms of end consumers, and the
construction of stiff barriers to entry. Hence why the competitive nature of the industry is closely
tracked by government agencies. Governments have a responsibility to ensure fair competition
and possess the power to alter the dynamics of power in the industry. Therefore, understanding
how these firms work and compete is critically important for economic policy (Stanikunas, 2010).

19
(Figure 2.3: A five forces analysis of the grocery retail industry)
The five forces discussed above are summarised in figure 3 and come together to exemplify a
very competitive industry. This is supported by my financial analysis of nine major retailers in
three major economies. The tight and small metrics that I have compiled provide empirical
evidence of the above strategic analysis. We can also understand the metrics better through
understanding the industry as a whole. Decreasing returns in the industry over the past five years
is not surprising considering what we know about the competitive struggles in the industry, as
well as economic circumstances. Therefore, greater depth and understanding of the industry can
be gained by conducting a high-level exploratory analysis of its performance through a range of
metrics.

20
3.0 METHODOLOGY
This section sets out the procedures by which the data for this dissertation will be collected. The
aim of this quantitative research it to give a general overview of the financial performance of the
grocery retail across three of the major economies over a period of five years, through the use of
financial metrics. As identified in the literature and the competitive analysis of the industry, this
industry in unique in terms of its competitive rivalry and therefore, we can expect to see
increasingly tight margins, decreasing performance based on the synopsis’ of each company, and
similarities between the different economies on each of the metrics.
3.1 Method, measures and rationale
The primary source of data for this dissertation is the annual reports of the chosen companies
which have been presented in a coherent format in order to improve understanding and analysis.
Excel sheets were compiled for each company with the three prominent financial statements: the
income statement, the balance sheet and the cash flow statement. The aim was to keep a
consistent format for each economy so as to facilitate comparisons and greater ease of analysis.
Information gathered from financial statements was appropriate for this research as it gives
insight into the financial performance of each company that can be useful in preparing industry
averages and economy specific information. However, financial statement analysis is not without
its limitations such as issues involving classification when considering statements produced in
different economies that operate under different accounting standards, the sole focus on historical
information and the problem of missing non-financial information (Mahboobinijad, 2015) To
analyse the industry, economies and companies, a range of eleven financial measures were put
together that would give a rounded view of the industry. The averages of such are presented in
appendix 2 and represent all nine companies over the five year period chosen. In an excel it was
possible to compile averages per economy, per year, per company, and over the five years.
Graphs were drafted up to improve visual coherence and certain trends could be spotted. From
this, a select few metrics were chosen out of interest and a DuPont analysis was formed to assess
the decline in returns observes. These measures will be discussed in greater detail throughout the
analysis. It was important to compile my own financial statements and metrics into a
comprehensive framework in order to gain a greater understanding of the key performance
indicators of the selected companies over a 5 year period. For developmental and professional

21
purposes, it made sense to conduct a financial analysis from scratch. This quantitative analysis
can be reproduced by another researcher who has the same aims and they will come out with the
same results, landing this research methodology in the realm of positivism according to Saunders
et al., (2007).
3.2 An introduction to the sample companies chosen for analysis
The target groups for my research are grocery retailers from three main economies; the UK, the
US and the EU. I have chosen to analyse and compile data on three companies domiciled in the
three different economies over a period of five years. At least one from the group operates
multinationally, and all of which are of similar scale, format and business model. The companies
chosen make up a substantial proportion of the total market which leads us to believe that it is
representative of that particular economy and the global grocery retail industry. The combined
market share of the three companies make up between 45% and 55% of the total grocery retail
market in their respective countries. Certain players in the industry had to be omitted from the
research due to insufficient financial information.
3.1.1 UK-domiciled companies
(Figure 1: Great Britain Grocery Market Share 2016. Kantarworldpanel.com, 2016)

22
The table above is a snapshot of the UK grocery market in 2016. It is clear from this that the three
companies chosen make up a substantial part of the total market with a combined share of 55.3%
(Kantarworldpanel.com, 2016). This leads us to believe that an analysis of these companies is
representative of the market as a whole. Asda is a Walmart-owned company and therefore, has
been omitted from this research project.
(1) Tesco
Tesco was established in 1919 in East London and operated on a small scale up until 1950 when
its first supermarket was introduced. In the 1960’s it began introducing various household items
and in 1968, in keeping with the periods of evolution outlined in chapter one, Tesco opened its
first superstore. Slightly behind the US in terms of computerisation, Tesco did not introduce
scanning registers until 1982. The 1990’s was a revolutionary decade for the company wherein it
launched its ‘every little helps’ campaign, the first Tesco Express was introduced, and, Tesco’s
international ambitions became a reality as it became a global corporation. In the early 2000’s,
Tesco continued its expansion which included building itsonline presence and buying the UK’s
largest convenience store chain, One Stop (Tescoplc.com, 2016). Today, Tesco is the UK’s
leading grocery retailer with a market share of 28.2% at the end of June 2016 (Kantarworldpanel,
2016). However, the seemingly impregnable brand has encountered some difficulty over the last
number of years. In the financial year ended February 2015, the net loss was £5,741 million,
compared to the net profit of £974 million in 2014. Tesco has been feeling the pressure from
German discounters with revenues falling since 2013, as well as suffering from the bad publicity
after the accounting scandal that transpired in 2014 (marketline, 2016). Some questioned whether
or not the company has been over-ambitious with its expansion as attempts to break the US
market failed and markets such as China and Japan proved less fruitful than it had hoped (Simms,
2014). In response, the company announced a turnaround strategy in order to restore
competitiveness. Tesco’s CEO, Dave Lewis, announced plans to scale back expansion, close
unprofitable stores, reduce the number of product lines held in store, and decrease prices on a
variety of ranges.
(2) Sainsbury’s
Sainsbury’s opened its doors 50 years before Tesco in 1869. Among its competitors, it was the
first in many ways including; the first to introduce fairtrade in its stores, recyclable plastic bags,

23
organic produce, and the use of the traffic light nutritional guidance system. In the 70’s, the store
began introducing non-food items in store, including its own fashion brand (J-Sainsbury.co.uk,
2016). The period between 1992 and 1998 was a rough one for the company as sales declined
considerably (Butler, 2014). Sainsbury’s not only operate the supermarket format. In 1998,
Sainsbury’s introduced its first convenience store, Sainsbury’s Local, which has now expanded to
over 700 stores as the company noticed a change in consumer buying habits away from the ‘one-
stop-shop’ phenomenon (Coles, 2015). Over 100 of these stores are thanks to a joint venture that
the company entered with Shell garages. As was the case for Tesco, acquisition was the main
entry mode into this sector of the industry. Sainsbury's too faced disaster when trying to expand
abroad, exemplified by its catastrophic joint venture with an Egyptian distribution company that
resulted in a first year loss of £10 million and the imprisonment of its Chief Executive, Mike
Coupe (Ruddick, 2015). 2015 was a particularly bad year financially for the company as it saw its
first loss in over a decade (Ruddick, 2015). At the beginning of 2016, the company decided to
expand its non-food range. The company managed to secure a takeover of Argos which it hopes
will guarantee it a position as the ‘leading food and non-food retailer’ in the future (Hutchison,
2016). The first quarter of 2016 has not been kind to the UK’s four major grocery retailers.
However, Sainsbury's has seen the smallest sales declines compared to its four main rivals
(Yeomans, 2016).
(3) Morrisons
Morrisons has its roots in Bradford in 1899. The first supermarket came some 62 years later in
1961 (Morrisons-corporate.com, 2016). As opposed to many of the other retailers in the market,
Morrisons has historically followed an organic-growth strategy rather than an acquisition-led
growth strategy. That was until 2004, when Morrisons acquired Safeway, making it the UK’s
fourth largest grocery retailer (Morrisons-corporate.com, 2016). In 2014, the company announced
its ‘im cheaper’ campaign which meant that the company was to become permanently cheaper
than its major rivals. Today, the chain is the cheapest among its ‘big four’ rivals. Since the
beginning of 2016, the company has consistently seen the second strongest sales declines
compared to its four main rivals in the UK grocery retail industry at roughly 2% (Yeomans, 2016)
However, this is much less severe than the declines suffered by the company in previous years.
For example, in 2015, the company saw a painful 5.9% decline in sales. The company has failed
to expand geographically which means it has heightened exposure to economic, political and
social situations in the UK. Furthermore, the company was slow to adapt to the move away from

24
the one-stop-shop trend and adopt a range of convenience stores like its rivals. It was not until
2011 that Morrisons introduced its chain of convenience stores known as M Local (Morrisons-
corporate.com, 2016). In an effort to improve performance, Morrison’s newly appointed CEO,
David Potts, announced a rebrand at the start of 2015 to turn around the financials of the
company. A number of initiatives were introduced, one of which was to sell of underperforming
stores, which included the whole chain of convenience stores (Smollen, 2015). A new logo has
been introduced, stores are being revamped, prices have been cut considerably to attract new
consumers, and greater efforts have been made to enhance its online presence (Hobbs, 2016). In
February of this year, Morrisons entered a major partnership deal with Amazon to extend its
online platform. Morrisons already have a 25-year supply deal with Ocado but partnering with
Amazon is a low-risk and capital light deal that will open the company up to a new consumer
base. As of 2014 figures, Morrisons held a miniscule 0.9% of the online grocery sector in the UK,
in companrison to the 39.1% share held by Tesco (Roderick, 2016).
3.2.2 US-domiciled companies
The three companies chosen for the analysis of the US retail grocery segment are Wal-mart,
Kroger and Costco, which together make up 49% of the total sales in the US grocery market
according to the Progressive Grocer’s Super 50 report (Korosec, 2015).
(1) Walmart
The company that is now hailed as a mega-corporation that has the power to impact society,
prices, wages and the overall economic situation on a local, national and global scale, began its
operations much later than some of its well-known rivals, in the year 1962. In the early 80’s, the
company opened its first cash and carry-style warehouse club, and a few years later it opened its
first hypermarket which transformed into the supercentres that we know today (Marketline.com,
2016). Today, Walmart operates various different store formats and holds the title as the retailer
that sells more groceries than any other in the entire world (Fishman, 2006). Walmart consistently
strive for lower input prices so that it can pass these savings on to its customers, otherwise known
at ‘the perpetual motion machine of profitability’ (Steffy, 2016). Before Walmart came onto the
scene, incumbents dabbled in sporadic sales, however, Walmart built on this by announcing
‘everyday low prices’ which became its slogan and the basis through which it turned the industry
on its head. The company is considered revolutionary in changing the shopping habits of

25
consumers and the structure of the industry. Essentially, what Walmart did was change our
perception about quality and its affordability. Walmart's expansion nationwide was aggressive,
with there now being a store in all 50 states, and exemplified by the fact that, today, more than
half of Americans are within five miles of a Walmart store (Fishman, 2006). According to
Progressive Grocer’s 2016 issue of the top US grocery retailers, Walmart ranks first in terms of
size, number of employees and total revenue (Progressivegrocer.com, 2016). Not only has its
expansion nationwide been impressive, but the corporation now boasts an international profile of
an additional 26 countries throughout the world, making it a truly global company
(Marketline.com, 2016). However, like others in the industry, Walmart has suffered setbacks. The
company didn’t always get it right when it came to international expansion, among others was the
much-publicised withdrawal from the German market. Furthermore, in tandem with the global
economic downturn and the rise in oil prices, Walmart has suffered sluggish global sales growth
over the last number of years. The company dominates the hypermarket channel however, sales in
such have slowed as cash-strapped consumers opt for the smaller-format dollar stores (O’Keefe,
2015). The company’s commitment to the ‘Always low prices, always’ slogan has afforded it
some unwanted publicity and criticism over its abuse of buyer power (Cascio, 2006). The
company that was once micro-managing the marketplace, now faces the stiffest competition of its
existence. As a result, CEO, Doug McMillion announced the reinvention of the company to win
in the digital age (O’Keefe, 2015). This led to the opening of multiple e-commerce fulfillment
centres throughout the US (Marketline.com, 2016).
(2) Kroger
The first Kroger was established almost 80 years before Walmart came on the scene. What sets
the company apart is its commitment to providing fresh, quality, organic produce in store and to
ensure this, more than 40% of the produce found in store is made in its own Kroger factories
(krogercorp.usdphosting.com, 2016). The first superstore came about in the early 1970’s, in
tandem with the evolution of the industry. When Walmart began to roll out its supercentres across
the country, Kroger began to invest heavily in a number of things, notably, greater data analytics
to improve the customer shopping experience (Telesca, 2015). Kroger has consistently been ahead
of its competitors with regards to the digital boom. It was the first to introduce scanning registers
at checkouts and, in 2012, it rolled out the first, and currently only technology platform in the US
that uses sensors and predictive analytics that affords managers real-time data (Taylor, 2015).
Kroger’s story has a common thread of acquisitions and mergers running through it which has led

26
it to the scale it operates at today and has been named as one of the top 10 retailers to from in
2016 (Springer & Zwiebach, 2016). Currently, Kroger ranks second in the US grocery market in
terms of sales, operates the third largest filling stations in the US and is the fifth largest drugstore
operator in the nation. The company announced a massive $4 billion expansion plan that is due to
be rolled out this year with a greater focus on high profile acquisitions, upgrading its digital
presence and extending its geographic reach (Coolidge, 2016).
(3) Costco
A key characteristic of the grocery retail industry is the lack of consumer loyalty. Despite efforts
by traditional retailers to increase loyalty through reward schemes, consumer loyalty has
diminished over the years along with the dissolution of the ‘one-stop-shop’ idea. Costco has
managed to hang on the coattails of this trend through the creation of members-only warehouses.
In the intensely competitive environment that it operates in, low-price membership and a bundle
of faithful shoppers sets Costco apart (Kell, 2015). Costco opened its doors for the first time in
1983 and operates the warehouse club format that champions bulk, low-cost products, pioneered
by Price Club (Datamonitor, 2010). Therefore, key to its competitive advantage is a lean
operating cost model whereby inventory levels are kept at a minimum, allowing the company to
make greater sales per square foot compared to its closest rivals (Soni, 2016). Rather than selling
the usual items at discounted prices, there can be high-end goods such as diamond rings for rock-
bottom prices which sends consumers on somewhat of a ‘treasure hunt’ while also changing
consumers perception of ‘discounts’ and quality. This strategy has worked well for the company
throughout the years as they attempt to stave off competition from ‘sensible discounters’ (Branch,
1999). The strategic emphasis for the company is on value rather than price. Thus, its target
market is the more upscale, sophisticated consumer base (Cascio, 2006). The company currently
operates in nine different countries throughout the world (Costco.com, 2016). However, it is
heavily reliant on its home market with almost 75% of its warehouses based in forty states in the
US (Datamonitor, 2010). By the end of 2015, the company ranked as the second-largest retailer in
the world (Carpenter, 2015) and ranked second in terms of sales in its country of origin.

27
3.2.3 EU-domiciled companies
The top European companies chosen for this project are within the top four in terms of sales. The
Schwarz group could not be included as it is privately owned and does not issue financial
statements.
(1) Carrefour
Carrefour is Europe’s largest retailer with over 15,000 stores in four different formats;
hypermarkets, supermarkets, cash and carry and convenience stores (Datamonitor, 2011). In 1959,
this French company pioneered the ‘hypermarket’ format, which, was an extension of
supermarkets in terms of retail space and product variety. In fact, the term ‘hypermarche’ means
“bigger than traditional supermarkets” in French (Yhi-Chearang et al, 2006). Carrefour operates
globally in over thirty countries concentrated on three continents (Carrefour.com, 2016). Despite
its huge success in Europe, the company failed to crack the American market due to stiff
competition, even though it entered into joint ventures with Costco and Office Depot. Hong Kong
also caused trouble for the French giant (Yhi-Chearang et al, 2006). The company is heavily
reliant on sales in France and Western Europe countries which has left it heavily exposed to the
turmoil the has occurred in these economic environments over the last number of years, notably,
the recession and the instability of the Eurozone area. For many years, the company was plagued
by disappointing results, until it announced a turnaround strategy in 2012 that would entail a
drawback from many unprofitable overseas markets in order to concentrate on maintaining a
leadership position in Europe (martin et al, 2016). 2016 will be the year of digitisation for the
company, along with others mentioned above. Carrefour’s CEO, Plassat, agrees with the general
consensus that physical stores will remain important in the industry, however, an online ‘click and
collect’ system is important in terms of evolution and providing time-conscious consumers with
an additional avenue for purchase (Van Looveren, 2016)
(2) Metro AG
Metro began operations in Germany in the year 1964 under the cash and carry format, and began
its internationalisation four years later. The company became Metro AG in 1996 and introduced a
variety of formats to change with the evolution of the industry (Krafft & Mantrala, 2010). It
witnessed the structural decline in large store formats such as supermarkets and hypermarkets
28
with sales falling for a number of years up until 2011. To offset this the company introduced a
‘Shape cost savings’ initiative, turned its international expansion efforts towards emerging
markets and focused on the smaller format stores. Today, Metro operates in 26 countries (Kelly,
2016). The company felt the effects of its native discount rivals Aldi and Lidl before other parts of
the world. In response, Metro added a new format to its list in tandem with the evolution of the
industry - the discount format. Its flexibility in format has been hailed as the main reason why the
company has managed to stay in business. Although, the Cash and Carry arm of the business
remains at the forefront contributing almost half of the group’s total earnings (Kelly, 2016). With
unstable financials over the last number of years, the company faced 2016 with reduced investor
confidence and a need to scale back its expansion plans significantly, and it did just that by selling
off unprofitable operations in both Vietnam and Canada which resulted in a slight growth in sales
and a reduction in its debt (Baja, 2016).
(3) Auchan
Following in Carrefour’s footsteps, French-based company, Auchan opened its first hypermarket
in 1967 (Groupe-Auchan.com, 2016). The 1990’s was an important period for the company in
terms of international expansion as it moved into various markets, notably, China. The company
has remained ‘hypermarket-dominated’ in format despite entering the convenience store,
supermarket and shopping centre realm (Marketline.com, 2015). The company’s 2014 financial
statements show that hypermarket income made up 81.6% of total revenue. Entering into
partnerships has been a core characteristic of the company’s strategy, especially when entering
international markets as was the case for China and India. It also entered an international
purchasing partnership with rivals Metro AG in 2014 to increase buyer power with suppliers
(Checkout.com, 2014). Auchan’s bigger rivals Walmart and Carrefour began to feel threatened by
Auchan’s success in global markets, especially since it managed to crack the Chinese Market
better than they could. This in large part is due to that fact that Auchan appeal to the middle class
shopper that exists in China, whereas, Walmart’s ‘everyday low prices’ strategy backfired with
Chinese consumers as they usually consider this to mean that products are unsafe or counterfeit
(Matlack, 2009). However, Auchan’s internationalisation process was not an unhindered success
story. In 2003, the company pulled out of the US market due to unanticipated sluggish sales
(Roberts, 2004). France remains the largest geographic segment in terms of revenue for the
company with the combined total revenues in Asia and Africa coming in second (Marketline.com,

29
2015). Auchan ranked as 129th on the 2015 Fortune 500 list, and was named as Russia’s largest
international player dominating 14 % of the grocery market (ceeretail.com, 2015).
Company Approx. Market
Capitalisation (2016) -
billions
Turnover (2015) -
millions
Profitability (2015) -
millions
UK-domiciled companies
- Tesco £13.09 £62,284 £-5,766
- Sainsbury’s £4.35 £23,775 £-166
- Morrisons £4.20 £16,816 £-761
US-domiciled companies
- Wal-mart $229.10 $482,229 $16,363
- Kroger $34.01 $109,830 $2,039
- Costco $73.36 $113,666 $2,377
EU- domiciled companies
- Carrefour €17.48 €76,945 €1,124
- Metro €9.3 €59,219 €-221
- Auchan N/A €54,232 €719
(Table 1: Market capitalisation (2016 approx.), profitability (2015) and turnover (2015) for each
company chosen for sample)
In conclusion, the companies presented in my analysis make up a substantial part of the grocery
retail industry as a whole and therefore, can be seen as representative of the industry. However, it
is understood that this sample is not exhaustive whereby it only represents a proportion of three
economies. The aim of this research is a general overview of this industry and therefore, further

30
research may want to include a greater sample size. A range of financial metrics have been used
to test this methodology. Using financial ratios was appropriate for the purpose of this dissertation
in order to gain a high-level understanding of the industry, spot trends, facilitate comparisons, and
predict future prospects for the industry. It was also beneficial in avoiding exchange rate and scale
effects. It is also understood that the list of measures chosen is not all encompassing and presents
its own set of limitations including comparability issues due to the use of different accounting
practises, the one-dimensionality of ratios, and the effect of outliers (Faello, 2015). Taking a
proactive approach to compiling these ratios helps to enhance comparability and the adoption of a
DuPont analysis minimises the issues surrounding one-dimensionality.
The following part of this dissertation will look at the metrics that enticed substantial interest and
were most meaningful. I will consider the returns in the industry as a whole over a five year
period, which can be broken down using the DuPont analysis. This gives us an interesting
overview of the financial performance of the industry, and in specific cases, interesting
similarities and differences across the three different economies.

31
4.0 FINDINGS AND ANALYSIS
From the graphs presented below we can see that there is a similar decreasing trend in both return
on equity (ROE) and return on assets (ROA). Specifically, 2015 which seems to have taken a
particular hit. Returns overall are not huge in this particular industry which is something we
would expect to find considering what we know about its structure. This makes for an interesting
observation in the industry and across the different economies.
4.1 Return on Equity (ROE)
The first measure, ROE, is a profitability ratio that attempts to measure the ability of a particular
firm to generate profits from the investments by shareholders. It can also be used as an indicator
of how effective management is at using equity financing to grow the business. ROE was
calculated as ROA X Leverage X 100.
The results for the industry are presented in figure 1 below. Attractive investment quality would
lie in the range of 15-20%, leaving the -6.37% 2015 ROE figure for the industry, well below
satisfactory levels for investors. The decreasing trend that we can see is problematic as companies
within the industry are mismanaging their equity and/or need more capital to finance operations
and generate profits. The grocery retail industry is characterised by fast moving consumer goods
and therefore, risk in the industry is relatively low and investors can expect a smaller return on
their investment in such an industry.

32
(Figure 4.1: Return on equity for industry sample)
If we break down these metrics by jurisdiction we can see in figure 2 that the US receives the
highest returns on average compared to the UK and EU. Hogan & Hutson (2004) noted that US
firms tend to prefer equity financing which may help to explain why the US consistently stayed
above the other two economies on this metric. Both the EU and US have managed to keep their
returns relatively stable over the five year period studied. However, the UK figures have
significantly impacted the overall industry average with a significant decline in ROE from the
year 2014 to 2015. From this it would seem that the UK as a whole requires greater capital to
generate profit, and in some ways indicates inefficiencies.
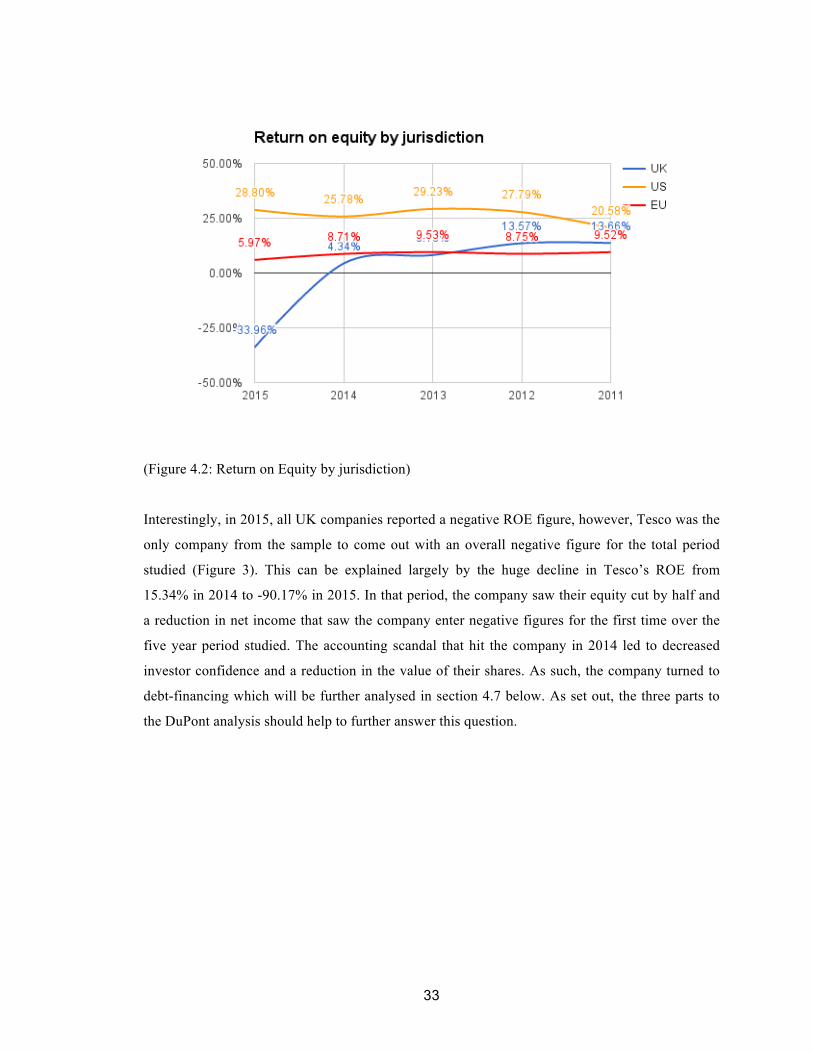
33
(Figure 4.2: Return on Equity by jurisdiction)
Interestingly, in 2015, all UK companies reported a negative ROE figure, however, Tesco was the
only company from the sample to come out with an overall negative figure for the total period
studied (Figure 3). This can be explained largely by the huge decline in Tesco’s ROE from
15.34% in 2014 to -90.17% in 2015. In that period, the company saw their equity cut by half and
a reduction in net income that saw the company enter negative figures for the first time over the
five year period studied. The accounting scandal that hit the company in 2014 led to decreased
investor confidence and a reduction in the value of their shares. As such, the company turned to
debt-financing which will be further analysed in section 4.7 below. As set out, the three parts to
the DuPont analysis should help to further answer this question.

34
(Figure 4.3: Average ROE by company)
4.2 Return on assets (ROA)
The second returns ratio to be analysed is ROA which considers the net income produced by total
assets during a particular period. Ultimately, the ratio measures how efficiently managed assets
produce profits. ROA was calculated as ATO X NPM X 100.
The results of the ROA analysis across the industry paints a similar picture to that of ROE above.
Typically, analysts would like to see an ROA figure of no less than 5%. From the graph we know
that 2012 was the only year in which the industry reached satisfactory ROA levels. The negative
level reached in 2015 suggests that the companies studied are investing heavily in capital while
also receiving little income. High levels of debt will amplify the negative ROA, further explained
by increased leverage in that period. The results are indicative of the net income per economy
studied which clearly have a substantial influence on the overall result.

35
(Figure 4.4: Return on assets for industry sample 2011-2015)
While figure 4 presents an industry level picture of declining ROA over the period studied, figure
5 shows that this has been impacted by the negative ROA in the UK. On average, the US presents
a healthy ROA figure between 6.78% and 7.82% with an average asset turnover in the 3.0 range
as opposed to the other two economies which fall in the 1.0-1.9 range. Higher asset turnover
levels results in impressive ROA for the US (Kumar, 2006). Interestingly, it is Kroger and Costco
as opposed to Walmart that have the higher turnover of assets despite Walmart’s commitment to a
strategy centered around increasing this metric. The EU consistently presented below desired
levels of ROA across the five year period. Since 2011 however, the UK has seen declining ROA
year on year, which eventually plummeted to a minus figure of -8.67% in 2015. As mentioned
above when introducing the UK-domiciled companies included as part of the sample, these firms
are in the process of reducing their asset base as they employ an over-extensive list of product
ranges and entered too many property-related contracts, thus, total assets reported by these
companies have been large and inefficient in producing revenue due to change in consumer
preferences away from the ‘one-stop-shop’, supercentre phenomenon. As a result, all three
companies in the UK jurisdiction saw declining total assets between 2014-2015. However, the
decline of all companies into the negative realm for net income is what has resulted in the plunge
of roughly 9% in ROA.

36
(Figure 4.5: Return on assets by jurisdiction)
4.3 DuPont Analysis
To analyse these returns ratios further it is important to conduct a DuPont analysis which may aid
in understanding why this downward trend in returns has occurred in the industry over the five
year period from 2011-2015. The DuPont ratio analysis was introduced in 1914 by Donaldson
Brown and since then has gained traction as a way to explain ROA and ROE as a function of
three ratios. The DuPont analysis counteracts the argument that ratios are one-dimensional and do
not provide a holistic picture of the financial health of a business, or industry (Kusi et al, 2015).
According to DuPont analysis, ROE and ROA are a function of; profit margin (PM), asset
turnover (ATO) and financial leverage (FL).
4.3.1 Gross Profit Percentage (GPP)
In figures 6 & 9 below we can see that both net profit margin (NPM) and gross profit percentage
(GPP) have been decreasing in the industry over the past five years, and is one part of the puzzle
in explaining the same decreasing trend in ROA and ROE. As we know from the literature and

37
subsequent findings from Porter’s five forces analysis, the industry is plagued by increasingly
tight margins due to its competitive nature. Companies are constantly looking for ways to increase
this margin. Margins are so thin in this industry because we are dealing with commodities, low
switching costs and the emergence of discounters. As a result, the companies operating in the
industry are constantly looking to increase sales volume to make up for these margins, and
decrease their costs as much as possible especially when operating an international supply chain.
Many in the industry hope that a move toward online grocery retail will increase these margins.
Despite the competitive rivalry, low margins acts as another deterrent for new entrants.
GPP represents the percentage of sales revenue that the company retains after subtracting the
direct costs of those goods produced. GPP is calculated as follows:
(Figure 4.6: Gross Profit Percentage for industry sample)
The GPP for the industry (Figure 6) somewhat mirrors the revenue growth in the industry over the
period studied (Figure 7). While only showing half the picture for GPP this is an important trend
to note as this is clearly having a significant impact on the results.

38
(Figure 4.7: Revenue growth for industry sample)
Figure 8 below shows an interesting picture. Again we are seeing steady results from the EU and
US, however, the UK sample is three times lower on average over the period. A combination of
decreasing revenues and increasing cost of sales led to the sharp decline in 2015. However, the
overall inability to reach margins exemplified by the EU and US makes for an interesting
phenomenon. The UK-based companies face all the same challenges of those in the other two
jurisdictions such as increased competition, pressure from German discounters and changes in
shopping habits. However, the UK has suffered the most and has led to a huge write down of
operations among all three native companies. There are a number of rationales as to why this is
the case for the UK. The economy, industry and individual companies have faced turmoil over the
period chosen and in particular, in 2015.

39
(Figure 4.8: Gross Profit Percentage by jurisdiction)
On a more macro level, these retailers are still feeling the pressures of cautious shoppers since the
aftermath of the economic downturn, as well as the impact of deflationary prices in the industry
which are in large part, a result of the introduction and success of German discounters such as
Aldi and Lidl. According to Butler (2015), typical basket size in the UK for 2015 costs the
consumer 2.1% less than it did in 2014. As a result, there is less money in the tills of the UK retail
grocers, but a necessary move in order to compete in an industry characterised by vicious price
wars. The fall in food prices during 2015 came in tandem with the fall in commodity prices.
Furthermore, for 2015 as a whole, inflation in the UK economy averaged zero, which is the
lowest reading since the Office for National Statistics began their records in 1950 (Nocolaci da
Costs & Milliken, 2016). While both deflationary food prices and decreased inflation increase
consumer spending power, consumers in the UK are said to not have recovered in confidence as
well as those in the US or the EU, thus, the grocery retailers are suffering at the bottom line. The
large difference in GPP also begs the question as to whether this particular industry has greater
competitive rivalry than the other economies studied. Indeed this is outside the scope of this
study, however, the size of the market is much smaller and therefore, competitors are fighting for
a piece of a smaller pie.
Much of this explains the disappointing sales revenues for the companies, the next element of the
equation relates to cost of goods sold. How a company defines cost of goods sold is not dictated
by the any of the current accounting standards such as GAAP or IFRS. The UK companies
interestingly include a proportion of finance costs in their cost of goods sold, as well as

40
impairment on certain assets (Tescoplc.com, 2015). This has the potential to skew the GPP results
so that the UK figures are on average three times lower than that of the EU/US figures. Although
all UK companies saw a decline in gross margin, Tesco’s decline impacted this greatly in 2015
due to specific challenges faced by the company in that period such as lack of investor confidence
post-accounting scandal. Other potential reasons for the large differences in margins cross
jurisdictionally include inefficient supply chain systems, exchange rate effects and failure in
company strategy. As mentioned, this paper does not act as an in-depth analysis, nor does it
expect to explain why some economies seem to be performing better/worse than others, rather it
provides observations on the sample of the industry chosen.
4.3.2 Net profit margin (NPM)
NPM measures how much each dollar/euro or pound earned by a company translates into profit.
Not only are the margins tight at highs of 2.4% in 2011/2012, but they declined to a minus figure
in 2015 (figure 9). NPM is calculated as follows:
(Figure 4.9: Net Profit Margin for industry sample)
The relatively stable margins reported by the US and EU are indicative of the fact that demand for
food is relatively stable and are line with trends above. Due to the industry’s competitive nature,

41
this closeness is what I would have expected to see when I initially began research, as the
companies studied operate similar business models and conduct themselves in similar ways, as
well as the fact that we are moving towards an international set of accounting standards. These
margins are still consistently very low leaving the incumbents in those economies with little
cushion if sales dip. What is interesting when comparing NPMs across the three jurisdictions is
that the UK is the only economy to report negative figures in 2015 for all three companies
studied, even though Morrisons and Sainsbury’s had positive gross profit percentages (Figure 6).
The UK saw the largest NPMs among the three economies in 2011 but these declined year on
year until 2015.
(Figure 4.10: Net profit margin by jurisdiction)
Following on from disappointing gross margins, a major expense for these UK-domiciled
companies came from the loss associated with property as many projects and onerous contracts
are abandoned in tandem with industry evolution and a downsizing of stores. In fact, in 2015,
Tesco reported a property-related loss of £985 million. During the boom years, the company
hoarded millions of euro worth of land that then lost its value and had to be sold on to reduce the
debt burden it faced. If we take Walmart as a US example, the company formed Walmart Realty,
a subsidiary that focused on leasing out redundant supercentre premises to other retailers, thus,
providing revenue for the company and postponing the selling of these properties until a time
when the market for land and property recovers (Walmartrealty.com, 2016). Another recurring
expense for these companies is finance costs which increased in 2015. A further analysis of

42
leverage and borrowings for the period will be conducted below and will help in explaining this
expenditure. An extract from Tesco’s income statement for the years 2014 and 2015 is provided
to enhance clarity (Figure 11). Results from the two margins explained above may be due to a
number of reasons as explained above that relate to but are not limited to; the economy, consumer
confidence and particular company issues.
(Figure 4.11: Represents an increase in Tesco’s cost of sales and finance costs, and a reduction in
revenue. Thus, affecting profit margins)
Although I will not go into much detail about the implications of the Brexit vote for these grocery
retailers, it is important to point out some immediate consequences that would seem somewhat
unfavourable for the companies and their financials. Firstly, the pound sterling exchange rate has
suffered as a result of the announcement that the UK would be separating itself from the EU, and
due to the fact that the UK food market is heavily reliant on imports, consumers are likely to see
an increase in food prices as a result. Secondly, trade agreements are yet to be drawn up but could
impact these companies considerably as they operate internationally. Thirdly, suppliers may be
under further pressure due to a possible loss of subsidies and export/import implications with
increased costs being passed onto retailers, further squeezing margins. Finally, consumer
confidence is already an issue in the UK, and according to the GFK consumer confidence
barometer, the post-brexit reading took a dive due to concerns about the economic outlook As part
of the report, the grocery sector was pinpointed as a particularly vulnerable area due to
diminishing discretionary income (Ridsdale, 2016). In an industry whereby margins are already at

43
the lower spectrum, the Brexit announcement could put further pressure on these retailers in the
future (Vaughan, 2016).
4.3.3. Asset turnover (ATO)
To develop our analysis of returns further, I needed to assess ATO and its impact on returns. ATO
refers to how efficiently assets are being used in generating revenue for the company and is
calculated as follows:
As a sector, ATO tends to be high as exemplified graphically by Figure 12 below where it stays
within the 2.1 to 2.4 range. This is not surprising considering companies in the grocery retail
sector will tend to concentrate on sales volume when profit margins are increasingly tight (Bank,
2016). Reiterating what was found in the literature, economies of scale and constant innovation to
keep costs low has led companies in this sector to operating an efficient inventory management
system. The differences in ATO across the five year period is quite minimal. What seems like a
large drop from 2013-2014 is a decline of less that 0.10. However, in an industry whereby low
profit margins must be compensated by ATO efficiency to increase its ROA, this can be
important. Even though, on average, ATO increased for 2015, it was not a large enough increase
to offset the decline in profit margin and thus, ROA declined.
(Figure 4.12. Asset Turnover for industry sample)
44
4.3.4. Leverage
The third and final element to consider when assessing returns is leverage. Leverage refers to the
ratio of total debt to equity. For the purpose of this paper, leverage was calculated as follows:
Leverage in the industry has increased over the five year period studied, with it more than
doubling in 2015 (Figure 13). This affects the perceived level of risk in the industry for
prospective shareholders. As a whole, the industry tends to be highly leveraged due to its capital-
intensive nature and the expectation that earnings will be stable for the fast-moving consumer
goods industry. ROE is greatly affected by increased financial leverage. Increased debt, combined
with decreasing revenues in the industry and/or a poor economy leads to a decline in ROE.
Increased debt at a time with revenues are increasing would be beneficial in terms of profit and
ROE for shareholders. A higher degree of leverage means higher potential rewards, but also
higher potential losses and therefore, it is considered to be a high business risk, measured as the
potential variability of the company’s EBT from its assets (Schmidt, 2016). As well as business
risk, there is considerable financial risk involved with high levels of leverage. In terms of ROA,
increased debt can reduce revenues due to the cost of servicing this debt (Duff, 2016). When the
interest on the debt is greater than the ROA and therefore, negatively affects ROE. A highly
leveraged company will run the financial risk of being unable to meet its financial obligations
associated with a high level of debt repayments. When a company is considered to have high
financial risk, their credit and bond ratings will suffer.

45
(Figure 4.13: Leverage for the industry sample has increased)
If we consider whether each economy has increased its leverage over the particular sample period,
we can see that in the EU area, leverage has actually decreased year on year over the period
studied (Figure 14). However, as an economy as a whole, total leverage is above the US and the
UK consistently. Therefore, in total, as an economy it tends to be more highly leveraged than
other economies. The Eurozone debt crisis pointed out inefficiencies in the banking system and its
supervision. For many years, banks lent generously and therefore, the results for the EU are not
surprising. The US has seen slight increases in every year studied except 2014, but on a whole,
leverage has stayed relatively constant with a general focus on equity-financing preferred.
Between 2011 and 2014, the UK was below the other two economies in terms of leverage.
Indicating that it tends to use more equity/ less debt to fund operations compared to the other
jurisdictions studied. However, 2015 saw a sharp spike in leverage which saw it overtake the
2015 US level. This sharp spike in UK leverage likely explains the overall increase across the
industry for 2015 and is consistent with other metrics mentioned above. From our analysis of the
UK’s NPM, we can see that the cost of finance increased substantially in 2015. The debt burden
for the companies is so high that it cuts into net income and thus affects the ROA figure resulting
in the decline observed.

46
(Figure 4.14: Leverage by jurisdiction)
To delve deeper into 2015, with a specific focus on the UK economy, we can see in figure 15 that
all three companies increased their leverage from 2014-2015, and at the same time, sales revenue
and profitability declined for all companies. This raises questions regarding lax lending in the UK
economy. Tesco in particular has increased its amount of debt substantially in 2015. Levy &
Sarnat (1994) outlined a number of reasons as to why a company would increase its debt as part
of its long-term financing policy. Firstly, that the company can afford to take on the extra risk
associated with increased debt because it has an adequate operating profit. Secondly, the firm has
stable earnings. Other reasons include the unlikely probability of bankruptcy, agency costs and
fears around a loss of control in the company. From the PM analysis of the three companies
within the UK jurisdiction above, the companies would not seem to be in a position to take on
increased debt for the reasons given by Levy and Sarnat (1994) regarding profit and sales
revenue. This is certainly not the case for Tesco which has suffered in terms of both profit
margins in the year 2015. Tesco CEO, Lewis announced the reasoning behind an increase in debt
at such a turmoil time for the company which was centred around a fear of losing control
associated with offering shares, as well as the fact that shares in Tesco lost a lot of value in 2014
amid an accounting scandal (Chambers, 2015). Increased debt has contributed significantly to the
loss accounted for in 2015 but is part of their turnaround strategy to increase business potential in
the future and facilitate geographic expansion. After a downgrade in Tesco’s bonds by the top
rating agencies in 2014, the company was under pressure to raise capital and maintain an

47
investment grade status. Being the most highly leveraged UK supermarket is worrying for rating
agencies such as Moody's. Hence why many assets were sold off in the past two years in an
attempt to reduce net debt. In its endeavour to maintain investment grade bonds, borrowing costs
for the company have increased, which is problematic for a company entrenched in debt
(Beardsworth, 2014).
(Figure 4.16: In 2015, all UK-domiciled companies increased leverage, especially Tesco)
Table 1 below summarises the findings of the DuPont analysis explained above
Year NPM X ATO = ROA X Leverage = ROE
2015 -0.75% X 2.168 = -1.63% X 3.913 = -6.36%
2014 1.49% X 2.148 = 3.20% X 3.569 = 11.42%
2013 1.90% X 2.236 = 4.25% X 3.537 = 15.03%
2012 2.36% X 2.225 = 5.25% X 3.554 = 18.66%
2011 2.37% X 2.15 = 5.10% X 3.376 = 17.20%
(Table 4.1: A summary of the findings from the DuPont analysis)

48
5.0 CONCLUSION
The aim of this paper was to conduct an exploratory analysis in order to gain greater
understanding of the financial performance and characteristics of the grocery retail
industry in three major economies from the period between 2011 and 2015. To do so, it
was important to present the available literature on the evolution of the industry, its
structure and important historical trends. From this we found that over the 100 year
history studied, the change in store format has been pivotal in driving growth in the
industry over the years and is likely to continue to do so. We saw an increase in size,
scale and variety, to then seeing a drawback from this. The industry is fast-paced,
constantly changing, highly competitive and concentrated. Incumbents in the industry
fight hard to maintain market share and increasingly tight margins. Increasing supply
chain efficiencies to keep costs low is paramount when these retailers are being put under
pressure from the emergence of ‘hard discounters’ to keep prices at rock bottom levels.
To counteract the slim profit margins that operate in this industry, incumbents focus
hugely on increasing footfall in stores, and thus, sales volume. What is more, they attempt
to do this in an industry characterised by disloyal consumers. The tight margins that
encapsulate the industry, combined with an increasingly competitive and concentrated
landscape, pushes retailers in search of other revenue avenues with many operating
various subsidiaries in unrelated areas and of course, expanding geographically to less-
mature, more promising markets. As such, incumbents will be constantly looking for the
next step in the industry’s evolution to stay one step ahead of their main competitors. In
the context of the future, developing an efficient hybrid organisation that operates a
sufficient online platform will be of paramount importance. At this point it proved
productive to conduct a competitive analysis of the industry as we see it today using
Porter’s five forces framework to do so. This further enhances understanding of the
industry, its profitability and where it is likely to go in the future. Through the analysis of
the five forces, it is possible to conclude why we would see margins in this industry that
are low in comparison to more high risk or less competitive ones. It is also possible to
conclude from the various literature sources that this intensely competitive industry is

49
unlikely to see a cooling down anytime soon. This was beneficial as it provides a
theoretical proxy for what we might expect to see from the quantitative financial
exploration.
To add depth to the literature and further enhance understanding of the industry, I
conducted a high-level quantitative exploration of the financial performance of three
grocery retail companies in the US, EU and the UK over a five year period using certain
financial metrics. An overview of a range of financial metrics for the industry sample
gives greater insight into financial performance and a cross-jurisdictional analysis allows
us to spot any interesting similarities and/or differences between different economies. The
sample size and methodology used were appropriate for the research here which in many
ways solidified what we would expect from the industry based on the insight gained from
the literature, such as extremely tight margins and high asset turnover. Present limitations
in terms of sample size, geographic reach and the issues associated with financial
statement analysis and financial ratio usage invites further research in the area. A DuPont
analysis was chosen to explain declining returns for the grocery retail industry over the
five year period. An exploration of profit margins, asset turnover and leverage help to
understand this overall decline in returns. In some cases, it was possible to dissect this
result by jurisdiction and by company which explain a possible skew of results for the
industry. On the whole, the EU and the US tend to have relatively stable results along the
metrics chosen which is not surprising considering the competitive nature of the industry,
the operation of similar business models and the industry’s maturity. However, the UK
presented some interesting results for a myriad of possible reasons that are considered.
The purpose of the research was to provide observations and gain some understanding of
the financial performance of the industry, not to explain why one economy may be
performing better or worse than another. Therefore, this dissertation acts as a basis for
future theoretical and quantitative investigation whereby a greater sample size and
analysis may enhance these findings. On a practical level, I will enter this industry with
greater knowledge of its characteristics, history and financial performance. As well as
gaining an understanding about the performance and strategy of Lidl’s competitors, which

50
is why it was important for me to include the US in my investigation, as Lidl plan an
extensive expansion into the US in the coming years.
The purpose of the research was to provide an understanding of the industry so that I
would be better equipped to enter this particular industry, and for that reason, the
dissertation aim was achieved.

51
REFERENCES
Alexander et al, 2008. Retail innovation and shopping practices: Consumers’ reaction to self
service retailing. Environment and planning Vol. 40, No. 9. Available at: <
http://epubs.surrey.ac.uk/107402/2/Alexander%20et%20al%20Retail%20Innovation%20and%20
Shopping%20Practices.pdf >
Aufreiter et al, 1999. Walking down the aisles: Consolidation in the grocery industry. Ivey
business journal Vol. 63, Issue. 3. Available at: <
http://eds.b.ebscohost.com.elib.tcd.ie/eds/detail/detail?sid=a7ecaee7-f5a8-4aab-89b1-
8efe37069cfa%40sessionmgr120&vid=0&hid=113&bdata=JnNpdGU9ZWRzLWxpdmU%3d#A
N=511104223&db=bft >
Baja, 2016. Metro AG reduces debt significantly in Q1 2016. Robur financial news. [Website].
Available at: < http://roburfinancialnews.com/metro-ag-reduces-debt-significantly-q1-2016/ >
Bank, 2016. Companies with high asset turnover and low profit margin. The Houston Chronicle.
[Newspaper]. Available at: < http://smallbusiness.chron.com/companies-high-asset-turnover-low-
profit-margin-76515.html >
Basker, 2016. Handbook of the economics of retailing and distribution. Edward Elgar publishing.
Available at: <
https://books.google.ie/books?id=EYteCwAAQBAJ&pg=PA374&lpg=PA374&dq=The+post-
war+period+was+a+period+of+boom+for+these+supermarkets&source=bl&ots=Z-2On-
rvYa&sig=pvbOOSKyu2GXZCKQoBNUf4Mc1mM&hl=en&sa=X&ved=0ahUKEwiN3ODWp-
vNAhUBJ8AKHbVzD3kQ6AEIJjAB#v=onepage&q=The%20post-
war%20period%20was%20a%20period%20of%20boom%20for%20these%20supermarkets&f=fa
lse >
Blackbook, 2009. Will consumer slowdown accelerate consolidation of the global food retail
industry. The long view - 2009 ed. Available at: <
http://eds.b.ebscohost.com.elib.tcd.ie/eds/pdfviewer/pdfviewer?sid=9e1edfc6-4162-470a-926d-
fa6170ba3dfd%40sessionmgr104&vid=0&hid=113 >

52
Bloom and Perry, 2015. Retailer power and supplier welfare: The case of Wal-Mart. Journal of
retailing Vol. 77, Issue 3. Available at: <
http://eds.b.ebscohost.com.elib.tcd.ie/eds/detail/detail?sid=8aa706fa-0552-417c-a0e1-
90c9ac669b15%40sessionmgr101&vid=0&hid=113&bdata=JnNpdGU9ZWRzLWxpdmU%3d#A
N=5206591&db=bth >
Bls.gov.uk, 2015. Consumer expenditures - 2014. Economic news release. Bureau of labor
statistics. Available at: < http://www.bls.gov/news.release/cesan.nr0.htm >
Borraz et al, 2014. Supermarket entry and the survival of small stores. Review of industrial
organisation. Available at: <
http://eds.b.ebscohost.com.elib.tcd.ie/eds/pdfviewer/pdfviewer?sid=9d8d37a1-15b8-4bda-8179-
fc6239651149%40sessionmgr120&vid=0&hid=113 >
Branch, 1999. Inside the cult of Costco: Diamonds, and tires, and bras, oh, my! Fortune vol. 140,
issue. 5. Available at: < http://eds.b.ebscohost.com.elib.tcd.ie/eds/detail/detail?sid=52036641-
b114-4057-b7db-
8c39308b97a8%40sessionmgr107&vid=0&hid=113&bdata=JnNpdGU9ZWRzLWxpdmU%3d#A
N=2182013&db=bth >
Briggs & Goldman, 2006. Food retail report - US grocery stores. Yale school of management.
Available at: < http://analystreports.som.yale.edu/reports/grocerystores.pdf >
Burch et al, 2013. Watchdogs and ombudsmen: monitoring the abuse of supermarket power.
Agricultural and human values. Available at: <
http://eds.b.ebscohost.com.elib.tcd.ie/eds/pdfviewer/pdfviewer?sid=dbe3b64f-5cec-4d44-be34-
1d4b56e953e2%40sessionmgr107&vid=0&hid=113 >
Burt and Sparks, 2003. Power and competition in the UK retail grocery market. British journal of
management Vol. 14. Available at: <
http://eds.b.ebscohost.com.elib.tcd.ie/eds/pdfviewer/pdfviewer?sid=d7db6c9a-9e80-465c-b65f-
480823caef3e%40sessionmgr102&vid=0&hid=113 >

53
Carrefour.com, 2016. Group: Carrefour stores worldwide. [Company website]. Available at: <
http://www.carrefour.com/content/carrefour-stores-worldwide >
Cascio, 2006. Decency means more than “always low prices”: A comparison of Costco to
Walmart’s Sams Club. Academy of marketing perspectives. Available at: <
http://eds.a.ebscohost.com.elib.tcd.ie/eds/pdfviewer/pdfviewer?sid=144d8704-21d2-43e3-9528-
0da89dcbaf32%40sessionmgr4005&vid=0&hid=4105 >
Ceeretail.com, 2015. Auchan and Metro Group are Russia’s largest international companies.
Available at < http://www.ceeretail.com/news/250327/auchan-and-metro-group-are-russias-
largest-international-companies >
Checkout.com, 2014. Metro and Auchan form purchasing partnership. Vol. 40, No. 11. Available
at: < http://eds.a.ebscohost.com.elib.tcd.ie/eds/pdfviewer/pdfviewer?sid=0d0c605a-1cf7-4c58-
8cbe-ce4db25b1ff4%40sessionmgr4001&vid=0&hid=4105 >
Clereen et al, 2010. Intra and interformat competition among discounters and supermarkets.
Marketing science Vol. 29, no.3. Available at: <
http://eds.a.ebscohost.com.elib.tcd.ie/eds/pdfviewer/pdfviewer?sid=4918f4d9-73e6-43bf-9d42-
ea3d6eec8c9c%40sessionmgr4005&vid=0&hid=4105 >
Coles, 2015. Sainsbury’s to have more convenience stores than traditional ones. AOL. [Website].
Available at: < http://money.aol.co.uk/2015/03/27/sainsbury-s-to-have-more-convenience-stores-
than-traditional-one/ >
Coolidge, 2016. Kroger’s $4 billion expansion plan. Available at: <
http://www.cincinnati.com/story/money/2016/05/20/krogers-big-4-billion-expansion-
plan/84539400/ >
Corstjens & Vanderheyden, 2010. Competition, risk and return in the US grocery industry.
Review of marketing science Vol. 8, Article. 2. Available at: <
http://eds.b.ebscohost.com.elib.tcd.ie/eds/pdfviewer/pdfviewer?sid=3d903f7a-de60-4322-bfd2-
ca5a3b956480%40sessionmgr106&vid=0&hid=113 >

54
Costco.com, 2016. About us. [Company Website]. Available at: <
http://www.costco.com/about.html >
Datamonitor, 2011. Company profile: Carrefour: Hypermarket reinvention. Available at: <
http://eds.b.ebscohost.com.elib.tcd.ie/eds/pdfviewer/pdfviewer?sid=a31532c8-e520-45b7-8051-
4dfb571ea939%40sessionmgr120&vid=0&hid=113 >
Datamonitor, 2010. Costco: The pinnacle of value. Available at: <
http://eds.b.ebscohost.com.elib.tcd.ie/eds/pdfviewer/pdfviewer?sid=780ea3af-8a22-4aed-a91c-
0988bfb4491e%40sessionmgr107&vid=0&hid=113 >
Dobson & Chakraborty, 2008. Buying power in the UK groceries market. The antitrust bulletin
Vol. 53, No. 2. Available at: <
http://eds.a.ebscohost.com.elib.tcd.ie/eds/pdfviewer/pdfviewer?sid=72cd334c-4f9c-4c25-848d-
d4c7b29a8e1d%40sessionmgr4004&vid=0&hid=4105 >
Dobson, Waterson and Chu, 1998. The welfare consequences of the exercise of buying power.
Available at: <
https://www.researchgate.net/publication/37142835_The_welfare_consequences_of_the_exercise
_of_buyer_power >
Dries et al, 2004. The rapid rise of supermarkets in central and eastern Europe: implications for
the agrifood sector and rural development. Development policy review. Available at: <
http://citeseerx.ist.psu.edu/viewdoc/download?doi=10.1.1.471.5370&rep=rep1&type=pdf >
Duff & Phelps, 2016. Industry insights: food retail industry insights - 2016. Available at: <
http://www.duffandphelps.com/assets/pdfs/publications/mergers-and-acquisitions/industry-
insights/consumer/food-retail-industry-insights-2016.pdf >
Ellickson, 2013. Supermarkets as a natural oligopoly. Economic inquiry. Available at: <
http://eds.b.ebscohost.com.elib.tcd.ie/Legacy/Views/static/html/Error.htm?aspxerrorpath=/eds/pdf
viewer/pdfviewer >

55
Ellickson, 2015. The evolution of the supermarket industry: From A&P to Walmart. [pdf].
Available at: < http://paulellickson.com/SMEvolution.pdf >
Fishman, 2006. The Walmart effect and a decent society: Who knew shopping was so important?
Available at: < http://eds.a.ebscohost.com.elib.tcd.ie/eds/pdfviewer/pdfviewer?sid=80bde40c-
f23b-4438-af09-0bcf76ccb072%40sessionmgr4004&vid=0&hid=4105 >
Gerrard & Cartmell, 2014. Restaurant and Casual Dining Insight Report 2014. Ernest and young.
[pdf]. Available at: < http://www.ey.com/Publication/vwLUAssets/EY_-
_Restaurant_and_Casual_Dining_Insight_Report/$FILE/EY-casual-dining-report.pdf >
Glandon & Jaremski, 2014. Sales and firm entry: The case of Wal-Mart. Southern economic
journal. Available at: <
http://eds.b.ebscohost.com.elib.tcd.ie/eds/pdfviewer/pdfviewer?sid=096f4b75-d732-44d3-9aa8-
c35baccb5e7b%40sessionmgr103&vid=0&hid=113 >
Goldschmidt et al, 2016. Driving health in-store requires the co-operation of various stakeholders.
Spund strategies Vol. 95, issue 3. Available at: <
http://eds.b.ebscohost.com.elib.tcd.ie/eds/detail/detail?sid=5ea8432f-f37d-426d-a5ce-
5491bf44cc04%40sessionmgr101&vid=0&hid=113&bdata=JnNpdGU9ZWRzLWxpdmU%3d#A
N=113507258&db=bft >
Green, 2015. Retail rap: The grocery evolution. Chain Store Age. [website]. Available at: <
http://www.chainstoreage.com/article/retail-rap-grocery-evolution >
Groupe-Auchan.com, 2016. Who is Auchan? Story. [Company website]. Available at: <
http://www.groupe-auchan.com/en/who-is-auchan/story/ >
Hanner et al, 2015. Dynamics in a mature industry: Entry, exit and growth of big box grocery
retailers. Journal of economics and management strategy. Available at: <
http://eds.b.ebscohost.com.elib.tcd.ie/eds/pdfviewer/pdfviewer?sid=78e761a0-d0fa-45df-b995-
10d277e7356a%40sessionmgr102&vid=0&hid=113 >

56
Hattersley et al, 2013. Supermarket power, own-labels, and manufacturer counterstrategies:
international relations of cooperation and competition in the fruit canning industry. Agricultural
human values. Available at: <
http://eds.b.ebscohost.com.elib.tcd.ie/Legacy/Views/static/html/Error.htm?aspxerrorpath=/eds/pdf
viewer/pdfviewer >
Hobbs, 2016. Morrisons rebrands as it focuses on being ‘surprisingly good’ at pricing. Marketing
Week. Available at < http://eds.b.ebscohost.com.elib.tcd.ie/eds/detail/detail?sid=1ffb2acc-6944-
476f-9437-
c51954d28431%40sessionmgr104&vid=0&hid=113&bdata=JnNpdGU9ZWRzLWxpdmU%3d#A
N=113655929&db=bth >
Hogan and Hutson, 2015. Capital structure in new technology firms: Evidence from the Irish
Software Sector. [pdf]. Available at: < http://www.ucd.ie/t4cms/HUTSON_2004_CF.pdf >
Hortacsu & Syverson, 2015. The on-going evolution of US retail: A format of tug-of-war. Journal
of economic perspectives. Vol. 29, no. 4. Available at: <
http://eds.b.ebscohost.com.elib.tcd.ie/eds/pdfviewer/pdfviewer?sid=e4d64b3b-adba-4c58-a17e-
dc45e3d611a2%40sessionmgr107&vid=0&hid=113 >
Hutchison, 2016. Home straights Sainsbury’s wins board backing for £1.4m Argos takeover.
Available at: <http://eds.b.ebscohost.com.elib.tcd.ie/eds/detail/detail?sid=d4729649-5d95-4cb0-
b6e0-
d4f77a116fa8%40sessionmgr104&vid=0&hid=113&bdata=JnNpdGU9ZWRzLWxpdmU%3d#A
N=114149949&db=ukh>
Igami, 2011. Does big drive out small? Entry, exit and differentiation in the supermarket industry.
Review of industrial organisation. Available at: <
http://eds.a.ebscohost.com.elib.tcd.ie/eds/pdfviewer/pdfviewer?sid=1120d3d0-6396-4838-96c4-
6c60da86ec88%40sessionmgr4003&vid=0&hid=4105 >
IGD.com, 2016. Global grocery markets: Our forecasts to 2020. Available at: <
http://www.igd.com/Research/Retail/Global-grocery-markets-our-forecasts-to-2020/ >

57
Jackson, 2005. Acquisition dangers. Available at: < http://www.growthbusiness.co.uk/growing-a-
business/merger-and-acquisition/2304/acquisition-dangers.thtml >
Jamrisko, 2015. Americans’ spending on dining out just overtook grocery sales for the first time
ever. Bloomberg. [Newspaper]. Available at: < http://www.bloomberg.com/news/articles/2015-
04-14/americans-spending-on-dining-out-just-overtook-grocery-sales-for-the-first-time-ever >
J-Sainsbury.co.uk, 2016. Abous us: 145 years of history. [Company Website]. Available at: <
http://www.j-sainsbury.co.uk/about-us/145-years-of-history/20th-century/#tabbed_section >
Kantarworldpanel, 2016. Grocery market share: Great Britain. [website]. Available at: <
http://www.kantarworldpanel.com/en/grocery-market-share/great-
britain/snapshot/19.06.16/22.05.16 >
Kell, 2015. Dancing in teh Aisles. Fortune Vol. 172, issue. 8. Available at: <
http://eds.b.ebscohost.com.elib.tcd.ie/eds/detail/detail?sid=104caaf0-2bf7-4aae-8e2c-
680339b3f355%40sessionmgr102&vid=0&hid=113&bdata=JnNpdGU9ZWRzLWxpdmU%3d#A
N=111402633&db=bth >
Kelly, 2016. The Big Blue. Checkout. Available at: <
http://eds.a.ebscohost.com.elib.tcd.ie/eds/pdfviewer/pdfviewer?sid=fa0936ef-bba2-428b-903b-
b98caf21a0bb%40sessionmgr4002&vid=0&hid=4105 >
Korosec, 2015. Supermarket chains fail HFCs Survey. Environmental leader. Available at: <
http://www.environmentalleader.com/2013/10/17/supermarket-chains-fail-hfcs-
survey/?graph=full&id=1 >
Krafft & Mantralaa (2010), Retailing in the 21st century: Current and future trends. Springer. 2nd
ED. Available at: <
https://books.google.ie/books?id=rM9cJVWiceYC&pg=PA41&lpg=PA41&dq=metro+group+str
ategy&source=bl&ots=OcrUvcgUpg&sig=ZqnLivTH9maCU0olu4Q9rAg48x0&hl=en&sa=X&v
ed=0ahUKEwj_jIuzl_TNAhUcOsAKHXxUBMcQ6AEIMzAG#v=onepage&q=metro%20group
%20strategy&f=false >

58
Krogercorp.usdphosting.com, 2016. Operations: Manufacturing: About. [Company website].
Available at: < http://krogercorp.usdphosting.com/operations/operations_manufacturing.htm >
Kumar, 2006. Strategies to fight low-cost rivals. Harvard Business Review. Available at: <
https://hbr.org/2006/12/strategies-to-fight-low-cost-rivals >
Marketline.com, 2013. Industry profile: Food retail in Europe. Available at: <
http://eds.a.ebscohost.com.elib.tcd.ie/eds/pdfviewer/pdfviewer?sid=364f5e9a-c5eb-4d0b-8256-
5bbc3c81c706%40sessionmgr4004&vid=0&hid=4105 >
Marketline, 2016. Company profile: Tesco. Available at: <
http://eds.b.ebscohost.com.elib.tcd.ie/eds/pdfviewer/pdfviewer?sid=3fdbcf57-d05c-4c51-b44c-
73234fcdc4c5%40sessionmgr103&vid=0&hid=113 >
Marketline, 2016. Company profile: Walmart. Available at: <
http://eds.a.ebscohost.com.elib.tcd.ie/eds/pdfviewer/pdfviewer?sid=12f5eae0-1571-4f58-88b9-
593c7461af2f%40sessionmgr4002&vid=0&hid=4105 >
Marketline.com, 2016. Company profile: Kroger. Available at: <
http://eds.b.ebscohost.com.elib.tcd.ie/eds/pdfviewer/pdfviewer?sid=f7a1863c-5be9-4bce-a04c-
19d2b955da39%40sessionmgr104&vid=0&hid=113 >
Marketline.com, 2015. Company profile: Groupe Auchan S.A. Available at: <
http://eds.b.ebscohost.com.elib.tcd.ie/eds/pdfviewer/pdfviewer?sid=952fb811-0afc-4b27-a132-
04a9b1c1d9a9%40sessionmgr107&vid=0&hid=113 >
Martin et al., 2016. Carrefour meets expectations as improvement continues. The Financial
Times. [Newspaper]. Available at: < http://www.ft.com/fastft/2016/03/10/carrefour-meets-
expectations-as-improvement-continues/ >
Mass grocery retail, 2009. Germany food and drink report. Available at: <
http://eds.a.ebscohost.com.elib.tcd.ie/eds/pdfviewer/pdfviewer?sid=2eedac6a-578d-4cc5-a352-
e5107b2c8fdf%40sessionmgr4003&vid=0&hid=4105 >

59
Matlak, 2009. Auchan: Wal mart’s tough new global rival. Business week online. Available at: <
http://eds.b.ebscohost.com.elib.tcd.ie/eds/detail/detail?sid=58bd9618-8cd8-4470-9d63-
44b5da871dce%40sessionmgr120&vid=0&hid=113&bdata=JnNpdGU9ZWRzLWxpdmU%3d#A
N=44894170&db=bth >
Mattera, 2005. Fighting chain stores past and present: The roots of the campaign against Wal-
mart. Corporate research project. Available at: < http://www.corp-research.org/e-letter/fighting-
chains-stores-past-and-present >
McTaggart, 2012. Full circle. Progressive grocer Vol. 91, Issue. 12. Available at: <
http://eds.a.ebscohost.com.elib.tcd.ie/eds/detail/detail?sid=45851743-8cae-49bb-bca8-
1de1ccf12338%40sessionmgr4003&vid=0&hid=4105&bdata=JnNpdGU9ZWRzLWxpdmU%3d#
AN=84544933&db=bft >
Morrisons-corporate.com, 2016. About us: Company history. [Company Website]. Available at: <
http://www.morrisons-corporate.com/about-us/company-history/ >
O’Keefe, 2015. The chosen one. Fortune. Vol. 171, Issue 8. Available at: <
http://eds.a.ebscohost.com.elib.tcd.ie/eds/detail/detail?sid=28afb58d-556c-477e-8f2d-
2cccee0e8ccd%40sessionmgr4001&vid=0&hid=4105&bdata=JnNpdGU9ZWRzLWxpdmU%3d#
AN=103123799&db=bth >
Plumer, 2015. Map: Here's how much each country spends on food. Energy and environment.
[Newspaper]. Available at: < http://www.vox.com/2014/7/6/5874499/map-heres-how-much-
every-country-spends-on-food >
Pope, 2016. Combined Lidl, Aldi market share nears leader Supervalu. The Irish Times
[Newspaper}. Available at: < http://www.irishtimes.com/news/consumer/combined-lidl-aldi-
market-share-nears-leader-supervalu-1.2640076 >
Porter, 2008. The five competitive forces that shape strategy. The Harvard Business Review.
Available at: < https://hbr.org/2008/01/the-five-competitive-forces-that-shape-strategy >

60
Progressivegrocer.com, 2016. The super 50: Ripple effect. <
http://eds.a.ebscohost.com.elib.tcd.ie/eds/pdfviewer/pdfviewer?sid=ff6cea03-6042-454a-9aad-
4b3148d404eb%40sessionmgr4005&vid=0&hid=4105 >
Ridsdale, 2016. Consumer Confidence Barometer: Brexit Special. [GFK Press Release].
Available at: <
http://www.gfk.com/fileadmin/user_upload/dyna_content/Global/documents/Press_Releases/2016
/20160707_CCB_UK_Brexit_special.pdf >
Roberts, 2004. Auchan’s internationalisation: Waaoh, wow or woe? European retail digest.
Available at: < http://eds.b.ebscohost.com.elib.tcd.ie/eds/pdfviewer/pdfviewer?sid=ce0505c4-
1e48-46ed-8f98-e91c26586b29%40sessionmgr101&vid=0&hid=113 >
Roderick, 2016. Amazon’s tie-up with Morrisons will force e-commerce innovation. Marketing
week. [Newspaper]. Available at: <
http://eds.b.ebscohost.com.elib.tcd.ie/eds/pdfviewer/pdfviewer?sid=61d5d352-d798-42fb-9b18-
c1bf07b46c54%40sessionmgr104&vid=0&hid=113 >
Ruddick, 2015. Why do British retailers get it so wrong overseas? The Telegraph. [Newspaper].
Available at: <
http://www.telegraph.co.uk/finance/newsbysector/retailandconsumer/11575184/After-Sainsburys-
Egyptian-drama-why-do-British-retailers-get-it-so-wrong-overseas.html >
Ruddick, 2015. Sainsbury’s falls to first loss for a decade. The Telegraph. [Newspaper]. Available
at a: < http://www.telegraph.co.uk/finance/newsbysector/epic/sbry/11585124/Sainsburys-falls-to-
first-loss-for-a-decade.html >
Salmon, 2015. Discounters gain on top four grocers. Daily Mail [newspaper]. Available at: <
http://eds.a.ebscohost.com.elib.tcd.ie/eds/detail/detail?sid=ef96381d-6011-4126-8e0b-
c8058f48e1e7%40sessionmgr4003&vid=0&hid=4105&bdata=JnNpdGU9ZWRzLWxpdmU%3d#
AN=109085027&db=ukh >
Shah, 2014. German discounters are spinning in the aisles. UK and Ireland reference centre.
Available at: < http://eds.a.ebscohost.com.elib.tcd.ie/eds/detail/detail?sid=525703a2-19df-4e6f-

61
98c7-
c209da6d14e2%40sessionmgr4004&vid=0&hid=4105&bdata=JnNpdGU9ZWRzLWxpdmU%3d
#AN=7EH93452940&db=ukh>
Simms, 2014. Tesco: why did it all go so wrong? The Guardian. [Newspaper]. Available at: <
https://www.theguardian.com/commentisfree/2014/sep/22/tesco-pursuit-of-profit-britains-biggest-
supermarket >
Smith, 2006. The Australian grocery industry: a competitive perspective. The Australian journal
of agricultural and resource economics. Available at: <
http://eds.a.ebscohost.com.elib.tcd.ie/eds/pdfviewer/pdfviewer?sid=2279374e-35f6-4114-842a-
32d23188eb1b%40sessionmgr4001&vid=0&hid=4105 >
Smollen, 2015. Morrisons’ profits dive amid change at the top. British Baker. Available at: <
http://eds.b.ebscohost.com.elib.tcd.ie/eds/detail/detail?sid=cf56577a-3b50-4bd4-96ef-
da58764cc44e%40sessionmgr102&vid=0&hid=113&bdata=JnNpdGU9ZWRzLWxpdmU%3d#A
N=101655898&db=bth >
Soni, 2016. What's the advantage of Costco’s retail model? Available at: <
http://marketrealist.com/2016/01/analyzing-costcos-retail-model-store-productivity/ >
Sotgiu and Gielens, 2015. Suppliers caught in supermarket price wars: Victims of victors?
Insights from a Dutch price war. Journal of marketing research. Available at: <
http://eds.b.ebscohost.com.elib.tcd.ie/eds/pdfviewer/pdfviewer?sid=bdcf58fc-f84a-4fae-90a3-
1c54f9915bf6%40sessionmgr101&vid=0&hid=113 >
Souza, 2016. German discounters Lidl adds double threat to Walmart’s model. [online]. Available
at: < http://talkbusiness.net/2016/03/german-discounter-lidl-adds-double-threat-to-walmarts-
model/ >
Springer & Zwiebach, 2016. 10 retail brands that will grow in 2016. Supermarket news. Vol. 65.
Issue. 6. Available at: < http://eds.b.ebscohost.com.elib.tcd.ie/eds/detail/detail?sid=ea31c66c-
5aad-4eb0-8e10-

62
d9ed49bcb7b1%40sessionmgr104&vid=0&hid=113&bdata=JnNpdGU9ZWRzLWxpdmU%3d#A
N=115965291&db=bft >
Stanikunas, 2010. Buyer power: Its economic concept and competition. Transformation in
business & economics Vol. 9, No. 1. Available at: <
http://eds.a.ebscohost.com.elib.tcd.ie/eds/pdfviewer/pdfviewer?sid=c2eb3110-42bb-45fc-bbdf-
8900ee1ad7a7%40sessionmgr4001&vid=0&hid=4105 >
Stefanska & Bilinska-Reformat, 2015. Influence of the global crisis on customer purchase
behaviour versus changes in the retail commerce. Review of business. Available at: <
http://eds.b.ebscohost.com.elib.tcd.ie/eds/pdfviewer/pdfviewer?sid=cd3a2e0b-cf5c-4f43-bc82-
797d4f370b83%40sessionmgr102&vid=0&hid=113 >
Steffy, 2016. Walmart wants to win the supermarket war in Texas: Has it met its match in H-E-B?
Texas Monthly. Available at: <
http://eds.a.ebscohost.com.elib.tcd.ie/eds/pdfviewer/pdfviewer?sid=20d93977-392b-43e6-9b73-
ba842e2d4114%40sessionmgr4001&vid=0&hid=4105 >
SupermarketNews, 2016. Grocery revolution or Evolution? Supermarket News. [newspaper
article]. Vol.64, issue 5. Available at: <
http://eds.b.ebscohost.com.elib.tcd.ie/eds/detail/detail?sid=2c4e698a-5eaf-4990-b5f5-
31eab14eabbb%40sessionmgr104&vid=0&hid=113&bdata=JnNpdGU9ZWRzLWxpdmU%3d#A
N=115249350&db=bft >
Tackett, 2014. European Grocery Retailing: Change is the Only Constant. Planetretail.com
[Online]. Available At: <https://www.planetretail.net/presentations/ApexBrasilPresentation.pdf >
Taylor, 2015. Kroger is building the grocery store of the future. Business Insider UK.
[Newspaper]. Available at: <http://uk.businessinsider.com/krogers-grocery-store-of-the-future-
2015-11?r=US&IR=T>
Telesca, 2015. Retail royalty: Kroger stay true to strategy while looking ahead. Supermarket news
Vol. 63, Issue. 4. Avaialble at: <
http://eds.a.ebscohost.com.elib.tcd.ie/eds/detail/detail?sid=745595b5-0eac-46ab-968d-

63
f5bb04f25724%40sessionmgr4003&vid=0&hid=4105&bdata=JnNpdGU9ZWRzLWxpdmU%3d#
AN=102111179&db=bth >
Tescoplc.com, 2016. About us: Company history. [company website]. Available at: <
https://www.tescoplc.com/about-us/history/ >
Van Looveren, 2016. Georges Plassat (Carrefour) still believes in physical stores. Retail Detail.
Available at: < http://www.retaildetail.eu/en/news/georges-plassat-carrefour-still-believes-
physical-stores >
Walmartrealty.com, 2016. In-store leasing from Walmart Realty. Walmartrealty.com. [Company
website]. Available at: < http://www.walmartrealty.com/instoreleasing/ >
Williem de Jongste, 2016. Research: Aldi and Lidl are set to benefit most from Brexit. Fresh
Plaza {Newspaper]. Available at: < http://www.freshplaza.com/article/159891/Research-Aldi-
and-Lidl-are-set-to-benefit-most-from-Brexit >
Wortmann, 2004. Aldi and the German Model: structural change in German grocery retailing and
the success of grocery discounters. Competition and change. Available at: <
http://eds.b.ebscohost.com.elib.tcd.ie/eds/pdfviewer/pdfviewer?sid=b20d4a6d-0057-4708-8486-
0c5eb44f84de%40sessionmgr102&vid=0&hid=113 >
Yeomans, 2016. Sainsbury's sales fall as Tesco stabilizes in latest supermarket Scrap. The
Telegraph. [Newspaper]. Available at: <
http://www.telegraph.co.uk/business/2016/06/01/sainsburys-sales-fall-as-tesco-stabilises-in-latest-
supermarket/ >
Yhi-Chearang et al, 2006. Carrefour’s global reach: A case study of its strategy. Journal of
American Academy of Business Cambridge. Vol. 9, no. 1. Available at: <
http://eds.b.ebscohost.com.elib.tcd.ie/eds/pdfviewer/pdfviewer?sid=0bdaecb8-6dfa-435f-a0d8-
8211084c2aaa%40sessionmgr120&vid=0&hid=113 >

64
Appendices Appendix 1: Abbreviations
1. EU - European Union
2. UK - United Kingdom
3. US - United States
4. ROA - return on assets
5. ROE - return on equity
6. ATO - asset turnover
7. PM - profit margins

65
Appendix 2: Graphical representation of industry averages across all eleven financial metrics chosen as part of the sample and by jurisdiction averages
1. Revenue growth 2. Return on equity
3. Net profit margin

66
4. Return on assets
5. Leverage
6. Liabilities/ Liabilities + Equity

67
7. Borrowings/ Borrowings + Equity
8. Receivable collection period
9. Asset turnover

68
10. Cash flow/net income
11. Gross profit Percentage