FINAL SUPPLEMENTAL ENVIRONMENTAL IMPACT STATEMENT …€¦ · emit magnetic and electric fields....
12
FINAL SUPPLEMENTAL ENVIRONMENTAL IMPACT STATEMENT FOR THE CROTON WATER TREATMENT PLANT AT THE MOSHOLU SITE 6.17. ELECTRIC AND MAGNETIC FIELDS (EMF) AND EXTREMELY LOW FREQUENCY FIELDS (ELF) ANALYSIS .............................................................................. 1 6.17.1. Introduction ............................................................................................................. 1 6.17.2. Baseline Conditions ................................................................................................ 1 6.17.2.1. Existing Conditions......................................................................................... 1 6.17.2.2. Future Without the Project .............................................................................. 4 6.17.3. Potential Impacts..................................................................................................... 4 6.17.3.1. Potential Project Impacts ................................................................................ 4 6.17.3.2. Potential Construction Impacts ..................................................................... 10 FIGURE 6.17-1. EMF AND ELF MOSHOLU SITE.................................................................... 3 FIGURE 6.17-2. PROPOSED FEEDER LOCATION PLAN MOSHOLU SITE ......................... 5 TABLE 6.17-1. EXISTING ELECTRIC AND MAGNETIC FIELD DATA FOR THE MOSHOLU SITE ................................................................................................................... 2 TABLE 6.17-2. EXISTING ELECTRIC AND MAGNETIC FIELD DATA FOR THE FEEDER DISTRIBUTION LINES (MT. VERNON TO THE BRONX) .............................................. 6 TABLE 6.17-3. MAGNETIC FIELD LEVELS FROM POINT SOURCES IN THE EXISTING WPCPS ................................................................................................................................... 7 TABLE 6.17-4. ESTIMATED MAGNETIC FIELD LEVELS FROM POINT SOURCES IN THE PROPOSED PLANT ..................................................................................................... 7 TABLE 6.17-5. ESTIMATION OF PROPOSED PLANT LINE SOURCE MAGNETIC FIELD STRENGTH............................................................................................................................ 9
Transcript of FINAL SUPPLEMENTAL ENVIRONMENTAL IMPACT STATEMENT …€¦ · emit magnetic and electric fields....
FINAL SUPPLEMENTAL ENVIRONMENTAL IMPACT STATEMENT FOR THE CROTON WATER TREATMENT PLANT
AT THE MOSHOLU SITE
6.17. ELECTRIC AND MAGNETIC FIELDS (EMF) AND EXTREMELY LOW FREQUENCY FIELDS (ELF) ANALYSIS .............................................................................. 1
6.17.1. Introduction............................................................................................................. 1 6.17.2. Baseline Conditions ................................................................................................ 1
6.17.2.1. Existing Conditions......................................................................................... 1 6.17.2.2. Future Without the Project.............................................................................. 4
6.17.3. Potential Impacts..................................................................................................... 4 6.17.3.1. Potential Project Impacts ................................................................................ 4 6.17.3.2. Potential Construction Impacts ..................................................................... 10
FIGURE 6.17-1. EMF AND ELF MOSHOLU SITE.................................................................... 3 FIGURE 6.17-2. PROPOSED FEEDER LOCATION PLAN MOSHOLU SITE ......................... 5 TABLE 6.17-1. EXISTING ELECTRIC AND MAGNETIC FIELD DATA FOR THE
MOSHOLU SITE ................................................................................................................... 2 TABLE 6.17-2. EXISTING ELECTRIC AND MAGNETIC FIELD DATA FOR THE FEEDER
DISTRIBUTION LINES (MT. VERNON TO THE BRONX).............................................. 6 TABLE 6.17-3. MAGNETIC FIELD LEVELS FROM POINT SOURCES IN THE EXISTING
WPCPS ................................................................................................................................... 7 TABLE 6.17-4. ESTIMATED MAGNETIC FIELD LEVELS FROM POINT SOURCES IN
THE PROPOSED PLANT ..................................................................................................... 7 TABLE 6.17-5. ESTIMATION OF PROPOSED PLANT LINE SOURCE MAGNETIC FIELD
STRENGTH............................................................................................................................ 9

6.17. ELECTRIC AND MAGNETIC FIELDS (EMF) AND EXTREMELY LOW FREQUENCY FIELDS (ELF) ANALYSIS 6.17.1. Introduction Electric and Magnetic Fields (EMF) surround any electrical devices that carry an electrical charge and/or current. Electric fields exist near electric equipment or devices that carry an electrical current (e.g. home appliances that are plugged into electrical outlets). They are present even when the equipment is turned off, as long as it remains connected to the source of electric power. Magnetic fields are emitted when electrical equipment is operated or the current is being transmitted. Magnetic fields can pass through most materials, while electric fields are easily shielded or weakened by conducting objects such as trees and buildings. Conducting materials also weaken magnetic fields, but not to the same degree as they do it to electric fields. The magnitude of both types of fields decreases with distance from their sources. Fields generated by electric current that is typically transmitted at 50 to 60 cycles per second are considered Extremely Low Frequency (ELF) fields. An evaluation of electric and magnetic fields under existing and future conditions was conducted to identify potential impacts that could result from the proposed Croton Water Treatment Plant (WTP) project. Measurements were taken around and within the perimeter of the water treatment plant site and along the feeder lines, which would supply power to the proposed project, extending from Washington Street substation in Mount Vernon to the Bronx, NY. The methodology used to prepare this analysis is presented in Section 4.17, Data Collection and Impact Methodologies, Electric and Magnetic Fields (EMF) and Extremely Low Frequency Fields (ELF) Analysis. 6.17.2. Baseline Conditions In order to properly evaluate electric and magnetic fields, point sources and line sources measurements were taken. Point sources are specific sources, such as stationary equipment, that emit magnetic and electric fields. Line sources, such as power lines, also emit magnetic and electric fields. The main difference between the two sources is the rate of decay of the magnetic fields they produce (detailed information is presented in Section 4.17, Data Collection and Impact Methodologies, EMF/ELF). Point source magnetic fields decrease inversely with the cube of the distance, while line source magnetic fields decrease inversely with the square of the distance. While there are no official standards or guidelines, this analysis compares measured electric and magnetic field data to the general guidelines of the International Radiation Protection Association (IRPA) general public limit and the New York State Right-of-way (NYSROW) maximum guidelines for electric and magnetic fields.
6.17.2.1. Existing Conditions
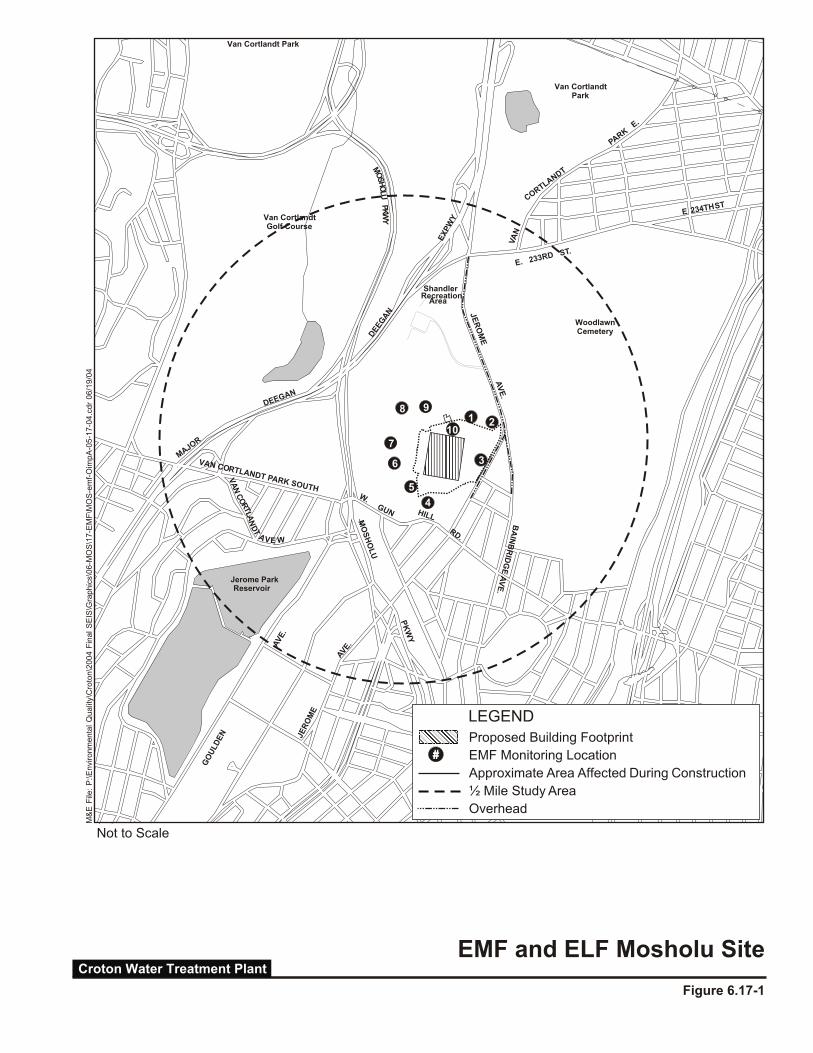
Electric and magnetic field measurements were conducted in July 1998 at the water treatment plant site. Feeder line measurements were conducted in March and July 1998. The sampling locations, from M1-M10, are marked on Figure 6.17-1. Measurements for these locations are summarized in Table 6.17-1. Existing feeder lines are also shown on Figure 6.17-1.
Final SEIS MOSEMF 1

The electric and magnetic fields measurements were performed at the water treatment plant site using the Holaday meter, following procedures outlines in Section 4.17, Data Collection and Impact Methodologies, Electric and Magnetic Fields (EMF) and Extremely Low Frequency Fields (ELF) Analysis.
6.17.2.1.1. Point Sources
The magnetic fields measured in July 1998 by the Holaday meter ranged from 0.00012 to 0.00052 Gauss (see Table 6.17-1). These values are well below the International Radiation Protection Association (IRPA) general public limit of 1.0 Gauss. IRPA issued interim standards for electric and magnetic field exposure limits for the general public in 1990 based upon 1984 World Health Organization Guidelines. In addition, New York State (NYS) uses informal guidelines to limit electric and magnetic field strengths along rights-of-way (ROW) for overhead power transmission lines. These guidelines have been designed to ensure that field levels around new transmission lines do not exceed those around existing transmission lines. Currently, there are no existing guidelines specifically for underground distribution lines. As presented in Table 6.17-1, the magnetic field data are well below the NYSROW maximum guideline for magnetic field strength of 0.2 Gauss. The electric fields measured in July 1998 by the Holaday meter ranged from 1.35 to 1.41 volts/meter (V/m). These values are well below the IRPA general public limit for electric field strength of 5,000 V/m. Likewise, they are below the NYSROW maximum guidelines for electric field of 11,800 V/m. Table 6.17-1 also shows the summarized electric fields measured in July 1998.
TABLE 6.17-1. EXISTING ELECTRIC AND MAGNETIC FIELD DATA FOR THE MOSHOLU SITE
Sample Location Holaday Magnetic Field
Gauss July 1998
Holaday Electric Field Volts/Meter
July 1998 M1 0.00019 1.41 M2 0.00019 1.41 M3 0.00019 1.41 M4 0.00019 1.41 M5 0.00019 1.41 M6 0.00019 1.41 M7 0.00019 1.35 M8 0.00019 1.35 M9 0.00019 1.35 M10 0.00019 1.35
Final SEIS MOSEMF 2
A VE W
GO
ULD
EN
Reservoir
MO
SH
OL
U
PK
WY
JER
OM
E
ReservoirHillview
RD.
VA
NC
RTLA
NDT
AreaRecreation
DEEG
AN
EX
PW
Y
MOSHO
LUPK
WY
O
DEEGAN
Jerome Park
Shandler
MAJOR
W.GUN HILL
VAN CORTLANDT PARK SOUTH
AVE.AV
E.
JE
RO
ME
AV
E.
BA
INB
RID
GE
AV
E.
E 234THST
E. 233RD ST.
VA
N
CORTLANDT
PARK E.
Van Cortlandt Park
Van Cortlandt Golf Course
Woodlawn Cemetery
Van Cortlandt Park
Temporary Club House
Temporary Club Parking
3
4
5
6
2110
7
8 9
Figure 6.17-1
EMF and ELF Mosholu SiteCroton Water Treatment Plant
Not to Scale
M&
E F
ile:
P:\E
nvi
ron
me
nta
l Q
ua
lity\
Cro
ton
\20
04
Fin
al
SE
IS\G
rap
hic
s\0
6-M
OS
\17
-EM
F\M
OS
-em
f-O
imp
A-0
5-1
7-0
4.c
dr
06
/19
/04
Proposed Building Footprint
EMF Monitoring Location
Approximate Area Affected During Construction
½ Mile Study Area
Overhead
LEGEND
##

6.17.2.1.2. Line Sources
In addition to the ten sampling locations at the water treatment plant site, 27 points were chosen along the existing underground feeder lines. These feeder lines, which run from the Washington Street substation in Mount Vernon to the Bronx, would supply electrical power to the proposed project. In addition, the sampling captured some existing overhead lines that would also be used to supply power to the proposed project. These feeder lines extend from the Washington Street substation to East and West 4th Street and East and West 5th Street. The sampling locations, F1 to F27, are shown on Figure 6.17-2. Table 6.17-2 contains the electric and magnetic field data that were measured in March and July 1998. As presented in the table, for both March and July 1998 the magnetic field ranged from 0.00013 to 0.00771 Gauss. These values are well below the IRPA general public limit of 1.0 Gauss and the NYSROW maximum guidelines for magnetic field strength of 0.2 Gauss. The electric field measured at the same locations by the Holaday meter ranged from 1.33 to 28.30 V/m. These values are well below the IRPA general public limit for electric field strength of 5,000 V/m. Likewise, they are below the NYSROW maximum guidelines for an electric field of 11,800 V/m. Sampling points F1, F16, and F17 are relatively high because the measurements were taken next to overhead transmission lines. 6.17.2.2. Future Without the Project
The Future Without the Project conditions were developed for the anticipated peak year of construction (2010) and the anticipated year of operation (2011) for the proposed project. The anticipated peak year of construction is based on the peak number of workers. In the Future Without the Project, electric and magnetic fields at the water treatment plant site and along the proposed feeder route are anticipated to essentially remain at current levels. 6.17.3. Potential Impacts 6.17.3.1. Potential Project Impacts
The anticipated year of operation for the proposed plant is 2011. Therefore, potential project impacts have been assessed by comparing the Future With the Project conditions against the Future Without the Project conditions for the year 2011. There would be two principal sources of electric and magnetic fields anticipated at the proposed plant: point sources and line sources. The point sources would include the electrical equipment operating within and/or around the proposed plant. The line sources would include the feeder lines that bring power to the proposed plant.
Final SEIS MOSEMF 4

M&
E F
ile:
P:\E
nvi
ron
me
nta
l Q
ua
lity\
Cro
ton
\20
04
Fin
al
SE
IS\G
rap
hic
s\0
6-M
OS
\17
-EM
F\M
OS
-in
f-O
imp
B-0
5-1
7-0
4.c
dr
06
/19
/04
Croton Water Treatment Plant
Proposed Feeder Location PlanMosholu Site
Figure 6.17-2
F22
LEGEND
Approximate Affected During Construction
Proposed Building Footprint
Overhead Feeder
Underground Feeder

TABLE 6.17-2. EXISTING ELECTRIC AND MAGNETIC FIELD DATA FOR THE
FEEDER DISTRIBUTION LINES (MT. VERNON TO THE BRONX)
Holaday Magnetic Field Holaday Electric Field Gauss Volts/Meter Sample
Location March 1998 July 1998 March 1998 July 1998
F1 0.00254 0.00612 17.95 28.3 F2 0.00191 0.00771 1.70 1.41 F3 0.00213 0.00331 7.17 6.80 F4 0.00215 0.00151 1.70 1.51 F5 0.00126 0.00162 1.53 1.52 F6 0.00179 0.00213 1.34 1.35 F7 0.00453 0.00565 9.95 8.23 F8 0.00314 0.00640 1.43 1.76 F9 0.00100 0.00181 1.60 3.20 F10 0.00033 0.00036 1.37 1.41 F11 0.00128 0.00185 1.44 1.41 F12 0.00126 0.00147 1.58 1.52 F13 0.00096 0.00544 4.08 2.60 F14 0.00304 0.00394 2.68 2.35 F15 0.00183 0.00345 4.82 5.02 F16 0.00152 0.00202 27.50 23.20 F17 0.00159 0.00258 27.40 24.01 F18 0.00219 0.00140 1.83 1.54 F19 0.00170 0.00425 3.90 2.11 F20 0.00020 0.00023 1.40 1.41 F21 0.00025 0.00031 1.34 1.36 F22 0.00058 0.00031 1.34 1.41 F23 0.00133 0.00013 1.52 1.54 F24 0.00043 0.00030 1.34 1.42 F25 0.00025 0.00032 1.42 1.81 F26 0.00019 0.00018 1.33 1.36 F27 0.00021 0.00028 1.34 1.42
6.17.3.1.1. Point Sources
Magnetic field levels were measured at two existing New York City-owned facilities, the
Wards Island and North River Water Pollution Control Plants (WPCP). These two plants house electrical equipment similar to the proposed electrical equipment requirements for the proposed plant. Measurements were taken at varying distances from the equipment to determine how the magnetic fields would decrease with distance based on the inverse cube relationship. The maximum magnetic fields and measurement distances from each type of equipment at the two WPCPs are presented below in Table 6.17-3. These maximum magnetic fields in Gauss (Table 6.17-3) were used to estimate the magnetic fields strength from the point sources at the proposed plant, shown on Table 6.17-4.
Final SEIS MOSEMF 6
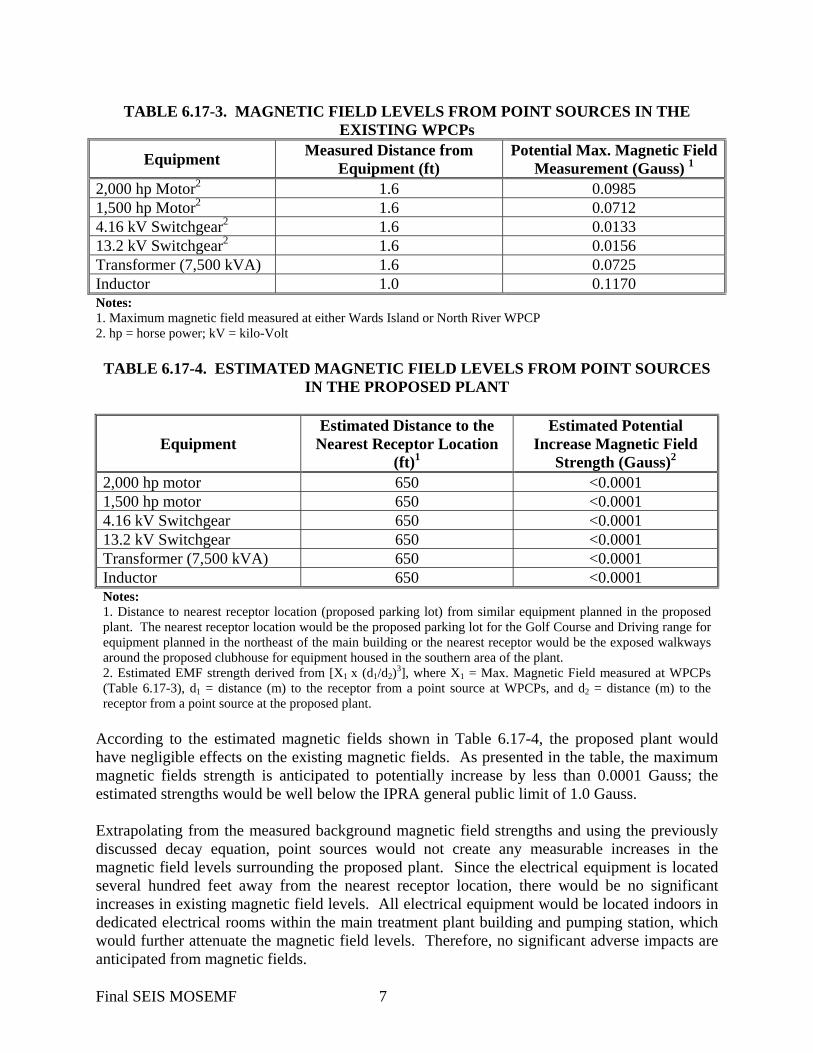
TABLE 6.17-3. MAGNETIC FIELD LEVELS FROM POINT SOURCES IN THE
EXISTING WPCPs
Equipment Measured Distance from Equipment (ft)
Potential Max. Magnetic Field Measurement (Gauss) 1
2,000 hp Motor2 1.6 0.0985 1,500 hp Motor2 1.6 0.0712 4.16 kV Switchgear2 1.6 0.0133 13.2 kV Switchgear2 1.6 0.0156 Transformer (7,500 kVA) 1.6 0.0725 Inductor 1.0 0.1170 Notes: 1. Maximum magnetic field measured at either Wards Island or North River WPCP 2. hp = horse power; kV = kilo-Volt TABLE 6.17-4. ESTIMATED MAGNETIC FIELD LEVELS FROM POINT SOURCES
IN THE PROPOSED PLANT
Equipment Estimated Distance to the
Nearest Receptor Location (ft)1
Estimated Potential Increase Magnetic Field
Strength (Gauss)2
2,000 hp motor 650 <0.0001 1,500 hp motor 650 <0.0001 4.16 kV Switchgear 650 <0.0001 13.2 kV Switchgear 650 <0.0001 Transformer (7,500 kVA) 650 <0.0001 Inductor 650 <0.0001 Notes: 1. Distance to nearest receptor location (proposed parking lot) from similar equipment planned in the proposed plant. The nearest receptor location would be the proposed parking lot for the Golf Course and Driving range for equipment planned in the northeast of the main building or the nearest receptor would be the exposed walkways around the proposed clubhouse for equipment housed in the southern area of the plant. 2. Estimated EMF strength derived from [X1 x (d1/d2)3], where X1 = Max. Magnetic Field measured at WPCPs (Table 6.17-3), d1 = distance (m) to the receptor from a point source at WPCPs, and d2 = distance (m) to the receptor from a point source at the proposed plant.
According to the estimated magnetic fields shown in Table 6.17-4, the proposed plant would have negligible effects on the existing magnetic fields. As presented in the table, the maximum magnetic fields strength is anticipated to potentially increase by less than 0.0001 Gauss; the estimated strengths would be well below the IPRA general public limit of 1.0 Gauss. Extrapolating from the measured background magnetic field strengths and using the previously discussed decay equation, point sources would not create any measurable increases in the magnetic field levels surrounding the proposed plant. Since the electrical equipment is located several hundred feet away from the nearest receptor location, there would be no significant increases in existing magnetic field levels. All electrical equipment would be located indoors in dedicated electrical rooms within the main treatment plant building and pumping station, which would further attenuate the magnetic field levels. Therefore, no significant adverse impacts are anticipated from magnetic fields.
Final SEIS MOSEMF 7
Point sources would not create any measurable increases in the electric field levels surrounding the proposed plant. All major electrical equipment would be located indoors in dedicated electrical rooms. Electric fields would be shielded and weakened by conducting material between the sources and the closest public access area. Therefore, no significant adverse impacts are anticipated from electric fields. The emergency power system would be available for smoke purging, emergency elevators, alarms, fire pumps, communications, and other emergency equipment in case of fire or other emergency conditions. Emergency power would also be provided for the security system, communications system, lighting protection system, plant control system, and other safety related equipment. No emergency power would be provided to operate the proposed plant. Two diesel emergency generators, rated at about 1,500-kW are proposed for emergency power supply; one generator would serve as backup. The emergency system would include a 3,000-gallon fuel storage tank and two load banks for exercising the diesel engine (generators would be operated on a monthly basis for testing). As an example, this proposed system would be smaller than a standard 10,000-kVA transformer (in terms of its electric power) that may potentially contribute approximately 1.5x10⁻⁴ Gauss at the nearest sensitive receptor. From this example it could be concluded that the proposed system would result in less than a 1.5x10⁻⁴ Gauss reading at the nearest sensitive receptor; therefore, no significant adverse impacts on the surrounding magnetic and electric fields are anticipated from the emergency power system. When considered together the point source magnetic fields (from the proposed plant and emergency power system) would have negligible effects on the existing magnetic fields. The maximum magnetic fields strength would add up to less that 0.0001 Gauss. The estimated strengths would be well below the IPRA general public limit of 1.0 Gauss and the NYSROW maximum guidelines for magnetic field strength of 0.2 Gauss. All electric fields associated with the proposed project (i.e. the proposed plant and emergency power system) would be contained within a building shielding the electric fields from the closest public access area. Therefore, no significant adverse impacts are anticipated from the cumulative effects of magnetic and electric fields point sources.
6.17.3.1.2. Line Sources
Based on the conceptual design of the proposed plant, Con Edison would supply power to the proposed plant through up to six 13.2 kV underground feeder lines from the Washington Street substation located in Mount Vernon. Triplex-shielded cables would be used for 13.2 kV service feeders in public areas and within the proposed plant; rigid steel conduits would be specified. Some of the Con Edison service feeders would be overhead, while the remaining feeders would be underground. The triplex-shielded cables would adsorb the electric fields emitted from the 13.2 kV feeders and prevent public exposure to lines sources related to the proposed plant. Any increases in electric field levels would be zero because of shielding and/or the rapid decrease in field strength from the electrical source.
The service feeders would be underground in concrete-encased steel conduits. The magnetic fields generated by the currents in each of the three conductors within each of the service feeders would cancel each other out. Therefore, the magnetic fields at maximum operating condition would have a negligible increase on the existing magnetic field at the water treatment plant site.
Final SEIS MOSEMF 8

To calculate the projected magnetic field strengths from underground feeders associated with the proposed project, additional field measurements were taken at the Wards Island and North River WPCPs. Since the proposed project would use 13.2 kVA underground feeders, similar to those already at use at the two WPCPs, the field measurements at the WPCPs are considered representative of field measurements that would occur with the proposed project. To be conservative, the maximum magnetic field readings (0.002 Gauss at 2.0 meters) were used to predict magnetic field strengths for the proposed project. Using the formula below Table 6.17-5, the projected magnetic field levels for the proposed project were derived from the measured magnetic field values from the North River WPCP and from the values of the feeder lines running from the Washington Street substation in Mt. Vernon to the Bronx. Table 6.17-5 shows a quantitative basis that the magnetic field strength from line sources from the proposed plant would not increase significantly. The Holaday calculations show that the field strength from line sources would be 0.003 Gauss. The calculation shows on a quantitative basis that the magnetic field strength from line sources for the proposed plant would increase but would remain well below the IRPA standard of 1.0 Gauss; therefore, no significant adverse impacts are anticipated from the magnetic fields.
TABLE 6.17-5. ESTIMATION OF PROPOSED PLANT LINE SOURCE MAGNETIC FIELD STRENGTH
Points Along Underground Feeder (Line Source)1
Existing Conditions Magnetic Field (Gauss)2
Projected Magnetic Field Strength from the Proposed
Water Treatment Plant (Gauss)
F1 0.002 0.003 F2 0.002 0.003 F3 0.002 0.003 F4 0.002 0.003
Notes: 1. Sampling locations along underground feeder line from Mount Vernon to the Bronx (from Table 6.17-2 in Existing Conditions Section). 2. Magnetic field measurement taken along underground feeder line from Mount Vernon to the Bronx to establish existing conditions (from Table 6.17-2 in Existing Conditions Section). 3. Projected magnetic field strength from the proposed project. Calculated using the formula x1(d1/d2)2=x2. Then, [(x2)2+(x3)2]½ was used, where x1=0.002 Gauss for Holaday meter, d1=2.0 m (distance from feeder at the North River WPCP), d2=1.83 m (distance from feeder at the proposed project), and x3=existing conditions value above. The electric and magnetic fields potential project impacts are insignificant individually as discussed above. The magnetic fields generated would be calculated by multiplying the new magnetic field level calculated for the F1 sampling location by four (the number of feeder lines). The four feeder lines would cumulatively emit a magnetic field of 0.08 Gauss, still an insignificant exposure. The potential electric and magnetic fields from the operation of the proposed project are insignificant as discussed above. The projected impacts discussed above, would be well below the IRPA general public limit of 1.0 Gauss. However, the following features would generally be incorporated in the design to ensure that the prospective electric and magnetic fields would be minimized further:
Final SEIS MOSEMF 9
• Providing remote control/monitoring for personnel to minimize time in electrical equipment rooms.
• Specifying equipment that has negligible harmonic voltages and currents and providing
tuned harmonic filters (to prevent/minimize harmonic fields).
• Using computer monitors designed for low magnetic field emissions and active power line conditioners for groups of computers.
• Balancing of electrical systems, as much as possible, such that fields would cancel each
other or the residual field would be minimized.
• Energy conservation and power factor correction, which would reduce the field-producing line currents.
Project plans include shielding ELF and isolating EMF sources so that the public would not be exposed to significant increases in EMF/ELF. The goal would be to avoid a measurable increase above local background levels. 6.17.3.2. Potential Construction Impacts
The anticipated year of peak construction for the proposed project is 2010. Therefore, potential construction impacts have been assessed by comparing the Future With the Project conditions against the Future Without the Project conditions for the year 2010.
6.17.3.2.1. Point Sources
A temporary 13.2-kV substation would be provided by Con Edison to supply power during the construction period. The temporary substation would consist of three 500-kVA mineral oil-filled transformers with network protectors on the secondaries. This substation would be used by contractors, resident engineers and the NYCDEP for construction equipment, site lighting, and field offices. The power capacity of this temporary substation is anticipated to be 1,500 kVA, while the power capacity of the permanent substation is anticipated to be 15,000 kVA. In Table 6.17-4, the projected point source magnetic field strength of the transformer, with a power capacity of 7,500 kVA, is anticipated to be less than 0.0001 Gauss. The projected point source magnetic field strength of the temporary substation, with a smaller power capacity is anticipated to be even less. Therefore, the contribution of the proposed substation to the point source magnetic and electric field is anticipated to be negligible and no significant adverse impacts are anticipated.
Final SEIS MOSEMF 10
6.17.3.2.2. Line Sources
Four temporary feeders (three online, one backup) each supplying 2,500 kVA, would be provided by Con Edison to supply power during the construction period. 5,000 kVA of the total temporary demand would supply the tunnel work that includes the tunnel boring machine (TBM) and welding. The additional 2,500 kVA would supply electricity to other construction equipment, site lighting, and field offices for contractors, resident engineers and the NYCDEP personnel. The temporary feeders (total 7,500-kVA) source magnetic field strength is anticipated to be less than 0.003 Gauss based on an estimated magnetic field strength of the larger projected proposed feeders (total 15,000-kVA), refer to Table 6.17-5. The distribution feeders would provide electrical power to a temporary on-site substation. These feeders would be buried underground and, where appropriate would be enclosed in steel conduits that would shield electric and magnetic fields. These feeders would be triplex-shielded cables installed within rigid steel conduits where appropriate. The triplex-shielded cables would adsorb the electric fields emitted from the four feeders and prevent public exposure to the line sources related to the proposed project. Any increases in electric field levels would be null because of shielding and/or the rapid decreases in field strength from the electrical source. Therefore, the contribution of the substation to the line source magnetic and electric field is anticipated to be negligible and no significant adverse impacts are anticipated. The four temporary feeders would each be made of three conductors, and these conductors would each produce magnetic fields. In each feeder, the magnetic fields of its conductors would cancel each other out. Therefore, the magnetic fields at maximum operating conditions would have a negligible increase on the existing magnetic field at the water treatment plant site. The projected line source magnetic field is anticipated to be well below the IRPA general public limit of 1.0 Gauss. Therefore, the contribution of the substation and feeders to the line source magnetic and electric field are anticipated to be negligible and no significant adverse impacts are anticipated. Based on the analyses presented above, the proposed Croton project at the Mosholu Site would have no significant adverse impacts from EMF and ELF. For comparison purposes, this is true of the Eastview and Harlem River sites as well.
Final SEIS MOSEMF 11