Final Sediment Monitoring Summary Report 2008 … Monitoring Summary Report ... Sediment Monitoring...
40
US ARMY CORPS OF ENGINEERS New England District Contract No. DACW33-03-D-0004 Delivery Order No. 22 June 2009 Final Sediment Monitoring Summary Report 2008 Remedial Dredging Environmental Monitoring, Sampling, and Analysis New Bedford Harbor Superfund Site New Bedford Harbor, MA
Transcript of Final Sediment Monitoring Summary Report 2008 … Monitoring Summary Report ... Sediment Monitoring...

US ARMY CORPS OF ENGINEERS New England District
Contract No. DACW33-03-D-0004
Delivery Order No. 22
June 2009
Final Sediment Monitoring
Summary Report 2008 Remedial Dredging
Environmental Monitoring, Sampling, and Analysis
New Bedford Harbor Superfund Site
New Bedford Harbor, MA

Final Report Sediment Monitoring Summary Report
2008 Remedial Dredging
Environmental Monitoring, Sampling, and Analysis New Bedford Harbor Superfund Site
New Bedford Harbor, MA
Submitted to:
Department of the Army U.S. Army Corps of Engineers
North Atlantic Division New England District
Contract Number: DACW33-03-D-0004 Delivery Order Number: 22
Prepared by:
Battelle 397 Washington Street Duxbury, MA 02332
(781) 934-0571
June 2009

This page left intentionally blank

TABLE OF CONTENTS
Executive Summary .........................................................................................................................v
1.0 INTRODUCTION.............................................................................................................................. 1
1.1 Site Description ......................................................................................................................... 1 1.2 Project Objectives...................................................................................................................... 3
1.2.1 Pierce Mill Cove........................................................................................................... 3 1.2.2 North of Wood Street ................................................................................................... 4 1.2.3 OU3 Pilot Cap Site ....................................................................................................... 4
2.0 METHODS ......................................................................................................................................... 5
2.1 Sediment Collections ................................................................................................................. 5 2.1.1 Pierce Mill Cove........................................................................................................... 5 2.1.2 North of Wood Street ................................................................................................... 9 2.1.3 OU3 Pilot Cap Site ..................................................................................................... 10 2.1.4 Quality Control ........................................................................................................... 10
2.2 Sample Processing ................................................................................................................... 10 2.2.1 Photo documentation.................................................................................................. 11 2.2.2 Visual Characterization and Sub-sampling for Chemical Testing ............................. 11
2.3 Chemical Testing ..................................................................................................................... 12 2.3.1 Polychlorinated Biphenyls ......................................................................................... 12 2.3.2 Quality Control ........................................................................................................... 13
2.4 Data Analysis .......................................................................................................................... 13
3.0 RESULTS ......................................................................................................................................... 15
3.1 Field Activities ........................................................................................................................ 15 3.1.1 Pierce Mill Cove......................................................................................................... 15 3.1.2 North of Wood Street ................................................................................................. 17 3.1.3 OU3 Pilot Cap Site ..................................................................................................... 18
3.2 Chemical Testing ..................................................................................................................... 19 3.2.1 Pierce Mill Cove......................................................................................................... 19 3.2.2 North of Wood Street ................................................................................................. 19 3.2.3 OU3 Pilot Cap Site ..................................................................................................... 20
3.3 Quality Control ........................................................................................................................ 20 3.3.1 Field Activities ........................................................................................................... 20 3.3.2 Chemical Testing ........................................................................................................ 20
4.0 DISCUSSION................................................................................................................................... 25
4.1 Vertical Elevation Results Related to Dredging ...................................................................... 25 4.2 PCB Trends at the North of Wood Street ................................................................................ 26
4.2.1 River Sediments ......................................................................................................... 26 4.2.2 Shoreline Soils ............................................................................................................ 27
4.3 PCB Trends OU3 Pilot Cap Site ............................................................................................. 28
5.0 REFERENCES................................................................................................................................. 30
New Bedford Harbor 2008 Sediment Monitoring June 2009 Final Report Page i

LIST OF TABLES
Table 1. Elevation Data From the 2008 Pre-dredge Sampling Event, Pierce Mill Cove. .......................... 16 Table 2. Elevation Data from the 2008 Post-dredge Sampling Event, Pierce Mill Cove. ......................... 17 Table 3. Summary of Samples Collected at the North of Wood Street, 2008. .......................................... 18 Table 4. Summary of Samples Collected at the OU3 Pilot Cap Site, 2008. .............................................. 19 Table 5. Total PCB Concentrations in Surface Sediment at the Site, 2008. .............................................. 21
LIST OF FIGURES
Figure 1. Location of the Site in Southeastern Massachusetts. .................................................................... 1 Figure 2. New Bedford Harbor. ................................................................................................................... 2 Figure 3. 2008 Dredge Area......................................................................................................................... 3 Figure 4. Pierce Mill Cove Planned Dredge Area with Z-blocks and Target Dredge Elevations. ............... 4 Figure 5. Pre- and Post-dredge Sample Locations, Pierce Mill Cove. ......................................................... 5 Figure 6. Graphical Depiction of Sediment Core Measurements. ............................................................... 8 Figure 7. North of Wood Street Sampling Locations. ................................................................................. 9 Figure 8. OU3 Pilot Cap Site Sampling Locations. ................................................................................... 10 Figure 9A. Example Box Plot. .................................................................................................................... 13 Figure 9B. Example Output from ANOVA. ............................................................................................... 13 Figure 10. Pre-dredge Thickness of OL Layer at Pierce Mill Cove. ......................................................... 15 Figure 11. Total PCB Concentrations in Post-dredge Sediment at Pierce Mill Cove, 2008...................... 22 Figure 12. Total PCB Concentrations in Sediment/Soil at North of Wood Street, 2008........................... 23 Figure 13. Total PCB Concentrations in Sediment at the OU3 Pilot Cap Site, 2008. ............................... 24 Figure 14. Correlation between Sediment Thickness of the OL Layer and Total PCB in Post-dredge
Sediment, Pierce Mill Cove. ........................................................................................................ 25 Figure 15. Distribution of Total PCB in River Sediment at the North of Wood Street, 2003-2008. ......... 26 Figure 16. Temporal Trends in Total PCB (log normalized) in River Sediment at the North of Wood Street,
2003-2008. ................................................................................................................................... 27 Figure 17. Distribution of Total PCB in Shoreline Soil at the North of Wood Street, 2006-2008. ........... 27 Figure 18. Temporal Trends in Total PCB (log normalized) in Shoreline Soil at the North of Wood Street,
2006-2008. ................................................................................................................................... 28 Figure 19. Distribution of Total PCB in Sediment at the OU3 Pilot Cap Site, 2005-2008........................ 28 Figure 20. Temporal Trends in Total PCB (log normalized) in Sediment at Ridge (A) and Valley (B)
Locations at the OU3 Pilot Cap, 2005-2008. ............................................................................... 29
APPENDICES
Appendix A: Field Sample Data Appendix B: PCB Analytical Data
New Bedford Harbor 2008 Sediment Monitoring June 2009 Final Report Page ii

ACRONYMS AND ABBREVIATIONS
ANOVA analysis of variance
CAD confined aquatic disposal
DMU dredge management unit
ID identification IS internal standard
LCS laboratory control sample
mg/kg milligrams per kilogram MPC measurement performance criteria MS/MSD matrix spike/matrix spike duplicate
NS&T National Status and Trends NWS North of Wood Street
PCB polychlorinated biphenyl
QA quality assurance QC quality control
ROD Record of Decision
TTFW Tetra Tech Foster Wheeler, Inc.
USACE NAE U.S. Army Corps of Engineers, New England District USCS United Soil Classification System USEPA United States Environmental Protection Agency
New Bedford Harbor 2008 Sediment Monitoring June 2009 Final Report Page iii

This page intentionally left blank
New Bedford Harbor 2008 Sediment Monitoring June 2009 Final Report Page iv

EXECUTIVE SUMMARY
Sediment monitoring was performed in 2008 at the New Bedford Harbor Superfund Site (site), located in New Bedford, Massachusetts. Sediment samples were collected at three areas of the site to characterize polychlorinated biphenyl (PCB) contamination in surface sediments: Pierce Mill Cove, North of Wood Street (NWS), and the OU3 pilot cap site.
Pierce Mill Cove
Pierce Mill Cove is located in the upper harbor north of Sawyer Street. Remedial dredging was performed at Pierce Mill Cove from August 18 through October 21, 2008, resulting in the removal of approximately 20,000 cubic yards of contaminated sediments. Dredging activities targeted removal of sediments to the approximate depth of the target dredge elevation (where, based on modeling, PCB concentrations are predicted to be less than the 10 milligrams per kilogram [mg/kg] remediation criteria). Sediment monitoring activities in 2008 included: 1) the collection of pre-dredge cores to determine the elevation of the visual transition and sediment thickness of the OL layer (‘OL’ in the United Soil Classification System [USCS], defined as ‘organic silt, organic clay’) to assist dredge planning; and 2) post-dredge coring to assess the overall performance of the dredging operation and support future needs.
Pre- and post-dredge sediment cores were typically comprised of two layers. The surface layer was characterized by fine-grained loose black organic silt with high moisture content (‘OL’). Below this layer, the sediment type was generally comprised of moderately firm olive-gray clay (‘OH’ in the USCS, defined as organic clay, organic silt). In many cases the post-dredge cores had less distinct visual transitions compared to pre-dredge cores, and the transition occurred over a relatively broad band (>0.5 ft) of mixed sediment. The overall thickness of the OL layer was reduced as a result of dredging. That is, the thickness of the OL layer in the pre-dredge cores ranged from 0.5 to 2.2 ft and the thickness of the OL layer in the post-dredge cores ranged from 0.3 to 1.6 ft.
Concentrations of total PCB in the post-dredge cores ranged from 10 to 47 mg/kg. Post-dredge cores with a thicker OL layer generally had higher concentrations of total PCB, except stations bb28 and T38 where the total PCB concentrations were low relative to other sediments with similar sediment thickness.
North of Wood Street
The NWS area is located at the far northern end of the upper harbor. This area was prioritized for restoration activities based on its proximity to shoreline residential and recreational land use areas. The NWS area was remediated in 2002-2003, and again (in a small shoreline area missed in 20022003) in 2005. Long-term sediment monitoring has been performed since 2004 to assess the effectiveness of prior remediation and potential recontamination of this area due to sediment transport from unremediated areas of the Harbor. In 2008, sediment cores were collected at 21 locations, including 14 in-river locations and seven shoreline soil locations. Sediment cores were visually characterized and the 0 to 0.5 ft of surface analyzed for PCBs.
Many of the river sediments had similar physical characteristics, characterized by a layer of fine black silt underlain by sand, clay or silt. Sediment samples closer to the shore and further
New Bedford Harbor 2008 Sediment Monitoring June 2009 Final Report Page v

upstream typically contained more sand. Shoreline soils were generally comprised of brown sand and/or organic silt underlain by sand.
Concentrations of total PCB ranged from 0.98 to 180 mg/kg in surface sediments sampled at the NWS area in 2008. The highest concentrations (>100 mg/kg) were measured in sediment at subtidal stations 055 and 039, located in the vicinity of the Wood Street bridge. Lower concentrations of total PCB (<10 mg/kg) were typically measured in sediment sampled further upstream and closer to the shore.
Total PCB concentrations were substantially lower in the shoreline soil samples, ranging from 0.076 to 0.67 mg/kg. Total PCB concentrations were below the applicable recreational cleanup criteria (25 mg/kg) at all shoreline locations sampled at the NWS area in 2008.
Long-term monitoring data suggest that post-remediation concentrations of total PCB have increased in river sediment, but not in shoreline soils. The post-remediation increase at river sediment locations could be associated with contaminant transport from the upper harbor during dredging activities or from natural transport (e.g., sediment resuspension and transport during tidal cycles or high winds) of contaminated sediment from unremediated areas of the Harbor. Annual sediment monitoring will continue at the NWS area as needed to assess the potential for recontamination from the unremediated areas of the Harbor immediately to the south.
OU3 Pilot Cap Site
The OU3 Pilot Cap site is a localized area of elevated PCB contamination located outside the hurricane barrier in New Bedford, Massachusetts. In 2005, this area was capped with parent material dredged during the construction of a confined aquatic disposal (CAD) cell in New Bedford Harbor. Annual monitoring has been performed since 2005 (shortly after completion of the capping activity) to determine the effectiveness of cap placement in lowering surficial sediment PCB concentrations, as well as the extent of change in PCB concentrations over time. In 2008, sediment grab samples were collected at 17 locations, encompassing a series of stations representative of ridge and valley locations at the pilot cap site. Sediment grabs were visually characterized and the 0 to 0.3 ft of surface was analyzed for PCBs.
All of the OU3 surface sediment samples had similar physical characteristics, characterized by fine sand with some silt. Based on the visual examination of the sediment grabs, sediment at the valley locations often contained more silt compared to sediment at the ridge locations. Concentrations of total PCB were also slightly higher at the valley locations (concentrations ranged from 0.23 to 6.0 mg/kg) compared to ridge locations (concentrations ranged from 0.26 to 2.2 mg/kg).
Long-term monitoring data suggest that there have been no significant differences in total PCB concentrations at the ridge locations, whereas total PCB concentrations at valley locations decreased significantly in 2008 compared 2005. The 2008 decrease at valley locations could reflect the deposition of cleaner material at these locations. Overall, the long-term monitoring data suggest that the cap remains effective in terms of lowering surficial PCB contamination.
New Bedford Harbor 2008 Sediment Monitoring June 2009 Final Report Page vi

1.0 INTRODUCTION
1.1 Site Description
The New Bedford Harbor Superfund Site (hereafter referred to as the site), located in Bristol County, Massachusetts, extends from the shallow northern reaches of the Acushnet River estuary south through the commercial harbor of New Bedford and into 17,000 adjacent acres of Buzzards Bay (Figure 1). Industrial and urban development surrounding the Harbor has resulted in sediments becoming contaminated with high concentrations of many pollutants, notably polychlorinated biphenyls (PCBs) and heavy metals. Two manufacturers in the area used PCBs while producing electronic devices from the 1940s to the late 1970s, when the use of PCBs was banned by the U.S. Environmental Protection Agency (USEPA). Based on human health concerns and ecological risk assessments, USEPA added New Bedford Harbor to the National Priorities List in 1983 as a designated Superfund Site. Through an Interagency Agreement between the USEPA and the U.S. Army Corps of Engineers, New England District (USACE NAE), the USACE is responsible for carrying out the design and implementation of the remedial measures at the site. The site has been divided into three areas the upper, lower and outer harbors consistent with geographical features of the area and gradients of contamination (Figure 2).
The shoreline Aerovox manufacturing facility located in New Bedford, Massachusetts, used PCBs in the manufacture of electrical capacitors from approximately 1940 to 1977. This facility is located in the upper harbor (Figure 2) and is considered one of the major sources of historic PCB contamination to New Bedford Harbor. The highest concentrations of PCBs were found in sediments in a 5-acre area in the northern portion of the Acushnet River Estuary adjacent to the Aerovox facility. These ‘hot spot’ sediments, which contained PCBs upwards of 100,000 milligrams per kilogram (mg/kg), were removed between 1994 and 1995 as part of USEPA’s 1990 “Hot Spot” Record of Decision (ROD). Full scale remediation dredging per the 1998 Upper and Lower Harbor ROD was initiated in 2004 and has continued with annual funding every year since.
Figure 1. Location of the Site in Southeastern Massachusetts.
New Bedford Harbor 2008 Sediment Monitoring June 2009 Final Report Page 1 of 31

Another known source of PCB contamination in New Bedford Harbor is related to activities at the Cornell-Dubilier mill on the western shore of the outer harbor (Figure 2). In 2005, a 15 acre underwater cap pilot project was implemented near Cornell-Dubilier to cap PCB-contaminated sediments.
The remediation of this site per the 1998 ROD involves the excavation and dredging of approximately 900,000 cubic yards (cy) of PCB contaminated sediment. The majority of contaminated material is being removed utilizing a hydraulic dredge that pumps dredge slurry to the project’s Sawyer Street facility where it is mechanically processed to remove all sand, gravel, and debris material. The silt and clay size materials are then pumped to the Area D Dewatering Facility located on Herman Melville Boulevard, where it is mechanically dewatered and transported off-site for disposal.
The site is divided into a series of Dredge Management Units (DMU) based on contamination levels, contamination sources, topography, and other factors. In 2008, remediation activities at the site included shoreline excavation adjacent to the Aerovox facility and hydraulic dredging at Pierce Mill Cove. This report presents results from sediment monitoring performed during dredging activities at Pierce Mill Cove, which encompasses sections of DMU-19, DMU-20, DMU-21, DMU-23, DMU-24, and DMU-25 (Figure 3). Monitoring results associated with shoreline excavation activities conducted adjacent to the Aerovox facility are reported in Jacobs (2009).
This report also presents results from sediment monitoring performed in 2008 at the North of Wood Street (NWS) and OU3 pilot cap areas. The NWS area is located at the far northern end of the upper harbor (Figure 2). This area was remediated in 2002-2003 and again (for an area missed initially in 2002-2003) in 2005. Annual sediment monitoring has been performed at the NWS area since 2004 to assess the effectiveness of prior remediation and potential recontamination of this area due to sediment transport from unremediated areas of the Harbor. The OU3 area is located in the outer harbor (Figure 2). An underwater cap was placed over PCB-contaminated sediments at this area in 2005 and annual monitoring has been performed since then to assess the effectiveness of the underwater cap.
Figure 2. New Bedford Harbor.
New Bedford Harbor 2008 Sediment Monitoring June 2009 Final Report Page 2 of 31

1.2 Project Objectives
The objectives of the 2008 sediment monitoring program were to perform monitoring in support of the remedial dredging activities at the Pierce Mill Cove dredge area and to characterize PCB contamination in surface sediments at the Pierce Mill Cove, NWS and OU3 areas of the site.
1.2.1 Pierce Mill Cove
Sediment monitoring at the Pierce Mill Cove dredge area (Figure 3) included pre-dredge coring to determine the elevation of the visual transition and sediment thickness of the OL layer (‘OL’ in the United Soil Classification System [USCS], defined as ‘organic silt, organic clay’) to assist dredge planning and post-dredge coring to assess the overall performance of the dredging operation and support future needs.
Pre-dredge Sediment Sampling. The entire upper harbor, including the planned Pierce Mill Cove dredge area depicted in Figure 4, have been parceled into discrete 25-foot by 25foot ‘z-blocks’. During remedial design, a geostatistical model was used to predict a target elevation for dredging each z-block. This target dredge elevation, as shown in Figure 4, represents the elevation below which PCB concentrations are predicted to be
less than the 10 mg/kg remediation criteria at the Pierce Mill Cove dredge area. Using target dredge elevations in combination with bathymetric data, a preliminary dredge plan was developed, which estimated the required depth of dredging and the thickness of the overlying sediment to be removed. The pre-dredge sediment sampling plan was designed to confirm these estimates or adjust elevations as needed. Coring locations were placed onto the z-block map to achieve sufficient spatial coverage for making an evaluation of the target dredge elevations (Figure 4). Visual characterization data from the pre-dredge cores was used by USACE NAE and Jacobs Engineering Group (Jacobs) to prepare the final 2008 dredge plan (Jacobs, 2009).
Post-dredge Sediment Sampling. Post-dredge sediment sampling was conducted to assess the sediment condition relative to the target dredge elevation for the 2008 dredging event and to assist with future site needs. Post-dredge cores were visually characterized to determine the elevation
Figure 3. 2008 Dredge Area.
New Bedford Harbor 2008 Sediment Monitoring June 2009 Final Report Page 3 of 31

and thickness of overlying material remaining after the completion of dredging. Samples selected by USACE NAE were chemically tested to assess PCB concentrations remaining in the sediments following the completion of dredge activities; samples tested were selected based on location, color change, and core stratigraphy.
Figure 4. Pierce Mill Cove Planned Dredge Area with Z-blocks and Target Dredge Elevations. (Source: Jacobs, 2009)
1.2.2 North of Wood Street
Long-term sediment monitoring has been performed at the NWS area since 2004 to assess the effectiveness of prior remediation and potential recontamination of this area due to sediment transport from unremediated areas of the Harbor. The objectives of the 2008 monitoring activities were to characterize PCB contamination in surficial river sediment and shoreline soils at the NWS area, and evaluate the 2008 data in context of the larger monitoring period and the cleanup criteria established in the 1998 ROD: 1 mg/kg for residential shoreline areas, 10 mg/kg for the sub-tidal sediments, 25 mg/kg for the top foot of recreational land use shoreline soils, and 50 mg/kg for shoreline soils deeper than the top foot in residential and recreational land use areas.
1.2.3 OU3 Pilot Cap Site
Long-term monitoring has been performed at the OU3 pilot cap area since 2005 to assess the effectiveness of the cap. The objectives of the 2008 monitoring activities were to characterize PCB contamination in surface sediments collected at the OU3 cap area, and to evaluate the 2008 data in context of the larger monitoring period (2005-2007).
New Bedford Harbor 2008 Sediment Monitoring June 2009 Final Report Page 4 of 31
2.0 METHODS
Methods used to collect and analyze sediment samples are summarized below and described in detail in the project Field Sampling Plan (Battelle 2008a) and Quality Assurance Project Plan (Battelle, 2008b).
2.1 Sediment Collections
2.1.1 Pierce Mill Cove
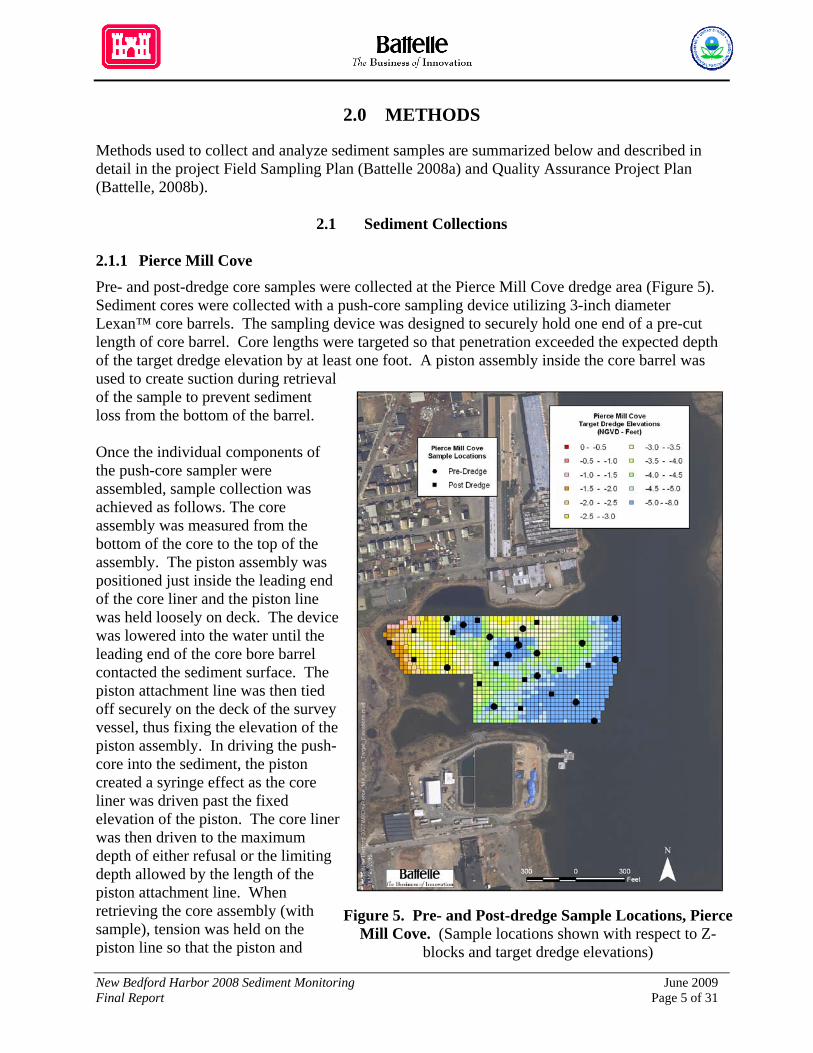
Pre- and post-dredge core samples were collected at the Pierce Mill Cove dredge area (Figure 5). Sediment cores were collected with a push-core sampling device utilizing 3-inch diameter Lexan™ core barrels. The sampling device was designed to securely hold one end of a pre-cut length of core barrel. Core lengths were targeted so that penetration exceeded the expected depth of the target dredge elevation by at least one foot. A piston assembly inside the core barrel was used to create suction during retrieval of the sample to prevent sediment loss from the bottom of the barrel.
Once the individual components of the push-core sampler were assembled, sample collection was achieved as follows. The core assembly was measured from the bottom of the core to the top of the assembly. The piston assembly was positioned just inside the leading end of the core liner and the piston line was held loosely on deck. The device was lowered into the water until the leading end of the core bore barrel contacted the sediment surface. The piston attachment line was then tied off securely on the deck of the survey vessel, thus fixing the elevation of the piston assembly. In driving the push-core into the sediment, the piston created a syringe effect as the core liner was driven past the fixed elevation of the piston. The core liner was then driven to the maximum depth of either refusal or the limiting depth allowed by the length of the piston attachment line. When retrieving the core assembly (with sample), tension was held on the piston line so that the piston and
Figure 5. Pre- and Post-dredge Sample Locations, Pierce Mill Cove. (Sample locations shown with respect to Z-
blocks and target dredge elevations)
New Bedford Harbor 2008 Sediment Monitoring June 2009 Final Report Page 5 of 31

sample were not pulled back down the core liner by suction from the sediments. The sampler was recovered onto the deck of the survey vessel. The bottom end of the core barrel was fitted with a plastic cap, after which the sediment on the external body of the sampler was rinsed off. After thoroughly cleaning the sampling device, the core liner was removed from the socket assembly, the piston assembly was removed, and the top of the core liner was fitted with a plastic end cap.
Upon recovery, the core was examined for acceptability. The goal of the sampling was to identify visual transitions in the field. If it did not appear that a clear transition layer was captured, the field team used professional judgment to determine the cause. Possible causes included: 1) the core was not long/deep enough to capture transition layers; 2) smearing of overlying sediments obscured the transition; and 3) the entire core was composed of the characteristic native material. For the first two causes the collection of a second core (longer for cause 1) at the same location was conducted. For the third cause the field team repositioned slightly and collected a second core. Other factors that were considered in determining acceptability included: 1) too much water at the top of the core; 2) signs of significant compaction at the top of the core; and 3) signs of loss of sediment from the bottom of the core. Because of the wide range of possible scenarios, overall core acceptability was based on the experience and judgment of the Chief Scientist and the field team. All decision making was documented on the Sediment Sampling Log sheets (Appendix A).
Determination of the accurate vertical elevation of the samples was critical in achieving the objectives of the project. Elevation of the water levels, sediment-water interface, apparent target dredge elevation, and other sediment transition zones were all critical measurements for this project (see Section 3 and Appendix A). The project elevation datum is MLW NGVD-29. A series of measurements were conducted for each sample to correct elevations for tidal fluctuations. All measurements were recorded as ±0.1 feet. The required measurements and techniques are listed below. See Figure 6 for graphical depiction of the measurements.
A = Water depth. The water depth was recorded using a measuring pole.
B = Length of push-core assembly. Prior to deployment, the full length of the push-core assembly from the top of the handle to the bottom edge of the core liner was recorded.
C = Water surface to top of core assembly handle. Once the core assembly was fully inserted (refusal or full core penetration), the length of the assembly remaining above the water surface was recorded.
D = Core Length. The core length, from bottom to top, was measured and recorded.
E = Surveyed elevation. Prior to operations, the dredge contractor installed a fixed sheet pile with markings indicating a survey elevation (NGVD 29). This elevation was recorded and served as the reference point for all elevation calculations.
F = Water surface from surveyed elevation. After sample collection, the survey vessel navigated to the fixed sheet pile with surveyed elevations (position to be determined) and the distance from the water surface to the surveyed elevation was recorded.
New Bedford Harbor 2008 Sediment Monitoring June 2009 Final Report Page 6 of 31

From these measurements a number of calculations were made to determine true elevations:
E - F = Elevation of water surface (G).
G - (B - C) = Elevation of bottom of core (H).
The H elevation (bottom of core) was used to determine the elevation of all visual transitions, including apparent target dredge elevation, i.e.:
H + (distance to visual transition) = Elevation of visual transition (target dredge elevation)
H + D = Elevation of sediment-water interface (I).
The elevation of the sediment-water interface was also calculated from:
G - A = Elevation of sediment-water interface (I2).
I and I2 were compared at each station. In soft sediments the sediment-water interface may have been difficult to discern from soundings (i.e., it is difficult to feel). Additionally, the sediment-water interface within a core was subject to compaction during collection, settling after recovery, and other factors that may have impacted the accuracy of elevation measurements. If I and I2
varied by more than 1.0 foot, the core was discarded and a new sample collected.
Once the core was deemed acceptable, a Sediment Sampling Log sheet was completed. Sample collection data, including collection date and time, station coordinates, and sample identification (ID), were documented on Sediment Sampling Log forms. The field measurements required for determining vertical elevation of the sediment-water interface and each transitional layer was also included on the Sediment Sampling Log sheet. The core barrel was labeled with a sample ID, date, and the orientation for the top of the core. Chain of Custody for each core section was initiated in the field. Core samples were capped tightly, stored on ice in the field, and transferred to the Sawyer Street field trailer for processing (Section 2.2).
New Bedford Harbor 2008 Sediment Monitoring June 2009 Final Report Page 7 of 31

Elevation of Water surface (G)
Elevation of Sediment water interface (I, I2 )
Elevation of Bottom of core
Elevation of visual transition
Water
OL Layer: Dark , high water content, overlying sediment. High PCB (> 10mg/kg)
OH Layer: Light, consolidated, native sediment. Low PCB (< 10mg/kg)
Cor
e P
ush
cor
e h
and
le
A
B
C F
D
Surveyed elevation (E)
(H)
Figure 6. Graphical Depiction of Sediment Core Measurements.
New Bedford Harbor 2008 Sediment Monitoring June 2009 Final Report Page 8 of 31

2.1.2 North of Wood Street
Twenty-one (21) locations were sampled in 2008, including 14 sediment stations in the river and seven soil stations located at recreational and residential land use shoreline soil areas along the east and west side of the river (Figure 7). Station locations were based on locations sampled previously in 2006 and 2007 (Battelle, 2007 and 2008c).
In-river sediments were collected in Lexan™ core barrels attached to a stainless steel push-core sampler. In all cases, a one foot core was targeted. Samples in deeper waters were collected from a boat, while shallow water samples were collected by wading. The push-core sampler is designed to securely hold one end of a pre-cut length of core barrel. The stainless steel socket which holds the core liner was attached to a suitable length of push rod based on the water depths for the sampling effort. A piston assembly inside the core barrel was used to create suction during retrieval of the sample so that no sediment was lost from the bottom the barrel. The piston assembly was positioned just inside the leading end of the core liner and the piston line was held loosely on deck. The device was lowered into the water until the leading end of the core bore barrel contacted the sediment surface. The piston attachment line was then tied off securely on the deck, thus fixing the elevation of the piston assembly. In driving the push-core into the sediment, the piston created a syringe effect as the core liner was driven past the fixed elevation of the piston. The sampler was recovered onto the deck of the survey vessel. The bottom end of the core barrel was fitted with a plastic cap, after which the sediment on the external body of the sampler was rinsed off. After thoroughly cleaning the sampling device, the core liner was removed from the socket assembly, the piston assembly was then removed, and the top of the core liner was fitted with a plastic end cap. Shoreline soil samples were collected in Lexan™ core barrels inserted into a soil auger. Sample collection data, including collection date and time, station coordinates, and sample ID, were documented on Sediment Sampling Log forms (Appendix A). All cores were kept intact in the liners and returned to Figure 7. North of Wood Street Sampling Locations. the Sawyer Street field trailer for processing (Section 2.2).
New Bedford Harbor 2008 Sediment Monitoring June 2009 Final Report Page 9 of 31

2.1.3 OU3 Pilot Cap Site
Sediment sampling was conducted at 17 locations at the OU3 Pilot Cap site to collect surficial sediments for PCB analysis. Sample locations are consistent with previous investigations (ENSR, 2006), and encompass a series of stations representative of ridge and valley locations at the pilot cap site (Figure 8).
The vessel transited to the target locations and the surface feature (i.e., ridge and valley) was assessed using the fathometer. Clearly discernable features (ridges and valleys) were evident at some stations (i.e., OU01, OU12 and OU16), but not others. Surface grab samples were collected at the target coordinates using a 0.04m2 modified Van Veen grab sampler. Sample collection data, including collection date and time, station coordinates, and sample ID, were documented on Sediment Sampling Log forms (Appendix A). All samples were returned to the Sawyer Street field trailer for processing (Section 2.2).
2.1.4 Quality Control
A routine set of quality control (QC) samples, including field duplicates, equipment blanks, and quality assurance (QA) splits, were collected to evaluate the sampling and analytical data quality. One field duplicate and one equipment blank were collected during the NWS and OU3 sampling events. One QA split was collected for each event (Pierce Mill Cove, NWS and OU3); QA splits were shipped to ESS Laboratory, an independent testing laboratory identified by USACE NAE.
2.2 Sample Processing
Sediment samples were kept on ice and transferred to the Sawyer Street field trailer for processing. Sediment samples were photo-documented, visually characterized, and sub-sampled for chemical testing as described below.
Figure 8. OU3 Pilot Cap Site Sampling Locations. (Bathymetry conducted by Jacobs in March 2009)
New Bedford Harbor 2008 Sediment Monitoring June 2009 Final Report Page 10 of 31

2.2.1 Photo documentation
In general, previous investigations have shown that dark, high water content, organic silts in the surface sediment are associated with elevated PCBs (Foster Wheeler Environmental Corporation, 2001 and 2002; ENSR, 2004 and 2005). These sediments fall under the “OL” description in the USCS (organic silt, organic clay). At the site these contaminated OL sediments generally overlie lighter colored, more consolidated native clays which have lower PCBs concentrations. The use of this visual transition as a general indicator of the vertical location of contamination provides a rapid and inexpensive method to assess dredge targets and performance.
To document this visual transition, all sediment cores were documented with digital photographs. Each photograph contained the following elements in the frame:
The sediment core. Photographing was done through the clear liner.
Measurement reference. A tape measure (or equivalent) marked in decimal feet ran parallel to length of the core.
Sample identifier. A card, paper, whiteboard, or equivalent was placed next to the core with the following written information:
o Sample ID – an alpha numeric code that identifies sample matrix, sampling year, station location, and depth interval sampled
o Sample Collection Date
2.2.2 Visual Characterization and Sub-sampling for Chemical Testing
Following photo documentation, all sediment samples were visually characterized and sub-sampled for chemical testing as described below. Copies of the sample field logs and custody records are maintained with the project files at Battelle.
Pierce Mill Cove, Pre-dredge Cores. Each sediment core was visually characterized and the physical characteristics (i.e., material type, color, consistency, particle size and odor) documented on the Sediment Sampling Log forms (Appendix A). Sediment cores were not sub-sampled for chemical testing, but were archived frozen at the site for possible analysis at a later date.
Pierce Mill Cove, Post-dredge Cores. Each sediment core was visually characterized and the physical characteristics (i.e., material type, color, consistency, particle size and odor) documented on the Sediment Sampling Log forms (Appendix A). A sub-set of the cores were sub-sampled for PCB analysis (i.e., stations X33, T38, CC27, T22, D32, D25, and bb28); core segments tested were selected based on location, color change, and core stratigraphy. Cores not selected for chemical testing were archived frozen at the site.
Based on the visual characterization, a segment from top of the core to the visual interface was collected for analysis. A 6-inch segment below the visual interface was also sampled and archived frozen at the site for potential future analysis. The sediment was removed from the core using a decontaminated metal spoon and homogenized in a disposable aluminum bowl. Dedicated processing equipment was used for each sample to minimize the potential for cross-contamination and reduce the use of solvents. Samples were collected into pre-cleaned, 8-oz glass jars with Teflon® lined lids and transferred on ice to Battelle for chemical testing.
New Bedford Harbor 2008 Sediment Monitoring June 2009 Final Report Page 11 of 31

North of Wood Street Cores. Each core was visually characterized and physical characteristics (i.e., material type, color, consistency, particle size and odor) documented on the Sediment Sampling Log forms (Appendix A). All sediment cores were sub-sampled for chemical testing. Two samples were taken from each core (i.e., depth intervals 0 to 0.5 ft and 0.5 to 1.0 ft), homogenized, and placed into sample containers. The sample from the 0.0 to 0.5 foot interval was submitted for PCB analysis. The sample from the 0.5 to 1.0-foot interval was frozen and archived at the site until further notice. Samples were collected into pre-cleaned, 8-oz glass jars with Teflon® lined lids and transferred on ice to Battelle for PCB analysis.
OU3 Pilot Cap Sediment Grabs. The material type for each sediment grab was documented on the Sediment Sampling Log forms (Appendix A). The surface 0.3 ft from each sample was homogenized and sub-sampled for PCB analysis. Samples were collected into pre-cleaned, 8-oz glass jars with Teflon® lined lids and transferred on ice to Battelle for chemical testing.
2.3 Chemical Testing
2.3.1 Polychlorinated Biphenyls
Chemical testing of the sediment samples for PCB congeners and homologues was performed by Battelle, located in Duxbury, MA. Prior to analysis, samples were air-dried overnight to ensure percent solids in the samples were >50%. Approximately 5 g of the air-dried sample was spiked with surrogates and extracted using accelerated solvent extraction following modified USEPA Method 3545. The extracts were processed through activated copper for sulfur removal and then received disposable Florisil column clean-up. The post-Florisil extract was concentrated, fortified with internal standards (IS), and submitted for analysis.
All sample extracts were analyzed for the 18 National Status and Trends (NS&T) congeners using gas chromatography/electron capture detection by dual column confirmation, following modified USEPA Method 8082. Sample data were quantified by the method of internal standards, using the IS compounds. Positive congener results were confirmed by a secondary column confirmation analysis with the higher of the two results reported, unless analyst discretion required otherwise (e.g., the result without an interference signal was reported). Congener results that were greater than 40% different between the first and second column analysis were ‘p’ qualified.
The project requires that a minimum of 7.5% of the samples be analyzed for PCB homologues to evaluate the comparability of the PCB congener-homologue data, and verify the relationship between congeners and homologue groups as a defensible means of performing total PCB analysis (Jacobs, 2005). For the 2008 dredge season, approximately 13% of the sediment samples (6 out of 45 total samples) were analyzed for PCB homologues using gas chromatography/mass spectrometry, following modified USEPA Method 8270C. Specifically, two samples were selected at random from each of the collection areas: Pierce Mill Cove, NWS, and OU3. The homologue analysis was performed using the sample extract from the congener analysis (i.e., the same extract was analyzed by two methods to determine PCB congener [Method 8082] and homologue [Method 8270C] data). Sample data were quantified by the method of internal standards, using the IS compounds.
New Bedford Harbor 2008 Sediment Monitoring June 2009 Final Report Page 12 of 31

Concentrations of total PCB were calculated using the congener and homologue results to assess how comparable the methods (i.e., congeners vs. homologues) are with respect to determining the concentration of total PCB in sediment sampled at the site. Based on a previous site-specific correlation study, total PCB was calculated as the sum of the 18 NS&T congeners multiplied by the project-specific factor for upper and lower harbor sediments of 2.6. Total PCB was also calculated as the sum of the homologues. Total PCB was also calculated as the sum of the homologues. A value of zero (0) was used in the summation for non-detects. PCB congener and homologue results are reported in mg/kg dry weight to two significant figures in this report.
2.3.2 Quality Control
A routine set of QC samples were prepared with each batch of 20 or fewer project samples to monitor data quality in terms of accuracy and precision. Each batch of project samples included one method blank, one laboratory control sample (LCS), and one matrix spike and matrix spike duplicate (MS/MSD). For the post-dredge core samples, a laboratory duplicate was analyzed in place of a field duplicate.
2.4 Data Analysis
Microsoft® Excel 2003 and JMP (The Statistical Discovery Software, a business unit of SAS Institute, Inc.) were used to characterize the sediment PCB data and assess potential trends in the long-term monitoring data. Total concentrations of PCB were used in all data evaluations. XY scatter plots were prepared in Excel to evaluate the correlation between sediment thickness and PCBs. Box plots were prepared in JMP to illustrate 10
Possible outlier9the sample distribution for total PCB. Figure 9A 8shows a sample box plot, where the box plot displays
the median (represented by the center horizontal line), the 25th percentile (represented by the bottom of the box), and the 75th percentile (represented by the top of
Tot
al P
CB
(m
g/kg
)
7 75th quartile 6
5
4
2the box). The vertical lines, or whiskers, are drawn 1
25th quartilefrom the box to the most extreme point within 1.5 0
3 Median
interquartile range. (An interquartile range is the distance between the 25th and the 75th percentiles). Sample Year
Test Period
Values above or below the whiskers represent potential outliers. Figure 9A. Example Box Plot.
PCB data were also evaluated statistically in JMP by using the one way analysis of variance
Tes
t P
ara
met
er
-1.5
-1
-0.5
0
0.5
1
1.5
2005 2006 2007
Test Period
95%
Confidence
interval
Group mean
Overlap
marks
(ANOVA) to determine if there were significant differences among the sampling periods. The ANOVA used the natural logarithms of the total PCB data because this transformation stabilized the variance and better represented the apparent trends in the data. Figure 9B shows an example of the output from the ANOVA, where the diamonds illustrates a sample mean and 95% confidence interval. Overlap marks are drawn above and below the group mean. For groups with equal sample sizes, overlapping marks indicate that the Figure 9B. Example Output from
ANOVA.
New Bedford Harbor 2008 Sediment Monitoring June 2009 Final Report Page 13 of 31

two group means are not significantly different at the 95% confidence level. The line across the chart represents the overall response mean (arithmetic mean of all data). Wherever the ANOVA results indicated there was a significant difference among the sampling periods, a Tukey least significant difference test was performed to characterize the relationships among the periods.
New Bedford Harbor 2008 Sediment Monitoring June 2009 Final Report Page 14 of 31

3.0 RESULTS
3.1 Field Activities
Results from the sediment monitoring activities performed at the Pierce Mill Cove, NWS and OU3 areas of the site are described below. Complete field data including sample collection information and digital photographs of the sediment cores are provided in Appendix A. Digital photographs of the cores were uploaded to the New Bedford Harbor project database. These photographs are linked in the database to the location information and to the analytical results and can be viewed individually.
3.1.1 Pierce Mill Cove
Sediment monitoring activities conducted in support of the remedial dredging at Pierce Mill Cove included pre- and post-dredge core sampling. Pre-dredge coring was performed to determine the elevation of the visual transition and sediment thickness of the OL layer to assist dredge planning. Post-dredge coring was performed to assess the overall performance of the dredging operation and support future needs.
Pre-dredge Core Sampling. Pre-dredge cores were collected on May 30, 2008 at 15 locations identified by Jacobs. Sediment cores were examined to determine the elevation of the visual transition and sediment thickness of the OL layer. The thickness of the OL layer ranged from 0.5 to 2.2 ft (Table 1, Figure 10). These data were used by USACE NAE and Jacobs to refine the target dredge elevations for the final 2008 dredge plan (Jacobs, 2009).
The physical characteristics of the pre-dredge cores were typical of sediments previously described at the site, although surface sediments were generally more sandy compared to other dredge areas sampled in previous years. The cores were generally comprised of two distinct layers. The surface layer was characterized by fine-grained, loose black organic silt (‘OL’ in the USCS) with some sand. This surface layer ranged from about 0.5 to 2.2-ft of OL (Table 1). The thickness of the OL layer was generally higher in the northwest region of the cove and lower to the east near the river (Figure 10). Below this OL layer the sediment type was generally comprised of moderately firm olive-gray clay (‘OH’ in the USCS, defined as organic clay, organic silt). Figure 10. Pre-dredge Thickness of OL Layer
at Pierce Mill Cove.
New Bedford Harbor 2008 Sediment Monitoring June 2009 Final Report Page 15 of 31

Table 1. Elevation Data From the 2008 Pre-dredge Sampling Eventa, Pierce Mill Cove.
Station Northing
NAD 83 MA, ft Easting
NAD 83 MA, ft
Elevation of visual transition (native to OL)
(NVGD, ft)
Measured Sediment
Thickness of OL Layer (ft)
VV47 2701774.17 815199.91 -5.8 0.70
VV47 (duplicate) 2701774.17 815199.91 -5.8 0.80
RR42 2701887.10 815088.07 -4.6 0.90
AAA32 2702149.76 815326.76 -5.7 0.80
SS28 2702249.43 815125.35 -4.2 0.80
AAA22 2702399.18 815324.55 -6.2 1.70
HH30 2702186.76 814849.38 -4.1 0.60
HH36 2702049.74 814850.42 -4.2 1.10
DD28 2702238.06 814738.27 -7.6 2.20
W26 2702288.30 814561.37 -3.8 0.80
AA31 2702174.42 814675.76 -5.7 1.40
EE24 2702336.82 814762.41 -3.1 0.50
L34 2702099.57 814300.54 -3.7 1.60
P23 2702361.75 814399.16 -6.4 1.90
L22 2702399.44 814300.16 -3.6 1.30
X43 2701862.15 814586.72 -4.1 1.50
a Samples collected on May 30, 2008.
Post-Dredge Sediment Sampling. Post-dredge sediment cores were collected on December 5, 2008 to verify the final sediment condition at the end of the 2008 dredge season. Post-dredge cores were collected at 14 locations identified by Jacobs; none of which represented locations sampled during the pre-dredge coring event. Post-dredge cores were examined to determine the elevation of the visual transition and sediment thickness of the OL layer (Table 2). The thickness of the OL layer remaining in the sediment after completion of dredging activities at Pierce Mill Cove ranged from 0.3 to 1.6-ft (Table 2).
The post-dredge cores had the same general physical characteristics as was observed in the pre-dredge events. Nearly all of the post-dredge cores were comprised of two distinct layers (OL overlying OH); no clear transition was evident for the post-dredge cores collected at stations DD44 and T38. The visual transition zone in many of the post-dredge cores was noticeably different from the pre-dredge cores. That is, there were fewer cores with sharp demarcations between the OL and OH layers, and these blurred transitions tended to be thicker (>0.5-ft) compared to the pre-dredge cores.
New Bedford Harbor 2008 Sediment Monitoring June 2009 Final Report Page 16 of 31

Table 2. Elevation Data from the 2008 Post-dredge Sampling Eventa, Pierce Mill Cove.
Station Northing
NAD 83 MA, ft Easting
NAD 83 MA, ft
Elevation Measurements (NGVD ft) Measured
Sediment Thickness of
OL Layer (ft)
Actual vs. Predicted Transition Elevation
(ft)c
Target Dredge
Elevationb
Measured Elevation of
Visual Transition
(Native to OL)
Measured Elevation
of Sediment Surface
DD44 2701849.68 814748.15 -4.9 -6.7 -5.4 1.3 -1.8 EE37 2702026.51 814773.70 -4.6 -5.1 -4.8 0.3 -0.5 X33 2702123.59 814599.03 -4.8 -5.3 -4.2 1.1 -0.5 T38d 2701999.16 814510.51 -3.7 -5.3 -3.9 1.4 -1.6 CC27 2702273.74 814726.35 -5.6 -7.3 -6.4 0.9 -1.7 T22 2702387.21 814486.89 -5.5 -5.2 -4.8 0.4 0.3 N25 2702310.66 814338.21 -4.7 -3.0 -2.6 0.4 1.7
N25(duplicate) 2702310.66 814338.21 -4.7 -3.5 -2.7 0.8 1.2 D32 2702147.00 814099.75 -2.1 -3.7 -3.2 0.5 -1.6 D25 2702324.58 814100.24 -3.0 -3.2 -2.5 0.7 -0.2 bb28 2702250.56 813949.35 -1.6 -3.9 -2.9 1.0 -2.3 HH23 2702375.29 814850.30 -3.1 -4.8 -3.2 1.6 -1.7 NN34 2702089.21 814987.03 -4.4 -3.7 -3.0 0.7 0.7 LL40 2701936.86 814939.77 -5.6 -4.0 -2.9 1.1 1.6 UU33 2702113.75 815162.06 -4.5 -4.7 -3.7 1.0 -0.2
a Samples collected on December 5, 2008. b Source: Jacobs (2009). c Actual vs. Predicted = Measured Elevation of Visual Transition (ft) – Target Dredge Elevation (ft). d QA split collected and sent to independent testing laboratory.
3.1.2 North of Wood Street
River sediment and shoreline soil samples were collected at the NWS area in November and December, 2008 (Table 3). All samples were visually examined to characterize the physical characteristics of the one foot of surface sediment/soil (Appendix A).
River Sediment. Many of the river sediments had similar physical characteristics, characterized by a layer (0.2 to 0.8 feet) of fine black silt underlain by sand, clay or silt. The physical characteristics of sediment located closer to the shoreline and further upstream were different compared to in-river sediment locations. For example, station 030W, located near the western shore of the river, was comprised of brown sand with organic material underlain by sand and gravel. Station 030E, located near the eastern shore of the river, was uniformly comprised of medium sand throughout the entire one foot core. Station 010, located at the northern boundary of the NWS area, was comprised of medium to coarse, grey-black sand and gravel.
Shoreline Soil. Soils located along the western shore were generally comprised of sand underlain by sand and gravel. Soils located along the eastern shore were generally comprised of fine to coarse, loose brown organic silt and sand underlain by gravel, silt and sand. Shoreline soils at stations NWS-34, NWS-35, NWS-36, and NWS-37 had a more uniform composition within the top one foot.
New Bedford Harbor 2008 Sediment Monitoring June 2009 Final Report Page 17 of 31

Table 3. Summary of Samples Collected at the North of Wood Street, 2008.
Station Sample
Type Collection
Date Collection
Time
Northing (NAD 83 MA ft)
Easting (NAD 83 MA ft)
Study Samples 010
River Sediment
12/3/08 1204 2709128.94 815353.74 016 12/3/08 1140 2708949.2 815397.87 023 12/3/08 1126 2708814.59 815412.09 028 12/3/08 1112 2708704.43 815400.22
030E 11/20/08 0905 2708683.7 815498.6 030W 11/20/08 1004 2708653.30 815363.80 033 12/3/08 1102 2708613.29 815412.90 038a 12/3/08 1050 2708517.71 815383.18 039 12/3/08 1028 2708513.84 815410.39 040 12/3/08 1017 2708514.69 815462.20 048 12/3/08 0950 2708387.52 815414.40 049 12/3/08 1002 2708405.78 815468.41 055 12/3/08 0924 2708266.99 815461.10
055 REP 12/3/08 0935 2708266.99 815461.10 062 12/3/08 0915 2708165.92 815567.28
NWS-33
Shoreline Soil
11/20/08 1109 2709039.40 815330.20 NWS-34 11/20/08 1100 2708923.90 815338.80 NWS-35 11/20/08 0922 2708759.89 815508.68 NWS-36 11/20/08 0932 2708761.25 815516.12 NWS-37 11/20/08 0913 2708682.25 815534.72 NWS-38 11/20/08 0940 2708819.27 815503.15 NWS-39 11/20/08 0944 2708820.21 815508.55
QC Samples
055 REP Field
duplicate 12/3/2008 9:35:00 2708266.99 815461.1
038 QA Split 12/3/2008 10:50:00 2708517.71 815383.18
EB Equipment
blank 11/20/2008 13:35:00 — —
a QA split collected and sent to independent testing laboratory.
3.1.3 OU3 Pilot Cap Site
Sediment grab samples were collected in October 2008 at 17 locations at the OU3 Pilot Cap site (Table 4). Based on a visual characterization of the surface sediments (Appendix A), sediments were generally comprised of fine sand with some silt. Sediments from valley locations often had more silt compared to ridge locations. Algal mats and seaweed were observed at many of the locations (Appendix A).
New Bedford Harbor 2008 Sediment Monitoring June 2009 Final Report Page 18 of 31

Table 4. Summary of Samples Collected at the OU3 Pilot Cap Site, 2008.
Station Collection
Date Collection
Time
Northing (NAD 83 MA ft)
Easting (NAD 83 MA ft)
Study Samples OU01 10/6/2008 14:00 2685668.74 817983.57 OU02a 10/6/2008 14:49 2685864.94 818148.87 OU03 10/6/2008 14:26 2685852.81 817883.21 OU04 10/7/2008 10:09 2686006.17 818038.56 OU05 10/7/2008 9:45 2686187.28 818195.19 OU06 10/7/2008 9:25 2686192.94 817953.68 OU07 10/7/2008 10:43 2686017.93 817778.95 OU08 10/7/2008 8:57 2686233.99 817749.23 OU09 10/6/2008 12:47 2686125.16 817487.92 OU10 10/6/2008 12:14 2686249.50 817478.51 OU11 10/6/2008 11:53 2686374.39 817641.09 OU12 10/6/2008 11:08 2686489.87 817490.14 OU13 10/6/2008 11:27 2686395.40 817310.32 OU14 10/6/2008 10:46 2686643.80 817323.85 OU15 10/6/2008 10:26 2686715.37 817494.27 OU16 10/6/2008 9:54 2686837.18 817325.12 OU17 10/6/2008 9:34 2686800.94 817191.41
QC Samples OU16 (field duplicate) 10/6/2008 10:05 2686837.18 817325.12
OU02 (QA Split) 10/6/2008 14:49 2685864.94 818148.87 EB (Equipment blank) 10/6/2008 13:05 — —
a QA split collected and sent to independent testing laboratory.
3.2 Chemical Testing
This section summarizes the PCB results for sediment samples collected at the Pierce Mill Cove, NWS, and OU3 pilot cap areas in 2008. Total PCB results are summarized in Table 5. Complete test results, along with results from the analysis of field- and laboratory-based QC samples, are provided in Appendix B. Results from the analysis of field-based QA split samples were reported directly to USACE NAE by the independent testing laboratory.
3.2.1 Pierce Mill Cove
Post-dredge concentrations of total PCB in the surface OL layer ranged from 10 mg/kg to 47 mg/kg (Table 5, Figure 11). These data suggest that PCB concentrations in surface sediment after dredging were within an order of magnitude of the predicted concentrations based on the geostatistical model.
3.2.2 North of Wood Street
Total PCB concentrations in surface (0 to 0.5 ft) sediment samples at the NWS area ranged from 0.98 to 180 mg/kg (Table 5). The highest concentrations of total PCB (>100 mg/kg) were measured at subtidal stations 055 and 039 (Figure 12). Lower concentrations of total PCB (<10
New Bedford Harbor 2008 Sediment Monitoring June 2009 Final Report Page 19 of 31

mg/kg) were measured in sediment collected closer to the shoreline (stations 030W and 030E) and further upstream (station 010) (Figure 12, Table 5).
Total PCB concentrations were substantially lower in the shoreline soils compared to the river sediments, with concentrations ranging from 0.076 to 0.67 mg/kg (Table 5). Total PCB concentrations were below the residential cleanup criteria (1 mg/kg) at all shoreline locations sampled at the NWS area in 2008.
3.2.3 OU3 Pilot Cap Site
Concentrations of total PCB measured in surface sediment sampled in 2008 at the OU3 pilot cap site are shown in Figure 13 and summarized in Table 5. Overall, concentrations of total PCB were slightly higher at the valley locations (concentrations ranged from 0.23 to 6.0 mg/kg, Table 5) compared to ridge locations (concentrations ranged from 0.26 to 2.2 mg/kg, Table 5).
3.3 Quality Control
Results from the field- and laboratory-based QC samples are reported with the sample data provided in Appendix B. Results from the analysis of the field- and laboratory-based QC samples were evaluated against the measurement performance criteria (MPC) to evaluate the data quality in terms of accuracy and precision.
3.3.1 Field Activities
Results from the field-based QC samples were acceptable with respect to the MPC, indicating that the sampling methods were in control. That is, PCBs were undetected in the equipment blanks (Appendix B) and total PCB concentrations were comparable between the field replicates (Table 5).
3.3.2 Chemical Testing
QA/QC narratives that summarize the results from the laboratory-based QC samples against the MPC are provided in Appendix B. Results from the laboratory-based QC samples met the MPC, indicating that the laboratory methods were in control and that these data are useable. For example, the target compounds were undetected in the method blanks, indicating that the methods were free of contamination. In addition, recovery and precision results for the laboratory-based QC samples (i.e., LCS, MS, MSD and laboratory duplicate) were acceptable for all target compounds, indicating that the methods were in control.
A sub-set of the sediment samples were also analyzed for PCB homologues. Total PCB concentrations, calculated using both the congener and homologue data, are summarized in Table 5. The relative percent difference between the total PCB values, calculated using both the congener and homologue data, was within 15%, indicating that the two methods are comparable. Total PCB calculated by the homologue method was biased high compared to the congener method in five of the six samples (Table 5).
New Bedford Harbor 2008 Sediment Monitoring June 2009 Final Report Page 20 of 31

Table 5. Total PCB Concentrations in Surface Sediment at the Site, 2008.
Study Area Sample Type Station Depth Interval (ft) Total PCBa (mg/kg)
Pierce Mill Cove
Post-dredge cores
X33 0.0-1.1 45/49 b
T38 0.0-1.0 12 CC27 0.0-0.9 47 T22 0.0-0.4 37 D32 0.0-0.5 19 D25 0.0-0.7 24 bb28 0.0-1.0 10/11 b
North of Wood Street
River sediment
010 0.0-0.5 2.3 016 0.0-0.5 29 023 0.0-0.5 44/51b
028 0.0-0.5 76 030E 0.0-0.5 1.1 030W 0.0-0.5 0.98 033 0.0-0.5 74 038 0.0-0.5 33 039 0.0-0.5 140 040 0.0-0.5 24 048 0.0-0.5 46 049 0.0-0.5 23/26b
055 0.0-0.5 180/150c
062 0.0-0.5 58
Shoreline soil
NWS-33 0.0-0.5 0.19 NWS-34 0.0-0.5 0.2 NWS-35 0.0-0.5 0.67 NWS-36 0.0-0.5 0.18 NWS-37 0.0-0.5 0.13 NWS-38 0.0-0.5 0.076 NWS-39 0.0-0.5 0.14
OU3 Pilot Cap Site
Sediment grabs – Ridge
locations
OU1 0.0-0.3 1.1 OU4 0.0-0.3 1.6 OU5 0.0-0.3 0.28
OU11 0.0-0.3 0.26 OU15 0.0-0.3 2.2 OU17 0.0-0.3 0.57
Sediment grabs – Valley
locations
OU2 0.0-0.3 3.5 OU3 0.0-0.3 0.23 OU6 0.0-0.3 1.3 OU7 0.0-0.3 0.99 OU8 0.0-0.3 0.5 OU9 0.0-0.3 0.84
OU10 0.0-0.3 0.54 OU12 0.0-0.3 0.73/0.85 b
OU13 0.0-0.3 6/5.8 b
OU14 0.0-0.3 0.9 OU16 0.0-0.3 2.2/1.8 c
a Total PCB = sum 18 NS&T congeners * 2.6. b Total PCB based on sum of homologues. c Total PCB result for field duplicate.
New Bedford Harbor 2008 Sediment Monitoring June 2009 Final Report Page 21 of 31

Figure 11. Total PCB Concentrations in Post-dredge Sediment at Pierce Mill Cove, 2008.
New Bedford Harbor 2008 Sediment Monitoring June 2009 Final Report Page 22 of 31

Figure 12. Total PCB Concentrations in Sediment/Soil at North of Wood Street, 2008.
New Bedford Harbor 2008 Sediment Monitoring June 2009 Final Report Page 23 of 31
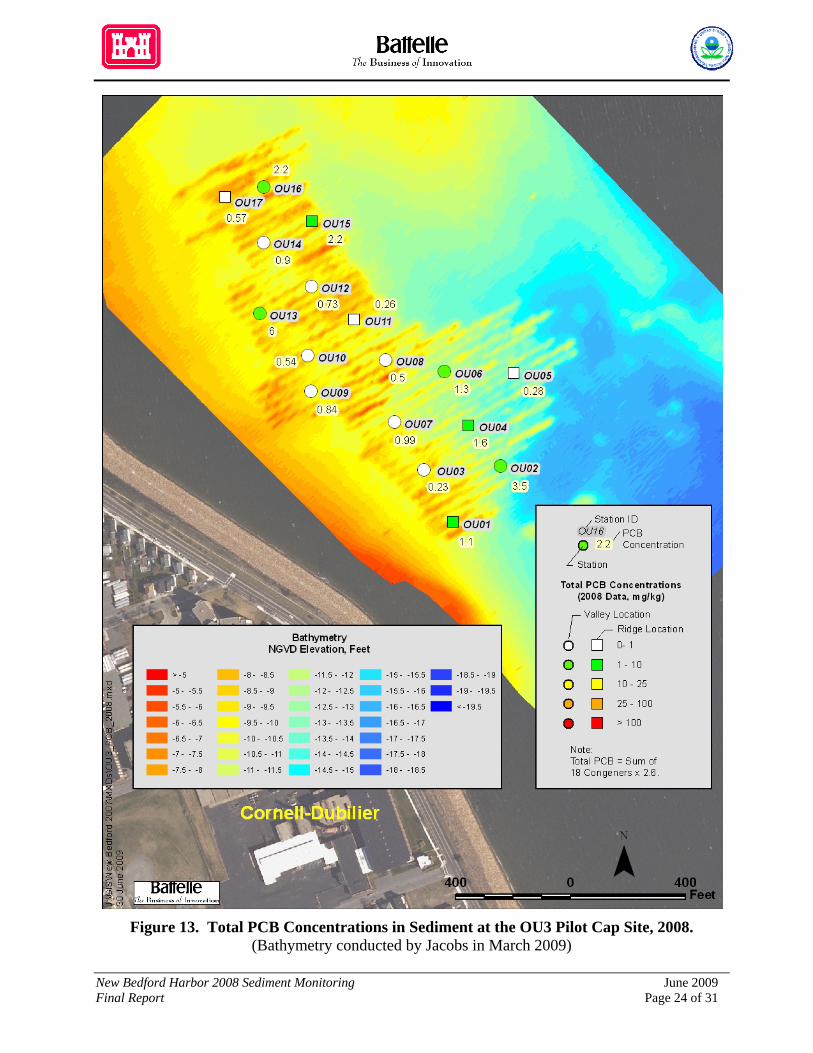
Figure 13. Total PCB Concentrations in Sediment at the OU3 Pilot Cap Site, 2008.
(Bathymetry conducted by Jacobs in March 2009)
New Bedford Harbor 2008 Sediment Monitoring June 2009 Final Report Page 24 of 31

4.0 DISCUSSION
4.1 Vertical Elevation Results Related to Dredging
The collection of post-dredge cores provided a characterization of the post-dredge sediment condition relative to the pre-dredge condition as well as setting a baseline for recently dredged areas. This baseline informs the planning process for subsequent years and provides feedback regarding re-deposition of sediments from dredging or natural processes.
Comparison of the visual characterization of the pre- and post-dredge cores revealed that the depth of the sediment surface and the overall thickness of OL layers were reduced at the Pierce Mill Cove dredge area. These were clear and expected results of the dredging. The thickness of the OL layer in pre-dredge cores ranged from 0.5 to 2.2 ft, with a median thickness of 1.0 ft. The thickness of the OL layer in the post-dredge cores ranged from 0.3 to 1.6 ft, with a median thickness of 0.85 ft.
Other post-dredge observations related to the visual transition between sediment types were also apparent. For example, in many cases, the post-dredge cores had less distinct visual transitions. In these cases, the transitions occurred over a relatively broad band (>0.5-ft) of mixed sediment. In most of these cases it appeared that the visual transition zone may have been disturbed during dredge related activities. In many cases (10 out of 15), the elevation of the post-dredge visual transition also occurred at a deeper elevation than predicted (Table 2).
There was an insufficient number of observations from the 2008 dredge season (n = 7) to meaningfully evaluate the correlation between the thickness of the OL layer and total PCB concentrations in the Pierce Mill Cove post-dredge sediments. The limited data suggest that sediments with a thicker OL layer have higher concentrations of total PCB, except at stations T38 and bb28 where the total PCB concentrations were relatively low compared to other sediments with similar sediment thickness (Figure 14).
X33
T38
CC27
T22
D32
D25
bb28
0
10
20
30
40
50
0 0.2 0.4 0.6 0.8 1 1.2
Thickness (ft) of OL Layer
To
tal P
CB
(m
g/k
g)
Figure 14. Correlation between Sediment Thickness of the OL Layer and Total PCB in Post-dredge Sediment, Pierce Mill Cove.
New Bedford Harbor 2008 Sediment Monitoring June 2009 Final Report Page 25 of 31

4.2 PCB Trends at the North of Wood Street
Several investigations have been conducted to characterize PCB contamination at the NWS area following remediation activities conducted in 2002-2003 to remove PCB-contaminated sediments and soils from the river and surrounding shoreline (Tetra Tech FW, Inc. [TTFW], 2004). A confirmatory sampling event was conducted by TTFW immediately following the remediation in February 2003 (North of Wood Street Cleanup Zone Map, USEPA, 2009). ENSR conducted four sampling events in the area to evaluate changes in river sediment PCB concentrations that may have occurred due to seasonal influence and/or remediation activities, as follows: August 2004 (pre-dredging), May 2005 (spring flow conditions), September 2005 (pre-dredging, late summer flow), and January 2006 (post-dredging). Annual monitoring has been performed since 2006 to further assess potential recontamination of the NWS area; sampling events were conducted in the late fall (November/December) after completion of dredging activities for the season.
4.2.1 River Sediments
The long-term monitoring data indicate that total PCB concentrations in river sediment at the NWS area are spatially and temporally variable (Figures 15 and 16). The variability among the PCB data may reflect differences in bulk sediment characteristics (e.g., grain size and organic carbon content), the highly dynamic nature of the system (e.g., tides, storm waves, high spring river flows), which can influence resuspension and transport of bottom sediment in the area, or a combination of these factors. In general, median concentrations of total PCB are lower and the distribution of the data less variable in surface sediment sampled at the upstream boundary of the study area (i.e., stations 010, 016, and 023) and near the shore (i.e., station 030E and 030W) compared to downstream locations (Figure 15).
Concentrations of total PCB (log transformed) in sediment sampled at a common group of locations (stations 023, 028, 033, 040, 049) across all sampling periods from 2003 to 2008 are shown in Figure 16. The lowest concentrations of total PCB in river sediment were measured in 2003, immediately following the remediation of the NWS area in the winter of 20022003. A post-remediation increase was observed in 2004 (Figure 16). While total PCB
Tot
al P
CB
(m
g/kg
)
0
50
100
150
200
250
010
016
023
030E
030W 02
8
033
038
039
040
048
049
055
062
Upstream Downstream
Station within Study Area
Sep-05
Jan-06
Aug-04
Figure 15. Distribution of Total PCB in River Sediment at the North of Wood Street, 2003-2008. (open circles
represent 2003-2007 data and filled circles represent 2008 data)
New Bedford Harbor 2008 Sediment Monitoring June 2009 Final Report Page 26 of 31

concentrations decreased in the two subsequent sampling periods, post-remediation levels in recent years remain elevated compared to 2003 (Figure 16). Statistical analysis indicates that the post-remediation data from the August 2004, May 2005, and November 2006 to 2008 sampling periods are significantly high than that seen in February 2003 and September 2005 (p = 0.001)1. The post-remediation increase could have resulted from contaminant transport from the upper harbor during dredging activities, natural transport of contaminated sediment from unremediated areas of the Harbor during tidal cycles, storms or high winds, or a combination of these factors. A sediment trap study conducted in the vicinity of the Wood Street bridge also showed that natural transport processes and human activities such as remedial dredging can influence the deposition of PCB-contaminated sediment material at the NWS area (Battelle, 2009).
Annual sediment monitoring will continue at the NWS area as needed to assess the potential for recontamination from the unremediated Harbor areas immediately to the south.
Log
Tot
al P
CB
-1
-0.5
0
0.5
1
1.5
2
2.5
Feb-2003
Aug-2004
May-2005
Sep-2005
Jan-2006
Nov-2006
Nov-2007
Nov-2008 Sampling Period
Figure 16. Temporal Trends in Total PCB (log normalized) in River Sediment at the North of Wood Street, 2003-2008. (common stations 023, 028, 033, 040
and 049; symbols represent the individual data points, diamonds illustrates the sample mean and
95% confidence interval)
4.2.2 Shoreline Soils
In December 2005, Jacobs Engineering performed additional remediation at the eastern shoreline of the NWS area to remove contaminated soils that were inadvertently missed during the 20022003 remediation. Post-remediation concentrations of total PCB have been below the recreational cleanup criteria (25 mg/kg recreational shoreline land use criteria) at all shoreline locations since 2006 (Figure 17), suggesting that the remediation was effective in terms of achieving the cleanup criteria.
To
tal P
CB
(m
g/k
g)
-1
0
1
2
3
4
5
6
7
8
NWS-33 NWS-34 NWS-35 NWS-36 NWS-37 NWS-38 NWS-39
Station
Nov-07
Nov-07
Figure 17. Distribution of Total PCB in Shoreline Soil at the North of Wood Street, 2006-2008. (open circles represent the 2006-2007 data and filled
circles represent the 2008 data)
1 The post-remediation data (i.e., means) from the following sampling periods are not significantly different: Group A: August 2004, May 2005, January 2006, and November 2006 through 2008; Group B: January 2006 and September 2005; and Group C: February 2003 and September 2005.
New Bedford Harbor 2008 Sediment Monitoring June 2009 Final Report Page 27 of 31

The monitoring data indicate that concentrations of total PCB in shoreline soils have been uniformly low over space and time, except at stations NWS-34 and NWS-37 (Figure 17). Total PCB concentrations at these locations were elevated in 2007, but decreased in 2008 returning to low levels representative of other shoreline locations (Figure 17). There were no significant differences in total PCB concentrations among the sampling periods (Figure 18).
4.3 PCB Trends OU3 Pilot Cap Site
The OU3 Pilot Cap site is a localized area of elevated PCB contamination located outside the hurricane barrier in New Bedford, MA (Figure 2). In 2005, this area was capped with parent material dredged during the construction of a CAD cell in New Bedford Harbor. Annual monitoring has been performed since 2005 (shortly after completion of the capping activity) to determine the effectiveness of cap placement in lowering surficial sediment PCB concentrations, as well as the extent of change in PCB concentrations over time.
Log
Tot
al P
CB
-2
-1.5
-1
-0.5
0
0.5
1
Nov-2006 Nov-2007 Nov-2008
Sample Date
Figure 18. Temporal Trends in Total PCB (log normalized) in Shoreline Soil at the North of Wood Street, 2006-2008. (symbols represent the
individual data points, diamonds illustrates the sample mean and 95% confidence interval)
The long-term monitoring data indicate that total PCB concentrations are uniformly low over space and time at most locations sampled at the OU3 pilot cap (Figure 19). Total PCB concentrations are spatially and temporally variable at valley stations OU12, OU13, and OU14 (Figure 19). Total PCB concentrations in surface sediments sampled in 2008 were among the lowest measured over the monitoring period, especially at valley locations (Figure 19).
There were no significant differences in total PCB concentrations (log transformed) among the sampling periods at ridge locations (Figure 20A). However, concentrations of total PCB were significantly lower (p = 0.04) at valley locations in 2008 compared to 2005 (Figure 20B). The decrease could reflect the deposition of cleaner material at these locations.
Overall, the long-term monitoring data suggest that the cap remains effective in terms of the surficial PCB data (i.e., no change and/or increase in surficial PCB contamination).
Tot
al P
CB
(m
g/kg
)
0
5
10
15
OU
1
OU
11
OU
15
OU
17
OU
4
OU
5
OU
10
OU
12
OU
13
OU
14
OU
16
OU
2
OU
3
OU
6
OU
7
OU
8
OU
9
Ridge Valley
Station within Location
Figure 19. Distribution of Total PCB in Sediment at the OU3 Pilot Cap Site, 2005-2008. (open circles represent
2005-2007 data and filled circles represent 2008 data)
New Bedford Harbor 2008 Sediment Monitoring June 2009 Final Report Page 28 of 31

Log
Tot
al P
CB
-1.5
-1
-0.5
0
0.5
1
1.5
2005 2006 2007 2008
Sample Year
A
Lo
g T
ota
l PC
B
-1.5
-1
-0.5
0
0.5
1
1.5
2005 2006 2007 2008
Sample Year
B
Figure 20. Temporal Trends in Total PCB (log normalized) in Sediment at Ridge (A) and Valley (B) Locations at the OU3 Pilot Cap, 2005-2008. (symbols represent individual data points
(log normalized) and diamonds illustrates the sample mean and 95% confidence interval)
New Bedford Harbor 2008 Sediment Monitoring June 2009 Final Report Page 29 of 31

5.0 REFERENCES
Battelle. 2009. Sediment Trap Study Report, New Bedford Harbor Superfund Site, New Bedford, Massachusetts. Prepared under Contract DACW33-03-D-0004 Task Order No 0022 for the U.S. Army Corps of Engineers New England District, Concord, MA. March.
Battelle. 2008a. Environmental Monitoring, Sampling and Analysis, Sediment Monitoring Final Field Sampling Plan New Bedford Harbor Superfund Site, New Bedford, Massachusetts. Prepared under Contract DACW33-03-D-0004 Task Order No 0022 for the U.S. Army Corps of Engineers New England District, Concord, MA. May.
Battelle. 2008b. Environmental Monitoring, Sampling, and Analysis Quality Assurance Project Plan Addendum Revision 1.0 New Bedford Harbor Superfund Site, New Bedford, Massachusetts. Prepared under Contract DACW33-03-D-0004 Task Order No 0022 for the U.S. Army Corps of Engineers New England District, Concord, MA. June.
Battelle. 2008c. North of Wood Street Monitoring, Summary Report, 2007 Remedial Dredging. Prepared under Contract DACW33-03-D-0004 Task Order No 0022 for the U.S. Army Corps of Engineers New England District, Concord, MA. June.
Battelle. 2007. North of Wood Street Monitoring, Summary Report, 2006 Remedial Dredging. Prepared under Contract DACW33-03-D-0004 Task Order No 0022 for the U.S. Army Corps of Engineers New England District, Concord, MA. July.
ENSR Corporation. 2004. Field Sampling Plan Addendum New Bedford Harbor Superfund Site. Prepared Under NAE Contract No. Dacw33-00-D-0003 Task 010. U.S. Army Corps Of Engineers New England District Concord, Massachusetts. August.
ENSR Corporation. 2005. Sediment Sampling Summary Report DMU-2, Fall 2005.
ENSR Corporation. 2006. Progress Sediment Sampling at OMU-2 and OMU-4, Fall 2005. Dacw33-00-D-0003. U.S. Army Corps Of Engineers New England District Concord, Massachusetts. June.
Foster-Wheeler Environmental Corp. 2001. Pre-Design Field Test Dredge Technology Evaluation Report. New Bedford Harbor Superfund Site. August 2001.
Foster-Wheeler Environmental Corp. 2002. Technical Memorandum Visual Approach to PCB Contamination Characterization. New Bedford Harbor Superfund Site. May 2002.
Jacobs. 2009. 2008 Dredge Season Data Submittal, New Bedford Harbor Remedial Action. In Progress.
Jacobs. 2005. Quality Assurance Program Plan, New Bedford Harbor Superfund Site. Prepared for the U.S. Army Corps of Engineers New England District, Concord, MA. May.
New Bedford Harbor 2008 Sediment Monitoring June 2009 Final Report Page 30 of 31

Tetra Tech FW, Inc. (TTFW) 2004. North of Wood Street Confirmatory Sampling Report, New Bedford Harbor Superfund Site. August.
USEPA. 2009. North of Wood Street Cleanup Zone Map, available at http://www.epa.gov/ne/nbh/).
New Bedford Harbor 2008 Sediment Monitoring June 2009 Final Report Page 31 of 31