
Final Report Year 2: March 2002 – January 2003 Report Year 2: March 2002 – January 2003 I....
107
1 of 107 REDUCING BARRIERS TO USE OF HIGH EFFICIENCY LIGHTING SYSTEMS Final Report Year 2: March 2002 – January 2003 I. Project Title: Reducing Barriers to Use of High Efficiency Lighting Systems II. Project Sponsor: US Department of Energy III. Date of Report: January 22, 2003 IV. Prepared by: Lighting Research Center, Rensselaer Polytechnic Institute Lighting Research Center Rensselaer Polytechnic Institute 21 Union Street Troy, NY 12180 518-687-7100 518-687-7120 (fax)
Transcript of Final Report Year 2: March 2002 – January 2003 Report Year 2: March 2002 – January 2003 I....

1 of 107
REDUCING BARRIERS TO USE OF HIGH EFFICIENCY LIGHTING SYSTEMS
Final Report
Year 2: March 2002 – January 2003
I. Project Title: Reducing Barriers to Use of High Efficiency Lighting Systems
II. Project Sponsor: US Department of Energy
III. Date of Report: January 22, 2003
IV. Prepared by: Lighting Research Center, Rensselaer Polytechnic Institute
Lighting Research Center Rensselaer Polytechnic Institute 21 Union Street Troy, NY 12180
518-687-7100 518-687-7120 (fax)

Reducing Barriers to Use of High efficiency Lighting Systems
2 of 107
EXECUTIVE SUMMARY
With funding from the US Department of Energy (DOE), the Lighting Research Center (LRC) at Rensselaer Polytechnic Institute is (1) identifying barriers to widespread penetration of lighting controls in commercial/industrial (C/I) applications that employ fluorescent lamp technologies and (2) making recommendations to overcome these barriers.
Over the first year of the project (2001/2002), the LRC focused on identifying the barriers to the widespread use of lighting controls. The LRC reviewed existing research, technologies, patents, and market data related to lighting controls, interviewed manufacturers, surveyed control installers, and conducted peer group review to improve and validate a proposed set of recommendations. The LRC identified two distinct categories of effort, each with their own set of barriers: dimming controls (load-shed dimming and photosensor-activated daylight dimming) and automatic shut-off controls (occupancy sensors and time clocks)1. Participating experts in lighting agreed that the tasks associated with the latter category should be geared towards market transformations activities while the tasks to be performed under the first category should be focused on technological investigations and solutions.
The second-year scope of work focused on identifying and proposing solutions for each of the categories identified during the first year. In the category dealing with automatic shutoff controls, two tasks were undertaken. The first of these two tasks (4.7) was directed toward developing fixed values for energy savings from occupant sensors so state and regional agencies in the U.S. could use these values in their market transformation activities. Based upon an extensive review and analysis of the literature, the LRC developed fixed values for energy savings. The second of the two tasks (4.8) was directed at developing a best practices document that helps both manufacturers and installers improve the likelihood of installing and commissioning occupancy sensors.
In the category dealing with dimming, which represented the majority of the effort for the second year, the focus was on investigating and proposing specific technological parameters for product improvement. The LRC identified manufacturing partners to begin discussion about these technological solutions (e.g., development of load-shed ballast) and conducted limited testing. The LRC focused on economic, perceptional (human), and technical issues associated with whole-building and local control strategies, and undertook five tasks. In addition to developing a review of the progress in whole building control systems (4.1), great progress continues to be made in developing communication systems for lighting control systems. Problems still exist, however, with standardization and cost. These systems have developed their own momentum and only time will tell if and when the US market embraces whole-building lighting control systems. Neglected in most discussions of lighting controls is the lamp-ballast system used. Tasks 4.1, 4.2, 4.3, 4.4 and 4.5 concentrated on understanding lamp-ballast performance issues, which we believe must be at the core of developing any successful fluorescent lighting control system for C/I applications. The major issues to consider are occupant response, initial equipment cost, and lamp life. Heating the electrodes prolongs lamp life by minimizing the damaging effects of sputtering from both
1 Architectural dimming is excluded from this project.

Reducing Barriers to Use of High efficiency Lighting Systems
3 of 107
switching and dimming. These systems are commonly three to five times more expensive than systems that do not provide heat to the electrode. Without question, these systems reduce lamp life due to sputtering from starting and dimming. Interestingly however, a non-linear relationship exists between operating current and life. A central focus of the effort this year was to explore the technical and economic issues associated with dimming instant start systems. Finally, the LRC reviewed the significance of dimming for occupants and made recommendations for integrating them with lamp-ballast system performance.
Task 4.6, develops recommendations for improved components and systems as evaluated in Task 2 (technology assessment) and integrates all of the information on tasks 4.1 to 4.5.

Reducing Barriers to Use of High efficiency Lighting Systems
4 of 107
TASK 4.1 WORK WITH KEY MANUFACTURERS, INDUSTRY ASSOCIATIONS, GOVERNMENT AGENCIES AND NATIONAL LABORATORIES TO EXPAND THE BEST EXISTING COMMUNICATIONS PROTOCOLS, IF NECESSARY, TO MEET THE NEEDS OF A FULLY INTEGRATED LIGHTING AND WHOLE BUILDING CONTROL PROTOCOL
Introduction The lighting market in the United States has not experienced wide penetration of the use of whole building integrated lighting controls. While such lighting controls could undoubtedly reduce energy consumption for lighting, it must be realized that other, less expensive, lighting controls are available, and those markets have not seen pervasive utilization either. To determine whether the slow adoption of whole building lighting controls is due to technological barriers or other economic and market forces, it is necessary to take a critical look at the necessity of these controls and what economic benefits they offer. Then, an examination of what is currently available and what is being developed will determine if these needs are being met.
The success of lighting control products on the market must allow systems to achieve three main goals:
1. Achieve sufficient functionality to meet the key requirements of their main market.
2. Allow a significant cost reduction compared to current market standard systems. Cost should take into account: hardware capital cost including wiring, design time required by the specifier and the control system manufacturer, installation time required from the electrician, and commissioning time and remedial time required from the electrician and end user.
3. Minimize ongoing perceived overhead costs and inconvenience to the end user, or in other words, systems should be simple to understand and use.

Reducing Barriers to Use of High efficiency Lighting Systems
5 of 107
What benefits do whole building systems provide? Available control strategies differ widely in terms of functionality and cost; some are much simpler than others. Some operate locally on a small number of fixtures, and some collectively over a large number of fixtures. Some require continuous monitoring and immediate actions, while others are not so time sensitive. For analysis purposes, it is helpful to divide lighting control strategies into two groups based on similar communication needs. The groups are local control and collective control.
Local controls should respond to local conditions. They require continuous monitoring and often immediate (very short time delay) responses. Control strategies in this group include:
Occupancy sensors
Photosensor control
Manual switching and dimming
Collective controls respond to global, or external, signals. Exact timing of actions is not important because no immediate action is required. Many fixtures are often grouped together all responding to the same signal. Control strategies in this group include:
Scheduling (sweep off functions)
Load shed
Local control functions do not need to be integrated into a whole building system in order to work effectively. For monitoring purposes they might be connected, but their value for energy savings is not clear. Problems encountered when trying to integrate local control into large networks include:
1. Too many control nodes: the large number of individual ballasts and lighting fixtures adds excessive cost and complexity to systems. Such individualism is usually not needed anyway because fixtures are mostly operated/controlled in groups as part of an overall lighting design.
2. The need for immediate response/action places excessive demand on bandwidth and processing ability of a networked system. For example, a signal from an occupancy sensor must turn on a light within half a second or less. This is easily accomplished in a local system with a dedicated signal path, but in a networked system, a lot of processing and communication has to be done to determine which sensor is signaling, what action should be taken, addressing each component, receiving confirmations, carrying out network protocols, and gaining access to the communication medium. As more devices are added to the network, the reliability of getting a signal through within a given period of time diminishes.
3. Attention to reliability is of much greater importance for an integrated system than for individual controls, which adds considerable cost. Problems with an integrated system threaten the whole operation of a building, while local control isolates problems to small areas.

Reducing Barriers to Use of High efficiency Lighting Systems
6 of 107
Collective controls could benefit by being integrated with other building communication systems. With collective control schemes, the number of control nodes is greatly reduced by collecting individual lighting ballasts/fixtures into groups. This does not strain the limitations of existing networks. Also, large groupings of fixtures usually do not require immediate action/response. The cost-benefit of integrating collective control is that existing hardware and network infrastructure can be shared across all building control systems.
Trying to apply a single solution that is capable of handling all the requirements of the different control strategies is not cost effective. Such a strategy will result in an overbuilt system where most of the resources are hardly, if ever used, and so consequently the system is too expensive and/or complicated to use. Therefore, it should be recognized that whole building lighting control systems might not be appropriate for all buildings now, until costs come down.
The ultimate level of control being pursued by the lighting industry is the individually addressable ballast, ideally with full-range dimming, as well as switching capabilities. Listed below (Table 1) are the key features and applications of a ballast/control system that meets this ideal. Meeting these features goes well beyond ballast design and hardware issues. They are also critically dependent upon the communication protocol used for implementing whole-building control, the commissioning of the system, and other building aspects such as daylight availability and auxiliary control devices.
It is not expected that all buildings need, or even desire this level of control, but the more features that can be packaged into a system presumably increases its market appeal, provided that other factors, namely cost and reliability, are not affected. The other advantage of an all-in-one approach is that makes life simpler for the specifier and improves interoperability because fewer product types need to be offered. Manufacturers also benefit from having to support fewer product lines. Most likely, though, cost and reliability are affected by making a system more universal. In this case the market will eventually sort out what features are most beneficial and cost effective. Assuming that the trends for increasing space use intensification, energy costs, and state and federal building code legislation continue, many of these features that are now considered nonessential may become perceived as mandatory, as they already are to some extent in other countries for intensively used, urban office space.
Table 1 - Key features and applications for individually addressable luminairesA
Testing and monitoring of emergency luminaires
Load shedding
Lamp failure reportingB
Reduced / zero wiringC
* See notes for further explanation
Photosensing
Control of window shading devices
InterchangeabilityD
Occupant control from desktop

Reducing Barriers to Use of High efficiency Lighting Systems
7 of 107
Notes:
A. Individually addressable luminaires allow end-users to organize workplace lighting into
functional groups, so that switching / scene setting corresponds to the organization of the workplace. Intensively-used (usually urban) office space is frequently repartitioned or reorganized to adapt to the changing requirements of businesses and addressable systems allow the lighting to be reconfigured easily as this happens.
The end users should be able to either carry out simple lighting reconfiguration themselves (adding new luminaires, changing functional groups, changing scene settings), or have reconfiguration carried out by their regular qualified electrician, rather than having to contact the control system manufacturer. This is desirable both in order to reduce wasted time for the end-user, and to reduce the overhead costs of lighting controls manufacturers, which are recovered by adding (often very significantly) to the capital cost of lighting controls hardware, thus raising a barrier to more widespread use.
Because large buildings often house high salary workers at high occupancy densities, disruption is costly and, as far as possible, readdressing of luminaires should be carried out without access to the ceiling being required.
B. Lamp failure reporting facilitates quick replacement of failed lamps, which minimizes occupant dissatisfaction, maintains the architectural appearance of the building, and fulfils the end-user’s health and safety obligations.
C. Assuming that he cost of electrical and electronic hardware will continue to fall in comparison to the cost of labor, the necessity of installing additional signal wiring will become an increasingly significant barrier to the use of control systems. This problem may soon be solved by wireless communications, but in the short term it is desirable for lighting control protocols either to allow the amount of wiring to be minimized, and/or for their signals to be sufficiently robust to allow signal wires to be run with lighting power in order to minimize the cost or cable or conduit.
Under the National Electric Code (NEC) 2002, conductors of different circuits rated at 600V or less (both ac and dc) are permitted to run in the same cable (300.3(C1)), so - barring regional variations - wiring of this type, though not common, is technically feasible.
D. Interchangeable systems are those in which components from a variety of different suppliers can be used as part of an integrated system. Conversely, proprietary systems are those with which only a single supplier’s components are compatible. Due to the technical difficulty of achieving interoperability, and the absence of a perceived need for interoperability among lighting specifiers, proprietary systems remain the worldwide norm for lighting (though not for HVAC systems, which don’t require instant responses and usually require far fewer addresses). Nevertheless, interchangeability remains a desirable goal for clients nervous about having only a single source for future

Reducing Barriers to Use of High efficiency Lighting Systems
8 of 107
replacement or upgraded parts. However, it remains to be seen whether interchangeability will founder on the contractual rocks of having to allocate responsibility or blame when components turn out not to be interchangeable in real life. The related issues of “interoperable” systems are a partial solution not addressed in this report.
Do established and newly-developed protocols meet these functionality requirements at a reasonable cost?
A major cost not included in this discussion is the cost of system commissioning. Currently major systems can be commissioned only by the lighting controls manufacturers (the anticipated cost of this is built into the price quotation), or in rare cases by a professional systems integrator. It is likely that part of the motivation for the development of the DALI system was to transfer commissioning cost from the manufacturers to the contractors, but from the point of view of the client the cost will not change significantly.
Another cost category that is often overlooked in the discussion of whole building controls that must be considered is the foundation costs of controls, including the cost of peripheral control technologies (e.g., photoelectric sensors or manual dimmers) as well as the more expensive dimming ballasts that is needed to provide heat to the electrodes while dimmed. Together, these foundation costs can easily be as much as an additional $150.00 per luminaire.
Analogue 1-10V protocol Functionality
The 1-10V protocol allows continuous dimming of one or more luminaries, to the same light level. The protocol is technically ill-defined and there is no agreed statement of the exact parameters for impedance or current, and consequently this protocol has developed a reputation for inconsistent and unpredictable light levels from different luminaires, depending on the length (hence signal voltage drop) of each signal wire, and upon the particular permutation of control system and ballast from different manufacturers.
Hardware cost
The 1-10V protocol carries no addressing information, so if luminaries are to be individually addressable, each pair of signal wires must be terminated into a local control system outlet, which in turn is connected to the rest of the system by a different (usually proprietary) addressable bus. To avoid excessively complex wiring, no more than a handful of luminaries can be connected into the same local outlet box, so the 1-10V protocol carries a high overhead of ceiling-mounted lighting hardware, which adds mainly to capital cost but also to design time and installation time. In the absence of any other barriers, this cost barrier is sufficient to prevent the widespread uptake of lighting control systems.
Wiring cost
The signal carried on 1-10V wires is highly susceptible to 60Hz interference, and so should not be run in the same conduit or cable as lighting power. The necessity for different cable

Reducing Barriers to Use of High efficiency Lighting Systems
9 of 107
routing adds to the wiring cost and the wiring complexity of the system. The maximum length of signal wire permitted before voltage drop begins to severely affect the system is debatable, and depends how much discrepancy in luminaire output the client is prepared to tolerate, as well as the number of ballasts connected. Where this wire length is exceeded, signal repeater units must be used to boost the signal.
Design cost
Usually, not all the luminaries in a given area need to be individually addressable. To save cost in 1-10V systems, luminaries in common areas of the workplace can be grouped together and set to the same dimming level. This is also often the case with a row of luminaries parallel to the windows in a daylight-linked system. In these cases the grouping and wiring of the luminaries must be exactly specified during the design stage, and must satisfy the requirements of both the architect and the electrical engineer. This process involves the issuing of extra drawings and the necessity for additional project group meetings. There is also a need to consult with the control system manufacturer about maximum cable lengths, the necessity for signal repeaters, and potentially other wiring issues.
Reconfiguration cost
If a fully-addressable 1-10V system is installed, it should be as easy to readdress the luminaries, as it would be with any other system. However, 1-10V systems very seldom have full addressability, in which case reconfiguration involves access to the ceiling void and re-wiring of parts of the control system. Usually this is a complex process and would require the original ceiling plan to be referenced.
Non-addressable digital dimming protocols (SuperDim, DSI etc) These protocols are topologically the same as 1-10V, but provide specific technical advantages, including accurately specified and predictable light output, no problems with voltage drop, zero susceptibility to radiated interference, and the ability to report lamp or ballast failures (either from an individual luminaire, or from somewhere within a group). However, they still do not allow individual dimming and so incur the same high overheads as 1-10V systems. Due to the resistance of the US market to factory-prewired components including modular wiring, these cost overheads are much more significant in the US than in other countries, and are not likely to be overcome.
DALI Functionality
DALI is a protocol developed by a partnership of major ballast manufacturers. It allows addressing, dimming, grouping, lamp error feedback, and will allow a variety of other

Reducing Barriers to Use of High efficiency Lighting Systems
10 of 107
functionalities in the future. DALI-compliant ballasts and input devices from different suppliers can be used interchangeably in the same installation.
Hardware cost
The DALI protocol is based on the DSI digital protocol, but with additional bi-directional communication that allows 64 separately addressable luminaires to be connected on a single free-topology bus. This feature allows addressability to be achieved with far fewer ceiling-mounted boxes. The overall cost of DALI components is low because they are standardized between manufacturers. 2
The facility for emergency testing and monitoring is incorporated into the DALI protocol, and load shedding can be carried out very simply. However, due to the low speed of the bus, DALI’s ability to convey continual level signals from photosensors is very limited. This limitation can be overcome by using fewer photosensors (or even just one single photosensor for the whole building), which also minimizes installation and maintenance effort.
The DALI protocol is very rigid in order to ensure interchangeability between ballasts and input devices from any DALI-compliant supplier. Additional functionality can be built into individual systems, but because the protocol has been specifically developed for the lighting industry, writing specialist applications is a specialist business.
Wiring cost
The protocol operates at a low speed of 1200 baud and is therefore highly resistant to interference, so it can be carried in the same conduit or cable as the lighting power. Furthermore, it does not require regular twists in the wires (as is the case with some protocols), so standard (cheap) RJ11 or RJ45 cabling can be used to reduce on-site wiring (though cable insulation must of course be rated for plenum ceilings where relevant). There question of whether low-voltage signal wires can be run in the same cable as lighting power appears to be a gray area – if this were allowed it would further reduce the incremental cost of lighting controls.
Design cost
Because the wiring of the luminaries is not determined by their functional groupings, the time required to design cable routing is minimal, and the routing can be adapted to suit the space requirements of other ceiling services. The absence of voltage drop problems allows more
2 A low-cost communication interface does not necessarily translate into a low system cost. Dimming ballasts are expensive in terms of lamp operation circuit design, and decreased efficiency in operating the lamp over non-dimming ballast designs. Peripherals that add functionality to the system, such as sensors and user interfaces, also contribute greatly to the overall cost. This can make a DALI system, or any other control system, expensive independent of the isolated communication protocol cost.

Reducing Barriers to Use of High efficiency Lighting Systems
11 of 107
flexibility in the siting of boxes remotely from the luminaries they control. Only the electrical engineer need be involved in designing the wiring, so there is little need for consultation between the engineer, the architect and the control system manufacturer.
Reconfiguration cost
Because all major ballast manufacturers support the DALI protocol, electrical contractors are likely to become sufficiently familiar with the system to undertake minor reconfigurations without having to consult the manufacturer of the particular components used. This means that the end-user will likely be able to use their regular electrician, who is already familiar with the building, to carry out the work. Many end-users will be able to carry out the work in-house. In the longer term this will result in a significant saving in post-installation site visits by control system manufacturers, reducing their overhead costs.
LBNL IBECS Functionality
IBECS is a protocol under development at Lawrence Berkeley National Laboratories. It offers addressability over a twisted pair bus, and potentially the same range of functionality as DALI, with the advantage that the higher baud rate allows more devices to be connected, and allows the attachment of devices such as photosensors which send out continuous level signals.
Hardware cost
IBECS interface chips can be built in to ballasts in the same way that 1-10V and DALI systems are at present, but for much lower cost. (See note in section 4.3.2.)
Due to the fast baud rate of the bus, IBECS is susceptible to the high degree of harmonic and radiated interference produced by high frequency and dimming ballasts. For this reason it is necessary to incorporate an opto-isolator into each module. The opto-isolator adds only marginally to the cost of the system, and apparently solves the interference problem completely.
The interface between the IBECS microLAN and the high level TCP-IP network is made via a readily-available and cheap standard RS232 gateway.
Wiring cost
Up to 100 devices can be connected to each microlan, making the wiring cost comparable with DALI. IBECS can be made to run over a wireless network, probably more cheaply than will be possible with DALI, because the microlan is more akin to standard IT industry networks.

Reducing Barriers to Use of High efficiency Lighting Systems
12 of 107
Design cost
As with DALI, because the wiring of the luminaries is not determined by their functional groupings, the time required to design cable routing is minimal, and the routing can be adapted to suit the space requirements of other ceiling services. The absence of voltage drop problems allows more flexibility in the siting of boxes remotely from the luminaries they control. Only the electrical engineer need be involved in designing the wiring, so there is little need for consultation between the engineer, the architect and the control system manufacturer.
Reconfiguration cost
IBECS runs on an IT industry-standard high speed bi-directional bus, known as MicroLAN, which allows a virtually unlimited number of separately addressable luminaries, and a similarly unlimited variety of other potential functions such as emergency testing and monitoring, load shedding, and communication with other components such as shading device actuators. The protocol is potentially much less rigid than DALI, and since it is based on a very common technology, specialist applications are likely to be easier to design. However, for the same reason, some question mark exists over the interchangeability of components.
Summary Realizing that whole building controls are not the only solution to an assumed latent market demand for energy-saving, and/or comfort-enhancing lighting controls, the added functionality of using such controls for lighting was presented. In terms of this added functionality of the whole-building approach, the capabilities of existing control protocols were analyzed. This analysis reveals that existing lighting controls protocols are functionally capable of meeting the needs of current and future market demand for lighting control systems, though the ease and expense of specifying, designing, purchasing and installing a lighting control system is significantly affected by the protocol choice. The current move in the market is towards protocols, which require fewer pieces of associated lighting control hardware – the ultimate goal being the “addressable ballast”.
In particular, the DALI protocol offers high functionality and low hardware cost, and is well along the road to widespread use outside the US, although the requirements of the National Electrical Code, and inertia associated with electrical engineering practice raise questions over whether it can cheaply be implemented in this country. The IBECS protocol from Lawrence Berkeley National Labs may offer similar functionality at an ever lower cost, though no large IBECS systems have yet been made or tested in the laboratory. Such testing would have to be conducted before IBECS could be viewed as a viable technology for lighting control.
The current market standard 1-10V dimming protocol is widely considered to be unreliable and excessively expensive, and progress in energy-efficient lighting is unlikely to be made

Reducing Barriers to Use of High efficiency Lighting Systems
13 of 107
until improved technology becomes widely available and widely understood by specifiers and electricians.
The industry drive for individually addressable ballast systems is making progress in the US market despite there being no clear demand at this present time for the functionality it offers. The added cost, complexity, and market wariness associated with dimming ballasts along with the overall high first-costs associated with putting together a complete functional system most likely limits broader acceptance. Continued development and investment to lower these costs is occurring even though the economic drivers behind this investment are not obvious to everyone.
Codes and standards must also be considered because, if adopted, they could radically change the current economic picture, making greater penetration of controls required in new construction and major renovation.

Reducing Barriers to Use of High efficiency Lighting Systems
14 of 107
TASK 4.2 INVESTIGATE IDEAL LAMP LIGHT OUTPUT DIMMING RATIO REQUIRED FOR DIFFERENT TYPES OF APPLICATIONS
Introduction The overall scope of this project funded by the US Department of Energy (DOE) is to recommend means of reducing barriers to the wide spread use of lighting controls for commercial/industrial (C/I) applications using fluorescent systems. It is important to note that this project is focused on load-shed applications and photoelectric dimming where energy savings and energy management are of central concern. The project does not address architectural dimming found in many conference rooms or residential applications where multiple visual functions requiring different light levels (e.g., audio-visual presentations, conferences) are required to meet occupant objectives. This particular task (4.2) is concerned with switch-dimming, step-dimming and continuous-dimming in spaces dominated by electric lighting. Switch-dimming is switching one or more lamps off within a luminaire; step-dimming is dropping power to all lamps within the luminaire. In every case, the discussion is limited to linear, T-8 fluorescent lighting systems operated with electronic ballasts. Although, consideration of daylight from windows and skylights is implicitly excluded from this task because, ideally, an occupant will not perceive reductions in light levels if a successful photoelectric dimming system is installed, the system performance discussion is applicable to photoelectric dimming as well.
Economic rationale There are two, essentially distinct economic considerations with regard to the ideal dimming ratio. First, it must be acknowledged that lighting is introduced into C/I applications to meet human needs. It is assumed that dimming to lower light levels must not lead to a significant drop in human performance or satisfaction. Since occupant salaries and benefits dominate building economics, dimming must not have a measurable negative impact on their performance or their satisfaction. The first goal for this task is to develop a justification for dimming to lower light levels that does not significantly affect occupant performance and satisfaction. The following sections “Lighting to meet human needs” provides this justification. Second, given the first consideration, lighting system decisions will be driven by technical considerations that minimize system costs. There are many factors that affect life-cycle costs of a lighting system including, first costs, energy (kWh) costs, demand charges, load management benefits, lamp replacement costs, and disposal costs; these can be described as energy, capital and maintenance costs. As will be discussed in the section “Lighting system performance”, there are several strategies to minimize the life-cycle costs of lighting systems. These economic factors will be optimized differently for new construction, renovation, or retrofit. (Changes in legislation can also significantly affect lighting economics, but these are not addressed in this task.) The second goal for this task is to develop an economic justification for dimming (switch, step or continuous) from what we currently understand about linear T8 fluorescent system performance and costs.

Reducing Barriers to Use of High efficiency Lighting Systems
15 of 107
Lighting to meet human needs Prescribed illuminance levels are offered by sanctioning bodies such as the Illuminating Engineering Society of North America (IESNA) (Rea, 2000). It is formally acknowledged by the IESNA that a prescribed illuminance for nominally identical spaces will, in practice, vary. Naturally, photometric measurements show statistical variation and, moreover, humans are poor detectors of small changes in light levels, measured either in terms of subjective judgments of brightness or of objective measures of performance. Several recent studies by Kryszczuk (2001), Shikakura et al. (2001) and Akashi et al. (2002a, Appendix 2-A) found that people cannot reliably perceive reductions of up to 20% from the original illuminance level. A series of experiments by Rea and his colleagues (1986, 1987, 1991) show visual performance, defined in terms of speed and accuracy of processing visual information, does not vary by more than a few percent for most reading materials found in commercial spaces (Dillon et al., 1987). Since variations in visual performance are small for the range of illuminances presently recommended (300 to 1000 lx), task performance, which is dependent upon many non-visual factors, will vary even less (Boyce and Rea, 2001). Moreover, Rea et al. (1985) showed that people will perform compensatory behaviors (e.g., moving closer to the task) to ensure good performance while performing visual tasks. These studies indirectly support the IESNA position that variations of +/- 33% from the recommended illuminance can be considered as “the same” light level. Since these empirical data and the IESNA recommendations are consistent, it is reasonable to expect that occasional, modest dimming of the lights to lower levels to save energy or reduce electrical demand will be accepted by occupants and will not affect their performance.
The IESNA also acknowledges variations in the difficulty of visual tasks performed in spaces as well as variations in the visual needs of different individuals. Further, there will always be some statistical uncertainty in any behavioral measurement. This provides still greater potential opportunity for dimming while continuing to meet occupant visual needs. Nevertheless, it must be acknowledged that for every opportunity to reduce recommended light levels, and thereby reduce energy or manage load, there is a risk that these reductions can penalize certain individuals performing certain visual tasks. Without question a dimming strategy can only be satisfactorily realized if those individuals and visual tasks are considered. This point is entirely consistent with the IESNA recommendations that lighting specifiers should not apply general recommendations without understanding the visual requirements in a specific application.
It is also important to realize that people are not rigid with regard to their preferences for changes in light level, even when the magnitude of those changes is reliably perceived. For example, most people find very dim lighting in high-end restaurants acceptable but, for nominally identical visual requirements, prefer much higher illuminance levels in cafeterias or lunchrooms. In a simulated commercial space, Akashi et al. (2002b, Appendix 2-B) showed that 80% of the people in his study would accept dimming to 62% of the original light level (a 38% reduction, from 500 lx to 310 lx). It is also clear that certain biases can be introduced into subjective judgments for one type of application, even in the same building space. For example, occupants will set illuminances in residential dining rooms to different levels depending upon the situation. Illuminance levels while feeding the family in the dining room will be typically higher than those while entertaining guests. In a simulated commercial space, Akashi et al. (2002b) showed that 80% of the subjects in his study were willing to accept dimming to 46% of the original light level (a 54% reduction, from 500 lx to 230 lx)

Reducing Barriers to Use of High efficiency Lighting Systems
16 of 107
under conditions where they felt they were helping their employer financially and helping the environment, both locally and globally.
As argued at the end of this task report, the evidence suggests that occasional dimming by 33% will be readily acceptable to occupants and, if the purposes for dimming were explained well, occupants would also accept dimming by 50%.
Lighting system performance Lighting system economics are judged on several performance characteristics that can be characterized as energy, capital, and maintenance costs. Ideally, lighting systems will be chosen based upon a life cycle cost analysis that minimizes energy, capital and maintenance costs over the life of the system while maintaining lighting design objectives. Before the wide spread introduction of T-8, electronic ballast lighting systems in the 1990s, lamp-ballast system performance was fairly well understood and consistent among the various T-12 lamp and magnetic ballast manufacturers. This consistency provided good predictions of the life cycle costs of fluorescent lighting systems. Today, however, the characteristics of different T-8 lamps and electronic ballasts have become so idiosyncratic that it is difficult to predict lamp life, one of the most important performance parameters for estimating life cycle costs. This difficulty is significantly exacerbated when one considers dimming fluorescent lighting systems.
As with the older T-12, magnetic ballast systems, the life of modern T-8, electronic ballast systems will still be governed by how the ballast controls heat to the lamp electrodes during starting and during operation. Specifically, the failure of fluorescent lamps is caused mainly by the loss of electron emissive coating of the lamp electrodes, either by sputtering or by evaporation (Verderber, 1985; Waymouth, 1971). (Although under certain circumstances, such as high frequency operation and frequent starting on instant start ballast (“cold ignition”), fracture of the tungsten coil is also observed which cause the lamp fail (Haverlag, 2002)). Very high electrode temperature (greater than 1000 oC) will reduce lamp life due to evaporation of the emitting material, and a low electrode temperature (less than 700 oC) will reduce lamp life due to erosion of the emitting material by sputtering (Davis and Ji, 1998). The precise optimization of temperature within this range is presently unknown as well as spatial-temporal effects of dimming electrodes, and this uncertainty is likely the reason for the idiosyncratic performance of different lamp and ballast combinations.
Modern high frequency ballasts for fluorescent lighting systems have improved efficiency significantly, and recent advances in ballast control of lamp starting has demonstrably improved lamp life by reducing sputtering. Some improvements in lamp filament design have also occurred, but the electrical optimization of fluorescent lamps for extended life has changed little since the 4-foot T-12 design was established in the 1930s (Waymouth, 1971). For the most part, ballast and lamp developments have occurred separately, each taking advantage of the new technology as it became available. These parallel developments by different manufacturers have added to the complexity and uncertainty in lamp-ballast performance, specifically lamp life. Moreover, little is known outside the lamp manufacturers about lamp life during dimming.

Reducing Barriers to Use of High efficiency Lighting Systems
17 of 107
Dimming Methods There are two approaches to dimming lamps within a building space, dimming all the lamps by a fixed amount or switching off some of the lamps. Although there is still much to learn about how lamp-ballast system combinations affect lamp life, much more is known about the impact of switching on lamp life than about the effects dimming on lamp life.
It is well established that on-off switching of fluorescent lamps will reduce lamp life (O’Rourke and Figueiro, 2000; Carriere and Rea, 1988). Sputtering is the primary failure mechanism associated with starting, and, except for very special cases, lamp life will be shorter the more frequently the system is switched on and off. Broadly, there are two ways to switch a lamp, with or without application of heat to the electrodes before starting. In general, heating the electrode before starting will reduce sputtering and thereby increase lamp life.
Instant start systems apply a high voltage across the lamp electrodes to start the lamp. These “cold starts” have been shown to increase sputtering of emissive coating on the electrodes which leads to shorten lamp life compared to continuous operation. Rapid start and program start systems apply heat to the electrodes prior to starting to minimize sputtering. Although the distinction between instant start and rapid start systems was useful for older T-12, magnetic ballast systems, this distinction is less clear today with T-8 electronic ballast systems. Empirical evidence has shown that lamp life is not significantly different for rapid start and instant start electronic ballast systems (Davis and Ji, 1998). The reason appears to be that although there is a distinction in how rapid start and instant start systems, as separate groups, actually start the lamps, there is little, if any, impact on lamp life. Although there is no formal definition for program start, commercially available systems called program start, in fact, control electrode heating prior to starting and significantly increase lamp life (Davis and Ji, 1998).
Switch-dimming can occur external to the ballast utilizing separate electrical circuits or with multiple-lamp ballast. Switch-dimming can be accomplished with tandem wiring ballasts of adjacent fixtures or with ballasts that control multiple lamps within a fixture. Separate electrical circuits, one of which could receive a signal to shed load, could supply these ballasts. This option is independent of the ballast, and any ballast type could be used, but this approach may be a better solution for new construction or a major renovation because rewiring an existing installation would not be cost effective. It is also possible to switch lamps independently of each other with multiple-lamp ballasts. Turning off one lamp in a two-lamp, three-lamp, or four-lamp ballast results in 50%, 33%, or 25% dimming, respectively. Lamp life will, of course, depend on the frequency of switching, but it will also depend upon the particular lamp-ballast combination used, and although the relationship between switching and lamp life is better understood than the impact of step- or continuous-dimming on lamp life, there is still great uncertainty in predicting lamp life and, thus, life cycle costs.
The impact of continuous- and step-dimming on lamp life is less well known, as previously mentioned. However, the principles affecting lamp life remain the same. Namely, electrode heating is the key issue to consider during lamp operation in the dim mode. Filament temperatures below approximately 700oC will be associated with sputtering of the filament emissive coating, whereas temperatures above 1000oC will be associated with evaporation of the emissive coating. Between these two temperatures, the spatial-temporal effects of dimming are not well understood.

Reducing Barriers to Use of High efficiency Lighting Systems
18 of 107
Rapid start and program start ballasts are currently the only ballasts used for dimming. These ballasts add heat to the electrodes while operating, as well as for starting, to minimize sputtering and extend lamp life. Dimming ballasts account for about 1% of the fluorescent ballast market, presumably because of their relatively high cost. An instant start ballast sells for between $8.00 and $15.00, while a dimming program start ballast, the most expensive type, may cost well over $50.00. These ballasts also use more energy at full light output than an instant start ballast because of electrode heating and the additional dimming interface circuitry, they may save energy relative to fixed-level systems if they are dimmed to at least 15% of full light output.
Instant start ballasts make up 80% of the market of electronic ballasts sold today. This ballast design is the simplest and the cheapest, which is why it is also the most prevalent. Instant start ballasts do not provide heat to the filaments while starting or operating the lamps when dimmed. The lower filament temperatures of instant start systems are believed to cause greater sputtering of emissive coating from the lamp electrodes, which leads to shorter lamp life.
This logic would preclude the development of instant start dimming ballasts and, indeed, an instant start dimming ballast cannot be found in the specification market. Consider, however, that ballast factor simply describes the fixed level of dimming offered by the instant start system. Since manufactured ballasts with different ballast factors have the same rated life, it should be possible to actively dim instant start ballasts within the range of currently manufactured ballast factors.
Ballast factor (BF) is the ratio of the light output of a lamp or lamps operated by a specific ballast to the light output of the same lamp(s) operated by a reference ballast. BF can range from 0.73 to 1.50 (Lighting Research Center, 2000). Thus, the range of “fixed” dimming currently offered by instant start systems is 73% (0.73/1.00) or 49% (0.73/1.50), depending upon the ballast used as the reference. Again, however, there appears to be a wide range of continuous- or step-dimming instant start systems that are possible, but active dimming with these systems has not been explored. Naturally, the big advantage of instant start dimming is the relatively low cost of the ballast. If it could be shown that lamp life was not significantly affected by continuous- or step-dimming of instant start systems, then the life cycle cost of dimming would be significantly reduced, due to the low initial costs and high efficacy over the life of the system.
As mentioned several times, there remains uncertainty about the performance of switching modern electronic lamp-ballast systems. Dimming systems are even less well understood and there are no standards to guide the manufacturers or the specifiers to ensure satisfactory system performance. It is beyond the scope of this section to describe the physics of electrode heating, but it can be emphasized that reducing filament heat during dimming is a distinctly non-linear process, exacerbated by variations in manufacturing. So called “deep dimming” without heating the electrodes certainly adds complexity to the issue of dimming, but it appears that dimming by 33% or, perhaps, even 50% may have no measurable impact on lamp life, for short periods of time (less than 100 hours/year).

Reducing Barriers to Use of High efficiency Lighting Systems
19 of 107
The optimum dimming ratio The optimum dimming ratio will be driven by maximizing lighting system performance while minimizing negative impacts on occupants within the building space. Human factors research suggests that occupants have difficulty in detecting dimming of 20% from recommended levels of illuminance, and that the majority (80%) of people will readily accept dimming of 33%. Moreover, under some conditions the majority (80%) will accept dimming of 50% (Akashi et al., 2002a and 2002b). As noted several times, there are some uncertainties about lighting system performance with electronic ballast systems not found with the older, obsolete magnetic ballast systems. Without question more research is needed to understand lamp-ballast interactions before a precise optimum dimming ratio can be deduced. Nevertheless, it is useful to develop some interim recommendations that could lead to more widespread use of technologies that should improve life cycle cost of fluorescent dimming systems through lighting controls.
Perhaps the most obvious approach is to utilize existing program start systems that maintain electrode heating during dimming. The major strength of this approach is that these systems ensure customers will achieve rated lamp life. They can also serve as a platform for “deep dimming” for maximizing photoelectric and user-controlled dimming, as well as any other control strategy. The largest barrier to this approach is that these systems are expensive to purchase, and they are slightly more expensive to operate because they have slightly higher energy expenditures due to lamp electrode heating. Since clear economic benefits of photoelectric dimming and of user-controlled dimming have yet to be established, this strategy will probably continue to capture only a few percent of the market.
A more cost effective strategy is switch-dimming, either with different circuits or with ballasts that switch out certain lamps. This approach reduces initial cost considerably but does not allow for added functionality achieved by the program start dimming system. If added functionality is not required, or expected, a switch-dimming approach appears to be a very logical line of development. It should be noted, again, that the effect of switching on lamp life is better understood, but there is still some uncertainty in the performance of electronic ballast and lamp systems and more research should be undertaken. There is also some uncertainty to this approach regarding user acceptance. One objection to switch-dimming and to step-dimming is that occupants have been shown to be dissatisfied with sudden transitions in light output (Boyce, 1984). Another objection might be that occupants do not like to see luminaires with deactivated lamps. Nevertheless, as shown by Akashi (2002b), it may be possible to adjust occupant expectations such that switch-dimming can be acceptable under some circumstances, but this has yet to be shown.
Another approach to dimming that has not been properly explored is continuous- or step-dimming of instant start systems. The largest appeal to this approach is that these systems are the least expensive. Strategies for new construction and retrofit would seem to be cost effective if it was established that modest dimming to no more than 50% of maximum light output for less than 100 hours/year did not significantly affect lamp life. Preliminary evidence from our laboratory suggests that operating lamps in a dimmed mode (90 mA, or a ballast factor of 0.44) is in fact possible for periods of time longer than 100 hours/year. Certainly, commercially available ballasts with a ballast factor of 0.73 are warranted at rated lamp life, so operating them at 27% dimmed mode (BF of 1.00) appears to be readily achieved without significantly affecting lamp life.

Reducing Barriers to Use of High efficiency Lighting Systems
20 of 107
Whatever approach is taken, it would be useful to standardize on dimming levels. We recommend that the industry standardize on 33% and 50% dimming. Both the lighting system performance data and the human factors data suggest that that these values will have minimum negative impacts on lighting system performance and on occupant satisfaction and performance. The major advantage of this standard would be to accommodate switch-dimming of two, three and four lamp systems as well as both instant start and program start dimming systems, utilizing either continuous- or step-dimming.3 Naturally, the cost of dimming will vary depending upon the lamp-ballast system, but every approach can be accommodated by this standard. The marketplace will determine which system will ultimately be more attractive.
References Akashi, Y, Neches J, Bierman, A. Energy saving load-shedding ballast for fluorescent lighting
systems: occupant’s dimming requirements. Draft report submitted to Connecticut Light and Power September, 2002a.
Akashi, Y, Neches J, Bierman, A. The effect of bias towards energy savings on occupant’s. Draft Report submitted to the US Department of Energy, October, 2002b.
Boyce, PR, and Rea, MS. Lighting and human performance II; Beyond visibility models toward a unified human factors approach to performance, Electric Power Research Institute, 2001.
Boyce, PR. Lighting Control: The user’s point of view. Proceedings of the CEA/DBR Symposium, Lighting Control, Ottawa, June 28, 1984, M.S. Rea (ed.): 69-85.
Carriere, LA and Rea, MS. Economics of switching fluorescent lamps. IEEE Transactions on Industry Applications, 1988, Vol. 24(3), May/June.
Davis, RG and Ji, Y. Fluorescent lamp-ballast systems. Final Report prepared for Empire State Electric Energy Research Corporation. 1998: 94-40.Troy, NY: Lighting Research Center.
Dillon, RF, Pasini, IC, and Rea, M.S. Survey of visual contrast in office forms. Proceedings 21st Session of the Commission Internationale de l’Eclairage (CIE), June 1987:74-77.
Haverlag, M., Kraus, A., Sormani, J., et. al. High-frequency cold ignition of fluorescent lamps. Journal of Physics D: Applied Physics, 2002, 35: 1695-1701.
Kryszczuk, K. Detection of slow light level reduction. IESNA Conference Proceedings, 2001: 315-322.
3 It must be noted, however, that dimming light levels is only equal to dimming power for switch-dimming and for continuous- or step-dimming without electrode heating (i.e., instant start systems). For the same reduction in power using electrode heating (i.e., rapid start or program start), the light levels will always be relatively lower than they will be for instant start systems.

Reducing Barriers to Use of High efficiency Lighting Systems
21 of 107
Lighting Research Center. Specifier Reports: Electronic Ballasts. 2000. Troy, NY: Lighting Research Center.
O’Rourke, C., and Figueiro, M. 2001. Long-term performance of screwbase compact fluorescent lamps. J. Illum Eng. Soc. 30(2): 30.
Rea MS (ed.). IESNA Lighting Handbook: Reference and Application, 9th ed. 2000, New York: Illuminating Engineering Society of North America.
Rea MS, Ouellette MJ. Relative visual performance: A basis for application. Light. Res. Technol. 1991, 23(3): 135-144.
Rea, MS. Toward a model of visual performance: foundations of data. J. Illum. Eng. Soc., 1986, 15 (2): 41-57.
Rea, MS. Toward a model of visual performance: a critical review of methodologies. J. Illum. Eng. Soc., 1987, 16 (1): 128 – 142.
Rea, MS, Ouellette, MJ, and Kennedy, ME, Lighting and task parameters affecting posture, performance and subjective ratings, J. Illum. Eng. Soc., 1985, 15 (1): 231-238.
Shikakura, T., Morikawa, H., Nakamura, Y. Research on the perception of lighting fluctuation in a luminous offices environment, Journal of the Illuminating Engineering Institute of Japan, 2001, 85(5): 346-351
Verderber, R.R, et al. 1985. “Life of fluorescent lamps operated at high frequencies with solid-state ballasts.” Paper presented at the IEEE Industrial Applications Society Annual Meeting, Toronto, Canada.
Waymouth, J.F. Electric discharge lamps (Cambridge, MA and London, England: M.I.T. Press, 1971).

Reducing Barriers to Use of High efficiency Lighting Systems
22 of 107
APPENDIX 4.2 – A
DRAFT REPORT: ENERGY SAVINGS FOR LOAD-SHEDDING BALLAST FOR FLUORESCENT LIGHTING SYSTEMS
Sponsored by: Connecticut Light and Power Prepared by: Yukio Akashi, Ph.D.
Jason Neches Andy Bierman, MS

Reducing Barriers to Use of High efficiency Lighting Systems
23 of 107
1. Introduction Load shedding ballasts could be used as an effective means of load management by reducing the peak demand for electricity needed for lighting. This is especially true for the brief and infrequent times when demand for electricity approaches the capacity of the power supply system and prices soar as more expensive means of generation an/or transmission are called upon to meet the demand. Lighting offers the opportunity to reduce demand without impacting productivity and normal business activities by dimming to lower power levels. Thereby, lighting is still provided to preserve function, but at a reduced level. However, before such a load-shed technique is applied to the real world, it is important to understand occupants’ light level requirements with respect to dimming.
A recent study at the Lighting Research Center (LRC) investigated a detectable range of illuminance change and suggested that occupants could not detect up to 20 % illuminance reduction regardless of initial illuminance or dimming speed within the experimental conditions (Kryszczuk, 2001). A similar study, in which the subjects were more sensitive to illuminance change than in Kryszczuk’s study, also suggested that illuminance could be changed by up to 20 % from the initial value without being detected by occupants when they were devoted to tasks (Shikakura, 2001).
However, it is unknown what cues occupants use to detect illuminance change and whether the reducible illuminance range defined in the above studies, up to 20 % change from the initial illuminance, could be extended if slower dimming speeds or smoother dimming functions are employed. To detect such illuminance changes, two cues—memory of the initial illuminance and the transient change in illuminance—are likely decision factors. Sensitivity to the transient illuminance change occurring over time periods shorter than around 3 seconds has already been well investigated by a series of studies on flicker (e.g. Kelly, 1961, 1971). Longer, more drawn out illuminance changes occurring over many seconds, as could easily be done for load shed, has not been investigated as completely. The first experiment of this study seeks to determine if memory of initial illuminance levels is the main clue to detecting dimmed light levels. If so, then less effort could be placed on investigating different dimming rates and functions and more effort focused on determining the appropriate ultimate dim level. With regard to the above question of whether using slower dimming speed and or smoother dimming functions can extend the reducible illuminance range, this study focused on the effects of dimming functions rather than that of very slow dimming speed. This is because fast dimming speed, or short dimming periods that are presumably less than 15 seconds, allow the use of less expensive dimming techniques than long dimming periods, and very long dimming periods, such as hours in length, would not be responsive enough for load shed.
Knowing what people can detect in terms of illuminance reduction is the first step in understanding what occupants’ dimming requirements are. Beyond detection, and perhaps more relevant to load shed dimming, is determining what level of dimming is acceptable to occupants. Acceptable dim levels must be at least as low as what is a detectable change in illuminance, and

Reducing Barriers to Use of High efficiency Lighting Systems
24 of 107
quite possibly they are much lower depending on the context, thereby enabling a greater load shed potential. Since acceptability may vary according to motivation to energy savings, this study also investigated the effects of subjects’ bias on acceptable dimming range.
2. Objectives To aid in specifying the dimming parameters of load shedding ballasts, the following objectives were defined:
• To investigate the mechanism of how occupants detect illuminance changes: memory study
• To investigate the effect of different dimming functions on detectable and acceptable dimming ranges: dimming curve study
• To investigate the effect of motivation on the acceptable dimming range: bias study.
3. Literature survey Recently, the LRC had conducted an experiment on the detection of dimming (Kryszczuk, 2001). The experiment measured when subjects perceived a reduction in luminance on a target and its surroundings under different conditions of initial illuminance, dimming speed, and task context. While conducting a task, each subject signaled the detection of illuminance reduction, as soon as the subject noticed it, by pressing a manual switch. The time necessary for the subject to detect the illuminance change was recorded from which the amount of illuminance reduction was calculated. The results suggested that regardless of the initial illuminance, dimming speed (ranging from 3.7 to 340 lux per second), and task context, the illuminance could be reduced by up to 22% without being noticed by subjects.
Another recent study conducted similar experiments (Shikakura et al., 2001). The study tackled the same question of to what degree illuminance could be reduced without detection by occupants under different initial illuminance levels, target illuminance levels, and dimming speeds. The results of the experiment suggested:
• When subjects conducted no tasks, 50 % of the subjects could not notice an illuminance change of up to 7 %, regardless of the initial illuminance and dimming speed. The subjects hired in Shikakura’s experiment seemed more sensitive to illuminance change than subjects in the LRC experiment, or the particular conditions in the experiment heightened their sensitivity.
• When conducting a visual search task or VDT task, or when being interviewed, 50 % of the subjects could not notice the illuminance change by up to 20 % from the initial level.

Reducing Barriers to Use of High efficiency Lighting Systems
25 of 107
These studies imply that lighting levels may be reduced by about 20 % without compromising occupant satisfaction with the lighting because such a change would barely be detectible. However, these studies do not deal with occupants’ acceptance of possibly greater illuminance change, or the effects of dimming curve functions and occupants’ motivation to energy conservation on acceptability. To investigate these factors, the following three experiments were carried out.
4. Experiments In this study, three experiments—memory study, dimming curve study, and bias study—were conducted. The memory study addressed the question of whether one can memorize the initial illuminance level and how long this memory is sustained. The dimming curve study investigated the effects of dimming function on detectability and acceptability of illuminance reduction. The bias study addressed the question of how occupants’ motivation influences the acceptability of illuminance reduction. All three experiments used the following experimental setup:
4.1 Experimental setup The experiments used a windowless private office and an adjacent room. Figure 1 shows the private office viewed from the adjacent room. Although, in this picture the door is open, the door remained closed during the experiment. Figure 2 illustrates the plan of the private office and the experimental system in the adjacent room. The interior wall and ceiling of the private office was painted white (reflectance: 85%). The reflectance of the floor carpet was about 30 %. The office was furnished with a bookshelf, a desk and a chair. The office was equipped with three-direct/indirect pendant luminaires suspended from the ceiling. Figure 3 shows the ceiling with the luminaires and the luminous intensity distribution of the luminaires. The experimental apparatus in Figure 2 was composed of the above described luminaires with dimming ballasts and T8 fluorescent lamps; an operating system—a desktop computer, a picoammeter, a photo-sensor, and a DC power supply; a communication system—two telephone sets and a “hands-free” phone tool; and a monitoring system—a TV monitor, a digital video camera with a transmitter, and a receiver. Table 1 summarizes the details of the experimental system.

Reducing Barriers to Use of High efficiency Lighting Systems
26 of 107
Figure 1. Windowless private office and adjacent room used in all three experiments
Figure 2. Room plan and experimental setup

Reducing Barriers to Use of High efficiency Lighting Systems
27 of 107
Figure 3. Direct/indirect pendant luminaires (Crescent, Ledalite)
Table 1. Experimental system.
Components Product name Manufacturer 3 Luminaires Crescent (8316T02PN) Ledalite 3 Ballasts M2-PD-T8-5C-B-120 Gold Edition
Programmed Start, dimming 5 ~ 110%
Motorola
6 Fluorescent lamps FO32/835/XP Osram Sylvania Inc.
1 Computer P5-166 Gateway 1 Picoammeter 485 Auto ranging Picoammeter Keithley Software Lab View 6.0 National
Instruments 1 DC power supply E3632A Hewlett Packard 1 Photo sensor 268P photopic, cosine response Graseby Optronics 1 Color TV monitor (13”)
PC1342 CRAIG
1 Camera and transmitter
XC10A X10, Inc.
1 Receiver VR30A X10, Inc. 2 Telephones DX2NA-12CTXH TEL (BK) Nitsuko America
Co. 1 Hands-free phone tool
Vista, M12 Plantronics

Reducing Barriers to Use of High efficiency Lighting Systems
28 of 107
4.2 Memory study The memory study investigated whether subjects could memorize the initial illuminance level and how long the memory of the subjects was sustained.
4.2.1 Experimental conditions Table 2 summarizes the experimental conditions employed in the memory study. As independent variables, the target illuminance and eye closure time varied. The initial illuminance was constant at 500 lx. The dependent variable of the experiment was subjective evaluation of whether the illuminance at a given moment is different from the initial illuminance. The three target illuminance levels that are higher than the initial illuminance (500 lx) were used as balancing conditions.
Table 2. Experimental conditions.
Variables Range
Target illuminance (lx) 976, 781, 625, 500, 400, 320, 256
Eye closure period (seconds) 3, 100
4.2.3 Experimental procedure Twelve subjects, ranging from 22 to 41 years of age, participated in the experiment. An experimenter escorted a subject to the private office and seated the subject in the chair. The subject was exposed to the initial illuminance of 500 lx, for about five minutes so that he/she would adapt to this lighting condition. During this adaptation time, the subject read and signed an informed consent form. The experimenter gave instructions about the experimental procedure to the subject. Then, the experiment began. First, the subject closed his/her eyes for a given period, 3 or 100 seconds. When closing their eyes, the subject used an eye mask to prevent light from coming through their eyelids. While the subject sat with his/her eyes closed, the experimenter changed the initial illuminance level to one of the target illuminance levels. Second, the experimenter asked the subject to open his/her eyes and answer whether the illuminance level was changed from the initial illuminance level. The subject was allowed to choose one from three choices—“down”, “same” or “up”. The orders of the target illuminance and the eye closure time were randomized across subjects. All 14 (7×2) conditions were repeated three times for each subject.

Reducing Barriers to Use of High efficiency Lighting Systems
29 of 107
4.2.4 Experimental results For each of the 14 experimental conditions, all 36 responses (three answers from each of the twelve subjects) were analyzed. Figure 4 shows the percentage of subjects who responded “down” for the 14 conditions. Figure 4 suggests:
• Subjects are able to memorize the brightness under the initial illuminance and can reliably detect reductions greater than 20%.
• As eye closure time increases, memory may fade and therefore the sensitivity to illuminance change may decrease. This is based on the sensitivity to reduction after the 3-second eye closure being higher than that after the 100-second eye closure. For instance, the comparison between the 100- and 3-second eye closure periods at 50% probability, when 50% of the subjects detected illuminance changes, suggests that illuminance reduction by up to 20% and 30 % of the initial illuminance was undetectable respectively.
Figure 4. Percentage of subjects who responded “down”.
A two-factor analysis of variance (ANOVA) with replication was conducted using all the subject data. Table 3 shows the results of the ANOVA. Table 3 shows that the ANOVA found significant differences between different target illuminance levels and between eye closure period conditions, and in their interaction. These statistical results supported all the above suggestions derived from Figure 4.
Table 3. Two-factor analysis of variance with replication.

Reducing Barriers to Use of High efficiency Lighting Systems
30 of 107
Source of Variation SS df MS F P-value Fcrit
Target illuminance 24.78571 6 4.130952 184.1984 1.29E-67 2.157911
Eye closure period 0.291667 1 0.291667 13.00536 0.000419 3.902557
Interaction 0.5 6 0.083333 3.715818 0.001769 2.157911Within 3.453704 154 0.022427 Total 29.03108 167
4.2.5. Discussion: The results of the memory experiment support the hypothesis that people can detect changes of illuminance greater than about 20% based solely on memory of the initial light level. Therefore, over the range of times tested, the actual dimming speed, or function, presumably has little effect on detecting illuminance reductions.
The data also suggest that subjects could remember the initial illuminance more precisely after the 3-second eye closure period than after the 100-second eye closure. This implies that as eye closure time increases, the memory of the initial illuminance fades. However, an experimental confound, dark adaptation, might have influenced the sensitivity of subjects to illuminance changes. Some of the subjects reported that all the illuminance presentations looked brighter after the 100-second eye closure than those after the 3-second eye closure. This might be because the 100-second period allowed the subjects time to adapt to the dark condition of covering their eyes, while less adaptation occurred for the 3-second period. This confound, which proved very difficult to eliminate from this type of experiment, works to make decreases in illuminance less detectable over longer periods of time. Therefore, we cannot conclude at this point whether the further decreases in illuminance for the same level of detection result from the adaptation confound or from some other effect over time. Nevertheless, for the time periods tested, 3 and 100 seconds, we can put a limit on the additional amount of dimming possibly gained by the time factor, which in this case is an additional 10%, and conclude that the dominant effect is the memory of the initial level.
Figure 5 compares the results of this study for 3-second eye closure period with those of the Kryszczuk study. This figure illustrates percentages of subjects who detected illuminance changes as a function of change in illuminance. In the Kryszczuk study, the initial illuminance was 475 lx and the dimming period ranged from 3.3 seconds to 120 seconds. The line shows averaged data for all his experimental conditions. Both the lines in Figure 5 show similar trends. This supports the earlier conclusion that the memorized initial illuminance is the most dominant factor. However, Figure 5 indicates that the subjects in this study were less sensitive to the illuminance changes than those in the Kryszczuk study. The difference in sensitivity between the

Reducing Barriers to Use of High efficiency Lighting Systems
31 of 107
two experiments hints that subjects might use another clue, presumably transient change in illuminance.
Figure 5. Percentage of subjects who detected illuminance
changes vs. the degree of illuminance changes in percentage
4.3 Dimming curve study The dimming curve study investigated the effects of shape, or curvature of dimming curves on detectability and acceptability of illuminance reduction. Another objective of the dimming curve study was to investigate the effect of task conditions on detectability and acceptability.
4.3.1. Experimental conditions Table 4 shows the experimental conditions employed in the dimming curve study. The independent variables of the experiment were dimming curve function, target illuminance level, and task condition. The initial illuminance and dimming period were constant at 500 lx and 10 seconds respectively. This experiment used Equation 1 to vary the curvature of dimming curve. Constants a and b were determined according to each target illuminance. As a constant c that determines the curvature, 0.1, 0.2, and 0.4 were used. As the constant decreases, the function becomes more curvilinear. The constant 0.4 made the curve straighter than the constant 0.2 or 0.1. In this experiment, dimming period: p was constant at 10 (seconds). This is because a pilot study, done using two subjects to determine the dimming period, could not find any difference in detectable range of illuminance reduction while the dimming period ranged between 3 seconds and 120 seconds. Additionally, since a long dimming period, presumably longer than 15 seconds, for load shedding ballasts requires more sophisticated and therefore expensive control systems, the ten-second dimming period was selected as a constant experimental condition.

Reducing Barriers to Use of High efficiency Lighting Systems
32 of 107
beaE pct
+×= ×−
(1)
where E: illuminance (lx)
a, b: constants
c: a constant to change curvature
p: dimming period (second)
t: time (second)
This experiment used two task conditions: no-task and paper-task conditions. Under the no-task condition, subjects were allowed to freely gaze anywhere in the room. Under the paper task condition, subjects conducted word puzzles. Figure 6 shows a sample of the word puzzle. Four sets of word puzzles were printed in each page. Each puzzle had a 12×12 array of 12-point capital letters and a list of words. The goal of subjects was to find and mark the listed words among the 12×12 array of letters. This experiment used eleven target illuminance levels. Five of the eleven, which were higher than the initial illuminance (500 lx), were used as dummy conditions to make the probabilities of increase and decrease conditions identical.
Figure 6. Word puzzle on a page.

Reducing Barriers to Use of High efficiency Lighting Systems
33 of 107
The dependent variable was a subjective evaluation of whether illuminance level at a given moment was different from the initial illuminance level and whether the illuminance change was acceptable. The subjects also evaluated the acceptability using an eleven-step scale, from zero (very unacceptable) to five (neutral) and ten (very acceptable).
Table 4. Experimental conditions
Variables Range Dimming curve function Linear, 0.4, 0.2, 0.1
Target illuminance (lx) 833, 752, 679, 613, 554, 500, 451, 408, 368, 332, 300
Task condition Paper task (word puzzle), no task (free gaze)
4.3.2. Experimental procedure Twenty subjects, ranging from 22 to 41 in age, participated in the experiment. In the experiment, an experimenter escorted a subject to the private office and seated the subject in the chair. The subject adapted himself/herself to the brightness of the initial illuminance, 500 lx, for about five minutes. During the adaptation, the subject read and signed an informed consent form. The experimenter gave instructions about the experimental procedure to the subject. The instructions emphasized that the subject should evaluate not the final illuminance but the whole illuminance presentation in which the illuminance might or might not had changed. After the instruction, the experiment began. The experiment was divided into two sessions—paper-task and no-task sessions. The order of the sessions was counterbalanced across subjects. The subject started performing either the paper-task or no-task under the initial illuminance level of 500 lx. After 5-10 seconds the illuminance was or was not gradually dimmed according to one of the four dimming functions for ten seconds. After the ten second presentation, the experimenter asked the subject the following three questions—(1) whether the illuminance changed (“up”, “same”, or “down”), (2) whether the illuminance change (if the subject detected) was acceptable (“yes” or “no”), and (3) how acceptable was the illuminance change (if the subject detected). To respond to the third question the subject used an eleven-step scale from 0 to 10—0: “very unacceptable”, 5: “neutral”, and 10: “very acceptable”.
4.3.3. Experimental results Figure 7 shows the results of the detectability of illuminance reduction. Figure 7 suggests that the dimming curvature and task conditions have little influence on the detection of illuminance reductions. Regardless of the dimming curvatures or tasks, 50 % of the subjects could detect the change in illuminance after about a 15 % reduction from the initial illuminance. Figures 8 and 9 show the results of the two acceptability evaluations—yes-or-no and rating evaluations. Figure 8 suggests that the dimming curvatures and tasks little influenced the acceptability of illuminance

Reducing Barriers to Use of High efficiency Lighting Systems
34 of 107
reductions. 50 % and 80 % of the subjects accepted illuminance reductions up to about 40% and 20% respectively. Figure 9 shows a similar trend to Figure 8.
(a) No task (free gaze) (b) Paper task (word puzzle)
Figure 7. Detectability of illuminance reduction.
(a) No task (free gaze) (b) Paper task (word puzzle)
Figure 8. Acceptability of illuminance reduction.

Reducing Barriers to Use of High efficiency Lighting Systems
35 of 107
(a) No task (free gaze) (b) Paper task (word puzzle)
Figure 9. Acceptability of illuminance reduction (0 to 10 scale).
4.3.4. Discussion Figure 10 diagrams the relationship between the percentage of subjects who accepted the change in illuminance and the acceptability ratings. Figure 10 illustrates a linear relationship with high R2 value: 0.83 between the two evaluations and therefore implies the consistency of evaluation of all the subjects.
Figure 10. Relationship between acceptability rating and percentage.

Reducing Barriers to Use of High efficiency Lighting Systems
36 of 107
4.4 Bias study The bias study investigated how bias given to subjects influences the acceptability to illuminance change. Another objective of the bias study was to investigate how tasks performed by subjects influence the acceptability of illuminance change.
4.4.1 Experimental conditions: Table 5 summarizes the experimental conditions. As independent variables, the target illuminance, task condition, font size, and bias condition varied. A wider range (20 lx to 1,000 lx) than the dimming curve study was employed because it was expected that biased subjects might accept lower target illuminance levels. For both the paper and VDT tasks, the same word puzzles as the dimming curve study were used. For the VDT task, a desktop personal computer (DELL, OptiPlex) with a 16” CRT screen was used. The dimming period and initial illuminance were constant at 10 seconds and 500 lx respectively. The dependent variable was subjective evaluation of whether the illuminance level at a given moment was different from the initial illuminance level and whether the illuminance change was acceptable. The subjects also evaluated the acceptability using the same eleven-step scale as the dimming curve study, from zero (very unacceptable) to five (neutral) and ten (very acceptable).
Table 5. Experimental conditions
Variables Range Target illuminance (lx)
1000, 900, 820, 740, 660, 580, 500, 420, 340, 260, 180, 100, 20
Task condition Paper task, VDT task Font size (point) 6, 12 Bias No-bias, bias
4.4.2. Experimental procedure Four subjects, ranging 25 to 28 in age, participated in the experiment. In the experiment, an experimenter escorted a subject to the private office and seated the subject in the chair. The subject adapted himself/herself to the brightness of the initial illuminance, 500 lx, for about five minutes. During the adaptation, the subject read and signed an informed consent form. The experimenter gave instructions about the experimental procedure to the subject. The experiment was divided into two sessions, one for a no-bias session and the other for a bias session. All the subjects started with the no-bias session. In each session, the subject conducted a paper task and a VDT task. Both tasks used the same word puzzles as the dimming curve study. Two font sizes, 6 and 12 points were used for the puzzles in both the tasks. The order of the tasks and font sizes were counterbalanced across subjects. For each of the four combinations (2 tasks × 2 font sizes), thirteen target illuminance levels were presented to the subject. In each

Reducing Barriers to Use of High efficiency Lighting Systems
37 of 107
presentation, the illuminance was gradually reduced from the initial illuminance (500 lx) to each of the thirteen target illuminance levels for ten seconds following linear dimming functions. The order of the target illuminance levels was randomized. The subject started performing either the paper task or the VDT task under the initial illuminance level, 500 lx. After the ten-second dimming presentation, the experimenter asked the subject whether the illuminance change was detectable, and if so, acceptable (“yes” or “no”). After completing the no-bias session, the experimenter gave an instruction sheet to the subject. The instructions given to subjects are listed below. All three following paragraphs were given to the subject as one general bias:
• Economic effect: Assume you are working for a company in the capital district of NY that is on the verge of blackouts. To avoid building more power plants, we have to find a way to cut peak electricity consumption. Some feasibility studies have shown that dimming the lighting is an effective way to cut the peak load without compromising productivity. Such load shedding could reduce your company’s electricity bill by about $1,500/10kW/year.
• Global effect: Simulations show that every new power plant will lead to an increase of CO2 gas, which will cause a global warming effect. We have already seen such greenhouse effects such as an increase of the sea level, climatic change, and more frequent floods. Demand side management through load shedding ballasts can reduce the number of new power generators and therefore reduce additional contribution to the greenhouse effect.
• Local effect: New power plants and transmission lines need to go somewhere. For a variety of reasons, health, aesthetic and economic, people generally do not want such structures built near them. The reality is that people have little control over their community, and a new plant or transmission line may be built near you. Knowing that load shedding ballasts will reduce the number of new plants and transmission lines needed, how acceptable are the following dimming levels?
After reading the instructions, the subject followed the same procedure as the no-bias session. Each session took a subject about 30 to 40 minutes. The subject conducted the two sessions on different days.
4.4.3 Experimental results Figure 11 shows the results of the acceptability evaluations to the illuminance changes under the four task conditions—(1) paper task with 6-point font size, (2) paper task with 12-point font size, (3) VDT task with 6-point font size, and (4) VDT task with 12-point font size. Figure 11 suggests that the instruction given to the subjects between the two sessions somewhat affected the subject responses. It is apparent that the acceptable dimming range by biased subjects is wider than that by non-biased subjects, although the probability curves are not smooth because of the small sample size. Figure 12 compares acceptable dimming ranges between biased subjects and non-biased subjects. Each of the two lines shows the average of the percentages for all four task conditions. The comparison of illuminance reductions, which all four subjects accepted, between the non-biased subjects and the biased subjects shows that the acceptable target

Reducing Barriers to Use of High efficiency Lighting Systems
38 of 107
illuminance of the biased subjects was lower by one to two steps, 80 lx to 160 lx respectively, than that of the non-biased subjects. The comparison of the acceptable target illuminance levels between the four task conditions in each of the graphs (a) and (b) in Figure 11 suggests that the acceptable target illuminance for the VDT task tends to be lower than that for the paper task. It also suggests that the lager font size might lower the acceptable target illuminance.
The results of this study imply that if the motivation of occupants towards energy savings is raised, occupants may accept larger reductions in illuminance. However, further studies need to be done with more subjects to obtain more reliable data.
(a) Non-biased subjects (b) Biased subjects
Figure 11. Acceptability of illuminance reduction in the bias study
Figure 12. Acceptability of illuminance reduction
for biased subjects and non-biased subjects

Reducing Barriers to Use of High efficiency Lighting Systems
39 of 107
5. Conclusions The memory study indicates that occupants are able to memorize the initial brightness of their surroundings and respond to illuminance changes based on this memory. Lengthening the time in the dark from exposure to the initial lighting conditions appears to decrease sensitivity to illuminance reduction, but this result is potentially confounded with light adaptation, thereby possibly diminishing the magnitude of this effect. The dimming curve study suggests that the dimming curvature and task conditions have little influence on the detection of illuminance reductions. It was also found that regardless of the dimming curvatures or tasks, 50 % of the subjects could detect a reduction of initial illuminance of about a 15 % or greater. With regard to acceptability, the experimental results suggest that the dimming curvatures and tasks had little influence on the acceptability of illuminance reductions. The bias study suggested that the acceptable dimming range of biased subjects is wider than that of non-biased subjects, offering an additional 20 to 30% acceptable illuminance reduction. More precise results with smoother probability curves, especially for the specific task analyses require a larger number of subjects. That data is now being collected as this work continues.
6. Implications for load shedding If the amount of power reduction for effective load management requires dimming by more than 15% then there is a high probability that people will notice the change in illuminance, no matter how that change is accomplished. Fortunately, changes of this magnitude and up to about 25% are acceptable to most people. Furthermore, by educating people on the reasons for and benefits of load shedding, which is called biasing when under experimental conditions, the acceptable dimming range can be extended to 50% or more. This provides great insight into how to manage a successful load-shed program. To maximize demand savings, education of the public, or affected persons, should be a high priority.
7. Further study It is important to add more subjects to the bias study to specify acceptable dimming ranges for biased and non-biased occupants. It is also useful to investigate how dimming periods longer than two minutes affect the acceptability of illuminance reduction. Eventually, based on our findings, we will have to conduct field studies in real commercial offices to verify whether occupants are comfortable with the specified requirements of the dimming range, curve, and speed and evaluate how much electric energy can be saved through the load shedding system.
Acknowledgements The authors would acknowledge Connecticut Light and Power for funding this research.

Reducing Barriers to Use of High efficiency Lighting Systems
40 of 107
The authors would like to acknowledge Peter Boyce and Mark Rea for their comments on the experiments. The authors would like to thank Lei Deng, Jean Paul Freyssinier, Chao Ling, and Francisco Garza for their technical support.
REFERENCES Kelly, D.H. (1961) Visual response to time-dependent stimuli, Journal of the Optical Society of America, No. 51
Kelly, D.H. (1971) Theory of flicker and transient responses, Journal of Optical Society of America, No. 61
Kryszczuk, K. (2001) Detection of slow light level reduction, 2001 IESNA Conference Proceedings, pp.315-322
Shikakura, T., Morikawa, H., Nakamura, Y. (2001), Research on the perception of lighting fluctuation in a luminous offices environment, Journal of the Illuminating Engineering Institute of Japan, 85, 5, pp. 346-351

Reducing Barriers to Use of High efficiency Lighting Systems
41 of 107
APPENDIX 4.2-B
DRAFT REPORT: THE EFFECT OF BIAS TOWARDS ENERGY SAVINGS ON OCCUPANT’S DIMMING REQUIREMENTS
Sponsored by US Department of Energy Prepared by: Yukio Akashi, PhD
Jason Neches

Reducing Barriers to Use of High efficiency Lighting Systems
42 of 107
1. Introduction
Load shedding ballasts could be used as an effective method for load management by reducing the peak electricity demand needed for lighting. However, before they are applied to the real world, it is important to understand occupants’ light level requirements with respect to dimming.
A recent study at the Lighting Research Center (LRC) investigated a detectable range of illuminance change and suggested that occupants could not detect up to 20 % illuminance reduction regardless of initial illuminance or dimming speed within the experimental conditions (Kryszczuk, 2001). A similar study, in which the subjects were more sensitive to illuminance change than in Kryszczuk’s study, also suggested that illuminance could be changed by up to 20% from the initial value without being detected by occupants when they were devoted to tasks (Shikakura, 2001). More recently, two studies at the LRC investigated what cues occupants used to detect illuminance change and whether the reducible illuminance range defined in the above studies, up to 20 % change from the initial illuminance, could be extended if slower dimming speeds or smoother dimming functions are employed (Akashi et al., 2002). The first Akashi et al. study sought to determine whether memory of the initial illuminance level is the main cue to detecting dimmed light levels. The results of this study suggested that occupants were able to memorize a room’s brightness under the initial illuminance and could reliably detect reductions greater than 20% when the dimming period was relatively short. As the period of dimming increased, memory may have faded and therefore the sensitivity to illuminance change decreased. These results suggested that memory is the primitive decision factor. The results also led to a hypothesis that longer dimming periods, and therefore a slower rate of illuminance change, might lead to decreased sensitivity in detecting illuminance reduction.
With regard to the above question of whether slower dimming speeds and/or smoother dimming functions can extend the undetectable illuminance range, the second Akashi et al. study focused on the effect of dimming functions. The study also investigated acceptable range of illuminance reductions because, beyond detection, and perhaps more relevant to load shed dimming, is determining what level of dimming is acceptable to occupants. The results indicated that dimming function had little effect on the detectability and acceptability of illuminance change. The subjects accepted larger illuminance reductions than the above mentioned undetectable illuminance reduction—e.g., 50 % of the subjects accepted illuminance reductions up to about 40 % of the initial illuminance level while they could detect illuminance reductions greater than 15 % of the initial illuminance.
Since acceptability may vary according to one’s motivation for energy savings, it is important to investigate the effect of subjects’ bias on the acceptable dimming range. Therefore, in this study, the LRC attempted to investigate whether a pre-assigned bias towards energy savings could increase the acceptability of dimming through load shedding ballasts. Another objective of this study was to investigate how tasks performed by subjects influence the acceptability of illuminance change.

Reducing Barriers to Use of High efficiency Lighting Systems
43 of 107
2. Experiment Experimental setup: The experiment used a windowless private office and an adjacent room. Figure 1 shows the private office viewed from the adjacent room. Although, in this picture the door is open, the door remained closed during the experiment. Figure 2 illustrates the plan of the private office and the experimental system in the adjacent room. The interior wall and ceiling of the private office was painted white (reflectance: 85%). The reflectance of the floor carpet was about 30 %. The office was furnished with a bookshelf, a desk and a chair. The office was equipped with three-direct/indirect pendant luminaires suspended from the ceiling. Figure 3 shows the ceiling with the luminaires and the luminous intensity distribution of the luminaires. The experimental apparatus in Figure 2 was composed of the above described luminaires with dimming ballasts and T8 fluorescent lamps; an operating system—a desktop computer, a picoammeter, a photo-sensor, and a DC power supply; a communication system—two telephone sets and a “hands-free” phone tool; and a monitoring system—a TV monitor, a digital video camera with a transmitter, and a receiver. Table 1 summarizes the details of the experimental system.
Figure 1. Windowless private office and adjacent room used in all three experiments

Reducing Barriers to Use of High efficiency Lighting Systems
44 of 107
Figure 2. Room plan and experimental setup
Figure 3. Direct/indirect pendant luminaires (Crescent, Ledalite)

Reducing Barriers to Use of High efficiency Lighting Systems
45 of 107
Table 1. Experimental system.
Components Product name Manufacturer
3 Luminaires Crescent (8316T02PN) Ledalite
3 Ballasts M2-PD-T8-5C-B-120 Gold Edition
Programmed Start, dimming 5 ~ 110%
Motorola
6 Fluorescent lamps FO32/835/XP Osram Sylvania Inc.
1 Computer P5-166 Gateway
1 Picoammeter 485 Auto ranging Picoammeter Keithley
Software Lab View 6.0 National Instruments
1 DC power supply E3632A Hewlett Packard
1 Photo sensor 268P photopic, cosine response Graseby Optronics
1 Color TV monitor (13”)
PC1342 CRAIG
1 Camera and transmitter
XC10A X10, Inc.
1 Receiver VR30A X10, Inc.
2 Telephones DX2NA-12CTXH TEL (BK) Nitsuko America Co.
1 Hands-free phone tool
Vista, M12 Plantronics
Experimental Conditions: Table 2 summarizes the experimental conditions. As independent variables, the target illuminance, task condition, font size, and bias condition varied. Both the paper and VDT tasks used a word puzzle as shown in Figure 4. The VDT task used a desktop personal computer (DELL, OptiPlex) with a 16” CRT screen. The dimming period and initial illuminance were constant at 10 seconds and 500 lx respectively. The dependent variables were an evaluation of whether the illuminance level at a given moment was higher, lower, or identical to the initial illuminance level and whether the illuminance change was acceptable. The subjects also evaluated the acceptability using an eleven-step scale, from zero (very unacceptable) to five (neutral) and ten (very acceptable).

Reducing Barriers to Use of High efficiency Lighting Systems
46 of 107
Table 2. Experimental conditions
Variables Range
Target illuminance (lx)
1000, 900, 820, 740, 660, 580, 500, 420, 340, 260, 180, 100, 20
Task condition Paper task, VDT task
Font size (point) 6, 12
Bias Non-biased, biased
Figure 4. Word puzzle on a page.
Experimental procedure: Twenty subjects, ranging from 20 to 40 in age, participated in the experiment. In the experiment, an experimenter escorted a subject to the private office and seated the subject in the chair. The subject adapted himself/herself to the brightness of the initial illuminance, 500 lx, for about five minutes. During the adaptation, the subject read and signed an informed consent form. The experimenter gave instructions about the experimental procedure to the subject. The experiment

Reducing Barriers to Use of High efficiency Lighting Systems
47 of 107
was divided into two sessions, one for a non-biased session and the other for a biased session. Half the subjects started with the non-biased session, the other half started with the biased section. In each session, the subject conducted a paper task and a VDT task. Both tasks used word puzzles. Two font sizes, 6 and 12 points were used for the puzzles in both the tasks. The order of the tasks and font sizes were counterbalanced across subjects. For each of the four combinations (2 tasks × 2 font sizes), thirteen target illuminance levels were presented to the subject. In each presentation, the illuminance was gradually increased or reduced from the initial illuminance (500 lx) to each of the thirteen target illuminance levels for ten seconds following linear dimming functions. The order of the target illuminance levels was randomized. The subject started performing either the paper task or the VDT task under the initial illuminance level, 500 lx. After the ten-second dimming presentation, the experimenter asked the subject whether the illuminance change was detectable, and if so, acceptable (“yes” or “no”). Before undertaking the biased session, the experimenter gave an instruction sheet to the subject. The instructions given to subjects are listed below. All three following paragraphs were given to the subject as one general bias:
Economic effect: Assume you are working for a firm in the capital district of New York . This area is on the verge of a power shortage. Power shortages cause an increase in the price of electricity due to the laws of supply and demand. Some feasibility studies have shown that dimming the lighting is an effective way to cut the peak electricity load without compromising worker productivity. Such load shedding could reduce your company’s electricity bill by about $1,500/10kW/year.
Global effect: Simulations show that every new power plant will lead to an increase in CO2 gas, which will cause a global warming effect. We have already seen such greenhouse effects such as an increase in the sea level, climatic change, and more frequent floods. Electricity demand side management through load shedding ballasts can reduce the number of new power generators and therefore reduce your contribution to the greenhouse effect.
Local effect: New power plants and transmission lines need to go somewhere. For a variety of reasons, health, aesthetic and economic, people generally do not want such structures built near them. The reality is that people have little control over their community, and a new plant or transmission line may be built near you. Knowing that managing electricity demand through lighting will reduce the number of new plants and transmission lines needed, how acceptable are the following dimming levels?
After reading the instructions, the subject followed the same procedure as the non-biased session. Each session took a subject about 30 to 40 minutes. The subject conducted the two sessions (biased and non-biased) on different days.

Reducing Barriers to Use of High efficiency Lighting Systems
48 of 107
Experimental results: Figure 5 shows the results of the detectability of illuminance change. Figure 5 confirmed the results of the former studies that occupants could not detect up to 20 % illuminance reduction and obviously shows that detectability of illuminance reduction is unaffected by bias. This should be the case, as detectability is a lower order response unrelated to bias feelings.
Average Comparison: % who responded down
0%10%20%30%40%50%60%70%80%90%
100%
0 200 400 600 800 1000
E(t)
% w
ho re
spon
ded
dow
n
NB % down
B % down
Figure 5. Detectability of illuminance change in the bias
study for biased (B) and non-biased (NB) subjects
Figures 6 and 7 show the results of acceptability evaluations to illuminance changes under the four task conditions—(1) paper task with 6-point font size, (2) paper task with 12-point font size, (3) VDT task with 6-point font size, and (4) VDT task with 12-point font size. Figures 6 and 7 suggest that the instruction given to subjects between the two sessions somewhat affected their responses. It is apparent that the acceptable dimming range for biased subjects is wider than that for non-biased subjects. Figure 8 compares acceptable dimming ranges between biased subjects and non-biased subjects, averaged for all four task conditions. Figure 8 shows that the acceptable target illuminance of biased subjects was lower (by approximately 80 lux) than that of non-biased subjects. For instance, 50 % of the biased subjects accepted illuminance reduction by 380 lx (76 % of the initial illuminance from 500 lx) while 50 % of the non-biased subjects accepted illuminance reduction by 300 lx (60 % of the initial illuminance from 500 lx). The 80th percentile acceptable illuminance reductions are 270 lx for biased subjects and 190 lx for non-biased subjects. Comparison of Figures 6 and 7 suggests that the acceptable target illuminance for the VDT task tends to be lower than that for the paper task. We can assume that this

Reducing Barriers to Use of High efficiency Lighting Systems
49 of 107
difference was due to the self-luminous VDT screen. Interestingly, very little effect was shown with reducing the font size within a given task. Most likely, for both the point sizes of 6 and 12, the visual performance was already plateaued for such short-term tasks. Figures 9 through 11 show subjective ratings (scale 0 – 10) which where asked of subjects as a method to verify acceptability evaluations. These figures indicate similar tendencies to the above results of the yes/no appraisals.
BIAS % acceptable
0%10%20%30%40%50%60%70%80%90%
100%
0 200 400 600 800 1000
E(t)
% w
ho re
spon
ded
acce
ptab
le
condition 5 - B / paper / 6
condition 6 - B / paper / 12
condition 7 - B / VDT / 6condition 8 - B / VDT / 12
Average
Figure 6. Acceptability of illuminance change for biased (B) subjects
NO BIAS % acceptable
0%10%20%30%40%50%60%70%80%90%
100%
0 200 400 600 800 1000
E(t)
% w
ho re
spon
ded
acce
ptab
le
condition 1 - NB / paper / 6condition 2 - NB / paper / 12condition 3 - NB / VDT / 6condition 4 - NB / VDT / 12AVERAGE
Figure 7. Acceptability of illuminance change for non-biased (NB) subjects

Reducing Barriers to Use of High efficiency Lighting Systems
50 of 107
Average Comparison: % acceptable
0%10%20%30%40%50%60%70%80%90%
100%
0 200 400 600 800 1000
E(t)
% w
ho re
spon
ded
acce
ptab
le
NB % acceptableB % acceptable
Figure 8. Acceptability of illuminance change for biased (B)
and non-biased (NB) subjects, averaged for all four tasks
BIAS average rating
0.01.02.03.04.05.06.07.08.09.0
10.0
0 200 400 600 800 1000
E(t)
aver
age
ratin
g
condition 5 - B / paper / 6condition 6 - B / paper / 12condition 7 - B / VDT / 6condition 8 - B / VDT / 12AVERAGE
Figure 9. Subjective rating of illuminance change for biased (B) subjects

Reducing Barriers to Use of High efficiency Lighting Systems
51 of 107
NO BIAS average rating
0.01.02.03.04.05.06.07.08.09.0
10.0
0 200 400 600 800 1000
E(t)
aver
age
ratin
g
condition 1 - NB / paper / 6condition 2 - NB / paper / 12condition 3 - NB / VDT / 6condition 4 - NB / VDT / 12AVERAGE
Figure 10. Subjective rating of illuminance change for non-biased (NB) subjects
Average Comparison: rating
0.001.002.003.004.005.006.007.008.009.00
10.00
0 200 400 600 800 1000
E(t)
aver
age
ratin
g
NB average rating
B average rating
Figure 11. Average rating of illuminance change for biased (B)
and non-biased (NB) subjects, averaged for all four tasks
3. Conclusions The results of this study on detectability were similar to the results of the previous studies—occupants detected illuminance reductions greater than 15 % of the initial illuminance. This detectable range of illuminance change was not influenced by the bias given to subjects.��This study also found that the acceptable dimming range of biased subjects was wider than that of non-biased subjects. For instance, the 50th percentile acceptable illuminance reduction was 380 lx (76 % of the initial illuminance) for the biased subjects while 300 lx (60 % of the initial

Reducing Barriers to Use of High efficiency Lighting Systems
52 of 107
illuminance) for the non-biased subjects. The 80th percentile acceptable illuminance reductions are 270 lx for the biased subjects and 190 lx for the non-biased subjects. These results imply that if the motivation of occupants towards energy savings is raised, occupants may accept larger reductions in illuminance. �
References Kryszczuk, K. (2001) Detection of slow light level reduction, 2001 IESNA Conference Proceedings, pp.315-322
Shikakura, T., Morikawa, H., Nakamura, Y. (2001), Research on the perception of lighting fluctuation in a luminous offices environment, Journal of the Illuminating Engineering Institute of Japan, 85, 5, pp. 346-351
Akashi, Y., Neches J., Bierman, A. Energy saving load-shedding ballast for fluorescent lighting systems: occupant’s dimming requirements. Draft report submitted to Connecticut Light and Power on September 16th, 2002.�

Reducing Barriers to Use of High efficiency Lighting Systems
53 of 107
TASKS 4.3, 4.4, 4.5 INVESTIGATION OF THE EFFECTS OF DIMMING ON FLUORESCENT LAMP LIFE
Introduction The overall objective of this project is to identify and seek to reduce the barriers to wide acceptance and use of energy-saving daylighting, electric lighting, and control technologies, including occupancy sensors, photosensors, dimming electronic ballasts, and whole building integrated control systems. The following are detailed descriptions of the scope of work from tasks 4.3, 4.4, and 4.5:
• Task 4.3 – Investigate critical performance factors, such as optimal electrode voltage vs. percent rated current required maintaining electrode hot spot temperature. The focus will be on popular 32 Watt, T8 lamps, and on the performance of rapid start dimming ballasts.
• Task 4.4 – Investigate impact on lamp life of starting lamps when dimmed, i.e., at lower than rated current. This is related to lamps starting under dimmed conditions.
• Task 4.5 – Investigate the allowable dimming range that can be achieved without additional electrode heating voltage. This will enable lower cost, instant start, dimming ballasts for load shedding, lumen maintenance, etc. This task requires investigation of instant start, dimming ballasts for load-shedding applications.
Overall, these three tasks require the LRC to investigate the interaction between dimming ballasts and fluorescent lamps, and to identify the impacts of dimming on fluorescent lamp life. This knowledge will be used to help reduce the barriers to widespread use of electronic dimming ballasts.
The first section reviews research on the topic of fluorescent lamp failure mechanism, electrode characteristics, ballast operation and starting on lamp life. This section provides necessary background information on fluorescent lamps, ballasts, and their interactions. The sections that follow relate directly to specific tasks as follows:
The section, Optimum electrode heating as a function of the discharge current, provides a direct answer to Task 4.3, detailing how dimming affects fluorescent lamp life and how to reserve dimmed lamp life by supplying optimum electrode heating.
The section, Impact on lamp life of starting lamps when dimmed, focuses on task 4.4, providing theoretical analysis and laboratory testing on how starting lamps when dimmed may reduce lamp life.

Reducing Barriers to Use of High efficiency Lighting Systems
54 of 107
The section, Allowable dimming range without additional electrode heating, investigates the allowable dimming range that can be achieved without additional electrode heating voltage. These results are a direct answer to task 4.5.
Appendix-4.3 - A presents a market analysis for load-shedding ballasts, which is needed in task 4.5 in order to decide the allowable dimming range in such applications.
Fluorescent Lamp Life
Lamp failure mechanism The failure of fluorescent lamps is caused mainly by the loss of the electron emissive coating of the lamp electrodes (den Hoek, 2002, Verderber, 1985, Waymouth, 1971). Under certain circumstances, such as high frequency operation and frequent starting on instant start ballasts (“cold ignition”), fracture of the tungsten coil is also observed, which causes the lamp to fail (Haverlag, 2002). Electrode temperature directly affects the evaporation and erosion of the emitting material and thus the lamp life. A very high electrode temperature (greater than 1000 ºC) will reduce lamp life due to evaporation of the emitting material, and a low electrode temperature (less than 700 ºC) will reduce lamp life due to erosion of the emitting material by sputtering (Ji, 1998).
With the introduction of low-mercury content lamps it is possible that lamp life, when over 20,000 hours, might also be influenced by a reduction of available mercury within the lamp. Since there is a strong movement in the industry to limit the mercury content of fluorescent lamps, some new lamp designs are manufactured with near the minimum amount of mercury needed for an efficient mercury discharge. Over time, free mercury in the lamp bonds to other materials within the lamp envelope, especially the sputtered and/or evaporated electrode material that gets deposited over the inside lamp walls (personal conversation with lamp manufacturer representative). For lamps with excess mercury added, mercury absorption is not an operational problem because the lamp electrodes limit life before the excess available mercury is removed. However, lamps with marginal amounts of mercury dosing, combined with severely sputtered and/or evaporated electrodes may show different end-of-life behavior.
Electrodes for fluorescent lamps
Electrode characteristics Fluorescent lamps operated on alternating current have two identical electrodes that serve alternately as the anode and the cathode. The electrode at the negative end of the tube (the cathode) and its associated discharge region (the negative glow) serve the function of injecting the necessary electron current into the discharge column. The positive electrode (the anode), on other hand, must extract electrons from the discharge column at the other lamp end. The sketch in Figure 1 (Waymouth, 1971) identifies the main discharge regions and electric potentials for a fluorescent lamp.

Reducing Barriers to Use of High efficiency Lighting Systems
55 of 107
Figure 1. Sketch identifying the main discharge regions and potentials across them (Waymouth,
1971)
Fluorescent lamps used for general lighting applications are known as hot cathode lamps. These are different than cold cathode lamps used for “neon” signs and other special applications. Hot cathode lamps produce light much more efficiently than cold cathode lamps. Hot cathode operation is what is generally referred to as fluorescent lighting. Therefore, this discussion will consider only hot cathode lamps.
Electrode temperature is an important factor that affects lamp operation and life. The majority of the electrons emitted by the cathode result from the process of thermionic emission, whereby thermally excited electrons have enough energy to free themselves from the material. The work function is a property of a material that determines the energy needed for an electron to escape the material. Fluorescent lamp electrode filaments are coated with an emission mix, made from calcium (Ca), barium (Ba), and strontium (Sr) oxides, that has a very low work function, ranging from 0.9 to 1.1 eV, compared to that of the bare tungsten filament whose work function would be about 4.5 eV. For coated filaments, temperatures of about 900 ºC are high enough to create thermionic emission of electrons sufficient for the discharge current. Without the emissive coating, thermionic emission is insufficient for the discharge current, which, if maintained, would lead to the destruction of the electrode and lamp failure.
The emissive coating on the electrodes is removed by two processes: evaporation and sputtering. Evaporation is the continual, temperature dependent removal of material into the low pressure atmosphere inside the lamp envelope. The removed material is deposited on nearby cooler surfaces, such as the lamp wall, that results in lamp end-darkening. Sputtering is the removal of material by the impact of positively charged ions accelerated toward the cathode. Sputtered material also gets re-deposited on nearby surfaces, including the electrode.

Reducing Barriers to Use of High efficiency Lighting Systems
56 of 107
Operating life, therefore, is limited by evaporation and sputtering of electrode coating. If the electrode temperature is too high, lamp life is reduced by evaporation of the emissive coating. While a low electrode temperature will reduce the evaporation of the emissive coating, it may increase lamp electrode sputtering. Sputtering increases at low electrode temperatures because alternate processes take the place of thermionic emission for generating the supply of electrons for the discharge. These processes require a drop in electric potential adjacent to the electrode, which is responsible for accelerating ions, which impact the electrode. This drop in electric potential is called cathode fall voltage. Near end of life, when the emission mix is depleted from the electrode filament, the work function of the electrode material increases up to about 4.5 eV, that of bare tungsten. To sustain the discharge, the sharp drop in electric potential at the cathode increases dramatically to aid in extracting electrons. Large increases in cathode fall voltage result in either catastrophic sputtering of the electrode, or the ballast failing to sustain or initiate the discharge due to the higher overall lamp voltage.
Cathode fall voltage Cathode fall voltage is a fundamental property of the discharge and always indicates the electrode sputtering level (Hammer, 1995). Cathode fall voltage is the drop in electric potential from the cathode to the end of the cathode sheath region; a distance of about 0.1 mm. The cathode fall voltage accelerates the electrons emitted from the electrode toward the lamp arc stream and enables ion generation when these accelerated electrons collide with the mercury and argon atoms in the gas atmosphere of the lamp. Once produced, these ions are accelerated by the cathode fall voltage and strike the cathode. The ion bombardment heats the cathode surface, raising the electrode temperature and increasing the emission of electrons. High cathode fall voltage will cause ions to strike the cathode so forcefully that a great deal of emissive coating sputtering occurs. Alternately, low cathode fall voltage indicates an abundance of free electrons from which the rate of thermionic emission is high. This implies that the electrode is operating at an excessively high temperature with a high electrode-evaporation rate that eventually will shorten lamp life.
Theoretically, the thermionic emitting properties of the electrode can be used to indicate cathode fall voltage and the resulting degree of sputtering during lamp operation. The cathode at its operating temperature with no external electric field has a certain thermionic emission of electrons, called zero-field thermionic emission. A higher zero-field thermionic emission, implies little or no sputtering. Several researchers developed different methods to measure the zero-field thermionic emission and electrode temperature, while other researchers developed models to predict these values (Waymouth, 1971, Soules et al 1989, Watanabe 1995). However, these researchers never related their measurement to real lamp-life data. Thus, it is still not clear how these properties relate to fluorescent lamp life. Research on cathode fall voltage has progressed beyond measurement and models to relate the cathode fall voltage data to lamp life (Hammer 1989 and 1995, Misono 1992, Watanabe 1993).
Figure 2 shows the postulated lamp-life relationship with cathode fall voltage. Figure 3 shows Misono’s data on the relation between cathode fall voltage and lamp life for experimental lamps. At 60 Hz operation, the acceptable range of peak cathode fall voltage is approximately 11.0 to

Reducing Barriers to Use of High efficiency Lighting Systems
57 of 107
14.5 V. However under high frequency operation (>20 kHz), this range will be as low as 7 to 10V (Hammer 1989).
Figure 2. Postulated lamp life (%) vs. cathode fall voltage (V) at 60 Hz (Hammer, 1995)
Figure 3. Relationship between lamp life and cathode fall voltage (Misono, 1992)

Reducing Barriers to Use of High efficiency Lighting Systems
58 of 107
Electrode thermal model In alternating current (ac) operation, when no separate heating of the cathode is provided, most of the cathode heating arises from electron bombardment during the half-cycle when the electrode is acting as anode (Lowry, 1951). Some additional heating results from ion bombardment during the half-cycle when the electrode is acting as cathode and from the resistive losses (loss = I2R) in the tungsten wire core caused by the discharge current flowing in through the leads and out through the cathode surface. In these cases, the cathode heat developed is related to the arc current being drawn.
For both low frequency lamp operation (60 Hz) and high frequency operation (> 20 kHz) most of the cathode heating comes from the anode cycle because the energy dissipated (lost) at the anode is much larger than that lost at the cathode. According to Watanabe (1993), for 50 Hz operation, anode cycle loss is about 6 times the cathode cycle loss. For 43 kHz operation, anode cycle losses decrease due to the lack of the anode fall voltage, however, the anode loss from the work function of the electrode material is still about one and a half times larger than the cathode fall loss.
The main electrode heat loss mechanisms are conduction to adjacent elements, electron emission cooling, radiation cooling, and convection cooling of the electrode surface. The reduced demand on the electrode to supply electrons resulting from dimming the lamp can reduce the heat loss from electron emission cooling. However, this reduction of heat loss cannot completely compensate for the reduction of electrode heating due to dimming.
The inherent bombardment type of cathode heating that occurs on the lamp electrodes ordinarily results in what is known as “hot spot” operation. Since points on the cathode will vary in potential depending on their distance from the lead wire supplying power, and since it is a practical impossibility to maintain all areas of the cathode surface at exactly the same electron emitting efficiency, the discharge tends to localize at the most efficient emitting areas and also at areas nearest the lowest electric potential. The result is that this type of cathode does not operate at a uniform temperature throughout its length. A “hot spot” develops, which comes to a temperature and area equilibrium depending on the arc current being passed. During lamp life, emission mix material leaves the electrode by evaporation. Due to the relatively high temperature of the “hot spot,” the emission mix evaporates more in that location. This results in the hot spot moving like a candle flame from one end of the electrode to the other. When all of the emission mix material is consumed, the lamp will quickly extinguish. Soules (1989) has presented an excellent simulation of this process. Investigations at the LRC support this “candle flame” movement of the hot spot occurring over the life of lamps operated on instant-start ballasts (See Figure 4).

Reducing Barriers to Use of High efficiency Lighting Systems
59 of 107
64 mA 121 mA 180 mA
Hot spot Hot spot Hot spot
64 mA 121 mA 180 mA
Hot spot Hot spot Hot spot
Days of operation @ 30 mA
Filament breaks
Days of operation @ 30 mADays of operation @ 30 mA
Filament breaksFilament breaks
Figure 4. Movement of Hot Spot for Instant Start Fluorescent Lamp under Dimmed Condition
Electrode heating under 60 Hz and high frequency operations When a fluorescent lamp operates on alternating current, the electrode alternately operates as both cathode and anode. During the anode cycle, since the anode does not emit ions, a negative space charge builds up in front of the electrode and an anode fall voltage is formed, analogous to cathode fall voltage. Under 60 Hz operation, the anode fall voltage averages approximately 5 V and is marked by oscillations in voltage about this level (Waymouth, 1971). Electrons accelerated by this anode fall are collected by the anode and contribute a significant fraction of the energy to heat the emitter coil. Since no ions exist in front of the electrode during the anode cycle at 60 Hz operation, the anode current flows uniformly into the electrode. Thus, the electrode is heated rather uniformly during the anode cycle.
When a fluorescent lamp is operated at high frequency (> 20 kHz), the electrons and ions formed in front of the electrode during its cathode cycle are hardly removed during the following

Reducing Barriers to Use of High efficiency Lighting Systems
60 of 107
anode cycle because of the short length of time of the half-cycle period. The anode can draw electrons from the free electrons remaining from the period in which the electrode was a cathode. As a consequence, the anode fall voltage vanishes and the anode cycle loss decreases due to the lack of the anode fall voltage. The average electrode temperature therefore is lower under high-frequency operation than under low-frequency operation due to the drop in the anode cycle loss. However, the electrode hot-spot temperature under high-frequency operation may be still higher than the electrode temperature under low-frequency operation. This is supported by the fact that the cathode fall voltage under high frequency operation is lower than that under 60 Hz operations (Hammer, 1995). Watanabe (1993) explained this peculiar sounding phenomenon as follows:
Ion space charges are formed in front of the cathode spot position during the cathode cycle. When the polarity is changed, the ion space charges are quickly neutralized by the electrons from the positive column, and the electric field vanishes. Then, mercury ions in front of the cathode-spot position diminish mainly through the diffusion process during the anode cycle…Therefore mercury ions randomly travel a distance of 240 µm during the anode cycle. Since this distance is comparable to the size of the cathode spot, it is reasonably concluded that the ion space charges in front of the cathode-spot position are virtually not removed during the anode cycle.
Due to the ion space charge in front of the cathode spot, the anode cycle loss is concentrated at one particular spot on the electrode in the case of high frequency operation. Thus, the cathode-spot is efficiently heated during the anode cycle under high frequency operation. In contrast, uniform heating by the anode cycle loss under low frequency operation is less effective for increasing the cathode-spot temperature. In this case, high frequency operation will not only increase the lamp efficacy due to the elimination of anode fall voltage, but also may enhance lamp life due to the effective heating of the cathode spot (Watanabe, 1993).
Ballast operating effects on fluorescent lamp life There are three operating parameters that may affect fluorescent lamp life: lamp current crest factor (CCF), supplemental electrode heating voltage, and lamp operating current. The ballast that operates the lamp mainly determines these three parameters.
Lamp current crest factor is the ratio of peak lamp current to the root mean square lamp current. A higher CCF indicates a distorted wave shape with the potential for high peak current, which can damage the lamp electrode and reduce lamp life. Fortunately, most electronic ballasts have satisfactory CCF of less than 1.7, which is regarded as an acceptable limit by ANSI ballast performance standards. However, this limit is based on 60 Hz operation, therefore applying it to high frequency operation is questionable. Perhaps higher CCF values are acceptable for high frequency operation due to the more efficient heating of the electrodes under high frequency operation.
Supplemental lamp electrode voltage is the voltage across the electrode filament at each lamp end that is supplied by certain ballast types to heat the electrodes during lamp operation. For

Reducing Barriers to Use of High efficiency Lighting Systems
61 of 107
Instant start and modified rapid start ballasts, this voltage is 0 V (non-existent), but some electronic rapid start ballasts, and most magnetic rapid start ballasts continue to provide about 3.5 V across the electrodes during lamp operation. Although this increases the active power of the system, it can diminish or possibly avoid the sputtering of the electrode emissive material that occurs if the electrode temperature drops below 700 ºC. The electrode temperature will likely drop to below 700 ºC when the lamp is dimmed.
Lamp operating current is the current flowing through the lamp during operation. The Ballast factor (BF) is the ratio of the luminous flux emitted by a lamp operated on a given ballast to the flux emitted by the same lamp when operated on a reference ballast. These two parameters are directly related in that reducing the lamp operating current reduces the light output of the lamp and therefore reduces the BF. ANSI sets maximum limits on lamp operating current to minimize the evaporation of the electrode emissive coating and minimum limits to avoid electrode sputtering. ANSI does not address the issue of dimming the light output of lamps. Lamp voltage increases slightly as lamp current is decreased, making the direct relationship between lamp current and light output deviate slightly from being directly proportional.
Starting effects on fluorescent lamp life There are four main methods to start fluorescent lamps: preheat start (or switch-start), rapid start (includes modified rapid start), programmed start, and instant start.
In a preheat start system, a starter switch diverts lamp current across the filaments at the lamp ends to preheat the lamp electrode for several seconds. Then, when the starter’s switch opens, the ballast provides approximately 200 to 300 V across the lamp to strike the arc. This method is obsolete in the U.S. and is rarely used in commercial and industrial lighting systems.
Rapid-start ballasts include an electrode heating circuit that provides a low filament heating voltage (about 3.5 V) to obtain an electrode temperature ranging from about 700 to 1000 ºC within a one- or two-second starting-period while at the same time applying a starting voltage of 200 to 300 V to the lamp. Most rapid-start ballasts continue to supply the electrode heating voltage even after the lamp has started, which results in power efficiency losses of about 1.5 to 3 watts per lamp. There is also a ballast type that uses a rapid start starting method, called cathode disconnect (or modified rapid start), that removes the supplemental heating after the lamp has started.
Programmed start, being recently introduced to the market, is defined in ANSI 2002 standards as follows:
Those systems in which the sequence for starting hot-cathode electric discharge lamps is as follow: (1) the lamp cathodes are initially preheated to a temperature sufficient for adequate electron emission and without establishing local ionization across the cathodes; (2) this cathode heating is accomplished by supplying the required energy from a voltage or current source in the ballast itself, while during the preheated period the voltage across the lamp is kept below a level to initiate a glow discharge; (3) after the preheating period the voltage across the lamp is increased to a sufficient level to initiate the arc breakdown

Reducing Barriers to Use of High efficiency Lighting Systems
62 of 107
discharge; and (4) cathode heating may be reduced or removed after the lamp is in full conduction.
Supplying the correct amount of supplemental heating is critical for the above starting methods. If the electrode heating voltage is too high, the overall temperature of the electrode may exceed 1000 ºC, thus reducing lamp life due to a high electrode coating evaporation rate, especially if the supplemental electrode heating is not removed after the lamp starts. If the electrode heating voltage is too low, the temperature of the electrode may be too low for sufficient thermionic emission, thus reducing lamp life due to excessive coating loss through sputtering. The electrode Rh/Rc ratio is often used to measure whether or not the electrode is heated to an appropriate temperature during starting. Rc is the cold lamp electrode resistance at room temperature (25 ºC). Rh is the hot lamp electrode resistance at the end of the preheat period but just before the glow to arc transition. Ji (Ji, 1998) illustrated that Rh/Rc ratio correlates well with rapid start fluorescent lamp life (See Figure 5). A higher Rh/Rc ratio enables more starts.
-
10,000
20,000
30,000
40,000
50,000
2.00 2.50 3.00 3.50 4.00 4.50
Rh/Rc ratio
Lam
p lif
e (c
ycle
s)
Figure 5. Rh/Rc ratio vs. lamp life (Ji, 1998)
Instant start ballasts supply a high initial voltage (over 400 V for 4-foot lamps) to strike the arc and start the lamp. The high voltage is required to initiate the discharge between the unheated electrodes. Since no supplemental heating is provided to the electrodes either before or during lamp operation, instant start ballast systems are more efficient than rapid start systems.

Reducing Barriers to Use of High efficiency Lighting Systems
63 of 107
According to the U.S. Census Bureau (2001), 85% of the electronic ballasts sales for fluorescent lighting systems are instant start. This is despite the fact that rated life claims for lamps operated on instant start ballasts are less than that for rapid start operation. However, rated life may not take into account operation at high frequency which provides better self-heating of the electrodes and the longer cycle times found in many applications (on for 8 to 10 hours at a time compared to the three-hours-per-start cycle for rating purposes). Recent life test results show that high frequency electronic instant start systems have nearly the same lamp life as rapid start systems (Ji, 1998). The widespread market acceptance of instant start electronic ballasts can be attributed to the benefits of the instant start method, including higher efficiency (5% higher than rapid start), faster starting and lower initial costs (3 - 9%).
0%
50%
100%
- 2,000 4,000 6,000 8,000 10,000 12,000 14,000 16,000Lamp operating hours
Lam
p Su
rviv
al (%
)
AB9_5min on 20min off
BB7_5min on 20min off
CB1_5min on 20min off
AB9_1hr on 20min off
BB7_1hr on 20min off
CB1_1hr on 20min off
AB9_3hr on 20min off
BB7_3hr on 20min off
CB1_3hr on 20min off
Continuous_all
Figure 6. Instant start fluorescent lamp life at different operating cycles
As previously stated, the operating life of fluorescent lamps is determined in most cases by the rate of the electrode emitter depletion. There are two different contributions to this process: depletion during steady–state operation and depletion due to starting. Damage to the cathode from the starting process is generally more serious than steady-state operation. Waymouth (1971) found that starting could reduce the life of the fluorescent cathode by a factor of about 2 to 3. Figure 6 shows the Lighting Research Center (LRC) life test results for T8 lamps operated on high frequency instant start electronic ballasts at different operating cycles. The lamps used in the study were manufactured by GE, Philips and OSI. The difference in life is more than a factor of four comparing the 5-minute-on per-start to the 1-hour-on per-start. It is important to note that frequent switching of lamps operated on instant start ballasts shortens life significantly, yet the market still chooses instant-start ballasts over other ballast types by a large margin. This

Reducing Barriers to Use of High efficiency Lighting Systems
64 of 107
demonstrates that lamp-life is just one of many factors considered when choosing a particular technology. Consumers apparently accept the damaging effects of starting using instant-start ballasts because they gain energy savings and lower initial costs.
Optimum electrode heating as a function of the discharge current (task 4.3)
Fluorescent lamp electrodes are designed to operate at a temperature high enough to support thermionic emission of electrons when they are operated near the rated discharge current. Dimming a fluorescent lamp by reducing the lamp current will reduce the cathode hot spot temperature. The consequence will be an increase in cathode fall voltage that is sufficient to increase the electrode temperature again by increasing the energy of the ions reaching the electrode. This may result in a higher electrode sputtering rate and lead to an early lamp failure. At the same time, however, the reduced discharge current requires less electron emission from the cathode. This reduced requirement somewhat offsets the lack of cathode heating, but because cathode electron emission is highly non-linear with electrode temperature, cathode fall voltage still rises upon dimming. At lamp discharge currents in the range of a few percent of the rated current value, lamp life may drop down to values of only a few days.
In order to avoid these negative effects on lamp life when dimming, there is the possibility of applying supplemental electrode heating current, which goes through the electrode filament and heats it by resistance heating to the temperature that is necessary for thermionic emission. Obviously, the lower the dimming level at which the lamp is operated, the higher the supplemental electrode heating current required. However, the electrode heating current should not be too high. The guiding principles are:
a. Too little heat reduces lamp life due to sputtering.
b. Too much heat reduces lamp life due to a high rate of the emission-mix evaporation.
Following these arguments, an optimum supplemental electrode heating current (or electrode voltage) exists for lamp dimming as a function of the discharge current and must be maintained in order to keep lamp life within a reasonable range. Various approaches for the determination of this optimization are possible through the following measurements:
a. Lamp life at various levels of the discharge current and different values for the electrode heating current
b. Electrode temperature (overall hot spot location) at different discharge and supplemental heating currents
c. Evaporation of barium from the electrode at different discharge and supplemental heating currents
d. Cathode-fall voltage measurements at different settings of discharge and heating currents made by the following techniques:
1. Langmuir probe

Reducing Barriers to Use of High efficiency Lighting Systems
65 of 107
2. Capacitive coupling
3. Measuring the lamp operating voltage
The first method yields the most reliable results as it is a direct measure of life and can match conditions as closely as possible to the situation the lamp user would experience. Unfortunately, results from such measurements will only be available after two to three years of testing with much effort and at great expense.
Hilscher (2002), from OSRAM GmbH, found a way of acquiring cathode-fall voltage of a fluorescent lamp operated at different discharge and electrode heating current values by measuring the lamp operating voltage. The lamps used in the experiment were 32 W, triple tube compact fluorescent (OSRAM DULUX T/E 32W), operated on 25 kHz electronic ballasts. Figure 7 shows the maximum observed cathode fall voltage, Ucf (i.e. the cathode fall voltage that corresponds to a minimum or no supplemental heating current) as a function of the discharge current. This clearly indicates that the cathode fall voltage increases exponentially with the reduction of lamp discharge current.
The measured values of the cathode fall voltage were used to determine minimum, target, and maximum values for the cathode-heating current. In practice it is difficult to isolate supplemental cathode heating current from lamp current, since the same wires that attach to the lamp carry both currents at the same time. An approximate value that represents the effect of the heating current is calculated as the sum of the squares (SOS) of the current in each lamp-end lead wire. These so called SOS values, given in terms of lamp current, are used as design guides for proper supplemental electrode heating. For the triple tube, 32W compact fluorescent lamp, Hilscher (2002) obtained:
SOSmin = 0.518 - 0.544*Id (A)
SOStarget = 0.163 - 0.255*Id (A)
SOSmax = 0.181 + 0.267*Id (A)

Reducing Barriers to Use of High efficiency Lighting Systems
66 of 107
Figure 7. Maximum cathode fall voltage (Ucf) as a function of lamp discharge current (Id)
(Hilscher, 2002)
Tetri (2000) conducted a life test on dimming T8 fluorescent lamps operated on dimming ballasts that provided cathode heating. Tetri found that when the lamps were operated at static dim levels of 1%, 5% or 15% luminous flux, or dimmed dynamically up and down according to daylight illuminance levels, the lamp would reach the nominal lamp life and lumen maintenance factor. Thus, Tetri concluded that dimming with proper cathode heating would not impact fluorescent lamp life. Examination of the life data from this experiment reveals a trend of decreasing lamp life for higher output levels that was not discussed by the authors. This hints at the possibility that the shortest life might be at an intermediate dim level. A probable reason for this is that at the lowest dim levels of 1% and 5%, very little current is demanded from the electrodes, so precise heating is not critical. As the current increases for higher levels of light output, heating becomes more critical, but the lamp current is still insufficient for self-heating of the electrodes.
Impact on lamp life of starting lamps when dimmed (task 4.4)
During the instant start and rapid start starting processes, the lamp undergoes a transition from cold cathode glow discharge to hot cathode discharge. The cold cathode glow discharge is formed when the cathode is capable of emitting electrons only by ion-impact-induced secondary electron emission. Even though the discharge might be self-sustaining, the current near the cathode is carried mainly by positive ions. As a result, each electron that leaves the cathode must cause the production of many ions at a point near the cathode. For this to occur, a very high cathode-fall-voltage must exist−often several hundred volts.
In the case of hot cathode discharge, the current at the cathode is carried mainly by thermionically-emitted electrons; positive ions are needed only to neutralize electron space

Reducing Barriers to Use of High efficiency Lighting Systems
67 of 107
charge and provide a modest electron-accelerating field at the cathode surface. The necessary ion production is much less than one ion per electron. The cathode fall voltage is therefore very small, typically on the order of the ionization potential of the atoms of the gas (5 to 10 V). Figure 8 illustrates the potential versus distance for cold cathode and hot cathode discharges operated at the same current in similar tubes at the same gas pressure (60 Hz) (Waymouth, 1971). The positive column potential drop, Vp, and anode fall, VA, are the same, but cathode fall voltage, and therefore total potential, are substantially greater for the cold cathode discharge.
Figure 8. Potential versus distance for cold cathode and hot cathode discharges (60 Hz
operation)
In the usual range of glow discharge conditions encountered in the process of lamp starting, the cathode fall voltage increases with rising current (Brown, 1959). This helps the transition from cold to hot cathode discharge by increasing the energy input to the cathode from the discharge. The positive ions reaching the cold cathode strike it with kinetic energies equal to the charge times the accelerating potential, which can be as high as the full cathode fall voltage. Most of this energy goes into heating the cathode, which increases the cathode temperature. The higher the cathode fall voltage and the ion current, the faster the cathode is heated to thermionic emitting temperature and the sooner the discharge is converted to a hot-cathode discharge.
When starting the lamp with an instant-start ballast at its rated lamp current, a sufficiently high potential is applied to the lamp to ionize the gas and to reach full operating current without a temporary pause in the glow state. The discharge current and lamp light output reach their normal operating values typically well before the 100 ms time limit measured after the application of the open-circuit voltage as defined by ANSI. The instantaneous energy input to the cathode

Reducing Barriers to Use of High efficiency Lighting Systems
68 of 107
during the transient glow-discharge-like condition that persists while current is increasing to normal operating current is very high. The rate of change of cathode surface temperature has been described as “almost of explosive violence” (Waymouth, 1971). As a result, during lamp starting, simple blasting off of chunks of cathode material by the drastic temperature rise will reduce the amount of coating remaining and would be expected to reduce lamp life. It is not known whether this potentially explosive heating reduces lamp life in practice, however. Most fluorescent lamp electrodes are designed with a coiled-coil or triple coil structure to help restrain the emission material so the lamp can last its rated life (typically 20,000 hours at 3 hours per start for T8 lamps) with no problem.
In the case of starting lamps when dimmed, i.e. at lower than rated current, the transition from cold-cathode glow discharge to hot-cathode discharge will most likely be extended due to the decrease of lamp current and the corresponding decrease in heating power available to the electrode. Although this may alleviate somewhat the violent cathode damage due to the explosive temperature rise, overall it is much more damaging on the cathodes because of the potential for a relatively extended period of glow discharge ion bombardment (sputtering). In the extreme case, when the lamp is dimmed to levels below about 20%, the current in the steady-state glow discharge is too low to heat the cathode to a sufficient temperature to convert it to the hot cathode mode. The discharge will “hang up” in the glow state. The high-energy ion bombardment in the glow discharge knocks away surface atoms and erodes the cathode to the point of destruction in a short time. Waymouth (1971) explained this sputtering damage during glow discharge at starting as follows:
Under glow-discharge conditions, with cathode fall voltages of 200 V or so, sputtering rates of 0.1 atom removed per incident ion would be quite typical. Besides, sputtering also damages the thermionic emission of the surface (even without significant material removal) in two ways. First, since the cathode is cold, atoms are sputtered away, bounced back on the cathode surface by the gas, and re-deposited helter-skelter instead of in an orderly way. Destruction of the ordered surface of the crystal must be expected to increase the work function and thus reduce thermionic emission. Second, tungsten atoms sputtered from the surface of exposed tungsten are deposited on the surface of the oxide almost as readily as on the tungsten, “plating” the oxide with a metallic covering and increasing its work function. The resulting reduction of accelerating field emission of the cathode means that the cathode fall voltage in the discharge must be higher to increase the ion current; the increased power input to the cathode increases its temperature to bring the electron emission up to the required level. The increased cathode fall voltage, ion current, and temperature persist for ten minutes to an hour after the damage, until the effects of the damage have been ‘annealed out’.
Figure 9 illustrates the relationship between lamp current and starting time for one Sylvania OCTRON FO32/735 T8 lamp operated by a high-frequency electronic ballast. It clearly indicates that start time increases exponentially with the reduction of lamp current.

Reducing Barriers to Use of High efficiency Lighting Systems
69 of 107
-
0.5
1.0
1.5
2.0
2.5
0 20 40 60 80 100 120 140 160 180 200
Lamp starting current (mA)
Star
ting
time
(s)
y = 4.768e-0.025x
R2 = 0.9925
Figure 9. Relationship between lamp starting current (mA) and starting time (s)
Also, it is observed after each start that the cathode operates for a significant time at a higher temperature than it does under continuous-burning conditions. This period of increased temperature greatly increases the evaporation rate of cathode coating material, and consequently the overall loss rate of coating material, leading to shortened lamp life.
Technically, it is possible to apply supplemental electrode heating current to heat the electrode before starting lamps when dimmed. This is similar to the situation of rapid start or programmed start fluorescent lamp. However, this is at the expense of efficiency, and/or initial cost. The possibility also exists that the intended supplemental electrode heating current is not effectively applied in all cases. LRC researchers found that in actual applications, connections and excessively long, tightly bundled wire leads reduce the amount of heating that actually takes place. On at least one LRC project this condition seriously reduced lamp life when traditional dimming ballasts that employ supplemental electrode heating were used (LRC, to be published).
Therefore, starting lamps when dimmed, i.e., at lower than rated current, is not recommended. To ensure long life, especially when supplemental electrode heating is not applied (e.g., instant start), a procedure of starting the lamp at its nominal full output level and then dimming it down to the desired light levels is necessary. Starting at full power will minimize the damaging effects of starting. This is advisable whether supplemental electrode heating is applied as part of the starting sequence, but most critical without supplemental electrode heating.

Reducing Barriers to Use of High efficiency Lighting Systems
70 of 107
Allowable dimming range without additional electrode heating (task 4.5)
In ac operation, when no separate heating of the cathode is provided, most of the cathode heating arises from electron bombardment during the half-cycle when the electrode is acting as anode. Some additional heating results from ion bombardment and from the resistance losses (loss = I2R) in the tungsten wire core caused by the discharge current flowing in through the leads and out through the cathode surface. In these cases, the cathode heat developed is positively related to the arc current being drawn. The main heat loss comes from the conduction to adjacent elements, the electron emission cooling, radiation cooling, and convection cooling of the electrode surface. Although dimming can reduce the electrode heat loss from the reduction of electron emission cooling, this reduction of heat loss does not compensate completely for the reduction of electrode heating.
Obviously, a certain amount of variation in lamp current is entirely permissible and results in no unfavorable performance. This is demonstrated by the fact that ballasts with ballast factors ranging from 1.3 to 0.77 are widely used and appear to maintain lamp life acceptably. Nevertheless, any cathode operates best at some definite value of lamp current. A cathode that is properly designed for best operation at 225 mA, for example, will run too hot at 400 mA and entirely too cold at 75 mA. If such a cathode is operated at too high a current and temperature, results may include excessive vaporization of barium, discoloration in the form of anode spots, and reduced lamp life. If the cathode is operated at too low of a current, too high of a percentage of the total emission must be obtained by ion bombardment, field emission, or some mechanism other than thermionic emission. This method of operation is conducive to an excessive cathode-fall voltage, greatly increased cathode sputtering by ion bombardment, and in extreme cases, very short life.
It has also been found that sputtering under continuous operating conditions is small under fairly wide variations of lamp current. Wehner (Stuart and Wehner, 1962) found that at a cathode fall voltage less than 20 V, the electrode sputter field is quite small, about 10-6 atoms removed per incident ion. Also there is little cathode temperature dependence in the sputtering yield (Stuart and Wehner, 1962). A great deal of the electrode heating energy comes from the collection of electrons in the anode half-cycle, and due to thermal inertia, the electrode does not cool down between its half-cycle of cathode duty. During operation, evaporation normally occurs at about a factor of 20 times greater than the rate of removal by sputtering. Therefore, sputtering can be ignored entirely in comparison with evaporation as a cause of coating loss under continuous burning conditions at nominal lamp currents. A lamp should be able to preserve a reasonable life within fairly wide variations of lamp current if it is started at its full rated current, and then dimmed down to the desired light level after it has reached its full light output. Now the question is: how much dimming is allowable for such reasonable lamp life?
In order to answer this question regarding the effect of lamp current on high frequency instant start fluorescent lamp life, a life test was designed at the Lighting Research Center. The life test included a total of 80 lamps at eight different lamp current conditions: ten lamps at each lamp

Reducing Barriers to Use of High efficiency Lighting Systems
71 of 107
current. All lamps were operated on 120 V ballasts for one lamp. The lamp current conditions selected were 180 mA, 121 mA, 64 mA, 49 mA, 41 mA, 30 mA, 24 mA, and 21 mA.
All ballasts were operated at 120 V, were from the same manufacturer, and had the same model number. The ballasts were rated to operate one lamp at 180 mA, which corresponds to a ballast factor of about 0.9, taking into account high frequency lamp operation. In order to achieve the different, reduced, lamp currents required by the life test design, a high voltage ceramic capacitor was placed in series with the lamp. The value of the capacitor, along with the specific ballast characteristics (e.g., operating frequency, output circuit details) determined the lamp current for each capacitor-ballast system. All of the capacitor-ballast systems were tested with a T8 fluorescent lamp to ensure that they operated the lamp closely to the selected lamp current.
In order to avoid the adverse effect of starting lamps under dim mode, the capacitors were connected in series with the lamp through a shorting device to bypass the capacitor during starting. After the lamps started, the shorting devices were manually removed, thereby dimming the lamps.
Calibrated capacitor-ballast systems were installed on two metallic racks that served as the support structure for holding the lamps. Each rack had eight levels, one level for each lamp current condition. One rack held six ballast-capacitor-lamp systems (48 lamps total). The other held four systems (32 lamps total). Figure 10 illustrates one such life test rack. Both racks were powered by a regulated 120 V power supply.
Figure 10. Instant start fluorescent lamp life test rack

Reducing Barriers to Use of High efficiency Lighting Systems
72 of 107
The life test was started with the capacitors shorted, thus all systems were started at their nominal lamp current. After 30 minutes of operation, the capacitor-shorting devices were removed, dimming the test lamps to their intended lamp currents. At this point, measurements of the lamp operating time began. Hours of operation for each lamp were accumulated until the lamp failed. A lamp was considered failed when it had no visible light output to the experimenter’s bare eye. The average lamp life was defined as the number of hours at which 50% of the test lamps at a given operating current failed.
As of November 6th, 2002, the lamps had accumulated 93 days of operation (2139 hours). By this date, all lamps operated at 49 mA and below had reached their median life (50% had failed). At the other extreme, all lamps operated at or above 121 mA were still operating. For the group at 64 mA operating current, only one lamp had failed by this date. Figure 11 summarizes the results for the dimming testing of instant start fluorescent systems. The results show that dimming to about one third of rated current (121 mA), a T8 fluorescent lamp operated with an instant start circuit still keeps a reasonable long life (more than 2139 hours with no failures).
Using current electricity pricing practices and load shed programs, LRC researchers found that load shed-related dimming of 100 hours per year would capture most of the economic benefit (see Appendix 4.3 - A). If the damage to the electrodes during dimmed operation is simply cumulative, meaning that no effects that accelerate the damage caused by dimming are occurring, then 2000 hours of dimmed operation is sufficient for load shedding applications. For example, a 20,000-hour lamp life corresponds to about 5.5 years of operation at 10 hours per day. If load shed dimming amounts to 100 hours per year, then 550 hours of dimmed operation is required. This dimmed operation would be expected to reduce the life of the lamp by about 25% (550/2100), equivalent to a 15,000 hour life. A more exact calculation, taking into account the reduced dimmed operation time due to the reduced life yields a life reduction of only 19%, corresponding to a life of 16,200 hours.
One interesting point worth mentioning is that impact of dimming on instant start fluorescent lamp life is quite analogous to frequent switching effects on life. Figure 12 is a re-plot of Figure 4, which shows the Lighting Research Center (LRC) life test results for T8 lamps operated on high frequency instant start electronic ballasts at different operating cycles. Frequent switching of lamps operated on instant start ballasts significantly shortens life, yet the market still chooses instant-start ballasts (85% shipment in 2001) over other ballast types by a large margin. This demonstrates that lamp-life is just one of the many factors considered when choosing a particular technology. Consumers apparently accept the damaging effects of starting using instant-start ballasts because they gain the energy savings and lower initial costs. Based on the above calculation, dimming 100 hours per year to 67% rated current levels is expected to reduce overall life by less than 20% (20,000 hour life reduced to 16,000 hours). Considering the energy savings, it should be reasonable for consumers to accept low cost instant start load shedding ballasts (about $9 cost increment on the standard instant start ballast) that enable the user to dim the lamp to 67% rated current level.
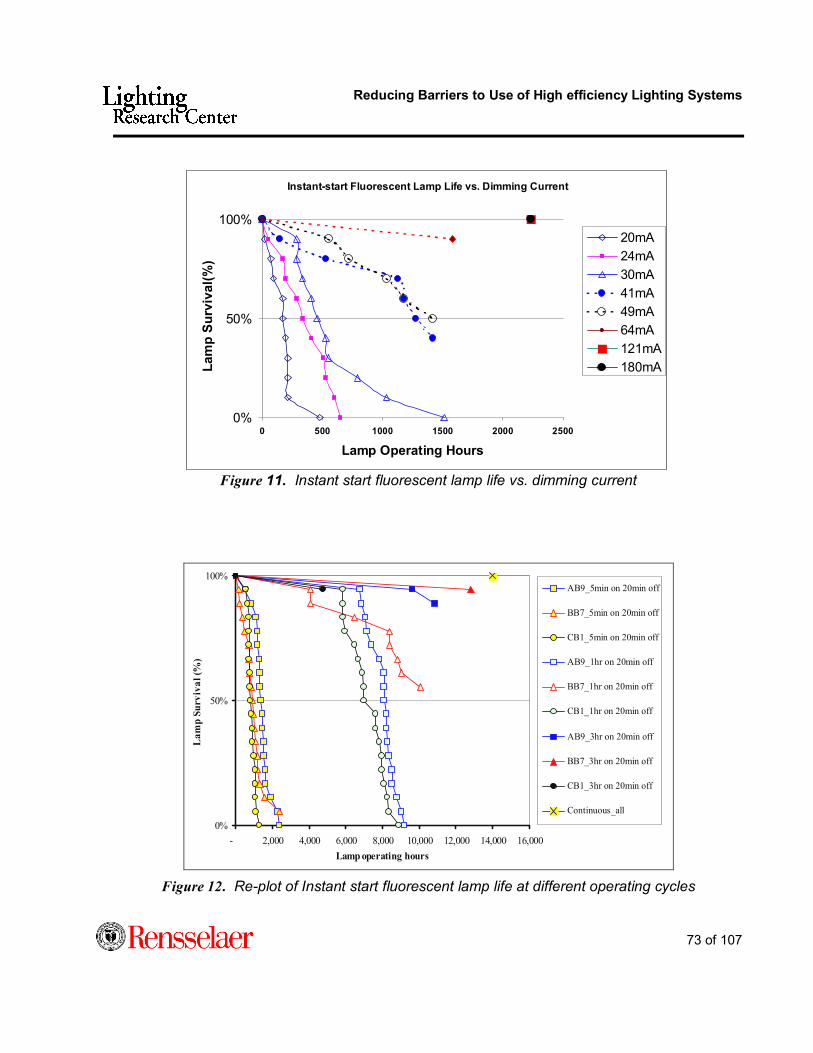
Reducing Barriers to Use of High efficiency Lighting Systems
73 of 107
Figure 11. Instant start fluorescent lamp life vs. dimming current
0%
50%
100%
- 2,000 4,000 6,000 8,000 10,000 12,000 14,000 16,000Lamp operating hours
Lam
p Su
rviv
al (%
)
AB9_5min on 20min off
BB7_5min on 20min off
CB1_5min on 20min off
AB9_1hr on 20min off
BB7_1hr on 20min off
CB1_1hr on 20min off
AB9_3hr on 20min off
BB7_3hr on 20min off
CB1_3hr on 20min off
Continuous_all
Figure 12. Re-plot of Instant start fluorescent lamp life at different operating cycles
Instant-start Fluorescent Lamp Life vs. Dimming Current
0%
50%
100%
0 500 1000 1500 2000 2500
Lamp Operating Hours
Lam
p Su
rviv
al(%
)
20mA24mA30mA41mA49mA64mA121mA180mA

Reducing Barriers to Use of High efficiency Lighting Systems
74 of 107
REFERENCES ANSI C82.11 Consolidated-2002, ANSI standard for lamp ballast-High frequency fluorescent lamp
ballasts –supplements, American National Standard Lighting Group, NEMA Brown, S.C. Basic data of plasma physics (Cambridge, MA: M.I.T. Press, 1959)
Hammer, E.E. “Comparative starting operating characteristics of typical F40 systems.” Journal of the Illuminating Engineering Society 18, no. 1 (1989): 63-69.
Hammer, E.E. “Cathode fall voltage relationship with fluorescent lamps.” Journal of the Illuminating Engineering Society 24, no. 1 (1995): 116-122.
Hilscher, A. “Determination of the cathode fall voltage in fluorescent lamps by measurement of the operating voltage.” Journal of Physics D: Applied Physics 35, (2002): 1707-1715.
Lowry, E.F. “Thermionic Cathodes for Fluorescent Lamps and Their Behavior.” Illuminating Engineering 46 (1951): 288-294.
Misono, K. “Cathode fall voltage of low-current fluorescent lamps.” Journal of the Illuminating Engineering Society 20, no. 2 (1991): 108-115.
Lighting Research Center “Integrated skylight luminaire.” Field Test Delta 1, no. 1 (to be published).
Davis, RG., Ji, Y. “Fluorescent lamp-ballast systems.” ESEERCO Final Report 94-40, part 1, 1998. Troy NY, Lighting Research Center.
Soules, T.F., Ingold, J.H., Bhattacharya, A.K., Springer, R.H. “Thermal model of the fluorescent lamp electrode.” Journal of the Illuminating Engineering Society 18, no. 2 (1989): 81-92.
Stuart, R.V., Wehner, G.K. “Sputtering at Very Low Bombarding Energies.” Journal of Applied Physics 33, no. 7 (1962): 2345-2352.
Tetri, E., “Daylight linked dimming: effect on fluorescent lamp performance.” Lighting Research and Technology 34, no.1 (2000): 3-10.
US Census Bureau, “Fluorescent lamp ballasts: 2001.” Current Industrial Reports MQ335C (01)-5, (July 2001).
Watanabe, Y., Murayama, S. “Cathode fall characteristics of fluorescent lamps under high-frequency operation.” Japanese Journal of Applied Physics 32, Pt. 1, no. 8 (1993)
Watanabe, Y. “Dependency of cathode temperature on operation frequencies in fluorescent lamps.” Journal of the Illuminating Engineering Society 24, no. 1 (1995): 48-57.
Waymouth, J.F. Electric discharge lamps (Cambridge, MA and London, England: M.I.T. Press, 1971).

Reducing Barriers to Use of High efficiency Lighting Systems
75 of 107
APPENDIX 4.3 A: MARKET ANALYSIS FOR LOAD-SHEDDING BALLASTS
Introduction Market penetration for a load-shedding ballast and its associated communication link is a function of the incremental cost of the ballast/communication link and the potential customer savings on their electric bills from participation in load management programs or reducing monthly demand. Some portions of the country (mainly the northeast and west coast) also offer the customer a payment (conservation rebate) for installing load-shedding devices. Table 1 presents an analysis of possible customer savings from seven utilities for instituting load shedding.
This analysis examines these conservation rebates but does not use them in determining the maximum incremental cost of a load-shed ballast in the marketplace. The offering and amount of conservation rebates changes frequently and should not be relied upon in determining market penetration. Load management programs are in their infancy. Their use and value to customers are expected to grow over the next five years as the deregulated electricity market matures and stabilizes.
Bottom line - If a load shed ballast and its associated communication link can be sold to the customer for an incremental cost of $9 or less over an instant-start ballast (the most common ballast used today), the market for this ballast would be approximately 10% of all ballasts sold into the new construction/remodeling market.
Customer Savings/Payments There are three possible revenue streams from which the customer can receive a savings or payments for reducing their peak electric demand. These payments come from the utility or state agency that offers conservation rebates or from the utility or transmission system operator for participation in load management programs. Customer savings are from reducing demand and thereby reducing the monthly electric bill.
Conservation Rebate Programs There are some locations within the U.S. where customers are offered rebates if they install load-shedding equipment. Most of these rebates can be found in the northeast or west coast. The rebates vary widely and are subject to change or program cancellation/suspension annually. Current rebates range from approximately $5 to $40 per ballast in those locations where they are offered.
Because of the transitory nature of conservation programs and rebates, it is recommended that these incentives to customers not be included in determining market penetration of load-shed ballasts. Where the rebates are available, they will assist in the early years of adoption of the technology and, therefore, increase sales projections.

Reducing Barriers to Use of High efficiency Lighting Systems
76 of 107
Load Management Programs Load management programs exist either through a utility’s load curtailment rates or through the transmission system operator payment to the customer for shedding load. However, not all utilities or transmission operators have these kinds of rates or programs in place today.
Assuming a 20% to 30% reduction in wattage for each light fixture equipped with a load-shed ballast, the customer can expect to receive between $0.30 and $1.50 per year per ballast in payments for reducing their lighting load. It is expected the value for load shedding will rise in future years by as much as 50% as the deregulated electric marketplace begins to place stronger values on load management.
Demand Reduction Savings A customer who can control his/her monthly peak demand will garner savings through reduced electric bills. Assuming a 20% to 30% reduction in wattage for each light fixture equipped with a load-shed ballast, the customer can expect to save, with today’s electric rates, between $1.03 and $8.03 per year per ballast installed. The amount depends on the electric utility’s demand charge and how many months the customer is willing to control his or her demand. For example, Consolidated Edison of New York’s demand charges are much higher than those found at Public Service Electric and Gas in New Jersey.
A customer participating in a load management program cannot double count the demand reduction for that program with savings on their electric bill associated with controlling monthly peak demand. Therefore, the customer’s benefits for reducing demand is either the amount available from a load management program OR from reduced electric bills. In most cases, the greater savings today comes from controlling the monthly peak demand and obtaining a savings on the monthly electric bill. This savings averages about $3.20 per year per ballast.
Ballast and Communication Link Costs It is assumed a customer would be willing to accept a three year payback on the investment of a load-shed ballast. The customer savings associated with a demand reduction of 20% to 30% of the light fixture wattage is approximately $9 based on the net present value of an annual saving stream of $3.20 and a 6% discount rate. Therefore, the ballast and its communication link must cost the customer (not manufacturing cost) no more than $9 over what he/she would have paid for a ballast without the load shedding capability. For the new construction/remodeling market, the $9 is incremental to the price of a standard ballast. For the retrofit market, the customer would only be willing to pay a total ballast cost of approximately $12, $9 for the load shedding and a $3 premium to obtain a new ballast.
Market Analysis Based on the above information, the new construction/remodeling market across the country would be the primary market for the load-shed ballast. Currently, such a ballast would have to
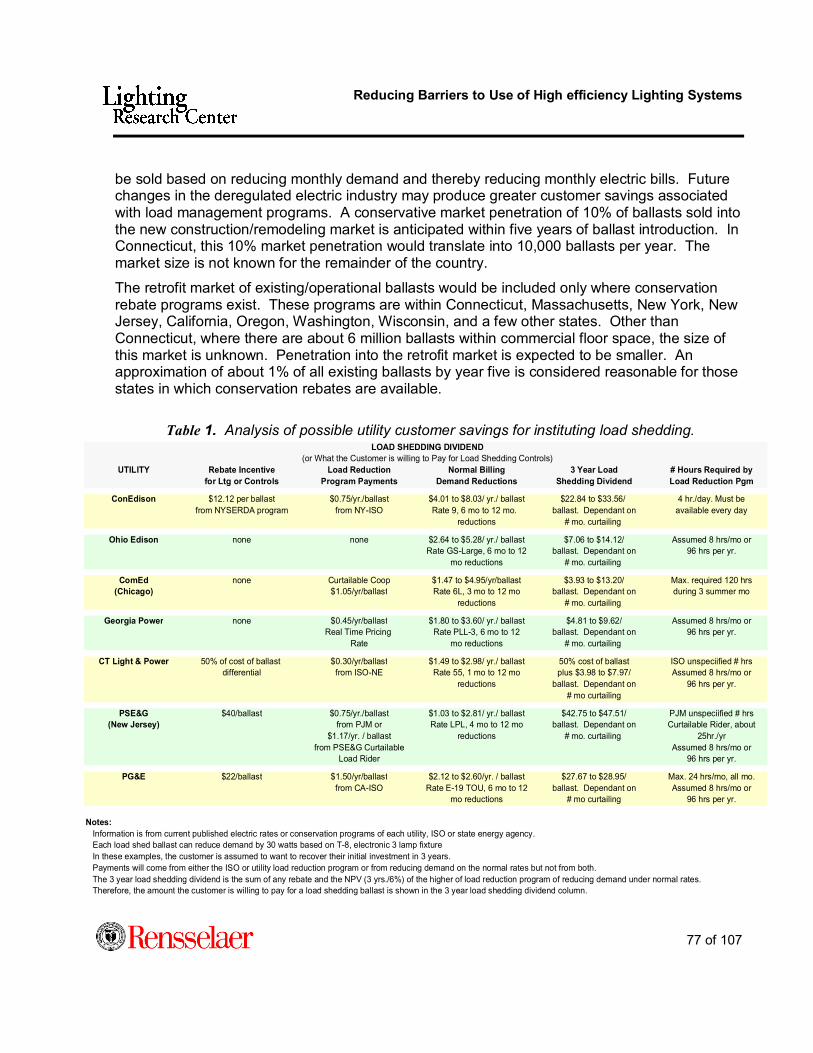
Reducing Barriers to Use of High efficiency Lighting Systems
77 of 107
UTILITY Rebate Incentive Load Reduction Normal Billing 3 Year Load # Hours Required byfor Ltg or Controls Program Payments Demand Reductions Shedding Dividend Load Reduction Pgm
ConEdison $12.12 per ballast $0.75/yr./ballast $4.01 to $8.03/ yr./ ballast $22.84 to $33.56/ 4 hr./day. Must befrom NYSERDA program from NY-ISO Rate 9, 6 mo to 12 mo. ballast. Dependant on available every day
reductions # mo. curtailing
Ohio Edison none none $2.64 to $5.28/ yr./ ballast $7.06 to $14.12/ Assumed 8 hrs/mo orRate GS-Large, 6 mo to 12 ballast. Dependant on 96 hrs per yr.
mo reductions # mo. curtailing
ComEd none Curtailable Coop $1.47 to $4.95/yr/ballast $3.93 to $13.20/ Max. required 120 hrs(Chicago) $1.05/yr/ballast Rate 6L, 3 mo to 12 mo ballast. Dependant on during 3 summer mo
reductions # mo. curtailing
Georgia Power none $0.45/yr/ballast $1.80 to $3.60/ yr./ ballast $4.81 to $9.62/ Assumed 8 hrs/mo orReal Time Pricing Rate PLL-3, 6 mo to 12 ballast. Dependant on 96 hrs per yr.
Rate mo reductions # mo. curtailing
CT Light & Power 50% of cost of ballast $0.30/yr/ballast $1.49 to $2.98/ yr./ ballast 50% cost of ballast ISO unspeciified # hrsdifferential from ISO-NE Rate 55, 1 mo to 12 mo plus $3.98 to $7.97/ Assumed 8 hrs/mo or
reductions ballast. Dependant on 96 hrs per yr.# mo curtailing
PSE&G $40/ballast $0.75/yr./ballast $1.03 to $2.81/ yr./ ballast $42.75 to $47.51/ PJM unspeciified # hrs(New Jersey) from PJM or Rate LPL, 4 mo to 12 mo ballast. Dependant on Curtailable Rider, about
$1.17/yr. / ballast reductions # mo. curtailing 25hr./yrfrom PSE&G Curtailable Assumed 8 hrs/mo or
Load Rider 96 hrs per yr.
PG&E $22/ballast $1.50/yr/ballast $2.12 to $2.60/yr. / ballast $27.67 to $28.95/ Max. 24 hrs/mo, all mo.from CA-ISO Rate E-19 TOU, 6 mo to 12 ballast. Dependant on Assumed 8 hrs/mo or
mo reductions # mo curtailing 96 hrs per yr.
Notes: Information is from current published electric rates or conservation programs of each utility, ISO or state energy agency. Each load shed ballast can reduce demand by 30 watts based on T-8, electronic 3 lamp fixture In these examples, the customer is assumed to want to recover their initial investment in 3 years. Payments will come from either the ISO or utility load reduction program or from reducing demand on the normal rates but not from both. The 3 year load shedding dividend is the sum of any rebate and the NPV (3 yrs./6%) of the higher of load reduction program of reducing demand under normal rates. Therefore, the amount the customer is willing to pay for a load shedding ballast is shown in the 3 year load shedding dividend column.
LOAD SHEDDING DIVIDEND(or What the Customer is willing to Pay for Load Shedding Controls)
be sold based on reducing monthly demand and thereby reducing monthly electric bills. Future changes in the deregulated electric industry may produce greater customer savings associated with load management programs. A conservative market penetration of 10% of ballasts sold into the new construction/remodeling market is anticipated within five years of ballast introduction. In Connecticut, this 10% market penetration would translate into 10,000 ballasts per year. The market size is not known for the remainder of the country.
The retrofit market of existing/operational ballasts would be included only where conservation rebate programs exist. These programs are within Connecticut, Massachusetts, New York, New Jersey, California, Oregon, Washington, Wisconsin, and a few other states. Other than Connecticut, where there are about 6 million ballasts within commercial floor space, the size of this market is unknown. Penetration into the retrofit market is expected to be smaller. An approximation of about 1% of all existing ballasts by year five is considered reasonable for those states in which conservation rebates are available.
Table 1. Analysis of possible utility customer savings for instituting load shedding.
Reducing Barriers to Use of High efficiency Lighting Systems
78 of 107
APPENDIX 4.4 A: LOAD-SHED BALLAST SPECIFICATION Revised Draft Performance Specification - Loadshed Ballasts
Operational definition of loadshed What: A ballast specification for reducing power demand by dimming fluorescent
lighting (T-8 lamps) from a centralized point of control.
Why: To manage load on the electrical grid. Used by electricity suppliers/grid
operators as a substitute for power generating resources in times of critical peak system demand, and for managing demand at any time for more efficient system operation and risk avoidance.
How: Dimming and/or switching T-8 fluorescent lamps to reduce luminaire power input by 33% or 50%, and aggregating those loads via a building-wide signaling system. There are two scenarios for control of dimming:
Scenario 1. Dimming is controlled by the electricity supplier/grid operator via remote signaling and distributed automatically to the luminaires (i.e., ballasts). Dimming times and payments are determined through negotiated contracts between the utility/grid operator and electricity customers. Payments to customers are based on minimizing the customer’s electric demand while reducing operating risk for utility/grid operator.
Scenario 2. Dimming is controlled by the building owner/manager and used as a load management resource to limit peak electrical demand, resulting in lower electrical demand charges. An automated system that tracks electrical demand and initiates load shedding is envisioned.
When: As needed up to a maximum of 100 hours per year of lamp operating time.
Where: The technology is applicable to all C/I applications except where light-
dependent critical tasks or processes are conducted (e.g., hospital operating rooms)

Reducing Barriers to Use of High efficiency Lighting Systems
79 of 107
Loadshed Ballast Specifications
Non-loadshed condition The loadshed ballast, operating under non-loadshed conditions, shall perform equally well, in terms of energy efficiency and reliability, as the popular instant-start ballasts that now dominate the fluorescent lighting market. A loadshed ballast must meet or exceed most existing ballast performance specifications so that it can be installed everywhere where traditional ballasts are installed.
Ballast type Any (e.g., instant start, programmed start)
Ballast factor 0.88 (nominally 180 mA high frequency operation)
Power factor: > 0.9
THD: < 20% (ANSI definition)
Ballast efficiency factor: 2-Lamp > 1.48
3-Lamp > 1.00
Loadshed condition Input power Reduce operating power by 33% or 50%
Ballast efficiency factor 2-Lamp > 1.35
3-Lamp > 0.92
THD: < 32% relative to the fundamental (60 Hz) input current.
Loadshed Signal The signal to loadshed originates at the electricity supplier/grid operator, or within the building depending on the control scenario. Signals originating outside the building are distributed to building by various established means (e.g., internet, telephone modem), which are not covered in this specification. Once inside the building, the signal is distributed to a network of Ballast
Matching that of standard
Maintain efficiency when dimmed comparable to standard dimming ballasts

Reducing Barriers to Use of High efficiency Lighting Systems
80 of 107
Control Modules, that in turn, distribute the signal to individual ballasts. The ballast contains circuitry to decode the signal from the Ballast Control Module and to dim or switch the lamps upon command.
Ballast Control Module Inputs at least 1 (receiving load shed signal from primary control
center within building)
Outputs PLC signal covering at least 10,000 sq. ft. of building space
Refresh rate of signal to ballasts at least once every 10 minutes (perhaps continuous signal during load shedding)
Default state signal non-loadshed (full light output)
The method of distribution of the loadshed signal inside a building to the Ballast Control Modules is yet to be determined, but it seems probable that an existing building automation protocol using twisted pair wiring could be used.
Ballast characteristics Starting of lamps Lamps always start at full power levels
Response time < 1 minute after receiving signal (Dim/switch and restore)
The physical nature of the PLC signal and encoding scheme are yet to be determined. A PLC signaling scheme from the Ballast Control Module to the individual ballasts seems most promising based on current knowledge. An example of the signaling scheme might be frequency shift keying (FSK) at 42 and 52 kHz, encoding an alternating sequence of ones and zeros for either analog or digital decoding circuitry.

Reducing Barriers to Use of High efficiency Lighting Systems
81 of 107
Task 4.6 Develop recommendations for improved components and systems as evaluated in Task 2, based on defined performance characteristics, and defined acquisition, installation and commissioning costs Summary of recommendations: In the course of Task 2 of this project, three technologies were identified as having the potential to achieve greater market share, if certain barriers could be overcome. These technologies were the prototyped load-shed ballast, occupancy sensors, and an innovative easily-commissioned photosensor. To maximize their market potential, these technologies must all demonstrate their cost-effectiveness, their practicality in real installations, and their suitability to the market. Based on subsequent development of these technologies and analysis of the market, we recommend the following courses of action:
Load-shed ballasts:
• Perform large scale field trials of load-shed ballasts. These trials should aim to verify the acceptability of illuminance reductions to occupants, both when the reasons for load shedding have been explained to occupants, and when they have not. The process of informing occupants of the environmental and cost benefits of load shedding is referred to as “biasing”.
• Test the electromagnetic compatibility (EMC) of load-shed ballasts in their two normal operating states (i.e., full on and dimmed), and when switching between states.
• Work with one or more ballast manufacturers to produce a commercially viable load-shed ballast based on electronic instant-start technology. To be financially attractive to customers, the price of this ballast should be no more than $9 more than a regular instant-start ballast.
• Test the prototype ballast as part of the LRC’s National Lighting Product Information Program (NLPIP), and make the result of the testing available on the NLPIP website.
• Work with one or more ballast manufacturers to develop a suitable method to carry signals from a central controller within the building, to the individual ballasts. (“stage 2” signaling). This signal should not cause disruption (e.g., flicker) to the other lighting in the building.
• Ensure that the signals sent out by electricity suppliers are suitable to be received by lighting load-shed controllers (“stage 1” signaling). Both the format and the medium for these signals should be considered in detail.

Reducing Barriers to Use of High efficiency Lighting Systems
82 of 107
• Develop a performance specification for load-shed ballasts that can be easily followed by commercial ballast manufacturers, yet ensures minimum performance standards.
• Leverage current and future market forces to create demand for load-shed ballasts. This can be achieved by promoting the electricity cost savings achieved using load-shed ballasts, and by promoting load-shed ballasts as an environmentally friendly and therefore desirable feature of a building, especially new-builds. This may take place through published articles, seminars, demonstration projects and voluntary accreditation schemes.
Occupancy sensors:
• Publicize the aggregate figures for energy savings compiled as part of Task 4. Everyone in the building industry should be aware of typical figures for energy saving achievable by the use of occupancy sensors.
• Work with control system manufacturers to produce a commissioning standard for occupancy sensors. If all sensors can be commissioned using the same procedure, the likelihood of installers making mistakes on site will be much reduced, and these mistakes account for a lot of the failings of systems in situ.
Easily-commissioned photosensor:
• Continue to use existing market channels, such as the LRC’s NLPIP program and outreach education, to support the use of photosensing in those applications for which it is commercially viable. This is usually only in owner-occupied buildings with large window area and high occupation density.

Reducing Barriers to Use of High efficiency Lighting Systems
83 of 107
Introduction
Some technologies aimed at reducing lighting energy consumption and cost are already well accepted and reliably implemented by the building community, while others are constrained by real or perceived barriers to more widespread use, such as complexity, reliability or cost.
Examples of the former include “architectural” dimming, occupancy sensing in new-builds, programmed-start ballasts, time-switching, and energy efficient lamps and luminaires. Examples of the latter include photosensing, occupancy sensing in retrofits, and load management systems. The LRC is primarily interested in determining which of these latter technologies may be able to graduate into the mainstream, with the help of technological improvements, human factors research, and market transformation efforts.
We are particularly interested in the comparatively neglected potential of innovative, low-cost, simple systems which may reach a wide market. Load-shed ballasts are a good example of a technology with low cost and potentially high benefit for consumers, electricity suppliers, and the country as a whole. The LRC’s intention is to prepare the way for fast and sustainable market uptake of lighting load shedding systems, by ensuring that they are easy to specify and install, and that the cost-benefits calculations are highly persuasive - especially in an economic climate where companies have little spare cash for non-core investments.
This report deals mainly with load shedding systems. It is important to note that load-shed ballasts and other lighting control systems (such as occupancy sensing) are not mutually exclusive; either or both may be used in a space. Therefore a concentration on load-shedding is complementary to the LRC and DOE’s existing commitments to promote other energy-saving strategies. Furthermore, most US office space is deep-plan therefore not amenable to daylight savings, and occupancy systems may not be appropriate in every space. Load shedding is therefore a complementary technology that may be added to other energy and cost-saving strategies.
This report goes on to deal with ways of expanding the market for occupancy sensors, and the market potential of a design for a new type of easily-commissioned photosensor, which may be much easier to design, install and commission than existing types.
Lighting opportunities in the deregulated power market
At times of peak load, the cost of providing every additional watt of power can be as much as $1. This imposes a high cost on the nation, and should provide a high incentive for consumers to reduce load at peak times, but current electricity pricing structures prevent these costs being visible to consumers, so it is often not financially beneficial for building operators to install power-reducing systems. Forthcoming changes to the structure of electricity pricing, however, are likely to create a market for shedding load.

Reducing Barriers to Use of High efficiency Lighting Systems
84 of 107
The Federal Energy Regulatory Commission (FERC) has proposed the following policy; “Power markets should accommodate price-responsive load and demand resales, through market rules that give willing [wholesale] customers and their suppliers reasonable opportunity to adjust consumption in response to market conditions…FERC should promote transmission rate designs that reveal the cost of congestion across different times and locations”4
The cost of providing additional power to a consumer at a given location and time is known as the “locational marginal price” (LMP), and is usually measured in dollars per megawatt. LMP comprises the cost of generation, and the cost of transmission (including the fact that power may have to be transported to allow for regional disparities in capacity and consumption).
If consumers were charged the LMP for any extra capacity they required, many of them would ensure that their load was minimized at times of peak demand (and hence peak LMP). This would require an accurate and verifiable record to be kept of their electrical load hour-by-hour or minute-by-minute. Although verifiable timed metering is now comparatively cheap (typically less than $200 to install), consumers have been reluctant to be charged the LMP for their additional power due to the possibility that it might increase their electricity bills and/or cause them to have to change their hours of work.
In the last two to three years, however, some regional transmission organizations (RTOs) have piloted “economic load response” schemes for large consumers (typically those whose peak demand exceeds 1MW). Some of these schemes have gone on to allow consumers to bid in advance (typically one day in advance) for load reductions, thus creating a true market for power, with consumers able to engage in bilateral trading of available capacity. It is anticipated that participation in load response schemes will rapidly be extended to more and smaller consumers as hourly metering and data logging becomes less expensive.
In addition to these economic load response schemes, some RTOs have piloted emergency load shedding schemes5. These schemes are doubly useful in that they not only reduce generation costs, but also ensure adequate power quality and reliability, which are as important to RTOs as cost. The key difference is that, in the economic schemes, consumers have the prerogative to buy or sell capacity or capacity options at their own discretion, whereas in the emergency load shedding schemes, consumers must shed capacity when instructed to do so by the RTO. Although a consumer may take part in both schemes, each separate load must be registered in either one scheme or the other - not both - because for the purposes of emergency load-shed, the RTO must be able to predict in advance the magnitude of the drop in demand.
Another key difference between economic and emergency load response schemes is that it may only be large consumers that find it worthwhile to participate in economic load response
4 Federal Energy Regulatory Council (FERC). 4 January 2002. Demand-side resources and regional power markets: a roadmap for FERC (draft 2A). Accessed on 13 December 2002 at http://www.ferc.gov/electric/rto/mrkt-strct-comments/02-05-02/FERC-load-response-road-map-02-05-02.pdf 5 Such as PJM, a regional transmission operator (www.pjm.com)

Reducing Barriers to Use of High efficiency Lighting Systems
85 of 107
schemes, because of the overhead costs of personnel and of installing hourly metering in their premises. Emergency load shedding schemes, by contrast, because they are administered by the RTO instead of by the consumer, require little overhead cost and so comparatively small consumers may find it worthwhile to participate.
Small consumers are pivotal to the success of lighting load shedding because there are effectively no large lighting consumers; even a large office building with 1000 occupants will have the potential to shed no more than 50kW – much smaller than the current minimum increment of 100kW commonly used in current economic load response pilots. Therefore emergency load shedding schemes are more likely to be attractive to those seeking to save lighting electricity costs.
Load-shed ballasts
Background: Who benefits from load shedding? Load shedding is not primarily a way of reducing energy consumption; rather it is a way of reducing the cost of providing power at times of peak electrical demand. Load shedding is only envisaged as occurring a few times per year, and only for brief periods (<100 hours/year), so the number of kWh of electricity which can potentially be saved is small. Consequently, the environmental benefit is marginal, although it should be remembered that peak-demand electricity is particularly “dirty” to produce, because older, smaller, and therefore less efficient power stations are used to produce it, and that load shedding at peak times may obviate the need to build new power stations.
Load shedding also helps to relieve transmission congestion, and the need to transport electrical power from one region to another; hence it reduces the inefficiencies associated with the transmission of power, and the need for extra capacity to cover contingencies such as the loss of transmission lines.
The direct beneficiaries of these cost savings would be electricity suppliers, although adjustments to the pricing structure of electricity should ensure that the cost savings are eventually passed on to consumers.
So load shedding would produce cost savings for the economy, and benefits for the environment. Lighting is an important part of any load-shedding strategy because it accounts for around 25% of national electricity consumption. To ensure that individual consumers find it profitable to include their lighting load in economic or emergency load response programs, the lighting industry (in the form of lamp and ballast manufacturers, and the LRC) should become involved in the discussions of pricing structure currently underway within the electricity industry.
Human factors implications

Reducing Barriers to Use of High efficiency Lighting Systems
86 of 107
Load shedding using bi-level switching ballasts creates a comparatively fast reduction in workplace illuminance for occupants, taking place over only a few seconds, and lasting for around four hours. It is essential to determine whether these reductions are either noticeable or acceptable to occupants, before investing in the development of load shedding technology.
Experiments were conducted at the LRC to determine what magnitude of illuminance reduction is acceptable to office workers. The reductions took place over a period of around three seconds. The results showed that the degree to which subjects found illuminance reductions acceptable was affected by whether the reason for the reduction was explained beforehand. The reasons consisted of the potential for energy cost saving, and the environmental benefits. Subjects who had previously had the reasons explained to them were known as “biased” subjects. All of the “unbiased” subjects found a reduction in illuminance of 20% acceptable, and 80% of them found a reduction of 50% acceptable. All of the “biased” subjects found a reduction of 50% acceptable, and 80% of them found a reduction of 75% acceptable.
On the basis of this research, and previous research, the LRC has recommended6 that the development of load-shed ballasts should standardize on illuminance reductions of 33% and/or 50%, since these figures correspond to the switching off of one lamp in a three-lamp luminaire, or two lamps in a four-lamp (or one in a two-lamp) luminaire. These figures could be used as a basis for initial trials.
Field trials in real buildings would be required to verify the findings of the research already undertaken, and to ensure that “real world” factors such as the presence to daylight (perhaps as a brightness referent) do not result in lower acceptability ratings in practice. As stated in Appendix 4.2 – A of the Task 4 report (p.39), “to maximize demand savings, education of the public or affected persons, should be a priority”.
Power quality implications Sudden changes in electricity consumption, especially for inductive or capacitive loads, can cause harmonic distortions in the line voltage (electromagnetic interference), which can adversely affect other electronic equipment. The sudden reduction in electricity consumption caused by load shedding may produce effects of this kind. Further research should be carried out to ensure that harmonics do not adversely affect either the building’s switchgear, or other connected loads. Routemap for developing ballast technology The discussion above suggests that developing a load-shed ballast is both desirable and possible, though it must meet strict performance and cost targets.
6 Lighting Research Center (LRC). November 2002. Reducing Barriers to Use of High Efficiency Lighting Systems, Task 4.2: Investigate ideal lamp light output dimming ratio required for different types of applications. Troy, NY. Report submitted to US Department of Energy.

Reducing Barriers to Use of High efficiency Lighting Systems
87 of 107
The LRC’s investigations into the effect of dimming on fluorescent lamp life7, and the constraints of cost (see below), suggest that electronic instant-start may be the preferred technology base for load-shed ballasts. Instant start is substantially less expensive than other technologies (rapid-start, programmed-start), and does not appear to result in shorter lamp life under standard test conditions of 3 hours on, 20 minutes off.
Operating instant start ballasts at a reduced ballast factor (i.e., dimmed), reduces lamp life marginally; in tests conducted at the LRC, dimming to 67% for 100 hours per year shortened life by less than 20%8. These tests suggested that most fluorescent lamps can be operated without significantly reduced lamp life or efficiency, over a wide range of outputs, both below and above their rated output. The energy consumption of a ballast is described by its “ballast factor”, where 1.0 means that the ballast is running at its rated output. Many lamps operate without detrimental effect on their life, at ballast factors between 0.7 to 1.3.
A further persuasive reason to build load-shed ballasts on an electronic instant-start platform is that instant-start currently constitutes the largest segment of the ballast market, and is therefore most likely to receive quick acceptance by consumers.
Field trials in real buildings will require prototype ballasts to be developed, leading to a commercially viable mass-produced version, which should be tested under the National Lighting Product Information Program (NLPIP). The LRC will need to work closely with one or more ballast manufacturers in order to achieve this.
The report of Task 4.3 of this project projected that;
“If a load-shed ballast and its associated communication link can be sold…for an incremental cost of $9 over an instant-start ballast…the market for this ballast would be approximately 10% of all ballasts sold in the new-construction / remodeling market.”9
Routemap for developing communication protocol(s) Experience from other lighting control technologies clearly shows that the communication protocol is a determining factor in the success or failure of a technology. A protocol must be immune to interference, must allow easy installation and reconfiguration, and compatible components must be widely available from a variety of competing suppliers. It must also be possible to add new components on to an existing system, so the protocol must be backwards-compatible. This means that it is crucial to get the protocol right in the prototype stage, and avoid subsequent changes.
7 Lighting Research Center (LRC). November 2002. Reducing Barriers to Use of High Efficiency Lighting Systems, Task 4.3-4.5: Investigation of the Effects of Dimming on Fluorescent Lamps. Troy, NY: Lighting Research Center. Report submitted to US Department of Energy. 8 Ibid. 9 Ibid, p.75

Reducing Barriers to Use of High efficiency Lighting Systems
88 of 107
Two distinct communication signals are required within a load shedding system. Firstly the signal from the electricity supplier or RTO to the building’s load-shed coupler (stage 1), and secondly the signal from the load-shed coupler to the individual ballasts (stage 2).
Some utility companies and RTOs have already developed stage 1 systems for sending out real-time price information to consumers via the utility’s website, or via email10. Such a system could also send out instructions to shed load. For ease of commissioning, it may be preferable to use a standalone system such as cellphone short message service (SMS) to receive stage 1 signals, instead of attempting to link the load-shed coupler to the internet via a company’s local area network. Stage 1 signalling should present no technical problems, and the nature of the signal will mainly be determined by the requirements of the electricity supplier or RTO – the LRC need not be overly concerned with stage 1 signals.
For maximum market penetration, stage 2 signals between the coupler and the load-shed ballasts should not require any additional wiring, and should require an absolute minimum of additional hardware, in order to minimize cost. The additional design effort required by electrical engineers and architects should also be minimal, in order not to create reluctance among specifiers toward the provision of load shedding ballasts. For these reasons, development will focus on the use of the building’s electrical power network to carry signals to the load-shed ballasts; it would also be possible to implement the signal using wireless technology, but this remains expensive. The LRC recommends that stage 2 rather than stage 1 signaling be the main focus of load-shed signaling development.
In a small number of buildings, there is already a whole-building lighting control system, connected to dimming ballasts via a protocol such as LONworks, BACnet or DALI. These systems (especially DALI) may become more commonly used in the medium term, but it is worthwhile to check whether load shedding could be implemented in such a system using conventional dimming ballasts instead of instant-start load-shed ballasts. In this case, the lighting control system would simply instruct all ballasts to dim down so that their electricity consumption falls to 66% or 50% of maximum (their light output would be a slightly lower percentage of its maximum), so the end result would be the same as in a building equipped with load-shed ballasts.
Should specifications be developed for ballast and communication technology? Some kind of minimal specification for load-shed ballasts is required, for two reasons: Firstly, if incentives or rebates are used to make load shedding attractive, then some minimum performance specification will be required in order to allow ballasts or luminaires to be classified as qualifying for the incentive; secondly, if ballasts from different manufacturers are used in the same building, they must dim down to approximately the same level in order to preserve
10 Independent System Operator New England (ISO-NE). 2002. ISO-NE Load Response Program Manual. This system sends information about forthcoming changes in the price of electricity, on an hour-by-hour basis. Load shedding would require minute-to-minute information.

Reducing Barriers to Use of High efficiency Lighting Systems
89 of 107
illuminance and luminance uniformity. The LRC currently recommends either 66% or 50% as the target light output level. However, a performance specification should be based around electricity consumption rather than light output, so that energy suppliers obtain a guaranteed reduction in load. The specification could simply require the ballast to reduce its electricity consumption to a certain target value within a narrow margin of error, while also achieving a target value for light output, with a slightly boarder margin of error.
Stage 1 signals are likely to be technologically easy to implement; and to that extent there is little need to worry about achieving a workable solution. Nevertheless, these signals warrant attention because it would be desirable for utility companies and RTOs to use the same medium and the same format for the load-shed instructions or real-time price information they send out to consumers. This would make it much cheaper and easier to implement lighting load shedding nationwide, rather than state-by-state or even provider-by-provider. This will require co-operation between a core of committed utility companies and RTOs at an early stage; the LRC and DOE are well placed to facilitate this process.
Stage 2 signals must be robust, should not cause lamps to flicker, and must not interfere with other building systems. During the early stages of development it may be sufficient to engineer solutions on the fly using a loose specification, but at some stage it will become necessary to develop a formal standard for the stage 2 protocol and signals, in order to ensure interchangeability between components from different suppliers. Developing a standard is a time-consuming process and all parties should be cognizant of the potential for this to delay the market penetration of load-shed ballasts. Field trials A prototype load-shed ballast has already been developed by the LRC and OSRAM Sylvania (OSI) for Connecticut Light and Power, based on a programmed-start ballast. Programmed-start ballasts maximize lamp life but may be too expensive to achieve the intended market share for load-shed. Development will therefore concentrate on cheaper technologies, but programmed-start remains an important complementary technology because it will allow load shedding systems to be installed alongside other control systems, such as photosensing.
The powerline signal used to control the existing prototype ballast is simple, requiring a significant change to the waveform for around two seconds; such a simple signal may however interfere with the operation of other connected loads, and might necessitate a completely separate circuit for load-shed ballasts – this would add highly undesirable costs.
For the forthcoming field trial, to be conducted in conjunction with the California Energy Commission, the envisioned prototype will be based on a cheaper instant-start ballast, and a more refined signal will be used. This prototype is likely to be trialed in the LRC’s own offices.
One or more large-scale trials will be required, to ensure that the technology achieves the predicted cost savings, that it can be implemented on a large scale, and that the occupants of a large office behave in the way suggested by the human factors experiments already conducted, i.e., that they find the same magnitude of illuminance reduction acceptable. Such a field trial

Reducing Barriers to Use of High efficiency Lighting Systems
90 of 107
would have to be conducted with the active involvement of the building owners and occupants, to ensure that the occupants are informed of the reasons for the illuminance reductions.
It may be beneficial to work closely with a ballast manufacturer to find a suitable large office building in which to hold trials. The manufacturer could alert the LRC to forthcoming suitable sites on their order books.
In parallel, it may be desirable to trial a load shedding system implemented using a whole-building lighting control system. This also would require the LRC to liaise with lighting controls manufacturers.
Market transformation
Market forces (rather than legislation, tax breaks or other incentives) are the preferred vehicle for transforming markets. Government agencies repeatedly express their preference for existing or nascent market forces, as the means of bringing about market change11. The US in particular has a “successful policy of market reliance.”12 Energy efficiency standards or rebates should be considered only if there is no means by which the technology can be made commercially viable. Also, technologies supported in significant part by legislation or government incentives remain commercially parlous because the structures which support them could be withdrawn or amended at any time.
One feature peculiar to the building industry is that the party buying or specifying the ballast is usually not the same party that will benefit from the electricity cost savings. This is especially true of buildings procured under design-and-build contracts, where no independent advocate for the client exists. This may present a hurdle to the use of market forces to expand demand for load-shed ballasts.
“Market forces” include:
• The electricity cost savings achieved by installing load-shed ballasts;
• The possibility of adding value to the building (in terms of resale or lease price or lettability) by installing a technology that is perceived as valuable either in its own right (such as air conditioning) or as part of a voluntary building accreditation program (such as Leadership in Energy and Environmental Design (LEED)).
In the short term, before electricity price restructuring takes effect, it may be possible to begin to create demand for load-shed ballasts by including them into existing voluntary accreditation programs. These programs give each building a score based on an evaluation of its “green” credentials, and so allow building owners to more effectively market the added value of the
11 Simons, J. 1992. Energy efficiency standard in a market economy – regulation vs competition? In Proceedings of the International Energy Agency conference on Use of Efficiency Standards in Energy Policy 42-51. Paris 1992. 12 Millhone, J. 1992. The Role of Efficiency Standards in the United States. In Proceedings of the International Energy Agency conference on Use of Efficiency Standards in Energy Policy 16-20. Paris 1992.

Reducing Barriers to Use of High efficiency Lighting Systems
91 of 107
energy-saving technology in which they have invested. So, tentatively, there are three stages in achieving widespread acceptance of load-shed ballasts by the building community:
1. Collect detailed data on the degree or type of price restructuring or incentive that utility companies, state energy agencies and RTOs offer consumers to install load-shed ballasts.
2. Communicate the financial and environmental benefits of load-shed ballasts to the building community; e.g., by reviewing successful projects in magazines and seminars.
3. Ensure that load-shed ballasts are mentioned in any future mandatory energy-saving legislation, best practice advice, and voluntary environmental accreditation programs.
The first of these stages is an ongoing activity of the LRC13. The second of these stages is referred to in the plan for the third year of the Reducing Barriers Project, although within that time frame there may not be any large completed projects. Continued funding will be required to ensure that successful installations are publicized.
The timescale for the third stage is somewhat determined by the slow natural frequency with which energy saving legislation and best practice advice are revised. Within this project, it may be possible to establish a precedent for incorporating14 load-shed ballasts into the LEED certification15 for commercial interiors, a document which is still in draft form.
LEED is a voluntary, consensus-based national standard for developing high-performance, sustainable buildings. Acquiring LEED certification for a building demonstrates to potential buyers or tenants that the building has low energy consumption, a high degree or airtightness, and certain environment-oriented facilities of benefit to staff (such as bike racks, showers). The LEED certification is similar to the BREEAM energy rating method developed for commercial premises in the United Kingdom in the mid-1990s. Experience from the BREEAM project suggests that voluntary accreditation can work effectively if the certification is seen to benefit the occupier, and is sufficiently onerous to garner support from environmental pressure groups. Uptake of the BREEAM rating on new-build offices in the UK reached and maintained a level of 25% of floorspace within three years of the scheme’s inception, and it remains a widely known and respected indicator of environmental and build quality.
Voluntary accreditation schemes are complementary to price restructuring approach, since price restructuring would affect mainly owner occupiers, while voluntary accreditation would affect mainly property developers and landlords.
13 Lighting Research Center (LRC). January 2002. Reducing Barriers to Use of High Efficiency Lighting Systems, Task 4.3 Appendix A: Market Analysis for Load Shedding Ballasts. Troy, NY: Lighting Research Center. Report submitted to US Department of Energy. 14 The US Green Buildling Council has indicated that load-shed ballasts could initially be eligible for an “innovation credit” within the LEED scheme, and could then be further considered for formal inclusion. 15 U.S. Green Buildings Council (USGBC). June 2002. Rating System for Commercial Interiors, Un-balloted Draft for Pilot Program. Accessed on 7 November 2002 at http://www.usgbc.org/docs/LEEDdocs/LEEDCIvPilot.pdf

Reducing Barriers to Use of High efficiency Lighting Systems
92 of 107
Development of the market for occupancy sensors
The technology of occupancy sensors is mature enough to allow accurate data on its energy-saving potential to be gathered. To expand the market, this dataset needs to be communicated to specifiers and end-users.
Figures compiled by the LRC from a wide variety of sources indicate that the potential energy savings achievable by occupancy sensing range from a mean of 25% for shared (e.g., open-plan) spaces, to 40% for privately “owned” spaces such as private or partitioned offices. These figures are for the energy saved in comparison with each area’s lighting energy consumption prior to the installation of the occupancy sensing system, relative to an eight to ten-hour working day. In relation to these substantial savings, the occupancy sensor market remains notably underdeveloped.
Widespread publication of these figures in industry magazines and via other communication channels, will bolster market demand for occupancy sensing systems.
A previous investigation16 conducted by the LRC indicated that the difficulty of commissioning occupancy-sensing systems was a significant barrier to their more widespread use. To overcome this barrier, a commissioning standard should be developed in co-operation with key controls manufacturers (already identified17). This standard would include requirements for at least the following; the process by which sensors are commissioned; their functionality; and their labeling. The importance of generating support for this standard among lighting controls manufacturers cannot be overstated.
Easily-commissioned photosensor
The LRC’s design for a more easily commissioned photosensor, while innovative and low in cost, still depends on the use of expensive dimming ballasts to adjust the output of the luminaire in response to daylight.
There are several reliability and efficiency issues which hamper the widespread acceptance of full-range continuous dimming ballasts. Firstly, many dimming ballasts have a low efficiency
16 Lighting Research Center (LRC). January 2002. Reducing Barriers to Use of High Efficiency Lighting Systems, Task 2.11: Interview key control manufacturers…. Troy, NY: Lighting Research Center. Report submitted to US Department of Energy. 17 Lighting Research Center (LRC). January 2002. Reducing Barriers to Use of High Efficiency Lighting Systems, Task 2.10: Interview contractors and installers to determine installation and commissioning issues…. Troy, NY: Lighting Research Center. Report submitted to US Department of Energy.

Reducing Barriers to Use of High efficiency Lighting Systems
93 of 107
when operated at full load, due to the constant heating of the electrodes. Secondly, some ballasts have an adverse effect on lamp life, because they do not constantly heat the electrodes. Thirdly, dimming ballasts remain expensive in comparison to non-dimming ballasts. Until the price of dimming ballasts falls to a level where paybacks are achievable over a commercially-viable timeframe, the use of daylight-linked systems will remain limited to a few building owners; those willing to commit to a long return on investment, and those who require dimming ballasts anyway, for reasons other than energy saving. Codes and/or legislation requiring the use of daylight-linked systems could only be justified once the performance and price issues surrounding dimming ballasts have been resolved.
Meanwhile, it remains worthwhile to promote the value of daylighting (high internal daylight levels make photosensing more economic), and to ensure that photosensing is given appropriate credit in voluntary accreditation schemes such as LEED, and in lighting energy legislation. Moreover, photosensors should be considered as part of a daylight system of windows, light fixtures and controls. As such, the incremental cost of photosensors is small.
The LRC is inherently supportive of photosensing, because daylight-linked controls can contribute to integrated architectural lighting design. Daylight-linked controls give the designer the ability to control the balance between natural and electric light in a space, in order to maximize the visibility of daylight, or to minimize the contrast imbalances created by it.
Research suggests that the most effective way of reducing lighting energy use is to ensure that occupants do not turn the lights on in the first instance18, and these enhanced savings will only be consistently achieved with the advent of a much more subtle and research-based approach to lighting design and daylighting than commonly exists at present.
18 Lighting Research Center (LRC). 1998. A field study of lighting controls. Troy, NY: Lighting Research Center.

Reducing Barriers to Use of High efficiency Lighting Systems
94 of 107
TASK 4.7
PROVIDE TECHNICAL FOUNDATION FOR MARKET TRANSFORMATION GROUPS TO INCREASE PENETRATION OF AUTOMATIC SHUTOFF CONTROLS
Background Automatic shutoff lighting controls consist of two main technologies: occupancy sensors and timeclock devices. Occupancy sensors are designed to monitor small areas but can be linked together19 to control the lights in a large area. Due to their intrinsically small area of influence, occupancy sensors are valuable for controlling small spaces (private offices, restrooms) or for spaces that tend to be used periodically (storage closets, warehouse aisles). Manual controls or time clocks may be a more cost-effective automatic shutoff technology for large spaces (open plan offices) or spaces where the pattern of use is very regimented (classrooms, state offices),.
In remodeling or retrofit applications, timeclocks are usually impractical due to the need to provide extensive rewiring and/or local override switches. In these cases, occupancy sensors remain a viable option for reducing wasted lighting energy use.
Advice from Steering Committee members in December 2001 indicated that the market for occupancy sensors in new construction is successfully transformed in states with progressive energy codes such as California. However, feedback from the subsequent industry roundtable in February 2002 indicated that energy codes in much of the nation lag behind those of the western states, such that new construction is still an important area for consideration of automatic shutoff controls.
The roundtable group indicated that market transformation groups lack credible support to predict how much energy occupancy sensors will save. Market transformation experts suggested the need for a review of available literature about the effectiveness of occupancy sensors. They saw less need for a similar review of literature regarding time clock effectiveness. Based on this advice, the LRC focused on identifying expected savings percentages from occupancy sensors.
19 One occupancy sensor controls a much smaller area than a standard electrical branch circuit. When multiple occupancy sensors must be connected to control a larger circuit, timeclocks may be more cost-effective than tens of occupancy sensors.

Reducing Barriers to Use of High efficiency Lighting Systems
95 of 107
Proposed Estimate of Energy Savings The LRC consulted its extensive resource collection to compile a group of 26 case studies and claims by manufacturers regarding the effectiveness of occupancy sensor technologies. We organized the data in different ways in the various studies, often by specific room type (restrooms, hallways, coffee break rooms, conference rooms). We reviewed the literature and organized studies into broader occupancy categories based upon private (“owned”) vs. shared and scheduled vs. sporadic:
� Private (“Owned”) Spaces (such as single-person offices or spaces in which the user takes “ownership”)
� Shared Spaces, Scheduled use (such as classrooms)
� Shared Spaces, Sporadically used (such as public spaces, open-plan offices, corridors, bathrooms, storage rooms)
Private (“Owned”), scheduled occupancy was not a legitimate category.
For private offices, all data were averaged leading to an average savings of 31.7%. This average represents a wide range of hours of use, so we also examined the percentage of energy savings in those studies that were based upon documented “core hours” between 7.5 to 10 hours per day. This analysis yielded a lower average energy savings of 26%, as expected because the former analysis was dominated by studies using longer hours of use as a base line. This latter percentage (26%) is perhaps a better estimate of potential energy savings from occupancy sensors because, for buildings showing wasted energy use outside the core hours, other technologies such as time clocks are usually more cost effective than occupancy sensors. We recommend 25% as the best estimate of energy savings for private offices with sporadic use.
For shared spaces that are only used sporadically, the average savings was 40.8%. Again, there was a wide range of hours of use, but it seems inappropriate to base energy savings on “core hours” (7.5 to 10 hours per day) because hallways, stairs, etc. can be used at any time day or night. Therefore, we recommend 40% energy savings as the best estimate for shared, sporadically occupied spaces. Note, however, that some spaces should be illuminated without occupancy if lighting is used to signal potential occupants that a business is open or if the lights being on provides occupants with a sense of security or safety.
For shared, scheduled spaces, in particular classrooms, it is often difficult to ascertain the hours of use. Classrooms are used not only for teaching during the day, but also for community activities during the night. Often more than one teacher uses the space but does not “own” the classroom. Since these spaces are sporadically used and do not have a clear “owner,” occupancy sensors are a good choice for reducing wasted lighting energy. The average energy savings was 31.7%. We recommend 30% energy savings as the best of estimate for shared, scheduled, spaces. Note, however, that one study of teacher “owned” classrooms reviewed for this task showed that more energy waste due to the time delays on the occupancy sensors.

Reducing Barriers to Use of High efficiency Lighting Systems
96 of 107
Consequently, the specifier must have a clear understanding of classroom use before applying occupancy sensors to reduce wasted energy.
Table 1 - Recommended values for the three types of spaces.
Private ("Owned") SharedSporadically Use: 25 40Scheduled Use: 30
Percent Savings from Occupancy Sensors(Mean Values)

Reducing Barriers to Use of High efficiency Lighting Systems
97 of 107
Table 2 - High, low and mean percent of energy savings for shared spaces, sporadically used based on literature review
Source # High Low Mean(1) 75 20 48.2(2) 35 35 35.0(3) 90 20 49.0(4) 70 15 45.0(7) 55 13 35.6(9) 36 36 36.0
(10) 55 55 55.0(10) 45 45 45.0(10) 17 17 17.0(11) 50 50 50.0(11) 41 33 37.0(14) 14.4 8.6 9.9(15) 75 25 42.4(17) 48 11 24.3(19) 42 28 35.0(20) 38 36 37.0(42) 26 26 26.0(42) 30 30 30.0(42) 55 55 55.0(43) 60 30 46.0(44) 90 48 66.0(45) 90 30 53.3(46) 90 40 60.1
mean 40.8
Percent Energy Savings
Shared, Sporadically Use

Reducing Barriers to Use of High efficiency Lighting Systems
98 of 107
Table 3 - High, low and mean percent of energy savings for private (“owned”), sporadically use spaces based on literature review
Private ("Owned"), Sporadically Use
Source # High Low Mean
(1) 50 25 37.5(2) 45 45 45.0(3) 50 13 31.5(4) 31 30 30.5(5) 19 7 12.0(6) 26 20 23.0(7) 22 20 21.0
(10) 27 27 27.0(12) 20 14 16.8(13) 43 43 43.0(16) 45 45 45.0(17) 23 9 16.0(19) 26 26 26.0(43) 30 30 30.0(44) 45 45 45.0(45) 55 40 47.5(46) 55 25 40.0
Mean 31.6
Percent Energy Savings
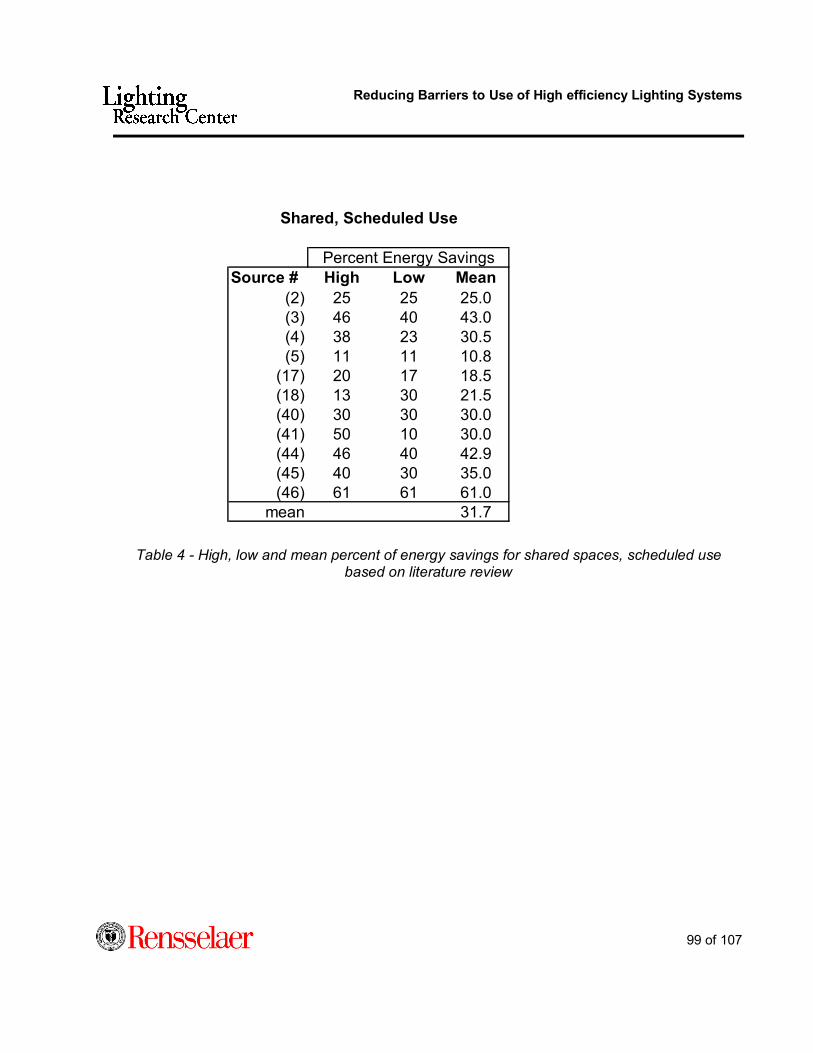
Reducing Barriers to Use of High efficiency Lighting Systems
99 of 107
Table 4 - High, low and mean percent of energy savings for shared spaces, scheduled use based on literature review
Source # High Low Mean(2) 25 25 25.0(3) 46 40 43.0(4) 38 23 30.5(5) 11 11 10.8
(17) 20 17 18.5(18) 13 30 21.5(40) 30 30 30.0(41) 50 10 30.0(44) 46 40 42.9(45) 40 30 35.0(46) 61 61 61.0
mean 31.7
Percent Energy Savings
Shared, Scheduled Use

Reducing Barriers to Use of High efficiency Lighting Systems
100 of 107
Table 5 – Sources used to calculate proposed estimate of energy savings
Sources:1 Advance Lighting Guidelines, California Energy Commission 19932 Advance Lighting Guidelines, California Energy Commission 2001
3 E Source Tech Update TU-93-8 Occupancy Sensors: Promises and Pitfalls 1999
4 EPRI "Occupancy Sensors: Positive On/off lighting control" 1992 RPT00374
5 Floyd, David B; Parker, Danny S.; Sherwin, John R.; "Measured Field Performance and Energy Savings of Occupancy Sensors: Three Case Studies" FL Energy Ctr on-line publication
6 Jennings et al "Comparison of Control Options in an advanced Ltg Controls Testbed" Proceedings IES 1999 (SF Federal Bldg)
7 Richman et al "Field Analysis of Occupancy Sensor Operation: Parameters Affecting Lighting Energy Savings" JIES96
8 Energy User News, Ambion building article, "Occupancy Sensor Retrofit to Earn 1-yr Payback" Sept 97
9 Nilsson, Erik Adelaide Lunch room"Energy-Efficient Ltg in Commercial Bldgs" CADDET 201517 (1985 case study)
10 Bohrer, James "Case Study on Occupant Sensors as an Office Lighting Control Strategy" Seattle City Light '92 RPT00315
11 Johnson, Karl F. "Keys to Successful Lighting Control Applications" New York, Illuminating Engineering Society of North America. 8-5-1996. Ref Type: Conference Proceeding1996 pp800-811
12 Pigg, Scott; Eilers, Mark; Reed, John; "Behavioral Aspects of Lighting andOccupancy Sensors in Private Offices: A Case Study of a University Office Building" ACEEE 1996
13 Maniccia,D., Rutledge,B., Rea,M.S., and Morrow,W. "Occupant use of manual lighting controls in private offices." Journal of the Illuminating Engineering Society 28, no. 2 (1999): 42-56.
14 Jennings, Judith; Colak, Nesrin; Rubinstein, Francis; "Occupancy and Time-based Lighting Controls in Open Offices" Journal IES, Summer 2002
15 Kaiser/EPRI92 (See Reference #4)16 Chevron/EPRI92 (See Reference #4)17 VonNeida, Bill; Maniccia, Dorene; Tweed, Allan; "An Analysis of the
Energy and Cost Savings of Occupancy Snesors for Commercial Lighting Systems" 100764
18 Maniccia,D. "NLPIP Specifier reports: Occupancy sensors". 20. 1992. Troy, NY, Rensselaer Polytechnic Institute. Specifier Reports.
19 Figueiro,M.G., Rea,M.S., Rea,A.C., and Stevens,R.G. "Daylight and productivity - A field study". 2002. Washington, DC, American Council for an Energy-Efficient Economy. 2002.
20 Rea,M.S. and Jaekel,R.R. "Monitoring occupancy and light operation." Lighting Research & Technology 19, no. 2 (1987): 45-49.Manufacturer Claims
40 Sensorswitch. Middlesx Community College case study41 Wattstopper general claims42 Wattstopper Case studies43 Mytech general claims44 Novitas Case studies45 Novitas General claims46 Leviton general claims

Reducing Barriers to Use of High efficiency Lighting Systems
101 of 107
TASK 4.8
PROVIDE TECHNICAL FOUNDATION ON BEHALF OF MANUFACTURERS TO OVERCOME NAGGING INSTALLATION BARRIERS IN EXISTING BUILDINGS
Practices for Installing Occupancy Sensors A roundtable conducted in February 2002 brought together manufacturers, market transformation groups, specifiers, government agencies, and utilities to discuss barriers to widespread penetration of automatic shut-off lighting controls. One of the recommendations from this group was to encourage, aggressively, the widespread deployment of automatic shut-off lighting controls in new and existing C/I buildings.
In addition to the roundtable, LRC staff participated in a field visit to witness occupancy sensor installations at a company in New Jersey. Professional installers conducted the installation and participating staff learned a number of lessons during the visit. A site visit report is attached in Appendix 4.8 - A.
Automatic shut-off controls turn off lamps when a signal is received from an occupancy sensor, a building automation system (BAS), or a timer located locally or remotely in a lighting circuit panel box. The main goal of automatic shut-off controls is to turn off the lights when no one is occupying the space. Based on recommendations from the roundtable, this task focused on best practices for installing occupancy sensors to help increase the penetration of these controls into C/I applications.
Automatic shut-off controls have a high penetration on new construction as a result of energy-code provisions, ease of installation, and potential energy savings. Penetration of automatic shut-off controls in existing buildings is poor, however, with the “hassle factor,” (aggravation) perceived or real, seen as the greatest barrier to acceptance. The hassle factor associated with automatic shut-off, particularly with occupancy sensors, may be a result of poor sensor positioning in the space, the wrong choice of sensor for the application, poor product labeling, lack of commissioning settings on sensors, or complexity and uniqueness of installation.
As an attempt to help overcome this specific barrier, the LRC, following the recommendations from the roundtable, developed the following best practice document for installing occupancy sensors. We performed this task as an attempt to fill gaps and/or simplify information currently available in the manufacturers’ literature. Recommendations that will help address nagging installation barriers of occupancy sensors are given to manufacturers and installers. Although just a starting point, this can be a useful tool and can help reduce the real and perceived “hassle factor” associated with installing, commissioning, and using occupancy sensors.
1. Best Practices for Manufacturers
Reducing Barriers to Use of High efficiency Lighting Systems
102 of 107
In order to minimize installation and commissioning time and hassle, manufacturers should:
• Supply circuit schematics or documentation explaining inputs and outputs to the sensors and power packs.
• Use the same wire color scheme across manufacturers. This will facilitate the installation of sensors and power packs or any other components that are not from the same manufacturer.
• Supply documentation on how to override the system after the power packs are installed. In general, power packs are installed before the sensor and installers do not have enough information about how to override the system after the sensor is installed.
• Develop a diagnostic interface that can be plugged in each power pack and sensor to speed up commissioning and diagnosing problems.
• Include zero-delay setting to the sensor to allow faster commissioning.
• Set up a 24-hour hotline customer service to allow nightshift installers to have customer support at night.
2. Best Practices for Installers In order to properly install and commission occupancy sensors, the installers should:
• Never disable manual controls when installing occupancy sensors; existent light switch should be supplemented, not replaced, by the occupancy sensor.
• Provide a sufficient number of sensors, placed appropriately, in open plan offices. Saving money by reducing the number of occupancy sensors used in open plan area may result in poor performance and thus, dissatisfaction and rejection.
• Place occupancy sensors in areas where small movements are made (e.g., near desks, over bathroom stalls).
• Put two sensors in hallways, one at each end, pointing toward the center of the controlled area to provide good coverage and avoid false triggering.
• Use BX cable instead of conduits to ease the wiring process.
• While commissioning and re-commissioning, increase the time delay, if sensor sensitivity is turned down, to allow the lights to be on longer without movement.
In addition to the tips above, the LRC developed a prototype “laminated sheet” that can be used on site by installers. This prototype “laminated sheet” will help installers select the best occupancy sensor for the application and shows examples of installations in typical applications (Please refer to PDF file “Best Practices – Task 4.8” provided with this report).

Reducing Barriers to Use of High efficiency Lighting Systems
103 of 107
APPENDIX 4.8 – A
REDUCING BARRIERS TO THE USE OF LIGHTING CONTROLS Problems encountered during installation and commissioning of sensors
AUTHOR: Andrew Bierman
AUDIENCE: DOE program administrators
REPORT SECTION: Best Practices for Installing Occupancy Sensors
Background Andrew Bierman, a researcher at the Lighting Research Center in Troy, NY, traveled to Titusville, New Jersey to witness occupancy sensor installations at the a company’s headquarters. The work was conducted the night of June 27, 2002 from 5:00pm until 2:30am. The following are his observations, problems encountered, and recommendations for improving efforts to reduce barriers to the use of lighting controls.
Customer familiar with sensors The contractor had installed ultrasonic occupancy sensors throughout most of the building’s private offices and some of the open plan offices approximately four years earlier. Now, the customer wanted more occupancy sensors installed in the remaining open plan offices and hallways, and photosensors installed in the throughways between buildings and daylit reception areas. The contractor explained that this particular job of installing sensors would be more time consuming than typical installations because the easy application areas for occupancy sensors had already been exploited, and what remained were the more challenging locations.
Training customer’s maintenance staff before installation On the day of the installation, the installer met with the customer and some of the maintenance staff to present a basic training session about operating the new sensors. The installer appeared to have a good relationship with the customer, but a lack of communication appeared to exist between the customers’ management and maintenance staff. During a question and answer session, the customer discovered that maintenance personnel had removed a number of the existing occupancy sensors because they had encountered problems. Management, not informed about the removals until the training session, had assumed that all of the sensors were being utilized. Also, during the training session, the customer’s staff displayed a distrust of and

Reducing Barriers to Use of High efficiency Lighting Systems
104 of 107
annoyance with the sensor products. The information most sought by the maintenance staff was how to override, or disable the device when it fails or causes complaints.
Installation time difficult to estimate The time required to install occupancy and photosensors is difficult to estimate and prone to take longer than expected because of the complexity and uniqueness of each installation. Finding and tracing circuits takes time, and the installers report that “as-built” drawings are rarely accurate. For most products installing the sensor part of the control is only half the job. Connecting to the lighting circuit that the sensor will control is the other half and it is not trivial. As an example, a photosensor was installed the previous night with the low voltage signal wiring run back to the electrical panel box. The installer had about two additional hours of work consisting of drilling into the main panel box and add an auxiliary box for the necessary power packs that supply electricity to the sensors and contain the switching relays, adding new wires that must be connected to the appropriate circuit breakers and the new power packs, connecting the low voltage wires to the power pack relays and securing all wires and components. This work is time consuming partly because each panel box is somewhat unique in its size, shape, wiring and location making custom fittings necessary.
Problems encountered In this installation, the contractors had to break circuits and put in special wiring and relay controls on panel boxes to control atrium area lights. One technician installed only two sensors during the evening…but neither worked when finished. He did not know for sure what the problem was and decided to return during the day to commissioned the sensors. In another example, three technicians worked four hours to install two occupancy sensors in a hallway, plus get an open-plan office area wired with relay power packs so that occupancy sensors could be installed the following night.
When wiring the hallway, the installers tried to use sensors manufactured by one manufacturer and power packs (with relays) manufactured by another manufacturer. Neither manufacturer supplied circuit schematics or documentation explaining the inputs and outputs to the sensors and power packs, and each used different wire colors. This resulted in trial-and-error installation and troubleshooting, which was very time consuming. Even more time would have been used if the installers had to turn off the electricity each time they tried a different wiring combination as the instructions suggest. After several failed attempts, the installers replaced the power packs with Novitas equipment and the sensors worked. Although I was not present when these particular sensors were commissioned, I did witness the technicians commissioning other sensors and this too is a trial-and-error technique, which obviously was expedited by the installers’ experience using this particular product. Had an inexperienced technician installed the sensors, commissioning would have been much more difficult.

Reducing Barriers to Use of High efficiency Lighting Systems
105 of 107
Lighting controls are often installed in two stages; first the power packs and relays are installed, then the sensors are added. Installers rely on overriding the system after the power packs and relays are installed so the lights will work while awaiting installation of sensors. However, the installers often don’t know how to override because they don’t have sufficient documentation by manufacturer. The installers guessed at which connections would turn the lights on with no sensor attached, unaware of any damage that may be incurred by shorting different wires together in a trial-and-error approach.
When walking around the installation site (11:00pm), some private office lights were on with no one present. The technicians checked and found many of the previously installed sensors’ sensitivity adjustments were turned all the way up, perhaps by facilities technicians who were trying to avoid complaints. Oversensitive sensors tend to keep the lights on all the time. The technicians also pointed out that some of the installations of wall mounted occupancy sensors in the private offices were not the ideal location for such a sensor because of obstructions such as file cabinets and book cases. In these cases a ceiling mounted sensors would probably have worked better, but would have been about twice as expensive to install.
The installers offered an important tip: Never disable manual controls when installing automatic shut-off controls. If a hallway, for example, already has a light switch, add the automatic control in series with the existing switch. In this way, the automatic control supplements the light switch rather than replacing it. The light switch does not override the sensor. Rather, the light switch and the sensor work in combination, either one able to switch the lights.
Commissioning The commissioning procedure used by the installers for the occupancy sensors is as follows:
1. Turn time delay to minimum and put sensitivity dial in middle position (the dial has no other indication).
2. Walk through the area monitored by the sensors. If the light does not turn on, increase the sensitivity.
3. Wait for light to turn off (after minimum time delay) and test again.
4. If the lights turn on, but then don’t turn off, turn down the sensitivity.
5. After the sensitivity is set correctly, set the desired time delay remembering that lower sensitivity can be somewhat compensated by increased time delay.
These repetitive tasks take time, as the installers must repeatedly wait for the lights to turn off before they can retest the sensitivity. The objective is to adjust the sensitivity so the lights turn on only when needed, but not when not needed. The installers commented that even for similar applications, similar settings do not guarantee similar performance because dial positions do not correspond to similar sensitivity settings from sensor to sensor.

Reducing Barriers to Use of High efficiency Lighting Systems
106 of 107
Lessons learned The following lessons learned were gleaned from observations of, and discussions with the installers, product information, manufacturers’ web sites and Training Videos provided by Sensor Switch, Inc.
1. Professional installers are needed to properly install and commission occupancy sensors.
2. Installer: “People should realize that sensors can not be placed just anywhere. Some areas are just not appropriate for sensors.”
3. Current commissioning procedures take too much time! The time delay features alone require waiting for the lights to turn off before the installers can retest the sensor for movement detection.
4. Blueprints cannot be trusted. Installers often find circuits are different than the drawings indicate so wire paths must always be verified.
5. Open plan areas with cubicles need sufficient numbers of sensors placed appropriately. Too few sensors are commonly used in an attempt reduce costs, resulting in lack of coverage and poor performance.
6. A lot of judgment goes into placement of sensors. Installers must assess each situation individually. The experience of a professional installer is very beneficial.
7. Installers should place occupancy sensors near areas where small movements are made…near desks, over bathroom stalls, etc., and not worry about sensors picking up large motions such as opening doors, people entering rooms, which sensors easily detect.
8. A trick used by installers in hallways is to put two sensors, one at each end, pointing toward the center of the controlled area. This provides good coverage in the hallway and minimizes the risk of the lights turning on when someone walks near, but not in, the hallway.
9. The type of wiring affects how easily circuits can be broken. Conduit requires more circuit tracing because of multiple wires within the conduit. BX cable, which is armored, is easier to use.
10. Modular wiring can be problematic. One problem is by cutting cable doesn’t provide enough slack, so they have to piece in new wiring. This requires junction boxes, extra cost, extra time, etc.
11. Since installation is often done at night, so as not to interfere with company’s business activities, installers don’t have manufacturer support available during installation.
12. Ceiling mounted sensors are nearly twice the cost of wall switch replacement sensors, because you have to install the sensor and the power pack, plus the extra wiring involved and more difficult access.
13. During commissioning or re-commissioning, when turning down sensor sensitivity, installers should increase the time delay to somewhat compensate for the reduced sensitivity to

Reducing Barriers to Use of High efficiency Lighting Systems
107 of 107
motion. Although a longer time delay is not a substitute for sensitivity, longer time delays allow the lights to stay on longer without demanding movement.
14. Device failures: Alan Rhode estimated product failure rates at less than two percent. Most failures are immediate and are dealt with during installation. Actual callbacks for failed devices are estimated by Alan Rhode to be less than ¼ of one percent.
Recommendations Based on Andrew Bierman’s observations and on knowledge gained at the Lighting Research Center, we recommend the following:
1. Manufacturers should include labeled circuit schematics on the devices or in the packaging identifying the signals, and/or function of all the electrical connections. Presently, manufacturers seem to keep information from contractors, perhaps to encourage them to purchase all components from same manufacturer, or from fear of confusing installers. The more information installers have, the better they can cope with all the different situations that arise in the field.
2. Industry should develop a diagnostic interface that installers/facility technicians can plug into each power pack or sensor to speed up commissioning and diagnosing problems. The currently practice of trial-and-error is much too time consuming and prone to non-optimal solutions.
3. All manufacturers should include a “zero delay” setting on the sensor to allow faster commissioning. This would allow the lights to turn off immediately so installers would not wait several seconds or minutes between each test.
Bottom line The lighting industry does not seem to have the financial resources, or the willingness to develop low cost, sophisticated sensor systems. If as much money were spent on lighting control systems as is spent on cell phone development, for example, barriers to controls use could be quickly and greatly reduced.
![[XLS] · Web view7788 149 2003 5675 150 2003 2210 151 2003 14342 152 2003 5 153 2003 29 154 2002 155 2002 156 2002 157 2002 158 2002 468 159 2002 2304 160 2002 569 161 2002 96 162](https://static.fdocuments.in/doc/165x107/5ad48db07f8b9a1a028c0511/xls-view7788-149-2003-5675-150-2003-2210-151-2003-14342-152-2003-5-153-2003-29.jpg)