By: Tara Henry San Saba High School Mrs. Colleen Womack San Saba County San Saba, Texas Rogan Field.
Final Report
Selenium in San Francisco BayConceptual Model/Impairment Assessment
Prepared by:
Khalil Abu-Saba, Ph.D. and Scott Ogle, Ph.D.Larry Walker Associates Pacific EcoRisk
Prepared for:
Clean Estuary Partnership
June 2005
Clean Estuary Partnership
Selenium in San Francisco Bay: Conceptual Model/Impairment Assessment – Final Report i
Executive SummaryBackground InformationSection 303(d) of the Clean Water Act requires states to identify water bodies not attaining waterquality standards (i.e., waters whose beneficial uses have been impaired), to identify thepollutant causing the impairment, and to develop total maximum daily loads (TMDLs) that willreduce and eventually eliminate the impairment and restore the beneficial use(s). In response toobservations of elevated concentrations of selenium in the tissues of diving ducks, the CADepartment of Health Services (DOHS) issued health advisories against the consumption of theducks; these advisories reflect an impairment of San Francisco Bay’s beneficial uses, and servedas the basis for the San Francisco Bay Regional Water Quality Control Board (Regional Board)to place 6 San Francisco Bay water bodies on the 303(d) list as being impaired due to seleniumin 1998:
1. Sacramento-San Joaquin Delta,2. Suisun Bay,3. Carquinez Strait,4. San Pablo Bay,5. Central San Francisco Bay,6. South San Francisco Bay.
More recently, the Bay Protection and Toxic Cleanup Program (BPTCP) identified 5 Bay waterbodies as Category IV sites (i.e., locations having elevated chemicals in sediments and adversebiological impact as indicated by either sediment toxicity or degradation of the benthiccommunity):
1. Castro Cove,2. Central Basin,3. San Leandro Bay,4. Oakland Inner Harbor (Pacific Drydock Yard 1),5. Oakland Inner Harbor (Oakland-Fruitvale).
If the observed sediment toxicity at these BPTCP sites is, in fact, due to selenium, then several ofthe Bay’s beneficial uses, in addition to the previously-mentioned commercial and sport fishing,would be impaired due to elevated selenium. As a result, the State Water resources ControlBoard (State Board) placed these sites on the 303(d) list in 2002.
A Conceptual Model for SeleniumThe conceptual model of the fate and effects of selenium in the San Francisco Estuary watershedintegrates information on the sources and loading of selenium to the Bay, the chemicalcharacteristics of selenium, and the linkages between these and the resultant cycling andbioaccumulation of selenium. Because selenium occurs in a wide variety of different chemicalforms, a normal discussion of “cycling” processes can rapidly become overly complex. As aresult, discussion of cycling processes in this report is limited to those involved in seleniumbioaccumulation.
Clean Estuary Partnership
Selenium in San Francisco Bay: Conceptual Model/Impairment Assessment – Final Report ii
Like mercury, selenium is a naturally-occurring trace element. And like mercury, many of theproblems that selenium can cause in aquatic ecosystems result from:
1. mobilization of selenium from terrestrial sources into surface waters,2. transformation of inorganic forms into organic forms, and3. bioaccumulation of these organic forms into higher trophic level organisms.
Selenium occurs in several different chemical forms or species: selenate (SeO4+2), the most stable form in most oxic waters, selenite (SeO3+2), often abundant due to slow conversion to selenate, selenite is rapidly
taken up by microbes and algae, and is readily biotransformed into organic forms, elemental selenium (Se0), least bioavailable of major selenium forms, but important due
to formation in sediments, inorganic selenide(s) (e.g., metal-Se-2), potential loss mechanism via precipitation with
metals, organoselenides (R-Se-2), occurs as wide variety of compounds, including
selenomethionine, one of the most bioavailable and toxic forms.
Sources and Loading - The three major sources of selenium to the Bay are:1. the Sacramento River,2. the San Joaquin River, which includes seleniferous agricultural drainwater,3. discharges from oil refineries,
all of which bring selenium into the northern reach of the Bay system. The southern reach of theBay does not have similar tributary or industrial discharge sources, and acts much more like atidal lagoon; POTWs are the major sources of selenium to South Bay.
The Sacramento River is the largest source of surface water runoff into San Francisco, and theconcentrations of total dissolved selenium in the Sacramento River water have remainedessentially unchanged over the past 20+ years.
The San Joaquin River concentrations of total dissolved selenium in the San Joaquin River aremuch higher than in the Sacramento River. As state-mandated increases in the flow of SanJoaquin River water to the Delta and Bay come into play, the contribution of the San JoaquinRiver to northern San Francisco Bay can be expected to increase.
Studies in the 1980’s had identified oil refinery discharges as being a major source of seleniteto the Bay. Since that time, the refineries have achieved an average 66% reduction in totaldissolved selenium discharge, and a remarkable 92% average reduction in the selenite beingreleased. Selenite concentrations, particularly in the Suisun Bay-Carquinez Strait-San Pablo Bayregion, have decreased by 82%, roughly the same decrease as that in the refinery effluents.
Sources of Suspended Particulate Selenium - The primary source for selenium bioaccumulationat the lower trophic levels is ingestion of particulate materials (i.e., microbes, algae, detritus, aswell as abiotic particulate materials). Studies have indicated that particulate selenium consists ofresuspended Bay and Delta sediment and cellular (microbial and algal) organoselenides, and it

Clean Estuary Partnership
Selenium in San Francisco Bay: Conceptual Model/Impairment Assessment – Final Report iii
was concluded that particulate selenium is a function of phytoplankton productivity and riverineinputs of sediment.
Selenium Cycling and Bioaccumulation - While dissolved selenium species can causedirect toxicity to aquatic organisms, the lethal threshold concentrations (i.e., LC50 values) aretypically much, much higher than the waterborne concentrations seen in all but the mostcontaminated of ecosystems. This is one reason why water quality criteria are typically manyorders of magnitude higher than the concentrations measured in the San Francisco Estuary’sambient waters.
However, the reproductive and other health impairments that can result from bioaccumulation ofselenium up through the food chain can be a toxicity issue of ‘real world’ concern, as evident bythe DOHS health advisories and the observation of waterfowl and fish reproductive problems atKesterson and elsewhere.
The Bioaccumulation and Biotransformation of Dissolved Selenium - Microbes and algaecomprise the “base” of the food chain, and perform the most critical selenium biotransformationstep: the reduction of selenite and selenate and incorporation of the reduced selenides intoseleno-amino acids, particularly selenomethionine, an analog to the essential amino acidmethionine (due to its chemical similarity, the selenium is ‘mistakenly’ used in place of sulfur inthe synthesis of this compound); selenomethionine is believed to be the major cause of much ofthe observed reproductive problems in fish and waterfowl.
Studies have indicated that selenite uptake by marine bacteria and algae is rapid, and thatselenite is rapidly biotransformed into seleno-amino acids and proteins, whereas the uptake andbiotransformation of selenate is much more limited, indicating significant differences in thecycling, fate, and effects of selenite vs. selenate.
Studies have also indicated that selenium concentrations in algae did not increase proportionatelyto 30-fold increases in ambient selenite from 0.15 to 4.5 nM, suggesting that the algal tissueconcentrations of selenium in San Francisco Bay may have been relatively unaffected by therecent reductions in the Bay’s ambient water selenium concentrations.
The Bioaccumulation of Selenium by Invertebrates - It has long been recognized thatassimilation of ingested selenium (i.e., from the diet) is the primary mechanism forbioaccumulation of selenium by invertebrates. Studies with zooplankton have indicated that theassimilation of selenium from algal diets are very high, although the zooplankton do notaccumulate selenium to concentrations much higher than present in their microbial/algal diet.Recent studies of selenium in San Francisco Bay zooplankton reported that the zooplanktontissue concentrations were generally similar to those found in other “uncontaminated“ systems,although the observation of markedly higher concentrations in the Fall of 1999 that coincidedwith a peak concentration in particulate selenium suggests that zooplankton in the Bay may besubject to occasional increases in selenium content.
Unlike zooplankton, bivalves have been observed to accumulate ingested selenium toconcentrations markedly higher than in their particulate diet, in part due to their high assimilation

Clean Estuary Partnership
Selenium in San Francisco Bay: Conceptual Model/Impairment Assessment – Final Report iv
rates of the selenium, but also to their relatively low excretion rates. This difference is mostdramatic in the Asian clam Potamocorbula amurensis, an exotic species that invaded SanFrancisco Bay in the mid 1980’s and has since become the dominant benthic organism in muchof the Bay; P. amurensis accumulates selenium to much higher concentrations (e.g., 6-20 µg/g,dry wt) than either zooplankton or other bivalves.
Selenium Bioaccumulation by Fish and Waterfowl - Given that Potamocorbula amurensistissue selenium concentrations can be so elevated, it is not surprising that the higher trophic levelorganisms that eat these bivalves will, in turn, exhibit elevated tissue selenium concentrations. Infact, the elevated selenium concentrations in the Greater Scaup and Surf Scoter that triggered theinitial health advisories which led to the current 303(d) listing almost certainly reflect the factthat clams are important food items for these diving ducks. Similarly, P. amurensis is a dominantfood item for white sturgeon and mature Sacramento splittail, which are the Bay fish speciesexhibiting the highest tissue selenium concentrations.
In contrast, fish that feed primarily upon the planktonic food chain (i.e., such as juvenile stripedbass feeding on zooplankton and other water column organisms) do not exhibit similarlyelevated tissue selenium concentrations.
What is Driving Selenium Bioaccumulation in San Francisco Bay?Interestingly, while the concentrations of total dissolved selenium, and more importantly, ofselenite, declined dramatically in the late 1990’s, there have been no reported correspondingreductions in the reported P. amurensis tissue concentrations. This is likely due to the fact that itis the ingestion and assimilation of particulate selenium that drives bioaccumulation by P.amurensis, and in similar contrast with the declining selenium concentrations in the Bay’s water,there has been no decline in the selenium concentrations of the suspended particulate material.
Given the magnitude of the decline in dissolved selenium between and 1997-1999, it seems asthough there should be some measurable change in particulate selenium … however, none wasobserved. This, of course. raises the question:
“Why hasn’t the selenium concentration of suspended particulates (and thecorresponding selenium concentration in the bivalve P. amurensis) declinedin response to the declines in dissolved selenium in the Bay?”
Upstream riverine and Delta sediments and Delta primary productivity are major sources of thesuspended particulate selenium. Delta sediment selenium concentrations are actually higher thanthose in the northern reach of the Bay, and the selenium concentrations are generally constantwith depth. This suggests that the reservoir of upstream sediments provides a steady supply ofparticulate material (suspended and bedded) to the northern reach of San Francisco Bay withconsistent concentrations of selenium that will be independent of the Bay’s dissolved seleniumconcentrations, and therefore, unaffected by the reductions in selenium that were affected by theoil refineries.
The absence of any reduction in particulate selenium might also be explained by the seleniumuptake of the phytoplankton component. Algal uptake studies have indicated that the algal
Clean Estuary Partnership
Selenium in San Francisco Bay: Conceptual Model/Impairment Assessment – Final Report v
selenium concentrations did not increase proportionately to varying selenite concentrations overa 30-fold range that encompasses the concentrations found in the Bay. This suggests that algalselenium bioaccumulation is not proportional the Bay’s dissolved selenium concentrations (at therange of concentrations that have been observed in the Bay), and therefore, may be relativelyunaffected by the reductions in selenium that were affected by the oil refineries.
Impairment Assessment: Current Conditions
Compliance with Water Quality Objectives - Examination of the waterborne seleniumconcentrations reported by the Regional Monitoring Program (RMP) reveals that there have beenno exceedances of the U.S. EPA and the California Toxics Rule criteria; indeed, the ambientconcentrations of selenium in the Bay’s waters are typically orders of magnitude below thecriteria levels.
Compliance with Sediment Quality Objectives - There are no existing sedimentcriteria for selenium. US Fish & Wildlife Service selenium experts have established 4 µg/g, drywt, as the maximum allowable selenium concentration in their guidance for TMDLs. Thesediment selenium data reported by the RMP indicate that the sediment concentrations in the Bayare typically much lower than this guidance threshold.
Health Advisory Against Consumption of Resident Organisms - The CA DOHShas provided the following health advisory warning for inclusion in the CA Dept. of Fish &Game Waterfowl Hunting Guidelines:
Suisun Bay (Contra Costa and Solano Counties)San Pablo Bay (Contra Costa, Marin, Solano, Sonoma Counties)Because of elevated selenium levels, no one should eat more than 4 oz. per week of scaupmeat, or more than 4 oz. of scoter meat in any 2 week period. No one should eat livers ofduck from the area.
San Francisco Bay (Alameda, Contra Costa, Marin, San Francisco, San Mateo, SantaClara Counties)Because of elevated selenium levels, no one should eat more than 4 oz. per week ofGreater Scaup meat from the central bay, or more than 4 oz. of Greater Scaup meat fromthe South Bay in any 2-week period. No one should eat livers of duck from the area.
Bay Protection Toxic Cleanup Program Toxicity - Based upon the weight-of-evidence presented in this Impairment Assessment, it is concluded that selenium is not impairingthe BPTCP sites that were added to the 303(d) list in 2002.
Assessment of Impairment by Selenium - Any assessment of impairment of the Bay’swaters will by necessity be based upon a “weight of evidence” approach, with review andevaluation of all available relevant information. The Clean Estuary Partnership (CEP) hasproposed a set of potential conclusions and outcomes of impairment assessment that reflects the

Clean Estuary Partnership
Selenium in San Francisco Bay: Conceptual Model/Impairment Assessment – Final Report vi
State’s 303(d)-listing policy categorizations. Based upon this current review of availableinformation, it is this study’s conclusion that:
There is possible impairment of the Bay by selenium – The continued presence of ahealth advisory against the consumption of diving ducks in San Francisco Bay clearlymeets the State Board’s Category 4 classification that selenium does impair one ormore of the beneficial uses of San Francisco Bay. However, there are someuncertainties that must be addressed with additional studies. As a result, it must beconcluded that there is possible impairment of San Francisco Bay by selenium.
However, it is concluded that there is no impairment of the BPTCP sites byselenium, and de-listing of these sites is warranted.
Uncertainties and Data GapsAny objective analysis will always contain uncertainties. A summary of uncertainties is animportant component of the impairment assessment, as the uncertainties guide subsequentinvestigations. Uncertainties with the assessment of impairment by selenium identified anddiscussed in this report include:
Appropriate calculation of dietary exposures, Potential impairment of other ecological receptors, Compliance with proposed and/or planned water quality criteria, Future loadings of agricultural drainwater.
Where Do We Go From Here: Filling the Information GapsThis report concludes with identification of some potential future projects to obtain additionaldata and conduct more analysis of the sources, fate, transport, and effects of selenium. In otherdocuments or forums, the CEP will develop appropriate strategies for addressing selenium in theBay and its watersheds. These strategies may include:
• Data collection or analysis,• Implementation of corrective actions,• Formulating and refining management questions and setting priorities for the above 2
activities,• Determining an ongoing process for integrating all of the above.
There may be control measures, remediation, and regulatory actions that can and should beginnow, even with existing uncertainties. The CEP partners are committed to identifying theseactions. Future CEP data gathering and technical analysis should focus on determining thepotential effectiveness, and actual effects, of actions to reduce or eliminate impairment and torestore beneficial uses of the Bay.
Clean Estuary Partnership
Selenium in San Francisco Bay: Conceptual Model/Impairment Assessment – Final Report vii
Table of ContentsPage
1. Introduction ..........................................................................................................................12. Background Information: the 303(d) Listing.......................................................................3
2.1 San Francisco Bay.............................................................................................................32.1.1 The Impaired San Francisco Bay Segments and Water Bodies....................................3
2.2 Regulatory Background for the 303(d) Impairment Listing................................................62.3 Basis for the 303(d) Impairment Listing for Selenium .......................................................6
2.3.1 Elevated Levels of Selenium Observed in San Francisco Bay Diving Ducks...............62.3.2 The Initial Basis for Impairment: Health Advisories for Consumption of Waterfowl...72.3.3 The Initial 303(d) Impairment Listing.........................................................................7
2.3.3.1 Additional Impairment Considerations: Amending the 303(d) List ........................82.3.4 Consistency of the 303(d) Listing with Current State Policy .......................................9
3. A Conceptual Model for Selenium .....................................................................................113.1 Selenium: Background Information.................................................................................113.2 Sources and Loading .......................................................................................................14
3.2.1 Riverine Input of Dissolved Selenium to Northern San Francisco Bay ......................143.2.2 Mid-Estuarine Sources of Dissolved Selenium: the Oil Refineries ............................143.2.3 South Bay: The POTWs ...........................................................................................163.2.4 South Bay: The Alviso Slough Puzzle.......................................................................163.2.5 Sources of Suspended Particulate Selenium ..............................................................183.2.6 Sediment-Water Interchange of Selenium.................................................................193.2.7 Volatilization of Selenium From San Francisco Bay .................................................193.2.8 Estimation of Selenium Loading into San Francisco Bay ..........................................20
3.2.8.1 Riverine Fluxes via the Delta ..............................................................................203.2.8.2 Oil Refinery Effluent Discharges.........................................................................203.2.8.3 Municipal Wastewater, Local Tributaries, and Urban Runoff ..............................20
3.2.9 Initial Mass Inventory Calculations and Observations...............................................213.3 Selenium Cycling and Bioaccumulation ..........................................................................24
3.3.1 The Bioaccumulation and Biotransformation of Dissolved Selenium ........................243.3.1.1 Microbial Uptake and Transformation of Selenium .............................................263.3.1.2 Algal Uptake and Transformation of Selenium....................................................26
3.3.2 The Bioaccumulation of Selenium by Invertebrates ..................................................273.3.2.1 Selenium Bioaccumulation by Zooplankton ........................................................283.3.2.2 Selenium Bioaccumulation by Bivalves...............................................................283.3.2.3 The Role of Particulate Selenium in Bivalve Uptake ...........................................29
3.3.3 Selenium Bioaccumulation by Fish and Waterfowl...................................................314. Impairment Assessment: Current Conditions ...................................................................32
4.1 Compliance with Water/Sediment Quality Objectives .....................................................324.1.1 Compliance with Water Quality Objectives ..............................................................324.1.2 Compliance with Sediment Quality Objectives .........................................................32
4.2 Health Advisory Against Consumption of Bay Organisms ..............................................364.3 Bay Protection and Toxic Cleanup Program Sites............................................................36
4.3.1 Is Selenium Impairing the BPTCP Sites? ..................................................................38
Clean Estuary Partnership
Selenium in San Francisco Bay: Conceptual Model/Impairment Assessment – Final Report viii
4.4 Conclusion: Is Selenium Impairing San Francisco Bay? ..................................................385. Uncertainties and Data Gaps..............................................................................................40
5.1 Uncertainties Associated with the 1998 303(d) Listings...................................................405.1.1 Appropriate Calculation of Dietary Exposures ..........................................................40
5.2 Compliance with US EPA’s Draft Selenium Criteria .......................................................415.3 Other Potential Impairments............................................................................................41
5.3.1 Potential Impairment of Diving Duck Reproduction .................................................415.3.2 Potential Impairment to Clam-Eating Fishes .............................................................425.3.3 Use of Impairment or Risk Threshold Guideline Values ...........................................43
5.4 Future Loadings of Agricultural Drainwater ....................................................................466. Where Do We Go From Here: Filling the Information Gaps ...........................................48
6.1 Function of this report in the CEP work plan ...................................................................507. References Cited..................................................................................................................54
Appendices
Appendix A Timeline of events relevant to the Clean Estuary Partnership and importantselenium management issues in San Francisco Bay

Clean Estuary Partnership
Selenium in San Francisco Bay: Conceptual Model/Impairment Assessment – Final Report ix
List of FiguresPage
Figure 1. The San Francisco Estuary watershed, including the Sacramento River watershedand the San Joaquin River watershed in the Central Valley, and the San FranciscoBay watershed.............................................................................................................4
Figure 2. The San Francisco Bay system, including the Bay segments or water bodies thathave been placed on the 303(d) list for impairment by selenium..................................5
Figure 3. The Periodic Table of Elements.................................................................................. 11Figure 4. A conceptual model of the major sources of selenium into San Francisco Bay ........... 15Figure 5. Changes in the selenite levels in the Bay area refinery effluents “before” and
“after” refinery-implemented selenium control strategies, and the resultantchanges in northern San Francisco Bay ambient water selenite levels........................ 17
Figure 6: The California Toxics Rule water quality objective for protection against chronictoxicity for selenium (5 µg/L) is frequently exceeded at Alviso Slough. .................... 18
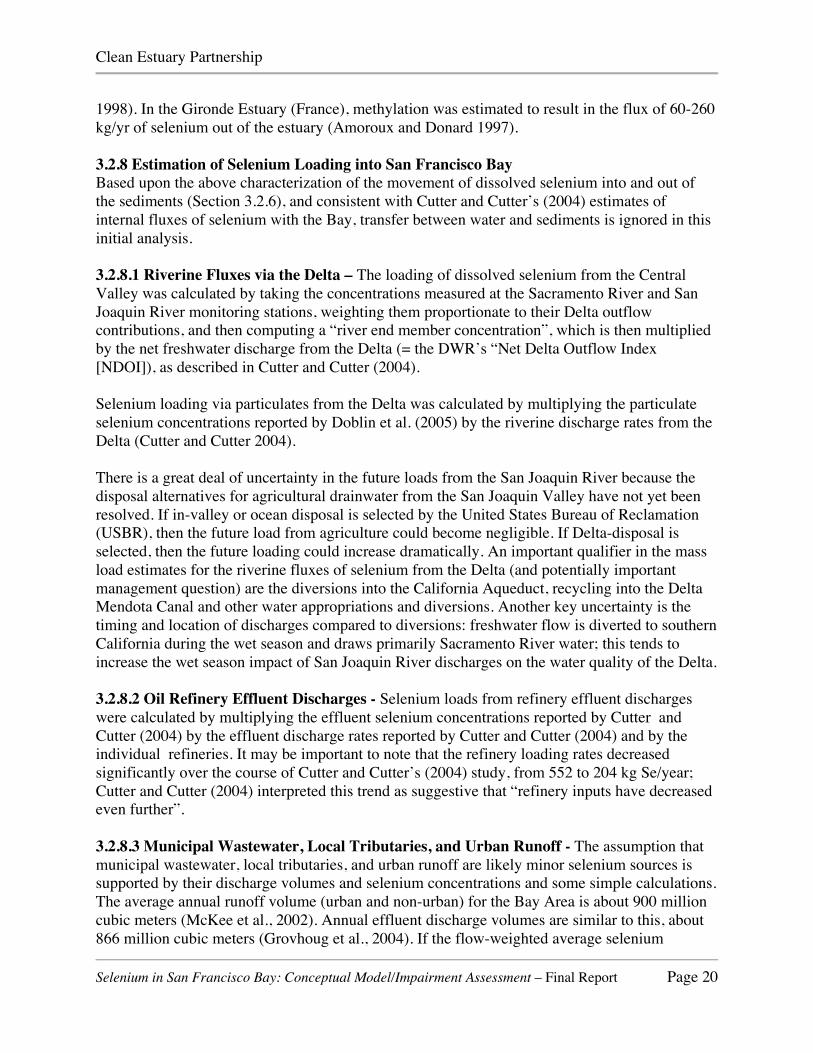
Figure 7. Initial selenium mass balance for the Bay, using a two compartment model for theBay. .......................................................................................................................... 23
Figure 8. A conceptual model of the transport and bioaccumulation of the key seleniumforms and matrices in SF Bay.................................................................................... 25
Figure 9. Monthly selenium concentrations (µg/g, dry wt) in Potamocorbula amurensis atCarquinez Strait. ....................................................................................................... 29
Figure 10. Suspended particulate selenium concentration in northern San Francisco Bayhave remained unchanged, despite the significant declines in dissolved seleniumconcentrations ........................................................................................................... 30
Figure 11. Ambient water selenium concentrations in northern San Francisco Bay.................... 33Figure 12. Ambient water selenium concentrations in South San Francisco Bay........................ 34Figure 13. Ambient sediment selenium concentrations in North and South San Francisco
Bay. .......................................................................................................................... 35Figure 14. Selenium concentrations (µg/g, dry wt) in white sturgeon muscle tissue................... 43Figure 15. Conceptual illustration of why drainage plans from the San Joaquin Valley could
threaten the Bay’s assimilative capacity for selenium. ............................................... 47Figure 16. Context of this selenium Conceptual Model Impairment Assessment Report
within the State’s adaptive strategy for implementing water quality standards andthe CEP’s workplan development.............................................................................. 49
Figure 17. The CEP Technical Committee’s process for developing, reviewing, and fundingtechnical projects. ..................................................................................................... 50

Clean Estuary Partnership
Selenium in San Francisco Bay: Conceptual Model/Impairment Assessment – Final Report x
List of TablesPage
Table 1. The San Francisco Bay segments or water bodies that are currently on the CleanWater Act 303(d) list as being impaired by selenium...................................................3
Table 2. Beneficial uses of San Francisco Bay that are impaired. ................................................8Table 3. BPTCP Category IV sitesa: stations with elevated chemistry and biological impact
measured by either toxicity or degraded benthos. ........................................................8Table 4. Beneficial uses of San Francisco Bay that could potentially be impaired from ambient
water toxicity due to selenium.....................................................................................9Table 5. Chemistry and significance of selenium species in natural waters. .............................. 13Table 6. Relative concentrations of selenium species (µg/L Se) in the major sources of
dissolved selenium into San Francisco Bay. .............................................................. 16Table 7. Selenium loading (kg/yr) to San Francisco Bay. .......................................................... 21Table 8. Input terms for selenium mass inventory and residence time calculations .................... 22Table 9. Cellular selenium concentration (ng/µm3) for marine algae exposed to 0.15 nM
selenite...................................................................................................................... 27Table 10. Water quality criteria for selenium............................................................................. 32Table 11. Characterizations of the impairment of San Francisco Bay ........................................ 39Table 12. Current status of indicators of beneficial use impairment by selenium in San
Francisco Bay ........................................................................................................... 45Table 13. Preliminary list of selenium management questions identified in this report .............. 52

Clean Estuary Partnership
Selenium in San Francisco Bay: Conceptual Model/Impairment Assessment – Final Report Page 1
1. IntroductionSection 303(d) of the federal Clean Water Act (CWA) requires states to identify those waterbodies not attaining water quality standards (i.e., waters whose beneficial uses have beenimpaired), to identify the pollutant causing the impairment, and to develop remediation plans(known as “total maximum daily loads”, or TMDLs) for each pollutant in each water body thatwill reduce and eventually eliminate the impairment and restore the beneficial use(s). In responseto observations of elevated concentrations of selenium in the tissues of diving ducks, the CADepartment of Health Services (DOHS) issued health advisories against the consumption of theducks. These health advisories reflect an impairment of San Francisco Bay’s beneficial uses,which is the basis for the San Francisco Bay Regional Water Quality Control Board (RegionalBoard) to identify much of San Francisco Bay as 303(d)-listed “impaired water bodies” due toselenium contamination.
In the almost 20 years that have passed since the initial health advisories were issued, there havebeen significant changes in the loading and fate and effects of selenium in San Francisco Bay,and the management responses to new information, as it has become available, would be atextbook example of adaptive environmental management. Two decades ago, resource agencieswere finding dead and deformed baby birds in Kesterson Reservoir resulting from the disposal ofsubsurface agricultural drainage from the western San Joaquin Valley. Monitoring of selenium inducks, fish, and invertebrates in the Bay and Delta revealed levels that could cause health risks topeople and wildlife. By 1989, studies had identified local industrial selenium sources to the Bay,and the Regional Board required those sources to reduce selenium discharges. All of this tookplace amid an invasion of the Asian clam (Potamocorbula amurensis), an exotic species that isvery efficient at moving selenium into the food chain. Now, six years after significant seleniumload reductions have been implemented by Bay Area oil refineries, and before long-term plans tomanage agricultural drainage in the Central Valley are finalized, it is a good time to review theoriginal basis for concern over selenium in the Bay, and summarize new information that hassurfaced over the past decade.
This report includes a brief narrative of the 303(d)-listing history, followed by a conceptualmodel and a current impairment assessment for selenium in San Francisco Bay. The conceptualmodel describes the sources of selenium to the Bay and the processes that determine theoccurrence and concentrations of selenium in the system. The impairment assessment re-evaluates the rationale for the initial 303(d)-listing(s) and summarizes existing data on seleniumin San Francisco Bay. Because there have been significant changes in the sources and loading ofselenium over the past 10 years, an important part of this document is the assessment of recentstudies that may significantly affect how we think selenium behaves in the Bay, and recent andongoing regulatory developments that may affect compliance with regulatory criteria and thepotential impairment of San Francisco Bay by selenium.
This report has been produced for the Clean Estuary Partnership (CEP). The CEP is acollaboration of the Bay Area Clean Water Agencies, Bay Area Stormwater ManagementAgencies Association, and the San Francisco Bay Regional Board. Other important participantsinclude the San Francisco Estuary Institute, Clean Water Fund, San Francisco Bay Keeper, Port
Clean Estuary Partnership
Selenium in San Francisco Bay: Conceptual Model/Impairment Assessment – Final Report Page 2
of Oakland and the Western States Petroleum Association. This cooperative partnershipfacilitates efforts to improve water quality in San Francisco Bay by providing financial and staffsupport for technical studies, discussion of management questions and strategies, and stakeholderoutreach activities.
Several Conceptual Model/Impairment Assessment (CM/IA) reports have been commissioned bythe CEP for pollutants that have been identified in the past as possible causes of impairment tobeneficial uses in San Francisco Bay. The general objectives of these CM/IA reports are:
• Develop a conceptual model that describes the current state of knowledge for thepollutant of concern, including sources, loads, and pathways into and out of the Bay andits water, sediment and biota;
• Evaluate the current level of impairment of beneficial uses, including description ofstandards or screening indicators and relevant data;
• Recommend options for the next steps needed to reduce uncertainties in the conceptualmodel and impairment, to assist the CEP partners in balancing priorities for datagathering along with other pollution prevention activities.
Since the state of knowledge varies among pollutants, initial CM/IA reports may lack theresources to fully achieve all these objectives in each case. This CM/IA report should be viewedas a tool for planning and an important step in resolution of selenium-related issues, and not as aconclusive statement on the conceptual model, beneficial use impairment, or next steps needed toresolve selenium-related issues.
This report is a planning document. At the end, key findings are expressed as managementquestions that may lead to either study plans or action plans, depending on the level of certaintyabout the answers. The report is also intended to be a tool for communications and outreach, so itrelies on graphics, conceptual logic, and plain language to explain what we know and what weneed to know about how watershed management in California affects selenium in the food chainand the health of people and wildlife who eat fish and invertebrates from the Bay.

Clean Estuary Partnership
Selenium in San Francisco Bay: Conceptual Model/Impairment Assessment – Final Report Page 3
2. Background Information: the 303(d) Listing2.1 San Francisco BaySan Francisco Bay is the largest estuary on the West Coast of the United States, draining anoverall watershed area of 60,000 square miles (Figure 1), and the Bay’s deepwater channels,tidal mudflats and wetlands, and freshwater streams and rivers provide a wide variety ofimportant ecological habitats. The Sacramento and San Joaquin Rivers enter the northern reachof the Bay via the Delta, at the eastern end of Suisun Bay (Figure 2), and contribute almost all ofthe freshwater flow into the Bay, although there are many smaller tributary rivers and streamswithin the Bay’s immediate watershed. Suisun Bay, which is the largest brackish-water marsh inthe United States, flows through the Carquinez Straits into San Pablo Bay. The South Bay, at theother end of the Bay system, receives much less freshwater inflow than does the northern reach,and acts more like a tidal lagoon. The northern and southern Bay segments meet in the CentralBay, which is the Bay’s connection to the Pacific Ocean, and which is heavily influenced byoceanic conditions.
2.1.1 The Impaired San Francisco Bay Segments and Water BodiesThe San Francisco Bay segments or water bodies that are currently listed as being impaired byselenium (Figure 2) are listed in Table 1.
Table 1. The San Francisco Bay segments or water bodies that are currently on theClean Water Act 303(d) List as being impaired by selenium
Bay Segment or Water Body 1998303(d) List
2002303(d) List
Sacramento-San Joaquin Delta X XSuisun Bay X X
Carquinez Strait X XSan Pablo Bay X X
Central San Francisco Bay X XSouth San Francisco Bay X X
Central Basin (part of Central SF Bay) XCastro Cove X
Oakland Inner Harbor – Pacific Dry Dock(part of Central SF Bay) X
Oakland Inner Harbor – Fruitvale(part of Central SF Bay) X
San Leandro Bay X
In general, little is known about concentrations of selenium in the Baylands, margins, and saltmarshes bordering the Bay.

Clean Estuary Partnership
Selenium in San Francisco Bay: Conceptual Model/Impairment Assessment - Final Report Page 4
Figure 1. The San Francisco Estuary watershed, including the Sacramento River watershed andthe San Joaquin River watershed in the Central Valley, and the San Francisco Bay watershed.
HumboldtBay
Mountains and Hills
Valleys
Historic Lakes
Basin Boundaries
CA
SC
AD
ER
AN
GE
SI
ER
RA
NE
VA
DA
0
0 100 kilometers50
100 miles50
GooseLake
ShastaLake
Eagle Lake
Lake Almanor
PyramidLake
LakeOroville
LakeTahoe
ClearLake
LakeBerryessa
MonoLake
Folsom Lake
San LuisRes.
Sacramento
River
San
Joaquin
Kings
LakeIsabellaKern
Riv
er
KernLake
River
Riv
erMontereyBay
TulareLake
Fea
ther
River
OwensLake
TrinityLake
Buena Vista
Lake
MorroBay
PA
CI
FI
C
OC
EA
N
K L A M A T HM O U N T A I N S
NE V A
DA
CA
L I F OR
NI A
O R E G O NC A L I F O R N I A
NO
RT
HE
RN
CO
AS
TR
AN
GE
S
SO
UT
HE
RN
CO
AS
TR
AN
GE S
M O D O CP L A T E A U
CE
NT
RA
L
VA
LL
EY
CA
LI
FO
RN
I A
N
Merced
River
Stan
islau
sR
iver
River
Tuolumne
Fresno
Slough
River
Am
erica
n
River
Pit
River
C
osumnes
Enlarged in Figure 2
Delta
Pease Press Cartography (www.peasepress.com).Original maps courtesy of the Bay Institute of San Francisco & San Francisco Estuary Institute, 1998
SacramentoRiver Basin
San JoaquinRiver Basin
TheDeltaSan
FranciscoBay
Tulare Lake Basin
S.F.Bay
PA
CI F
I CO
C
EA
N
San Francisco Estuary Watershed

Clean Estuary Partnership
Selenium in San Francisco Bay: Conceptual Model/Impairment Assessment – Final Report Page 5
Figure 2. The San Francisco Bay system, including the segments and water bodies of the Bay that have beenplaced on the 303(d) list for impairment by selenium.
10/1
3/04
Sacramento/San JoaquinRiver Delta
SuisunBay
Central Bay
San PabloBay
N V
O R I D
CA
LI
FO
RN
I A
Map Area
SF Estuary Watershed
0 5 10 miles
10 kilometers50
Golden Gate
Mt. Tamalpais
Mt. Diablo
Bay Segments
Other bodies of water
Pease Press Cartography: www.peasepress.com
San Francisco Bay System
PA
CI
FI
C
OC
EA
N
Castro Cove
CarquinezStrait
Oakland Inner HarborSan Leandro Bay
Point of Interest
SouthSan FranciscoBay
Clean Estuary Partnership
Selenium in San Francisco Bay: Conceptual Model/Impairment Assessment – Final Report Page 6
2.2 Regulatory Background for the 303(d) Impairment ListingSection 303(c)(2)(a) of the federal Clean Water Act requires that states develop water qualitystandards to protect human health and the environment, and Section 303(d) requires that statesdevelop lists of water bodies that do not meet those standards.
In California, the Porter-Cologne Water Quality Control Act, which is contained in theCalifornia Water Code, identifies the State Water Resources Control Board (State Board) andRegional Water Quality Control Boards (Regional Boards) as the principal agencies responsiblefor controlling water quality in California. This joint agency responsibility couples state-levelcoordination with regional familiarity with local conditions. Accordingly, the San Francisco BayRegional Board has the responsibility for regulating and protecting water quality within the SanFrancisco Bay region, which it addresses within its basin-specific Water Quality Control Plan(Basin Plan). The key elements of the San Francisco Bay Basin Plan consist of:
• A statement of the beneficial uses of San Francisco Bay that are to be protected;• Identification of the water quality objectives needed to protect these beneficial uses;• An implementation plan to protect these beneficial uses, primarily via regulation of
discharges to the Bay and its tributaries (SFBRWQCB 1995).
In meeting the requirements of the Clean Water Act, and consistent with the Basin Plan, whenwater quality objectives are not being met such that any one or more of the Bay’s beneficial usesare impaired, the San Francisco Bay Regional Board is responsible for placing the impaired bodyof water on the 303(d) list, with the listing being subject to approval by EPA. In complying, theSan Francisco Bay Regional Board has developed successive lists of “impaired” segments orwater bodies since 1976. The State Board has subsequently issued the Water Quality ControlPolicy for Developing California’s Clean Water Act Section 303(d) List (SWRCB 2003) toformalize this process and provide the guidelines to be used for listing waters and developingTMDLs, as well as for “de-listing” waters (removing waters from the 303(d) list if the listingwas based on faulty data, if objectives or standards have been revised and the segment or waterbody meets the new standards, or if the standards have been fully attained).
2.3 Basis for the 303(d) Impairment Listing for Selenium
2.3.1 Elevated Levels of Selenium Observed in San Francisco Bay Diving DucksBased upon early studies with domestic livestock and poultry, it has long been recognized thatexcessive accumulation of selenium can cause adverse effects in animals. However, it was notuntil US Fish & Wildlife Service (USFWS) studies of the accumulation and effects of seleniumon aquatic birds nesting around the agricultural drainwater ponds at the Kesterson NationalWildlife Refuge began reporting severe reproductive impairment (Ohlendorf et al. 1986; Saiki1986), including the now infamous pictures of severely deformed embryos and hatchlings, thatselenium became a part of the national consciousness. Indeed, the name “Kesterson” has come toassume a similar connotation to that of “Three Mile Island” or “Love Canal”.
However, it is important to note that these same investigators had conducted an even earlierstudy that had already revealed elevated concentrations of selenium in diving ducks (GreaterScaups and Surf Scoters) in San Francisco Bay (Ohlendorf et al. 1986). While the findings of

Clean Estuary Partnership
Selenium in San Francisco Bay: Conceptual Model/Impairment Assessment – Final Report Page 7
elevated tissue concentrations of selenium in these diving ducks did not receive the sameattention as did “Kesterson”, they did not go un-noticed.
In response to these findings, the State Board and CA Department of Fish & Game (DFG)conducted a “Selenium Verification Study” from 1985-1990 in which a variety of aquaticorganisms from various segments of San Francisco Bay were collected and analyzed for tissueconcentrations of selenium (White et al. 1987, 1988, 1989; Urquhart et al. 1991). And indeed,the Selenium Verification Study did “verify” that these diving ducks had elevated tissueconcentrations of selenium.
2.3.2 The Initial Basis for Impairment: Health Advisories for Consumption of WaterfowlBased upon the initial data reported by the Selenium Verification Study (i.e., for the period ofJanuary-April 1986), the CA DOHS issued a health advisory for the consumption of tissues fromthese diving ducks:
“DHS recommends limiting consumption of scoters to not more than four ouncesevery two weeks and scaups to not more than four ounces per week. Livers shouldnot be eaten because of high selenium levels. Due to concern on the reproductiveand developmental effects of selenium, women of child-bearing age and children15 of age and under should not eat scoters and scaups from Suisun Bay” (Fan andBook 1986).
Upon review of subsequent data generated by the Selenium Verification Study, the CADHS issued additional advisories in 1988 (Fan and Lipsett 1988) for San Pablo Bay(Contra Costa, Marin, Solano, and Sonoma counties), and San Francisco Bay (Alameda,Contra Costa, Marin, San Francisco, San Mateo, and Santa Clara counties).
2.3.3 The Initial 303(d) Impairment ListingIn response to the issuance of health advisories for the consumption of the diving ducks byDOHS, the San Francisco Bay Regional Board identified 6 San Francisco Bay segments or waterbodies (Table 1; Figure 2) as being impaired due to selenium in 1998:
“Affected use is one branch of the food chain; most sensitive indicator ishatchability in nesting diving birds, significant contributions from oil refineries(control program in place) and agriculture (carried downstream by rivers); exoticspecies may have made food chain more susceptible to accumulation of selenium;health consumption advisory in effect for scaup and scoter (diving ducks); lowTMDL priority because Individual Control Strategy in place.” (SFBRWQCB 1998).
The health advisories against the consumption of diving ducks represent a clear impairment ofthe beneficial use of commercial and sport fishing: “Uses of water for commercial orrecreational collection of fish, shellfish, or other organisms in oceans, bays, and estuaries,including, but not limited to, uses involving organisms intended for human consumption or baitpurposes” (Table 2).

Clean Estuary Partnership
Selenium in San Francisco Bay: Conceptual Model/Impairment Assessment – Final Report Page 8
Table 2. Beneficial uses of San Francisco Bay that are impaired.Use Abbreviation Definition
Ocean, commercial,and sport fishing COMM
Uses of waters for commercial or recreational collection of fish,shellfish, or other organisms in oceans, bays, and estuaries,including but not limited to, uses involving organisms intendedfor human consumption.
2.3.3.1 Additional Impairment Considerations: Amending the 303(d) List – In 1989,California Water Code was amended to establish a comprehensive program to protect theexisting and future beneficial uses of California's enclosed bays and estuaries. The resultant BayProtection and Toxics Cleanup Program (BPTCP) has four primary goals:
1. protect existing and future beneficial uses of bay and estuarine waters;2. identify and characterize toxic hot spots;3. plan for the prevention and control of further pollution at toxic hot spots; and4. develop plans for remedial actions of existing toxic hot spots and prevent the creation of
new toxic hot spots.
As part of the BPTCP, intensive monitoring of numerous sites throughout San Francisco Baywas performed, which led to the identification of several sites as being contaminated with a widevariety of chemicals and trace elements, including selenium (Hunt et al. 1998).
In 2002, the State Board amended the 303(d) list to include those BPTCP sites having elevatedchemicals in sediments and adverse biological impact as indicated by either sediment toxicity ordegradation of the benthic community (Table 3; Figure 2).
Table 3. BPTCP Category IV sitesa: stations with elevated chemistry and biological impactmeasured by either toxicity or degraded benthos.
Impaired Water Body Indicator of Impairment Linkage of Impairment to Seb
Castro Cove Sediment toxicity to amphipods Se concentration exceeds theBPTCP 90th percentile value
Central BasinSediment toxicity to amphipods
(high sulfide); sediment porewatertoxicity to urchins (ammonia high)
not identified
San Leandro Bay Sediment toxicity to amphipods Se concentration exceeds theBPTCP 90th percentile value
Oakland Inner Harbor(Pacific Drydock Yard 1) Sediment toxicity to amphipods not identified
Oakland Inner Harbor(Oakland-Fruitvale)
Sediment toxicity to amphipods(high ammonia, sulfide) not identified
a - From Table 28 in Hunt et al. (1998).b – From Table 16 in Hunt et al. (1998).Note - the San Francisco Bay Regional Board has, in comments to the State Board, expressed concern that theBPTCP had not established a causal link between any adverse effects and any of the elevated contaminantconcentrations (SFBRWQC 2001).
Clean Estuary Partnership
Selenium in San Francisco Bay: Conceptual Model/Impairment Assessment – Final Report Page 9
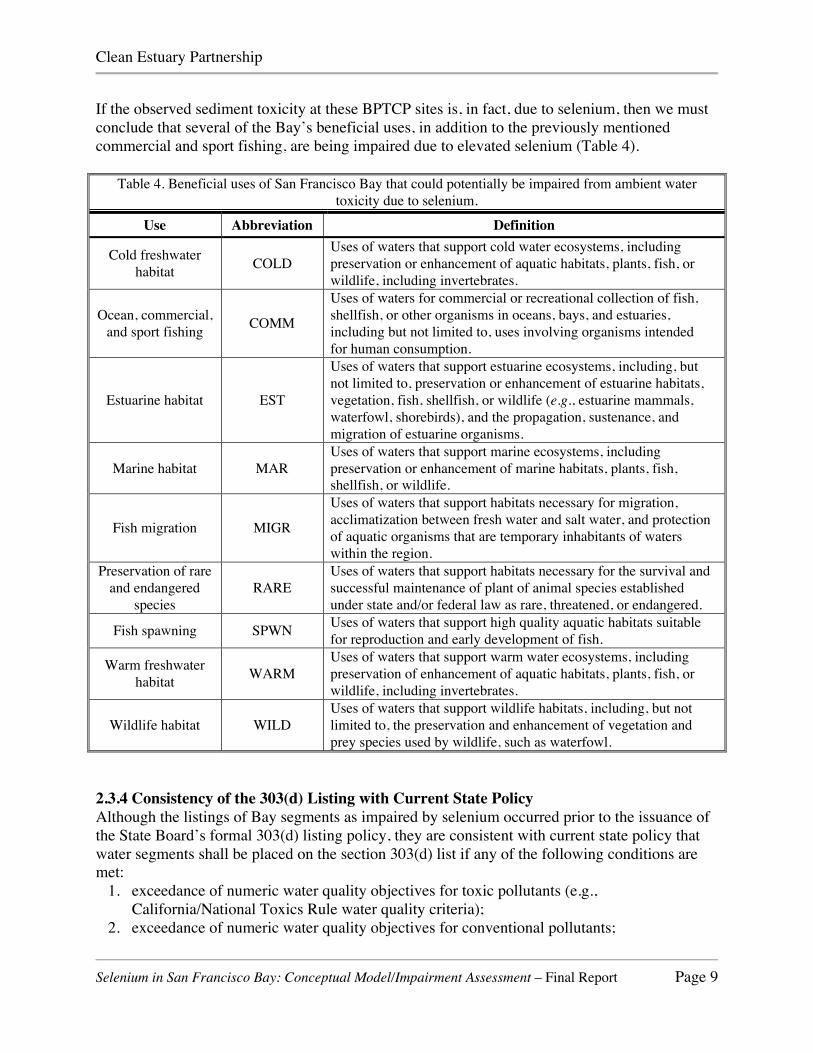
If the observed sediment toxicity at these BPTCP sites is, in fact, due to selenium, then we mustconclude that several of the Bay’s beneficial uses, in addition to the previously mentionedcommercial and sport fishing, are being impaired due to elevated selenium (Table 4).
Table 4. Beneficial uses of San Francisco Bay that could potentially be impaired from ambient watertoxicity due to selenium.
Use Abbreviation Definition
Cold freshwaterhabitat COLD
Uses of waters that support cold water ecosystems, includingpreservation or enhancement of aquatic habitats, plants, fish, orwildlife, including invertebrates.
Ocean, commercial,and sport fishing COMM
Uses of waters for commercial or recreational collection of fish,shellfish, or other organisms in oceans, bays, and estuaries,including but not limited to, uses involving organisms intendedfor human consumption.
Estuarine habitat EST
Uses of waters that support estuarine ecosystems, including, butnot limited to, preservation or enhancement of estuarine habitats,vegetation, fish, shellfish, or wildlife (e.g., estuarine mammals,waterfowl, shorebirds), and the propagation, sustenance, andmigration of estuarine organisms.
Marine habitat MARUses of waters that support marine ecosystems, includingpreservation or enhancement of marine habitats, plants, fish,shellfish, or wildlife.
Fish migration MIGR
Uses of waters that support habitats necessary for migration,acclimatization between fresh water and salt water, and protectionof aquatic organisms that are temporary inhabitants of waterswithin the region.
Preservation of rareand endangered
speciesRARE
Uses of waters that support habitats necessary for the survival andsuccessful maintenance of plant of animal species establishedunder state and/or federal law as rare, threatened, or endangered.
Fish spawning SPWN Uses of waters that support high quality aquatic habitats suitablefor reproduction and early development of fish.
Warm freshwaterhabitat WARM
Uses of waters that support warm water ecosystems, includingpreservation of enhancement of aquatic habitats, plants, fish, orwildlife, including invertebrates.
Wildlife habitat WILDUses of waters that support wildlife habitats, including, but notlimited to, the preservation and enhancement of vegetation andprey species used by wildlife, such as waterfowl.
2.3.4 Consistency of the 303(d) Listing with Current State PolicyAlthough the listings of Bay segments as impaired by selenium occurred prior to the issuance ofthe State Board’s formal 303(d) listing policy, they are consistent with current state policy thatwater segments shall be placed on the section 303(d) list if any of the following conditions aremet:
1. exceedance of numeric water quality objectives for toxic pollutants (e.g.,California/National Toxics Rule water quality criteria);
2. exceedance of numeric water quality objectives for conventional pollutants;
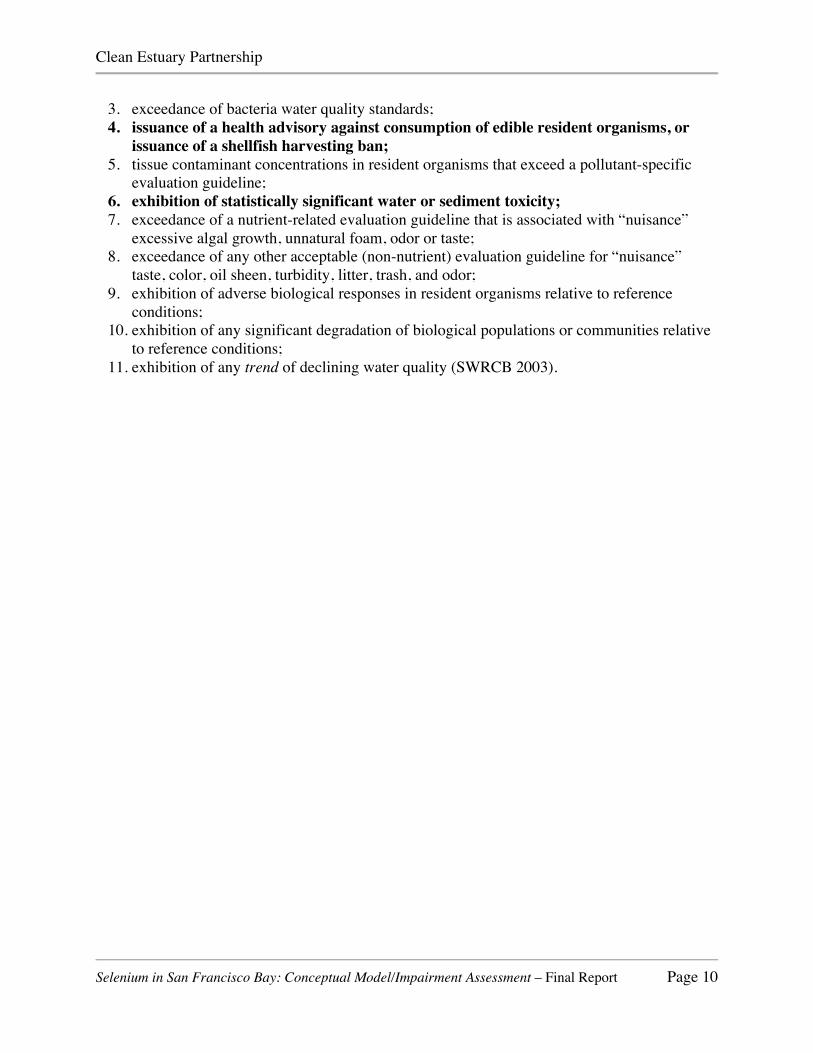
Clean Estuary Partnership
Selenium in San Francisco Bay: Conceptual Model/Impairment Assessment – Final Report Page 10
3. exceedance of bacteria water quality standards;4. issuance of a health advisory against consumption of edible resident organisms, or
issuance of a shellfish harvesting ban;5. tissue contaminant concentrations in resident organisms that exceed a pollutant-specific
evaluation guideline;6. exhibition of statistically significant water or sediment toxicity;7. exceedance of a nutrient-related evaluation guideline that is associated with “nuisance”
excessive algal growth, unnatural foam, odor or taste;8. exceedance of any other acceptable (non-nutrient) evaluation guideline for “nuisance”
taste, color, oil sheen, turbidity, litter, trash, and odor;9. exhibition of adverse biological responses in resident organisms relative to reference
conditions;10. exhibition of any significant degradation of biological populations or communities relative
to reference conditions;11. exhibition of any trend of declining water quality (SWRCB 2003).
Clean Estuary Partnership
Selenium in San Francisco Bay: Conceptual Model/Impairment Assessment – Final Report Page 11
3. A Conceptual Model for SeleniumThe conceptual model of the fate and effects of selenium in the San Francisco Estuary watershedintegrates information on the sources and loading of selenium to the Bay, the chemicalcharacteristics of selenium, and the linkages between these and the resultant cycling andbioaccumulation of selenium. Because selenium can and does occur in a wide variety of differentchemical forms, a normal discussion of “cycling” processes can rapidly become overly complex.As a result, the formal discussion of cycling processes in this CMIA is limited to those involvedin selenium bioaccumulation; other cycling processes may be discussed in other sections of thisconceptual model, as appropriate.
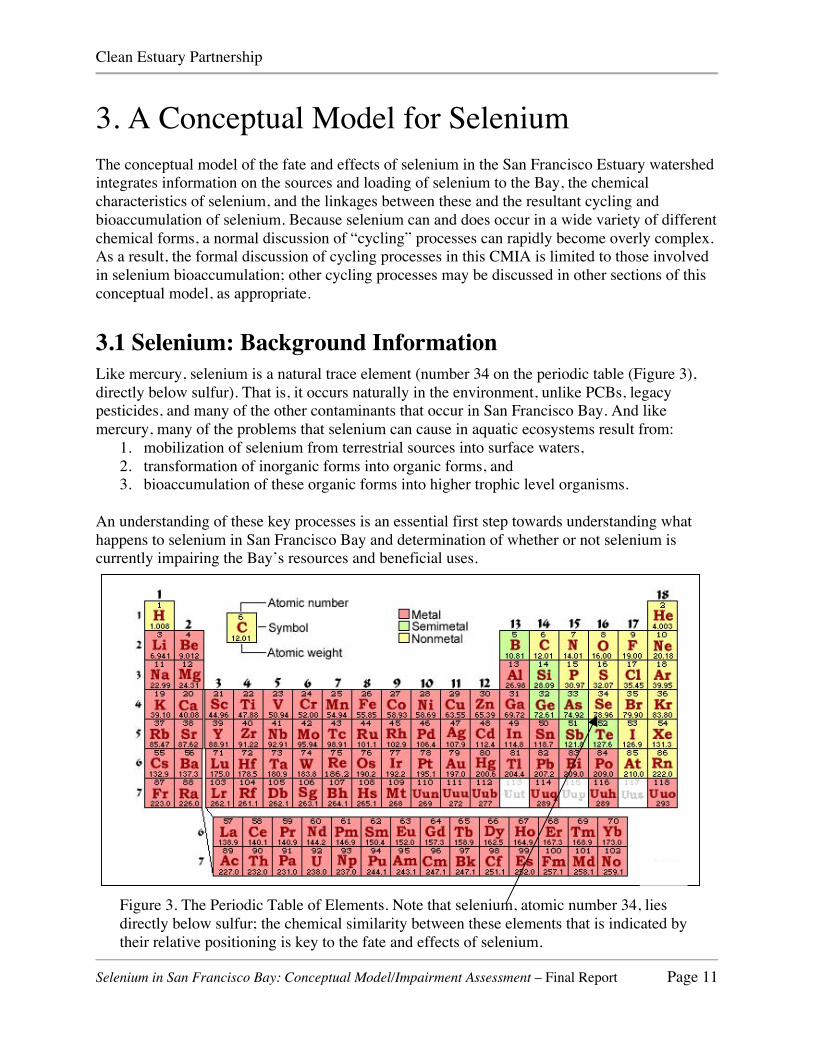
3.1 Selenium: Background InformationLike mercury, selenium is a natural trace element (number 34 on the periodic table (Figure 3),directly below sulfur). That is, it occurs naturally in the environment, unlike PCBs, legacypesticides, and many of the other contaminants that occur in San Francisco Bay. And likemercury, many of the problems that selenium can cause in aquatic ecosystems result from:
1. mobilization of selenium from terrestrial sources into surface waters,2. transformation of inorganic forms into organic forms, and3. bioaccumulation of these organic forms into higher trophic level organisms.
An understanding of these key processes is an essential first step towards understanding whathappens to selenium in San Francisco Bay and determination of whether or not selenium iscurrently impairing the Bay’s resources and beneficial uses.
Figure 3. The Periodic Table of Elements. Note that selenium, atomic number 34, liesdirectly below sulfur; the chemical similarity between these elements that is indicated bytheir relative positioning is key to the fate and effects of selenium.

Clean Estuary Partnership
Selenium in San Francisco Bay: Conceptual Model/Impairment Assessment – Final Report Page 12
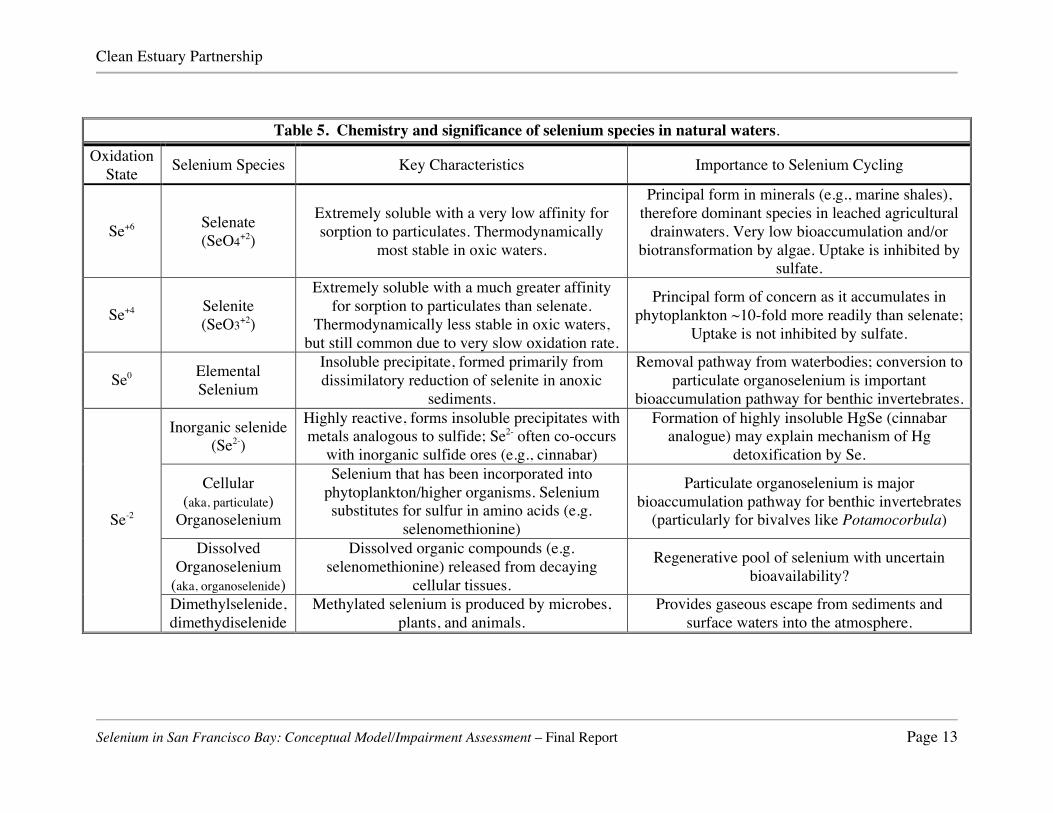
Selenium occurs in several different chemical forms or species (Table 5). Due to its chemicalsimilarity to sulfur, these selenium species are typically direct analogs to similar sulfur species.In most oxic waters, selenium will be most stable in its most oxidized form, Se+6, which typicallyoccurs as the oxyanion selenate (SeO4+2), a direct analog to sulfate (SO4+2). The uptake andbiotransformation of selenate into organoselenides by the microbes and algae at the base of thefood chain is greatly reduced relative to selenite (see review by Ogle et al. 1988), and theseprocesses are further inhibited by sulfate (Williams et al. 1994; US EPA 2004). Selenate behavesas a non-sorbing solute, and relative to selenite, is much less likely to adsorb to particulates andbecome incorporated into sediments (Zhang and Moore 1997; Guo et al. 1999). As the amount ofavailable oxygen in water decreases, the preferred stability to selenium shifts towards a slightlymore reduced form, Se+4, which typically occurs as the oxyanion selenite (SeO3+2), a directanalog to sulfite (SO3+2). In contrast to selenate, selenite is readily taken up by the microbes andalgae at the base of the food chain, and is rapidly biotransformed into organoselenides, such asseleno-amino acids (see review by Ogle et al. 1988). Selenite also readily sorbs to particulatematerial, particularly Fe/Mn oxides (Neal et al. 1987; Balistrieri and Chao 1990).
Loadings of selenate and selenite can both push adsorption and phytoplankton uptake towardshigher particulate selenium concentrations, it’s just that selenite pushes harder, pound for pound.The approximately 10-fold difference in the bioavailability of selenite relative to selenate ledRegional Board staff to propose a 10:1 ratio for managing selenium loads (Taylor, 1997). In theenvironment, selenium will shift back and forth between these forms depending upon theambient water quality conditions, although in the case of oxidation of selenite to selenate, thereaction rate may be exceedingly slow, i.e., on the order of 103 years (Cutter and Bruland 1984).
As the amount of available oxygen in water continues to decrease, as might be common insediment interstitial waters, the preferred stability to selenium again shifts towards a morereduced form, Se0, or elemental selenium. Elemental selenium is insoluble, and occurs inparticulate form. The formation of elemental selenium from the more oxidized forms can befacilitated by anoxic microbes in a process termed “dissimilatory reduction” (Zehr and Oremland1987; Steinberg and Oremland 1990).
Under extremely reducing conditions, selenium may be reduced further to form selenide(s), Se-2.Like inorganic sulfides, inorganic selenide can bind very strongly to metal ions, forminginsoluble precipitates. However, an even more important pathway for the conversion of seleniumto the Se-2 form is biotransformation, in which living cells absorb one of the more oxidizedforms of selenium, and then reduce the selenium biologically and incorporate it into a widevariety of organic compounds, such as seleno-amino acids (e.g., selenomethionine); the resultantorganoselenides (which are often referred to as “particulate” selenium) are then available, bothin living cells and in detrital materials, for bioaccumulation by consumer organisms. Seleniumcan also occur as methylated selenides which are volatile and serve as a means of selenium lossfrom water and sediments to the atmosphere.
Clean Estuary Partnership
Selenium in San Francisco Bay: Conceptual Model/Impairment Assessment – Final Report Page 13
Table 5. Chemistry and significance of selenium species in natural waters.Oxidation
State Selenium Species Key Characteristics Importance to Selenium Cycling
Se+6 Selenate(SeO4+2)
Extremely soluble with a very low affinity forsorption to particulates. Thermodynamically
most stable in oxic waters.
Principal form in minerals (e.g., marine shales),therefore dominant species in leached agricultural
drainwaters. Very low bioaccumulation and/orbiotransformation by algae. Uptake is inhibited by
sulfate.
Se+4 Selenite(SeO3+2)
Extremely soluble with a much greater affinityfor sorption to particulates than selenate.
Thermodynamically less stable in oxic waters,but still common due to very slow oxidation rate.
Principal form of concern as it accumulates inphytoplankton ~10-fold more readily than selenate;
Uptake is not inhibited by sulfate.
Se0 ElementalSelenium
Insoluble precipitate, formed primarily fromdissimilatory reduction of selenite in anoxic
sediments.
Removal pathway from waterbodies; conversion toparticulate organoselenium is important
bioaccumulation pathway for benthic invertebrates.
Inorganic selenide(Se2-)
Highly reactive, forms insoluble precipitates withmetals analogous to sulfide; Se2- often co-occurs
with inorganic sulfide ores (e.g., cinnabar)
Formation of highly insoluble HgSe (cinnabaranalogue) may explain mechanism of Hg
detoxification by Se.
Cellular(aka, particulate)
Organoselenium
Selenium that has been incorporated intophytoplankton/higher organisms. Seleniumsubstitutes for sulfur in amino acids (e.g.
selenomethionine)
Particulate organoselenium is majorbioaccumulation pathway for benthic invertebrates
(particularly for bivalves like Potamocorbula)
DissolvedOrganoselenium
(aka, organoselenide)
Dissolved organic compounds (e.g.selenomethionine) released from decaying
cellular tissues.
Regenerative pool of selenium with uncertainbioavailability?
Se-2
Dimethylselenide,dimethydiselenide
Methylated selenium is produced by microbes,plants, and animals.
Provides gaseous escape from sediments andsurface waters into the atmosphere.
Clean Estuary Partnership
Selenium in San Francisco Bay: Conceptual Model/Impairment Assessment – Final Report Page 14
3.2 Sources and LoadingThe three major sources of selenium to the Bay are:
1. the Sacramento River,2. the San Joaquin River, which includes seleniferous agricultural drainwater,3. discharges from oil refineries,
all of which bring selenium into the northern reach of the Bay system (Figure 4). As described earlier, thesouthern reach of the Bay does not have similar tributary or industrial discharge sources, and acts muchmore like a tidal lagoon; POTWs are the major sources of selenium to South Bay (Cutter 1989; Cutter andSan Diego-McGlone 1990).
3.2.1 Riverine Input of Dissolved Selenium to Northern San Francisco BayThe Sacramento River is the largest source of surface water runoff into San Francisco Bay (Figure 1),with a flow rate that is over 10-times that of the San Joaquin River (Ball and Arthur 1979). Cutter andCutter (2004) recently reported that the concentrations of total dissolved selenium in the SacramentoRiver water have been remarkably consistent over time, with values in 1997-99 (Table 6) beingessentially identical to those observed in the 1980s; furthermore, the relative proportions of the variousselenium species have been similarly consistent: predominantly selenate (48% of the total), with muchless selenite (12% of the total), and the remainder being assumed to be dissolved organoselenides (Table6).
The San Joaquin River drains approximately 13,500 mi2 (Figure 1), much of which is agricultural. Soilson the west side of the San Joaquin Valley are derived from marine geological deposits that are high inselenium and salts, and irrigation and drainage of these saline soils dissolves the selenium (most of whichis in selenate form) into the agricultural drainwater, much of which is eventually conveyed to the SanJoaquin River (Presser and Barnes 1984; Tanji et al. 1986). As a result, the concentrations of totaldissolved selenium in the San Joaquin River are much higher than in the Sacramento River, althoughrecent changes in management practices by agricultural (ag) drainwater stakeholders appear to have beeneffective in reducing the San Joaquin River water total dissolved Se concentrations in 1997-2000 to lessthan half that observed in 1984-1988 (Cutter and Cutter 2004). Nevertheless, the selenium concentrationsin the San Joaquin River remain elevated relative to the Sacramento River, again being predominantlyselenate (66% of the total) with much less selenite (3% of the total), and the remainder being assumed tobe dissolved organoselenides (Table 6). However, because of the historical diversion of San Joaquin Riverwater for domestic and agricultural uses prior to discharge into the Delta or northern San Francisco Bay(Arthur and Ball 1979), the contribution of the San Joaquin River as a source of selenium has often beenconsidered negligible (Cutter and Diego-McGlone 1990). This may well change as state-mandatedincreases in the flow of San Joaquin River water to the Delta and Bay come into play (as per the 1994Bay-Delta Water Accord, SWRCB 1994).
3.2.2 Mid-Estuarine Sources of Dissolved Selenium: the Oil RefineriesLike sulfur, selenium is a natural constituent of oil, and due to high water solubilities, many of theselenium compounds present in the oil will partition into the wastewater stream. As a result, oil refineriescan discharge a variety of selenium species, including selenate and selenite. Studies in the 1980’s hadidentified refinery discharges as being a major source of selenite to the Bay.

Clean Estuary Partnership
Selenium in San Francisco Bay: Conceptual Model/Impairment Assessment – Final Report Page 15
Figure 4. A conceptual model of the major sources of selenium into San Francisco Bay.

Clean Estuary Partnership
Selenium in San Francisco Bay: Conceptual Model/Impairment Assessment – Final Report Page 16
(Cutter 1989; Cutter and San Diego-McGlone 1990). The San Francisco Bay Regional Boardresponded with a Mass Emissions Reduction Strategy that required the oil refineries to reducetheir loads of selenium to the Bay (SFBRWQCB 1992). The refineries have been extremelysuccessful in achieving these reductions, with the most recent studies indicating an average 66%reduction in total dissolved selenium discharge (Cutter and Cutter 2004), and a remarkable 92%average reduction in the amount of selenite being released (Figure 5).
As reported by Cutter and Cutter (2004), this has resulted in a concomitant change in the Bay’sselenium profile: “selenite concentrations, particularly in the Suisun Bay-Carquinez Strait-SanPablo Bay region, have decreased by 82%, roughly that same decrease as that in the refineryeffluents…”. Cutter and Cutter (2004) concluded, “the present day refinery fluxes seldom exceedthe riverine inputs, are largely selenate, and the few data presented here suggest that the refineryinputs have decreased even further
Table 6. Relative concentrations of selenium species (µg/L Se) in the major sources of dissolvedselenium into San Francisco Bay.
Selenium Species Sacramento Riverb San Joaquin Riverc Refinery Effluentsd
Total Se 0.074 0.679 16.34Selenate ~0.036 (48% of total) ~0.448 (66% of total) ~9.97 (61% of total)Selenite ~0.009 (12% of total) ~0.020 (3% of total) ~2.29 (14% of total)
organic selenidesa ~0.030 (40% of total) ~0.210 (31% of total) ~4.09 (25% of total)a – Calculated as the difference between Total Se and (selenite + selenate).b – from November 1997 to May 2000 (Meseck 2002).c – from November 1997 to April 2000 (Meseck 2002).d – from October 1999 to August 2000 (Cutter and Cutter 2004).
3.2.3 South Bay: The POTWsBased upon analysis of South Bay ambient waters and POTW effluents, Cutter (1989) concludedthat “..the source of selenium (to South Bay) appears to be the effluents from municipal andindustrial discharges rather than in situ production”. This was also supported by follow-upmonitoring indicating that the maximum potential selenium loading from the Coyote Creeksystem was only 10% of that from the municipal sources (Cutter and San Diego-McGlone 1990).
3.2.4 South Bay: The Alviso Slough PuzzleSelenium concentrations in water at Alviso Slough exceed the California Toxics Rule (CTR)-established chronic water quality objective of 5 µg/L (Figure 6). Because of the concentrationgradient leading up to Alviso Slough, and the fact that a temporally intensive study conducted bythe City of San Jose (Watson et al., 1998) showed that low-tide selenium concentrations inAlviso Slough are substantially higher than high-tide concentrations, it was initially concludedthat the Guadalupe River (which drains into Alviso Slough) was the source of high-seleniumwaters (Zawislanski, 2003). That report went on to speculate that the source could be geologicdisturbances related to the New Almaden mercury mine, presumably due to the association ofselenium with sulfide ores.

Clean Estuary Partnership
Selenium in San Francisco Bay: Conceptual Model/Impairment Assessment – Final Report Page 17
5.49
0.270.02
0
1
2
3
4
5
6
Mean 1987-88 May 2000 August 2000
Sele
nit
e C
on
cen
trati
on
(µ
g/
L S
e)
Before
After
Refinery "A"
59.06
4.882.48
0
10
20
30
40
50
60
70
Mean 1987-88 May 2000 August 2000
Sele
nit
e C
on
cen
trati
on
(µ
g/
L S
e)
Before
After
Refinery "B"
4.32
0.06 0.09
0
1
2
3
4
5
Mean 1987-88 May 2000 August 2000
Sele
nit
e C
on
cen
trati
on
(µ
g/
L S
e)
Before
After
Refinery "C"
50.22
1.564.78
0
10
20
30
40
50
60
Mean 1987-88 May 2000 August 2000
Sele
nit
e C
on
cen
trati
on
(µ
g/
L S
e)
Before
After
Refinery "D"
22.19
0.16 0.040
5
10
15
20
25
Mean 1987-88 May 2000 August 2000
Sele
nit
e C
on
cen
trati
on
(µ
g/
L S
e)
Before
After
Refinery "E"
0.031
0.06
0.015 0.016
0.049
0.104
0
0.02
0.04
0.06
0.08
0.1
0.12
April 1986 Sept 1986 April 1999 Nov 1999
Sele
nit
e C
on
cen
trati
on
(µ
g/
L S
e)
mean Selenite
maximum Selenite Before
After
Northern San Francisco Bay
Figure 5. Changes in the selenite levels in the Bay area refinery effluents “before” and“after” refinery-implemented selenium control strategies, and the resultant changes in

Clean Estuary Partnership
Selenium in San Francisco Bay: Conceptual Model/Impairment Assessment – Final Report Page 18
northern San Francisco Bay ambient water selenite levels. Data from: Cutter (1989);Cutter and Cutter (2004).
0
5
10
Artesia
n slo
ugh
Alviso
Slou
gh
Guada
lupe
Slough
Lower
Sou
th B
ay
South
Bay
Centra
l Bay
North
Bay
[Se]
(µ
g/L
)
CTR Chronic Objective
USFWS Guideline
Figure 6. The California Toxics Rule water quality objective for protection againstchronic toxicity for selenium (5 µg/L) is frequently exceeded at Alviso Slough. Symbolsindicate average and range observed in the RMP.
The tidal variation of selenium in Alviso Slough observed by (Zawislanski, 2003) is an importantinsight. However, inspection of the relationship between the volume of flow in the GuadalupeRiver and the selenium concentration at Alviso Slough reveals that mobilization from the upperwatershed is not the likely source of high selenium water. When the Guadalupe River isdischarging enough water to fill Alviso Slough, the selenium concentration drops to 1-2 ppb.This pattern observed in the RMP data set is confirmed by analysis of the long-term monitoringdata produced by the City of San Jose [see, for example, Figure 7 in Zawislanski (2003)].
A more likely explanation is the discharge of pumped groundwater from dewatering operationsin the lower Guadalupe River. Selenium concentrations are elevated (2-8 µg/L) in groundwaterwells in the alluvial plain between Coyote Creek and the Guadalupe River (Santa Clara ValleyWater District, 1994), so groundwater dewatering operations that involve substantial volumesmay need to be investigated as potential selenium sources.
3.2.5 Sources of Suspended Particulate SeleniumUnlike microbes and algae, the primary source for selenium bioaccumulation by consumerorganisms is via the food chain. At the lower trophic levels, this will consist primarily ofingestion of particulate materials (i.e., microbes, algae, detritus, as well as abiotic particulatematerials). Recent studies have revealed that, on average, suspended particulate material in SanFrancisco Bay comprises 5-12% of the total amount of selenium in the water column (although it
Clean Estuary Partnership
Selenium in San Francisco Bay: Conceptual Model/Impairment Assessment – Final Report Page 19
can range from 2 to 18%, depending upon location), the remainder being the dissolved seleniumspecies discussed previously (Doblin et al. 2005).
Particulate selenium can be found in any of its oxidation states:1. organic selenides (e.g., cellular selenium, such as bacteria and algae),2. elemental selenium, or3. adsorbed or co-precipitated selenite of selenate.
Organic selenium comprises a large part of the particulate fraction (averaging ~45% of the total),with varying amounts of elemental selenium and adsorbed selenite(+selenate); however, underhigh flow conditions, the elemental selenium fraction increases. Because elemental selenium isgenerally only formed in anoxic sediments, it can be concluded that resuspended sediments arethe source of a large amount of the suspended particulates, and that contribution can be estimatedbased on the observation that Bay-Delta sediments average 53-57% elemental selenium (Doblinet al. 2005). Using this approach, Doblin et al. (2005) concluded that resuspension of sedimentcontributes an average of 83% (ranging from 35% to 100%) of the suspended particulates, withthe remainder assumed to be cellular (microbial and algal) organoselenides. This was reiteratedin Meseck’s (2002) conclusion that while dissolved selenium in San Francisco Bay is largelycontrolled by riverine and oil refinery inputs, particulate selenium is a function of riverine inputsof sediment and phytoplankton productivity.
The largest source of suspended particulate material to northern San Francisco Bay isresuspension of riverine and Delta sediments. Over the past 150+ years, human activities,including historical mining activities and more recent agricultural activities, have resulted in asignificant amount of particulate material to have settled or become deposited in the Delta.Today, these materials can be re-suspended and conveyed through northern San Francisco Bay.Stormwater runoff events are arguably the greatest cause of re-suspension of sediments (henceDoblin et al.’s (2005) observation of elevated proportions of elemental selenium in thesuspended particulate material during high flows), although there are many other factors thataffect the transport of suspended sediments from the Delta into San Francisco Bay, includinghuman activities, tides, wind, and water diversions.
3.2.6 Sediment-Water Interchange of SeleniumRecent studies using stable isotope ratios to discern sources of selenium to northern SanFrancisco Bay sediments concluded that the reduction of selenium from the overlying water isnot a significant mechanism for incorporation of selenium into the sediments (Johnson et al.2000). This is consistent with recent sediment and sediment porewater studies that indicate thatwhile there is a very small flux of inorganic selenium into sediments and a very small flux oforganic selenium out of sediments, the net flux of total selenium between the water column andsediments is relatively negligible (Meseck 2002).
3.2.7 Volatilization of Selenium From San Francisco BayUnder appropriate conditions, microbes (bacteria and fungi), algae and plants can formdimethylselenide and dimethyldiselenide which can be volatilized and released to the atmosphere(Ansede and Yoch 1997). Dimethylselenide loss to the atmosphere was estimated to be 10-30%of the selenium removal pathway in a treatment wetland from a Bay Area refinery (Hansen et al.,
Clean Estuary Partnership
Selenium in San Francisco Bay: Conceptual Model/Impairment Assessment – Final Report Page 20
1998). In the Gironde Estuary (France), methylation was estimated to result in the flux of 60-260kg/yr of selenium out of the estuary (Amoroux and Donard 1997).
3.2.8 Estimation of Selenium Loading into San Francisco BayBased upon the above characterization of the movement of dissolved selenium into and out ofthe sediments (Section 3.2.6), and consistent with Cutter and Cutter’s (2004) estimates ofinternal fluxes of selenium with the Bay, transfer between water and sediments is ignored in thisinitial analysis.
3.2.8.1 Riverine Fluxes via the Delta – The loading of dissolved selenium from the CentralValley was calculated by taking the concentrations measured at the Sacramento River and SanJoaquin River monitoring stations, weighting them proportionate to their Delta outflowcontributions, and then computing a “river end member concentration”, which is then multipliedby the net freshwater discharge from the Delta (= the DWR’s “Net Delta Outflow Index[NDOI]), as described in Cutter and Cutter (2004).
Selenium loading via particulates from the Delta was calculated by multiplying the particulateselenium concentrations reported by Doblin et al. (2005) by the riverine discharge rates from theDelta (Cutter and Cutter 2004).
There is a great deal of uncertainty in the future loads from the San Joaquin River because thedisposal alternatives for agricultural drainwater from the San Joaquin Valley have not yet beenresolved. If in-valley or ocean disposal is selected by the United States Bureau of Reclamation(USBR), then the future load from agriculture could become negligible. If Delta-disposal isselected, then the future loading could increase dramatically. An important qualifier in the massload estimates for the riverine fluxes of selenium from the Delta (and potentially importantmanagement question) are the diversions into the California Aqueduct, recycling into the DeltaMendota Canal and other water appropriations and diversions. Another key uncertainty is thetiming and location of discharges compared to diversions: freshwater flow is diverted to southernCalifornia during the wet season and draws primarily Sacramento River water; this tends toincrease the wet season impact of San Joaquin River discharges on the water quality of the Delta.
3.2.8.2 Oil Refinery Effluent Discharges - Selenium loads from refinery effluent dischargeswere calculated by multiplying the effluent selenium concentrations reported by Cutter andCutter (2004) by the effluent discharge rates reported by Cutter and Cutter (2004) and by theindividual refineries. It may be important to note that the refinery loading rates decreasedsignificantly over the course of Cutter and Cutter’s (2004) study, from 552 to 204 kg Se/year;Cutter and Cutter (2004) interpreted this trend as suggestive that “refinery inputs have decreasedeven further”.
3.2.8.3 Municipal Wastewater, Local Tributaries, and Urban Runoff - The assumption thatmunicipal wastewater, local tributaries, and urban runoff are likely minor selenium sources issupported by their discharge volumes and selenium concentrations and some simple calculations.The average annual runoff volume (urban and non-urban) for the Bay Area is about 900 millioncubic meters (McKee et al., 2002). Annual effluent discharge volumes are similar to this, about866 million cubic meters (Grovhoug et al., 2004). If the flow-weighted average selenium

Clean Estuary Partnership
Selenium in San Francisco Bay: Conceptual Model/Impairment Assessment – Final Report Page 21
concentration is 0.1 µg/L in a discharge volume of 900 million cubic meters, the selenium loadwould be 90 kg, a minor source compared to the riverine fluxes shown in Table 7. However, ifthe flow-weighted average concentration is 1 µg/L, the annual load for the same dischargevolume would be 900 kg, a load comparable load to the other sources shown in Table 7.
Accurate selenium concentration data for local tributaries and wastewater are sparse – typicaldetection limits are around 1 µg/L, and data are often “non-detect”. Wastewater seleniumconcentrations are largely a function of the selenium concentration in municipal drinking watersources (Santa Clara Valley Water District 1994). Given what is known about seleniumconcentrations in typical surface waters (e.g., the Sacramento River [see Table 6]), averageconcentrations in both runoff and effluent are more likely to be closer to 0.1 µg/L than 1 µg/L,but this is an uncertainty that leads to a management question: Are selenium concentrations inBay Area municipal water supply, effluent, urban, and non-urban streams closer to 0.1 µg/L or1.0 µg/L? This question is probably more relevant on local scales than Baywide.
Table 7. Selenium loading (kg/yr) to San Francisco Bay.Range of Loading Rates
(kg Se/yr)Source Sample Collection PeriodDissolvedSelenium
ParticulateSelenium
Riverine Fluxes of Seleniumfrom the Delta Nov, 1997 – Nov, 1999 282-9570a 47-686b
Oil Refinery Discharges Oct, 1999 – Aug, 2000 204-552c nrMunicipal Wastewater, LocalTributaries, and Urban Runoff See discussion above 90-900 (?) nr
a - Loading rates calculated using data from Cutter and Cutter (2004).b - Loading rates calculated using data from Cutter and Cutter (2004) and Doblin et al. (2005).c - Loading rates calculated using data from Cutter and Cutter (2004) and refinery effluent discharge rates provided
by the individual refineries.nr – not reported.
3.2.9 Initial Mass Inventory Calculations and ObservationsSome important conclusions become apparent from considering simple mass inventory and loadestimates for selenium. Unlike PCBs and mercury which are found almost exclusively insediments, selenium has a relatively low, variable partition coefficient (Kd between 100 and10,000), and about 80% of total selenium in the water column is dissolved. That means it needsto be modeled in two compartments: water and particulates/sediment (Figure 7).
Following established TMDL analysis methods for the Bay (Abu-Saba and Tang, 2000; Davis,2002; Looker and Johnson, 2003), the water inventory (1,250 kg) is estimated from the volumeof the Bay multiplied by the average dissolved selenium concentration as measured in the RMPdata set. The sediment selenium inventory (50,000 kg) is estimated as the mass of sediments inthe upper 15 cm times the average sediment selenium concentration measured in the RMP dataset. Selenium inputs to the dissolved box encompass the range of ‘best case’ to ‘worst case’ fromthe data in Table 7. Particulate selenium again encompasses the range from the ‘best case’ to
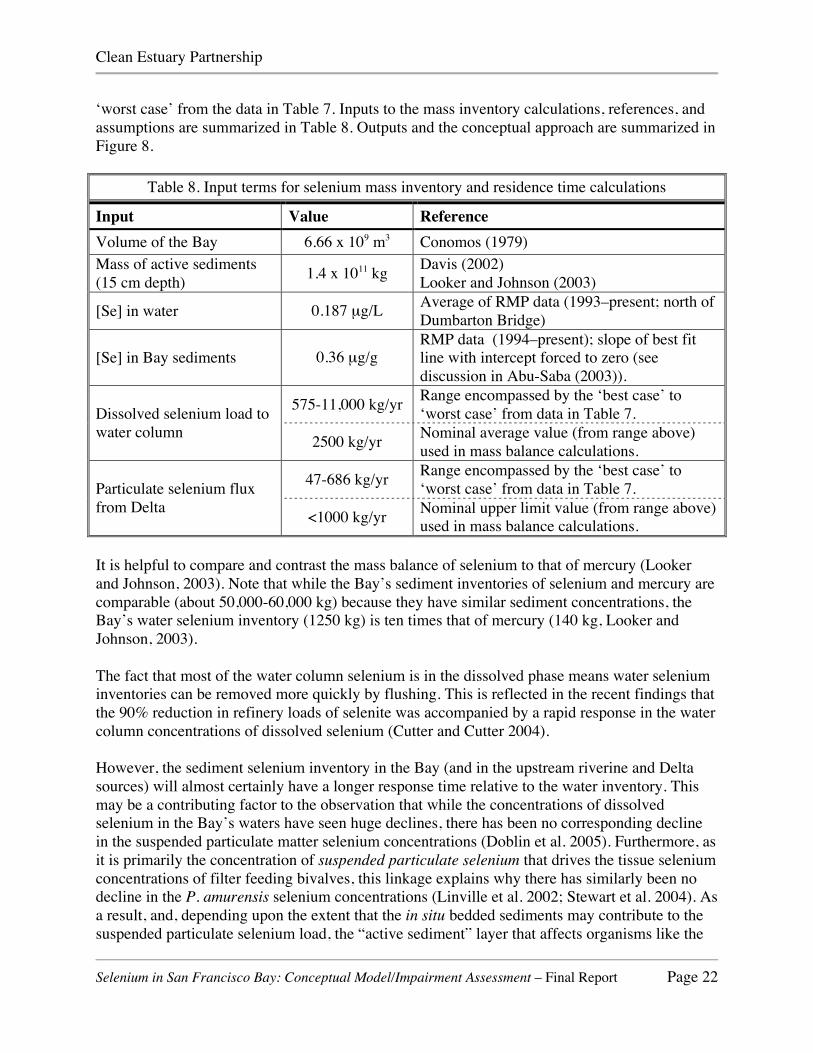
Clean Estuary Partnership
Selenium in San Francisco Bay: Conceptual Model/Impairment Assessment – Final Report Page 22
‘worst case’ from the data in Table 7. Inputs to the mass inventory calculations, references, andassumptions are summarized in Table 8. Outputs and the conceptual approach are summarized inFigure 8.
Table 8. Input terms for selenium mass inventory and residence time calculations
Input Value ReferenceVolume of the Bay 6.66 x 10⁹ m3 Conomos (1979)Mass of active sediments(15 cm depth) 1.4 x 10¹¹ kg Davis (2002)
Looker and Johnson (2003)
[Se] in water 0.187 µg/L Average of RMP data (1993–present; north ofDumbarton Bridge)
[Se] in Bay sediments 0.36 µg/gRMP data (1994–present); slope of best fitline with intercept forced to zero (seediscussion in Abu-Saba (2003)).
575-11,000 kg/yr Range encompassed by the ‘best case’ to‘worst case’ from data in Table 7.Dissolved selenium load to
water column 2500 kg/yr Nominal average value (from range above)used in mass balance calculations.
47-686 kg/yr Range encompassed by the ‘best case’ to‘worst case’ from data in Table 7.Particulate selenium flux
from Delta <1000 kg/yr Nominal upper limit value (from range above)used in mass balance calculations.
It is helpful to compare and contrast the mass balance of selenium to that of mercury (Lookerand Johnson, 2003). Note that while the Bay’s sediment inventories of selenium and mercury arecomparable (about 50,000-60,000 kg) because they have similar sediment concentrations, theBay’s water selenium inventory (1250 kg) is ten times that of mercury (140 kg, Looker andJohnson, 2003).
The fact that most of the water column selenium is in the dissolved phase means water seleniuminventories can be removed more quickly by flushing. This is reflected in the recent findings thatthe 90% reduction in refinery loads of selenite was accompanied by a rapid response in the watercolumn concentrations of dissolved selenium (Cutter and Cutter 2004).
However, the sediment selenium inventory in the Bay (and in the upstream riverine and Deltasources) will almost certainly have a longer response time relative to the water inventory. Thismay be a contributing factor to the observation that while the concentrations of dissolvedselenium in the Bay’s waters have seen huge declines, there has been no corresponding declinein the suspended particulate matter selenium concentrations (Doblin et al. 2005). Furthermore, asit is primarily the concentration of suspended particulate selenium that drives the tissue seleniumconcentrations of filter feeding bivalves, this linkage explains why there has similarly been nodecline in the P. amurensis selenium concentrations (Linville et al. 2002; Stewart et al. 2004). Asa result, and, depending upon the extent that the in situ bedded sediments may contribute to thesuspended particulate selenium load, the “active sediment” layer that affects organisms like the

Clean Estuary Partnership
Selenium in San Francisco Bay: Conceptual Model/Impairment Assessment – Final Report Page 23
clams may be much less than 15 cm. This would indicate a response time shorter than 50 years,though still longer than the water column. In addition, it is interesting to note that the RMP datasuggest that there was a “pulse” of elevated selenium in northern San Francisco Bay inSeptember of 1993 (Figure 13), that decreased to intermediate concentrations by February 1994,returning to “normal” levels thereafter (Figure 13), which is mirrored by a similar ‘pulse’ ofelevated selenium in the northern San Francisco Bay water column during this same period(Figure 11). This apparent rapid recovery of the northern San Francisco Bay sediment seleniumconcentrations suggests that the recovery rate for the sediment compartment may be muchgreater than is predicted by this simple model.
In summary, simple mass balance considerations help understand some general trends in theresponses of different indicators to management actions already initiated. To effectively manageselenium, we will have to look at finer scale spatial and temporal trends, and how selenium fateand effects are controlled by speciation and biological transformations.
Figure 7. Initial selenium mass balance for the Bay, using a two compartment model forthe Bay. The much shorter residence time (T = inventory / input) of selenium in water(0.5 year) compared to sediments (50 years or more) predicts a short response time forwater column indicators, but not necessarily for sediment. The sediment mass indicatesthe mass of sediments in the upper 15 cm of actively resuspended or reworked sedimentsfor the Bay, the water volume indicates volume of the Bay. Note that recent studiesindicate that the net flux of total selenium between sediments and the water column isrelatively negligible (see Table 4 in Meseck 2002), and this interchange is therefore notconsidered in this two-compartment model.
water
sediment
partition coefficient (Kd)
~ 1,250 kg
~ 50,000 kg Se
6.66 x 10⁹ m3 x 0.2 ppb Se
1.4 x 10¹¹ kg sed x 0.36 ppm Se
~ 2500 kg / yr
15cm
< 1000 kg/yr
T ~ 0.5 year
T ~ 50 years +
Clean Estuary Partnership
Selenium in San Francisco Bay: Conceptual Model/Impairment Assessment – Final Report Page 24
3.3 Selenium Cycling and BioaccumulationWhile dissolved selenium species can cause direct toxicity to aquatic organisms, the lethalthreshold concentrations (e.g., LC50 values) are typically much, much higher than the waterborneconcentrations seen in all but the most contaminated of ecosystems. This is one reason whyhistorical derivations of water quality criteria using the standard approach of evaluatingwaterborne toxicity data have arrived at such relatively high values (e.g., the most recentderivation of an acute criterion of selenite in saltwater [US EPA 2004] arrived at a concentration,many orders of magnitude higher than the concentrations measured in the San FranciscoEstuary’s ambient waters). As a result, the direct toxicity of waterborne selenium will not beaddressed in this CM/IA.
However, the reproductive and other health impairments that can result from bioaccumulation ofselenium up through the food chain can be a toxicity issue of ‘real world’ concern, as evident bythe DOHS health advisories and the observation of waterfowl and fish reproductive problems atKesterson and elsewhere.
Surface waters and effluent discharges that enter the Bay can convey selenium into the Bay’swaters in a variety of forms (Figure 8), including:
• Dissolved selenate and selenite,• Particulate elemental selenium,• Selenite adsorbed to inorganic or organic particulate material (selenate is much less prone
to adsorption),• Cellular organoselenium, either in living cells or in dead/senescing cells,• Dissolved organoselenides, typically the exometabolites of algae, but also the compounds
that results from the dissolution or release of former cellular material (i.e. cytosolicselenium) from dead/senescing cells.
The sources and loading of selenium into the Bay have been discussed previously. Dependingupon the residence time within the Bay’s waters, much of the selenium entering the Bay may beflushed out to the ocean without ever being taken up by or even interacting with the Bay’s biota.For instance, selenate is much less readily taken up by fungi, bacteria, and algae than is selenite(see below); at times of high flow, it might well be that much (if not most) of the selenate thatenters the Bay may pass through to the ocean without ever entering the bioaccumulation process.
3.3.1 The Bioaccumulation and Biotransformation of Dissolved SeleniumTraditional consideration of bioaccumulation, or trophic transfer, begins with the dissolvedcontaminant being taken up by primary producers (e.g. algae or phytoplankton) as the “base” ofthe food chain. However, it is important to note that microbial uptake (by fungi and bacteria) canoften be just as, or an even more important first step in the eventual bioaccumulation byconsumer organisms.
Moreover, it is the bacteria, fungi, and algae that will perform the most critical seleniumbiotransformation step: the reduction of selenite and selenate and incorporation of the reducedselenides into seleno-amino acids, particularly selenomethionine, an analog to the essentialamino acid methionine (due to its chemical similarity, the selenium is ‘mistakenly’ used in place
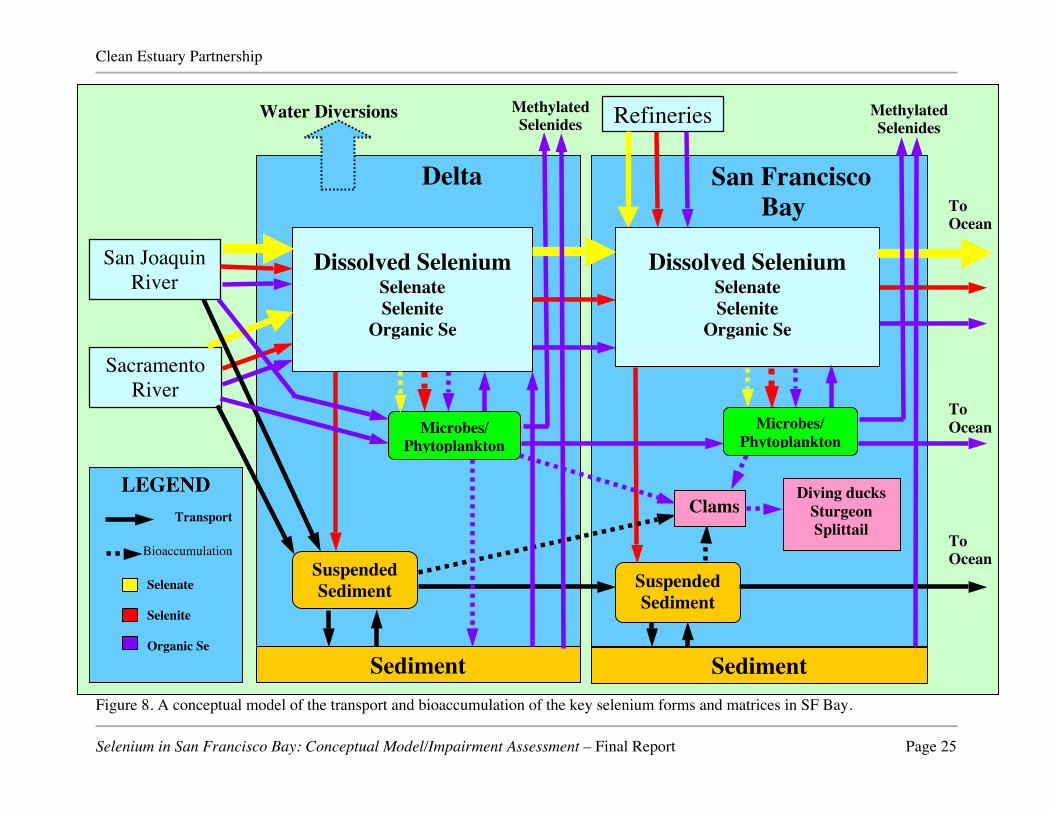
Clean Estuary Partnership
Selenium in San Francisco Bay: Conceptual Model/Impairment Assessment – Final Report Page 25
Figure 8. A conceptual model of the transport and bioaccumulation of the key selenium forms and matrices in SF Bay.
LEGENDTransport
Bioaccumulation
Selenate
Selenite
Organic Se
San FranciscoBay
Refineries
Dissolved SeleniumSelenateSelenite
Organic Se
Dissolved SeleniumSelenateSelenite
Organic Se
Microbes/Phytoplankton
Microbes/Phytoplankton
Diving ducksSturgeonSplittail
SuspendedSediment
SuspendedSediment
San JoaquinRiver
SacramentoRiver
Sediment Sediment
Water Diversions MethylatedSelenides
MethylatedSelenides
ToOcean
ToOcean
ToOcean
Clams
Delta
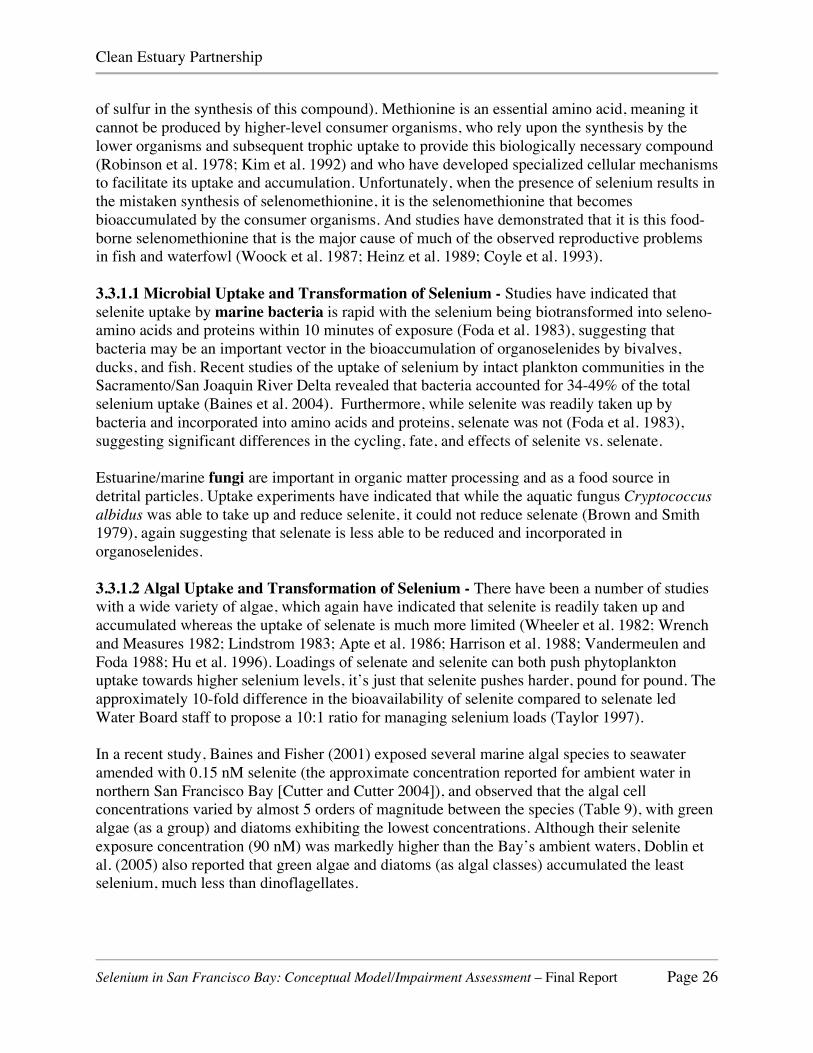
Clean Estuary Partnership
Selenium in San Francisco Bay: Conceptual Model/Impairment Assessment – Final Report Page 26
of sulfur in the synthesis of this compound). Methionine is an essential amino acid, meaning itcannot be produced by higher-level consumer organisms, who rely upon the synthesis by thelower organisms and subsequent trophic uptake to provide this biologically necessary compound(Robinson et al. 1978; Kim et al. 1992) and who have developed specialized cellular mechanismsto facilitate its uptake and accumulation. Unfortunately, when the presence of selenium results inthe mistaken synthesis of selenomethionine, it is the selenomethionine that becomesbioaccumulated by the consumer organisms. And studies have demonstrated that it is this food-borne selenomethionine that is the major cause of much of the observed reproductive problemsin fish and waterfowl (Woock et al. 1987; Heinz et al. 1989; Coyle et al. 1993).
3.3.1.1 Microbial Uptake and Transformation of Selenium - Studies have indicated thatselenite uptake by marine bacteria is rapid with the selenium being biotransformed into seleno-amino acids and proteins within 10 minutes of exposure (Foda et al. 1983), suggesting thatbacteria may be an important vector in the bioaccumulation of organoselenides by bivalves,ducks, and fish. Recent studies of the uptake of selenium by intact plankton communities in theSacramento/San Joaquin River Delta revealed that bacteria accounted for 34-49% of the totalselenium uptake (Baines et al. 2004). Furthermore, while selenite was readily taken up bybacteria and incorporated into amino acids and proteins, selenate was not (Foda et al. 1983),suggesting significant differences in the cycling, fate, and effects of selenite vs. selenate.
Estuarine/marine fungi are important in organic matter processing and as a food source indetrital particles. Uptake experiments have indicated that while the aquatic fungus Cryptococcusalbidus was able to take up and reduce selenite, it could not reduce selenate (Brown and Smith1979), again suggesting that selenate is less able to be reduced and incorporated inorganoselenides.
3.3.1.2 Algal Uptake and Transformation of Selenium - There have been a number of studieswith a wide variety of algae, which again have indicated that selenite is readily taken up andaccumulated whereas the uptake of selenate is much more limited (Wheeler et al. 1982; Wrenchand Measures 1982; Lindstrom 1983; Apte et al. 1986; Harrison et al. 1988; Vandermeulen andFoda 1988; Hu et al. 1996). Loadings of selenate and selenite can both push phytoplanktonuptake towards higher selenium levels, it’s just that selenite pushes harder, pound for pound. Theapproximately 10-fold difference in the bioavailability of selenite compared to selenate ledWater Board staff to propose a 10:1 ratio for managing selenium loads (Taylor 1997).
In a recent study, Baines and Fisher (2001) exposed several marine algal species to seawateramended with 0.15 nM selenite (the approximate concentration reported for ambient water innorthern San Francisco Bay [Cutter and Cutter 2004]), and observed that the algal cellconcentrations varied by almost 5 orders of magnitude between the species (Table 9), with greenalgae (as a group) and diatoms exhibiting the lowest concentrations. Although their seleniteexposure concentration (90 nM) was markedly higher than the Bay’s ambient waters, Doblin etal. (2005) also reported that green algae and diatoms (as algal classes) accumulated the leastselenium, much less than dinoflagellates.
Clean Estuary Partnership
Selenium in San Francisco Bay: Conceptual Model/Impairment Assessment – Final Report Page 27
Table 9. Cellular selenium concentration (ng/µm3) for marine algae exposed to 0.15 nM selenite.
Taxonomic Class Algal Species Cellular Se Concentration(ng/µm3)
Bacillariophyceae (diatoms) Skeletonema costatum 4.95 x 10⁻¹³
Chlorophyceae (green algae) Chlorella autotrophica 4.73 x 10⁻¹¹
Chlorophyceae (green algae) Nannochloris atomus 5.46 x 10⁻¹¹
Chlorophyceae (green algae) Dunaliella tertiolecta 1.21 x 10⁻¹⁰
Bacillariophyceae (diatoms) Chaetoceros gracilis 3.31 x 10⁻¹⁰
Bacillariophyceae (diatoms) Thalassiosira pseudonana 1.09 x 10⁻⁹
Dinophyceae (dinoflagellates) Prorocentrum minimum 3.08 x 10⁻⁹
Cryptophyceae (golden brown algae) Cryptomonas sp. 4.90 x 10⁻⁹
Prymnesiophyceae Emiliania huxleyi 3.37 x 10⁻⁸
From: Baines and Fisher (2001).
Furthermore, more detailed studies with the diatom Thalassiosira pseudonana indicated asaturation of selenium accumulation in cells at selenite concentrations between 0.1 to 10 nMselenite (Baines and Fisher 2001); similar results were observed for other algal species (exceptfor Skeletonema): the selenium concentrations of the algal cells did not vary in proportion toselenite concentrations but remained almost constant over a 30-fold variation in ambient selenitefrom 0.15 to 4.5 nM, suggesting that the algal tissue concentrations of selenium in San FranciscoBay are less responsive to changes in the Bay’s ambient water selenium concentrations thanmight otherwise have been expected (Baines and Fisher 2001).
Studies with the marine algae Tetraselmis tetrahele and Dunaliella minuta reported that selenitewas readily biotransformed into seleno-amino acids (Wrench 1978); similar results have alsobeen reported for many other marine algal species (Wrench and Campbell 1981; Bottino et al.1984; Vandermeulen and Foda 1988; Boisson et al. 1995). While much (if not most) of thisbiotransformed organoselenium is retained within the cellular tissues and eventually ingested byconsumer organisms, studies have indicated that live and dead algae will release organoselenidesback into the water (Vandermeulen and Foda 1988; Fisher and Wente 1993; Besser et al. 1994;Hu et al. 1996); whether or not these released organoselenides re-enter the food chain isuncertain as there are conflicting reports regarding their apparent bioavailability and uptake(Cutter and Bruland 1984; Cutter and Cutter 1998; Baines et al. 2001).
3.3.2 The Bioaccumulation of Selenium by InvertebratesIt has long been recognized that assimilation of ingested selenium (i.e., from the diet) is theprimary mechanism for bioaccumulation of selenium by invertebrates (Fowler and Benayoun1976; Sanders and Gilmour 1994; Zhang et al. 1990; Luoma et al. 1992; Wang et al. 1996; Ogle1996; Wang and Fisher 1999).

Clean Estuary Partnership
Selenium in San Francisco Bay: Conceptual Model/Impairment Assessment – Final Report Page 28
3.3.2.1 Selenium Bioaccumulation by Zooplankton - Again, traditional analysis of food chainbioaccumulation by invertebrates would focus upon the transfer from phytoplankton tozooplankton. And certainly, zooplankton are a critical component of the Bay’s food web. In astudy of assimilation efficiency of dietary trace elements by zooplankton, the diatomThallasiosira pseudonana was cultured in radio-labeled selenium and then fed to copepods(Fisher and Reinfelder 1991; Reinfelder and Fisher 1991); it was observed that the assimilationof selenium was 97%, the highest of all the trace elements examined, and that the assimilationwas related directly to the amount of selenium in the algal cell cytoplasm. Similar studies feedingThalassiosira to planktonic oyster larvae (Crassostrea gigas) observed that none of the diatom’sselenium was assimilated, presumably due to the inability of the oyster larvae to open thediatom’s silaceous shell (Reinfelder and Fisher 1994); however feeding the alga Isochrysisgalbana to planktonic oyster and clam larvae resulted in similarly high assimilation efficienciesof 97-100% (Reinfelder and Fisher 1994), again related directly to the amount of selenium in thealgal cell cytoplasm.
However, although efficient at assimilating selenium, zooplankton do not appear to accumulateselenium to concentrations much higher than present in their microbial/algal diet (Baines et al.2002) perhaps due to their relatively high excretion rate of the assimilated selenium (Wang andFisher 1998; Xu et al. 2001). Recent studies of selenium in San Francisco Bay zooplanktonreported that the zooplankton tissue concentrations were generally similar to those found in other“uncontaminated “ systems and generally without any spatial trends in the Bay (Purkerson et al.2003) although the observation of markedly higher concentrations in the Fall of 1999 thatcoincided with a peak concentration in particulate selenium suggests that zooplankton in the Baymay be subject to occasional increases in selenium content.
3.3.2.2 Selenium Bioaccumulation by Bivalves - Bivalves have been shown to similarly exhibitextremely high assimilation rates for ingested (i.e., “particulate”) selenium (Zhang et al. 1990;Luoma et al. 1992; Wang et al. 1995; Reinfelder et al. 1998) with relatively negligible absorptionefficiency of dissolved selenium from water (Luoma et al. 1992; Reinfelder et al. 1997; Wang2001). However, unlike zooplankton, the bivalves have been observed to accumulate theingested selenium to concentrations markedly higher than present in the microbial/algal diet(Reinfelder et al. 1998), in part due to their high assimilation rates of the cytosolic selenium, butalso to their relatively low excretion rates (Reinfelder et al. 1997; Schlekat et al. 2000).
This difference is most dramatic in the Asian clam Potamocorbula amurensis, an exotic speciesthat invaded San Francisco Bay in the mid 1980’s and has since become the dominant benthicorganism in much of the bay (Carlton et al. 1990); P. amurensis accumulates selenium to muchhigher concentrations (e.g., 6-20 µg/g, dry wt [Linville et al. 2002]) than were observed forbivalves from other uncontaminated estuaries in northern California (1.7-3.1 µg/g [White et al.1988]) or for the bivalves previously common in these waters (10-11.4 µg/g for Mytilus edulistransplanted into the Carquinez Strait [Risebrough et al. 1977] or 3.9-5.2 µg/g for Macomabalthica and Corbicula fluminea in Suisun Bay up to the mouth of the Carquinez Strait [Johns etal. 1988]).
Interestingly, while the concentrations of total dissolved selenium, and more importantly, ofselenite, declined dramatically in the late 1990’s (see previous discussion in Sections 3.2.1 and
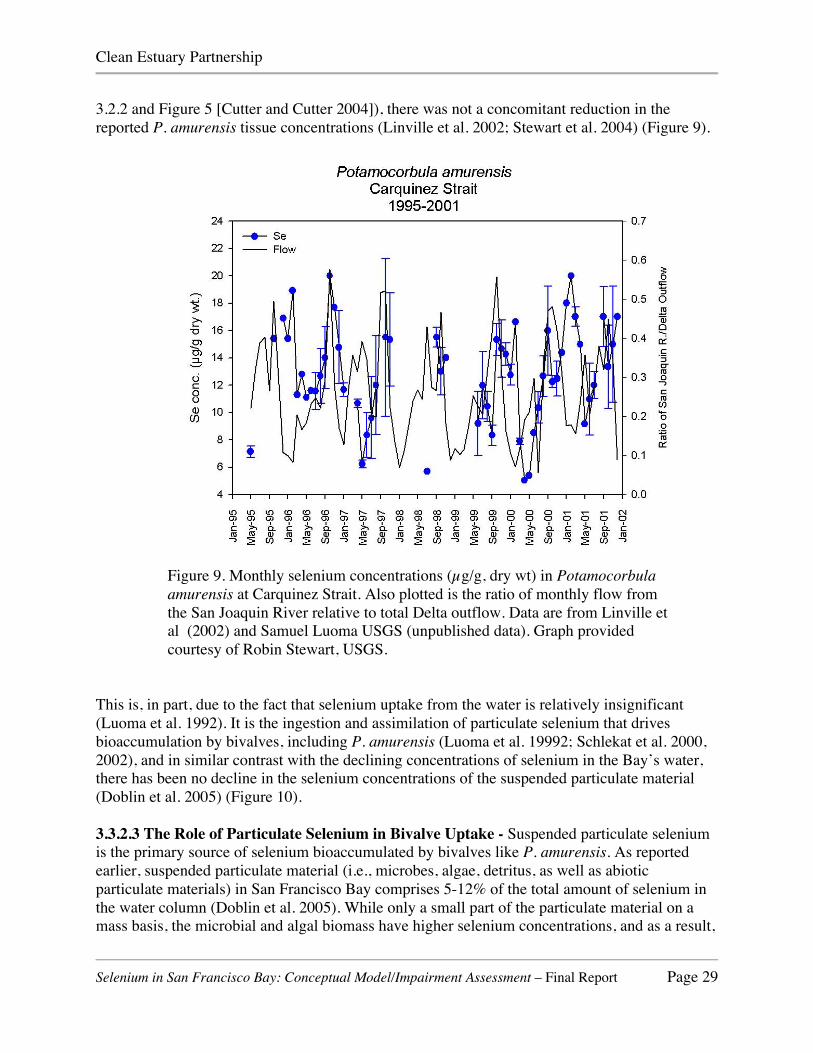
Clean Estuary Partnership
Selenium in San Francisco Bay: Conceptual Model/Impairment Assessment – Final Report Page 29
3.2.2 and Figure 5 [Cutter and Cutter 2004]), there was not a concomitant reduction in thereported P. amurensis tissue concentrations (Linville et al. 2002; Stewart et al. 2004) (Figure 9).
Figure 9. Monthly selenium concentrations (µg/g, dry wt) in Potamocorbulaamurensis at Carquinez Strait. Also plotted is the ratio of monthly flow fromthe San Joaquin River relative to total Delta outflow. Data are from Linville etal (2002) and Samuel Luoma USGS (unpublished data). Graph providedcourtesy of Robin Stewart, USGS.
This is, in part, due to the fact that selenium uptake from the water is relatively insignificant(Luoma et al. 1992). It is the ingestion and assimilation of particulate selenium that drivesbioaccumulation by bivalves, including P. amurensis (Luoma et al. 19992; Schlekat et al. 2000,2002), and in similar contrast with the declining concentrations of selenium in the Bay’s water,there has been no decline in the selenium concentrations of the suspended particulate material(Doblin et al. 2005) (Figure 10).
3.3.2.3 The Role of Particulate Selenium in Bivalve Uptake - Suspended particulate seleniumis the primary source of selenium bioaccumulated by bivalves like P. amurensis. As reportedearlier, suspended particulate material (i.e., microbes, algae, detritus, as well as abioticparticulate materials) in San Francisco Bay comprises 5-12% of the total amount of selenium inthe water column (Doblin et al. 2005). While only a small part of the particulate material on amass basis, the microbial and algal biomass have higher selenium concentrations, and as a result,

Clean Estuary Partnership
Selenium in San Francisco Bay: Conceptual Model/Impairment Assessment – Final Report Page 30
organic selenium is typically the largest fraction of the particulate selenium, ~45% of the total onaverage. elemental selenium (which can comprise most of the particulate selenium in highflows), and adsorbed selenite(+selenate). Moreover, microbial and algal selenium exhibitextremely high assimilation rates by bivalves (Zhang et al. 1990; Luoma et al. 1992; Wang etal.1995; Reinfelder et al. 1997,1998). Elemental selenium and particle-bound selenite, on theother hand, have much lower assimilation rates (typically <10% [Schlekat et al. 2000]).
0
0.1
0.2
0.3
0.4
0.5
0.6
0.7
0.8
Historic(1986)
1998-99 Historic(1986)
1998-99 SacramentoRiver
San JoaquinRiver
Part
icul
ate S
e Con
cent
ratio
n (m
g/kg
, dry
wt)
High Flow Conditions
Low Flow Conditions
All Flow Conditions
Northern San Francisco Bay
Suspended particulate selenium concentrations have remained unchanged
1998-99
Figure 10. Suspended particulate selenium concentration in northern SanFrancisco Bay have remained unchanged, despite the significant declines indissolved selenium concentrations (from Doblin et al. 2004).
Given the number of variables that go into determining suspended particulate selenium levels, itwould not necessarily be assumed that there should be a direct correlation between dissolvedselenium and particulate selenium. However, given the magnitude of the decline in dissolvedselenium over the past 20 years, it seems like that there should have been some measurablechange in particulate selenium … however, none was observed (Figure 10). This, of course.raises the question:
“Why hasn’t the selenium concentration of suspended particulates (andthe corresponding selenium concentration in the bivalve P. amurensis)declined in response to the declines in dissolved selenium in the Bay?”
It has already been indicated that the upstream riverine and Delta sediments are a major source ofthe suspended particulate selenium. Recent analyses have indicated that the Delta sedimentselenium concentrations are actually higher than those in the northern reach of the Bay, and
Clean Estuary Partnership
Selenium in San Francisco Bay: Conceptual Model/Impairment Assessment – Final Report Page 31
sediment cores in the Delta indicated that the selenium concentrations were generally constantwith depth (Meseck 2002). This, combined with the consistency of the dissolved seleniumchemistry and speciation in the Sacramento River suggests that the reservoir of upstreamsediments provides a steady supply of particulate material to the northern reach of San FranciscoBay with consistent concentrations of selenium that will be independent of the Bay’s dissolvedselenium concentrations, and therefore, unaffected by the reductions in selenium that wererequired of the oil refineries.
The absence of any reduction in particulate selenium might also be explained by the seleniumuptake of the phytoplankton component. As reported earlier, algal uptake studies have indicatedthat the algal selenium concentrations did not vary in proportion to selenite concentrations butremained almost constant over a 30-fold variation in ambient selenite, from 0.15 to 4.5 nM(Baines and Fisher 2001). Again, this suggests that algal selenium bioaccumulation is relativelyindependent of the Bay’s dissolved selenium concentrations (at the range of concentrations thathave been observed in the Bay), and therefore, unaffected by the reductions in selenium thatwere required of the oil refineries.
Interestingly, since the introduction of P. amurensis, there has been a significant decrease in theamount of phytoplankton in the Bay’s waters (Carlton et al. 1990; Alpine and Cloern 1992),which again would suggest that there should have been a proportionate decline in thephytoplankton component of the particulate selenium. However, Lehman (2000) reported thatthere has also been a significant shift in the phytoplankton community in northern San FranciscoBay with a 60% decrease in diatoms and corresponding increase in green, blue-green, andflagellated algae. As stated above, recent algal uptake studies have indicated that diatoms tend toaccumulate less selenium than do other algae (Table 9) (Baines and Fisher 2001; also see Table22 in Doblin et al. 2004). This suggests that the current phytoplankton fraction of the suspendedparticulate material will exhibit greater selenium bioaccumulation than before, which could serveto offset the reduction in algal biomass in terms of maintaining consistent particulate seleniumconcentrations.
3.3.3 Selenium Bioaccumulation by Fish and WaterfowlGiven that the benthic bivalve Potamocorbula amurensis tissue selenium concentrations can beso elevated, it is not surprising that the higher trophic level organisms that eat these bivalves will,in turn, exhibit elevated tissue selenium concentrations. In fact, the elevated tissue concentrationsof selenium in the Greater Scaup and Surf Scoter that triggered the initial health advisories whichled to the current 303(d) listing almost certainly reflect the fact that clams are important fooditems for these diving duck (Ohlendorf et al. 1986; Fan and Book 1986). Similarly, P. amurensisis a dominant food item for white sturgeon and mature Sacramento splittail (Feyrer et al. 2003;Stewart et al. 2004), which are the Bay fish species exhibiting the highest tissue seleniumconcentrations (Stewart et al. 2004).
In contrast, fish that feed primarily upon the planktonic food chain (i.e., such as juvenile stripedbass feeding on zooplankton and other water column organisms) do not exhibit similarlyelevated tissue selenium concentrations (Baines et al. 2002; Schlekat et al. 2002; Purkerson et al.20033; Stewart et al. 2004).

Clean Estuary Partnership
Selenium in San Francisco Bay: Conceptual Model/Impairment Assessment – Final Report Page 32
4. Impairment Assessment: Current Conditions4.1 Compliance with Water/Sediment Quality Objectives4.1.1 Compliance with Water Quality ObjectivesThe RMP has monitored water chemistry in San Francisco Bay since 1993. The results of theanalyses of selenium in San Francisco Bay ambient waters are summarized in Figures 11 and 12.Numerical water quality objectives for selenium for the protection of aquatic life have beenestablished by the U.S. EPA and the California Toxics Rule (CTR) (Table 10). Examination ofthe RMP waterborne selenium concentrations reveals that there have been no exceedances of theEPA and CTR criteria; indeed, the ambient concentrations of selenium in the Bay’s waters aretypically orders of magnitude below the criteria levels.
Table 10. Water quality criteria for seleniumAcute Criteria Chronic CriteriaRegulating Agency
Freshwater Saltwater Freshwater ChronicU.S. EPA 1987 20 ng/La 300 µg/Lb 5 ng/La 71 ng/Lb
Chronic: Whole-body fish tissueU.S. EPA 2004 (draft) 258 µg/Lc
417 µg/Ld 127 µg/Lc
7.91 µg/g, dry wtCalifornia Toxics Rule 20 µg/L 290 µg/L 5 µg/L 5 µg/L
a - 1-hr average, not to be exceeded more than once every 3 years.b - 4-day average, not to be exceeded more than once every 3 years.c – selenite.d – selenate; the selenate criterion is mediated by the sulfate concentration (the shown numerical value of 417 µg/Lis based upon a sulfate concentration of 100 mg/L).
However, it is difficult to interpret the RMP waterborne selenium data and achieve anymeaningful evaluation of impairment. As stated before, the lethal threshold concentrations (i.e.LC50 values) are typically much, much higher than the waterborne concentrations seen in all butthe most contaminated of ecosystems. This is one reason why historical derivations of waterquality criteria using the standard evaluation of waterborne toxicity data have arrived at suchrelatively high values, many orders of magnitude higher than the concentrations measured in theBay’s ambient waters).
4.1.2 Compliance with Sediment Quality ObjectivesThere are no existing sediment criteria for selenium, nor any existing sediment quality guidelinessuch as ERLs and ERMs. US FWS selenium experts have established 4 µg/g, dry wt, as themaximum allowable selenium concentration in their guidance for TMDLs (Lemly 2000). TheRMP sediment selenium concentration data indicate that the sediment concentrations in the Bayare typically much lower than this guidance threshold, including the worst-case data observed1993 (Figure 13).

Clean Estuary Partnership
Selenium in San Francisco Bay: Conceptual Model/Impairment Assessment – Final Report Page 33
Figure 11. Ambient water selenium concentrations in northern San Francisco Bay. Data are fromRMP (http://www.sfei.org/rmp/data.htm).
0.00
0.10
0.20
0.30
0.40
0.50
0.60
Mar-93
Jul-9
3
Nov-93
Mar-94
Jul-9
4
Nov-94
Mar-95
Jul-9
5
Nov-95
Mar-96
Jul-9
6
Nov-96
Mar-97
Jul-9
7
Nov-97
Mar-98
Jul-9
8
Nov-98
Mar-99
Jul-9
9
Nov-99
Mar-00
Jul-0
0
Nov-00
Mar-01
Jul-0
1
Sample Date
Tota
l Se (
µg/L
)
San Pablo BayPinole PointDavis PointNapa RiverPacheco CreekGrizzly BayHonker BaySacramento RiverSan Joaquin River
[Total Se] in Ambient Waters ofNorthern San Francisco Bay
0.00
0.05
0.10
0.15
0.20
0.25
0.30
0.35
0.40
0.45
0.50
Mar-93
Jul-9
3
Nov-93
Mar-94
Jul-9
4
Nov-94
Mar-95
Jul-9
5
Nov-95
Mar-96
Jul-9
6
Nov-96
Mar-97
Jul-9
7
Nov-97
Mar-98
Jul-9
8
Nov-98
Mar-99
Jul-9
9
Nov-99
Mar-00
Jul-0
0
Nov-00
Mar-01
Jul-0
1
Diss
olve
d Se
(µg/
L)San Pablo BayPinole PointDavis PointNapa RiverPacheco CreekGrizzly BayHonker BaySacramento RiverSan Joaquin River
``
[Dissolved Se] in Ambient Watersof Northern San Francisco Bay
Clean Estuary Partnership
Selenium in San Francisco Bay: Conceptual Model/Impairment Assessment – Final Report Page 34
Figure 12. Ambient water selenium concentrations in South San Francisco Bay. Data are fromRMP (http://www.sfei.org/rmp/data.htm).
0.00
0.20
0.40
0.60
0.80
1.00
1.20
Mar-93
Jul-9
3
Nov-93
Mar-94
Jul-9
4
Nov-94
Mar-95
Jul-9
5
Nov-95
Mar-96
Jul-9
6
Nov-96
Mar-97
Jul-9
7
Nov-97
Mar-98
Jul-9
8
Nov-98
Mar-99
Jul-9
9
Nov-99
Mar-00
Jul-0
0
Nov-00
Mar-01
Jul-0
1
Diss
olve
d Se
(µg/
L)
Redwood CreekDumbarton BridgeSouth BayCoyote Creek
[Dissolved Se] in Ambient Watersof South San Francisco Bay
0.00
0.20
0.40
0.60
0.80
1.00
1.20
Mar-93Jul-9
3Nov-93
Mar-94Jul-9
4Nov-94
Mar-95Jul-9
5Nov-95
Mar-96Jul-9
6Nov-96
Mar-97Jul-9
7Nov-97
Mar-98Jul-9
8Nov-98
Mar-99Jul-9
9Nov-99
Mar-00Jul-0
0Nov-00
Mar-01Jul-0
1
Sample Date
Tota
l Se (
µg/L
)
Redwood CreekDumbarton BridgeSouth BayCoyote Creek
[Total Se] in Ambient Watersof South San Francisco Bay
Clean Estuary Partnership
Selenium in San Francisco Bay: Conceptual Model/Impairment Assessment – Final Report Page 35
0.00
0.50
1.00
1.50
2.00
2.50
3.00
3.50
Mar-93
Jul-9
3
Nov-93
Mar-94
Jul-9
4
Nov-94
Mar-95
Jul-9
5
Nov-95
Mar-96
Jul-9
6
Nov-96
Mar-97
Jul-9
7
Nov-97
Mar-98
Jul-9
8
Nov-98
Mar-99
Jul-9
9
Nov-99
Mar-00
Jul-0
0
Nov-00
Mar-01
Jul-0
1
Sedi
men
t Sel
eniu
m C
once
ntra
tion
(mg/
kg, d
ry w
t)
San Pablo BayPinole PointDavis PointNapa RiverGrizzly BayPacheco CreekHonker BaySacramento RiverSan Joaquin River
[Total Se] in NorthernSan Francisco BaySediments
Figure 13. Ambient sediment selenium concentrations in Northern and South San Francisco Bay.Data are from RMP (http://www.sfei.org/rmp/data.htm).
0.00
0.20
0.40
0.60
0.80
1.00
1.20
1.40
Mar-93
Jul-9
3
Nov-93
Mar-94
Jul-9
4
Nov-94
Mar-95
Jul-9
5
Nov-95
Mar-96
Jul-9
6
Nov-96
Mar-97
Jul-9
7
Nov-97
Mar-98
Jul-9
8
Nov-98
Mar-99
Jul-9
9
Nov-99
Mar-00
Jul-0
0
Nov-00
Mar-01
Jul-0
1
Sample Date
Sedi
men
t Se (
mg/
kg, d
ry w
t)
Redwood CreekDumbarton BridgeSouth BayCoyote Creek
[Total Se] in South San Francico Bay Sediments
Clean Estuary Partnership
Selenium in San Francisco Bay: Conceptual Model/Impairment Assessment – Final Report Page 36
4.2 Health Advisory Against Consumption of Bay OrganismsThe CA DOHS has provided the following health advisory warning for inclusion in the CA DFG2004 Waterfowl Hunting Guidelines (personal communication: Dr. Margy Gassel, OEHHA):
“The California Environmental Protection Agency’s Office of EnvironmentalHealth Hazard Assessment (OEHHA) determines whether a public health hazardmay exist from consumption of waterfowl taken from certain locations inCalifornia based on laboratory testing data. The following advisories have beenissued. The guidelines are based on risk estimates that assume long-termconsumption; thus, occasional intake of duck meat slightly above therecommended quantitative limits is not expected to produce a health hazard.
Suisun Bay (Contra Costa and Solano Counties)Because of elevated selenium levels, no one should eat more than 4 oz. per weekof (greater and lesser) scaup meat, or more than 4 oz. of scoter meat in any 2week period. No one should eat livers of duck from the area.
San Pablo Bay (Contra Costa, Marin, Solano, Sonoma Counties)Because of elevated selenium levels, no one should eat more than 4 oz. per weekof Greater Scaup meat, or more than 4 oz. of scoter meat in any 2-week periodfrom the Bay. No one should eat livers of duck from the area.
San Francisco Bay (Alameda, Contra Costa, Marin, San Francisco,San Mateo, Santa Clara Counties)Because of elevated selenium levels, no one should eat more than 4 oz. per weekof Greater Scaup meat from the Central Bay, or more than 4 oz. of Greater Scaupmeat from the South Bay in any 2-week period. No one should eat livers of duckfrom the area”.
4.3 Bay Protection and Toxic Cleanup Program SitesThe following 5 sites were placed on the 2002 303(d) list for selenium, presumably because theywere BPTCP Category IV Sites:
Castro Cove – Selenium was identified as a contaminant of concern for Castro Cove as themeasured sediment concentration exceeded the BPTCP 90th percentile value of 1.09 mg/kg andthere was sediment toxicity to amphipods and sediment porewater toxicity to urchin embryos(Hunt et al. 1998). It is important to note that:
there was no causal relationship established between the observed sediment toxicity andselenium,
there were 11 other contaminants in this sediment that exceeded the ERM sedimentquality risk threshold, and the sediment exhibited an ERM quotient of 2.25 (indicative of ahigh potential for toxicity due to one or more of these 11 other contaminants),
The reported sediment selenium concentration of 2.03 mg/kg is less than the TMDLguidance maximum acceptable concentration of 4.0 mg/L established by USFWS

Clean Estuary Partnership
Selenium in San Francisco Bay: Conceptual Model/Impairment Assessment – Final Report Page 37
selenium experts (Lemly 2000).
Furthermore, the Castro Cove pollution problem is being remediated.
San Leandro Bay - Selenium was identified as a contaminant of concern for San Leandro Bayas the measured sediment concentration exceeded the BPTCP 90th percentile value of 1.09 mg/kgand there was sediment toxicity to amphipods (there was no sediment porewater toxicity tourchin embryos) (Hunt et al. 1998). It is important to note that:
there was no causal relationship established between the observed sediment toxicity andselenium.
there were 10 other contaminants in this sediment that exceeded the ERM sedimentquality risk threshold, and the sediment exhibited an ERM quotient of 1.52 (indicativeof a high potential for toxicity due to one or more of these 10 other contaminants).
The reported sediment selenium concentration of 2.83 mg/kg is less than the TMDLguidance maximum acceptable concentration of 4.0 mg/L established by USFWSselenium experts (Lemly 2000).
Inner Oakland Harbor - Pacific Dry Dock – It is unclear why this site was listed forimpairment due to selenium, as it was not identified as having elevated selenium concentrationsby the BPTCP (Hunt et al. 1988). Furthermore, the initial indication of sediment toxicity toamphipods (there was no sediment porewater toxicity to urchins) at this site was compromiseddue to the observation of sulfide levels that exceeded the toxicity threshold. In addition, it isimportant to note that there was no causal relationship established between the observedsediment toxicity and selenium. In fact, there were 9 other contaminants in this sediment thatexceeded the ERM sediment quality risk threshold, and the sediment exhibited an ERM quotientof 1.27 (indicative of a high potential for toxicity due to one or more of these 9 othercontaminants).
Similarly, there was no causal relationship established between the observed sediment toxicity ofthe second sediment sample collected at this site and selenium. In fact, there were 22 othercontaminants in the second sediment sample that exceeded the ERM sediment quality riskthreshold, and the sediment exhibited an ERM quotient of 3.94 (indicative of a very highpotential for toxicity due to one or more of these 22 other contaminants).
Inner Oakland Harbor – Fruitvale - It is unclear why this site was listed for impairment due toselenium, as it was not identified as having elevated selenium concentrations by the BPTCP(Hunt et al. 1988). Furthermore, the initial indication of sediment toxicity to amphipods (therewas no sediment porewater toxicity to urchins) at this site was compromised due to theobservation of sulfide levels that exceeded the toxicity threshold. In addition, it is important tonote that there was no causal relationship established between the observed sediment toxicity andselenium.
Similarly, there was no causal relationship established between the observed sediment toxicity toamphipods (again, no toxicity to urchins) of the second sediment sample collected at this site andselenium. Furthermore, the indication of sediment toxicity to amphipods for the second samplecollected at this site was even more compromised due to the observation of sulfide levels that

Clean Estuary Partnership
Selenium in San Francisco Bay: Conceptual Model/Impairment Assessment – Final Report Page 38
exceeded the toxicity threshold and ammonia levels that were more than 5-fold greater than thetoxicity threshold.
Central Basin - It is unclear why this site was listed for impairment due to selenium, as it wasnot identified as having elevated selenium concentrations by the BPTCP (Hunt et al. 1988).Furthermore, the initial indication of sediment porewater toxicity to urchins (there was nosediment toxicity to amphipods) at this site was compromised due to the observation of ammonialevels that exceeded the toxicity threshold. In addition, it is important to note that there was nocausal relationship established between the observed sediment toxicity and selenium. In fact,there were 8 other contaminants in this sediment that exceeded the ERM sediment quality riskthreshold.
4.3.1 Is Selenium Impairing the BPTCP Sites?There is no indication that selenium is causing or contributing to any toxicity problems at theseBTCP sites. In addition to the observations noted above, it is important to note that the reportedacute LC50 for selenium toxicity to bivalve embryos (analogous to the BPTCP urchin embryos)is >10,000 µg/L (US EPA 2002), more than four orders of magnitude greater than theconcentrations observed in the Bay’s ambient waters. Similarly, the acute LC50 for the mostsensitive crustacean (analogous to the sediment amphipod) is 600 µg/L (US EPA 2002), againmultiple orders of magnitude greater than could reasonably be expected in Bay sedimentporewaters. These toxicity data indicate that it is very unlikely that selenium is responsible forthe toxicity that was observed at these sites.
4.4 Conclusion: Is Selenium Impairing San Francisco Bay?Any assessment of impairment of the Bay’s waters will by necessity be based upon a “weight ofevidence” approach, with review and evaluation of all available relevant information. The CleanEstuary Partnership has proposed a set of potential conclusions and outcomes of impairmentassessment that reflects the State’s 303(d)-listing policy categorizations (Table 11). Based uponthis current review of available information, it is this study’s conclusion that:
There is possible impairment of the Bay by selenium – The continued presence of ahealth advisory against the consumption of diving ducks in San Francisco Bay clearlymeets the State Board’s Category 4 classification that selenium does impair one ormore of the beneficial uses of San Francisco Bay. However, there are someuncertainties that must be addressed with additional studies (see Section 5). As a result,it must be concluded that there is possible impairment of San Francisco Bay byselenium.
BPTCP Toxicity: Based upon the overwhelming weight-of-evidence presented inSection 4.3 above, it is concluded that selenium is not impairing the BPTCP sites thatwere added to the 303(d) list in 2002, and “de-listing” these sites for impairment byselenium is warranted.

Clean Estuary Partnership
Selenium in San Francisco Bay: Conceptual Model/Impairment Assessment – Final Report Page 39
Table 11. Characterizations of the impairment of San Francisco BayClean Estuary Partnership Classification State 303(d) Listing Policy Categoriesa
No Impairment – The available data aresufficient to unequivocally demonstrate thatthere are no negative effect(s) on the Bay’sbeneficial uses caused by selenium.
Category 1. Attaining the water qualitystandard and no use is threatened.
Impairment Unlikely – The available dataindicate no negative effect(s) on beneficial usesof the Bay, however, there is some uncertaintydue to lack of sufficient information ordisagreement about how to interpret that data.
Category 2. Attaining some of the beneficialuses; no use is threatened; and insufficient orno data and information is available todetermine if the remaining uses are attained orthreatened.
Unable to Determine Impairment – There isinsufficient information to make anydetermination.
Category 3. Insufficient or no data andinformation to determine if any designated useis attained.
Possible Impairment – The available datasuggest that there may be impairment of theBay’s beneficial uses caused by selenium,however there are some uncertainties that mustbe addressed with additional studies.
Category 4. One or more beneficial uses arethreatened, but the development of a TMDL isnot required.
Definite Impairment – The available data aresufficient to clearly demonstrate that there arenegative effect(s) on the Bay’s beneficial usescaused by selenium.
Category 5. The water quality standard is notattained.
a – SWRCB 2003.

Clean Estuary Partnership
Selenium in San Francisco Bay: Conceptual Model/Impairment Assessment – Final Report Page 40
5. Uncertainties and Data Gaps5.1 Uncertainties Associated with the 1998 303(d) ListingsAny objective analysis will always contain uncertainties. A summary of uncertainties is animportant component of the impairment assessment, as the uncertainties guide subsequentinvestigations.
5.1.1 Appropriate Calculation of Dietary ExposuresIn calculating the amount of duck tissue that could safely be consumed, the DOHS used thefollowing formula:
PI =
Where PI = permissible intake of duck fleshADI = acceptable daily intake, = 210 µg/dayDI = Daily dietary selenium uptake, = 170 µg/dayC = concentration of selenium in duck flesh
When DOHS did their original calculations, an Agency for Toxic Substances and DiseaseRegistry (ATSDR, an agency of the U.S. Department of Health and Human Services) MinimalRisk Level (MRL) was not available; the MRL is a daily intake that ATSDR considers to be safefor all populations. However, the ATSDR recently established an MRL of 5 µg/kg/day forchronic oral exposure (daily consumption, for the life of the individual) (ATSDR 2003). ThisMRL is based upon a No Observable Adverse Effect Level (NOAEL - the highest dose at whichno statistically or biologically significant adverse effects were observed) of 15 µg/kg/day. For a70 kg adult, this is equivalent to a selenium intake of 1,050 µg/day. To establish the MRL,ATSDR divided the NOAEL by a factor of three to account for human variability and arrived at5 µg/kg/day, which corresponds to 350 µg/day for a 70 kg individual.
Replacing the CA DOHS ADI with the ATSDR MRC of 350 µg/day results in a 66% increase inthe amount of duck tissue that could be consumed. Replacing the CA DOHS ADI with the NoObservable Adverse Effect Level of 1,050 µg/day results in a 400% increase in the amount ofduck tissue that could be consumed.
Moreover, there remains some question as to whether or not there is enough consumption ofthese ducks to warrant such concern. Anecdotal information suggests that these diving ducks arehunted primarily for sport, and are not eaten due to the fact that they taste bad. DOHS reportedthat the Surf Scoter “is seldom shot for food, since its flesh has a strong flavor that is verydisagreeable to most people. Its lack of palatability … renders it of slight importance as a gamebird” (Fan and Book 1986). It was also reported that “scaups are among the less desirable ofducks for table use because their flesh is tainted by their shellfish diet.”
It seems clear that the actual risk posed by the potential consumption of these diving dicks is inneed of re-evaluation, taking into account the most recent selenium exposure health information,
ADI – DIC
Clean Estuary Partnership
Selenium in San Francisco Bay: Conceptual Model/Impairment Assessment – Final Report Page 41
and arguably a probabilistic assessment that includes the actual likelihood of consumption.
5.2 Compliance with US EPA’s Draft Selenium CriteriaIn 2004, the US EPA released a Draft Aquatic Life Criteria for Selenium that proposed a fishwhole-body tissue selenium concentration of 7.91 µg/g, dry wt, as the chronic toxicity limit (USEPA 2004), with recommendations to monitor the status of the fish community if the tissueselenium concentration exceeds 5.85 µg/g.
Using the US EPA’s Draft Selenium Criteria formula for converting muscle seleniumconcentration to whole body selenium concentration, the most recent sturgeon muscle data (from2003-2004 [Linares et al. 2004]) correspond to a mean of 6.1 µg/g, whole body dry wt,indicating that the mean sturgeon tissue selenium concentrations are within the proposed chroniccriterion of 7.91 µg/g, dry wt (US EPA 2004). However, this does exceed the EPA’s monitoringrecommendation limit of 5.85 µg/g, indicating that monitoring of the status of the sturgeonpopulation may be warranted.
Unfortunately, considerable disagreement with EPA proposed fish tissue criterion of 7.91 µg/gwas expressed by other resource agencies during the Endangered Species Act consultationprocess. While the status of the draft criteria on a national basis remains unclear, the US EPA,US FWS, USGS, NMFS, and State Board met in September 2002, and agreed developCalifornia-specific (via the California Toxics Rule [CTR]) water quality criteria that wouldprotect not only aquatic life, but also other federally-listed threatened and endangered species(Grubbs and Kuhlman, 2002). A contract was recently issues to the USGS to complete thedevelopment of two criteria:
1) A criterion for California in general, using the Great Lakes Initiative (GLI) WildlifeMethodology (40 CFR Part 132), which was used to derive the proposed national fishtissue criterion of 7.9 µg/g, but with input from other resource agency scientists in thenew derivation of a numerical limit.
2) A criterion specifically for the San Francisco Estuary watershed using the selenium riskassessment model of Luoma and Presser (2000) This model is specific to seleniumloadings and ecosystem effects in the Sacramento-San Joaquin River Delta.
5.3 Other Potential Impairments5.3.1 Potential Impairment of Diving Duck ReproductionAlthough the original regulatory listings for selenium in the Bay were not about the health ofwildlife so much as the health of people who hunt and eat diving ducks for food, it is importantto note that questions have been raised as to how selenium in the Bay’s food web affects thebreeding success of migratory birds. Preserving wildlife habitat and making sure that gamespecies are of food-quality are both important to the Bay Area economy. There are over 200private duck hunting clubs around Suisun Bay and the Bay-Delta. The US Fish and WildlifeService estimates that duck hunters bring over $100 million to the State annually (San FranciscoEstuary Project, 1992). Businesses and tourism enterprises that serve duck hunters depend on thesuccessful annual return of migratory waterfowl such as the Surf Scoter.
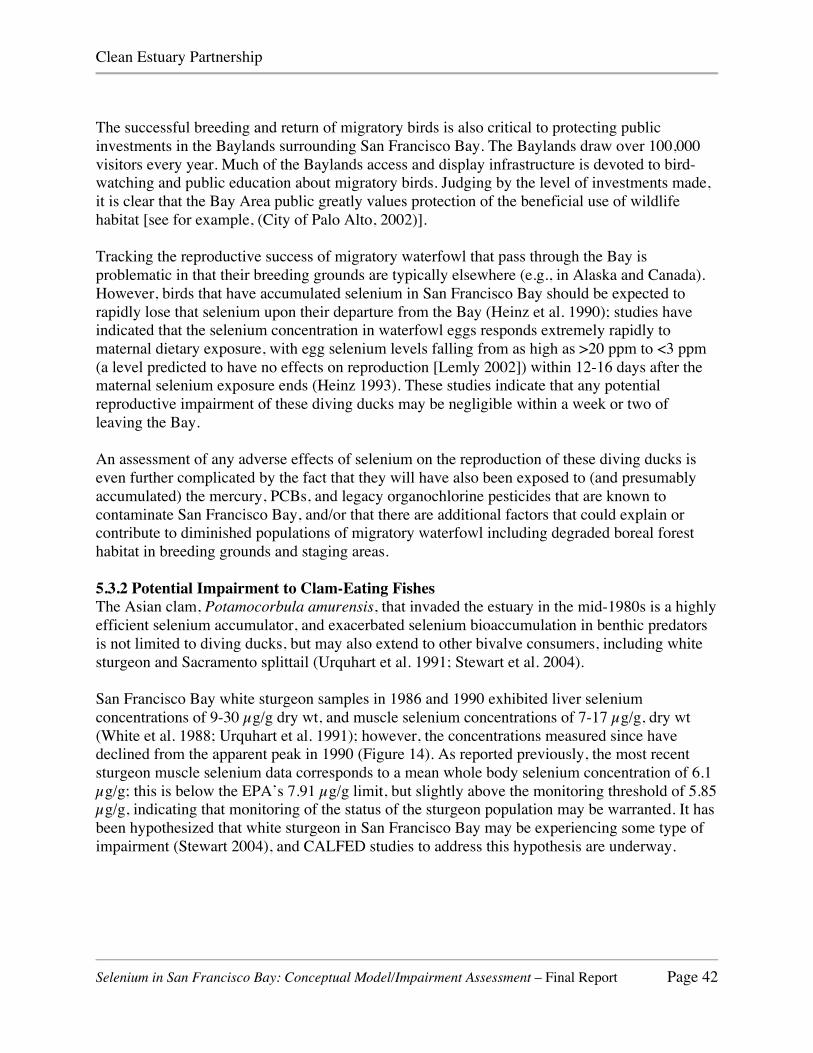
Clean Estuary Partnership
Selenium in San Francisco Bay: Conceptual Model/Impairment Assessment – Final Report Page 42
The successful breeding and return of migratory birds is also critical to protecting publicinvestments in the Baylands surrounding San Francisco Bay. The Baylands draw over 100,000visitors every year. Much of the Baylands access and display infrastructure is devoted to bird-watching and public education about migratory birds. Judging by the level of investments made,it is clear that the Bay Area public greatly values protection of the beneficial use of wildlifehabitat [see for example, (City of Palo Alto, 2002)].
Tracking the reproductive success of migratory waterfowl that pass through the Bay isproblematic in that their breeding grounds are typically elsewhere (e.g., in Alaska and Canada).However, birds that have accumulated selenium in San Francisco Bay should be expected torapidly lose that selenium upon their departure from the Bay (Heinz et al. 1990); studies haveindicated that the selenium concentration in waterfowl eggs responds extremely rapidly tomaternal dietary exposure, with egg selenium levels falling from as high as >20 ppm to <3 ppm(a level predicted to have no effects on reproduction [Lemly 2002]) within 12-16 days after thematernal selenium exposure ends (Heinz 1993). These studies indicate that any potentialreproductive impairment of these diving ducks may be negligible within a week or two ofleaving the Bay.
An assessment of any adverse effects of selenium on the reproduction of these diving ducks iseven further complicated by the fact that they will have also been exposed to (and presumablyaccumulated) the mercury, PCBs, and legacy organochlorine pesticides that are known tocontaminate San Francisco Bay, and/or that there are additional factors that could explain orcontribute to diminished populations of migratory waterfowl including degraded boreal foresthabitat in breeding grounds and staging areas.
5.3.2 Potential Impairment to Clam-Eating FishesThe Asian clam, Potamocorbula amurensis, that invaded the estuary in the mid-1980s is a highlyefficient selenium accumulator, and exacerbated selenium bioaccumulation in benthic predatorsis not limited to diving ducks, but may also extend to other bivalve consumers, including whitesturgeon and Sacramento splittail (Urquhart et al. 1991; Stewart et al. 2004).
San Francisco Bay white sturgeon samples in 1986 and 1990 exhibited liver seleniumconcentrations of 9-30 µg/g dry wt, and muscle selenium concentrations of 7-17 µg/g, dry wt(White et al. 1988; Urquhart et al. 1991); however, the concentrations measured since havedeclined from the apparent peak in 1990 (Figure 14). As reported previously, the most recentsturgeon muscle selenium data corresponds to a mean whole body selenium concentration of 6.1µg/g; this is below the EPA’s 7.91 µg/g limit, but slightly above the monitoring threshold of 5.85µg/g, indicating that monitoring of the status of the sturgeon population may be warranted. It hasbeen hypothesized that white sturgeon in San Francisco Bay may be experiencing some type ofimpairment (Stewart 2004), and CALFED studies to address this hypothesis are underway.

Clean Estuary Partnership
Selenium in San Francisco Bay: Conceptual Model/Impairment Assessment – Final Report Page 43
0
2
4
6
8
10
12
14
16
18
20
San PabloBay
Suisun Bay San PabloBay
San PabloBay
Suisun Bay Suisun Bay San PabloBay
San PabloBay
San PabloBay
North SFBay
Sample Date and Location
Mus
cle S
elen
ium
Con
cent
ratio
n (µ
g/g,
dry
wt)
Apparent "peak" in 1990 ...
… has since declined.
1986 1987 1988 1989 1990 1997 2000 2003-4
Figure 14. Selenium concentrations (µg/g, dry wt) in white sturgeon muscle tissue.Data from the Selenium Verification Study (White et al. 1988; Urquhart et al. 1991),the RMP data set, and Linares et al. (2004).
While a similar long-term data set for selenium concentrations in Sacramento splittail are notavailable, their benthivorous diet as adults includes Potamocorbula amurensis (Feyrer et al.2003) indicating that they are similarly exposed to elevated selenium concentrations in theirfood. However, the Sacramento splittail tissue selenium concentrations are markedly less thanseen in white sturgeon, and are more similar to those seen in striped bass (see Figure 2 in Stewartet al. 2004). Nevertheless, it has been reported that exposure to dietary selenium may causephysical deformities in splittail (Teh et al. 2004), although statistical analyses of these data failedto reveal any dose-response relationship; similar deformities have been observed in wild-caughtsplittail (Stewart et al. 2004), suggesting that selenium may be adversely affecting the splittail.
5.3.3 Use of Impairment or Risk Threshold Guideline ValuesNumeric indicators help to quantify the status of the Bay with respect to different pollutants. Justas the California Highway Patrol uses the speed limit as a numeric indicator for unsafe driving,concentrations of selenium in water, sediment, and organisms are important numeric indicatorsthat tell us whether or not selenium impairs the beneficial uses of fishing (COMM), wildlifehabitat (WILD), or protection of rare and endangered species (RARE). Just as the HighwayPatrol use multiple numeric indicators to identify unsafe driving (e.g., speed, following distance,
Clean Estuary Partnership
Selenium in San Francisco Bay: Conceptual Model/Impairment Assessment – Final Report Page 44
blood alcohol concentration), the multiple numeric indicators summarized in Table 12 provideadditional detail on not just whether the Bay is impaired, but also how.
What we know for sure is that the Bay is in attainment of numeric indicators in water andsediments, and over numeric indicators for key prey species (P. amurensis), as well as indicatorsfor organismal exposure (bird livers). We don’t know if human consumers are at risk – there is aconsumption advisory, but because of the narrow window between nutritional requirement andtoxicity and the use of questionable parameters in the health risk calculations, there are somequestions about the original risk assessment.
We also don’t have definitive evidence for effects on reproductive success of wildlife in the Baydue to selenium in the food chain, in part because many of the species we are most concernedabout don’t reproduce in the Bay, they just eat there. We do know that selenium concentrationsin exposed organisms that feed heavily on benthic invertebrates exceed teratogenic thresholdsfound in other ecosystems, so we have reason to be concerned.

Clean Estuary Partnership
Selenium in San Francisco Bay: Conceptual Model/Impairment Assessment – Final Report Page 45
Table 12. Current status of indicators of beneficial use impairment by selenium in San Francisco BayIndicator Relation to Beneficial Uses Threshold Status of the Bay
Water Indicator of chronic toxicity 5 µg/L GOOD – most of the Bay 0.02-0.6 µg/L , average 0.2 µg/L. Low-flow exceedancesup to 9 µg/L observed in southern estuary interface at Alviso Slough.
Sediments Particles are major pathwayfor bioaccumulation 4 µg/g (dry wt)
GOOD – most of the Bay 0.01-0.6 µg/g, average 0.3 µg/g. Episodic excursion ashigh as 3 µg/g observed in 1993; Napa Salt Ponds have 1-3 µg/g Se; condition ofSouth Bay salt ponds unknown.
BivalvePrey
Most significantly impactedbranch of aquatic food web 3 µg/g (dry wt) BAD – P. Amurensis levels ranged from 4-20 µg/g in 1990-96. Species has become
significant food source to benthic predators.
Bird Livers Indicator of organismalexposure 10 µg/g (dry wt)
BAD – While many species below threshold, scaups (average 36 µg/g) and scoters(13-368 µg/g, average 134 µg/g) well over this indicator; however, theseconcentrations are expected to drop rapidly once these birds leave the Bay.
Fish Livers Indicator of organismalexposure 12 µg/g (dry wt) BAD – Sturgeon livers in 1990-96 averaged 30 µg/g, with a range of 8-80 µg/g.
Fish eggs Indicator of threats toreproductive success 10 µg/g (dry wt)
BAD – White sturgeon ovaries ranged from 3-29 µg/g in 1991, however subsequentdecline in concentrations commensurate with those observed in muscle tissuesshould be expected.
FishMuscle
Indicator of exposure risk tohuman
7.9 µg/g (wholebody dry wt)
UNCERTAIN – Magnitude and frequency of exceedances by sturgeonsignificantly diminished since 1991; risk assessment needs to be reviewed.
BirdMuscle
Indicator of exposure risk tohuman consumers 2 µg/g (dry wt)
UNCERTAIN – only liver concentration data appear to be available; need to verifyif liver data were used to posit risk to humans; risk assessment needs to bereviewed.
Bird eggs Indicator of threats toreproductive success 3 µg/g (dry wt)
UNCERTAIN – scant, preliminary data available, many migratory species nest farnorth of SF Bay in Alaska, Northwest Territories, and bird tissue concentrationsdrop rapidly after the end of any exposure.
a – California Toxics Rule.Threshold values from: Fan et al. (1988); Lemly (1993, 1995, 2000); Van derVeer and Canton (1997); Hamilton and Lemly (1999),Luoma and Presser (2000), US EPA (2002), and the California Toxics Rule (CTR). Status from analysis of RMP data for this report,and as reported by Luoma and Presser (2000), and references cited therein.
Clean Estuary Partnership
Selenium in San Francisco Bay: Conceptual Model/Impairment Assessment – Final Report Page 46
5.4 Future Loadings of Agricultural DrainwaterSelenium loads from agricultural drainage are measured, modeled, and estimated based onconcentrations and flows discharged from the agricultural management subareas of the SanJoaquin Valley.
Future agricultural drainage loads may change dramatically, based on forecast scenarios fordifferent drainage alternatives (Luoma and Presser, 2000). The extremely wide range in potentialfuture loads from agricultural drainage results from the uncertainties about future disposalalternatives (in-Valley, to the Delta via the San Luis Drain, or direct drainage to the PacificOcean via a new drain). At present, in-valley disposal appears to be the preferred alternative, butthis matter is not yet resolved (USBR, 2004). The “possible” future loading rate of 20,000 kg/yris a speculative worst-case scenario. Ongoing selenium treatment operations may be as effectivein reducing agricultural drainage loads as the oil refineries’ implementation of selenium removaltreatments were in reducing refinery loading.
But simply putting the Bay’s selenium inventories and loads on scale with the upstreaminventory of selenium in subsurface agricultural drains helps understand that any plans to extendagricultural drainage to the Bay could overwhelm its assimilative capacity (Figure 15).
An important qualifier in the mass load estimates for the San Joaquin River is that they reflectloads to the delta before diversions into the California Aqueduct, recycling into the DeltaMendota Canal and other water appropriation projects. This issue is under investigation by theUnited States Bureau of Reclamation, and represents another potentially important managementquestion.

Clean Estuary Partnership
Selenium in San Francisco Bay: Conceptual Model/Impairment Assessment – Final Report Page 47
Figure 15. Conceptual illustration of why drainage plans from the San Joaquin Valleycould threaten the Bay’s assimilative capacity for selenium. The 50,000 kg sedimentinventory from the 2-box model in Figure 7 is shown next to the multi-million kgselenium inventory of the San Joaquin Valley. To provide adequate drainage, 20,000kg of selenium needs to be discharged for 60 – 3,000 years. Discharge pointscontemplated include San Francisco Bay (A – B) the Pacific Ocean (C – D) and “In-Valley” disposal (E, tentatively the preferred alternative identified by the USBR). Therelative volumes of the boxes representing upstream and in-Bay inventories are scaledto relative selenium inventories (i.e., the volume of the upstream box isapproximately 400 times greater than the in-Bay box).
50,000 kg
1,000,000 - 160,000,000
kg Se
20,000 kg Se / yr
T = 60 - 3,000 yr
Selenium Reservoir
in San Joaquin
Valley
AB
C
DE
Clean Estuary Partnership
Selenium in San Francisco Bay: Conceptual Model/Impairment Assessment – Final Report Page 48
6. Where Do We Go From Here: Filling theInformation GapsThis section summarizes the uncertainties in this report’s conclusions and suggests somepotential future projects to obtain additional data and conduct more analysis of the sources, fate,transport, and effects of selenium. In other documents or forums, the CEP will developappropriate strategies for addressing selenium in the Bay and its watersheds. These strategiesmay include:
• Data collection or analysis,• Implementation of corrective actions,• Formulating and refining management questions and setting priorities for the above 2
activities,• Determining an ongoing process for integrating all of the above.
There may be control measures, remediation, and regulatory actions that can and should beginnow, even with existing uncertainties. CEP partners are committed to identifying these actions.Future CEP data gathering and technical analysis should focus on determining the potentialeffectiveness, and actual effects, of actions to reduce or eliminate impairment and to restorebeneficial uses of the Bay.
Water Quality Planning and CEP Workplan Development
The State of California has developed a four-phased approach to resolving water qualityimpairments (California State Water Resources Control Board, 2003). Although this approachwas developed well after substantial selenium monitoring and management strategies had beenimplemented in the Bay, it is possible to frame the past two decades of planning and action (i.e.,the events summarized in Appendix A) in the four-phased approach (Figure 16). Within thatframework, this report represents a review and analysis stage at the end of and adaptiveimplementation cycle, and prior to initiating another iteration of planning, analysis, action, andimplementation.
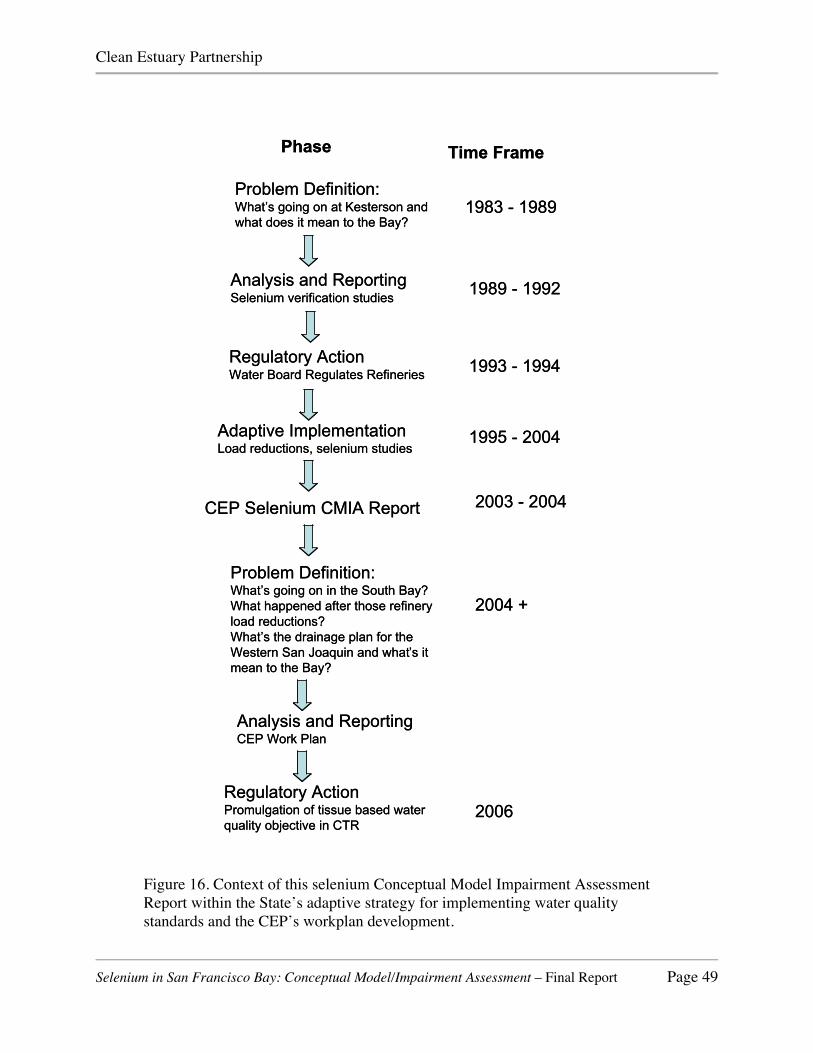
Clean Estuary Partnership
Selenium in San Francisco Bay: Conceptual Model/Impairment Assessment – Final Report Page 49
Figure 16. Context of this selenium Conceptual Model Impairment AssessmentReport within the State’s adaptive strategy for implementing water qualitystandards and the CEP’s workplan development.
Problem Definition: What’s going on at Kesterson and what does it mean to the Bay?
Analysis and ReportingSelenium verification studies
Regulatory ActionWater Board Regulates Refineries
Adaptive ImplementationLoad reductions, selenium studies
1983 - 1989
1989 - 1992
1993 - 1994
1995 - 2004
CEP Selenium CMIA Report
Phase Time Frame
2003 - 2004
Problem Definition: What’s going on in the South Bay?What happened after those refinery load reductions?What’s the drainage plan for the Western San Joaquin and what’s it mean to the Bay?
Analysis and ReportingCEP Work Plan
2004 +
Regulatory ActionPromulgation of tissue based water quality objective in CTR
2006

Clean Estuary Partnership
Selenium in San Francisco Bay: Conceptual Model/Impairment Assessment – Final Report Page 50
6.1 Function of this report in the CEP work planAs a program supporting water quality standards implementation, the CEP invests resources instudies needed to develop science-based management plans. Funding priorities are set by theTechnical Committee (TC), which recommends appropriation of funds for specific technicalprojects to the Administrative Committee. To ensure that resources are focused on the CEPprogram goals, the TC has established a process for scoping and funding projects (Figure 17).
Figure 17. The CEP Technical Committee’s process for developing, reviewing, andfunding technical projects. PM = Program manager; TC = Technical Committee,WG = Selenium Workgroup
A list of high priority pollutants of concern is developed by the TC and approved by the CEP’sExecutive Management Board (EMB). Pollutant-specific workgroups of the TC developquestions about managing the Bay’s assimilative capacity. Those management questions are
Approve members of Technical Workgroups
Develop conceptual scopes of work for projects in orderof priority
Propose members for Technical Workgroups
Approve and prioritize pollutant list
Develop and prioritize management questions
Review, discuss and prioritize management questions
Prepare short descriptions of projects to address toppriority management questions
Compile project descriptions into annual work plan
Review and revise conceptual scopes
TC
PM
PM, WG
TC
TC
WG
PM
PM
PM, WG
Review and approve annual work planTC
Approve conceptual scope for development intodetailed scope of work and budget
Develop detailed scope of work
Review and revise detailed scopes, including externalpeer review if neededPM, WG
TC
TC
PM
Approve detailed scope of work and forward toadministrative committee with recommendation forappropriation of funds.
WHO DOES WHAT
We areHere
Clean Estuary Partnership
Selenium in San Francisco Bay: Conceptual Model/Impairment Assessment – Final Report Page 51
prioritized, and the highest priority questions are developed into project descriptions for theannual work plan. The annual work plan is implemented by developing conceptual scopes fromeach project description, reviewing and revising the conceptual scopes, and upon approval by theTC, production of detailed scopes of work that are funded by the EMB and executed undersupervision of the TC and its workgroups and staff.
Within that process, this report takes the CEP TC to the stage of developing, ranking, andprioritizing management questions for selenium. Those management questions are discussed inthe last section of this report.
A preliminary list of management questions raised by this report is presented in Table 13.

Clean Estuary Partnership
Selenium in San Francisco Bay: Conceptual Model/Impairment Assessment – Final Report Page 52
Table 13. Preliminary list of selenium management questions identified in this report
Management Question Relevant report sections General approach to answering it
Does selenium bioaccumulation in the Bay affect thebreeding success of migratory birds? Section 5.3.1
Coordination with resource agencies (e.g.,USFWS, CDFG) and national wildlife
organizations.
Does selenium bioaccumulation in these diving duckspose a threat to human consumers? Section 5.1
Literature review, coordination withOEHHA, environmental groups, probabilistic
risk assessmentAre San Francisco Bay fish tissue selenium
concentrations in compliance with the DRAFT 2002EPA criteria?
Section 5.2Literature review, and possible development
of model to correlate liver and muscleconcentrations to whole-body concentrations.
Are the selenium concentrations in white sturgeon andSacramento splittail impairing the wild populations of
these fish in SF Bay?Section 5.3.2 Continue to monitor the results of ongoing
CALFED studies
Will the Bay’s waters, sediments, and/or organism tissueselenium concentrations be in compliance with the new
criteria currently under development?Section 5.2
Coordination with the resource agencies(e.g., USEPA, USGS) developing the new
criteria.What causes the extremely high selenium concentrations
observed at Alviso Slough? Sections 3.2.4 Investigation of groundwater discharges
How do water management choices, including floodcontrol, salt pond management, dry weather reclamation,and groundwater recharge affect selenium concentrations
and distributions in lower South Bay?
Sections 3.2.4Coordination with external programs andprojects (e.g., SANTA Clara Basin WMI,
South Bay Salt Ponds long term managementplan development)
How does freshwater diversion from the Delta affect thenet effect of selenium discharges to the Bay from the
San Joaquin River?Section 3.1 Coordination with USBR
How will increases in the flow of San Joaquin Riverwater though the Delta and northern San Francisco Bayaffect selenium bioaccumulation by the Bay’s foodweb?
Sections 3.2 and 3.3.2.3Coordination with water resource agencies,
and application of USGS and CALFED-study models.

Clean Estuary Partnership
Selenium in San Francisco Bay: Conceptual Model/Impairment Assessment – Final Report Page 53
Table 13 (continued): Preliminary list of selenium management questions identified in this report.Management Question Relevant report sections General approach to answering it
Are average selenium concentrations in Bay Areamunicipal water supply, effluent, urban and non-urban streams more like 0.1 µg/L or 1.0 µg/L?
Section 3.2.8.3Additional data gathering and synthesis,
targeted subsampling of different water sourcetypes for accurate low-level analysis
How do pollutant partition coefficients affectdistributions and recovery time scales, especially in
Lower South Bay?Sections 3.2 – 3.3 Synthesis and peer review of existing data in
coordination with CEP modeling project.
How will alternatives to provide agriculturaldrainage under consideration by the United States
Bureau of Reclamation affect future selenium loadsto the Bay?
Sections 5.4 Coordinate with USBR, upstreamstakeholders, resource agencies

Clean Estuary Partnership
Selenium in San Francisco Bay: Conceptual Model/Impairment Assessment – Final Report Page 54
7. References CitedAbu-Saba KE (2003) DRAFT Mercury Source Assessment for San Francisco Bay, San
Francisco Bay Clean Estuary Partnership, Oakland, California.
Abu-Saba KE, Tang LW (2000) Watershed Management of Mercury in San Francisco Bay: aTMDL report to the USEPA, San Francisco Bay Regional Water Quality Control Board.California Environmental Protection Agency. San Francisco Bay Regional Water QualityControl Board, Oakland, California, pp. 170.
Alaimo J, Ogle RS, Knight AW (1994) Selenium uptake by larval Chironomus decorus from aRupee maritima-based benthic/detrital substrate. Archives of EnvironmentalContamination & Toxicology, 27(4): 441-448.
Alpine AE, Cloern JE (1992) Trophic interactions and direct physical effects controlphytoplankton biomass and productivity in an estuary. Limnology and Oceanography37:946-955.
Amoroux D, Donard OFX (1997) Evasion of selenium to the atmosphere via biomethylationprocesses in the Gironde estuary, France. Marine Chemistry 58:173-188.
Ansede JH, Yoch DC (1997) Comparison of selenium and sulfur volatilization bydimethylsulfoniopropionate lyase (DMSP) in two marine bacteria and estuarinesediments. FEMS Microbiology Ecology 23:315-324.
Arthur JF, Ball MD (1979) Factors influencing the entrapment of suspended material in the SanFrancisco Bay-Delta Estuary. Pages 143-174 in: Conomos TJ (ed), San Francisco Bay:The urbanized Estuary. Pacific Division, American Association for the Advancement ofScience, San Francisco, CA.
ATSDR (2003) Toxicological Profile for Selenium. Agency for Toxic Substances and DiseaseRegistry, US Department of Health and Human Services, Washington, D.C.
Bailey FC, Knight AW, Ogle RS, Klaine SJ (1995) Effect of sulfate level on selenium uptake byRuppia maritima. Chemosphere, 30(3): 579-591.
Baines SB, Fisher NS (2001) Interspecific differences in the bioconcentration of selenite byphytoplankton and their ecological implications. Marine Ecology Progress Series 213:1-12.
Baines SB, Fisher NS, Doblin MA, Cutter GA (2001) Uptake of dissolved organic selenides bymarine phytoplankton. Limnology & Oceanography, 46(8): 1936-1944.
Clean Estuary Partnership
Selenium in San Francisco Bay: Conceptual Model/Impairment Assessment – Final Report Page 55
Baines SB, Fisher NS, Stewart R (2002) Assimilation and retention of selenium and other traceelements from crustacean food by juvenile striped bass (Morone saxatilis). LimnologyOceanography 47(3):646-655.
Baines SB, Fisher NS, Doblin MA, Cutter GA, Cutter LS, Cole B (2004) Light dependence ofselenium uptake by phytoplankton and implications for predicting selenium incorporationinto food webs. Limnology Oceanography 49(2):566-578.
Balistrieri LS, Chao TT (1990) Adsorption of selenium by amorphous iron oxyhydrooxides andmanganese dioxide. Geochimica Cosmochimica Acta 54:739-751.
Besser JM, Huckins JN, Clark RC (1994) Separation of selenium species released from Se-exposed algae. Chemosphere 229:771-780.
Boisson F, Gnassia-Barelli M, Romeo M (1995) Toxicity and accumulation of selenite andselenate in the unicellular marine alga Cricospaera elongata. Archives EnvironmentalContamination Toxicology 28:487-493.
Bottino NR, Banks C, Irgolic KJ, Micks P, Wheeler AE, Zingaro RA (1984) Selenium-containing amino acids and proteins in marine algae. Phytochemistry 23(111):2445-2452.
Brasher AM, Ogle RS (1993) Comparative toxicity of selenite and selenate to the amphipodHyalella azteca. Archives of Environmental Contamination & Toxicology, 30: 274-279.
Brown CL, Luoma SN (1995) Use of the euryhaline bivalve Potamocorbula amurensis as abiosentinel species to assess trace metal contamination in San Francisco Bay. MarineEcology Progress Series 124(1-3): 129-142.
CA OEHHA (1987) Duck Consumption Advisory for Suisun Bay, San Pablo Bay, and theCarquinez Straits, CAL-EPA, Office of Environmental Health Hazard Assessment,Sacramento, CA.
California State Water Resources Control Board (2003) DRAFT State of California S.B. 469TMDL Guidance: A process for Addressing Impaired Waters in California, CaliforniaState Water Resources Control Board, Sacramento, CA.
Carlton JT, Thompson JK, Schemel LE, Nichols FH (1990) The remarkable invasion of SanFrancisco Bay, California, by the Asian clam Potamocorbula amurensis: introduction anddispersal. Marine Ecology Progress Series.
Chapman PM (1999) Selenium - A potential time bomb or just another contaminant? Human &Ecological Risk Assessment, 5(6): 1123-1138.
City of Palo Alto (2002) Adoption of a Resolution Authorizing the City Manager to Apply for aGrant and Execute an Agreement with their State of California for a Roberti-Z'berg-Harris Urban Open Space and Recreation Grant for Improvements to Parking Lots at the
Clean Estuary Partnership
Selenium in San Francisco Bay: Conceptual Model/Impairment Assessment – Final Report Page 56
Baylands, Palo Alto City Council. Palo Alto City Council. City of Palo Alto, Palo Alto,CA.
Combs GF (2001) Selenium in global food systems. British Journal of Nutrition, 85(5): 517-547.
Conomos TJ (1979) Properties and Circulation of San Francisco Bay Waters. In: T.J. Conomos(Editor), San Francisco Bay: The Urbanized Estuary. Pacific Division, AmericanAssociation for the Advancement of Science, San Francisco, pp. 493.
Coyle JJ, Buckler DR, Ingersoll CG, Fairchild JF, May TW (1993) Effect of dietary selenium onthe reproductive success of bluegills (Lepomis macrochirus). Environmental Toxicologyand Chemistry 12:551-565.
Cutter GA, Bruland KW (1984) The marine biogeochemistry of selenium: a re-evaluation.Limnology Oceanography 29:1179-1192.
Cutter GA (1989) The estuarine behavior of selenium in San Francisco Bay. Estuarine, Coastaland Shelf Science, 28(1): 13-34.
Cutter GA, San Diego-McGlone MLC (1990) Temporal variability of selenium fluxes in SanFrancisco Bay. Science of the Total Environment 97/98: 235-250.
Cutter GA, Cutter LS (1998) Metalloids in the high latitude North Atlantic: sources and internalcycling. Marine Chemistry 61:25-36.
Cutter GA, Cutter LS (2004) Selenium biogeochemistry in the San Francisco Bay estuary:changes in water column behavior. Estuarine Coastal Shelf Science 61:463-476.
Davis J, (2004) The Long Term Fate of PCBs in San Francisco Bay, San Francisco EstuaryInstitute, Oakland, California.
Doblin MA, Baines SB, Cutter LS, Cutter GA (2005) Selenium biogeochemistry in the SanFrancisco Bay estuary: Seston and phytoplankton. Manuscript in review, Estuarine,Coastal, and Shelf Science.
Dowdle PR, Oremland RS (1998) Microbial oxidation of elemental selenium in soil slurries andbacterial cultures. Environmental Science & Technology 32(23): 3749-3755.
Fan AM, Book SA (1986) Human health significance of selenium in scoters and scaups in SanFrancisco Bay Region. CA OEHHA, Dept. of Health Services, Berkeley, CA.
Fan AM, Lipsett MJ (1988) Human health evaluation of findings on selenium in ducks obtainedfrom the Selenium Verification Study 1986-1987: Update of health advisories. CA Dept.of Health Services, Hazard Evaluation Section, Berkeley, CA.

Clean Estuary Partnership
Selenium in San Francisco Bay: Conceptual Model/Impairment Assessment – Final Report Page 57
Fan AM, Book SA, Neutra RR, Epstein DM (1988) Selenium and human health implications inCalifornia's San Joaquin Valley. Journal of Toxicology and Environmental Health 23:539-559.
Fisher NS, Reinfelder JR (1991) Assimilation of selenium in the marine copepod Acartia tonsastudies with a radiotracer method. Marine Ecology Progress Series 70157-164.
Fisher NS, Wente M (1993) The release of trace elements by dying marine phytoplankton. DeepSea Research 40:671-694
Foda A, Vandermeulen J, Wrench JJ (1983) Uptake and conversion of selenium by a marinebacterium. Canadian Journal Fisheries and Aquatic Sciences 40(supplement 2):215-220.
Fowler SW, Benayoun G (1976) Influence of environmental factors on selenium flux in twomarine invertebrates. Marine Biology 37:59-68.
Greenfield BK et al. (2003) Contaminant concentrations in fish from San Francisco Bay, 2000,San Francisco Estuary Institute, Oakland, CA.
Grovhoug T, Lau G, Abu-Saba KE (2004) Mercury Management by Bay Area WastewaterTreatment Plants, San Francisco Bay Clean Estuary Partnership, Oakland, California.
Guo L, Frankenberger WT, Jury WA (1999) Evaluation of simultaneous reduction and transportof selenium in saturated soil columns. Water Resources Research 35(3):663-669.
Hamilton SJ, Lemly AD (1999) Water-sediment controversy in setting environmental standardsfor selenium. Ecotoxicology & Environmental Safety 44(3): 227-235.
Hansen D, Duda PJ, Zayed A, Terry N (1998) Selenium removal by constructed wetlands - roleof biological volatilization. Environmental Science & Technology 32(5): 591-597.
Harrison PJ, Yu PW, Thompson PA, Price NM, Phillips DJ (1988) Survey of seleniumrequirements in marine phytoplankton. Marine Ecology Progress Series 47:89-96.
Harvey TE (1992) Status and trends report on wildlife of the San Francisco Estuary, SanFrancisco Estuary Project, Oakland, CA.
Heinz GH, Hoffman DJ, Gold LG (1989) Impaired reproduction of mallards fed an organic formof selenium. Journal of Wildlife Management 53(2):418-428.
Heinz GH, Pendleton GW, Krynitsky AJ, Gold LG (1990) Selenium accumulation andelimination in mallards. Archives Environmental Contamination and Toxicology 19:374-379.
Heinz GH (1993) Selenium accumulation and loss in mallard eggs. Environmental Toxicologyand Chemistry 12:775-778.
Clean Estuary Partnership
Selenium in San Francisco Bay: Conceptual Model/Impairment Assessment – Final Report Page 58
Hu MH, Yang YP, Martin M, Yin , Harrison PJ (1997) Preferential uptake of Se(IV) over Se(VI)and the production of dissolved organic Se by marine phytoplankton. MarineEnvironmental Research 44:225-231.
Hunt JW, Anderson BS, Phillips BM, Newman J, Tjeerdema RS, Taberski KK, Wilson CJ,Stephenson M, Puckett HM, Fairey R, Oakden J (1998) Sediment quality and biologicaleffects in San Francisco Bay. Bay Protection and Toxic Cleanup Program. FinalTechnical Report. San Francisco Bay Regional Water Quality Control Board, Oakland,CA.
Johns C, Luoma SN, Elrod V (1998) Selenium accumulation in benthic bivalves and in finesediments of San Francisco Bay, the Sacramento-San Joaquin Delta, and selectedtributaries. Estuarine Coastal Shelf Science 27:381-396.
Johnson TM, Bullen TD, Zawislanski PT (2000) Selenium stable isotope ratios as indicators ofsources and cycling of selenium: results from the northern reach of San Francisco Bay.Environmental Science Technology 34:2075-2079.
Kim K, Kayes TB, Anundson CH (1992) Requirements for sulfur amino acids and utilization ofd-methionine by rainbow trout (Oncorhynchus mykiss). Aquaculture 101:95-103.
Lehman PW (2000) The influence of climate on phytoplankton community carbon in SanFrancisco Bay estuary. Limnology and Oceanography 45:580–590.
Lemly AD (1993) Guidelines for evaluating selenium data from aquatic monitoring andassessment studies. Environmental Monitoring & Assessment, 28(1):83-100.
Lemly AD (1995) A protocol for aquatic hazard assessment of selenium. Ecotoxicology &Environmental Safety 32(3): 280-288.
Lemly AD (2000) Guidelines for conducting TMDL consultations on selenium. TechnicalAssistance Report to the U.S. Fish and Wildlife Service, Division of EnvironmentalContaminants, Washington, D.C.
Linares J, Linville R, Van Eennennaam J, Doroshov S (2004) Selenium effects on health andreproduction of white sturgeon in the Sacramento-San Joaquin Estuary. Final Report forCalFed Project No. ERP-02-P35, California Bay-Delta Authority, Sacramento, CA.
Lindstrom K (1983) Selenium as a growth factor for planktonic algae in laboratory experimentsand in some Swedish lakes. Hydrobiologia 101:35-48.
Linville RG, Luoma SN, Cutter L, Cutter GA (2002) Increased selenium threat as a result ofinvasion of the exotic bivalve Potamocorbula amurensis into the San Francisco Bay-Delta. Aquatic Toxicology, 57(1-2): 51-64.
Clean Estuary Partnership
Selenium in San Francisco Bay: Conceptual Model/Impairment Assessment – Final Report Page 59
Looker RE, Johnson BJ (2003) Mercury in San Francisco Bay: Total Maximum Daily Load(TMDL) Project Report, San Francisco Bay Regional Water Quality Control Board,Oakland, California.
Luoma SN, Johns C, Fisher NS, Steinberg NA, Oremland RS, Reinfelder JR (1992)Determination of selenium bioavailability to a benthic bivalve from particulate and solutepathways. Environmental Science & Technology, 26: 485-491.
Luoma SN, Presser TS (2000) Forecasting Selenium Discharges to the San Francisco Bay-DeltaEstuary: Ecological Effects of a Proposed San Luis Drain Extension. USGS Open FIleReport 00-0146, United States Geological Survey, Menlo Park, CA.
Maier KJ, Knight AW (1993) Comparative acute toxicity and bioconcentration of selenium bythe midge Chironomus-decorus exposed to selenate, selenite, and seleno-dl-methionine.Archives of Environmental Contamination & Toxicology, 25(3): 365-370.
Maier KJ, Ogle RS, Knight AW (1988) The selenium problem in lentic ecosystems. Lake andReservoir Management, 4: 155-163.
McKee L, Foe C (2002) Estimation of total mercury fluxes entering San Francisco Bay from theSacramento and San Joaquin River watersheds, San Francisco Estuary Institute, Oakland,CA.
McKee L, Leatherbarrow J, Davis J, Pearce S (2002) A review of urban runoff processes in theBay Area - Existing knowledge, conceptual model, and monitoring recommendations.,San Francisco Estuary Institute, Oakland, CA.
Meseck SL (2002) Modeling the Biogeochemical Cycle of Selenium in the San Francisco Bay.Ph.D. Dissertation, Old Dominion University.
Neal RH, Sposito G, Holtzclaw KM, Traina SJ (1987) Selenite adsorption on alluvial soils: IISolution composition effects. Journal Soil Science Society America 51:1165-11169
Ogle RS, Knight AW (1996) Selenium bioaccumulation in aquatic ecosystems. 1. Effects ofsulfate on the uptake and toxicity of selenate in Daphnia magna. Archives ofEnvironmental Contamination & Toxicology 30(2): 274-279.
Ogle RS, Maier KJ, Kiffney P, Williams MJ, Brasher A, Melton LA, Knight AW (1988)Bioaccumulation of selenium in aquatic ecosystems. Lake and Reservoir Management1988(4):165-173.
Ogle RS (1996) The bioaccumulation of selenium in aquatic ecosystems. Ph.D. Dissertation,University of California, Davis, CA.
Ohlendorf HM, Lowe RW, Kelly PR, Harvey TE (1986) Selenium and heavy metals in SanFrancisco Bay diving ducks. Journal Wildlife Management 50(1):64-71.
Clean Estuary Partnership
Selenium in San Francisco Bay: Conceptual Model/Impairment Assessment – Final Report Page 60
Ohlendorf HM, Hoffman DJ, Saiki MK, Aldrich TW (1986) Embryonic mortality andabnormalities of aquatic birds: apparent impacts of selenium from irrigation drainwater.Science of the Total Environment 52:49-63.
Ohlendorf HM (2002) The birds of Kesterson Reservoir: a historical perspective. AquaticToxicology 57(1-2): 1-10.
Oremland RS (1994) Biogeochemical transformations of selenium in anoxic environments. In:Frankenberger WT, Benson S (eds), Selenium in the Environment. Marcel Dekker, Inc.,New York.
Oremland RS et al. (2000) Bacterial dissimilatory reduction of arsenate and sulfate in meromicticMono Lake, California. Geochimica et Cosmochimica Acta, 64(18): 3073-3084.
Oremland, RSSJ (2000) Dissimilatory reduction of selenate and arsenate in nature.Environmental Microbe Metal Interactions
Presser TS, Barnes I (1984) Selenium concentrations in waters tributary to and in the vicinity ofthe Kesterson National Wildlife Refuge, Fresno and Merced Counties, California. WaterResources Investigation Report 84-4122, U.S. Geological Survey, Menlo Park, CA.
Purkerson DG, Doblin MA, Bollens SM, Luoma SN, Cutter GA (2003) Selenium in SanFrancisco Bay zooplankton: Potential effects of hydrodynamics and food webinteractions. Estuaries 26(4A): 956-969.
Reinfelder JR, Fisher NS (1991) The assimilation of elements ingested by marine copepods.Science 251:794-796.
Reinfelder JR, Fisher NS (1994) The assimilation of elements ingested by marine planktonicbivalve larvae. Limnology Oceanography 39(1):12-20.
Reinfelder JR, Fisher NS (1997) Assimilation efficiencies and turnover rates of trace elements inmarine bivalves: a comparison of oysters, clams, and mussels. Marine Biology 129:443-452.
Reinfelder JR, Fisher NS, Luoma SN, Nichols JW, Wang WX (1998) Trace element trophictransfer in aquatic organisms: A critique of the kinetic model approach. Science of theTotal Environment 219:117-135.
Risebrough RW, Chapman JW, Okazaki RK, Schmidt TT (1977) Toxicants in San FranciscoBay and Estuary. Report to the Association of Bay Area Governments, Berkeley, CA.
Robinson EH, Allen OW, Poe WE, Wilson RP (1978) Utilization of dietary sulfur compounds byfingerling channel catfish: l-methionine, d,l-methionine, methionine hydroxy analogue,taurine, and inorganic sulfate. Journal of Nutrition 108:1932--1936.
Clean Estuary Partnership
Selenium in San Francisco Bay: Conceptual Model/Impairment Assessment – Final Report Page 61
Saiki MK (1986) Concentrations of selenium in aquatic food chain organisms and fish exposedto agricultural tile drainage water. Pages 25-33, in: Howard AQ (ed) Selenium inAgricultural Drainage: Implications for San Francisco Bay and the CaliforniaEnvironment; Proceedings of the Second Selenium Symposium, Berkeley, CA, March23, 1985. Bay Institute of San Francisco, Tiburon, CA.
Steinberg NA, Oremland RS (1990) Dissimilatory selenate reduction potentials in a diversity ofsediment types. Applied Environmental Microbiology 56(11):3550-3557.
SWRCB (1994) Water quality control plan for the San Francisco Bay/Sacramento-San JoaquinDelta estuary. CA State Water Resources Control Board, Sacramento, CA.
SFBRWQCB (1992b) Mass emissions reduction strategy for selenium. San Francisco BayRegional Water Quality Control Board, Oakland, CA.
SFBRWQCB (1998) 1998 CWA Section 303(d) List of Water Quality Limited Segments. SanFrancisco Bay Regional Water Quality Control Board, Oakland, CA.
SFBRWQCB (2001) Proposed revisions to Section 303(d) List and priorities for development oftotal maximum daily loads (TMDLs) for the San Francisco Bay region. Staff Report. SanFrancisco Bay Regional Water Quality Control Board, Oakland, CA.
SFBRWQCB (2002) 2002 CWA Section 303(d) List of Water Quality Limited Segments. SanFrancisco Bay Regional Water Quality Control Board, Oakland, CA.
San Francisco Estuary Project (1992) Comprehensive Conservation and Management Plan,Association of Bay Area Governments, Oakland, CA.
Santa Clara Valley Water District (1994) Copper and selenium in the water supply of the SantaClara Valley, San Jose, CA.
Schlekat CE, Dowdle PR, Lee BG, Luoma SN, Oremland RS (2000) Bioavailability of particle-associated Se to the bivalve Potamocorbula amurensis. Environmental Science &Technology 34(21):4504-4510.
Schlekat CE, Lee BG, Luoma SN (2002) Assimilation of selenium from phytoplankton by threebenthic invertebrates: effect of phytoplankton species. Marine Ecology Progress Series,237: 79-85.
Stewart RS, Luoma SN, Schlekat CE, Doblin MA, Hieb KA (2004) Food web pathwaydetermined how selenium affects aquatic ecosystems: A San Francisco Bay case study.Environmental Science Technology 38:4519-4526.
Tanji K, Lauchlii A, Meyer J (1986) Selenium in the San Joaquin Valley. Environment 28(6):6-11, 34-39.
Clean Estuary Partnership
Selenium in San Francisco Bay: Conceptual Model/Impairment Assessment – Final Report Page 62
Taylor KA (1997) Selenium in the Bay Environment - an overview of the environmentalconcerns, regulatory history, and current status, San Francisco Bay Regional WaterQuality Control Board, Oakland, California.
Teh SJ, Deng X, Deng DF, Teh FC, Hung SS, Fan TW, Liu J, Higashi RM (2004) Chroniceffects of dietary selenium on juvenile Sacramento splittail (Pogonichthysmacrolepidotus). Manuscript.
United States Bureau of Reclamation (2002) Fact Sheet: San Luis Drain Feature Re-evaluation -Historical Perspective, United States Bureau of Reclamation, Sacramento, CA.
US EPA (2004) Draft Aquatic Life Water Quality Criteria for Selenium - 2004. EPA-822-D-04-001, US Environmental Protection Agency, Office of Water, Washington, D.C.
United States Environmental Protection Agency (2003) IRIS Database, Department of HomelandSecurity, Washington, DC.
Urquhart K, Regalado K, Carlson J, Hofmann PS, Puckett L, Wernette FG, White JR (1991)Selenium verification study 1988-1990. California Dept. of Fish and Game, Bay-DeltaProject, Stockton, CA.
Vandermeulen H, Foda A (1988) Cycling of selenite and selenate in marine phytoplankton.Marine Biology 98:115-123.
Vanderveer WD, Canton SP (1997) Selenium sediment toxicity thresholds and derivation ofwater quality criteria for freshwater biota of western streams. Environmental Toxicology& Chemistry 16(6): 1260-1268.
Wang WX, Fisher NS, Luoma SN (1995) Assimilation of trace elements ingested by the musselMytilus edulis: effects of algal food abundance. Marine Ecology Progress Series 129:165-176.
Wang WX, Fisher NS, Luoma SN (1996) Kinetic determinations of trace elementbioaccumulation in the mussel Mytilus edulis. Marine Ecology-Progress Series 140(1-3):91-113.
Wang WX, Fisher NS (1998) Excretion of trace elements by marine copepods and theirbioavailability to diatoms. Journal Marine Research 56:713-729.
Wang WX, Fisher NS (1999) Delineating metal accumulation pathways for marine invertebrates.Science of the Total Environment 2337/238:459-472.
Wang WX (2001) Comparison of metal uptake rate and absorption efficiency in marine bivalves.Environmental Toxicology and Chemistry 20(6):1367-1373.

Clean Estuary Partnership
Selenium in San Francisco Bay: Conceptual Model/Impairment Assessment – Final Report Page 63
Wanger O (2000) Firebaugh Canal Co. V. United States.
Watson D, et al. (1998) Spatial and Temporal Trace Level Monitoring Study of South SanFrancisco Bay, National Water Quality Management Council 1998 Conference, Reno,Nevada.
Wheeler AE, Zingaro RA, Irgolic K (1982) The effect of selenate, selenite, and sulfate on thegrowth of six unicellular marine algae. Journal Experimental Marine Biology andEcology 57:181-194.
White JR, Hofmann PS, Hammond D, Baumgartner S (1987) Selenium verification study - 1986:A report to the California State Water Resources Control Board from the CaliforniaDepartment of Fish and Game. California Dept. of Fish and Game, Bay-Delta Project,Stockton, CA.
White JR, Hofmann PS, Hammond D, Baumgartner S (1988) Selenium verification study - 1986-1987: A report to the California State Water Resources Control Board from the CaliforniaDepartment of Fish and Game. California Dept. of Fish and Game, Bay-Delta Project,Stockton, CA.
White JR, Hofmann PS, Urquhart KAF, Hammond D, Baumgartner S (1989) Seleniumverification study - 1987-1988: A report to the California State Water Resources ControlBoard from the California Department of Fish and Game. California Dept. of Fish andGame, Bay-Delta Project, Stockton, CA.
Williams MJ, Ogle RS, Knight AW, Burau RG (1994) Effects of sulfate on selenate uptake andtoxicity in the green alga Selenastrum capricornutum. Archives of EnvironmentalContamination & Toxicology, 27(4): 449-453.
Woock SE, Garrett WR, Partin WE, Bryson WT (1987) Decreased survival and teratogenisisduring laboratory selenium exposures to bluegill, Lepomis macrochirus. BulletinEnvironmental Contamination and Toxicology 39:998-1005.
Wrench JJ (1978) Selenium metabolism in the marine phytoplankters Tetraselmis tetrahele andDunaliella minuta. Marine Biology 49:231-236.
Wrench JJ, Campbell NC (1981) Protein-bound selenium in some marine organisms.Chemosphere 10:1155-1161.
Wrench JJ, Measures CI (1982) Temporal variations in dissolved selenium in a coastalecosystem. Nature 299:431-433.
Xu Y, Wang WX, Hsieh DPH (2001) Influences of metal concentration in phytoplankton andseawater on metal assimilation and elimination in marine copepods. EnvironmentalToxicology and Chemistry 20(5):1067-1077.
Clean Estuary Partnership
Selenium in San Francisco Bay: Conceptual Model/Impairment Assessment – Final Report Page 64
Zawislanski PT (2003) Selenium Loads to South San Francisco Bay, California, LFR - LevineFricke, Oakland, CA.
Zehr JP, Oremland RS (1987) Reduction of selenate to selenide by sulfate-respiring bacteria:experiments with cell suspensions and estuarine sediments. Applies EnvironmentalMicrobiology 53(6):1365-1369.
Zhang GH, Hu MH, Huang YP (1990) Se uptake and accumulation in marine phytoplankton andtransfer of Se to thee clam Puditapes philippnarum. Marine Environmental Research30:179-190.
Zhang Y, Moore JN (1997) Interaction of selenate with a wetland sediment. AppliedGeochemistry 12:685-691.
Clean Estuary Partnership
Selenium in San Francisco Bay: Conceptual Model/Impairment Assessment – Final Report Page 65
Appendix A
Timeline of events relevant to the Clean Estuary Partnershipand important selenium management issues in SanFrancisco Bay

Clean Estuary Partnership
Selenium in San Francisco Bay: Conceptual Model/Impairment Assessment – Final Report Page 66
Date Event Reference
1960 Federal San Luis Act Authorizes Construction of the San Luis Unit of the CVP, providing irrigationwater for 700,000 acres in the western San Joaquin valley
(United States Bureau ofReclamation, 2002)
1967 California’s Porter-Cologne Water Quality Control Act signed into law by Edmund Brown
1968 – 1975 Construction of 83 miles of the San Luis Drain (SLD) and Kesterson Reservoir to provide drainageand temporary storage for agricultural tailwaters
(United States Bureau ofReclamation, 2002)
1972 Congress overrides Richard Nixon’s veto to pass the Federal Clean Water Act on October 18, 1972. David
1975 Construction of SLD halted pending determination of final point of discharge (United States Bureau ofReclamation, 2002)
1975 – 1979Kesterson Reservoir functions as an evaporation facility, resulting in elevated concentrations ofselenate and bacterially mediated conversion to selenite, oganoselenide, and particulate selenium ona waterway in the path of birds migrating along the Pacific Flyway.
(United States Bureau ofReclamation, 2002);(Ohlendorf, 2002)
1983 – 1985 Studies conducted by USFWS and CDFG to assess effects of agricultural drainwater on Birds ofKesterson Reservoir; deaths and significant deformities linked to selenium bioaccumulation. (Ohlendorf, 2002)
1985 SWRCB orders USBR to clean up and abate conditions at Kesterson Reservoir. (United States Bureau ofReclamation, 2002)
1987 CDFG finds high selenium levels in scoters and scaup from Suisun Marsh. (Taylor, 1997)
1989 Greg Cutter publishes peer-reviewed manuscript demonstrating that oil refineries are substantialsource of selenite to the Bay, (Cutter, 1989)
1987 – 1990 SFRWQCB requires refineries to conduct selenium source investigations and reduction measuresthrough generic provisions in NPDES permits. (Taylor, 1997)
1986 – 1990 CDFG conducts Selenium Verification Studies.(Urquhart et al., 1991);(White, 1988; White,1989)
1991SFRWQCB imposes 50 µg/L effluent limits and performance-based mass limits on oil refineries,with compliance schedule of 3 years. Refineries appeal decision to SWRCB; appeals dismissedwithout prejudice.
(Taylor, 1997)
1991 SWRCB adopts Enclosed Bays and Estuaries Plan, including water quality objectives of 71 µg/L forsalt water and 5 µg/L for fresh water. (Taylor, 1997)
1992 USEPA promulgates 5 µg/L selenium criterion for all of San Francisco Bay (Taylor, 1997)
1992 – 1994 SFRWQCB conducts public hearings to consider Basin Plan Amendments (BPA) for site specificobjectives (BPA) and iterative management plans. (Taylor, 1997)

Clean Estuary Partnership
Selenium in San Francisco Bay: Conceptual Model/Impairment Assessment – Final Report Page 67
Date Event Reference
1991 – 1993 Refineries sue SFRWQCB, challenging scientific basis of effluent limits and feasibility of imposedcompliance schedule. (Taylor, 1997)
1994
Refineries reach settlement agreement with SFRWQCB; settlement includes time schedule forcompliance with effluent limits and agreement to pay $2 million into a selenium fund fordevelopment of mitigation and pollution studies. Settlement and subsequent Regional Board Orderdo not use the word “penalty”
(Taylor, 1997)
1991 – 1994
Environmental groups sue a refinery for violation of interim permit limit established by SFRWQCB,resulting in settlement consistent with SFRWQCB’s effluent limits and time schedule. A secondcoalition of environmental groups sues two refineries on the grounds that the 1994 settlement did notimpose a penalty.
(Taylor, 1997)
1998 SFRWQCB Lists all segments of San Francisco Bay as impaired due to selenium(San Francisco BayRegional Water QualityControl Board, 1998)
2000 U.S. District Court rules that USBR must fulfill its obligation to provide adequate drainage to SanLuis Unit, consistent with 1960 San Luis Act as mandated by congress (Wanger, 2000)
2000 USGS completes analysis forecasting of ecosystem impacts of extension of San Luis Drain (Luoma and Presser,2000)
2001 USBR issues reclamation plan of action in compliance with Wanger ruling. (United States Bureau ofReclamation, 2002)
2002 SFRWQCB Lists additional 5 segments of San Francisco Bay as impaired due to selenium(San Francisco BayRegional Water QualityControl Board, 2002)
2002 USEPA releases Draft Aquatic Life Water Quality Criteria for Selenium, proposing fish whole-bodytissue selenium criteria of 7.9 µg/g dry wt. US EPA 2002
2002 (May)San Francisco Bay Clean Estuary Partnership submits comments to CALFED Ecosystem RestorationProgram RFP process on basis for selenium monitoring at Big Break / Marsh Creek / Dutch Sloughrestoration project and supporting proposals on pilot treatment of selenium in agricultural tailwaters.
Freitas, 2002

Clean Estuary Partnership
Selenium in San Francisco Bay: Conceptual Model/Impairment Assessment – Final Report Page 68
Date Event Reference
2002(November)
After resource agency consultations, USEPA Notifies USFWS and NMFS of intent to developwildlife criteria for selenium for promulgation in the California Toxics Rule
November 20, 2002Letter from C. Kuhlmanto S. Thompson and R.Lent
2002(December)
In-valley disposal selected as preferred alternative in preliminary CEQA / NEPA analysis ofdrainage alternatives by prepared by USBR in compliance with Wanger ruling. This possiblyeliminates the threat of severely increased selenium loadings from extension of the SLD.
(United States Bureau ofReclamation, 2002)
2004 (June) USBR Scheduled to complete draft EIS report on drainage plan (United States Bureau ofReclamation, 2002)
2004(September) USEPA to publish fish-tissue criteria document in Federal Register
2004(December) Interagency working group to develop draft fish-tissue based wildlife criteria values for CTR
November 20, 2002Letter from C. Kuhlmanto S. Thompson and R.Lent
2004(December) Public hearings schedules on USBR draft EIS report on drainage plan (United States Bureau of
Reclamation, 2002)
2005 (June) USBR scheduled to complete final documents and ROD on drainage plan (United States Bureau ofReclamation, 2002)
2005 (June) San Francisco Bay Clean Estuary Partnership develops an impairment assessment and conceptualmodel report for selenium in SF Bay
Abu-Saba and Ogle, 2005(This report)
2005(September) Completion of external technical peer review of wildlife criteria
November 20, 2002Letter from C. Kuhlmanto S. Thompson and R.Lent
2005 – future Implementation of USBR drainage plan for the San Luis Unit of the CVP (United States Bureau ofReclamation, 2002)
2006(December) EPA Proposes changes to the CTR for wildlife criteria
November 20, 2002Letter from C. Kuhlmanto S. Thompson and R.Lent