FINAL REPORT - Transportation Research...
56
FINAL REPORT On Project 25-34 Supplemental Guidance on the Application of FHWA’s Traffic Noise Model (TNM) APPENDIX J Wind and Temperature Gradients Prepared for: National Cooperative Highway Research Program (NCHRP) Transportation Research Board of The National Academies March 2014 HMMH Report No. 304780 Prepared by: Research Topic Lead in association with Bowlby & Associates, Inc. Environmental Acoustics Grant S. Anderson Douglas E. Barrett
Transcript of FINAL REPORT - Transportation Research...
FINAL REPORT
On Project 25-34 Supplemental Guidance on the Application of
FHWA’s Traffic Noise Model (TNM)
APPENDIX J Wind and Temperature Gradients
Prepared for: National Cooperative Highway Research Program (NCHRP)
Transportation Research Board of
The National Academies
March 2014 HMMH Report No. 304780
Prepared by: Research Topic Lead
in association with
Bowlby & Associates, Inc. Environmental Acoustics
Grant S. Anderson Douglas E. Barrett


Final Technical Report: NCHRP 25-34 – Supplemental Guidance on the Application of FHWA’s TNM Appendix J Wind and Temperature Gradients
Contents Appendix J Wind and Temperature Gradients .............................................................................. J-1
J.1 Introduction .................................................................................................................................. J-1
J.2 Literature Review ......................................................................................................................... J-1 J.2.1 Caltrans: Route 99 Barrier Study and I-80 Davis OGAC Pavement Noise Study ......................... J-1 J.2.2 Atmospheric Effects Associated with Highway Noise Propagation ............................................... J-3 J.2.3 Validation of FHWA’s Traffic Noise Model (TNM): Phase1 ........................................................... J-4 J.2.4 Nord2000 Reports .......................................................................................................................... J-5 J.2.5 Springer Handbook of Acoustics .................................................................................................... J-6 J.2.6 Sound Intensity Attributed To Temperature Inversion At Night ..................................................... J-7 J.2.7 A Study of Air-To-Ground Sound Propagation Using An Instrumented Meteorological Tower ..... J-7
J.3 Modeling Parameters ................................................................................................................... J-7
J.4 Effect of Wind and Temperature Conditions on Highway Noise Source ............................... J-8 J.4.1 Sound Level Differences between Varying Wind and Calm Conditions with Autos and Trucks ... J-8 J.4.2 Sound Level Differences between Varying Temperature and Calm Conditions with Autos and Trucks ..................................................................................................................................................... J-13 J.4.3 Sound Level Differences between Varying Wind and Calm Conditions with Autos Only ............ J-17 J.4.4 Sound Level Differences between Varying Temperature and Calm Conditions with Autos Only J-22 J.4.5 Hourly Sound Level (Leq) for Varying Wind and Calm Conditions with Autos and Trucks ........... J-26 J.4.6 Hourly Sound Level (Leq) for Varying Temperature and Calm Conditions with Autos and Trucks ..... ..................................................................................................................................................... J-31 J.4.7 Hourly Sound Level (Leq) for Varying Wind and Calm Conditions with Autos Only ..................... J-35 J.4.8 Hourly Sound Level (Leq) for Varying Temperature and Calm Conditions with Autos Only ......... J-40
J.5 Combined Effects of Wind and Temperature Gradients on Highway Noise Source ........... J-44
iii
Final Technical Report: NCHRP 25-34 – Supplemental Guidance on the Application of FHWA’s TNM Appendix J Wind and Temperature Gradients
(This page intentionally left blank)
iv
Final Technical Report: NCHRP 25-34 – Supplemental Guidance on the Application of FHWA’s TNM Appendix J Wind and Temperature Gradients
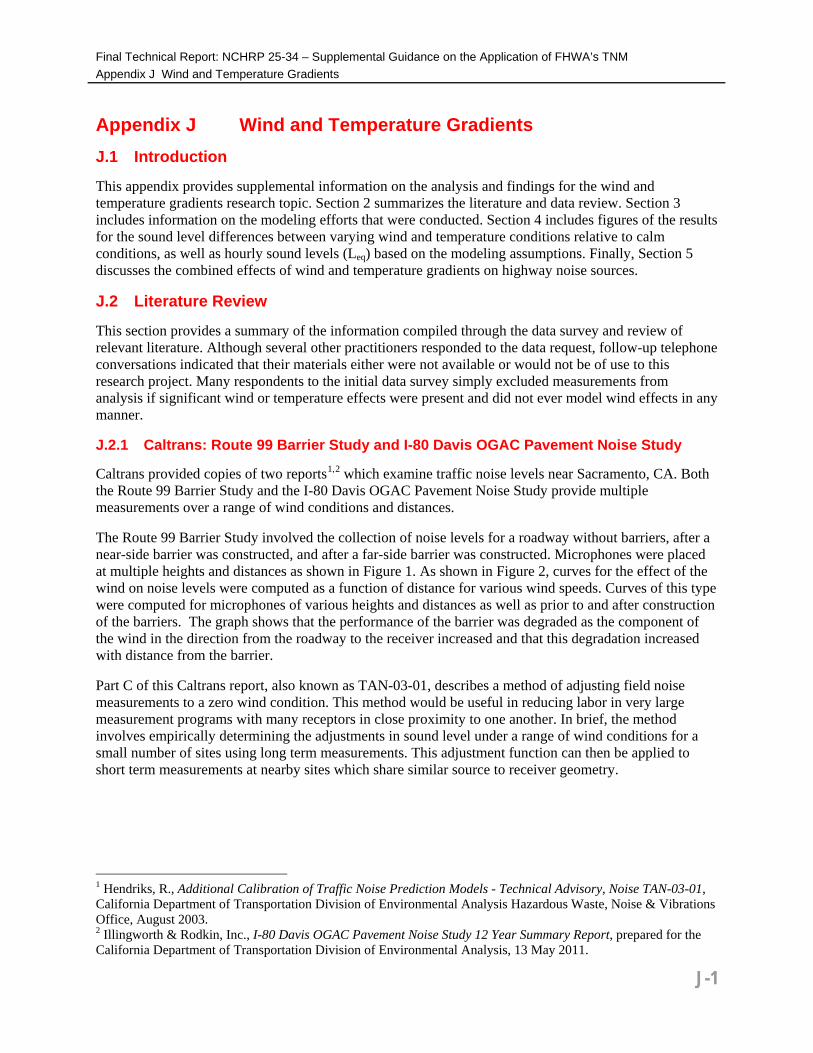
Appendix J Wind and Temperature Gradients J.1 Introduction
This appendix provides supplemental information on the analysis and findings for the wind and temperature gradients research topic. Section 2 summarizes the literature and data review. Section 3 includes information on the modeling efforts that were conducted. Section 4 includes figures of the results for the sound level differences between varying wind and temperature conditions relative to calm conditions, as well as hourly sound levels (Leq) based on the modeling assumptions. Finally, Section 5 discusses the combined effects of wind and temperature gradients on highway noise sources.
J.2 Literature Review
This section provides a summary of the information compiled through the data survey and review of relevant literature. Although several other practitioners responded to the data request, follow-up telephone conversations indicated that their materials either were not available or would not be of use to this research project. Many respondents to the initial data survey simply excluded measurements from analysis if significant wind or temperature effects were present and did not ever model wind effects in any manner.
J.2.1 Caltrans: Route 99 Barrier Study and I-80 Davis OGAC Pavement Noise Study
Caltrans provided copies of two reports1,2 which examine traffic noise levels near Sacramento, CA. Both the Route 99 Barrier Study and the I-80 Davis OGAC Pavement Noise Study provide multiple measurements over a range of wind conditions and distances.
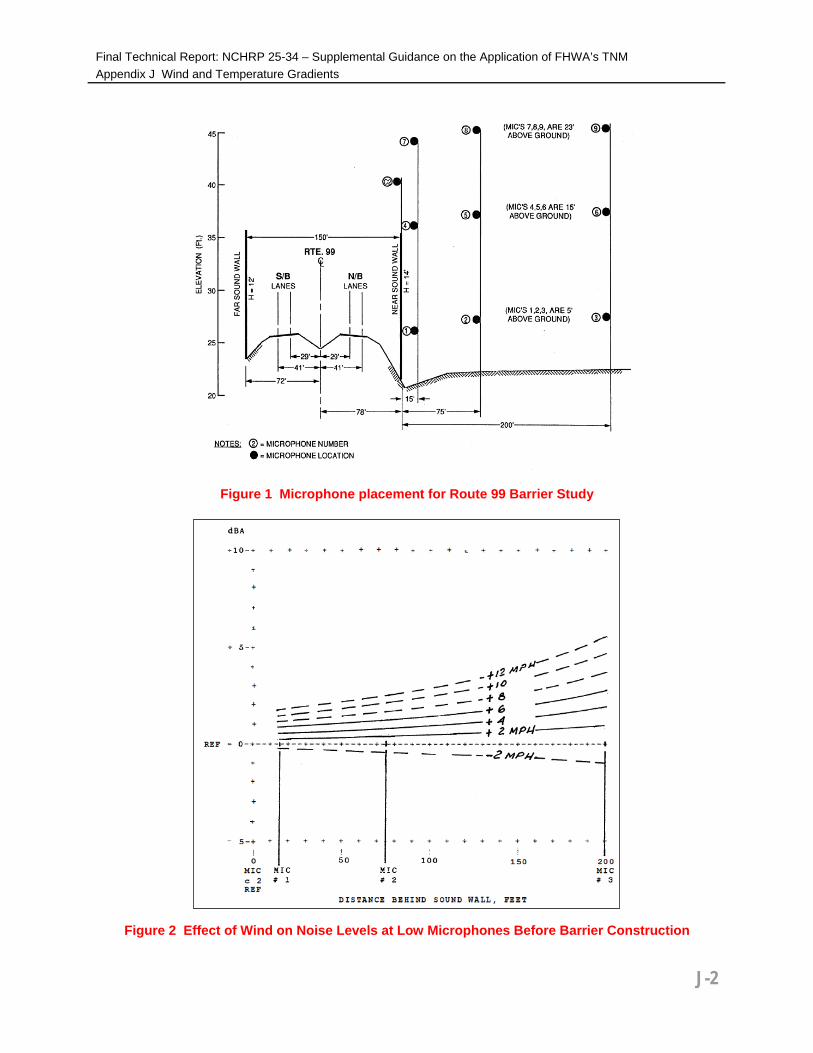
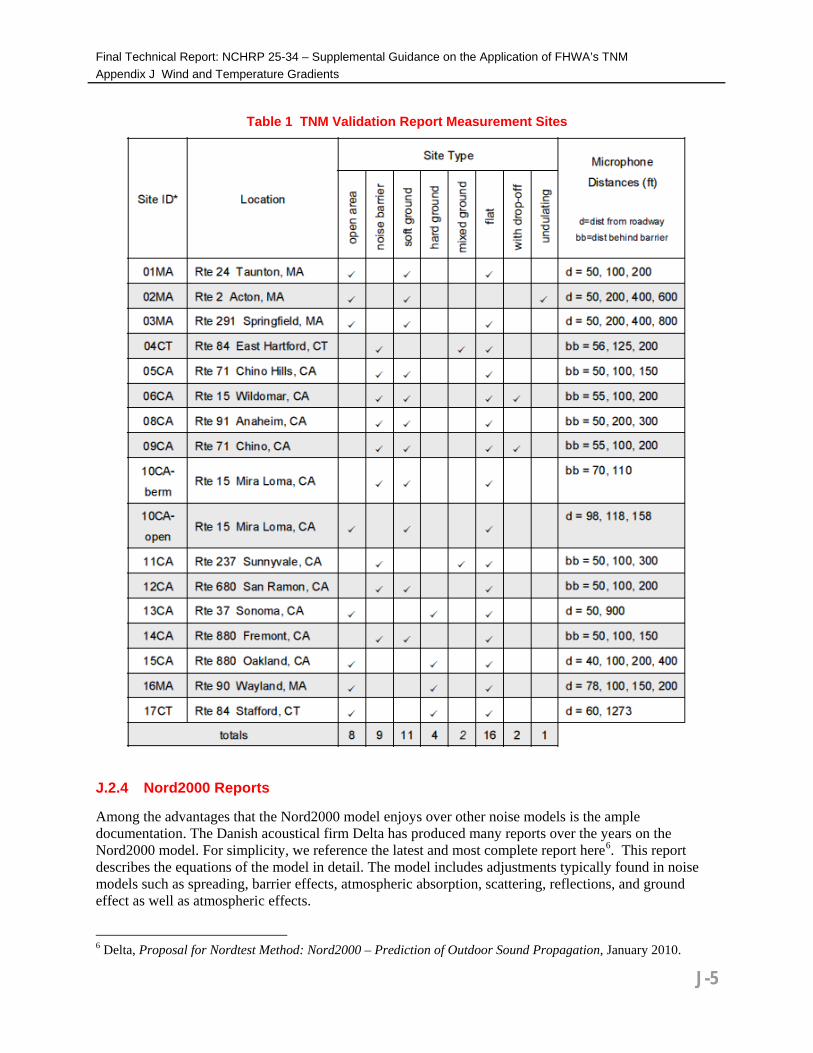
The Route 99 Barrier Study involved the collection of noise levels for a roadway without barriers, after a near-side barrier was constructed, and after a far-side barrier was constructed. Microphones were placed at multiple heights and distances as shown in Figure 1. As shown in Figure 2, curves for the effect of the wind on noise levels were computed as a function of distance for various wind speeds. Curves of this type were computed for microphones of various heights and distances as well as prior to and after construction of the barriers. The graph shows that the performance of the barrier was degraded as the component of the wind in the direction from the roadway to the receiver increased and that this degradation increased with distance from the barrier.
Part C of this Caltrans report, also known as TAN-03-01, describes a method of adjusting field noise measurements to a zero wind condition. This method would be useful in reducing labor in very large measurement programs with many receptors in close proximity to one another. In brief, the method involves empirically determining the adjustments in sound level under a range of wind conditions for a small number of sites using long term measurements. This adjustment function can then be applied to short term measurements at nearby sites which share similar source to receiver geometry.
1 Hendriks, R., Additional Calibration of Traffic Noise Prediction Models - Technical Advisory, Noise TAN-03-01, California Department of Transportation Division of Environmental Analysis Hazardous Waste, Noise & Vibrations Office, August 2003. 2 Illingworth & Rodkin, Inc., I-80 Davis OGAC Pavement Noise Study 12 Year Summary Report, prepared for the California Department of Transportation Division of Environmental Analysis, 13 May 2011.
J-1
Final Technical Report: NCHRP 25-34 – Supplemental Guidance on the Application of FHWA’s TNM Appendix J Wind and Temperature Gradients
Figure 1 Microphone placement for Route 99 Barrier Study
Figure 2 Effect of Wind on Noise Levels at Low Microphones Before Barrier Construction
J-2

Final Technical Report: NCHRP 25-34 – Supplemental Guidance on the Application of FHWA’s TNM Appendix J Wind and Temperature Gradients The I-80 Davis OGAC Pavement Noise Study examined noise levels over a 12-year period to track changes in noise levels due to the replacement of dense graded asphalt concrete with open-graded asphalt concrete and the subsequent wear of the OGAC. The area is quite open and flat and regularly subject to wind. Measurements were made near the roadway and at two heights distant from the roadway. The use of a closely positioned reference microphone helped to isolate the effects of wind as shown in Figure 3. For reference, the offset between the two positions as predicted by TNM is shown by the large gray dot.
Figure 3 Offset Between Reference and Distance Position as a Function of Wind Speed The I-80 Study also identifies a temperature gradient associated with typical weak lapse conditions. The report states, “Summer and spring periods typically had a normal low-level temperature lapse of about -0.056°F/ft (-0.1°C/m) present.” This temperature gradient was used to model the effects of weak lapse conditions on highway noise sources.
J.2.2 Atmospheric Effects Associated with Highway Noise Propagation
A report prepared by Saurenman, et. al. for the Arizona DOT examines the unique atmospheric effects in the Phoenix Valley.3 The study collected detailed wind and temperature profile data and noise levels at four sites over three weeks in March and October of 2004. Calculations in the study are focused on the consistent diurnal variations in temperature profiles and wind speeds. The environment for the study was characterized by temperature inversions and “nighttime down-slope drainage flows off the mountain ranges” with “low speed jets at elevations of 15 to 100m” which “cause localized focusing and de-focusing of sound levels.” Noise modeling was conducted using a Parabolic Equation model. Given the unique weather and modeling techniques, the conclusions of this study added to the base of knowledge
3 Saurenman, H., Chambers, J., Sutherland, L.C., Bronsdon, R.L., Forschner, H., Atmospheric Effects Associated with Highway Noise Prediction – Final Report 555, FHWA-AZ-05-555, prepared for the Arizona Department of Transportation, October 2005.
J-3

Final Technical Report: NCHRP 25-34 – Supplemental Guidance on the Application of FHWA’s TNM Appendix J Wind and Temperature Gradients showing the range of expected atmospheric effects on noise propagation, though the particular conclusions of the study may not be considered widely applicable to other locations.
Figure 4 shows hourly near-ground temperature profiles for one day of the study. Note the inversion conditions in the early morning and again starting in the evening. The data collected by Saurenman, et.al. suggest that the temperature gradient associated with a strong lapse is approximately -0.3°C/m, while the temperature gradient associated with a strong inversion is approximately +0.5°C/m. These rates of change in temperature with height above ground were used in the modeling of traffic noise for the present study.
Figure 4 Example Temperature Profile Graph
J.2.3 Validation of FHWA’s Traffic Noise Model (TNM): Phase1
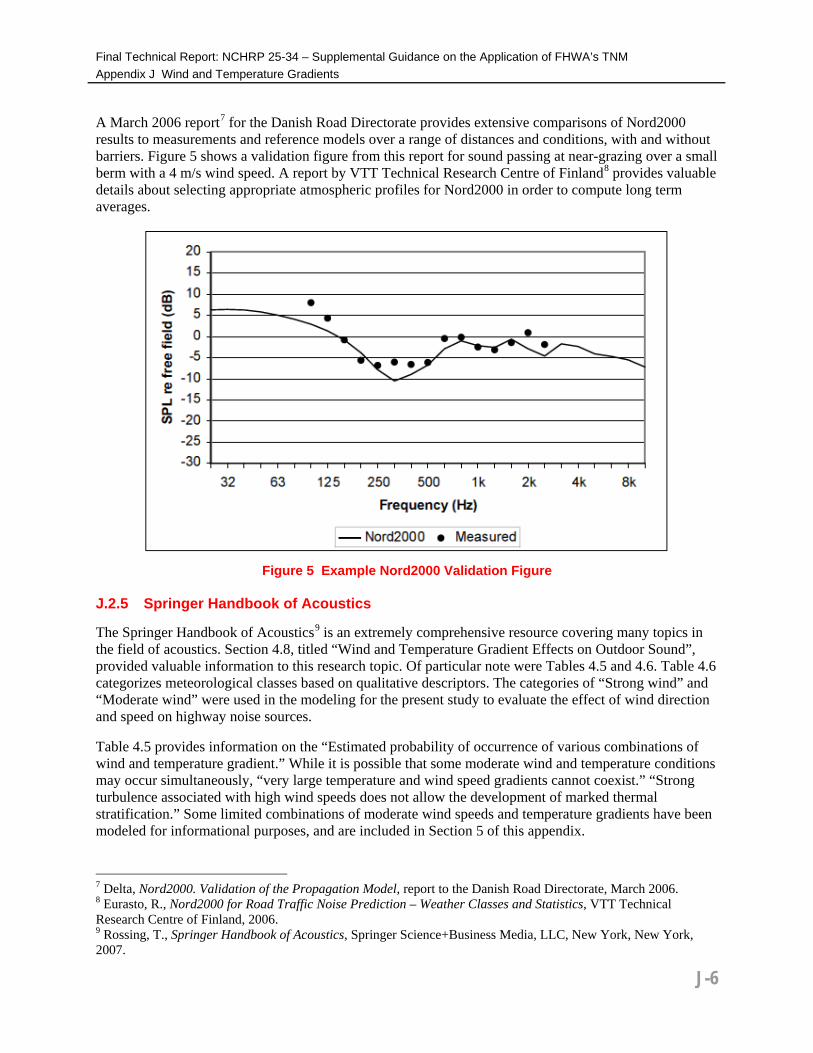
The TNM Validation Study4,5 was commissioned in support of the Federal Highway Administration and Caltrans to assess the accuracy of the TNM and make recommendations on its use. In this study measurements were made at a range of distances, with propagation over grass, pavement, dirt, and water. Measurements were made at sites with and without barriers and under varying wind conditions. Close-in microphones provide a valuable reference and the measurements are accompanied by TNM 2.5 modeling results. Table 1 below shows the variety of sites used in the validation report.
4 Rochat, J.L. and G.G. Fleming, Validation of FHWA’s Traffic Noise Model® (TNM): Phase 1, Reports DOT-VNTSC-FHWA-02-01 and FHWA-EP-02-031, Acoustics Facility, John A. Volpe National Transportation Systems Center, Cambridge MA, August 2002. 5 Rochat, J.L. and G.G. Fleming, TNM Version 2.5 Addendum to Validation of FHWA’s Traffic Noise Model® (TNM): Phase 1, Reports DOT-VNTSC-FHWA-02-01 Addendum and FHWA-EP-02-031 Addendum, Acoustics Facility, John A. Volpe National Transportation Systems Center, Cambridge MA, July 2004.
J-4
Final Technical Report: NCHRP 25-34 – Supplemental Guidance on the Application of FHWA’s TNM Appendix J Wind and Temperature Gradients
Table 1 TNM Validation Report Measurement Sites
J.2.4 Nord2000 Reports
Among the advantages that the Nord2000 model enjoys over other noise models is the ample documentation. The Danish acoustical firm Delta has produced many reports over the years on the Nord2000 model. For simplicity, we reference the latest and most complete report here6. This report describes the equations of the model in detail. The model includes adjustments typically found in noise models such as spreading, barrier effects, atmospheric absorption, scattering, reflections, and ground effect as well as atmospheric effects.
6 Delta, Proposal for Nordtest Method: Nord2000 – Prediction of Outdoor Sound Propagation, January 2010.
J-5
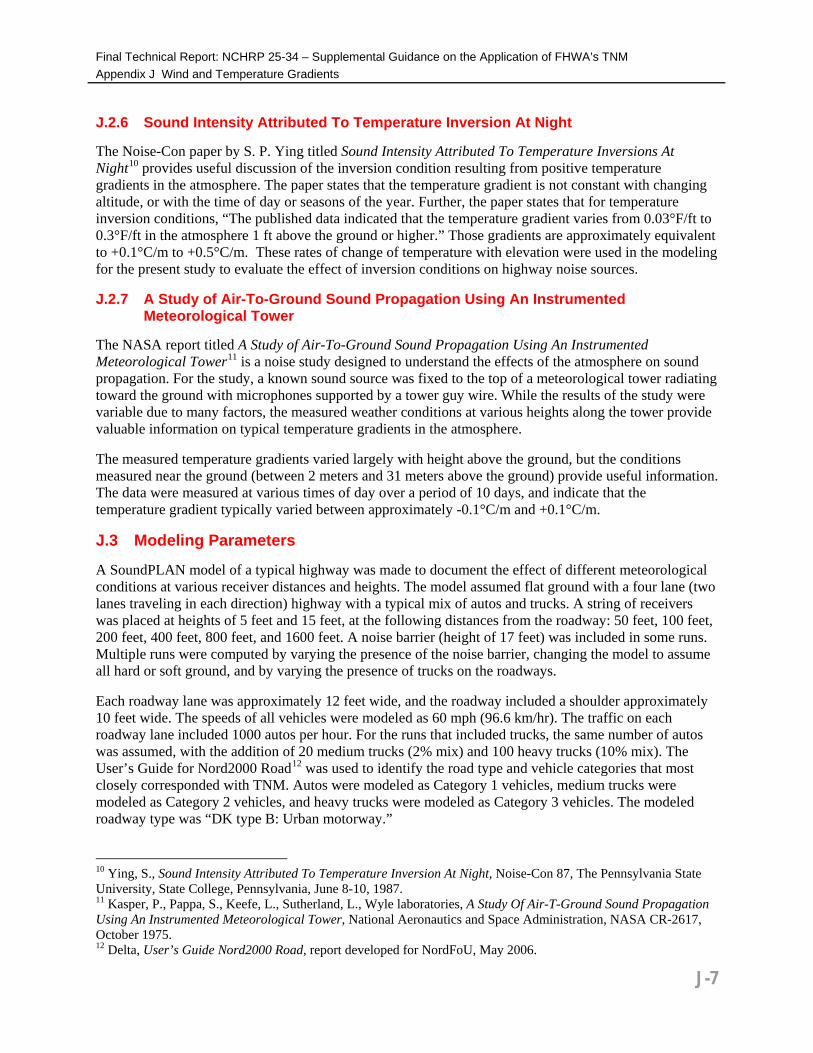
Final Technical Report: NCHRP 25-34 – Supplemental Guidance on the Application of FHWA’s TNM Appendix J Wind and Temperature Gradients A March 2006 report7 for the Danish Road Directorate provides extensive comparisons of Nord2000 results to measurements and reference models over a range of distances and conditions, with and without barriers. Figure 5 shows a validation figure from this report for sound passing at near-grazing over a small berm with a 4 m/s wind speed. A report by VTT Technical Research Centre of Finland8 provides valuable details about selecting appropriate atmospheric profiles for Nord2000 in order to compute long term averages.
Figure 5 Example Nord2000 Validation Figure
J.2.5 Springer Handbook of Acoustics
The Springer Handbook of Acoustics9 is an extremely comprehensive resource covering many topics in the field of acoustics. Section 4.8, titled “Wind and Temperature Gradient Effects on Outdoor Sound”, provided valuable information to this research topic. Of particular note were Tables 4.5 and 4.6. Table 4.6 categorizes meteorological classes based on qualitative descriptors. The categories of “Strong wind” and “Moderate wind” were used in the modeling for the present study to evaluate the effect of wind direction and speed on highway noise sources.
Table 4.5 provides information on the “Estimated probability of occurrence of various combinations of wind and temperature gradient.” While it is possible that some moderate wind and temperature conditions may occur simultaneously, “very large temperature and wind speed gradients cannot coexist.” “Strong turbulence associated with high wind speeds does not allow the development of marked thermal stratification.” Some limited combinations of moderate wind speeds and temperature gradients have been modeled for informational purposes, and are included in Section 5 of this appendix.
7 Delta, Nord2000. Validation of the Propagation Model, report to the Danish Road Directorate, March 2006. 8 Eurasto, R., Nord2000 for Road Traffic Noise Prediction – Weather Classes and Statistics, VTT Technical Research Centre of Finland, 2006. 9 Rossing, T., Springer Handbook of Acoustics, Springer Science+Business Media, LLC, New York, New York, 2007.
J-6
Final Technical Report: NCHRP 25-34 – Supplemental Guidance on the Application of FHWA’s TNM Appendix J Wind and Temperature Gradients J.2.6 Sound Intensity Attributed To Temperature Inversion At Night
The Noise-Con paper by S. P. Ying titled Sound Intensity Attributed To Temperature Inversions At Night10 provides useful discussion of the inversion condition resulting from positive temperature gradients in the atmosphere. The paper states that the temperature gradient is not constant with changing altitude, or with the time of day or seasons of the year. Further, the paper states that for temperature inversion conditions, “The published data indicated that the temperature gradient varies from 0.03°F/ft to 0.3°F/ft in the atmosphere 1 ft above the ground or higher.” Those gradients are approximately equivalent to +0.1°C/m to +0.5°C/m. These rates of change of temperature with elevation were used in the modeling for the present study to evaluate the effect of inversion conditions on highway noise sources.
J.2.7 A Study of Air-To-Ground Sound Propagation Using An Instrumented Meteorological Tower
The NASA report titled A Study of Air-To-Ground Sound Propagation Using An Instrumented Meteorological Tower11 is a noise study designed to understand the effects of the atmosphere on sound propagation. For the study, a known sound source was fixed to the top of a meteorological tower radiating toward the ground with microphones supported by a tower guy wire. While the results of the study were variable due to many factors, the measured weather conditions at various heights along the tower provide valuable information on typical temperature gradients in the atmosphere.
The measured temperature gradients varied largely with height above the ground, but the conditions measured near the ground (between 2 meters and 31 meters above the ground) provide useful information. The data were measured at various times of day over a period of 10 days, and indicate that the temperature gradient typically varied between approximately -0.1°C/m and +0.1°C/m.
J.3 Modeling Parameters
A SoundPLAN model of a typical highway was made to document the effect of different meteorological conditions at various receiver distances and heights. The model assumed flat ground with a four lane (two lanes traveling in each direction) highway with a typical mix of autos and trucks. A string of receivers was placed at heights of 5 feet and 15 feet, at the following distances from the roadway: 50 feet, 100 feet, 200 feet, 400 feet, 800 feet, and 1600 feet. A noise barrier (height of 17 feet) was included in some runs. Multiple runs were computed by varying the presence of the noise barrier, changing the model to assume all hard or soft ground, and by varying the presence of trucks on the roadways.
Each roadway lane was approximately 12 feet wide, and the roadway included a shoulder approximately 10 feet wide. The speeds of all vehicles were modeled as 60 mph (96.6 km/hr). The traffic on each roadway lane included 1000 autos per hour. For the runs that included trucks, the same number of autos was assumed, with the addition of 20 medium trucks (2% mix) and 100 heavy trucks (10% mix). The User’s Guide for Nord2000 Road12 was used to identify the road type and vehicle categories that most closely corresponded with TNM. Autos were modeled as Category 1 vehicles, medium trucks were modeled as Category 2 vehicles, and heavy trucks were modeled as Category 3 vehicles. The modeled roadway type was “DK type B: Urban motorway.”
10 Ying, S., Sound Intensity Attributed To Temperature Inversion At Night, Noise-Con 87, The Pennsylvania State University, State College, Pennsylvania, June 8-10, 1987. 11 Kasper, P., Pappa, S., Keefe, L., Sutherland, L., Wyle laboratories, A Study Of Air-T-Ground Sound Propagation Using An Instrumented Meteorological Tower, National Aeronautics and Space Administration, NASA CR-2617, October 1975. 12 Delta, User’s Guide Nord2000 Road, report developed for NordFoU, May 2006.
J-7
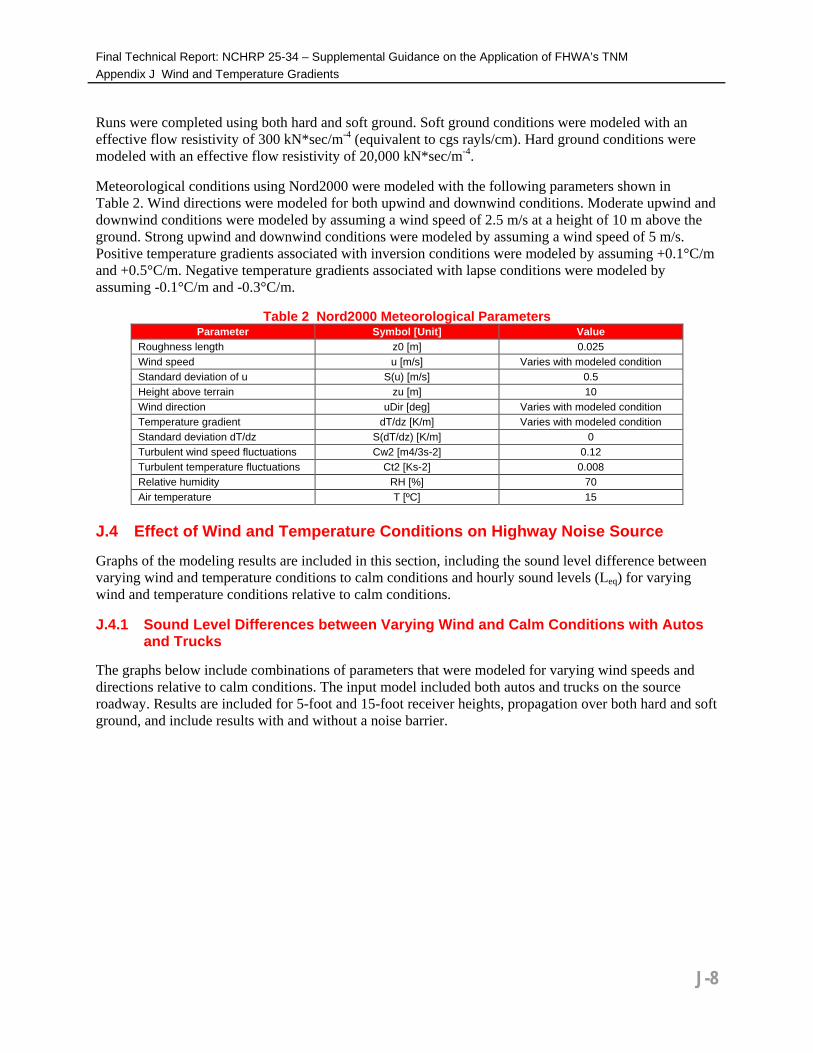
Final Technical Report: NCHRP 25-34 – Supplemental Guidance on the Application of FHWA’s TNM Appendix J Wind and Temperature Gradients Runs were completed using both hard and soft ground. Soft ground conditions were modeled with an effective flow resistivity of 300 kN*sec/m-4 (equivalent to cgs rayls/cm). Hard ground conditions were modeled with an effective flow resistivity of 20,000 kN*sec/m-4.
Meteorological conditions using Nord2000 were modeled with the following parameters shown in Table 2. Wind directions were modeled for both upwind and downwind conditions. Moderate upwind and downwind conditions were modeled by assuming a wind speed of 2.5 m/s at a height of 10 m above the ground. Strong upwind and downwind conditions were modeled by assuming a wind speed of 5 m/s. Positive temperature gradients associated with inversion conditions were modeled by assuming +0.1°C/m and +0.5°C/m. Negative temperature gradients associated with lapse conditions were modeled by assuming -0.1°C/m and -0.3°C/m.
Table 2 Nord2000 Meteorological Parameters Parameter Symbol [Unit] Value
Roughness length z0 [m] 0.025 Wind speed u [m/s] Varies with modeled condition Standard deviation of u S(u) [m/s] 0.5 Height above terrain zu [m] 10 Wind direction uDir [deg] Varies with modeled condition Temperature gradient dT/dz [K/m] Varies with modeled condition Standard deviation dT/dz S(dT/dz) [K/m] 0 Turbulent wind speed fluctuations Cw2 [m4/3s-2] 0.12 Turbulent temperature fluctuations Ct2 [Ks-2] 0.008 Relative humidity RH [%] 70 Air temperature T [ºC] 15
J.4 Effect of Wind and Temperature Conditions on Highway Noise Source
Graphs of the modeling results are included in this section, including the sound level difference between varying wind and temperature conditions to calm conditions and hourly sound levels (Leq) for varying wind and temperature conditions relative to calm conditions.
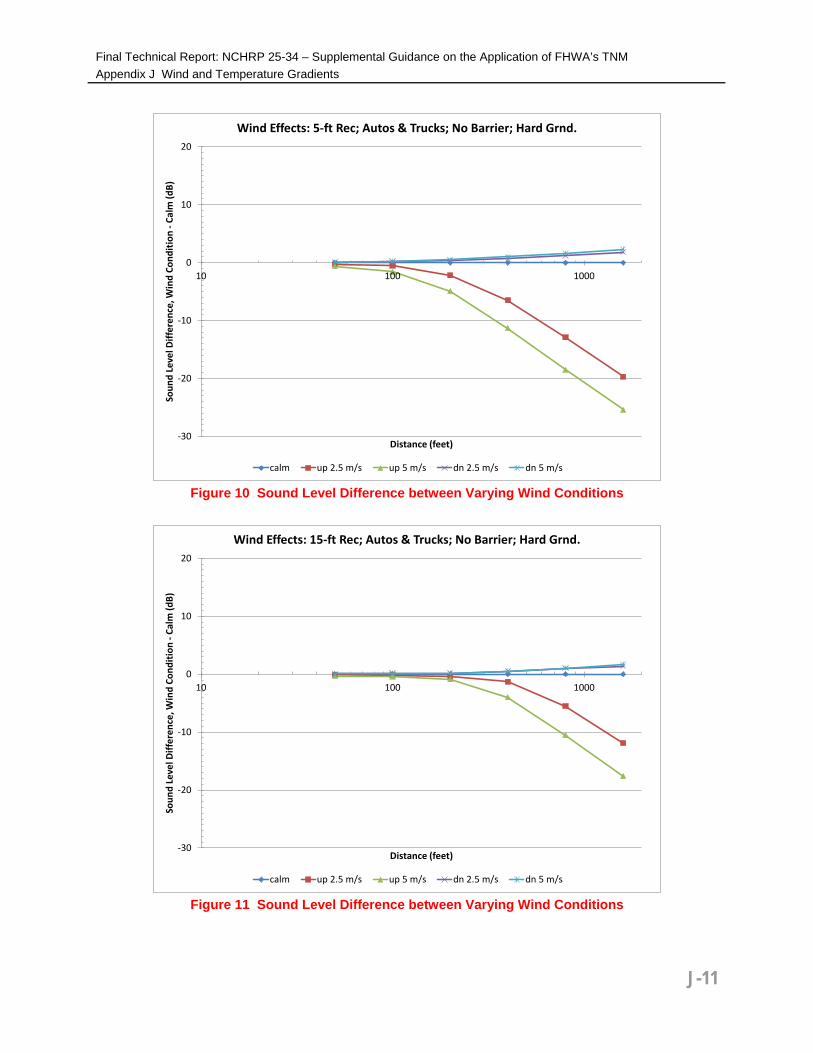
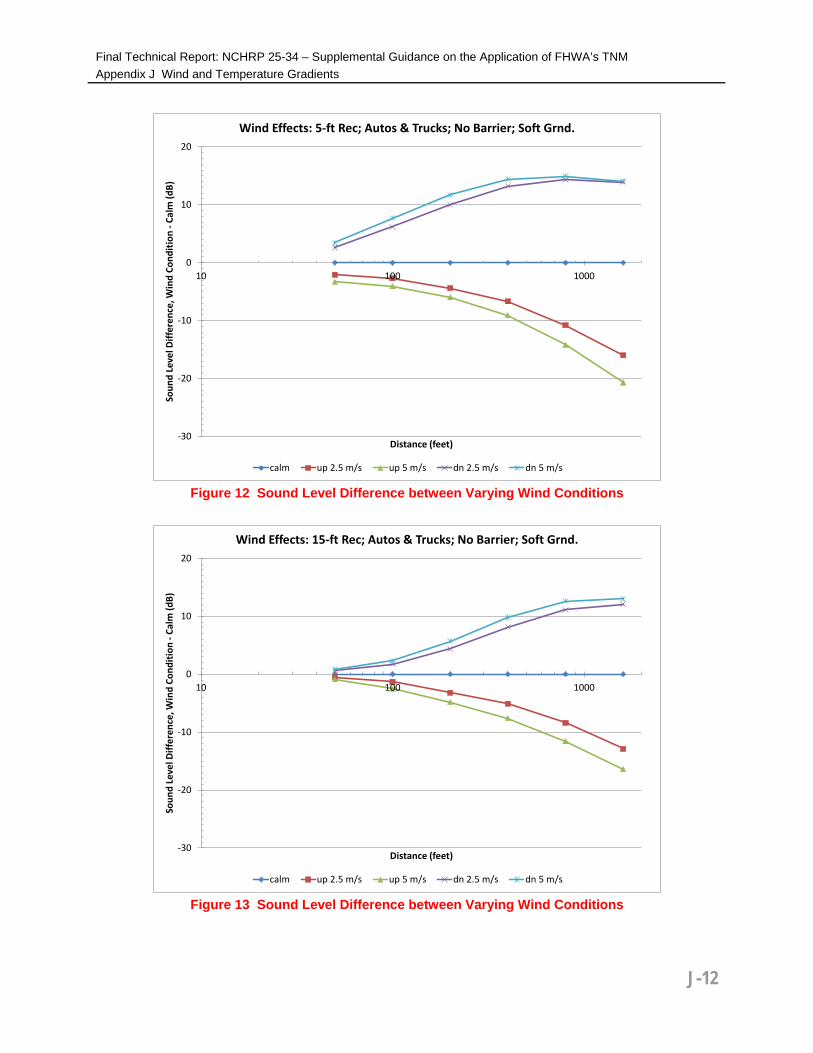
J.4.1 Sound Level Differences between Varying Wind and Calm Conditions with Autos and Trucks
The graphs below include combinations of parameters that were modeled for varying wind speeds and directions relative to calm conditions. The input model included both autos and trucks on the source roadway. Results are included for 5-foot and 15-foot receiver heights, propagation over both hard and soft ground, and include results with and without a noise barrier.
J-8

Final Technical Report: NCHRP 25-34 – Supplemental Guidance on the Application of FHWA’s TNM Appendix J Wind and Temperature Gradients
Figure 6 Sound Level Difference between Varying Wind Conditions
Figure 7 Sound Level Difference between Varying Wind Conditions
-30
-20
-10
0
10
20
10 100 1000
Soun
d Le
vel D
iffer
ence
, Win
d Co
nditi
on -
Calm
(dB)
Distance (feet)
Wind Effects: 5-ft Rec; Autos & Trucks; With Barrier; Hard Grnd.
calm up 2.5 m/s up 5 m/s dn 2.5 m/s dn 5 m/s
-30
-20
-10
0
10
20
10 100 1000
Soun
d Le
vel D
iffer
ence
, Win
d Co
nditi
on -
Calm
(dB)
Distance (feet)
Wind Effects: 15-ft Rec; Autos & Trucks; With Barrier; Hard Grnd.
calm up 2.5 m/s up 5 m/s dn 2.5 m/s dn 5 m/s
J-9

Final Technical Report: NCHRP 25-34 – Supplemental Guidance on the Application of FHWA’s TNM Appendix J Wind and Temperature Gradients
Figure 8 Sound Level Difference between Varying Wind Conditions
Figure 9 Sound Level Difference between Varying Wind Conditions
-30
-20
-10
0
10
20
10 100 1000
Soun
d Le
vel D
iffer
ence
, Win
d Co
nditi
on -
Calm
(dB)
Distance (feet)
Wind Effects: 5-ft Rec; Autos & Trucks; With Barrier; Soft Grnd.
calm up 2.5 m/s up 5 m/s dn 2.5 m/s dn 5 m/s
-30
-20
-10
0
10
20
10 100 1000
Soun
d Le
vel D
iffer
ence
, Win
d Co
nditi
on -
Calm
(dB)
Distance (feet)
Wind Effects: 15-ft Rec; Autos & Trucks; With Barrier; Soft Grnd.
calm up 2.5 m/s up 5 m/s dn 2.5 m/s dn 5 m/s
J-10
Final Technical Report: NCHRP 25-34 – Supplemental Guidance on the Application of FHWA’s TNM Appendix J Wind and Temperature Gradients
Figure 10 Sound Level Difference between Varying Wind Conditions
Figure 11 Sound Level Difference between Varying Wind Conditions
-30
-20
-10
0
10
20
10 100 1000
Soun
d Le
vel D
iffer
ence
, Win
d Co
nditi
on -
Calm
(dB)
Distance (feet)
Wind Effects: 5-ft Rec; Autos & Trucks; No Barrier; Hard Grnd.
calm up 2.5 m/s up 5 m/s dn 2.5 m/s dn 5 m/s
-30
-20
-10
0
10
20
10 100 1000
Soun
d Le
vel D
iffer
ence
, Win
d Co
nditi
on -
Calm
(dB)
Distance (feet)
Wind Effects: 15-ft Rec; Autos & Trucks; No Barrier; Hard Grnd.
calm up 2.5 m/s up 5 m/s dn 2.5 m/s dn 5 m/s
J-11
Final Technical Report: NCHRP 25-34 – Supplemental Guidance on the Application of FHWA’s TNM Appendix J Wind and Temperature Gradients
Figure 12 Sound Level Difference between Varying Wind Conditions
Figure 13 Sound Level Difference between Varying Wind Conditions
-30
-20
-10
0
10
20
10 100 1000
Soun
d Le
vel D
iffer
ence
, Win
d Co
nditi
on -
Calm
(dB)
Distance (feet)
Wind Effects: 5-ft Rec; Autos & Trucks; No Barrier; Soft Grnd.
calm up 2.5 m/s up 5 m/s dn 2.5 m/s dn 5 m/s
-30
-20
-10
0
10
20
10 100 1000
Soun
d Le
vel D
iffer
ence
, Win
d Co
nditi
on -
Calm
(dB)
Distance (feet)
Wind Effects: 15-ft Rec; Autos & Trucks; No Barrier; Soft Grnd.
calm up 2.5 m/s up 5 m/s dn 2.5 m/s dn 5 m/s
J-12

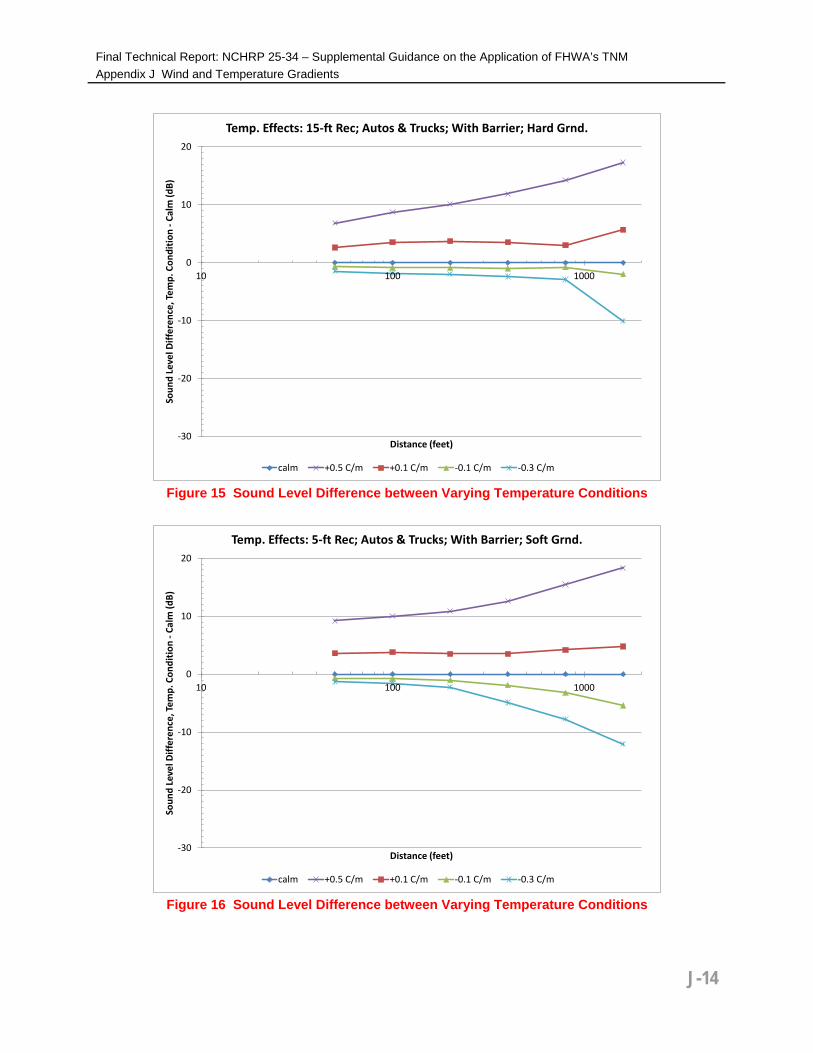
Final Technical Report: NCHRP 25-34 – Supplemental Guidance on the Application of FHWA’s TNM Appendix J Wind and Temperature Gradients J.4.2 Sound Level Differences between Varying Temperature and Calm Conditions with
Autos and Trucks
The graphs below include combinations of parameters that were modeled for varying temperature gradients relative to calm conditions. The input model included both autos and trucks on the source roadway. Results are included for both 5-foot and 15-foot receiver heights, propagation over both hard and soft ground, and include results with and without a noise barrier.
Figure 14 Sound Level Difference between Varying Temperature Conditions
-30
-20
-10
0
10
20
10 100 1000
Soun
d Le
vel D
iffer
ence
, Tem
p. C
ondi
tion
-Cal
m (d
B)
Distance (feet)
Temp. Effects: 5-ft Rec; Autos & Trucks; With Barrier; Hard Grnd.
calm +0.5 C/m +0.1 C/m -0.1 C/m -0.3 C/m
J-13
Final Technical Report: NCHRP 25-34 – Supplemental Guidance on the Application of FHWA’s TNM Appendix J Wind and Temperature Gradients
Figure 15 Sound Level Difference between Varying Temperature Conditions
Figure 16 Sound Level Difference between Varying Temperature Conditions
-30
-20
-10
0
10
20
10 100 1000
Soun
d Le
vel D
iffer
ence
, Tem
p. C
ondi
tion
-Cal
m (d
B)
Distance (feet)
Temp. Effects: 15-ft Rec; Autos & Trucks; With Barrier; Hard Grnd.
calm +0.5 C/m +0.1 C/m -0.1 C/m -0.3 C/m
-30
-20
-10
0
10
20
10 100 1000
Soun
d Le
vel D
iffer
ence
, Tem
p. C
ondi
tion
-Cal
m (d
B)
Distance (feet)
Temp. Effects: 5-ft Rec; Autos & Trucks; With Barrier; Soft Grnd.
calm +0.5 C/m +0.1 C/m -0.1 C/m -0.3 C/m
J-14

Final Technical Report: NCHRP 25-34 – Supplemental Guidance on the Application of FHWA’s TNM Appendix J Wind and Temperature Gradients
Figure 17 Sound Level Difference between Varying Temperature Conditions
Figure 18 Sound Level Difference between Varying Temperature Conditions
-30
-20
-10
0
10
20
10 100 1000
Soun
d Le
vel D
iffer
ence
, Tem
p. C
ondi
tion
-Cal
m (d
B)
Distance (feet)
Temp. Effects: 15-ft Rec; Autos & Trucks; With Barrier; Soft Grnd.
calm +0.5 C/m +0.1 C/m -0.1 C/m -0.3 C/m
-30
-20
-10
0
10
20
10 100 1000
Soun
d Le
vel D
iffer
ence
, Tem
p. C
ondi
tion
-Cal
m (d
B)
Distance (feet)
Temp. Effects: 5-ft Rec; Autos & Trucks; No Barrier; Hard Grnd.
calm +0.5 C/m +0.1 C/m -0.1 C/m -0.3 C/m
J-15

Final Technical Report: NCHRP 25-34 – Supplemental Guidance on the Application of FHWA’s TNM Appendix J Wind and Temperature Gradients
Figure 19 Sound Level Difference between Varying Temperature Conditions
Figure 20 Sound Level Difference between Varying Temperature Conditions
-30
-20
-10
0
10
20
10 100 1000
Soun
d Le
vel D
iffer
ence
, Tem
p. C
ondi
tion
-Cal
m (d
B)
Distance (feet)
Temp. Effects: 15-ft Rec; Autos & Trucks; No Barrier; Hard Grnd.
calm +0.5 C/m +0.1 C/m -0.1 C/m -0.3 C/m
-30
-20
-10
0
10
20
10 100 1000
Soun
d Le
vel D
iffer
ence
, Tem
p. C
ondi
tion
-Cal
m (d
B)
Distance (feet)
Temp. Effects: 5-ft Rec; Autos & Trucks; No Barrier; Soft Grnd.
calm +0.5 C/m +0.1 C/m -0.1 C/m -0.3 C/m
J-16
Final Technical Report: NCHRP 25-34 – Supplemental Guidance on the Application of FHWA’s TNM Appendix J Wind and Temperature Gradients
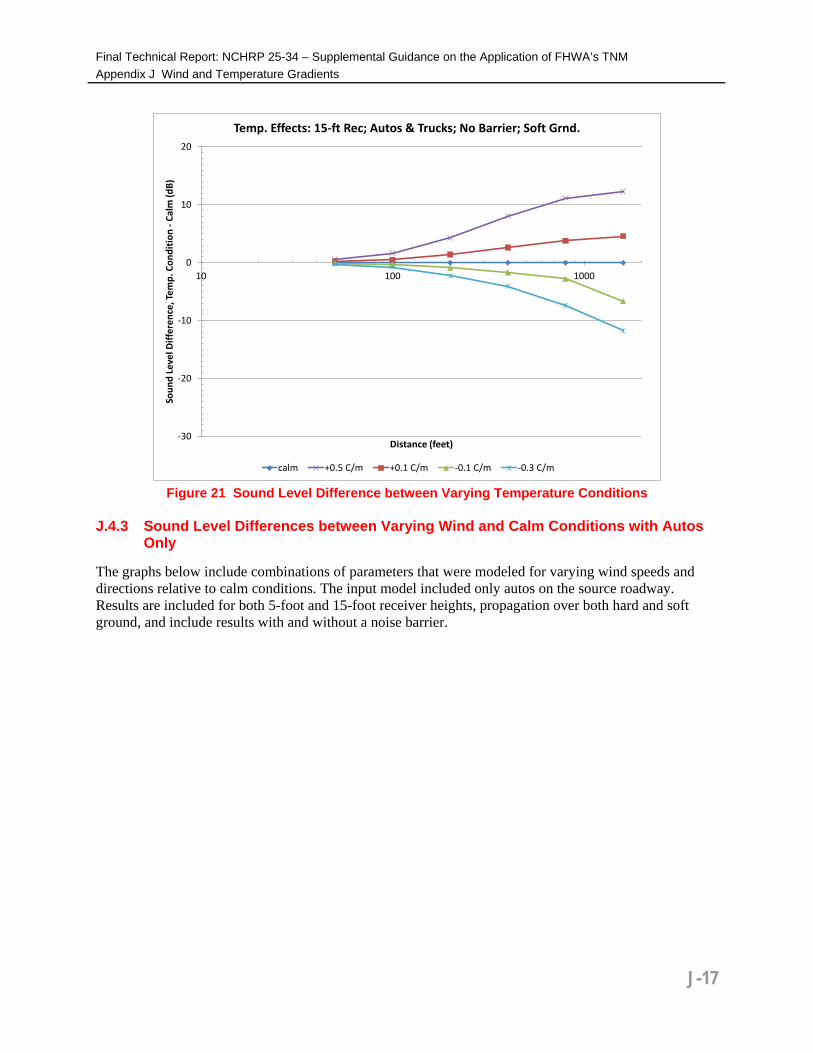
Figure 21 Sound Level Difference between Varying Temperature Conditions
J.4.3 Sound Level Differences between Varying Wind and Calm Conditions with Autos
Only
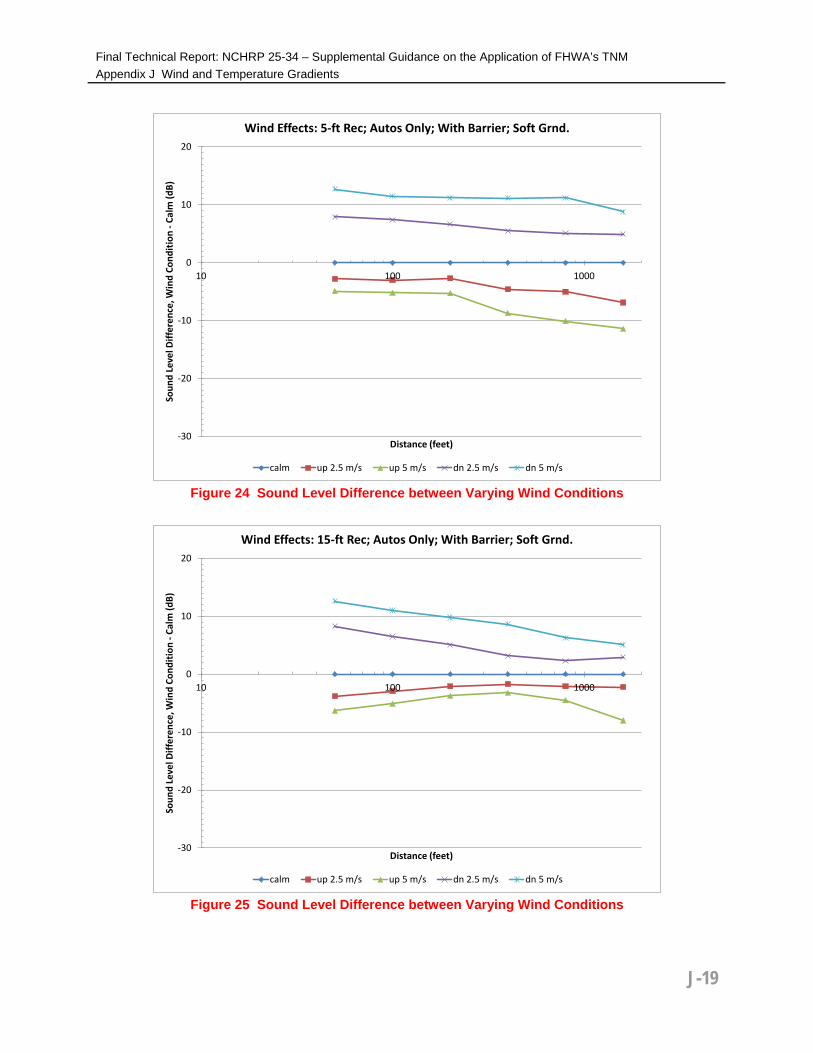
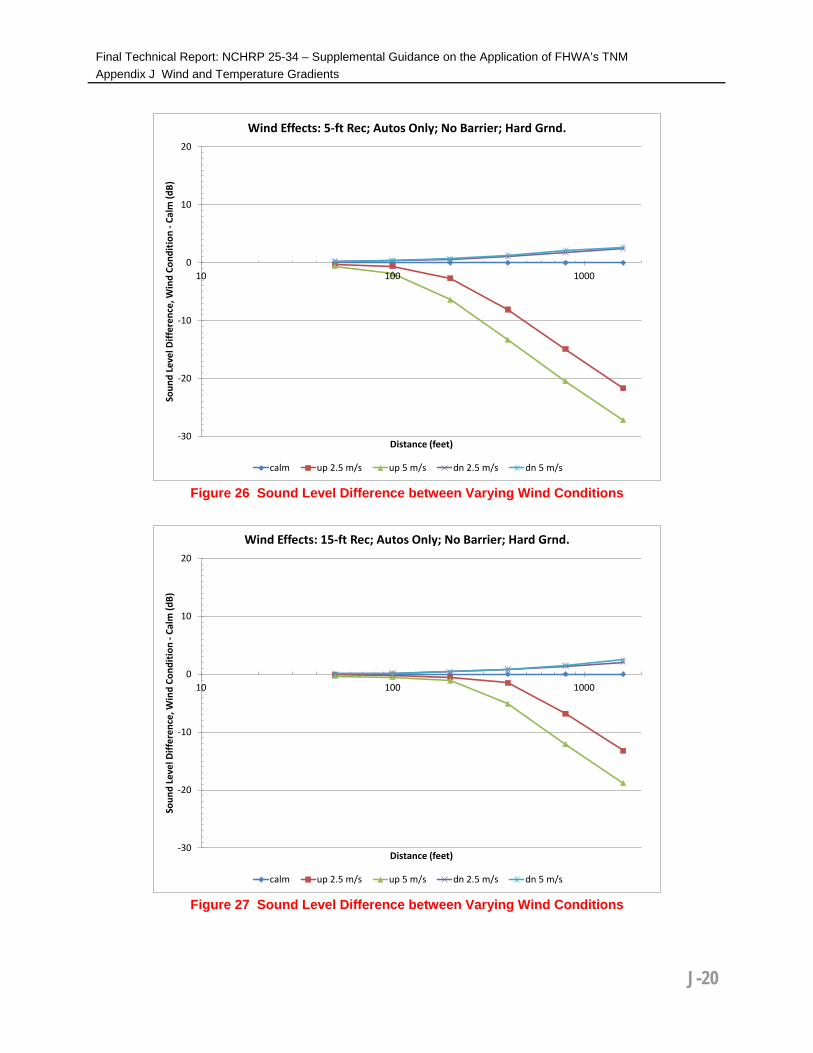
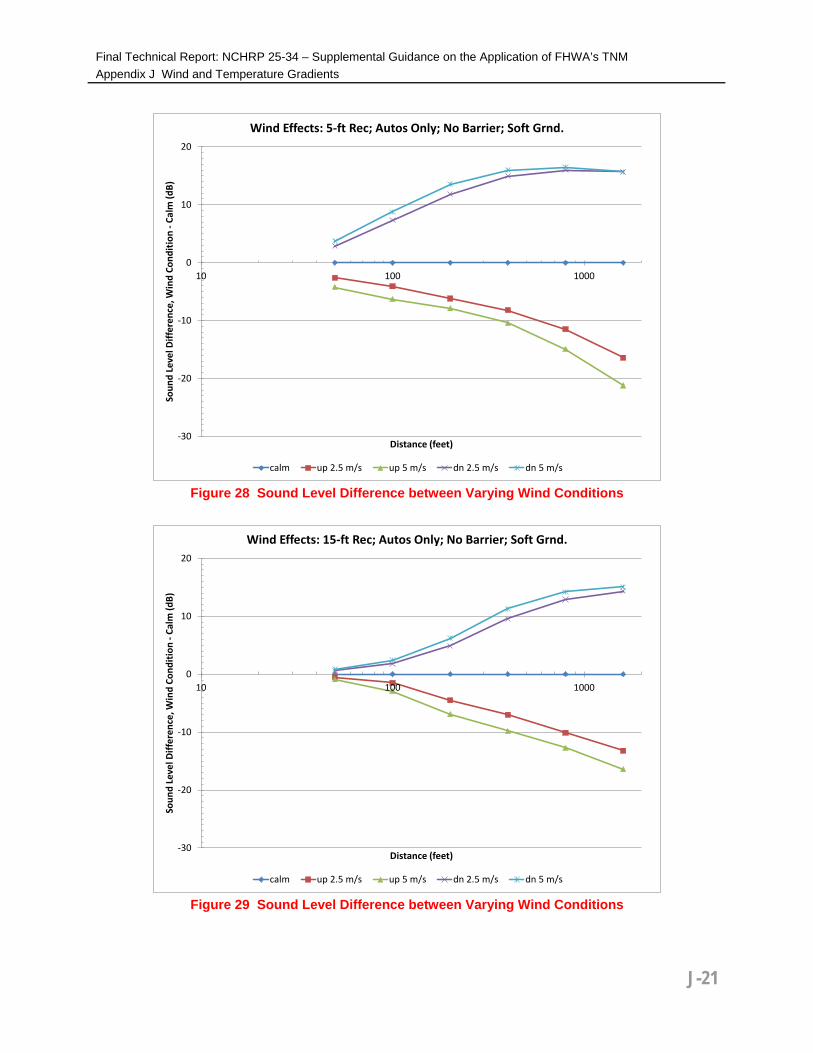
The graphs below include combinations of parameters that were modeled for varying wind speeds and directions relative to calm conditions. The input model included only autos on the source roadway. Results are included for both 5-foot and 15-foot receiver heights, propagation over both hard and soft ground, and include results with and without a noise barrier.
-30
-20
-10
0
10
20
10 100 1000
Soun
d Le
vel D
iffer
ence
, Tem
p. C
ondi
tion
-Cal
m (d
B)
Distance (feet)
Temp. Effects: 15-ft Rec; Autos & Trucks; No Barrier; Soft Grnd.
calm +0.5 C/m +0.1 C/m -0.1 C/m -0.3 C/m
J-17

Final Technical Report: NCHRP 25-34 – Supplemental Guidance on the Application of FHWA’s TNM Appendix J Wind and Temperature Gradients
Figure 22 Sound Level Difference between Varying Wind Conditions
Figure 23 Sound Level Difference between Varying Wind Conditions
-30
-20
-10
0
10
20
10 100 1000
Soun
d Le
vel D
iffer
ence
, Win
d Co
nditi
on -
Calm
(dB)
Distance (feet)
Wind Effects: 5-ft Rec; Autos Only; With Barrier; Hard Grnd.
calm up 2.5 m/s up 5 m/s dn 2.5 m/s dn 5 m/s
-30
-20
-10
0
10
20
10 100 1000
Soun
d Le
vel D
iffer
ence
, Win
d Co
nditi
on -
Calm
(dB)
Distance (feet)
Wind Effects: 15-ft Rec; Autos Only; With Barrier; Hard Grnd.
calm up 2.5 m/s up 5 m/s dn 2.5 m/s dn 5 m/s
J-18
Final Technical Report: NCHRP 25-34 – Supplemental Guidance on the Application of FHWA’s TNM Appendix J Wind and Temperature Gradients
Figure 24 Sound Level Difference between Varying Wind Conditions
Figure 25 Sound Level Difference between Varying Wind Conditions
-30
-20
-10
0
10
20
10 100 1000
Soun
d Le
vel D
iffer
ence
, Win
d Co
nditi
on -
Calm
(dB)
Distance (feet)
Wind Effects: 5-ft Rec; Autos Only; With Barrier; Soft Grnd.
calm up 2.5 m/s up 5 m/s dn 2.5 m/s dn 5 m/s
-30
-20
-10
0
10
20
10 100 1000
Soun
d Le
vel D
iffer
ence
, Win
d Co
nditi
on -
Calm
(dB)
Distance (feet)
Wind Effects: 15-ft Rec; Autos Only; With Barrier; Soft Grnd.
calm up 2.5 m/s up 5 m/s dn 2.5 m/s dn 5 m/s
J-19
Final Technical Report: NCHRP 25-34 – Supplemental Guidance on the Application of FHWA’s TNM Appendix J Wind and Temperature Gradients
Figure 26 Sound Level Difference between Varying Wind Conditions
Figure 27 Sound Level Difference between Varying Wind Conditions
-30
-20
-10
0
10
20
10 100 1000
Soun
d Le
vel D
iffer
ence
, Win
d Co
nditi
on -
Calm
(dB)
Distance (feet)
Wind Effects: 5-ft Rec; Autos Only; No Barrier; Hard Grnd.
calm up 2.5 m/s up 5 m/s dn 2.5 m/s dn 5 m/s
-30
-20
-10
0
10
20
10 100 1000
Soun
d Le
vel D
iffer
ence
, Win
d Co
nditi
on -
Calm
(dB)
Distance (feet)
Wind Effects: 15-ft Rec; Autos Only; No Barrier; Hard Grnd.
calm up 2.5 m/s up 5 m/s dn 2.5 m/s dn 5 m/s
J-20
Final Technical Report: NCHRP 25-34 – Supplemental Guidance on the Application of FHWA’s TNM Appendix J Wind and Temperature Gradients
Figure 28 Sound Level Difference between Varying Wind Conditions
Figure 29 Sound Level Difference between Varying Wind Conditions
-30
-20
-10
0
10
20
10 100 1000
Soun
d Le
vel D
iffer
ence
, Win
d Co
nditi
on -
Calm
(dB)
Distance (feet)
Wind Effects: 5-ft Rec; Autos Only; No Barrier; Soft Grnd.
calm up 2.5 m/s up 5 m/s dn 2.5 m/s dn 5 m/s
-30
-20
-10
0
10
20
10 100 1000
Soun
d Le
vel D
iffer
ence
, Win
d Co
nditi
on -
Calm
(dB)
Distance (feet)
Wind Effects: 15-ft Rec; Autos Only; No Barrier; Soft Grnd.
calm up 2.5 m/s up 5 m/s dn 2.5 m/s dn 5 m/s
J-21

Final Technical Report: NCHRP 25-34 – Supplemental Guidance on the Application of FHWA’s TNM Appendix J Wind and Temperature Gradients J.4.4 Sound Level Differences between Varying Temperature and Calm Conditions with
Autos Only
The graphs below include combinations of parameters that were modeled for varying temperature gradients relative to calm conditions. The input model included only autos on the source roadway. Results are included for both 5-foot and 15-foot receiver heights, propagation over both hard and soft ground, and include results with and without a noise barrier.
Figure 30 Sound Level Difference between Varying Temperature Conditions
-30
-20
-10
0
10
20
10 100 1000
Soun
d Le
vel D
iffer
ence
, Tem
p. C
ondi
tion
-Cal
m (d
B)
Distance (feet)
Temp. Effects: 5-ft Rec; Autos Only; With Barrier; Hard Grnd.
calm +0.5 C/m +0.1 C/m -0.1 C/m -0.3 C/m
J-22

Final Technical Report: NCHRP 25-34 – Supplemental Guidance on the Application of FHWA’s TNM Appendix J Wind and Temperature Gradients
Figure 31 Sound Level Difference between Varying Temperature Conditions
Figure 32 Sound Level Difference between Varying Temperature Conditions
-30
-20
-10
0
10
20
10 100 1000
Soun
d Le
vel D
iffer
ence
, Tem
p. C
ondi
tion
-Cal
m (d
B)
Distance (feet)
Temp. Effects: 15-ft Rec; Autos Only; With Barrier; Hard Grnd.
calm +0.5 C/m +0.1 C/m -0.1 C/m -0.3 C/m
-30
-20
-10
0
10
20
10 100 1000
Soun
d Le
vel D
iffer
ence
, Tem
p. C
ondi
tion
-Cal
m (d
B)
Distance (feet)
Temp. Effects: 5-ft Rec; Autos Only; With Barrier; Soft Grnd.
calm +0.5 C/m +0.1 C/m -0.1 C/m -0.3 C/m
J-23

Final Technical Report: NCHRP 25-34 – Supplemental Guidance on the Application of FHWA’s TNM Appendix J Wind and Temperature Gradients
Figure 33 Sound Level Difference between Varying Temperature Conditions
Figure 34 Sound Level Difference between Varying Temperature Conditions
-30
-20
-10
0
10
20
10 100 1000
Soun
d Le
vel D
iffer
ence
, Tem
p. C
ondi
tion
-Cal
m (d
B)
Distance (feet)
Temp. Effects: 15-ft Rec; Autos Only; With Barrier; Soft Grnd.
calm +0.5 C/m +0.1 C/m -0.1 C/m -0.3 C/m
-30
-20
-10
0
10
20
10 100 1000
Soun
d Le
vel D
iffer
ence
, Tem
p. C
ondi
tion
-Cal
m (d
B)
Distance (feet)
Temp. Effects: 5-ft Rec; Autos Only; No Barrier; Hard Grnd.
calm +0.5 C/m +0.1 C/m -0.1 C/m -0.3 C/m
J-24

Final Technical Report: NCHRP 25-34 – Supplemental Guidance on the Application of FHWA’s TNM Appendix J Wind and Temperature Gradients
Figure 35 Sound Level Difference between Varying Temperature Conditions
Figure 36 Sound Level Difference between Varying Temperature Conditions
-30
-20
-10
0
10
20
10 100 1000
Soun
d Le
vel D
iffer
ence
, Tem
p. C
ondi
tion
-Cal
m (d
B)
Distance (feet)
Temp. Effects: 15-ft Rec; Autos Only; No Barrier; Hard Grnd.
calm +0.5 C/m +0.1 C/m -0.1 C/m -0.3 C/m
-30
-20
-10
0
10
20
10 100 1000
Soun
d Le
vel D
iffer
ence
, Tem
p. C
ondi
tion
-Cal
m (d
B)
Distance (feet)
Temp. Effects: 5-ft Rec; Autos Only; No Barrier; Soft Grnd.
calm +0.5 C/m +0.1 C/m -0.1 C/m -0.3 C/m
J-25
Final Technical Report: NCHRP 25-34 – Supplemental Guidance on the Application of FHWA’s TNM Appendix J Wind and Temperature Gradients
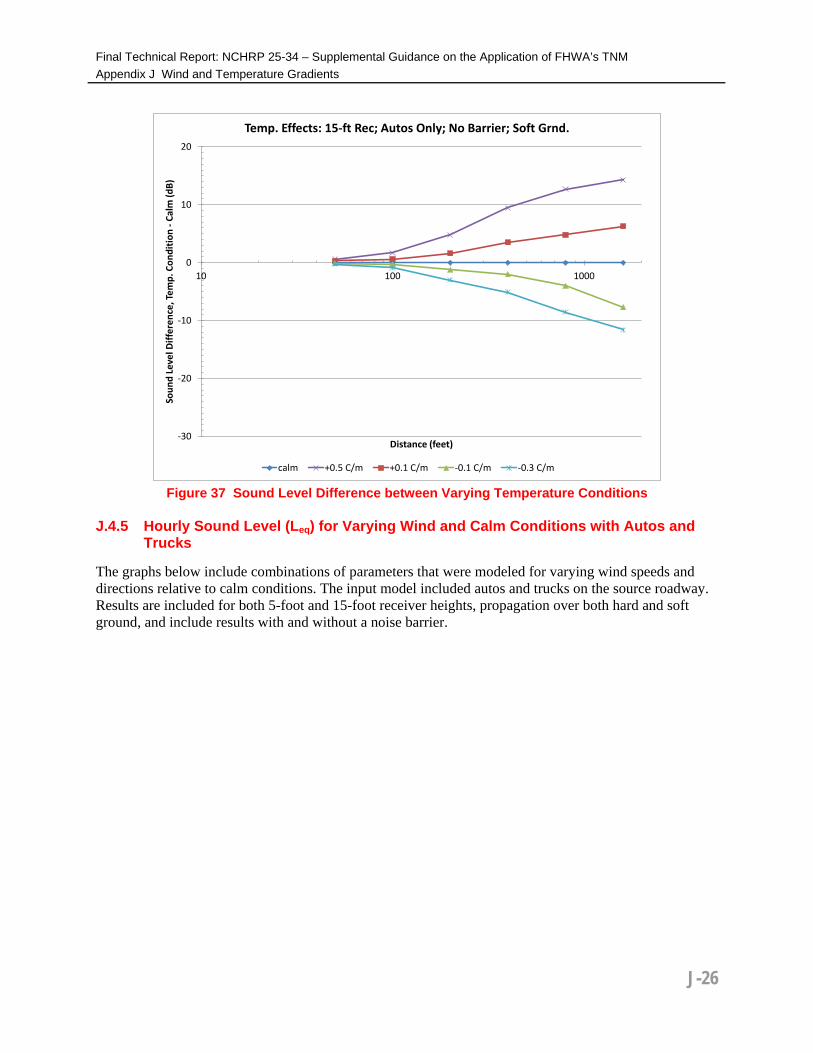
Figure 37 Sound Level Difference between Varying Temperature Conditions
J.4.5 Hourly Sound Level (Leq) for Varying Wind and Calm Conditions with Autos and
Trucks
The graphs below include combinations of parameters that were modeled for varying wind speeds and directions relative to calm conditions. The input model included autos and trucks on the source roadway. Results are included for both 5-foot and 15-foot receiver heights, propagation over both hard and soft ground, and include results with and without a noise barrier.
-30
-20
-10
0
10
20
10 100 1000
Soun
d Le
vel D
iffer
ence
, Tem
p. C
ondi
tion
-Cal
m (d
B)
Distance (feet)
Temp. Effects: 15-ft Rec; Autos Only; No Barrier; Soft Grnd.
calm +0.5 C/m +0.1 C/m -0.1 C/m -0.3 C/m
J-26

Final Technical Report: NCHRP 25-34 – Supplemental Guidance on the Application of FHWA’s TNM Appendix J Wind and Temperature Gradients
Figure 38 Hourly Sound Level (Leq) with Varying Wind Conditions
Figure 39 Hourly Sound Level (Leq) with Varying Wind Conditions
20
30
40
50
60
70
80
90
10 100 1000
Hour
ly Le
q (d
BA)
Distance (feet)
Wind Effects: 5-ft Rec; Autos & Trucks; With Barrier; Hard Grnd.
calm up 2.5 m/s up 5 m/s dn 2.5 m/s dn 5 m/s
20
30
40
50
60
70
80
90
10 100 1000
Hour
ly Le
q (d
BA)
Distance (feet)
Wind Effects: 15-ft Rec; Autos & Trucks; With Barrier; Hard Grnd.
calm up 2.5 m/s up 5 m/s dn 2.5 m/s dn 5 m/s
J-27

Final Technical Report: NCHRP 25-34 – Supplemental Guidance on the Application of FHWA’s TNM Appendix J Wind and Temperature Gradients
Figure 40 Hourly Sound Level (Leq) with Varying Wind Conditions
Figure 41 Hourly Sound Level (Leq) with Varying Wind Conditions
20
30
40
50
60
70
80
90
10 100 1000
Hour
ly Le
q (d
BA)
Distance (feet)
Wind Effects: 5-ft Rec; Autos & Trucks; With Barrier; Soft Grnd.
calm up 2.5 m/s up 5 m/s dn 2.5 m/s dn 5 m/s
20
30
40
50
60
70
80
90
10 100 1000
Hour
ly Le
q (d
BA)
Distance (feet)
Wind Effects: 15-ft Rec; Autos & Trucks; With Barrier; Soft Grnd.
calm up 2.5 m/s up 5 m/s dn 2.5 m/s dn 5 m/s
J-28

Final Technical Report: NCHRP 25-34 – Supplemental Guidance on the Application of FHWA’s TNM Appendix J Wind and Temperature Gradients
Figure 42 Hourly Sound Level (Leq) with Varying Wind Conditions
Figure 43 Hourly Sound Level (Leq) with Varying Wind Conditions
20
30
40
50
60
70
80
90
10 100 1000
Hour
ly Le
q (d
BA)
Distance (feet)
Wind Effects: 5-ft Rec; Autos & Trucks; No Barrier; Hard Grnd.
calm up 2.5 m/s up 5 m/s dn 2.5 m/s dn 5 m/s
20
30
40
50
60
70
80
90
10 100 1000
Hour
ly Le
q (d
BA)
Distance (feet)
Wind Effects: 15-ft Rec; Autos & Trucks; No Barrier; Hard Grnd.
calm up 2.5 m/s up 5 m/s dn 2.5 m/s dn 5 m/s
J-29
Final Technical Report: NCHRP 25-34 – Supplemental Guidance on the Application of FHWA’s TNM Appendix J Wind and Temperature Gradients
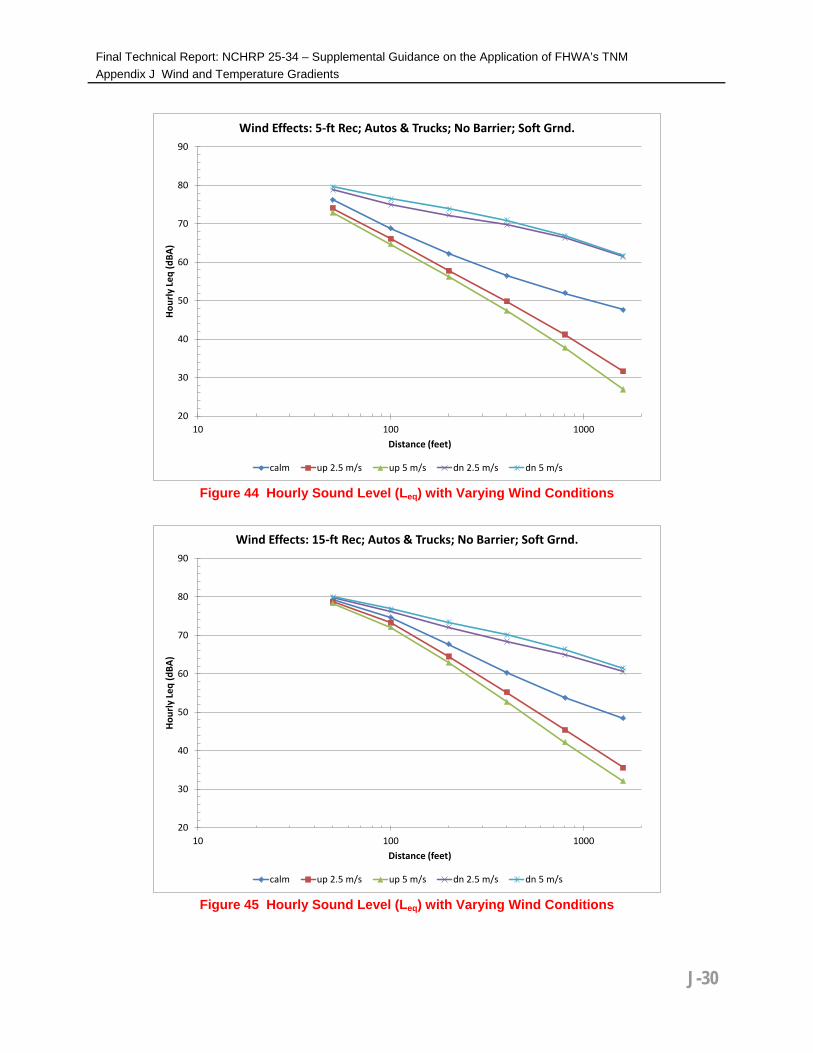
Figure 44 Hourly Sound Level (Leq) with Varying Wind Conditions
Figure 45 Hourly Sound Level (Leq) with Varying Wind Conditions
20
30
40
50
60
70
80
90
10 100 1000
Hour
ly Le
q (d
BA)
Distance (feet)
Wind Effects: 5-ft Rec; Autos & Trucks; No Barrier; Soft Grnd.
calm up 2.5 m/s up 5 m/s dn 2.5 m/s dn 5 m/s
20
30
40
50
60
70
80
90
10 100 1000
Hour
ly Le
q (d
BA)
Distance (feet)
Wind Effects: 15-ft Rec; Autos & Trucks; No Barrier; Soft Grnd.
calm up 2.5 m/s up 5 m/s dn 2.5 m/s dn 5 m/s
J-30
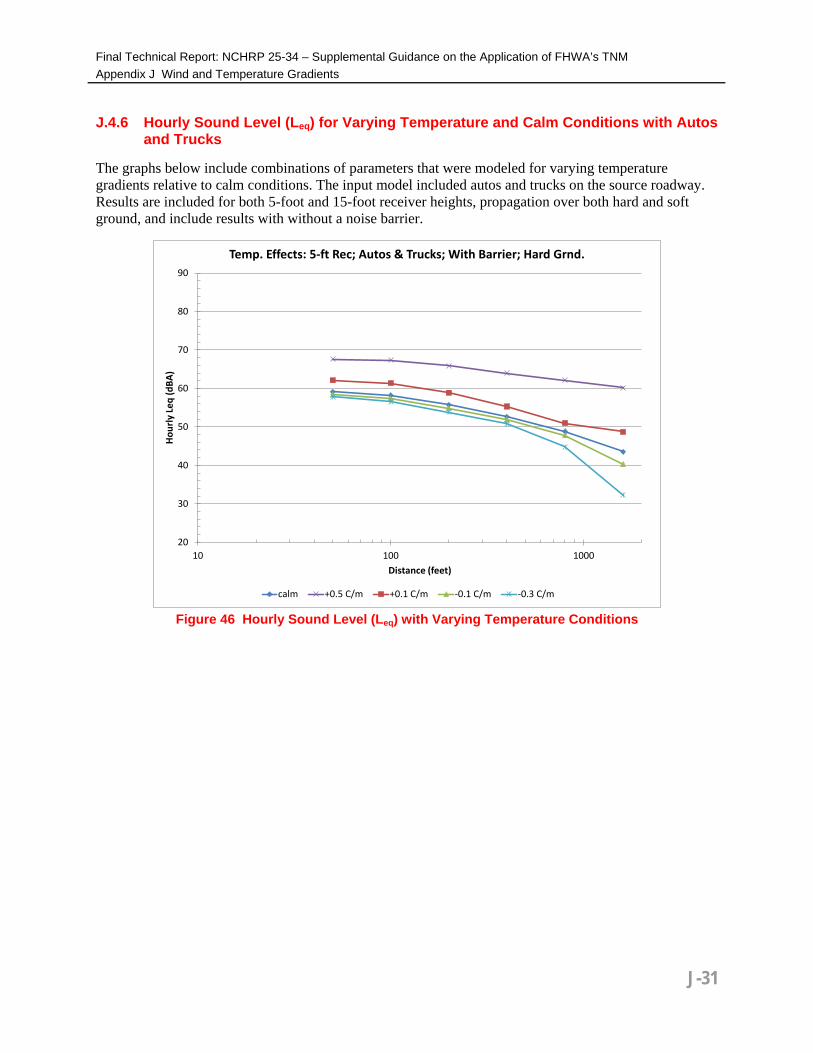
Final Technical Report: NCHRP 25-34 – Supplemental Guidance on the Application of FHWA’s TNM Appendix J Wind and Temperature Gradients J.4.6 Hourly Sound Level (Leq) for Varying Temperature and Calm Conditions with Autos
and Trucks
The graphs below include combinations of parameters that were modeled for varying temperature gradients relative to calm conditions. The input model included autos and trucks on the source roadway. Results are included for both 5-foot and 15-foot receiver heights, propagation over both hard and soft ground, and include results with without a noise barrier.
Figure 46 Hourly Sound Level (Leq) with Varying Temperature Conditions
20
30
40
50
60
70
80
90
10 100 1000
Hour
ly Le
q (d
BA)
Distance (feet)
Temp. Effects: 5-ft Rec; Autos & Trucks; With Barrier; Hard Grnd.
calm +0.5 C/m +0.1 C/m -0.1 C/m -0.3 C/m
J-31

Final Technical Report: NCHRP 25-34 – Supplemental Guidance on the Application of FHWA’s TNM Appendix J Wind and Temperature Gradients
Figure 47 Hourly Sound Level (Leq) with Varying Temperature Conditions
Figure 48 Hourly Sound Level (Leq) with Varying Temperature Conditions
20
30
40
50
60
70
80
90
10 100 1000
Hour
ly Le
q (d
BA)
Distance (feet)
Temp. Effects: 15-ft Rec; Autos & Trucks; With Barrier; Hard Grnd.
calm +0.5 C/m +0.1 C/m -0.1 C/m -0.3 C/m
20
30
40
50
60
70
80
90
10 100 1000
Hour
ly Le
q (d
BA)
Distance (feet)
Temp. Effects: 5-ft Rec; Autos & Trucks; With Barrier; Soft Grnd.
calm +0.5 C/m +0.1 C/m -0.1 C/m -0.3 C/m
J-32

Final Technical Report: NCHRP 25-34 – Supplemental Guidance on the Application of FHWA’s TNM Appendix J Wind and Temperature Gradients
Figure 49 Hourly Sound Level (Leq) with Varying Temperature Conditions
Figure 50 Hourly Sound Level (Leq) with Varying Temperature Conditions
20
30
40
50
60
70
80
90
10 100 1000
Hour
ly Le
q (d
BA)
Distance (feet)
Temp. Effects: 15-ft Rec; Autos & Trucks; With Barrier; Soft Grnd.
calm +0.5 C/m +0.1 C/m -0.1 C/m -0.3 C/m
20
30
40
50
60
70
80
90
10 100 1000
Hour
ly Le
q (d
BA)
Distance (feet)
Temp. Effects: 5-ft Rec; Autos & Trucks; No Barrier; Hard Grnd.
calm +0.5 C/m +0.1 C/m -0.1 C/m -0.3 C/m
J-33
Final Technical Report: NCHRP 25-34 – Supplemental Guidance on the Application of FHWA’s TNM Appendix J Wind and Temperature Gradients
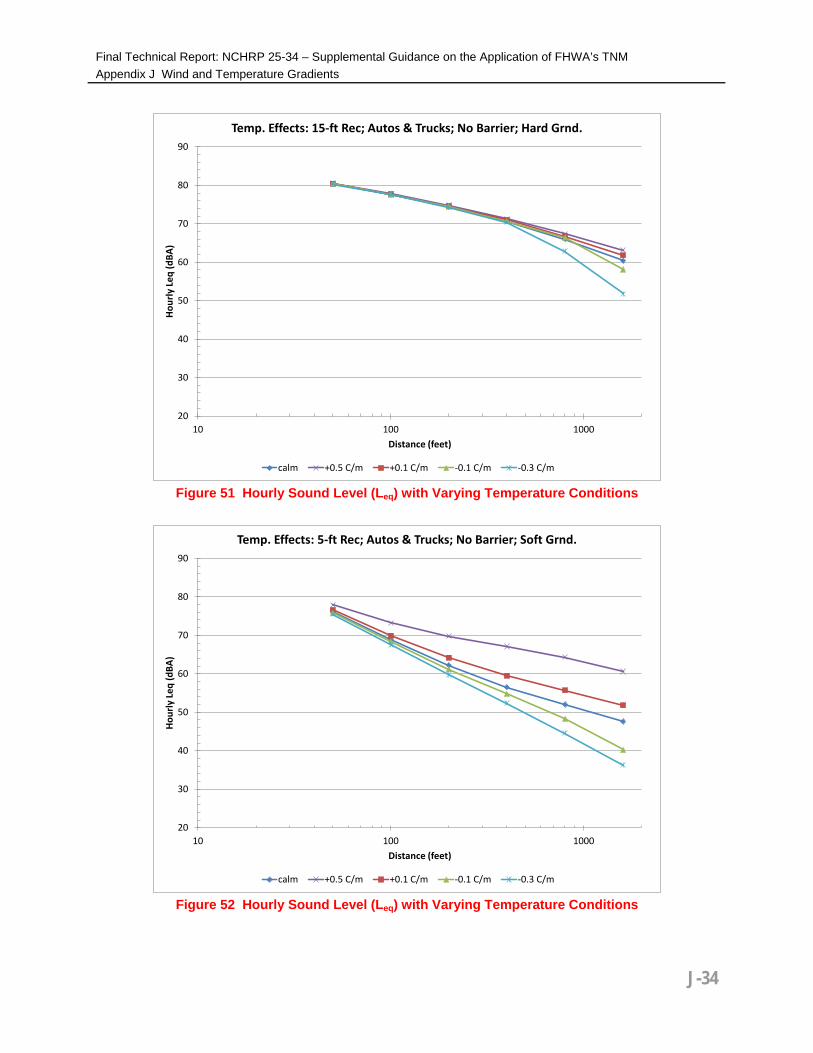
Figure 51 Hourly Sound Level (Leq) with Varying Temperature Conditions
Figure 52 Hourly Sound Level (Leq) with Varying Temperature Conditions
20
30
40
50
60
70
80
90
10 100 1000
Hour
ly Le
q (d
BA)
Distance (feet)
Temp. Effects: 15-ft Rec; Autos & Trucks; No Barrier; Hard Grnd.
calm +0.5 C/m +0.1 C/m -0.1 C/m -0.3 C/m
20
30
40
50
60
70
80
90
10 100 1000
Hour
ly Le
q (d
BA)
Distance (feet)
Temp. Effects: 5-ft Rec; Autos & Trucks; No Barrier; Soft Grnd.
calm +0.5 C/m +0.1 C/m -0.1 C/m -0.3 C/m
J-34

Final Technical Report: NCHRP 25-34 – Supplemental Guidance on the Application of FHWA’s TNM Appendix J Wind and Temperature Gradients
Figure 53 Hourly Sound Level (Leq) with Varying Temperature Conditions
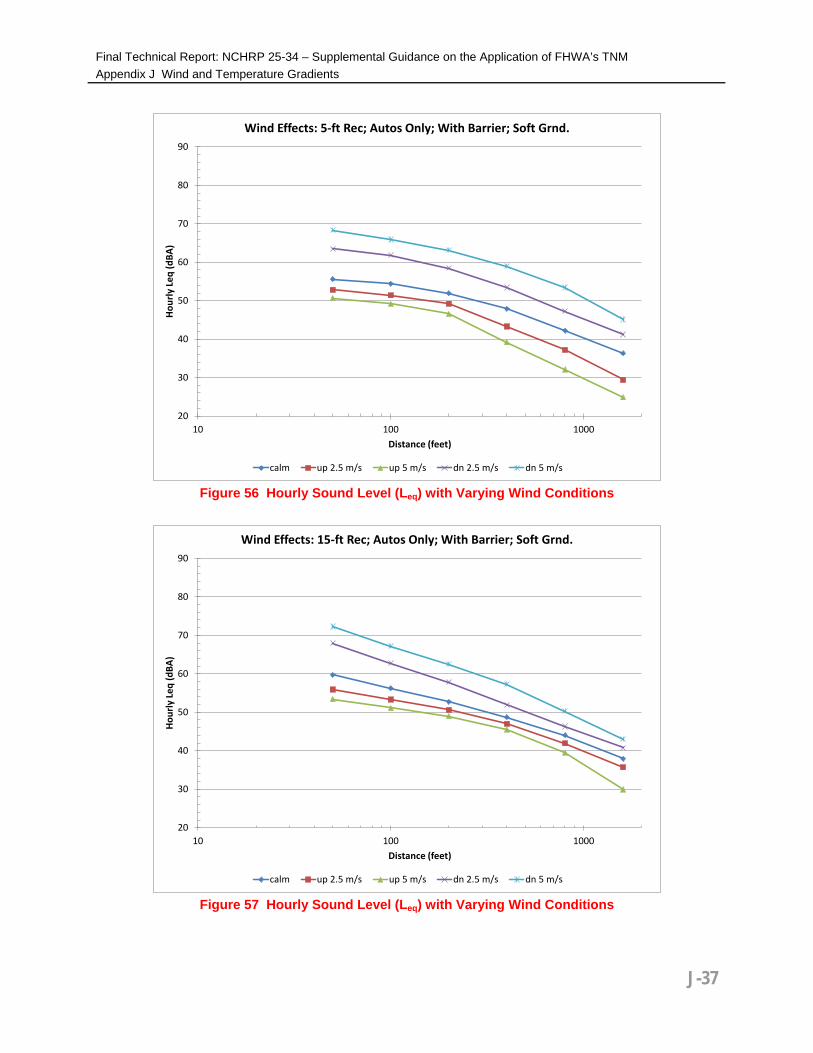
J.4.7 Hourly Sound Level (Leq) for Varying Wind and Calm Conditions with Autos Only
The graphs below include combinations of parameters that were modeled for varying wind speeds and directions relative to calm conditions. The input model included only autos on the source roadway. Results are included for both 5-foot and 15-foot receiver heights, propagation over both hard and soft ground, and include results with and without a noise barrier.
20
30
40
50
60
70
80
90
10 100 1000
Hour
ly Le
q (d
BA)
Distance (feet)
Temp. Effects: 15-ft Rec; Autos & Trucks; No Barrier; Soft Grnd.
calm +0.5 C/m +0.1 C/m -0.1 C/m -0.3 C/m
J-35

Final Technical Report: NCHRP 25-34 – Supplemental Guidance on the Application of FHWA’s TNM Appendix J Wind and Temperature Gradients
Figure 54 Hourly Sound Level (Leq) with Varying Wind Conditions
Figure 55 Hourly Sound Level (Leq) with Varying Wind Conditions
20
30
40
50
60
70
80
90
10 100 1000
Hour
ly Le
q (d
BA)
Distance (feet)
Wind Effects: 5-ft Rec; Autos Only; With Barrier; Hard Grnd.
calm up 2.5 m/s up 5 m/s dn 2.5 m/s dn 5 m/s
20
30
40
50
60
70
80
90
10 100 1000
Hour
ly Le
q (d
BA)
Distance (feet)
Wind Effects: 15-ft Rec; Autos Only; With Barrier; Hard Grnd.
calm up 2.5 m/s up 5 m/s dn 2.5 m/s dn 5 m/s
J-36
Final Technical Report: NCHRP 25-34 – Supplemental Guidance on the Application of FHWA’s TNM Appendix J Wind and Temperature Gradients
Figure 56 Hourly Sound Level (Leq) with Varying Wind Conditions
Figure 57 Hourly Sound Level (Leq) with Varying Wind Conditions
20
30
40
50
60
70
80
90
10 100 1000
Hour
ly Le
q (d
BA)
Distance (feet)
Wind Effects: 5-ft Rec; Autos Only; With Barrier; Soft Grnd.
calm up 2.5 m/s up 5 m/s dn 2.5 m/s dn 5 m/s
20
30
40
50
60
70
80
90
10 100 1000
Hour
ly Le
q (d
BA)
Distance (feet)
Wind Effects: 15-ft Rec; Autos Only; With Barrier; Soft Grnd.
calm up 2.5 m/s up 5 m/s dn 2.5 m/s dn 5 m/s
J-37

Final Technical Report: NCHRP 25-34 – Supplemental Guidance on the Application of FHWA’s TNM Appendix J Wind and Temperature Gradients
Figure 58 Hourly Sound Level (Leq) with Varying Wind Conditions
Figure 59 Hourly Sound Level (Leq) with Varying Wind Conditions
20
30
40
50
60
70
80
90
10 100 1000
Hour
ly Le
q (d
BA)
Distance (feet)
Wind Effects: 5-ft Rec; Autos Only; No Barrier; Hard Grnd.
calm up 2.5 m/s up 5 m/s dn 2.5 m/s dn 5 m/s
20
30
40
50
60
70
80
90
10 100 1000
Hour
ly Le
q (d
BA)
Distance (feet)
Wind Effects: 15-ft Rec; Autos Only; No Barrier; Hard Grnd.
calm up 2.5 m/s up 5 m/s dn 2.5 m/s dn 5 m/s
J-38

Final Technical Report: NCHRP 25-34 – Supplemental Guidance on the Application of FHWA’s TNM Appendix J Wind and Temperature Gradients
Figure 60 Hourly Sound Level (Leq) with Varying Wind Conditions
Figure 61 Hourly Sound Level (Leq) with Varying Wind Conditions
20
30
40
50
60
70
80
90
10 100 1000
Hour
ly Le
q (d
BA)
Distance (feet)
Wind Effects: 5-ft Rec; Autos Only; No Barrier; Soft Grnd.
calm up 2.5 m/s up 5 m/s dn 2.5 m/s dn 5 m/s
20
30
40
50
60
70
80
90
10 100 1000
Hour
ly Le
q (d
BA)
Distance (feet)
Wind Effects: 15-ft Rec; Autos Only; No Barrier; Soft Grnd.
calm up 2.5 m/s up 5 m/s dn 2.5 m/s dn 5 m/s
J-39

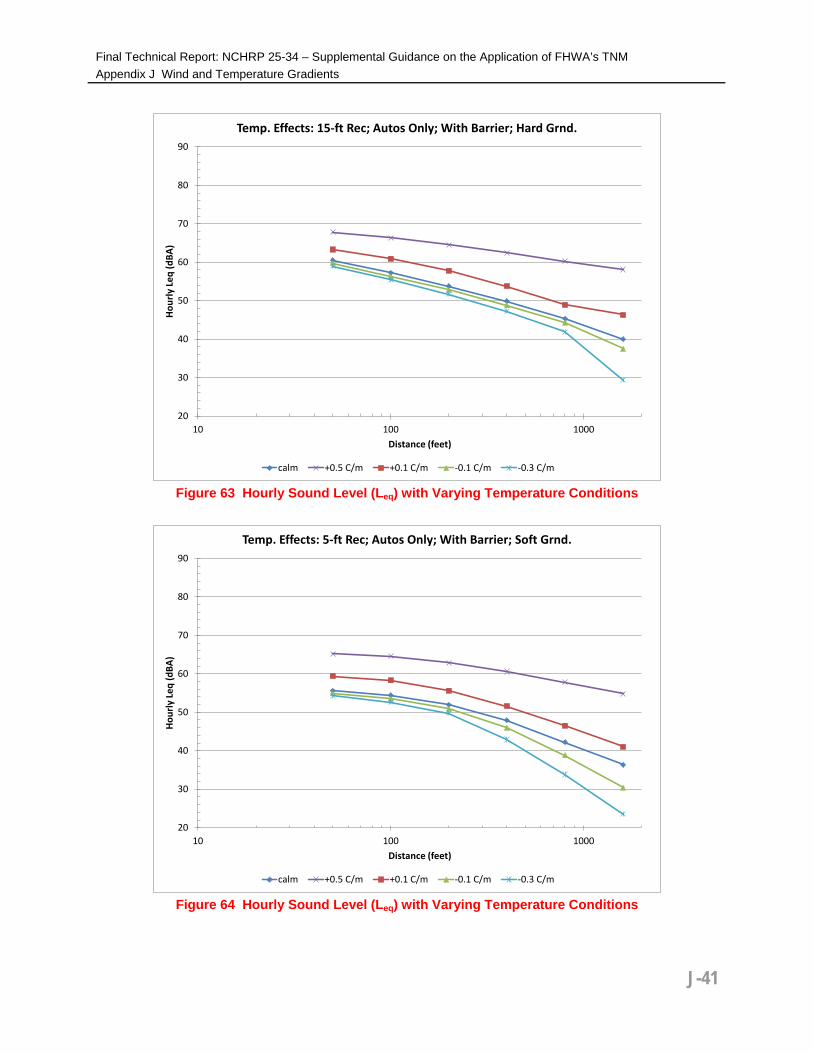
Final Technical Report: NCHRP 25-34 – Supplemental Guidance on the Application of FHWA’s TNM Appendix J Wind and Temperature Gradients J.4.8 Hourly Sound Level (Leq) for Varying Temperature and Calm Conditions with Autos
Only
The graphs below include combinations of parameters that were modeled for varying temperature gradients relative to calm conditions. The input model included only autos on the source roadway. Results are included for both 5-foot and 15-foot receiver heights, propagation over both hard and soft ground, and include results with and without a noise barrier.
Figure 62 Hourly Sound Level (Leq) with Varying Temperature Conditions
20
30
40
50
60
70
80
90
10 100 1000
Hour
ly Le
q (d
BA)
Distance (feet)
Temp. Effects: 5-ft Rec; Autos Only; With Barrier; Hard Grnd.
calm +0.5 C/m +0.1 C/m -0.1 C/m -0.3 C/m
J-40
Final Technical Report: NCHRP 25-34 – Supplemental Guidance on the Application of FHWA’s TNM Appendix J Wind and Temperature Gradients
Figure 63 Hourly Sound Level (Leq) with Varying Temperature Conditions
Figure 64 Hourly Sound Level (Leq) with Varying Temperature Conditions
20
30
40
50
60
70
80
90
10 100 1000
Hour
ly Le
q (d
BA)
Distance (feet)
Temp. Effects: 15-ft Rec; Autos Only; With Barrier; Hard Grnd.
calm +0.5 C/m +0.1 C/m -0.1 C/m -0.3 C/m
20
30
40
50
60
70
80
90
10 100 1000
Hour
ly Le
q (d
BA)
Distance (feet)
Temp. Effects: 5-ft Rec; Autos Only; With Barrier; Soft Grnd.
calm +0.5 C/m +0.1 C/m -0.1 C/m -0.3 C/m
J-41

Final Technical Report: NCHRP 25-34 – Supplemental Guidance on the Application of FHWA’s TNM Appendix J Wind and Temperature Gradients
Figure 65 Hourly Sound Level (Leq) with Varying Temperature Conditions
Figure 66 Hourly Sound Level (Leq) with Varying Temperature Conditions
20
30
40
50
60
70
80
90
10 100 1000
Hour
ly Le
q (d
BA)
Distance (feet)
Temp. Effects: 15-ft Rec; Autos Only; With Barrier; Soft Grnd.
calm +0.5 C/m +0.1 C/m -0.1 C/m -0.3 C/m
20
30
40
50
60
70
80
90
10 100 1000
Hour
ly Le
q (d
BA)
Distance (feet)
Temp. Effects: 5-ft Rec; Autos Only; No Barrier; Hard Grnd.
calm +0.5 C/m +0.1 C/m -0.1 C/m -0.3 C/m
J-42

Final Technical Report: NCHRP 25-34 – Supplemental Guidance on the Application of FHWA’s TNM Appendix J Wind and Temperature Gradients
Figure 67 Hourly Sound Level (Leq) with Varying Temperature Conditions
Figure 68 Hourly Sound Level (Leq) with Varying Temperature Conditions
20
30
40
50
60
70
80
90
10 100 1000
Hour
ly Le
q (d
BA)
Distance (feet)
Temp. Effects: 15-ft Rec; Autos Only; No Barrier; Hard Grnd.
calm +0.5 C/m +0.1 C/m -0.1 C/m -0.3 C/m
20
30
40
50
60
70
80
90
10 100 1000
Hour
ly Le
q (d
BA)
Distance (feet)
Temp. Effects: 5-ft Rec; Autos Only; No Barrier; Soft Grnd.
calm +0.5 C/m +0.1 C/m -0.1 C/m -0.3 C/m
J-43
Final Technical Report: NCHRP 25-34 – Supplemental Guidance on the Application of FHWA’s TNM Appendix J Wind and Temperature Gradients
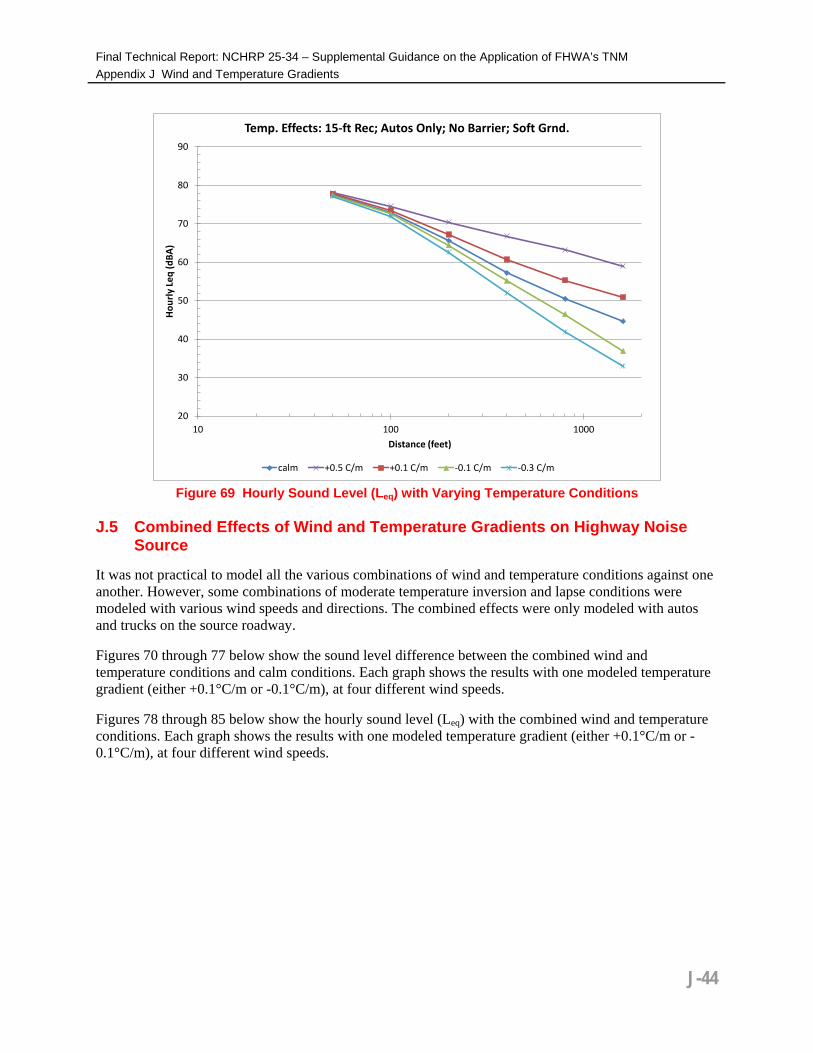
Figure 69 Hourly Sound Level (Leq) with Varying Temperature Conditions
J.5 Combined Effects of Wind and Temperature Gradients on Highway Noise
Source
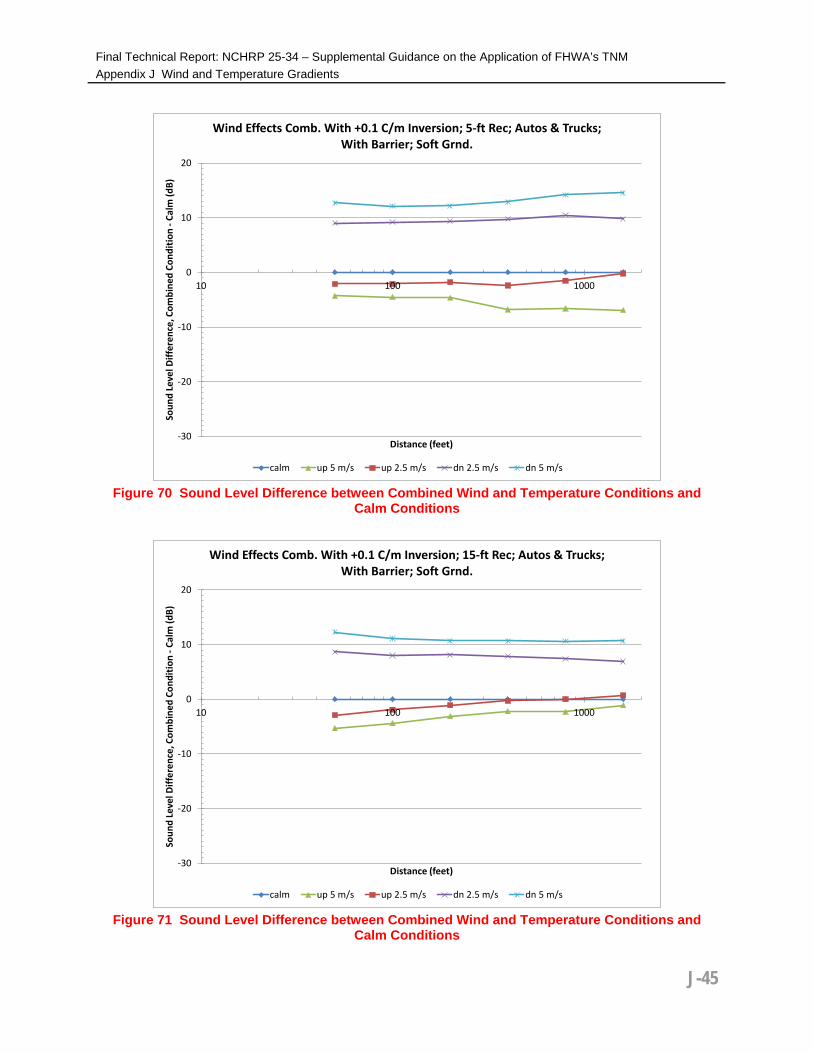
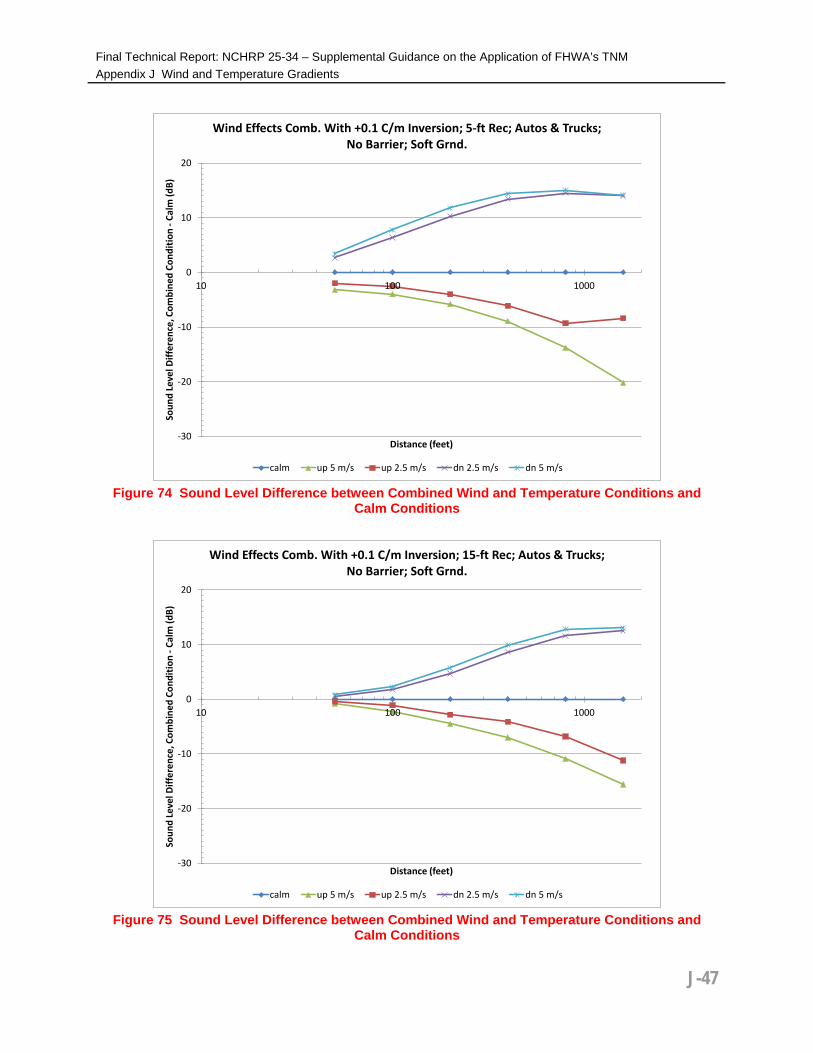
It was not practical to model all the various combinations of wind and temperature conditions against one another. However, some combinations of moderate temperature inversion and lapse conditions were modeled with various wind speeds and directions. The combined effects were only modeled with autos and trucks on the source roadway.
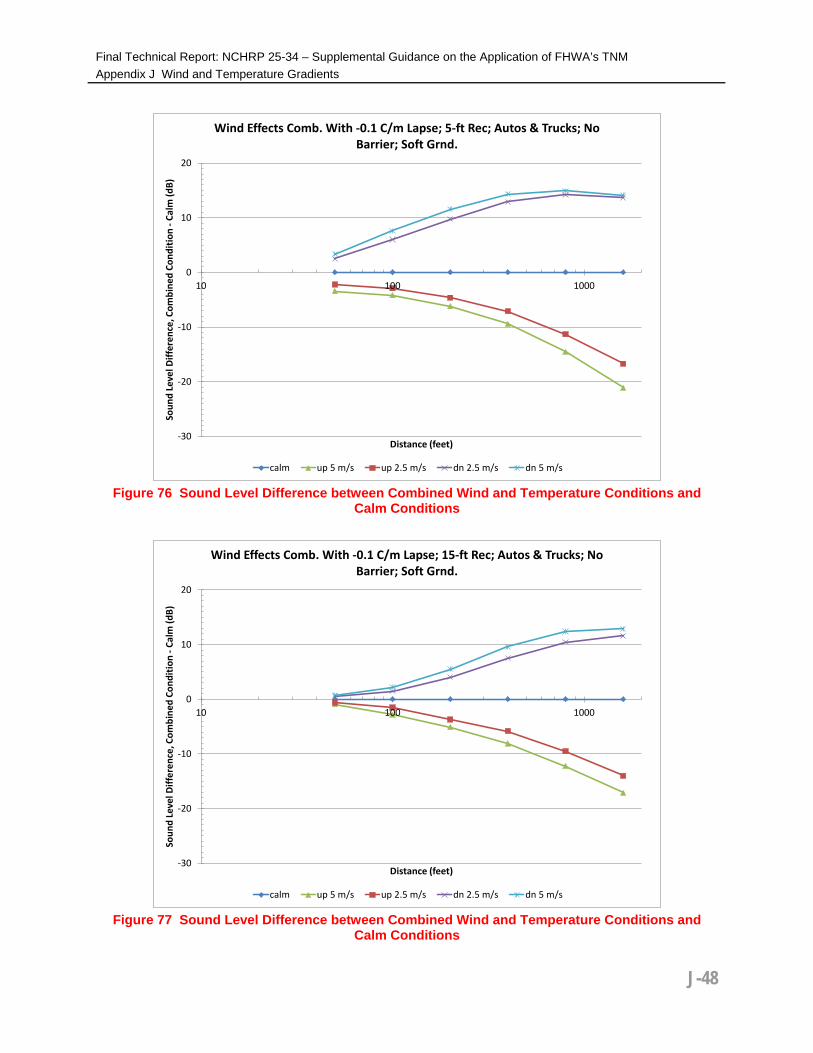
Figures 70 through 77 below show the sound level difference between the combined wind and temperature conditions and calm conditions. Each graph shows the results with one modeled temperature gradient (either +0.1°C/m or -0.1°C/m), at four different wind speeds.
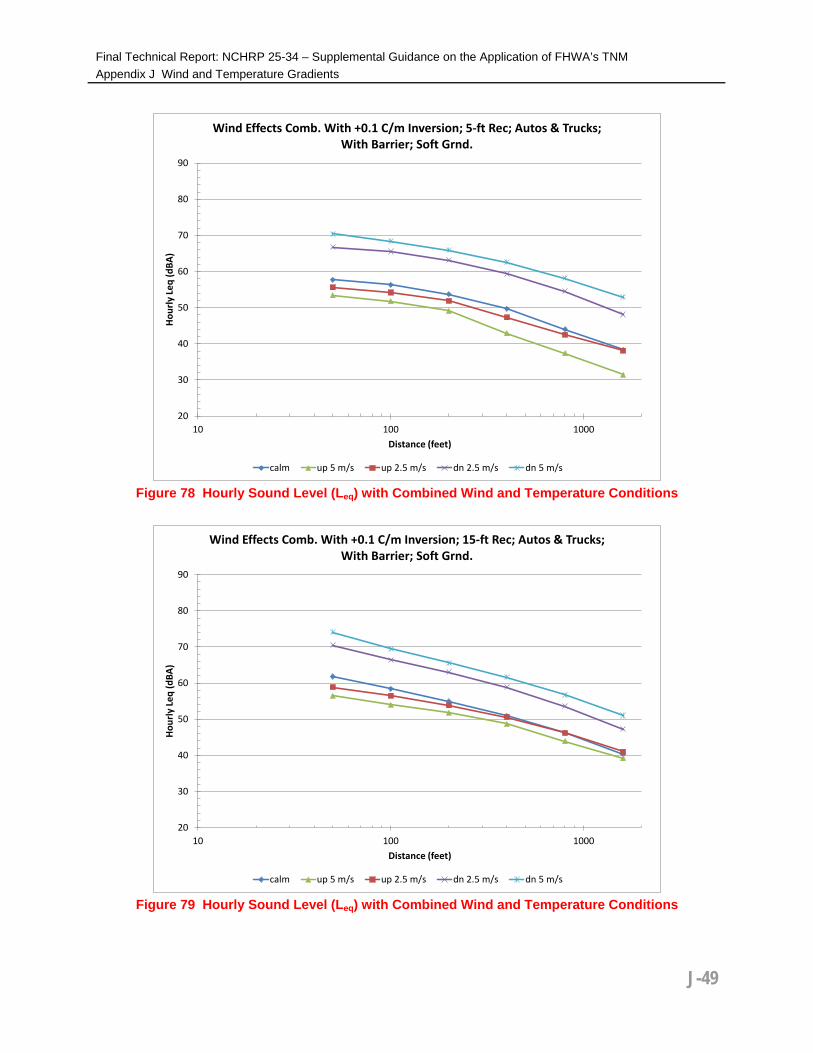
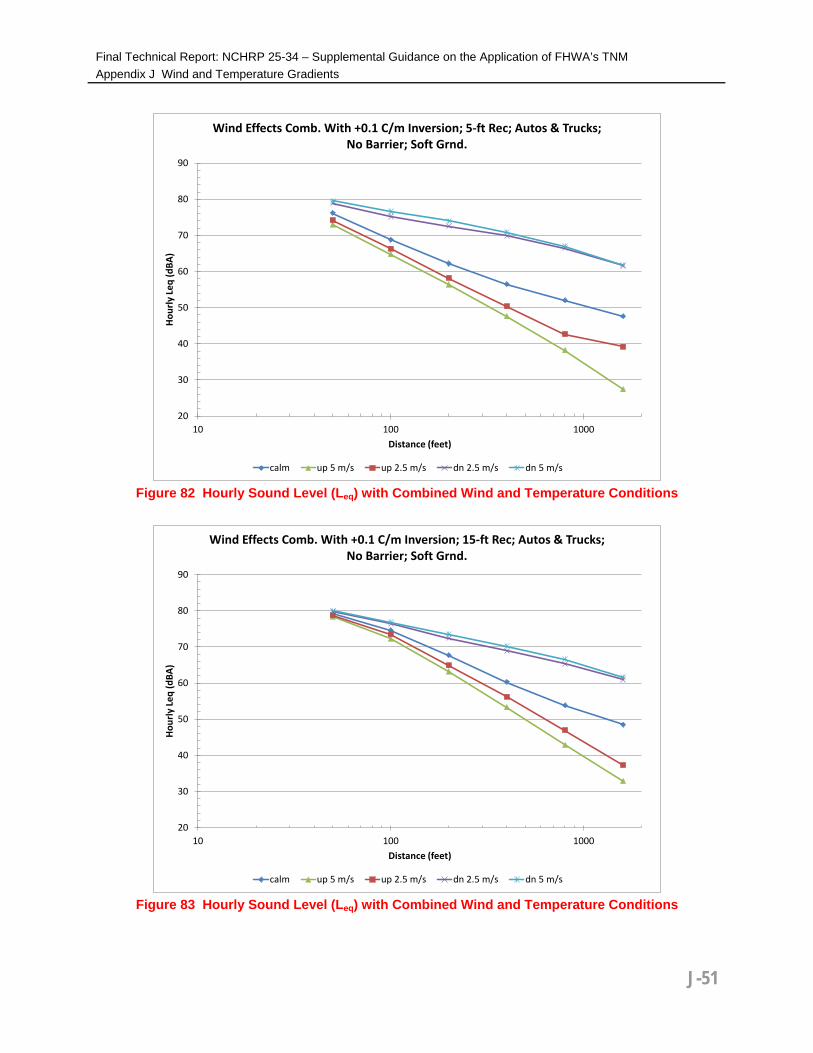
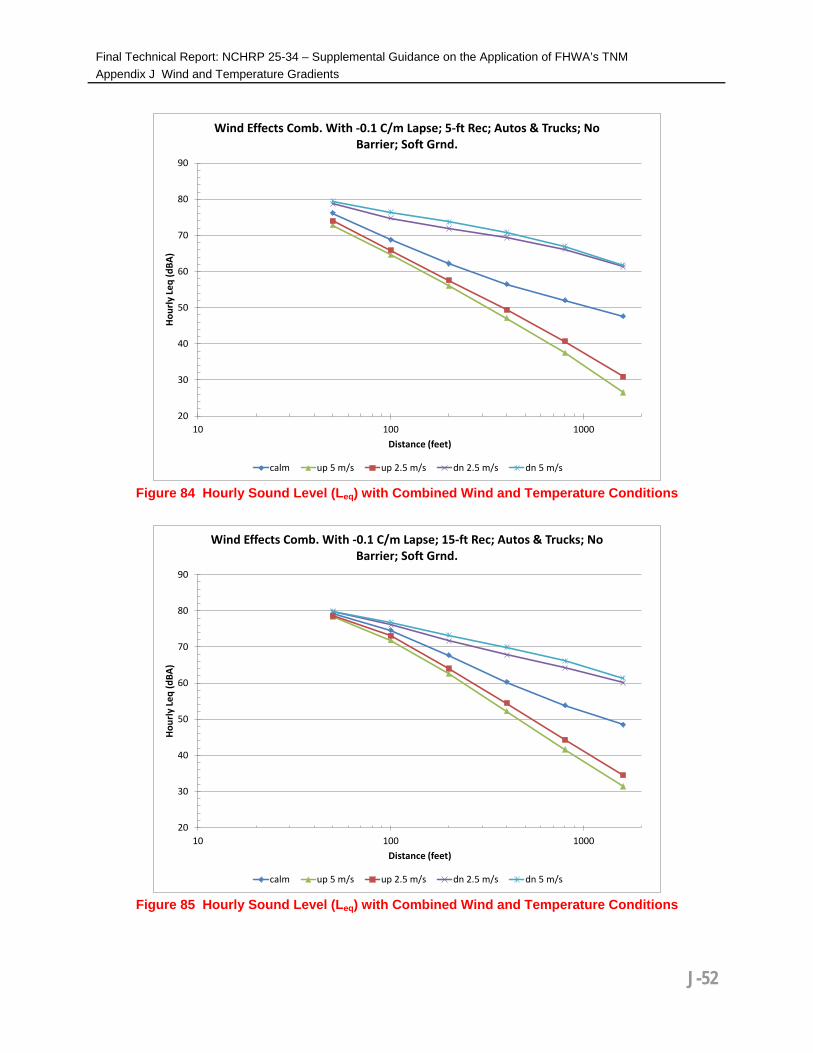
Figures 78 through 85 below show the hourly sound level (Leq) with the combined wind and temperature conditions. Each graph shows the results with one modeled temperature gradient (either +0.1°C/m or -0.1°C/m), at four different wind speeds.
20
30
40
50
60
70
80
90
10 100 1000
Hour
ly Le
q (d
BA)
Distance (feet)
Temp. Effects: 15-ft Rec; Autos Only; No Barrier; Soft Grnd.
calm +0.5 C/m +0.1 C/m -0.1 C/m -0.3 C/m
J-44
Final Technical Report: NCHRP 25-34 – Supplemental Guidance on the Application of FHWA’s TNM Appendix J Wind and Temperature Gradients
Figure 70 Sound Level Difference between Combined Wind and Temperature Conditions and
Calm Conditions
Figure 71 Sound Level Difference between Combined Wind and Temperature Conditions and
Calm Conditions
-30
-20
-10
0
10
20
10 100 1000
Soun
d Le
vel D
iffer
ence
, Com
bine
d Co
nditi
on -
Calm
(dB)
Distance (feet)
Wind Effects Comb. With +0.1 C/m Inversion; 5-ft Rec; Autos & Trucks; With Barrier; Soft Grnd.
calm up 5 m/s up 2.5 m/s dn 2.5 m/s dn 5 m/s
-30
-20
-10
0
10
20
10 100 1000
Soun
d Le
vel D
iffer
ence
, Com
bine
d Co
nditi
on -
Calm
(dB)
Distance (feet)
Wind Effects Comb. With +0.1 C/m Inversion; 15-ft Rec; Autos & Trucks; With Barrier; Soft Grnd.
calm up 5 m/s up 2.5 m/s dn 2.5 m/s dn 5 m/s
J-45

Final Technical Report: NCHRP 25-34 – Supplemental Guidance on the Application of FHWA’s TNM Appendix J Wind and Temperature Gradients
Figure 72 Sound Level Difference between Combined Wind and Temperature Conditions and
Calm Conditions
Figure 73 Sound Level Difference between Combined Wind and Temperature Conditions and
Calm Conditions
-30
-20
-10
0
10
20
10 100 1000
Soun
d Le
vel D
iffer
ence
, Com
bine
d Co
nditi
on -
Calm
(dB)
Distance (feet)
Wind Effects Comb. With -0.1 C/m Lapse; 5-ft Rec; Autos & Trucks; With Barrier; Soft Grnd.
calm up 5 m/s up 2.5 m/s dn 2.5 m/s dn 5 m/s
-30
-20
-10
0
10
20
10 100 1000
Soun
d Le
vel D
iffer
ence
, Com
bine
d Co
nditi
on -
Calm
(dB)
Distance (feet)
Wind Effects Comb. With -0.1 C/m Lapse; 15-ft Rec; Autos & Trucks; With Barrier; Soft Grnd.
calm up 5 m/s up 2.5 m/s dn 2.5 m/s dn 5 m/s
J-46
Final Technical Report: NCHRP 25-34 – Supplemental Guidance on the Application of FHWA’s TNM Appendix J Wind and Temperature Gradients
Figure 74 Sound Level Difference between Combined Wind and Temperature Conditions and
Calm Conditions
Figure 75 Sound Level Difference between Combined Wind and Temperature Conditions and
Calm Conditions
-30
-20
-10
0
10
20
10 100 1000
Soun
d Le
vel D
iffer
ence
, Com
bine
d Co
nditi
on -
Calm
(dB)
Distance (feet)
Wind Effects Comb. With +0.1 C/m Inversion; 5-ft Rec; Autos & Trucks; No Barrier; Soft Grnd.
calm up 5 m/s up 2.5 m/s dn 2.5 m/s dn 5 m/s
-30
-20
-10
0
10
20
10 100 1000
Soun
d Le
vel D
iffer
ence
, Com
bine
d Co
nditi
on -
Calm
(dB)
Distance (feet)
Wind Effects Comb. With +0.1 C/m Inversion; 15-ft Rec; Autos & Trucks; No Barrier; Soft Grnd.
calm up 5 m/s up 2.5 m/s dn 2.5 m/s dn 5 m/s
J-47
Final Technical Report: NCHRP 25-34 – Supplemental Guidance on the Application of FHWA’s TNM Appendix J Wind and Temperature Gradients
Figure 76 Sound Level Difference between Combined Wind and Temperature Conditions and
Calm Conditions
Figure 77 Sound Level Difference between Combined Wind and Temperature Conditions and
Calm Conditions
-30
-20
-10
0
10
20
10 100 1000
Soun
d Le
vel D
iffer
ence
, Com
bine
d Co
nditi
on -
Calm
(dB)
Distance (feet)
Wind Effects Comb. With -0.1 C/m Lapse; 5-ft Rec; Autos & Trucks; No Barrier; Soft Grnd.
calm up 5 m/s up 2.5 m/s dn 2.5 m/s dn 5 m/s
-30
-20
-10
0
10
20
10 100 1000
Soun
d Le
vel D
iffer
ence
, Com
bine
d Co
nditi
on -
Calm
(dB)
Distance (feet)
Wind Effects Comb. With -0.1 C/m Lapse; 15-ft Rec; Autos & Trucks; No Barrier; Soft Grnd.
calm up 5 m/s up 2.5 m/s dn 2.5 m/s dn 5 m/s
J-48
Final Technical Report: NCHRP 25-34 – Supplemental Guidance on the Application of FHWA’s TNM Appendix J Wind and Temperature Gradients
Figure 78 Hourly Sound Level (Leq) with Combined Wind and Temperature Conditions
Figure 79 Hourly Sound Level (Leq) with Combined Wind and Temperature Conditions
20
30
40
50
60
70
80
90
10 100 1000
Hour
ly Le
q (d
BA)
Distance (feet)
Wind Effects Comb. With +0.1 C/m Inversion; 5-ft Rec; Autos & Trucks; With Barrier; Soft Grnd.
calm up 5 m/s up 2.5 m/s dn 2.5 m/s dn 5 m/s
20
30
40
50
60
70
80
90
10 100 1000
Hour
ly Le
q (d
BA)
Distance (feet)
Wind Effects Comb. With +0.1 C/m Inversion; 15-ft Rec; Autos & Trucks; With Barrier; Soft Grnd.
calm up 5 m/s up 2.5 m/s dn 2.5 m/s dn 5 m/s
J-49

Final Technical Report: NCHRP 25-34 – Supplemental Guidance on the Application of FHWA’s TNM Appendix J Wind and Temperature Gradients
Figure 80 Hourly Sound Level (Leq) with Combined Wind and Temperature Conditions
Figure 81 Hourly Sound Level (Leq) with Combined Wind and Temperature Conditions
20
30
40
50
60
70
80
90
10 100 1000
Hour
ly Le
q (d
BA)
Distance (feet)
Wind Effects Comb. With -0.1 C/m Lapse; 5-ft Rec; Autos & Trucks; With Barrier; Soft Grnd.
calm up 5 m/s up 2.5 m/s dn 2.5 m/s dn 5 m/s
20
30
40
50
60
70
80
90
10 100 1000
Hour
ly Le
q (d
BA)
Distance (feet)
Wind Effects Comb. With -0.1 C/m Lapse; 15-ft Rec; Autos & Trucks; With Barrier; Soft Grnd.
calm up 5 m/s up 2.5 m/s dn 2.5 m/s dn 5 m/s
J-50
Final Technical Report: NCHRP 25-34 – Supplemental Guidance on the Application of FHWA’s TNM Appendix J Wind and Temperature Gradients
Figure 82 Hourly Sound Level (Leq) with Combined Wind and Temperature Conditions
Figure 83 Hourly Sound Level (Leq) with Combined Wind and Temperature Conditions
20
30
40
50
60
70
80
90
10 100 1000
Hour
ly Le
q (d
BA)
Distance (feet)
Wind Effects Comb. With +0.1 C/m Inversion; 5-ft Rec; Autos & Trucks; No Barrier; Soft Grnd.
calm up 5 m/s up 2.5 m/s dn 2.5 m/s dn 5 m/s
20
30
40
50
60
70
80
90
10 100 1000
Hour
ly Le
q (d
BA)
Distance (feet)
Wind Effects Comb. With +0.1 C/m Inversion; 15-ft Rec; Autos & Trucks; No Barrier; Soft Grnd.
calm up 5 m/s up 2.5 m/s dn 2.5 m/s dn 5 m/s
J-51
Final Technical Report: NCHRP 25-34 – Supplemental Guidance on the Application of FHWA’s TNM Appendix J Wind and Temperature Gradients
Figure 84 Hourly Sound Level (Leq) with Combined Wind and Temperature Conditions
Figure 85 Hourly Sound Level (Leq) with Combined Wind and Temperature Conditions
20
30
40
50
60
70
80
90
10 100 1000
Hour
ly Le
q (d
BA)
Distance (feet)
Wind Effects Comb. With -0.1 C/m Lapse; 5-ft Rec; Autos & Trucks; No Barrier; Soft Grnd.
calm up 5 m/s up 2.5 m/s dn 2.5 m/s dn 5 m/s
20
30
40
50
60
70
80
90
10 100 1000
Hour
ly Le
q (d
BA)
Distance (feet)
Wind Effects Comb. With -0.1 C/m Lapse; 15-ft Rec; Autos & Trucks; No Barrier; Soft Grnd.
calm up 5 m/s up 2.5 m/s dn 2.5 m/s dn 5 m/s
J-52