Final Report to the Department ofenergy.gov/sites/prod/files/2015/11/f27/final_report...Final Report...
50
Final Report to the Department of Energy Renewable Energy and Energy Efficiency Award Number: DE-EE0005623 Topic Area: Development of Economically Sustainable Renewable Energy Installations Project Name: Agua Caliente Wind/Solar Project at Whitewater Ranch Technical Contact: Todd Hooks, Economic Development Director Agua Caliente Band of Cahuilla Indians 5401 Dinah Shore Drive Palm Springs, CA 92264 Office: 760-883-1338 [email protected] Project Consultant: Royce Stewart, General Manager Red Mountain Energy Partners 223 N. Guadalup St,. #223 Santa Fe, NM 87501 Office: 505 983-8907 [email protected]
Transcript of Final Report to the Department ofenergy.gov/sites/prod/files/2015/11/f27/final_report...Final Report...

Final Report to the Department of Energy Renewable Energy and Energy Efficiency Award Number: DE-EE0005623 Topic Area: Development of Economically Sustainable Renewable Energy Installations Project Name: Agua Caliente Wind/Solar Project at Whitewater Ranch Technical Contact: Todd Hooks, Economic Development Director Agua Caliente Band of Cahuilla Indians 5401 Dinah Shore Drive Palm Springs, CA 92264 Office: 760-883-1338 [email protected]
Project Consultant: Royce Stewart, General Manager Red Mountain Energy Partners 223 N. Guadalup St,. #223 Santa Fe, NM 87501 Office: 505 983-8907 [email protected]

Table of Contents
Table of Contents .......................................................................................................................... 1
Section 1 – Executive Summary .................................................................................................. 5
Section 2: Project Background .................................................................................................... 6
Section 3: Resource Assessment ............................................................................................... 9
Introduction ................................................................................................................................ 9
Solar ........................................................................................................................................... 9
Wind ......................................................................................................................................... 11
Section 4 - Technology ............................................................................................................... 16
Introduction .............................................................................................................................. 16
Solar ......................................................................................................................................... 16
Solar Photovoltaic Panels ................................................................................................. 16
Top 10 PV Module Suppliers in 2013 ............................................................................. 17
Solar Thermal ..................................................................................................................... 23
Concentrator Photovoltaic Systems ................................................................................ 24
Wind ......................................................................................................................................... 25
Wind Turbines and Towers ................................................................................................... 25
Energy Storage ....................................................................................................................... 29
Batteries ............................................................................................................................... 30
Compressed Air .................................................................................................................. 31
Flywheel ............................................................................................................................... 32
Pumped Hydro .................................................................................................................... 32
Thermal Storage ................................................................................................................. 34
Microgrids ................................................................................................................................ 34
Section 5 - Power Markets .......................................................................................................... 36
CA Market Analysis ................................................................................................................ 36
Southern California Edison (SCE) Programs ....................................................................... 37
Solar Market Trends .............................................................................................................. 40
Wind Market Trends............................................................................................................... 43
Section 6 - Project Economics .................................................................................................... 48
Market Activity......................................................................................................................... 48
Section 7 - Project Assessment ................................................................................................. 49
Qualitative Factors ................................................................................................................. 49

Relative importance ............................................................................................................... 49
Risks ......................................................................................................................................... 49
Section 8 - Conclusions .............................................................................................................. 50

Figure 1 - Map of ACBCI Lands ................................................................................................. 6
Figure 2 - PV Solar Resources of US ....................................................................................... 9
Figure 3 - Solar Radiation at Global Tilt ................................................................................. 10
Figure 4 - Solar Resource at WWR ......................................................................................... 11
Figure 5 – US - Annual Average Wind Speed at 80 m ........................................................ 12 Figure 6 - Cal. - Average Annual Wind Speed at 80 m ........................................................ 14
Figure 9 – 2013 0 Top 10 PV Suppliers ................................................................................. 18
Figure 10 R&E vs Market Rank ............................................................................................... 19 Figure 11 – Solar Panel Efficiencies ....................................................................................... 20
Figure 12 – Wind Turbin Components .................................................................................... 25 Figure 13 – Tower Height vs LCOE ........................................................................................ 26
Figure 14 – Nameplate Capacity, Rotor Dia, & Avg. Hub Height ....................................... 27 Figure 15 – Annual Nameplate Capacity Deployment ......................................................... 27
Figure 16 – Annual Tower Height Deployment ..................................................................... 28 Figure 17 – Annual Rotor Diameter Deployment .................................................................. 28 Figure 18 – CAISO Duck Chart ................................................................................................ 30
Figure 19 – Geologic Formations ............................................................................................ 32
Figure 20 – Storage Deployment by Technology .................................................................. 33
Figure 21 – Pumped Hydro Example ...................................................................................... 33
Figure 22 – Microgrid example ................................................................................................ 35
Figure 23 – Renewable Energy Capacity in Operation ........................................................ 36
Figure 24 - Renewable Cap. Amt. by Study Status of Projects in CAISO Queue ........... 37 Figure 25 – SCE Contract Opportunities ................................................................................ 38
Figure 26 – Quarterly Solar PV Deployment ......................................................................... 40 Figure 27 Expected Solar PV Deployment ............................................................................ 41
Figure 28 – PV Systems Pricing Trends ................................................................................ 42
Figure 29 – Wind Annual and Cumulative Capacity ............................................................. 43
Figure 30 – Deployments by Resource .................................................................................. 44 Figure 31 – Map of US Wind Projects .................................................................................... 45
Figure 32 - Nameplate resource cap. in 37 selected interconnection queues ................. 46
Figure 33 - Wind power cap. in 37 selected interconnection queues ................................ 47
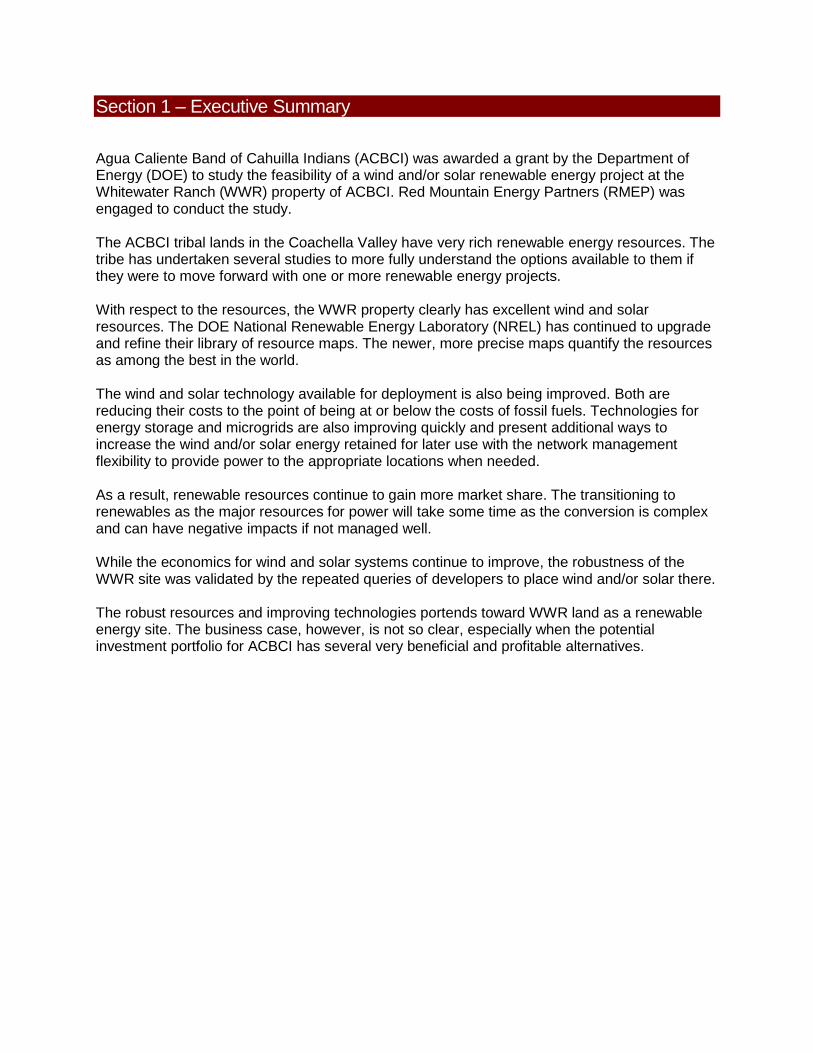
Section 1 – Executive Summary
Agua Caliente Band of Cahuilla Indians (ACBCI) was awarded a grant by the Department of Energy (DOE) to study the feasibility of a wind and/or solar renewable energy project at the Whitewater Ranch (WWR) property of ACBCI. Red Mountain Energy Partners (RMEP) was engaged to conduct the study. The ACBCI tribal lands in the Coachella Valley have very rich renewable energy resources. The tribe has undertaken several studies to more fully understand the options available to them if they were to move forward with one or more renewable energy projects. With respect to the resources, the WWR property clearly has excellent wind and solar resources. The DOE National Renewable Energy Laboratory (NREL) has continued to upgrade and refine their library of resource maps. The newer, more precise maps quantify the resources as among the best in the world. The wind and solar technology available for deployment is also being improved. Both are reducing their costs to the point of being at or below the costs of fossil fuels. Technologies for energy storage and microgrids are also improving quickly and present additional ways to increase the wind and/or solar energy retained for later use with the network management flexibility to provide power to the appropriate locations when needed. As a result, renewable resources continue to gain more market share. The transitioning to renewables as the major resources for power will take some time as the conversion is complex and can have negative impacts if not managed well. While the economics for wind and solar systems continue to improve, the robustness of the WWR site was validated by the repeated queries of developers to place wind and/or solar there. The robust resources and improving technologies portends toward WWR land as a renewable energy site. The business case, however, is not so clear, especially when the potential investment portfolio for ACBCI has several very beneficial and profitable alternatives.

Section 2: Project Background
Agua Caliente The Agua Caliente Band of Cahuilla Indians (ACBCI) is a federally recognized Native American Tribe with over 400 enrolled members. The reservation, according to Wikipedia, occupies 31, 600 acres with approximately 6,700 acres within the city of Palm Springs, CA. This makes the tribe the largest land owner in the city. The reservation has a checkerboard pattern across 51 sections, as is frequently done for tribal reservations in the western United States. Figure 1 is a map that shows the reservation lands in this area.
Figure 1 - Map of ACBCI Lands
ACBCI strives not only to maintain its cultural heritage and past, but also provides support for the surrounding community. ACBCI activities have had multiple economic impacts on the Coachella Valley stemming not only from the last 10 years of its casino operations, but also the extensive holdings remaining in the Tribe’s historic land base, underlying much of what is now the cities of Palm Springs and Cathedral City, and portions of the City of Rancho Mirage and Riverside County.

ACBCI is in a very active region in the United States for renewable energy development. California has the highest goal in the USA for the percentage of electricity to be generated by renewable energy- 33% by 2020. Significant progress is being made towards that goal but continued substantial deployments will be needed to achieve the 33% on time. The tribe has been thoroughly looking at its energy needs and the role that renewables might play in the mix for at least a decade. The work includes:
Renewable Resources Strategic Value Assessment In a project funded by a BIA grant the Tribe was able to assess renewable resources on the Agua Caliente Indian Reservation. The outcome of the study showed that the Tribe maintained an abundance of solar and wind resources and minimal geothermal resources. As a result, the Tribe pursued and installed an 8.25kW solar photovoltaic panel system at the Agua Caliente Trading Post within the Tribe’s sacred home in the Indian Canyons. The system is off-grid and provided return on investment within a 3 year period. Strategic Energy Plan Development for ACBCI The 2006 Energy Plan Development process allowed the Tribe to develop an energy vision for the Agua Caliente Indian Reservation and establish near and far term goals for the Tribe’s energy use and management going forward. Many of the processes established under this Energy Plan are in use today and provide an ongoing foundation for future efforts and endeavors. The Plan is nearly 10 years old and likely needs to be reassessed for current issues facing the Agua Caliente Band of Cahuilla Indians. Energy Plan Implementation: Utility Formation The Agua Caliente Tribe developed the Water and Energy Resource Authority (WERA) as a result of the Strategic Energy Plan. This entity still operates on some levels and allows the Tribe to maintain a structural entity as they face varied issues here in the Coachella Valley in dealing with local utilities.
Water and Energy Resource Authority See Utility Formation. The Tribe has discussed formation of a utility, but to this point this option has not been seriously considered. ACBCI Solar Feasibility Study The results of this study led to the current Wind/Solar Feasibility Study at Whitewater Ranch. Whitewater Ranch was one of the three locations analyzed within the Solar Feasibility Study. This study closely analyzed the three main load centers for the Tribe and analyzed the likelihood of renewable installation at these load centers. Unfortunately, the results came during the economic downturn and the costs required for these programs were prohibitive. The Agua Caliente Tribe continues to analyze and weigh the return on investment factors associated with these properties. The value of land near these load

centers also requires the Tribe to fully analyze the long term potential of the land and to this point has been a prohibitive factor.
Economic development is critically important to ACBCI as the Tribe continues to establish a vibrant and viable future for its people for generations to come. Moreover, by investing in diverse and strategic economic ventures both on and off the reservation, the Tribe has forged a long-standing history as an economic engine for the entire Coachella Valley. As a conscientious neighbor, and as one of the largest employers in the Coachella Valley with nearly 2,400 people on payroll, the Tribe continually works with surrounding municipalities to create economic ventures that build a strong economy for the community as a whole. The proposed solar project(s) being evaluated may be able to provide dependable long-term power to ACBCI facilities and to the reservation overall, at lower cost, and with less price fluctuation than at present, all with considerably less environmental impact than from fossil fueled generation . ACBCI will have more control over its energy costs, and potentially be able to provide electric service to other businesses being considered. ACBCI recognizes that diversification is key to sustainable Tribal economic and community development, and particularly in California, energy is a means to that end. From a project development and ownership perspective, ACBCI believes that the opportunity to have an equity interest in renewable energy projects will provide potentially significant economic gain in an industry other than gaming. The proposed solar projects evaluated could be the first Tribally-developed initiative to demonstrate ownership and operation of a utility-scale solar renewable energy project, and could represent an important first step toward developing a regional model and creating a reusable platform for Tribes. As described earlier, ACBCI has already been active in considering and evaluating energy infrastructure and self-generation projects, and has seen first-hand the impact of energy self-sufficiency on community development. The primary barrier to solar project development on ACBCI lands is the Tribe’s need to balance the costs and benefits of alternative land uses. However, ACBCI believes that its contemplated projects will create local and regional environmental benefit, and contribute to self-sufficiency and human capacity. Long before the Federal Government imposed its first environmental requirements under the national Environmental Policy Act in 1970, Tribal Members determined in 1959 that they must provide comprehensive stewardship of the land while carefully managing their real estate resources. For this reason, the Tribe reserved all the Reservation’s canyon lands from development and established the Indian Planning Commission to encourage responsible development of their real estate, while at the same time preserving the environment that their ancestors had bequeathed to them. That stewardship continues today and applies to the Tribe’s approach to development of sustainable energy projects.

Section 3: Resource Assessment
Introduction ACBCI lands have the unique and positive characteristic of having very good solar and wind resources. The tribe’s lands are in the western portion of the Sonoran Desert, which has many days of sunshine. The San Gorgonio Pass is located just west of the Agua Caliente Indian Reservation and has some of the best wind resources in the contiguous United States. The combined resources can provide energy over a longer portion of the 24 hours in a day. Power produced and sold from these locations come closer to providing “baseline power” that is available 24x7, a more attractive alternative than peaking power solutions. As energy storage solutions become more cost effective and reliable, the combined solution will closely approach baseline equality.
Solar The Department of Energy’s National Renewable Energy Laboratory (NREL), located in Golden, Colorado, has been providing a broad range of tools that are quite useful in examining renewable energy matters. Their many, many publically available tools include over 1200 maps showing the measured resources in many parts of the world. Because the solar systems vary in their ability to capture the energy as a consequence of the technology used, a geographic area will have several maps showing the available resource by technology. In this analysis, photovoltaic (PV) data was chosen because of the low impact on the system by the high winds in the area.
Figure 2 - PV Solar Resources of US
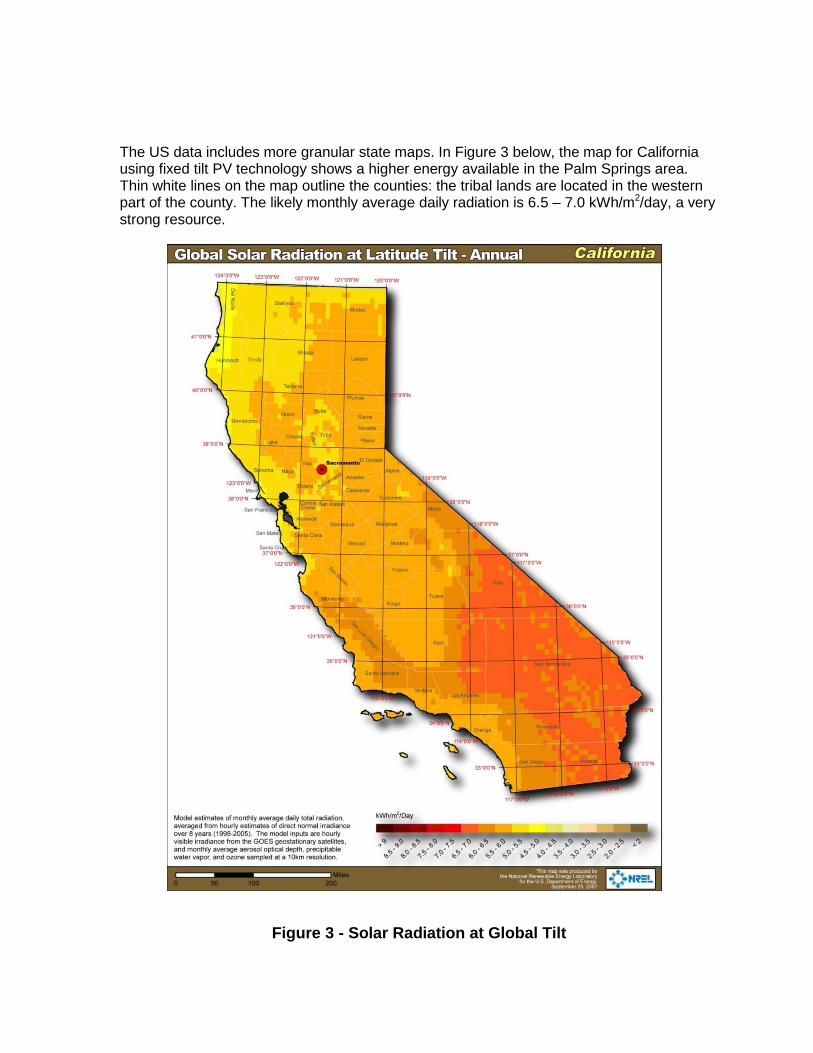
The US data includes more granular state maps. In Figure 3 below, the map for California using fixed tilt PV technology shows a higher energy available in the Palm Springs area. Thin white lines on the map outline the counties: the tribal lands are located in the western part of the county. The likely monthly average daily radiation is 6.5 – 7.0 kWh/m2/day, a very strong resource.
Figure 3 - Solar Radiation at Global Tilt

NREL also provides a more granular look at renewable energy resources with Geographic Information System (GIS) data sets where the information can be analyzed in much greater detail. One data set for solar provides granularity of the information in the previous map segmented to 10 kilometer (6.2 mile) squares. In Figure 3, the map shows monthly average daily radiation is 6.5 – 7.0 in the study area.
Figure 4 - Solar Resource at WWR
Wind California also has quite robust wind resources in several parts of the state. NREL has similar wind resource information like the information developed for solar. While the solar information is sorted at a high level by technology (fixed tilt, single axis tracking, etc.), the wind data is provided by tower height. The higher the tower is, the stronger the wind-speed,

which leads to more turbine power output. The NREL map shown below provides a US view of wind speeds at 80 meters in Figure 5.
Figure 5 – US - Annual Average Wind Speed at 80 m
Because WWR is located at the eastern end of San Gorgonio Pass, vigorous wind would be expected. The pass is one of the deepest in the US, cutting between the San Bernardino Mountains on the north and the San Jacinto Mountains to the south. Palm Springs and the Coachella Valley are just east of the pass. I-10 goes through the pass, as well as a Union Pacific double main line. Some of the earliest wind farms are located here, although some of them are upgraded to more modern technology via “repowering” programs.


Figure 6 - Cal. - Average Annual Wind Speed at 80 m
NREL has also provided GIS data with more granularity, although so far the data is for 50m high. Wind speeds increase as altitude increases, so an 80 m version would be highly likely to have higher wind speeds. Looking at the 50m data, the study area is shown to have winds at greater than 10.5 m/s, the highest level used in measuring
wind speeds for wind energy studies.
Figure 7 – WWR Wind Speed at 50 m
The met tower performed as part of this grant study confirmed the high speeds. This project included a task for specifically measuring the wind resource at a specific ACBCI land area known as White Water Ranch, which is just east of the intersection of Interstate Highway I-

10 and California State Highway 111. The DOE grant funded measuring the wind resource with a meteorological tower over a one year period. The work was tasked to Karbon Zero, who installed the tower and captured the data over the period from August 2013 to August 2014. After one year of data was captured, Karbon Zero worked with V-Bar to obtain an analysis. The 60 meter tower had instrumentation to measure wind speeds at 39.9m, 49.4m, and 58.4m above ground. The likely range of true long-term mean annual 80-m wind speeds is 9.8-10.0 mps, a very strong wind resource. The wind data was modeled used a configuration where two commercially available turbines would be located at the site. Three turbine sizes were used in the modeling: 2 MW, 3 MW, and 3.3 MW.
Section 4 - Technology
Introduction Progress continues in solar technology as market participants seek higher efficiencies, lower costs, improved maintenance processes, etc. The growth of this market helps drive the investment levels.
Solar Red Mountain assessed one solar technology, solar photovoltaics (PV), as the other two prominent technologies, solar thermal, and concentrating solar photovoltaics, have attributes that make them less acceptable in this locale. Solar thermal requires water that is circulated and heated. In the desert, water is scarce and other uses for the water make more economic sense. Solar thermal companies are working diligently to revive their technology by offering dispatchable power by integrating storage into their facilities. In the past few years, solar PV has dominated the market due to significant price drops in solar panels that solar thermal technologies could not compete with. Concentrating solar photovoltaics uses optics to concentrate the solar energy into a more concise array of PV. Currently the pricing makes this option much less competitive. One challenge with PV consists of grid stability due to intermittency.
Solar Photovoltaic Panels Photovoltaic technology converts sunlight directly into electricity, thus making panels effective during daylight hours. Many companies are working towards large scale storage applications for PV in order to enable excess PV energy to be stored and utilized at night. However, battery technology is still under development and large scale battery banks are not yet bankable. Red Mountain does not recommend adding storage to a PV project. PV panel suppliers typically offer 20-25 year linear output warrantees. There are two main types of solar panels: crystalline silicon and thin-film. Nearly 90% of the World’s PV today is based on some variation of silicon; the main difference between the panels is the purity of the silicon. Monocrystalline – single crystalline silicon; they have the highest efficiency rates since they are made out of the highest-grade silicon. They produce approximately four times the amount of electricity as thin-film solar panels thus requiring less space for the same amount of power output. Monocrystalline panels have the longest life times but are also the most expensive. Polycrystalline – the process used to make polycrystalline silicon is simpler and cost less and the heat tolerance is slightly lower than monocrystalline (solar panel output decrease with increasing temperatures). Because of lower silicon purity, polycrystalline solar panels are not as efficient as monocrystalline solar panels.

Thin-Film – thin film solar cells generally consist of depositing one or several thin layers of PV material onto a substrate. The different types of thin-film solar cells can be categorized by which photovoltaic material is deposited onto the substrate:
Amorphous silicon (a-Si)
Cadmium telluride (CdTe)
Copper indium gallium selenide (CIS/CIGS)
Organic photovoltaic cells (OPC) Depending on the technology, thin-film module prototypes have reached efficiencies between 7–13%. Future module efficiencies are expected to climb close to 10–16%. They are cheaper to manufacture than crystalline-based solar cells. High temperatures and shading have less impact on panel performance. In situations where space is not an issue, thin-film solar panels can make sense. Thin-film solar panels tend to degrade faster than mono- and polycrystalline solar panels, which is why they typically come with a shorter warranty. Cadmium telluride is the only thin-film solar panel technology that has surpassed the cost-efficiency of crystalline silicon solar panels in a significant portion of the market. First Solar has installed over 5 GW of cadmium telluride thin-film solar panels worldwide. First Solar holds the world record for CdTe PV module efficiency of 14.4%.
Top 10 PV Module Suppliers in 2013 Figure 9 is a list of the top 10 PV module suppliers in 2013. Seven of the Top 10 companies are publicly-listed, vertically-integrated crystalline-Silicon (c-Si) manufacturers located in China. Sharp Solar, First Solar is the only US based supplier in the rankings for 2013.1 The Top 10 supplied over 18GW of PV modules in 2013, representing a 40% increase compared to 2012. With global PV demand in 2013 only growing by 20%, it is clear that the industry’s leading players expanded market shares considerably in 2013. First Solar is also the only thin-film manufacturer in the list.
1 Jan 2014. SolarBuzz
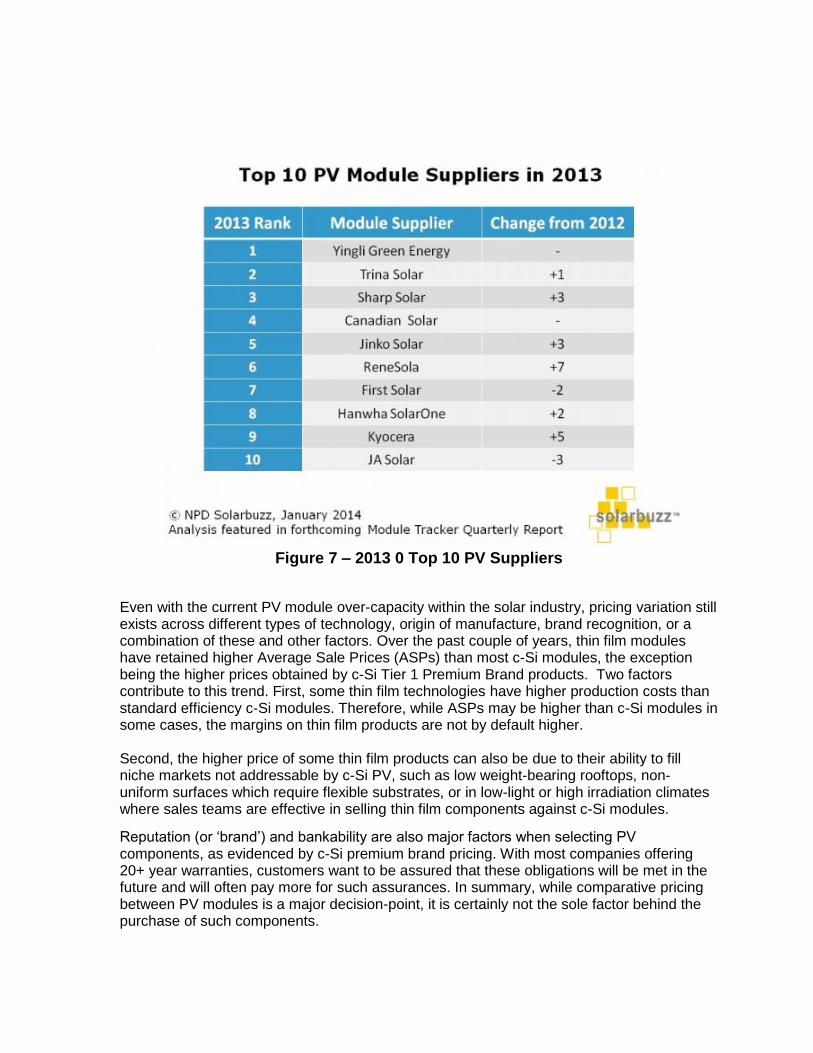
Figure 7 – 2013 0 Top 10 PV Suppliers
Even with the current PV module over-capacity within the solar industry, pricing variation still exists across different types of technology, origin of manufacture, brand recognition, or a combination of these and other factors. Over the past couple of years, thin film modules have retained higher Average Sale Prices (ASPs) than most c-Si modules, the exception being the higher prices obtained by c-Si Tier 1 Premium Brand products. Two factors contribute to this trend. First, some thin film technologies have higher production costs than standard efficiency c-Si modules. Therefore, while ASPs may be higher than c-Si modules in some cases, the margins on thin film products are not by default higher. Second, the higher price of some thin film products can also be due to their ability to fill niche markets not addressable by c-Si PV, such as low weight-bearing rooftops, non-uniform surfaces which require flexible substrates, or in low-light or high irradiation climates where sales teams are effective in selling thin film components against c-Si modules.
Reputation (or ‘brand’) and bankability are also major factors when selecting PV components, as evidenced by c-Si premium brand pricing. With most companies offering 20+ year warranties, customers want to be assured that these obligations will be met in the future and will often pay more for such assurances. In summary, while comparative pricing between PV modules is a major decision-point, it is certainly not the sole factor behind the purchase of such components.

Compared to their c-Si counterparts, thin film PV modules offer a different proposition as there are only a handful of manufacturers currently offering high quantities of product to the market. As a result, these companies are differentiated less by brand and more by type of product or business model. Thin film technologies often have very different cost and efficiency metrics, a big difference compared to c-Si modules. As such, thin film products exhibit a wider range of pricing differentials. But even these have been converging over the past year. Since thin film technologies have also been impacted by the global oversupply situation, they now see increased competition from the c-Si segment. There has been a direct correlation between the growth of the PV industry since 2007 and increased allocation of financial resources from leading PV module manufacturers towards R&D activities. See Figures 10 and 11 for a list of the Top 12 Research and Development spenders and their panel efficiencies. 2013 data is not yet available so date through 2012 is shown.
Figure 8 R&E vs Market Rank

Figure 9 – Solar Panel Efficiencies
Tiers of Solar Panel Quality Tier 1: Top 2% of solar manufacturers, vertically integrated, invests heavily in R&D, advanced robotic processes, manufacturing solar panels for longer than 5 years. Tier 2: Small-medium scale manufacturers, no or little investment in R&D, use some robotics and rely on some manual work from human production lines, usually producing panels for 2-5 years. Tier 3: Assemblers only – 90% of new solar PV, no investment in R&D, Assembly panels only, does not manufacture silicon cells, uses human production lines for manual soldering of solar cells instead of advanced robotics; assembling panels for 1-2 years.
First Solar First Solar is the only thin film maker in the top 10 list due to their business model; they shifted from supplying modules to external customers to using them predominantly on internal projects. First Solar has recently reported a range of record CdTe thin-film cell and module efficiencies both in the lab and at the manufacturing level. This year, R&D test cells produced at First Solar’s Perrysburg, Ohio factory have been verified by NREL to have reached a new record cell conversion efficiency of 18.7%. First Solar has launched its Series 3 CdTe thin-film PV module platform. The ‘Series 3 Black’ is said to incorporate First Solar's latest advances in conversion efficiency as well as additional features to enhance its performance in utility-scale power plants. The majority of PV power plants are located in hot temperature climates where module temperatures are above 25°C. Due to temperature coefficient impacts on module yields, limiting the temperature impact provides operators and owners with the best possible plant yield. Providing further enhancements due to harsh desert environments could increase the reliability of the modules.

The all-black module's change in appearance results from the use of an advanced, all-black edge seal technology combined with an innovative encapsulation material that further enhances its field durability and demonstrates improvements in accelerated life testing results. The Series 3 Black's performance in a wide range of operating environments is further validated by its new IEC 60068-2-68 "sand and dust test" certification, which measures durability in harsh desert environments characterized by blowing abrasive sand. First Solar retains its energy yield advantage in high temperature climates (temperature coefficient) where 90% of a PV plant’s generation can occur when module temperatures are above 25°C. The Series 3 Black is expected to have module conversion efficiencies greater than 12.9% to 13%. First Solar began to implement the Series 3 Black enhancements in production modules earlier this year.
Jinko Solar Jinko Solar also developed projects in China, and was one of the main beneficiaries from strong domestic market demand during the second half of 2012 from China. SunPower Corporation
SunPower recently launched its ‘X-Series’ module that employs its latest ‘Maxeon Gen 3’
solar cell technology, which has conversion efficiencies of over 24%. The modules have efficiencies of 21.5% and above. SunPower has delivered over 120 large-scale solar photovoltaic systems over the past decade. Sharp Sharp Solar Panels are currently the best-selling panel in the UK - comprising 180W, 185W and 235W series, module efficiencies of 13.7%-14.1%, 5 year product warranty and 10 and 25 year performance warranty of outputs of 90% and 80%. Hanwha Solar One Hanwha Q CELLS has introduced its polycrystalline-based ‘Q.PRO-G3’ series module. Using its ‘Q.ANTUM’ high-efficiency solar cell technology (19.5% conversion efficiencies) and performance induced degradation (PID) free technology, the module employs a lighter and slimmer design, using higher tensile aluminum frame. Slimmer module design and low weight allow for more modules per box and provide easier installation. Reducing logistics burdens and storage costs as well as less packaging waste support overall cost reductions. The new polycrystalline module features high performance cells based on Q.ANTUM technology, which generates higher module power. The Q.ANTUM dielectric cell back side reflects light waves which have passed through the cell, thus enabling the use of otherwise lost light energy. The module’s new high-quality anti-reflection glass further boosts power yields to facilitate polycrystalline solar modules with power classes of up to 265 Wp. Q.PRO-G3’s lighter and slimmer design allows easier handling, and reduces warehousing and logistics costs by up to a claimed 29%. According to the latest edition of the International Technology Roadmap for PV, significant changes, especially in the field of solar cell design and related move to N-type mono wafers and a switch to copper metallization starting in 2015, are predicted. An entire suite of evolutionary changes from wafers, materials, cells and modules are expected that should

require and have already forced some leading companies to continue to invest in R&D activities, a trend that is expected to continue in the mid-term.2 Yingli Yingli is one of the world's largest vertically integrated manufacturers, high efficiency, 210 W, 235 W outputs, module efficiency of 14.4%, 5 year product warranty and 25 years performance warranty of outputs of 80%.
Kyocera Kyocera high-performance solar cells, with efficiency of over 16%, provide high annual
energy yields. Kyocera is one of the world's largest vertically-integrated producers and
suppliers of solar energy panels. Kyocera Solar, Inc. (KSI) is headquartered in Scottsdale,
Arizona, manufacturing and installing more than 1.2 gigawatts of solar collection. Trina Solar Trina Solar is planning to introduce the 60-cell PDG5, the first in a new line of dual rated frameless modules. The PDG5 is optimized for reliable performance under stressful environmental conditions. Although glass/glass modules are believed to offer higher levels of robustness, especially in harsh environments they have typically suffered from higher cost and carry a weight penalty. The PDG5 features front and back layers of special heat-strengthened glass replacing the traditional backsheet materials of conventional solar modules. The PDG5 provides a heavy-duty solution for environments of high temperature and humidity, conditions that can accelerate performance degradation. The resulting module has increased resistance to micro-cracking, potential induced degradation (PID), module warping, and degradation from UV rays, sand, alkali, acids and salt mist. By reducing the module's glass thickness from the industry standard of 3.2mm to 2.5 mm, and applying an antireflective coating to the front glass, transmission is enhanced by an estimated 2.5%. MC4PLUS photovoltaic connectors increase system reliability. Modules are designed for higher 1000V IEC and 1000 V UL applications, which enables longer installation runs to enable improve cabling, hardware and labor installation costs. By eliminating the aluminum frame of conventional modules, grounding requirements are eliminated, which can extend Balance of System (BoS) cost savings. The new modules are backed by a 25-year linear power warranty. SunEdison SunEdison are tier 1 solar panels: vertically integrated, invests heavily in R&D, and have an advanced robotic processes. When assessing potential solar panel manufacturers, look for large publicly traded, government sponsored or large U.S. based manufacturer. Always ask for the manufacturer's stock symbol, sponsoring government identity or U.S. solar panel manufacturing facility address. With the flood of solar panels that are entering the U.S. market that are coming from hundreds of tiny, financially unsound overseas manufacturers. If a catastrophic manufacturing defect were to occur and a major portion of a manufacturer's production were

to result in a recall, it would be highly unlikely that a small privately held overseas company would be able to survive the replacement of even a moderate portion of their production. A larger publicly traded, government sponsored or U.S. based manufacturer would be far more likely to possess the financial strength to honor their warranty. Suntech Suntech Power Holdings Co. (STP), forced to put its Chinese solar unit into bankruptcy this year. Regulatory filings show customers linked to the founder couldn’t pay their bills and the company booked the sales as revenue anyway.
Solar Thermal3 Solar thermal electric energy generation concentrates the light from the sun to create heat, and that heat is used to run a heat engine, which turns a generator to make electricity. The working fluid that is heated by the concentrated sunlight can be a liquid or a gas. Different working fluids include water, oil, salts, air, nitrogen, helium, etc. Different engine types include steam engines, gas turbines, Stirling engines, etc. All of these engines can be quite efficient, often between 30% and 40%, and are capable of producing 10's to 100's of megawatts of power. Line focus is less expensive, technically less difficult, but not as efficient as point focus. The basis for this technology is a parabola-shaped mirror, which rotates on a single axis throughout the day tracking the sun. Point focus technique requires a series of mirrors surrounding a central tower, also known as a power tower. The mirrors focus the sun's rays onto a point on the tower, which then transfers the heat into more usable energy.
Point focus, though initially more expensive and more complex, is more efficient. The point of focus in a line focus mirror array temperatures can reach 250°C, enough to run a steam turbine, however, point focus can achieve higher temperatures in the 500°C range thus offering greater efficiencies. Improved efficiencies minimize land usage and the effective cost per kWh of the plant.
Spain and Australia are the current leading countries in solar thermal energy production. Spain produces a large percentage of their electricity though their solar thermal facilities, built by solar thermal powerhouses such as Acciona and Abengoa. California based solar thermal company, eSolar, and the Israeli company, Brightsource, are fast growing competitors. Abengoa is opening the first power tower to be used for commercial energy production. eSolar is working with Southern California Edison to use solar thermal technology to generate 245 MW of power. Similarly, Brightsource has contracts with Pacific Gas and Electric Company to bring even more solar thermal generated power to California. SolarReserve, a California company, is building a 110 MW Crescent Dunes facility in Nevada, which will be the largest solar tower system with integrated storage.
3 “An Industry Report on Solar Thermal,” http://www.solar-thermal.com/

eSolar has a different strategy to other solar tower technology developers that are building large-scale power plants of between 100 MW and 400MW with large towers soaring between 150 m and 200 m high. eSolar is developing smaller arrays in the 46 MW range around 65m high. eSolar recently completed a molten storage integration study funded by the Department of Energy. With molten salt technology would enable collecting more energy throughout the day and enable the plant to run after the sun goes down. Molten salt storage technology is still in the research and development (R&D) phase. Compared to PV, solar thermal requires more area and water for cooling purposes.
Concentrator Photovoltaic Systems4 A concentrator makes use of relatively inexpensive materials such as plastic lenses and metal housings to capture the solar energy shining on a fairly large area and focuses that energy onto a smaller area—the solar cell. A typical concentrator unit consists of a lens to focus the light, a cell assembly, a housing element, a secondary concentrator to reflect off-center light rays onto the cell, a mechanism to dissipate excess heat produced by concentrated sunlight, and various contacts and adhesives. Both reflectors and lenses have been used to concentrate light for PV systems. Concentrator PV systems use less solar cell material than other PV systems. PV cells are the most expensive components of a PV system, on a per-area basis. Concentrator PV systems have several advantages over flat-plate systems. First, concentrator systems reduce the size or number of cells required and allow for more efficient semiconductor materials that would otherwise be cost prohibitive. Second, a solar cell's efficiency increases under concentrated light. Third, a concentrator can be made of small individual cells; it is harder to produce large-area, high-efficiency solar cells than it is to produce small-area cells.
One challenge for concentrating PV is the concentrating optics are significantly more expensive than the covers necessary for flat-plate PV systems. In addition, most concentrators must track the sun throughout the day and year to be effective; thus, achieving higher concentration ratios means using expensive tracking mechanisms that incorporate more precise controls. Concentrators cannot focus diffuse sunlight, which makes up about 30% of the solar radiation available on a clear day. High concentration ratios also introduce a heat problem; concentrating solar radiation generates significant amounts of heat. Cell efficiencies decrease as temperatures increase, and higher temperatures also threaten the long-term stability of solar cells. Therefore, the solar cells must be kept cool in a concentrator system, requiring sophisticated heat sync cooling designs.
4 US DOE Energy Efficiency and Renewable Energy. “Concentrator PV Systems”. http://www.eere.energy.gov/basics/renewable_energy/concentrator_pv_systems.html

Wind
Wind Turbines and Towers Wind turbine technology is straightforward in the creation of electrical energy. The energy in the wind is transformed to electrical energy through the rotor blades being turned by the wind in a way that turns the central shaft where the blades are attached. The central shaft is connected to a generator which converts the mechanical energy into electricity. Wind turbines are basically built with the central axis horizontal (parallel to the land or water) or vertical (perpendicular to the land or water). The horizontal axis turbines dominate the market. A diagram of a horizontal axis turbine is shown in the figure below5.
Figure 10 – Wind Turbine Components
The towers for the turbines continue to increase in height, allowing the turbines to access the higher speed winds available at the greater heights. The taller towers do provide a lower Levelized Cost of Energy (LCOE), as shown by the red line in the following image6.
5 http://www.reuk.co.uk/Look-Inside-a-Commercial-Wind-Turbine.htm 6
NREL/TP-5000-61063, Page 5, January 2014

Figure 11 – Tower Height vs LCOE
As the towers get taller, the challenges of transporting and installing the towers have increased. Suppliers are looking at alternative designs and materials that will help keep the costs from inordinately increasing. For example, concrete towers are being viewed as an alternative for towers over 80 meters. A recently released DOE report provides more specific data on these trends.7 The report cited several technological trends. Increases continue in the nameplate capacity, hub height and rotor diameter. A graphic in the report demonstrates this trend, using data from the AWEA project database for turbines larger than 100 kW:
7 “2013 Wind Technologies Market Report”, Ryan Wiser and Mark Bolinger, Lawrence Berekley National
Laboratory, August 2014

Figure 12 – Nameplate Capacity, Rotor Dia, & Avg. Hub Height
Looking at each of the three characteristics, nameplate capacity has over 80% deployment in 2013 of 1.5 – 3.0 MW turbines with the remainder split between 2.0 – 2.5 MW and 2.5 – 3.0 MW turbines. The average actually decreased in 2013 as no 3 MW or bigger turbines were installed during the year.
Figure 13 – Annual Nameplate Capacity Deployment

For average hub height, a similar trend occurred. The authors cited two possible causes for the reduction in the average. A small number of projects were built in 2013 so the specific characteristics of the projects may have an impact. Also, a higher percentage of these projects were in the interior US where higher winds allow the use of standard 80 m towers.
Figure 14 – Annual Tower Height Deployment
Rotor diameter also has increased quickly, as shown below.
Figure 15 – Annual Rotor Diameter Deployment

Energy Storage Energy storage solutions have been in use for a while in both utility and distributed applications. The need for these solutions is driven by more than renewable energy applications. For all power generation technologies, a major challenge is to match the amount of energy generated to the amount of energy demand. Demand fluctuates as users vary their usage. The cost to build generation capacity to meet the highest levels of demand would greatly increase the price charged to users. A more economical alternative is to use solutions that incrementally add short term generation capacity and/or manage demand so as to avoid exceeding the maximum generation capacity and/or generate energy in advance that is stored for use when demand exceeds the online generation. Renewable energy generation systems like solar and wind are more variable than existing fossil fuel generation. Hence, energy storage is more helpful for solar and wind deployments. Implementation of energy storage systems into a public or commercial electrical grid is complex. Regardless of the technology, there are several technical, financial, and regulatory aspects that must be considered. As the amount of renewable energy implementation increases significantly, power providers will have to address the substantial changes in demand. An example that communicates the extensive upcoming changes in California is shown in Figure 18 below. The California ISO describes the chart: “The ISO created future scenarios of net load curves to illustrate these changing conditions. Net load is the difference between forecasted load and expected electricity production from variable generation resources. In certain times of the year, these curves produce a “belly” appearance in the mid-afternoon that quickly ramps up to produce an “arch” similar to the neck of a duck—hence the industry moniker of “The Duck Chart”

Figure 16 – CAISO Duck Chart
The hourly difference in demand is better handled by energy storage, in many instances. Businesses and consumers can diminish their power needs over this daily cycle with energy storage systems. Energy storage is available in several different technologies. The technologies that are currently more prominent include batteries, compressed air, flywheel, pumped hydro, and thermal storage.
Batteries Batteries have been in use for a long time in electrical applications. Two types of batteries have been used for energy storage: solid state and liquid flow. Solid state batteries use materials like Lithium – Ion that are solids and the energy is stored in the electrodes. Liquid flow uses chemicals in an electrolyte solution and the energy is stored in this solution. When being considered for use in grid applications, batteries have some attractive features as well as some meaningful drawbacks.

Batteries are attractive because:
They are promptly available to supply energy when needed as compared to many of
the other technologies.
No geographic constraints are present; some other technologies do have constraints.
Less complex implementation
Increasing reliability
Disadvantages of batteries are:
Relatively expensive, although economies of scale are quickly diminishing this
attribute
Lower energy density
Shorter lifetimes
Possible longer charging times
Potentially higher system costs
Compressed Air In this technology, air is compressed and stored under pressure in an underground cavern. When the energy is needed, the compressed air is used by a turbine to turn a generator that delivers the electrical power. This technology has been used for close to 150 years. An obvious constraint is having an underground cavern available. An image published by the Electrical Power Research Institute (EPRI) shows potential locations for compressed air.

Figure 17 – Geologic Formations
No areas are identified that are in reasonable proximity to the WWR site.
Flywheel Flywheels are rotating discs that store kinetic energy. The flywheel is normally driven by electricity and the disc rotates at high speed. Improved material for the disc and the use of a vacuum atmosphere has improved the efficiency of this technology. The primary application is to keep the frequency (e.g. 60 Hz) of the power well regulated.
Pumped Hydro Pumped Hydro storage contains the biggest portion of energy storage in the US, according to a recent DOE report.8 An image in the report shows 95% of the stored power in the US is pumped hydro.
8 “Grid Energy Storage”, US Department of Energy, December 2013

Figure 18 – Storage Deployment by Technology
The image below, published by the University of Iowa, describes how the pumped hydro is turned into electricity.
Figure 19 – Pumped Hydro Example
While pumped hydro is used in California, there are no options that are in close proximity to the WWR site.

Thermal Storage A specific thermal storage technology is being implemented in the desert of Southern California. Solar power towers concentrate the reflected sunlight onto a vessel containing molten salts. The heat of the salt is used later to heat water, creating steam that boils water to drive turbines that turn electricity generators. This is a relatively new technology
Microgrids Microgrid is the name used for new networks that help manage electrical networks. The new networks have intelligent devices with communication and control capabilities. A much less complex, consumer example of such a device is the Nest thermostat. The Nest “learns” the heating and cooling preferences for the home and programs itself to mimic those preferences. There is no need for the consumer to program the device. More complex hardware/software structures are arriving that will help manage the grid in several ways. One structure is the microgrid. Differences exist over how the term “microgrid” is used. For purposes of this report, the intent is to use the description on the Energy.gov website9. A portion of the page follows:
9 http://energy.gov/oe/services/technology-development/smart-grid/role-microgrids-helping-advance-
nation-s-energy-system

Figure 20 – Microgrid example
“Microgrids, which are localized grids, can disconnect from the traditional grid to operate autonomously and help mitigate grid disturbances to strengthen grid resilience. They can play an important role in transforming the nation’s electric grid. Microgrids can strengthen grid resilience and help mitigate grid disturbances because they are able to continue operating while the main grid is down, and they can function as a grid resource for faster system response and recovery. Microgrids also support a flexible and efficient electric grid, by enabling the integration of growing deployments of renewable sources of energy such as solar and wind and distributed energy resources such as combined heat and power, energy storage, and demand response. In addition, the use of local sources of energy to serve local loads helps reduce energy losses in transmission and distribution, further increasing efficiency of the electric delivery system.”

Section 5 - Power Markets
CA Market Analysis Governor Brown’s Clean Energy Jobs Plan set a goal of adding 20,000 MW of renewable generating capacity by 2020. The state’s RPS requires investor-owned utilities (IOUs), electric service providers, and community choice aggregators regulated by the CPUC to procure 33% of retail sales per year from eligible renewable sources by 2020. The RPS also requires retail sellers to achieve intermediate RPS targets of 20 percent from 2011-2013 and of 25% from 2014-2016. CA has roughly 3,000 MW of renewable energy capacity installed and IOUs have signed contracts for 14,000 MW of renewable energy within the state of CA. In 2011, CA IOUs served 20.6% of their electricity with renewable energy (up from 17% in 2010).10 The Renewable Auction Mechanism (RAM), approved by the California Public Utilities Commission (CPUC) in December 2010, is expected to result in 1,299 MW of new distributed generation over the course of two years. RAM is designed to streamline the procurement process for distributed generation projects up to 20 MW in capacity while ensuring the lowest costs for ratepayers. The RAM is for projects within CA only.
Figure 21 – Renewable Energy Capacity in Operation
10
http://www.cpuc.ca.gov/PUC/energy/Renewables/RPS_Q1Q2_2012_report_to_leg.htm

Figure 22 - Renewable Cap. Amt. by Study Status of Projects in CAISO Queue
Southern California Edison (SCE) Programs SCE has multiple programs implemented that provide their customers with renewable energy options. The SCE website has a table (shown below) listing 13 programs. From that group, three programs appear relevant for the specific circumstances of the WWR opportunity. In the SCE website table shown below, the three are distinguished with the darker background. The three programs present opportunity to provide distributed generation resources that are smaller in terms of the power generated. ACBCI’s Whitewater Ranch is space constrained and limited to smaller sized projects.

Figure 23 – SCE Contract Opportunities

Solar Photovoltaic Request for Offers The Solar Photovoltaic Program (SPVP) is the SCE procurement program adaptation of a California Public Utilities Commission decision. SCE intends to increase the deployment of distributed PV resources and points toward a target of ~250 MWdc. Resource sites must be in the range of 500 kWdc to 10 MWdc; WWR could accommodate a PV facility within this size range. SPVP was set up to procure these resources during the period of 2010 - 2015 via a series of RFO’s. RFO 4 is now open, with the deadline for offer submissions on January 6, 2015. Since this is too close to the deadline for a response, a subsequent RFO under this program or a similar future program would be a good match of solar PV at WWR.
Renewable Auction Mechanism The CPUC set up the Renewable Auction Mechanism (RAM) as a program for large California utilities to obtain competitive renewable distributed generation energy resources via a feed-in tariff program. The program is for renewable projects between 3MW and 20 MW. SCE and others have executed five iterations of the RAM purchases; RAM 5 occurred during May through October, 2014. Since solar and wind (and other renewable resources) are included, this alternative may be used for wind and/or solar installations at WWR.
Renewable Market Adjusting Tariff The Renewable Market Adjusting Tariff (Re-MAT) program is a feed-in tariff program for smaller renewable energy projects: 3MW and less. The renewable resources are segregated into three groups:
1. Baseload – Bioenergy and geothermal
2. As-Available Peaking – Solar
3. As-Available Non-Peaking – Wind and Hydro
SCE has been implementing a program period every two months ( Mar 2014, May 2014, etc.) and seeking 5 MW in each of the three groups listed above during that period. The SCE website shows a remaining program capacity of 116.676 MW after the Nov 14 awards. This program would be suitable for a smaller solar or single wind turbine installation on the WWR site. Since this is a competitive program, the financials may be very critical to verify a competitive price can be consistent with the cost structure that the tribe would require for a viable project.
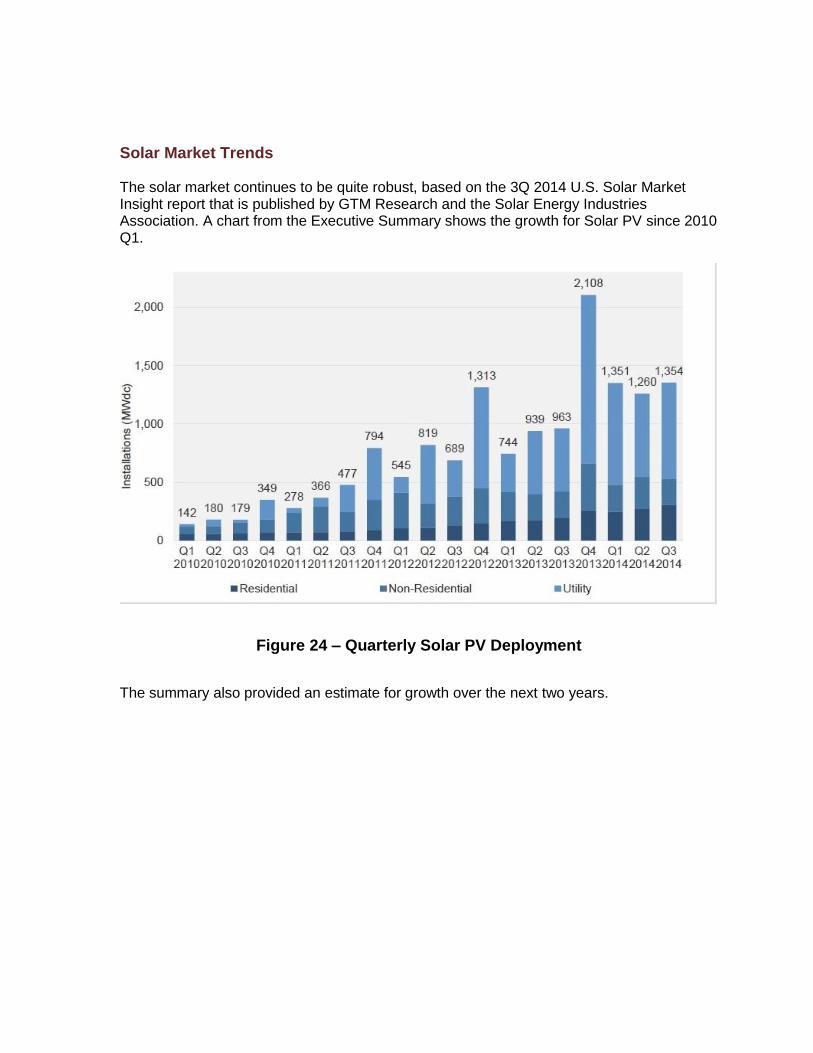
Solar Market Trends The solar market continues to be quite robust, based on the 3Q 2014 U.S. Solar Market Insight report that is published by GTM Research and the Solar Energy Industries Association. A chart from the Executive Summary shows the growth for Solar PV since 2010 Q1.
Figure 24 – Quarterly Solar PV Deployment
The summary also provided an estimate for growth over the next two years.

Figure 25 Expected Solar PV Deployment
The Department of Energy’s Sunshot initiative reports on pricing trends that help support the growth, as shown below. DOE Sunshot – PV System Pricing Trends
Reported system prices of residential and commercial PV systems declined 6%–7%
per year, on average, from 1998–2013, and by 12%–15% from 2012–2013,
depending on system size.
Market analysts expect system prices to continue to fall, but module prices to
stabilize in near-term

Figure 26 – PV Systems Pricing Trends
Beyond 2016, the forecasting becomes more difficult. Federal and state regulations are one factor providing more uncertainty. The following excerpt from the Insight report offers some detail: “As part of the broader electricity sector, the solar energy market is defined by the policies and regulations set by federal and state governments. From the broadest federal tax policy to the state public utility regulations that define access to the market, policy will remain important to solar even after grid parity is reached in different parts of the country. Among the core political/regulatory forces that will shape the future of the market are:
Investment Tax Credit expiration. In a little more than two years, on December 31,
2016, the 30% federal Investment Tax Credit, which has been the bedrock incentive
for the U.S. solar market, is scheduled to drop to 10% for commercial projects and to
zero for directly owned residential projects. Already, developers of utility-scale
projects are facing a cliff in 2017 and being forced to accelerate project timelines in
order meet the deadline for the 30% credit. Extension of the ITC is SEIA’s top
priority, and there is an increasingly loud chorus of voices in the solar industry
pushing for extension.
Net energy metering and utility rate structures. Solar advocates were dealt a blow in
Wisconsin recently, as that state’s Public Service Commission voted to significantly
increase fixed charges on customer bills for Wisconsin’s largest utility. This is a rare
defeat for solar among early NEM- or rate-related debates, and many proceedings
on the issue are still ongoing.
Greenhouse gas regulation and solar market impact. Over the next few years,
individual states will have to develop plans to meet proposed EPA standards for
carbon emissions in the power sector under Section 111(d) of the Clean Air Act.
These compliance plans could present myriad new opportunities for solar toward the
end of this decade, depending on how they are structured, and SEIA, along with
solar companies with a long-term view, is actively engaged in the rulemaking
process.”
While the overall trends are positive, the transition to significant solar will be accomplished in a complex market environment.
Wind Market Trends
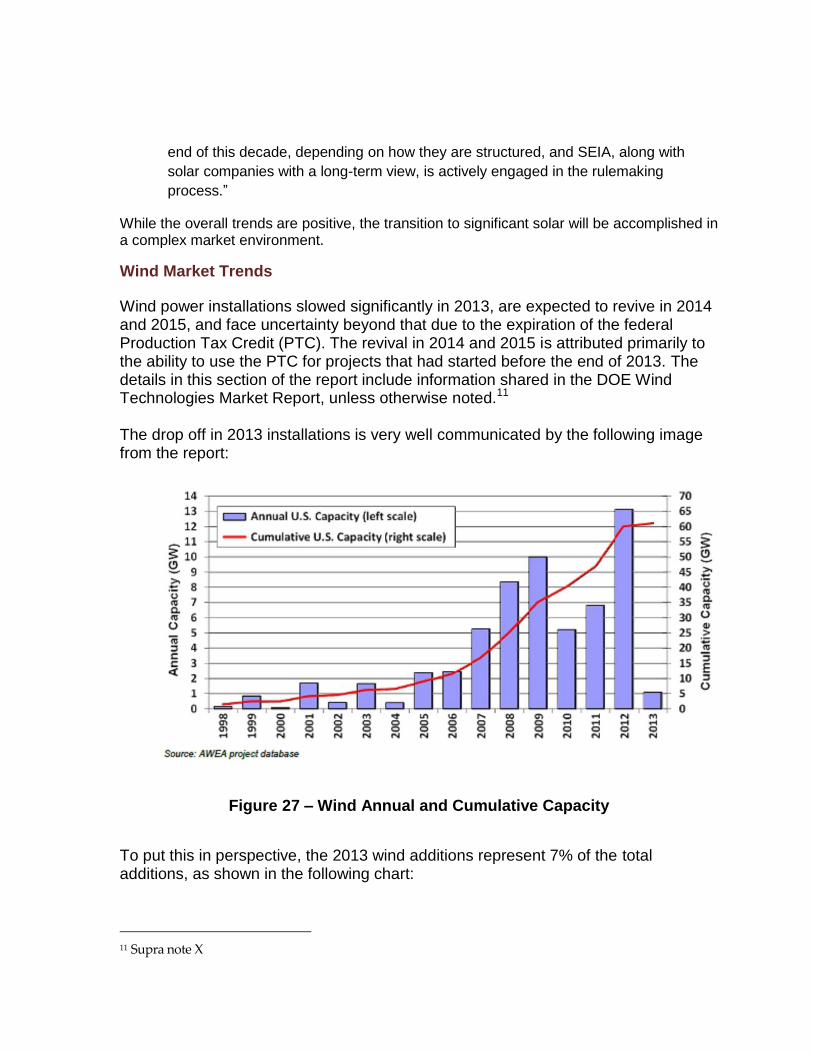
Wind power installations slowed significantly in 2013, are expected to revive in 2014 and 2015, and face uncertainty beyond that due to the expiration of the federal Production Tax Credit (PTC). The revival in 2014 and 2015 is attributed primarily to the ability to use the PTC for projects that had started before the end of 2013. The details in this section of the report include information shared in the DOE Wind Technologies Market Report, unless otherwise noted.11 The drop off in 2013 installations is very well communicated by the following image from the report:
Figure 27 – Wind Annual and Cumulative Capacity
To put this in perspective, the 2013 wind additions represent 7% of the total additions, as shown in the following chart:
11 Supra note X

Figure 28 – Deployments by Resource
California had the largest portion of the installations in 2013, with 269 MW. The following map shows the location of the activity as well as the 2013 and cumulative capacity amounts.

Figure 29 – Map of US Wind Projects
An analysis of the interconnection queues indicates strong potential for additional growth. As a caution, this view may include some projects that may never be erected. In the current market situation, it seems very likely that a high percentage of these projects will be finished. The organizations managing the queues, such as FERC, regional and state agencies, etc., have successfully managed to cull the projects that have a low probability of being completed. While this effort reduced the quantity of total capacity to be constructed, it improved the probability that actual construction would come closer to the amount shown in the interconnection queue. One way of looking at the queues is to include all resources, e.g. wind, solar, natural gas, etc. The data shows wind projects in the queue total 114 GW, which is about 2 times the capacity of currently installed wind capacity. Considering all resources, the wind capacity figure represents about 36% of all capacity, which is larger than any other resource except for natural gas. In comparison, in 2013, the gross wind capacity entering the queue was 21

GW. The related amount for natural gas was 42 GW and the amount for solar was 11 GW. No coal or nuclear projects were added to the queue.
Figure 30 - Nameplate resource cap. in 37 selected interconnection queues
Another view of the wind capacity in the queue is to look at the information by the agency administering the queue. These include independent system operators (ISOs), regional transmission operators (RTOs), and utilities. This look at the data indicates the bulk of that activity is planned for Texas, the Midwest, Southwest Power Pool (SPP), PJM Interconnection, the Northwest, the Mountain region, and California. The wind power projects for these regions in the interconnection queues at the end of 2013 accounted for 95% of the aggregate 114 GW of wind power in the selected queues

Figure 31 - Wind power cap. in 37 selected interconnection queues
Section 6 - Project Economics
Market Activity Often project economics in a report will include a pro forma financial model for renewable projects. This was done in earlier referenced studies that looked at Whitewater Ranch. The energy resources and favorable trends for renewables in California showed viability for such projects. A less quantitative but likely more meaningful statement about project viability has come from 3rd party developers who contacted the tribe during the study period. Each one had identified the Whitewater Ranch property as a site with great potential. The largest of the three is a national developer of wind and solar projects. This company ranks very highly nationally in the number of working and under construction projects, including a nearby wind project. Their interest was in having a combined renewable / energy storage project at the sight. The second company was new and staffed by several very experienced California wind developers. They wanted to build a wind project that would sell power to SCE under the Re - MAT program. The third group has already completed wind development projects in the San Gorgonio Pass area. They were looking to build on the Whitewater Ranch site and sell power to SCE via one of the programs cited earlier in this report. Project economics are never certain until the developers and financers come to agreement on a specific project. Based on the track records of the interested developers, the likelihood for successful project economics at Whitewater Ranch seems quite high.

Section 7 - Project Assessment
Based on the information presented in this report, the probability for a successful renewable project at this location is quite high. The resources, market environment, etc. look strong. Such a project does not take place in a vacuum and several other factors are very important in the assessment.
Qualitative Factors Three factors follow as examples. Very likely, more could be identified.
The primary focus of the tribe: ACBCI has demonstrated substantial expertise over a
very long time as effective participants in the real estate and entertainment markets.
Developing and managing a renewable energy site requires some effectiveness in
areas outside the current expertise. This may point toward working with a third party
developer in a build and operate arrangement.
The Coachella Valley community: ACBCI has a strong history in partnering with other
communities in the valley, working with the group towards the group goals. While
ACBCI has its own sovereignty, the potential impact of a project on the community is
a consideration.
Usually, one option for consumption of the power generated at the site would be
internal ACBCI use. However, the checkerboard pattern of the ACBCI land area is a
serious impediment. Current regulations do not allow the power to be transferred
between non-contiguous areas, eliminating internal use as an option.
Relative importance The tribe has quite often demonstrated excellent focus on the essential objectives for success and marshalled resources accordingly. While WWR has very strong attributes pointing towards a successful project, it may not clear the importance hurdle at this time.
Risks All renewable energy projects have risks. Experienced project developers have managed many of these risks, again pointing towards third parties for risk mitigation.

Section 8 - Conclusions
Several factors point towards a favorable location for a renewable energy project. The ability to pass the business case hurdle is less clear. For example:
Whitewater Ranch is a location that is rich in wind and solar resources, as
demonstrated by the many nearby wind farms and some solar installations.
While the location is currently lacking a very close proximity transmission connection
point, upgrades are underway in the grid that will improve the connectivity options.
The California renewable energy environment is among the best in the world.
The size and location of the site reduce the probability of finding a power buyer.
The development of renewable energy at Whitewater Ranch can be considered as one possibility for the ACBCI project portfolio.