Final Report to RPSEA - National Energy Technology … Library/Research/Oil-Gas/enhanced oil... ·...
102
1 Final Report to RPSEA REDUCTION OF UNCERTAINTY IN SURFACTANT-FLOODING PILOT DESIGN USING MULTIPLE SINGLE WELL TESTS, FINGERPRINTING AND MODELING Project Number: 11123-24 July 14, 2015 Ben Shiau The University of Oklahoma 100 E. Boyd Street Sarkeys Energy Center, 1210 Norman, Oklahoma 73019-1003 [email protected] MIDCON ENERGY III, LLC 2431 E. 61st Street, Suite 850 Tulsa, Oklahoma 74136 (918) 743-7575 Chemical Flooding Technologies, LLC 2431 E. 61st Street, Suite 850 Tulsa, Oklahoma 74136 (918) 743-7575
Transcript of Final Report to RPSEA - National Energy Technology … Library/Research/Oil-Gas/enhanced oil... ·...

1
Final Report to RPSEA
REDUCTION OF UNCERTAINTY IN SURFACTANT-FLOODING PILOT DESIGN
USING MULTIPLE SINGLE WELL TESTS, FINGERPRINTING AND MODELING
Project Number: 11123-24
July 14, 2015
Ben Shiau
The University of Oklahoma
100 E. Boyd Street Sarkeys Energy Center, 1210
Norman, Oklahoma 73019-1003
MIDCON ENERGY III, LLC
2431 E. 61st Street, Suite 850
Tulsa, Oklahoma 74136
(918) 743-7575
Chemical Flooding Technologies, LLC
2431 E. 61st Street, Suite 850
Tulsa, Oklahoma 74136
(918) 743-7575

2
Executive Summary
Reservoirs containing very high total dissolved solids and high hardness make the field design of
a surfactant polymer (SP) flood extremely difficult because surfactant tends to precipitate and
separate under these conditions. Under these harsh conditions, elevated levels of various
divalent ions, Ca2+
, Mg2+
, Fe2+
in the reservoir brine posted significant challenging issue for
designing surfactant formulations for EOR. Over the course of this multiple single-well tests
project, different surfactant formulations were successfully developed and tested for multiple
field sites based on site-specific reservoir conditions. Performance boosting additives, such as
cosurfactants and co-solvents, were also incorporated in the formulations which drastically
minimize viscous macroemulsions, promote rapid coalescence under Winsor Type III conditions,
and stabilize the chemical solution by reducing precipitation and phase separation. Based on the
promising results of batch experiments, the selected surfactant formulations were further
evaluated in one-dimensional sand packs and coreflood tests using representative Berea
sandstone, reservoir oils, and brines at reservoir temperatures. The procedures used in multiple
field single-well tests typically involve injecting 2 to 3 pore volumes of surfactant-only system,
without the help of polymer. Results of field tests show the oil recovery ranging from 45 % to
70% of the residual oil (Sor) after water flooding. The level of surfactant loading is less than 0.5
wt%. Initial single-well test was completed and successfully verified laboratory results in situ in
the presence of high-salinity formation water containing 102,300 mg/L total dissolved solids
(TDS). Based on the promising data of initial field test, the validity of this approach (i.e.,
surfactant-only injection) was further confirmed under even higher salinity (up to 260,000 mg/L)
and various reservoir conditions. One pilot interwell-test at a sandstone reservoir was executed
in later part of 2013 to further evaluate the effectiveness of surfactant formulation and address
technical issues related to scale-up.
The mathematical simulation efforts for this project were executed using multiple approaches to
match data from laboratory experiments and field data. From the field production tracer profiles
and data, the average Sor can be calculated by the retardation of ester over alcohol and given
partitioning coefficient. The approximation of Sor depends on the validity of several
assumptions: 1) Hydrolysis reaction occurs only during shut-in period (no flow), so that tracer B
(Material Balance Tracer) and unreacted tracer A (Partitioning Tracer) are exactly together

3
before back flow begins; 2) Sor is uniform throughout the target formation, and 3) The mixing
associated with flow through the porous medium affects partitioning and material balance tracers
in the same way.
A Single Well Chemical Tracer Test (SWCTT) was used to monitor results of single-well oil
mobilization tests. Due to the complex field test processes and geological uncertainties, popular
reservoir simulator CMG STARS was selected to model the SWCTT because of its good
computational capabilities and chemical reaction features. Permeability, porosity, payzone
thickness and partitioning coefficient were treated as input data. Partitioning coefficient of the
tracer(s) was measured in the lab under reservoir temperature and formation water salinity. The
number of layers, Sor, dispersivity coefficient, flow fraction in each layer, and reaction rate were
used as the matching parameters. Results of three representative SWCTT tests were numerically
interpreted. In dealing with the tracer material balance from field test results, the concentrations
of the selected partition tracer (ethyl formate), conservative tracers (methanol and n-propanol)
were kept constant and the flow rates of primary tracer and pusher injection were adjusted by
multiplying the percentage of recovery to streamline the prediction procedures.
In this endeavor, we also developed and completed a geochemical study of crude oil-composition
analyses, including 1) crude SARA fraction analysis, 2) oil fingerprints analysis. In addition, we
also completed a petrophysical study of reservoir sandstones using tool such as the Nuclear
Magnetic Resonance spectroscopy (NMR) method to investigate Berea sandstone.
Our results show that surfactant-only chemical EOR (cEOR) is a promising technology for
existing waterfloods and would provide a competitive alternative to horizontal drilling and
hydraulic fracturing. We have also accumulated convincing evidence that good performance in
sand packs is predictive of performance in core floods and in single-well tests for surfactant-only
cEOR. Our economic analysis of the surfactant-only flooding leads to the conclusion that it has
great economic viability than surfactant-polymer flooding or alkaline surfactant-polymer
flooding, and that the only remaining technological barrier is reduction of surfactant adsorption.
We believe this issue is best addressed with sacrificial agents and/or the use of surfactant
carriers.

4
Table of Contents
Executive Summary………………………………………………………………………… 2
Project Fact Sheet………………………………………………………………………….. 5
Chapter 1. Designing of Multiple Trace & Chemical Flooding Tests………………….. 9
1.1 Introduction…………………………………………………………………….. 9
1.2. Single-well Test at H Site ……………………………………………………. 15
1.3. Reservoir W Case Study……………………………………………………… 29
1.4. Single Well Tracer Test at R site…………………………………………….. 39
1.5. Mini-Single Well Tracer Test at AB Site…………………………………… 47
1.6. Pilot Interwell Chemical Flood Test at SK Site……………………………… 57
Chapter 2. Developing Crude Oil Fingerprinting Tool for Reducing Uncertainty of Field
Chemical EOR ………………………………………………………………………………. 64
2.1 Geochemical study of crude oil-composition analysis…………………………. 64
2.2. Petrophysical study of reservoir sandstones…………………………………… 70
Chapter 3. Numerical Simulation Efforts…………………………………………………… 75
3.1. Numerical Interpretation of Single Well Chemical Tracer Test (SWCTT)… . 75
3.2. Interwell tracer test (IWTT) at SK Site……………………………………….. 77
3.3. Simulation of Column Test…………………………………………………….. 78
Chapter 4. Conclusions & Recommendations…………………………………………… 96
References…………………………………………………………………………………. 100

5
Project Fact Sheet
Project Name : Reduction of Uncertainty in Surfactant-Flooding Pilot Design using Multiple
Single Well Tests, Fingerprinting, and Modeling
Program Name: 2011 Small Producer Program
Project Number: 11123-24
Start Date: 1/15/2013
End Date: 1/15/2015
RPSEA Share: $1,036,205
Cost Share: $264,886
Prime Contractor: The University of Oklahoma, Norman, Oklahoma
Participants: Midcon Energy III, LLC, Tulsa, Oklahoma
Chemical Flooding Technologies, LLC, Tulsa, Oklahoma
Contacts:
OU – Ben Shiau ([email protected] or 405-325-6817)
NETL – John Terneus ([email protected] or 304-285-4254)
RPSEA
www.rpsea.org
281-313-9555
NETL
www.netl.doe.gov
Objectives: The aim of the project is to use single well test as a design tool to streamline site-
specific field data collection tasks to reduce markedly the uncertainty of surfactant flooding pilot
design.
Approach: By conducting multiple single-well Surfactant-Polymer (SP) flooding tests, crude oil
fingerprinting, and modeling of the single well tests, we can reduce the uncertainty in the SP
pilot. The project also targets SP formulations for high TDS brines to reduce the need for surface
facilities associated with water treatment. The extent of oil mobilization during the single well
tests will be verified by comparing pre- and post partitioning tracer tests. Multi-scale models of
the SP single well tests will be used to refine the pilot-scale simulation.
Accomplishments:
1. Several potential binary and ternary surfactant-only formulations are successfully developed
for high salinity formations in this study based on batch and sand pack column experiments,
2. For tight formations, injection of polymer created some technical challenges to achieve high
oil recovery (< 40% oil recovered in the column), thus we successfully removed polymer (s)
from the surfactant formulations and were still able to obtain high recovery,
3. The newly developed surfactant-only system and formulations (between 0.5 to 0.75 total wt%)
were tested in multiple single-well locations and an interwell pilot test to verify their

6
performance,
4. Pre- and post-chemical flood tracer tests were used to assess the residual saturation and the
performance of oil recovery by surfactant injection,
5. We developed numerical simulation approaches and completed the effort in numerical
interpretation for multiple sites and tracer tests,
a. Single Well Chemical Tracer Test (SWCTT) – 5 sites,
b. Interwell tracer test (IWTT) – 1 site,
c. Simulation of laboratory sand pack tests and core flood experiments – a variety to
mimic a range of reservoir conditions
6. Developed and completed geochemical study of crude oil-composition analyses, including
a. crude SARA fraction analysis,
b. fingerprints analysis,
7. Completed petrophysical study of reservoir sandstones using tools such asNuclear Magnetic
Resonance spectroscopy (NMR) to investigate Berea sandstone.
8. On the technology transfer, we have made multiple RPSEA workshop presentations (e.g., KS,
TX, CA, IN). In additional, we presented technical papers at national conferences (ACS, SPE).
We also published several paper abstracts to national conferences (AOCS, AIChE). We are also
currently completing multiple papers for the refereed literature and one patent disclosure. The
accomplished of the documentation effort is summarized below,
1. Budhathoki, M., Hsu,T.P., Lohateeraparp, P., Roberts, B.L., Shiau, B.J., and Jeffrey
H. Harwell, J.H., “
Designing of Optimal Middle Phase Microemulsion for Ultra High
Saline Brine using Hydrophilic Lipophilic Deviation (HLD) Concept, Colloids and
Surfaces A: Physicochemical and Engineering Aspects, in submission (2015).
2. Harwell, J.H., Hsu, T.P., Roberts, B.L., Shiau, B.J., Budhathoki, M., Lohateeraparp,
“Binary and Ternary Surfactant Blends for Enhanced Oil Recovery in Reservoir Brines
with Extremely High Total Dissolved Solids, U.S. Patent Application No. 14/546,972
(2014).
3. Hsu, T.P., Lohateeraparp, P., Roberts, B.L., Wan, W., Lin, Z., Wang, X., Budhathoki,
M., Shiau, B. J., and Harwell, J. H. “Improved Oil Recovery by Chemical Flood from
High Salinity Reservoirs-Single-Well Surfactant Injection Test” Paper SPE 154383,
presented at the EOR Conference at Oil and Gas West Asia, Muscat, Oman, 16-18 April,
2012.
4. Jin, L.C., Jamili, A., Li, Z.T., Lu, J., Luo, H.S., Shiau, B.J., Delshad, M., Harwell, J.H.,
“Physics based HLD-NAC Phase Behavior Model for Surfactant/Crude Oil/Brine
Systems,” Journal of Petroleum Science and Engineering, in submission (2015).
5. Shiau, B.J., Hsu, T.P., Lohateeraparp, P., Wan, W., Lin, Z.X., Roberts, B.L., Harwell,
7
J.H., 2012. “Improved Oil Recovery by Chemical Flood from High Salinity Reservoirs,
”SPE 154260, presented at the SPE Improved Oil Recovery Symposium, Tulsa,
Oklahoma, 14–18 April.
6. Wan, W., Harwell, J.H., Shiau, B.J., “Characterization of Crude Oil Equivalent Alkane
Carbon Number (EACN) for Surfactant Flooding Design,” Journal of Dispersion Science
and Technology, (2014).
7.Weston, J.W., Harwell, J.H., Shiau, B.J., Kabir, M.,” Disrupting Admicelle Formation
and Preventing Surfactant, Adsorption on Metal Oxide Surfaces Using Sacrificial
Polyelectrolytes dx.doi.org/10.1021/la501074x | Langmuir 2014, 30, 6384−6388
Significant Findings:
1. Applying theoretical tools like the Hydrophilic-Lipophilic Difference (HLD) equation
and concept can significantly reduce surfactant screening time when compared to the
conventional method.
2. The developed binary and ternary surfactant-only system can markedly improve recovery
of common crude and viscous oil (e.g., 23 cp @ 50 0C) as confirmed in laboratory sand-
packed and core flood experiments.
3. Results of multiple field single-well tests indicate significant trapped oil (> 90%
reduction of Sor) can be mobilized from the target zone at various reservoir conditions
and even tight formation (i.e, permeability of 15 mD).
4. Field pilot multi-wells test (Sept. 2013 – Sept., 2014) indicated that significant surfactant
losses (likely due to adsorption) might interfere the field data interpretation and recovery
performance.
5. In simulation efforts, due to the complex field test processes and geological uncertainties,
numerical simulation method was used to interpret the field test results. Popular reservoir
simulator CMG STARS was selected to model the SWCTT because of its good
computational capabilities and chemical reaction features
6. Based on the resulting matching profiles of pre-SWCTT and post-SWCTT Sor at
multiple reservoirs and locations, we successfully exhibited good surfactant flooding
efficiency under various reservoir locations.
7. Based on fingering effort, we observed that crude oil fractions could have impact on the
interfacial tensions (IFTs), which is the most critical parameter of EOR.
8. Asphaltenes from different crude oils contain various components, which indicate these
crudes may come from different original materials and reservoir conditions.
Future work:
1. Field pilot multi-wells test: additional sites would be selected and screened for
potential surfactant flooding. And more pilot tests are anticipated in next twelve to
twenty four months (2016-17) based on the encouraging results of multiple single-well

8
tests and some challenging tasks we met and lessons learned from the first field pilot
interwell test. 2. Streamline the design protocols for field scale pilot test based on the conclusions of this
RPSEA effort.
3. Development of a single-well surfactant adsorption test. At this point the most
important barrier to commercial development of surfactant-only cEOR is the loss of surfactant through adsorption. It is important that a method be developed for verifying
the level of surfactant adsorption in the old waterfloods that are the target of this
technology.

9
Chapter 1. Designing Multiple Tracer and Chemical Flooding Tests
1.1 Introduction
Many mature reservoirs with potential for chemical EOR application have high salinities that
are problematic and challenging for process design. Because of this challenging characteristic,
the alkaline surfactant polymer flood (ASP) becomes economically impossible and technically
difficult due to the high cost of water treatment, sludge disposal and the potential scale problem
in the formation (Zaitoun et al., 2003). A surfactant polymer flood (SP) would be an option for
those reservoirs with very high total dissolved solids (TDS) and hardness in the reservoir brine.
However, one of the greatest difficulties in the application of surfactant formulations has been
their ineffectiveness in the formation brines having high salinity and divalent ions (Novosad et
al., 1982). Injected surfactant must remain chemically stable without exhibiting precipitation and
phase separation at reservoir conditions for the duration of the project, which could last for years.
If not, the surfactant could be distributed in a non-consistent and unpredictable manner in the
reservoir (Puerto et al., 2010). Removing high concentrations of ions by displacement with softer
brines is typically not viable due to complicated ion exchange phenomena between reservoir
rock and injected fluids, or else unfeasible due to a requirement of fresh water sources. Thus, to
overcome the unfavorable high salinity characteristic, it is desired to design a surfactant system
which forms a homogeneous, single-phase aqueous solution with formation brines, develops
ultralow interfacial tensions (IFTs) with crude oil at reservoir conditions, and has low adsorption
on reservoir rocks. Additionally, at high salinities conventional polymers are not effective at
increasing viscosity until the polymer concentration reaches economically nonviable levels.
These issues favor a consideration of surfactant-only chemical flooding for high salinity and low
permeability reservoirs.
It is well known that surfactants with alkoxy chains can provide high salinity and hardness

10
tolerance. Sulfates and sulfonates having ethylene oxide (EO) and/or propylene oxide (PO)
groups have been used in laboratory and pilot tests of surfactant EOR process (Chou and Bae,
1988; Flaaten, 2007; Liu et al., 2008; Levitt et al., 2009; Iglauer et al., 2010; Puerto et al., 2010).
Increasing the number of EO groups on the surfactant molecule increases the optimum salinity
and tolerance for Ca2+
and Mg2+
; PO groups increase the size and area of the surfactant without
making it too hydrophilic, which enables lower IFT over a wider range of conditions. However,
sulfates are limited to low temperature reservoirs because the hydrolysis of the sulfur-to-oxygen
bond takes place above about 60 ºC (Talley, 1988). Even though hydrolysis of sulfates can be
minimized by adding alcohol to the structure of alkoxy sulfate surfactants during the
manufacture (Pope et al., 2010), laboratory screening should be conducted for using sulfates
above 60 ºC with great carefulness to achieve the required surfactant stability during the entire
EOR process. In contrast, sulfonates with alkoxy groups have the required stability at high
temperatures because of their sulfur-to carbon bond, which is not subject to hydrolysis. Other
sulfonate surfactants without alkoxy groups, such as sulfosuccinic acid ester, are good candidates
for creating ultralow IFT with oil and have also been studied and used in enhanced oil recovery
and surfactant-enhanced aquifer remediation (SEAR) (Dwarakanath and Pope, 2000; Wu et al.,
2002; Rosen et al., 2005; Levitt, 2006; Iglauer et al., 2010; Shiau et al., 2010a., Shiau et al.,
2010b).
One of the main criteria for achieving high oil recovery is ultralow IFT between oil and
brine. Research has shown that when IFT reached 10-2
mN/m and below, residual oil could be
mobilized through the injection of surfactant solution (Pithapurwala et al., 1986; Zaitoun et al.,
2003; Flaaten, 2007; Levitt et al., 2009; Iglauer et al., 2010; Shiau et al., 2010a). Most coreflood
studies indicated that a small slug of surfactant-polymer flood (< 1 PV, surfactant conc. = 0.5-2

11
%) followed by a polymer drive slug injection could recover 65-97% residual oil saturation (22-
47% OOIP). There is a close connection between microemulsion formation and the effectiveness
of surfactants in EOR (Shah and Schechter, 1977). The relationship between microemulsion
phase behavior and IFT has been well-established, and the ultralow IFT can be achieved by
creating middle phase microemulsion (Winsor, 1954; Healy et al., 1976; Huh, 1979; Nelson and
Pope, 1978; Pope et al., 1979). The middle phase, which contains equal volumes of water and
oil, is observed over a narrow salinity range and can be characterized by an optimal salinity. The
maximum oil recovery is expected at the optimal salinity (Healy and Reed, 1974; Healy et al.,
1976; Norohna and Shah, 1982). Surfactants with long carbon chain and little branching can
form microemulsion and produce lower IFT by closely packing their hydrocarbon tails together.
The volume of middle phase microemulsion increases when microemulsion stability rises, which
is correlated with a very low oil/microemulsion and microemulsion/water IFT (Bourrel and
Schechter, 1988). Highly viscous phases will not easily transport and will perform poorly due to
the low pressure gradient in the reservoir which is about 1 psi/ft or less (Levitt et al., 2009). It
has been found that a branched hydrocarbon chain is able to decrease the order in the micellar
structures, which tends to reduce the microemulsion viscosity, decrease the equilibrium time, and
minimize undesirable gel and liquid crystal formations (Levitt et al., 2006). In addition, a more
extreme branching with two separate carbon tails stemming from the polar head group has also
shown very good performance (Rosen et al., 2005; Levitt, 2006).
Another approach to mitigate the high viscosity problem is adding co-solvents (i.e. alcohols)
to surfactant solution. Alcohols, small molecular weight compounds (C4 range), increase the
effective surfactant molecular volume at the interface by means of partitioning between the
surfactant hydrocarbon groups (Chou and Bae, 1988), to reduce the viscosity of the oil/water

12
microemulsion (Sanz and Pope, 1995; Levitt et al., 2009). Alcohols, such as pentyl, butyl and
propyl alcohols, which have a partition coefficient between the oil and water of nearly one have
been used the most in the past few decades. Another advantage of adding alcohols is to increase
the surfactant solubility in high salinity brines (Benton and Miller, 1983; Carmona et al., 1985).
Carmona et al. (1985) indicated that, at lower temperatures, addition of an alcohol was necessary
to prevent sulfonate from precipitating or forming liquid crystals. However, the use of alcohols
has been shown to increase the IFT and reduce the oil recovery (Pithapurwala et al., 1986;
Smith, 1986). Thus, there are disadvantages and advantages to use co-solvent but the advantages
outweigh the disadvantages.
This endeavor describes the development of new surfactant formulations that provide high
solubility in high salinities and ultra-low interfacial tensions at low concentrations. The
laboratory screening and evaluation of the surfactant, including phase behavior studies,
interfacial tensions properties, the surfactant system stability, and the performance of one-
dimensional column floods will be briefly discussed. To design a practical EOR surfactant
formulation, this research specifically addresses reservoirs with formation brine that has very
high total dissolved solids and high hardness, frequently with low permeabilities, and hopes to
contribute to future commercial pilot- to full-scale projects in these types of reservoirs. These
types of reservoirs have very high residual oil saturations, often greater than 80% of the OOIP.
The surfactants studied in this research were obtained from different sources. Table 1 describes
the names, origin of the compounds and chemical structures. The primary surfactant used in this
experiment was dioctyl sulfosuccinates, or diethylhexyl sulfosuccinates which contains two
branched hydrophobic groups in the molecule). Some of other primary surfactants included:
Alkyl propoxylate sulfate (C16-17 - 7PO - SO4-), (C+20) linear alkyl benzene sulfonate and alkyl

13
alcohol (C12-C13 100% branched alcohol) propoxylate (with 8 moles of propylene oxide (PO))
sulfate. Co-surfactants used were alkyl ethoxylated alcohol sulfate (sodium laureth sulfate 3 EO),
dialkyl (branched C12) sodium diphenyl oxide disulfonate, dialkyl (linear C16) sodium diphenyl
oxide disulfonate. Several different short chain alcohols ranging from C3 to C5 were studied for
phase behavior experiments which included iso-propyl alcohol (IPA, 70% vol.), sec-butanol
(SBA, 99%), diethylene glycol butyl ether (DGBE, 100%) and tert-butanol (TBA, > 99 %).
Xanthan gum polymer was used in stability tests, column test and corefloods, but not in the
microemulsion phase behavior test. Pure decane (Sigma-Aldrich) was used as representative oil
in this study to characterize microemulsion phase behavior and to develop potential surfactant
formulations for crude oil. This invention also involved two different crude oils retrieved from
the targeted oil fields (reservoir F and reservoir M) managed by Mid-Con Energy (Oklahoma).
The viscosities of the crude oil at reservoir temperatures were 7 cp for crude oil F (38゚C) and 5
cp for crude oil M (46゚C). Surfactant solutions were prepared with both synthetic and reservoir
brines. The formation brine from reservoir F (brine F) consists of 46,783 mg/L Na+, and 4,400
mg/L Ca2+
and 24 mg/L iron, and the total dissolved substance (TDS) is 131,283 mg/L. The site
brine from reservoir M (brine M) contains 46,000 mg/L Na+, 12,000 mg/L Ca
2+, 2050 mg/L
Mg2+
and 150 mg/L iron, and the total dissolved substance (TDS) is 185,000 mg/L.
Part of this RPSEA research efforts from laboratory experiments to field tests involves three
aspects of reduction of uncertainty in designing field pilot surfactant-flooding for reservoirs
containing very high total dissolved solids and high hardness:
1. Multiple single-well tests targeting high TDS formations (> 10 wt % or 100,000 mg/L):

14
When reservoir TDS levels reach 100,000 mg/L or higher most currently available surfactant
candidates will fall out of the solution because of their solubility limit. Our research in the last
few years has focused on developing surfactant formulations that can tolerate up to 300,000
mg/L TDS at low concentrations without the use of cosolvents. We have produced three to five
new surfactant formulations suitable for use in high TDS oil fields and verified their
performance through several single-well tests conducted in 2011 (Hsu et al., 2012; Shiau et al.,
2012).
The advantages of using a single-well test as a design tool include verifying recovery
performance of surfactant formulation under actual field conditions, ease of operation,
reasonable cost and shorter time-frame for assessment (typically between two- to three-week
operations per test). Uncertainty analyses can be conducted for the system design based on
multiple single-well data to optimize the performance of a chemical flood. Further economic
analyses will also aid in optimization of various parameters (e.g., slug size, and duration) for
maximizing the economic return.
2. Advancing surfactant technology and reservoir geochemistry tools for streamlining the
design protocols for new surfactant system and selection of potential EOR sites: We will extend
recent models relating surfactant structure to optimization of microemulsion formulation
through the relationship between the theoretically accessible packing factor (Pf) calculation and
the experimentally measurable so-called characteristic curvature (Cc) of the surfactant in the
surfactant membrane in a microemulsion. In recent years, we have accomplished this by
extending the range of surfactants for which the Cc has been measured to high TDS surfactants
applicable for harsh reservoir conditions. In this study, we plan to modify the current Pf
calculation procedure to better account for multiple and branched hydrophobes, which we

15
believe will improve the correlation between the calculated Pf and the measured Cc.
3. Modeling endeavors to account for the site heterogeneity, size of chemical slug, and well
placement limitations for chemical EOR design in mature fields: All EOR systems suffer from
uncertainties due to the complexity and nature of subsurface geology/hydrogeology. To
overcome the potential negative impacts of subsurface heterogeneity a step-up approach will be
used in the decision-making protocols. This includes at least discrete steps from bench-scale
experiments, core flood, multiple single well tests, pilot field tests, and data evaluation. Our aim
is to fill in the gap between the single well tests and the pilot test. The extent of oil mobilization
during the single well tests will be verified by comparing pre- and post partitioning tracer tests
using reservoir simulation tools. Multi-scale models of the SP single well tests will be used to
refine the pilot-scale simulation.
1.2. Single-well Test at H Site
1.2.1. Materials & Methods
There were five chosen single-well and inter-well test sites investigated in this effort. The
geologies may vary slightly on their permeability at different locations, mainly are sandstones
are located in Oklahoma and Texas. The first site described is at southwestern of Oklahoma near
Carter County. The perforated zone of this sandstone formation is between 5994' - 6006'.
Additional site characteristics at the single-well location are listed below,
Permeability Average: 15 mD
Porosity: 15% - 19%
Radius of Investigation: 12-15 ft
Pay Thickness: 9 ft
Temperature of Perf Zone: 123°F
Injection Rate (bbl per day, BPD): 120 (estimated)
Production Rate (BPD): 116
1.2.2. Brine and Oil properties of target site (H site)
16
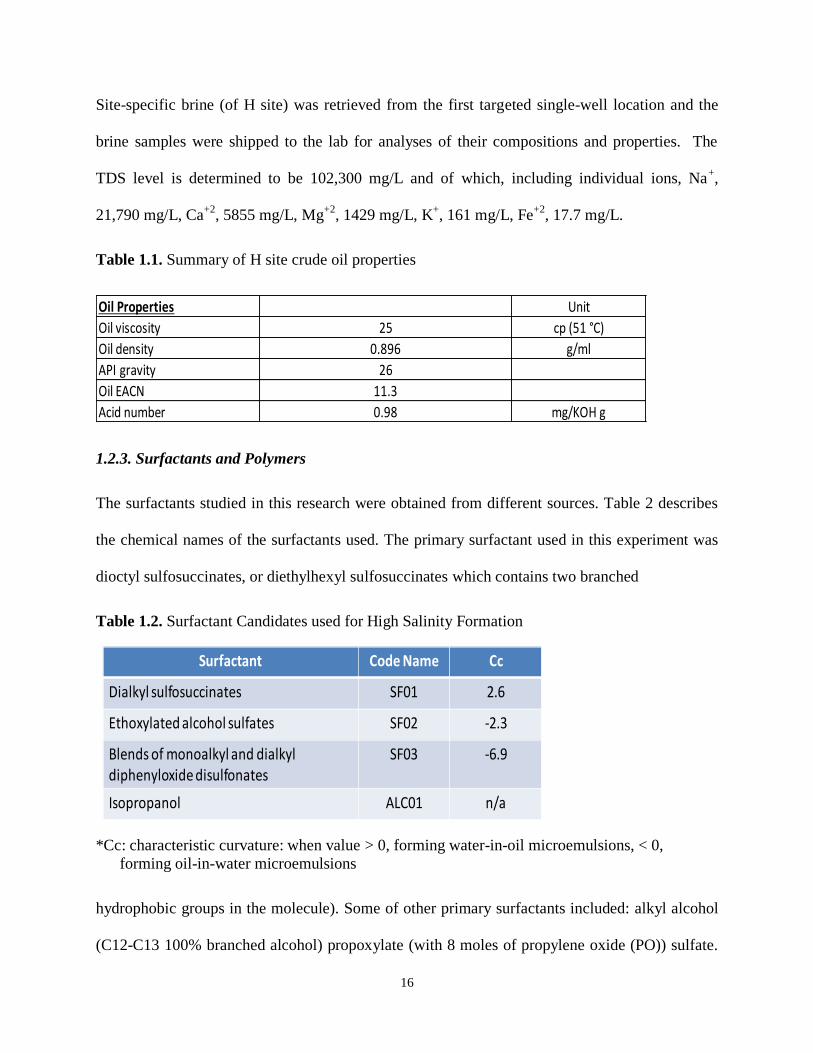
Site-specific brine (of H site) was retrieved from the first targeted single-well location and the
brine samples were shipped to the lab for analyses of their compositions and properties. The
TDS level is determined to be 102,300 mg/L and of which, including individual ions, Na+,
21,790 mg/L, Ca+2
, 5855 mg/L, Mg+2
, 1429 mg/L, K+, 161 mg/L, Fe
+2, 17.7 mg/L.
Table 1.1. Summary of H site crude oil properties
1.2.3. Surfactants and Polymers
The surfactants studied in this research were obtained from different sources. Table 2 describes
the chemical names of the surfactants used. The primary surfactant used in this experiment was
dioctyl sulfosuccinates, or diethylhexyl sulfosuccinates which contains two branched
Table 1.2. Surfactant Candidates used for High Salinity Formation
*Cc: characteristic curvature: when value > 0, forming water-in-oil microemulsions, < 0,
forming oil-in-water microemulsions
hydrophobic groups in the molecule). Some of other primary surfactants included: alkyl alcohol
(C12-C13 100% branched alcohol) propoxylate (with 8 moles of propylene oxide (PO)) sulfate.
Oil Properties Unit
Oil viscosity 25 cp (51 °C)
Oil density 0.896 g/ml
API gravity 26
Oil EACN 11.3
Acid number 0.98 mg/KOH g
Surfactant Code Name Cc
Dialkyl sulfosuccinates SF01 2.6
Ethoxylated alcohol sulfates SF02 -2.3
Blends of monoalkyl and dialkyldiphenyloxide disulfonates
SF03 -6.9
Isopropanol ALC01 n/a

17
Co-surfactants used were alkyl ethoxylated alcohol sulfate (sodium laureth sulfate 3 EO), dialkyl
(branched C12) sodium diphenyl oxide disulfonate (Calfax DB-45), dialkyl (linear C16) sodium
diphenyl oxide disulfonate. Several different short chain alcohols ranging from C3 to C5 were
studied for phase behavior experiments which included iso-propyl alcohol (IPA, 70% vol.), sec-
butanol (SBA, 99%), diethylene glycol butyl ether (DGBE, 100%) and tert-butanol (TBA, > 99
%). Two polysaccharide, biopolymers, were selected for a possible surfactant/polymer flood in
this effort to minimize the negative impact of high TDS on viscosity reduction and their mobility
control performance. The polymers used in this study include Xanthan gum and Scleroglucan.
The biopolymers were used in stability tests, column test and corefloods, but not in the
microemulsion phase behavior test. Pure decane (Sigma-Aldrich) was used as representative oil
in this study to characterize microemulsion phase behavior and to develop potential surfactant
formulations for crude oil.
1.2.4. Phase behavior Studies
Dioctyl sulfosuccinates (SF01) and alkyl (C12-C13) branched alcohol propoxylate (8 PO)
sulfate (SF05) were first selected to be the primary surfactants in the experiment due to their
branched hydrophobe structures. It has been shown that SF01 and SF05 are able to create
microemulsion with different hydrocarbon liquids and achieve low IFT with proper cosurfactants
addition (Wu et al., 2002; Shiau, 2005; 2006; Hsu, 2006). A 1:1 water/oil ratio was used for the
microemulsion test. Prior to crude oil studies, phase behavior studies using decane were
conducted with surfactant systems in both synthetic and site brines. With the targeted salinity,
the optimal surfactant formulation was obtained by varying the surfactant/cosurfactant ratio in a
binary surfactant mixture. The occurrence of middle phase microemulsion was verified by visual
observation. Crude oil phase behavior samples were incubated at reservoirs temperatures. Once

18
the equilibrated condition was achieved, IFT measurement was conducted for the samples. The
co-solvent was also added to the binary surfactant system to promote microemulsion formation if
necessary. The optimal surfactant formulations from decane studies then were further tested with
crude oils. Surfactant/cosurfactant or surfactant/cosurfactant/cosolvent formulations were
evaluated using the following typically qualitative criteria:
Solution stability: aqueous stability of surfactant and surfactant/polymer solutions at
reservoir conditions (salinity and temperature) without precipitation and/or phase
separation
Low interfacial tension: IFT is 10-2
mN/m or below.
Coalescence rate: how fast the emulsion brakes after mixing and form a microemulsion in
equilibrium with oil and/or brine.
Undesired phase: ideal microemulsion with low viscosity and, the absence of gelation
and liquid crystal formation.
Table 1.3. Surfactants Formulations for H Site Based on Crude oil/Brine Phase Behavior
Studies
1.2.5. Precipitation and phase separation studies
Various concentrations of surfactant were prepared with either the stimulated or site brine and
aged at reservoir temperatures for a minimum of a month and then observed for the appearance
of the samples. The presence of precipitate was determined visually based on the fact that
surfactant crystals can reflect light. The occurrence of phase separation was also assessed by
Surfactant Formulation Ultralow IFT*
Binary system Yes
Ternary system #1 Yes
Ternary system #2 Yes
Viscoelastic surfactant (VSurf) No
*IFT < 10-2 mN/m
Surfactants
SF01/SF02
SF01/SF04/SF02
SF05/SF02/SF03
SF02 and SF02/VSF02
19
visual observation. Phase separation is confirmed to have taken place when two layers form in
the solution (Shiau et al., 1995).
1.2.6. Interfacial tension measurements
The interfacial tension between crude oils and surfactant solutions were measured at reservoir
temperatures (51゚C for H site) using a Grace M6500 spinning drop tensiometer. IFT
measurement for decane samples were done at room temperature.
1.2.7. Column tests
Column tests were used to simulate one-dimensional reservoir flow. Figure 1 shows the
apparatus for column test in this study. Valuable information can be obtained from column
studies including: mobilization enhancement under flow-through conditions, potential pressure
drop in the reservoir and unanticipated reactions with reservoir rock. We first crushed the Berea
sandstone core and dry packed the column. The porosity of crushed sand was estimated using a
50-mL volumetric cylinder and volume displacement by water based on weight measurement. A
vertically oriented jacked Kontes chromatography column (2.5- cm diameter and 15-cm length)
was used in this study. A flow-adaptor was also used to adjust the length of the sand pack inside
the column. The fluids were delivered through the column from bottom to top. The column was
first saturated with formation brine and then a pre-determined oil amount was injected into the
column. Continuous brine solution was injected until achieving residual oil saturation (e.g.,
between 20 to 40% oil saturation). Column effluent samples were collected by a universal
fraction collector (LKB Bromma). The temperature of the jacked column was controlled by
circulating water from a water bath.
Table 1.4. Initial Results of Total Oil Recovery from Sand-pack Column Studies

20
*VSurf: viscoelastic surfactant formulation
1.2.8. Core flood test
The objective of the core flood experiment was to evaluate how effectively a surfactant
formulation can recover oil under reservoir conditions. Figure 2 shows equipment setups for core
flooding experiment. Mineral oil acted as the displacing fluid, and was driven by a pump to
displace the fluids of interest through the core. The one-inch core sample was kept in a
convection oven at constant reservoir temperature. Fluid eluting the core was collected into the
burette. Berea sandstone with targeted permeability was used for the core flood. The dimension
of the core was 1.225-inch long and 1-inch in diameter with a permeability of 20 millidarcy to
mimic the targeted site condition. After saturating the core, brine was pump through until the
pressure drop was constant. The core was then flooded with 6-PV of oil and subsequently
flooded with brine (approximately 6-10 PVs) again to achieve residual oil saturation (about
36%). Then the selected surfactant/polymer and polymer slugs were injected at flow rate of 0.05
mL/min.
1.2.9. Field Tracer Tests at H Site (Pre- and Post-Chemical flood test)
One of the aims for this study is to assess the performance of oil recovery by injecting the
developed high salinity surfactant formulations. The partitioning tracer selected is ethyl format
based on the reservoir temperature (51 °C) and laboratory treatability study results. Injection of
EF and monitoring its breakthrough in the produced fluid allow us to quantify the estimated
residual saturation (Sor) at the target zone. The concentrations and volumes injected for the
Column test # Injected chemical Injected slug size Residual oil recovery
1 Ternary#2/2000 ppm XG polymer 0.5 PV 24%
2 2000 ppm XG polymer 0.5 PV Plugging
3 Ternary#2/5500 ppm HEC-25 polymer 0.5 PV 23%
4 5500 ppm HEC-25 polymer 0.5 PV 13%
5 1.5% viscoelastic surfactant (Vsurf) 1 PV 0%
6 Pre 1.5% VSurf+ Ternary #2 + Post 1.5% Vsurf 0.1 PV+1.5 PV+0.5 PV 40%

21
partitioning and conservative tracers are listed in Table 5.
1.2.10. Field Preparation and Testing Procedure
In this study, the chemical tracer injection and chemical flooding were conducted at multiple
targeted sites. Though, each individual site (well) has their unique geological and
hydrogeological conditions, the general field preparation tasks and testing procedures are briefly
discussed below.
Our team would first select the possible well (mostly a producer well) at the targeted site based
on their production history and most favorable conditions for the single well test. Once the test
well location was decided, the site-specific crude oil and brine samples were collected from the
test well and shipped to the laboratory at University of Oklahoma for the surfactant screening
tests and determining the partitioning coefficient of the tracer.
Based on the reservoir temperature and the production rate at the test well, we would design the
radius of investigation at 10’ to 15’ for the partitioning tracer and 15’ to 20’ for the
conservative tracer(s).
Prior to the test being conducted, a packer was set one joint above the perforated zone. The
packer is intended to isolate the flow of the injected fluids into the perforated interval and
prevent entry of injection fluids into the annulus. During the week of the SWTT, we would
shut‐in the near-by wells to eliminate potential reservoir influences.
Our team would set up a portable field test unit at the field (see Figure 1.6). The field activities
schedule was drafted. In general, one to three 500 bbl frac tanks were placed on‐site for brine
storage and for reuse and re-injection. The rod pump of the test well was unseated first in
preparation for the pre‐flush to temporarily water out the test zone. The pre-determined volume
of brine (between 300 to 700 bbls) was injected during the pre‐flush at site-specific average
22
injection rate on vacuum (between 0.75 to 2 X average production rate). The injected brine was
filtered with 1 micron size filter cartridges to prevent plugging of the formation. Injection rate
and volumes were recorded during this procedure.
Prior to chemical tracer injection, the rod pump was temporarily reseated and produced back
for four to eight hours while recovering the fluid. This crucial step would clean the
perforations and helps ensure a good tracer push into the formation. The produced fluids
during this period went into one of the frac tanks on-site. The pump was then unseated
for chemical tracer injection and additional fresh water was delivered to the site to provide the
required fluids for tracer injection. Once ready, chemical tracer injection was initiated. Initially
the injected brine that contained the reactive tracer (EtF), the cover tracer (NPA), and the mass
balance tracer (MeOH) was injected. After main tracer slug injection, this was followed by the
push slug of brine containing mass balance tracer-only (MeOH). For proper tracer test and
chemical flood, the key is to maintain a constant injection rate during these tests (on vacuum).
During injection, the tracer solution was sampled and analyzed for tracer concentration by
field gas chromatography (GC) (see Figure 1.6).
The well was then shut‐in for a pre-determined soak period (between 24 to 72 hours, based on
temperature and reaction rate), during which the partitioning tracer (e.g., EtF) hydrolyzed to
form ethanol (EtOH), the product tracer. At the conclusion of the soak period, the test well pump
was reseated for the pullback production stage. During the pullback, a pre-determined volume
(usually between 1 to 1.5 PV) of the fluid were produced over a 24 to 48 hours period. The
produced fluid was sampled every 10 to 20 minutes for the first 8 hour and every 30 minutes for
the remainder of the test. Samples were analyzed for tracer concentration by GC on site.
Immediately after completion of pre-tracer test, the chemical flooding was initiated to mitigate

23
any significant change of Sor near the test well. The selected surfactant formulation was
prepared with the produced brine and the pre-determined PV of surfactant-only solution was
delivered into the well with a dedicated pump. Typically after the surfactant injection, a push
slug of brine would be injected to move the mobilized oil away from the radius of influence (>
20 ft).
After chemical flooding, the post tracer would be conducted using similar tracers, amount of the
required tracer and pusher, and identical procedures as the pre-tracer test. Results of the Sor
between the pre- and post-tracer test would be used to quantify the performance of the oil
removal based on the chemical flood.
1.2.11. Results of Reservoir H Field Test
Our initial observations showed that the ultra-low IFT (0.008 mN/m) has been achieved in our
initial efforts using ternary#2 surfactant formulation with site crude and site brine, the resulting
column tests did not produce favorable oil recovery level (< 25%). Part of this poor performance
is due to the tight formation at the H site (< 100 md). Thus, we made some modifications to
explore surfactant-only formulation for tight formation in the further tests.
The second set of column studies indicate the oil recovery increases markedly using one of the
modified surfactant systems, including,
1. Propoxylated/ethoxylated alcohol sulfates (SF05): 0.65%
2. Blends of monoalkyl and dialkyl diphenyloxide disulfonates (SF03): 0.05%
3. Ethoxylated alcohol sulfates (SF02): 0.05%
To improve the performance of the surfactant formulation, e.g., increasing the coalescence rate
of microemulsion (< 5 mins), and maintaining stable solution over extended period (> weeks),
additional formulation modifiers (e.g., chelating agents & hydrophilic linkers, averaging level of

24
300 to 600 mg/L) were introduced to achieve the performance goal.
1.2.12. Field single-well test design
Figures show the design of the pre- and post-chemical tracer test and surfactant mixing system
design. These engineering designs were similar to our previous studies (Hsu et al., 2012; Shiau
et al., 2012). The injection of chemicals at the H site was initiated in late April, 2013 and the
injection was completed in mid-May of 2013.
Representative photos and the resulted Sor of the field test are shown in Fig. 1.6 and Fig. 1.7,
respectively.
Table 1.5. The Designed Tracers, Concentrations and Volume used for the Single-Well Tracers
at H Site
(a)
(b)
*K: partitioning coefficient for Ethyl Format (EF)

25
Fig. 1.1—Pump, 2 packed column and sample collector
Fig. 1.2—Core flood apparatus used for the experiments

26
Fig. 1.3—Results of column tests using different surfactant concentrations and the length of
the sand-packed column
0
10
20
30
40
50
60
70
80
0 5 10 15
Res
idu
al O
il R
eco
very
(%
)
Pore Volumn (PV)
Total surf. 0.23%,3PV
Total surf 0.46%,3PV
Total surf 0.69%,3PV
Total surf. 0.92%,3PV
Total surf 0,23%, 3",3PV
Total surf 0.46%,3",3PV

27
Fig. 1.4—Flow chart of pre- and post-chemical flood tracer tests and their mixing and monitoring design
Fig. 1.5—Flow chart of chemical flood injection tests and surfactant mixing design
28
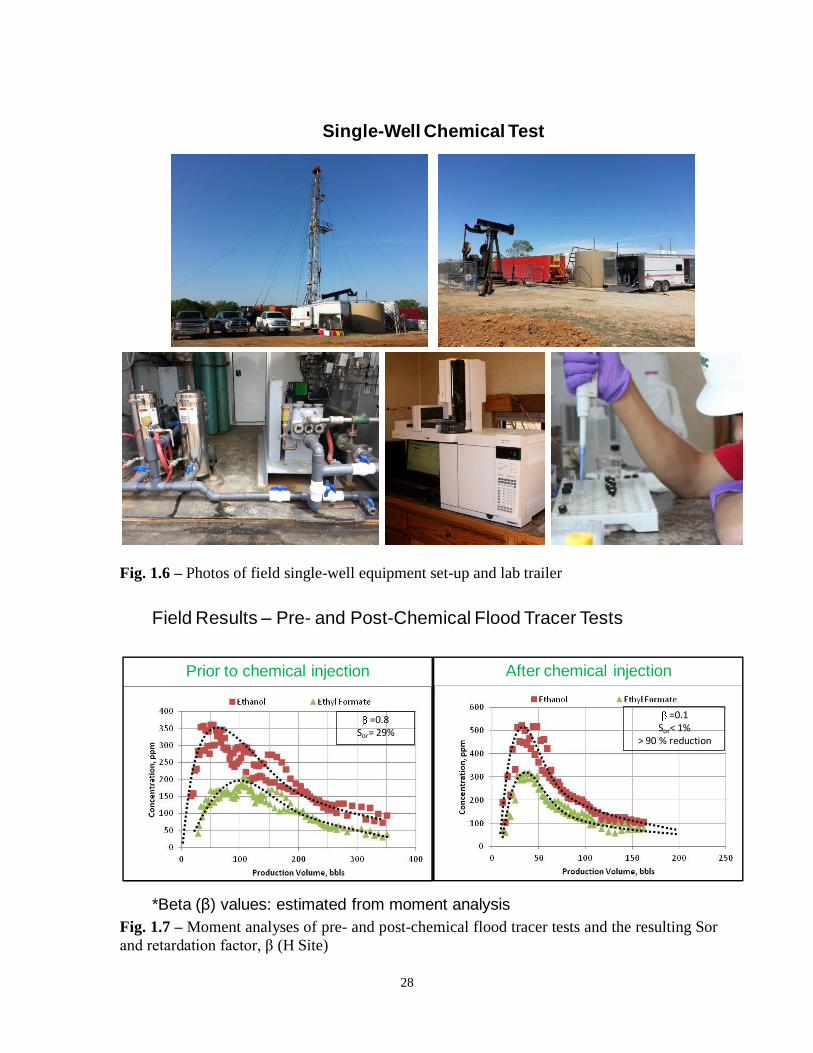
Fig. 1.6 – Photos of field single-well equipment set-up and lab trailer
Fig. 1.7 – Moment analyses of pre- and post-chemical flood tracer tests and the resulting Sor
and retardation factor, β (H Site)
Single-Well Chemical Test
Field Results – Pre- and Post-Chemical Flood Tracer Tests
Prior to chemical injection
=0.8Sor= 29%
=0.1Sor< 1%
> 90 % reduction
After chemical injection
*Beta (β) values: estimated from moment analysis

29
1.2.13. Summary of the H Site Field Test
Based on the resulting field tests and data comparisons between pre- and post-tracer tests, some
important conclusions can be drawn as follows,
• Applying HLD concept can significantly reduce surfactant screening time when
compared to the conventional method.
• The TDS of brine can be used as the optimal salinity in HLD equation at high salinity to
determine the surfactant selection
• The developed ternary surfactant-only system can markedly improve recovery of viscous
oil (23 cp @ 50 0C) as confirmed in sand-packed and core flood experiments.
• Results of field single-well test indicate significant trapped oil (> 90% reduction of Sor)
can be mobilized from the target zone at a tight formation (i.e, permeability of 15 mD) by
surfactant-only flooding
• Field pilot multi-wells test at the H site is anticipated in the near future based on the
encouraging results of single-well test, but will be delayed until oil prices stabilize
1.3. Reservoir W Case Study
Reservoir Information. W site located near Guymon, Oklahoma is the oil field for the targeted
location where SWCTTs are performed based on its uniqueness of extreme high salinity in the
formation. The produced reservoir brine and crude oil samples collected for this site are used for
the lab experiments. Table 1.6 shows information on composition of the reservoir brine. Brine
analysis is performed by an outside local lab (the Red River laboratory, Oklahoma City).

30
Table 1.6. Formation Brine Analysis of W Site
The permeability, porosity, pay thickness, and crude oil viscosity of the W site are reported as
500 to 1000 mD, 15-20 %, 12 ft, and 4.5 cP at the reservoir temperature of 52°C (125 °F)
respectively. The wellbore dead volume is 35 bbls and the average equilibrium production rate is
55 bbls/day.
1.3.1. Development of Surfactant Formulations for W Site
Four optimized surfactant formulations have been proposed for this specific reservoir conditions
by the hydrophilic lipophilic deviation (HLD) method and is discussed elsewhere (Budhathoki et
al., 2015). In this work, the surfactant formulation incorporating C8-(EO)1-(PO)4-SO
4Na and
SAES is selected as the surfactant flood system for field test because of unavailability of other
three extended surfactants in bulk quantity. The extended surfactant, C8-(EO)1-(PO)4-SO
4Na,
used in this study for both lab experiments and field tests is provided by Sasol North America,
Inc. SAES surfactant i.e. Sodium laureth sulfate, trade name Steol Cs460, is purchased from
Stephan Chemical Inc. F-95 grade Ottawa sand (60-170 mesh size) used in sand packed studies
is purchased for U.S. Silica and the tracers: ethylformate (>97%), methanol (>97%), and n-
propanol (>97%) used in SWCTT tests are purchased from Univar.

31
Figure 1.8 shows the IFT measurements of the surfactant system at the various concentrations of
SAES. The ratio between C8-(EO)1-(PO)4-SO
4Na and SAES at which the minimal IFT i.e. 8E-3
mN/m is obtained is defined as the optimal formulation. The aqueous phase of this surfactant
system at the optimal condition is reported to exhibit clear homogeneous single-phase solution.
Also the coalescence rate is reported to be less than 30 minutes showing that the proposed
formulation satisfies the criteria of the cEOR surfactant flood system.
Figure 1.8. Equilibrium IFT measurements of the binary mixtures (C8-(PO)4-(EO)1-SO4Na, 0.25
wt % + SAES) with the reservoir crude oil at 52°C
1.3.2. Sand Pack Studies
Sand pack studies are conducted in laboratory for the purpose of optimizing the surfactant-only
system for the field single-well flooding test. Figure 1.9 shows example of the sand pack study
results involving the effect of varying total surfactant concentration (between 0.25 wt% to 0.75
1.E-03
1.E-02
1.E-01
0.2 0.3 0.4 0.5 0.6 0.7 0.8
IFT
, m
N/m
Steol Cs460, wt %

32
wt%) on cumulative oil recovery. A glass column that is 1 inch in diameter and 6 inches long is
used for sand pack studies. F-95 grade Ottawa sand is used as a column packing material. As seen
in the Figure, decreasing the overall surfactant concentration from 0.75 wt% to 0.50 wt%
decreases the cumulative oil recovery from 60% to 48%. A further reduction in oil recovery is
observed for 0.25 wt% surfactant concentration (i.e., decrease to only 37 % recovered). Also in
Figure 1.9, early oil breakthrough is observed for the sand pack that is flooded with 0.75 wt%
surfactant concentration slug compared to that of sand packs flooded with less concentrated
surfactant slug. Figure 1.10 shows the position of oil bank in sand pack immediately after
flooding with one PV of each surfactant slug. It is observed that the sand pack flooded with 0.75
wt% surfactant slug has relatively higher oil bank position than that of 0.50 wt% and 0.25 wt%
surfactant slugs respectively.
In ideal case where the surfactant adsorption in porous media is minimal and if ultra-low IFT at
the oil-water interface is the only oil recovery mechanism then lowering overall surfactant
concentration while maintaining the optimal Type III region should not decrease the cumulative
oil recovery or nor should it delay the oil breakthrough. However, the observation made in this
study doesn’t correspond to the ideal case. One potential explanation could be the severe
surfactant retention in porous media by adsorption. In the literature it is reported that the oil
recovery is sensitive to the amount of surfactant injected and the amount of surfactant required
depends on the level of adsorption in porous media. In such case, 0.75 wt% surfactant slug is
arguably the best among other two less concentrated surfactant slugs as most surfactants are
available to effectively participate in oil recovery mechanism. It is also likely that 0.75 wt% slug
traverses in porous media faster because of more surfactant availability even after adsorption to
mobilize oil resulting in faster oil bank formation and ultimately leading to the early oil

33
breakthrough.
Figure 1.9. Effect of surfactant concentration on cumulative oil recovery and oil break through
Figure 1.10. Sand pack studies: A. 1 PV, 0.25 wt% B. 1 PV, 0.50 wt% C. 1 PV, 0.75 wt%. Fluid
injection rate: 0.3 ml/min
Table 1.7 summarizes the information of each sand pack test. Taking into account sand pack
performance, field operation, and cost, the surfactant only flood system with slug size of 0.5 PV
60%
48%
37%
0%
15%
30%
45%
60%
75%
0.00 0.50 1.00 1.50 2.00 2.50 3.00 3.50
Cu
mu
lati
ve O
il R
ecovery, %
Pore Volume injected, PV
1 PV, 0.75 wt %
1 PV, 0.5 wt %
1 PV, 0.25 wt %

34
and 0.5 wt % surfactant concentration is chosen as cEOR agent for field test. Literature shows
that the sand pack test results correspond very well with coreflood test (Hsu et al., 2012). For this
reason, coreflood tests are not performed in this study.
Table 1.7: Summary of sand pack studies
Sand
Pack
Surfactant Injection
protocol
IFT,
mN/m
Initial Sor
± 0.02
Final Sor
± 0.02
Cumulative oil
recovery, %
1 1 PV, 0.75 wt% 8.00E-03 0.24 0.1 60
2 1 PV, 0.50 wt% 7.80E-03 0.2 0.1 48
3 1 PV, 0.25 wt% 7.50E-03 0.26 0.16 37
4 0.50 PV, 0.50 wt% 8.1 E-03 0.23 0.14 41
1.3.3. Equilibrium Partition Tracer Coefficient, K
It is desired for a reactive tracer to have slightly higher solubility preference for oil over brine to
estimate the Sor accurately. The equilibrium partition coefficient K of ethylformate measured in
this study is 2.91±0.30. This value suggests that the ethylformate prefers oil almost 3 times to
brine at the reservoir conditions. The K value, which is sensitive to the reservoir temperature,
brine salinity, pH, and crude oil light component, is reported to be in the range of 2.0 to 8.0
(Deans & Carlisle, 1988; Jerauld et al. 2010).
Figure 1.11 shows the plot of ethylformate concentration versus time under the reservoir
temperature. The slope of Ln [EF] against Time (hr) in the study, -0.284 ± 0.03 hr-1
(7.88E-5 ±
8E-6 s-1
), is the hydrolysis rate constant of the ethylformate. This value is similar to the rate
constant, 7E-5 s-1
, reported in literature (Jin et al. 2015b) for ethylformate hydrolysis at the
reservoir temperature of 123 °F.

35
Figure 1.11. Ethylformate hydrolysis rate constant study
1.3.4. Field test results interpretation at W Site The matched SWCTT results are shown in Figures 1.12 and 1.13 for pre and post surfactant
injection respectively. The profiles of reactive tracer ethylformate and product alcohol ethanol are
well fitted by a single layer model indicating a homogenous geological formation. Table 1.8
summarizes the fitting parameters. As observed in the table, the reaction rate of ethylformate
decreases from 9.5e-5 s-1
in pre surfactant SWCTT to 6.6 e-5 s-1
in post surfactant SWCTT. The
decrease in rate constant is most likely the result of temperature drop from injecting high volume
of cold fluid during the tests (Park et al. 1991). Similar phenomenon is also reported in literature
(Jin et al., 2015).
The tracer concentration profile of pre surfactant SWCTT depicted in Figure 1.12 shows a narrow
separation between the peaks of ethylformate and ethanol. This observation indicates that the Sor
after water flooding is low (Deans & Carlisle, 1988) and is further confirmed from simulation
results that shows water flooding Sor of 0.11. It is reported that based on reservoir formation, oil
and brine properties, and other unknown variables, the Sor of mature reservoirs could vary from
less than 0.1 to more than 0.45 (Deans & Carlisle, 1988). Given the fact that the War Party
y = -0.2842x + 8.406
R² = 0.9917
7
7.4
7.8
8.2
8.6
0.0 1.0 2.0 3.0 4.0 5.0
Eth
ylf
orm
ate
con
cen
tra
tion
, ln
(EF
)
Time, hrs

36
formation is highly permeable, 500 mD to 1000 mD, it is possible for this specific reservoir to
have Sor of 0.11, especially after being water flooded with 6 PVs of reservoir brine at three times
higher injection rate than its equilibrium production rate of 55 bbls/day. Increasing the velocity of
injection fluid increases the capillary number and thereby decreases the Sor (Stegemeier, 1974).
Furthermore, as observed in Figure 1.13, there is no significant separation between the peaks of
ethylformate and ethanol in post surfactant SWCTT indicating that the Sor is very low. The
simulation results verify this observation and show the post surfactant Sor of 0.03.
An overall Sor reduction of about 73 % is observed after cEOR in field test, which is slightly
higher, compared to the sand pack studies conducted with similar surfactant only injection
protocol. However, sand pack studies are only used as a fast pre-screening tool for laboratory
designed formulation and its resemblance to the actual reservoir is almost impossible. Jin et al.
(2015) have also reported higher Sor reduction in field test compared to sand pack tests using
surfactant only cEOR system.
Figure 1.12. : Pre Surfactant SWCTT tracer concentration profile; single layer fitting
0
100
200
300
400
500
600
700
0 20 40 60 80 100 120 140
Trac
er C
on
cen
trat
ion
, p
pm
Cumulative water (bbl)
EtF_Field
EOH_Field
EtF
EOH

37
Figure 1.13. : Post Surfactant SWCTT tracer concentration profile; single layer fitting
Table 1.8. Simulation Matching Parameters
0
150
300
450
600
750
900
0 20 40 60 80 100 120 140
pp
m
Cumulative water (bbl)
EtF_Field
EOH_Field
EtF
EOH

38
1.3.5. Summary of W Site Test
Surfactant formulation developed for the ultra-high saline reservoir is optimized in laboratory
through sand pack tests and is implemented in the field test at W site. Efficiency of the designed
formulation in field is verified through SWCTTs and the numerical simulation is applied to
interpret field data. Based on the results obtained, following conclusions can be made:
1. Surfactant formulation incorporating extended surfactant, C8-(EO)1-(PO)4-SO4Na, and
SAES, C12-(EO)3-SO4Na shows excellent aqueous phase stability and generates ultra-low
IFT of 8e-3 mN/m with crude oil at the reservoir conditions.
2. Sand pack studies show improved cumulative oil recovery and early oil breakthrough
with increased surfactant concentration. More surfactants available after reaching
surfactant adsorption level to participate in oil recovery mechanism in the case of
concentrated surfactant slug could be the potential explanation. Further study is
recommended to understand surfactant only flooding systems better in sand packs.
3. The oil-water partition coefficient and hydrolysis rate constant of ethyl formate are
determined in laboratory and are found to be 2.91±0.30 and 7.88e-5 ± 8e-6 s-1
respectively.
4. The reaction rate constant of ethyl formate is found to decrease from 9.5e-5 s-1
in pre
surfactant SWCTT to 6.6e-5 s-1
in post surfactant SWCTT. Temperature drop due to high
volume cold fluid injection along with pH drop due to product acid of ester reaction
could have resulted such decrease in rate constant.
5. Highly permeable reservoir formation and high injection rate of water flooding could
have resulted low Sor of 0.11 in pre surfactant SWCTT.

39
6. The Sor of 0.03 in post surfactant SWCTT and 73 % overall Sor reduction demonstrate
that the laboratory optimized surfactant formulation is very promising and effective in
mobilizing residual oil in ultra -high TDS reservoir.
1.4. Single Well Tracer Test at R site
1.4.1. Introduction
A Single Well Tracer Test (SWTT) was executed for the clients at the target R site on January of
2014 to assess the effectiveness of SWTT at this formation.
The test was conducted at the selected producing well EU in the R Field near Eastland, Texas.
The objective of the test was to determine residual oil saturation (Sor) and any further test and
potential designing of viable EOR approaches would then be considered depending on the
outcome of the tracer test results.
1.4.2. Testing Procedure and Field Results
The EU producer well at the R field was pre-screened and selected to be the test well for the
Single Well Tracer Test (SWTT) based on the site characteristic and operations records. The EU
well is completed to a depth of 3,429 ft with a perforated interval of 16 ft. The formation has an
average porosity of 14.3% and a reservoir temperature of 120oF. The EU well produces
approximately 150 barrels of total fluid per day. The radius of investigation was designed at 14’
for the partitioning tracer and 19’ for the non‐partitioning tracer.
Prior to the test being conducted, a packer was set one joint above the perfs. The packer is
intended to isolate the flow of the injected fluids into the perforated interval and prevent entry
of injection fluids into the annulus. During the week of the SWTT, the client shut‐in the field,
to eliminate potential reservoir influences.

40
Our group set up a portable field test unit at the field location on January 17, 2014.
Two 500 bbl frac tanks were placed on‐site by the client. The frac tanks were filled with ~600
bbls of brine to be used for brine injection. The rod pump was unseated on January 18, 2014 at
2:30PM in preparation for the pre‐flush to temporarily water out the test zone. A total of 500 bbls
of brine was injected during the pre‐flush at an average rate of ~750 bpd on vacuum. The
injected brine was filtered with 1 micron size filter cartridges to prevent plugging of the
formation. Injection rate and volumes were recorded during this procedure.
Prior to chemical tracer injection, the rod pump was temporarily reseated and produced back
for 4 hours recovering approximately 42 bbls on Sunday, January 19th. This step cleans the
perforations and helps ensure a good tracer push into the formation. The produced fluids
from this 4 hour production period went into the north frac tank. The pump was then unseated
for chemical tracer injection the following morning. Additional fresh water was
delivered the afternoon of January 19th to provide the required fluids for tracer injection.
Chemical tracer injection started at 8 AM on January 20, 2014. Initially 62 bbls brine
containing the reactive tracer (EtF), the cover tracer (NPA), and the mass balance tracer
(MeOH) were injected. The concentrations of the tracers were: 10,432ppm for EtF, 4,365 ppm
for NPA, and 3,342 for MeOH. This was followed by the push slug of 244 bbls of brine
containing 3,342 ppm MeOH. The injection rate was held between 720‐750 bpd on vacuum.
During injection, the tracer solution was sampled and analyzed for tracer concentration by
gas chromatography (GC).
The well was then shut‐in for a two day soak period (January 21st and 22nd), during which the
EtF hydrolyzed to form Ethanol (EtOH), the product tracer. At the conclusion of the soak
period, the EU well pump was reseated for the pullback production stage on January

41
23rd. A total of 398 bbls were produced back over a two day period ending January 25th at
6AM. The produced fluid was sampled every 10 to 20 minutes for the first 960 minutes and
every 30 minutes for the remainder of the test, a total of 2,850 minutes. Samples were
analyzed for tracer concentration by GC on site.
The resulting chemical tracer profiles are shown in Figures 1.14 ‐ 1.16 and are plotted as tracer
concentrations vs. produced bbls. The ethanol product tracer, EtOH, is plotted against the NPA
cover tracer in Figure 1.14. The primary reactive tracer, EtF, is plotted in Figure 1.15 along with
the cover tracer, NPA. The material balance tracer, MeOH, is shown in Figure 1.16. The
horizontal separation between EtOH and NPA tracer profiles in Figure 1.14 is the basis for
determining the residual oil saturation using the SWTT method.
Figure 1.14. Concentration of EtOH versus Produced Volume for the SWTT

42
Fig. 1.15. Concentration of EtF versus Produced Volume for the SWTT
Fig. 1.16. Concentration of MeOH versus Produced Volume for the SWTT

43
1.4.3. Results of Single Well Tracer Test
Total tracer recovery was consistent between the mass balance tracer (MeOH) and cover
tracer (normal propyl alcohol, or propanol, NPA) of 56% and 52%, respectively. Total ethanol,
EtOH, recovery indicates 43% of the EtF was hydrolyzed. However, total EtF recovery was only
1.1%.
The results showed good separation between ethanol (EtOH) and the cover tracer NPA
indicating detectable levels of Sor. In this case, higher than normal hydrolysis rates coupled with
~45% dilution resulted in very low recovery of the reactive tracer (EtF) even with a short soak
period of only two days (typically, we use a three day soak period). Therefore, the cover tracer
NPA was used as a substitute to determine Sor. In cases where there is not excessive drift, the
cover tracer and EtF concentration profiles will closely match.
High measured levels of EtF, NPA, and EtOH during the first 50 bbls of production indicate
irreversible flow. Some tracer entered portions of the formation during injection of the ester
bank, but were not pushed out into the formation during subsequent slug push. After 50 bbls
production, the tracer profiles contain EtOH and NPA peaks with well‐defined leading and
trailing edges.
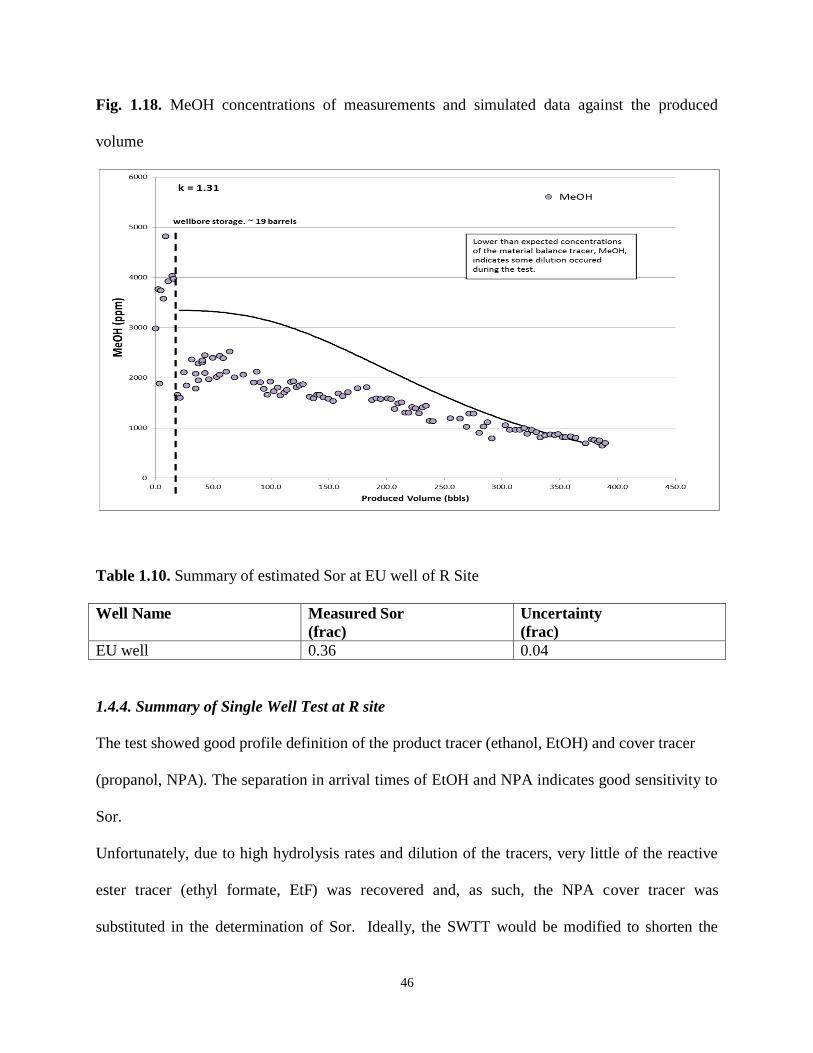
Ideally, the mass balance tracer (MeOH) should be produced at the injected concentration of
3,342 ppm for the first 20 to 30 bbls before reflecting dispersion and slowly tapering down to
about 800 ppm after 350 bbls produced. However, after the wellbore volume was recovered,
the MeOH concentration dropped to 2,400 ppm indicating dilution. This dilution is indicative of
a zone associated with the perforations that does not accepted tracer carrying water during
injection but produces water during production.
Determination of residual oil, Sor, was made with the updated partition coefficient of K = 1.31

44
(the partition coefficient was analyzed post the test using injected brine samples taken at the
site). The partition coefficient of the ester tracer (EtF) and oil saturation encountered by the
ester determines how much slower the ester returns to the well than the product alcohol. The
time separation between the slower moving retained tracer, the ester, and the more quickly
moving produced tracer, the product alcohol, is directly related to oil saturation. In this case,
the NPA cover tracer was substituted for the ester tracer.
The EtOH and NPA profiles are well defined and Sor is readily measured. Determination of Sor
was performed by delineating the x‐axis position of NPA and the corresponding x‐axis position
of EtOH (see basic equation below for determination of Sor). These positions were quite easy
to match. The best‐fit flow model that matched the NPA and EtOH profiles is a radial flow
model (see below).
Where,
Qa produced volume at NPA peak
Qb produced volume at EtOH peak
K partition coefficient
A single layer model was used to fit the NPA and EtOH profiles and is likely the best indication
of Sor (see modeled profiles in Figure 1.17). Figure 1.18 is the modeled profile for the MeOH
mass balance tracer. The estimated Sor was ~0.36 ± 0.04 (see Table 1.10). The uncertainty of
±0.04 was due to indications of dilution, irreversible flow, as well as injection of fresh water

45
during chemical tracer injection. A sensitivity analysis of Sor to the partition coefficient is given
in Table 1.9.
Table 1.9. Sensitivity analysis of Sor against various K
Fig. 1.17. EtOH concentrations of measurements and simulated data against the produced
volume
46
Fig. 1.18. MeOH concentrations of measurements and simulated data against the produced
volume
Table 1.10. Summary of estimated Sor at EU well of R Site
Well Name Measured Sor
(frac)
Uncertainty
(frac)
EU well 0.36 0.04
1.4.4. Summary of Single Well Test at R site
The test showed good profile definition of the product tracer (ethanol, EtOH) and cover tracer
(propanol, NPA). The separation in arrival times of EtOH and NPA indicates good sensitivity to
Sor.
Unfortunately, due to high hydrolysis rates and dilution of the tracers, very little of the reactive
ester tracer (ethyl formate, EtF) was recovered and, as such, the NPA cover tracer was
substituted in the determination of Sor. Ideally, the SWTT would be modified to shorten the
47
shut-in time to improve the data interpretation. Yet, this modification could not be realized due
to the site and budget limitations.
Thus, the Sor was determined by delineating the x‐axis position of the NPA and the
corresponding position of the EtOH. The measured Sor is 0.36 ± 0.04 within the reservoir pore
volume penetrated by the tracer carrying fluid. Details of the test are given below along with a
discussion of the results and findings.
Further tests at R site have not been decided by the client based on the results of pre-chemical
flood tracer test. No further action would be taken at the R site.
1.5. Mini-Single Well Tracer Test at AB Site
A mini-single well tracer was conducted at the AB site (a Red Fork Formation located in
Oklahoma) based on preliminary tracer tests indicating significant drifting phenomena might
occur near the target well impacted by surrounding active producing wells. Preliminary results
of tracer test indicated that significant tracers mass injected were not counted during the pull-
back operations.
1.5.1. Objective
The aim of the mini-test was to evaluate the drift rate in the formation at AB Site (Well #15)
which could potential impact the data interpretation of tracer recovery and the estimated Sor.
1.5.2. Procedures
In general, the injection protocols called for the mini tracer test involves injection of a smaller
slug of tracer(s) into the formation, with a brief of shut-in time (i.e., last only few hours), and
resume the pumping and recover the injected tracers from the formation. Specifically, at the AB
site, the pre-determined chemical slug of the mini test and injection and recovery steps included
48
the following based on documentation of prior literatures,
a. Step 1. Injection of 15 bbls of 1% MeOH solution (3.5 hours)
b. Step 2. Injection of 15 bbls of 1% PrOH solution (3.5 hours)
c. Step 3. Injection of 30 bbls of brine (7 hours)
d. Shut-in 5 hours
e. Production: 28 hours
f. Sampling protocol (for GC analyses)
o During injection: once every 1 hour
o During production: once every 10 minutes
The advantages of mini test are that it is rapid, easy to conduct, low cost with the benefits of
retrieving field data indicating the integrity of well bore and existing hydrodynamic conditions
with much quicker time frame, as compared to conventional single well test. This is especially
true for an unknown mature field which may largely lack comprehensive operation records and
additional tests been conducted in the past and/or in some cases, the integrity of well and the
flow field might be questionable.
1.5.3. Results of Mini Test at AB Site
Total amounts of tracer concentration used during the mini test are summarized in Table 1.11.
Dual alcohols (methanol and NPA) were used in this test, and both were non-reactive (i.e.,
conservative, or non-partitioning). Results of tracer concentration injected during the injection
stages are shown in Figure 1.19.

49
Table 1.11. Tracer concentration injected
Fig. 1.19. MeOH and NPA Concentrations versus injection time
Results of tracer concentrations during production step and the average production rate are
depicted in Figures 1.20 and 1.21, respectively. Based on these recovered concentrations and
flow rates (Figs. 1.19 – 1.21.), the total amounts of alcohols injected and recovered in the test
were calculated and summarized in Table 1.12.
MeOH PrOH
Average injected concentration, ppm 10906.8 7928.9

50
Table 1.12. Material balance of the tracers injected
Fig. 1.20. Concentrations of MeOH and NPA versus production time
MeOH PrOH
Total Recovered, kg 14.22 9.34
Total injected, kg 29.07 18.22
% recovery 48.91 51.27

51
Fig. 1.21. Cumulative production rate and average production against time
To facilitate the estimation of the drift (as denoted as parameter, d), we used the following
approaches as shown in Figures 1.22 – 1.23. The assumptions are formation permeability being
constant and homogeneous, no leak at the wellbore. Based on the mass of MeOH and PrOH
recovered and actual production rate, results of drift (estimated) were summarized in Tables 1.13
and 1.14. The resulted drift rates of MeOH and PrOH were 57.5 ft/d and 58.5 ft/d, respectively.
We also compared the estimated draft rates for several prior SWTT sites conducted by this group
at various formations and the results were summarized in Table 1.15. The mini test at AB site
indicated that we had much higher draft at this location.

52
Fig. 1.22. Maps of tracer migration and radius of plume
Fig. 1.23. Formulation and calculation for the intersected area between the tracer plume and
production boundary

53
Fig. 1.24. Intersected area estimated for PrOH (red) MeOH (green)
Table 1.13. Parameters used in drift calculation Table 1.14. Results of d & drift rates
Table 1.15. Comparison of drift rates at different formations and wells
Site Drift Rate, ft/d
PrOH MeOH
M 29 Pre-ChemFlood SWTT 4.76 n/a
M 29 Post-ChemFlood SWTT 6.56 6.37
SF 56 Pre-ChemFlood SWTT 6.74 6.15
SF 56 Post-ChemFlood SWTT 10.13 10.01
AB 18 Pre-ChemFlood SWTT 1st 7.04 7.54

54
AB 18 Pre-ChemFlood SWTT 2nd
9.25 9.50
AB 15 Pre-ChemFlood SWTT 1st 7.97 8.01
AB15 Pre-ChemFlood SWTT 2nd
5.59 5.80
AB 15 Pre-ChemFlood minitest 58.5 57.5
We also conducted the sensitivity analysis on drift rate calculation based on various parameters,
such as perforated zone thickness, porosity, Sor, shut-in time , and % mass recovery. The results
are depicted at Table 1.16 and Figure 1.25. While most parameters showed some extent of
affecting the drift rate, the levels of Sor show negligible impact on the drift rate, and change of
the shut-in time pose most significant impact on the drift.
Table 1.16. Summary of sensitivity analysis on drift rate

55
Fig. 1.25. Sensitivity analyses of drift rate versus different parameters
We also assessed the effect of sampling frequency (most samples collected at 10 mins during the
mini test) and the results are shown in Figures 1.26 – 1.27 for PrOH and MeOH, respectively.
Effects of sampling frequency on recovery and peak location are depicted in Table 1.17. Results
of tracer breakthrough indicated sampling frequency between 10 to 30 mins provides reasonable
close data of recovery and peak location. Increase of sampling frequency to 60 mins would tend
to increase the uncertainty on the data interpretation and deviate from the actual values of the
retrieved samples.

56
Fig. 1.26. Results of PrOH concentrations at different sampling frequency versus production
time
Fig. 1.27. Results of MeOH concentrations at different sampling frequency versus production
time

57
Table 1.17. Summary of sampling frequency on recovery and peak location
1.6. Pilot Interwell Chemical Flood Test at SK Site
1.6.1. Aim:
Though our main endeavor of this study was to explore different approaches and designs of
multiple single well tests for facilitating design of future pilot multi-well injection, our team also
had the opportunities to conduct a quick pilot multi-well test at the SK site (near northeastern
Oklahoma). Thus, the main aims of this quick inter-well test involving one injection and one
production well were at least two folds: 1) to assess injection of the developed surfactant
formulations and closely monitor the response of the chemicals injected at the production well,
2) based on these preliminary test and explore the opportunities of injecting surfactant-only
system for enhancing oil recovery. Since this is a quick pilot inter-well test, the main tasks
involved monitoring the injected tracer breakthrough, the breakthrough of chemicals injected and
trend of oil recovery.
Several fluorobenzoic acids, 2-fluoro benzoic acid (2-FBA), 4-fluoro benzoic acid (4-FBA), 4-
trifluoromethyl benzoic acid (4-TFMBA, were selected as inter-well tracers for the test and
injection of these tracers at the target injection were conducted with sequential approach,
injecting tracer 1 at Day 1 and followed by injecting tracer 2 at latter day, x. Once injected,
monitoring of the tracers breakthrough were continuously taken place at the selected surrounding
(producing) wells to better delineate the flow path of the target zone based on the history of
Sampling Freq., min 10.00 20.00 30.00 60.00 10.00 20.00 30.00 60.00
Total Recovered, kg 14.22 13.49 13.80 13.34 9.34 8.77 9.06 8.64
Total Injected, kg 29.07 29.07 29.07 29.07 18.22 18.22 18.22 18.22
% Recovery 48.91 46.39 47.46 45.89 51.27 48.12 49.73 47.41
Peak Location, hr 7.17 7.00 8.00 8.00 3.50 4.00 4.50 5.00
MeOH PrOH

58
breakthrough and the level of peak tracer concentration using moment analysis. An example of
tracer used and their breakthrough at near by producing well (North Inj Water well) at SK site
was depicted at Figure 1.28. The fluorobenzoic acids were measured by GC with a MS detector
with sampling pretreatment developed in-house at CFT. As shown in this figure, the
connectivity between injection well A9 and producing well (North Inj Water) is reasonable good.
However, the connectivity between wells B-11 and North Inj Water was poor as indicated by
lack of any tracer breakthrough at North Inj Water within reasonable time frame based on the
assumption of darcy law and average permeability of the formation. The shape of the
breakthrough curves (see Figure 1.28) are somewhat different between two sequential tracers
injected (2-FBA and 4-TGMBA), likely due to a modification of active production wells and
their pumping rate and well pattern was taken place at the target area.
Fig. 1.28. Example of tracers used in the inter-well and their breakthrough

59
Results of several non-partitioning tracer tests conducted at the targeted well (PA4) are shown in
Figures 1.29 and 1.30. The breakthrough of tracers between two sepearate tests are quite similar
(see Figure 1.29); while Test 1 was conducted in 2012, Test 2 conducted in 2013. Based on the
tracer breakthrough data (2-FBA in Figure 1.30), the breakthrough of conservative tracers at well
PA 4 should be around 104 to 120 days, as confirmed by second tracer injected (4-TFMBA).
Fig. 1.29. Comparison of two separate tracer injection/breakthrough at the targed well (PA4) at
SK site (note that: test 2 was conducted few months before the surfactant injection)

60
Fig. 1.30. Comparison of two sequential tracer injection (2-FBA & 4-TFMBA) at the targeted
well (PA4) at SK site during the pilot chemical flooding
The developed surfactant formulations for the SK site was a mixture of dual surfactant system:
Propoxylated alcohol sulfates (2560 mg/L) and ethoxylated alcohol sulfates (2450 mg/L) and
other performance booster additives ( a total of 1000 mg/L). The targeted PV of chemical slug
was 0.75 PV (=15,000 bbls) (the total chemicals required = 6276 gallons based on the
concentrations). The selected optimal surfactant solution was based on the laboratory batch
experiments and core flood tests (with Berea core).
Injection of surfactant started at September 17th
of 2013. The record of chemical injection are
depicted in Figure 1.31. And the second non-partitioning tracer (2-FBA) was also injected to
verify the flow path during the chemical flood as shown in Figure 1.32. Surfactant blend were
prepared on site in 2000 gallon flexi tank per batch (see Figure 1.33). Overall, injection of
surfactant mixture went well over the course the chemical flood stage. Example of produced
sample collected is depicted in Figure 1.34.

61
Fig. 1.31. Injection of chemical (surfactant plus additives) at SK site
Fig. 1.32. Tracer concentration (2-FBA) and its breakthrough during the chemical flood

62
Fig. 1.33. Delivery of dual surfactant mixture on site
Fig. 1.34. Example of production well sample
63
1.6.1 Summary SK Site
The SK Site pilot surfactant injection started September 17th
, 2013 and concluded March 13th
,
2014. A total of 7,000 gallons of solution was injected. A commercial blender prepared the
concentrated surfactant solution (53% active). The surfactant blend was then transported to the
field in totes and offloaded to the field facility. The facility was a unique design that utilized a
commercial bladder with 3,000 gallons of storage capacity. As the surfactant solution was drawn
down, the bladder collapses effectively limiting headspace and preventing evaporative losses. A
metering pump injected the surfactant solution directly into the high pressure injection line at the
well. A static mixer ensured adequate mixing of the surfactant solution with the injection brine.
A flow meter at the well head controlled the injection rate of the metering pump to ensure we
injected 0.5%-wt. surfactant solution. The surveillance program consisted on collecting high
concentration surfactant samples, samples of mixed solution and injection brine at the injection
well head, and samples of produced oil and brine from the producing well. At this time,
surfactant breakthrough has not been observed and the pilot monitoring would continue through
October 2014. It is suspected that higher than expected absorption has caused a delay of
surfactant breakthrough or has completely the consumed the chemical slug.

64
Chapter 2. Developing Crude Oil Fingerprinting Tool for Reducing Uncertainty of Field
Chemical EOR
2.1 Geochemical study of crude oil-composition analysis
2.1.1. Crude SARA Fraction analysis
2.1.1.1, Asphaltenes separation follows the Standard Method of Institute of Petroleum
Add into a conical flask weigh 2.00 g of crude oil
Add 20 mL of nearly boiling Ligroin (Sigma-Aldrich Cat# 333417-2L) into the
flask
Mix the oil and solvent (Ligroin) thoroughly and allow to stand in the closed flask
in the dark for 24 hours
Without agitation, decant the liquid through an 11-cm medium-texture filter paper
(Whatman No. 40)
Transfer the residue in the flask a complete as possible to the filter paper with
successive quantities of hot ligroin, using a glass rod to ensure thorough
extraction of the residue with the solvent. Give the flask a final rinse with hot
ligroin and pour the rinsings through the filter paper
Place the filter paper and its contents in a Soxhlet extraction system, and reflux it
with ligroin for about 60 minutes.
Use benzene (Sigma-Aldrich Cat# 270709-2L) to flux the filter paper and its
contents for additional 30 minutes
Weight a glass evaporating dish to nearest 0.20 mg by tare against a similar dish
Transfer the extract from the Soxhlet to the evaporation glass dish
Use benzene to wash the Soxhlet system twice, and pour the benzene to the
evaporating glass dish

65
Dry the dish containing the extract in chemical hood and weight the dish again
Calculate asphaltenes content as a percentage by weight of the original crude oil
Dissolve the asphaltenes by toluene and analyzed by GCFID/GCMS
2.1.1.2. Deasphalted crude oil that was dissolved by ligroin (see method for separating
asphaltenes described in 1-1 section) was used to fraction saturates (straight-chain
hydrocarbons), aromatics (aromatic hydrocarbons) and resins. An open column
chromatographic method was used for the separation.
Add equal quantities of Silica and Alumina into a Peroxide-Cured Reinforced
Silicone Tubing (Inter Diameter = 1”, Cole-Parmer Cat# S-95623-10).
Use a Berea sandstone plug (500MD) to block one end of the tubing
Add 10g of Silica Gel (Dynamic Adsorbents Inc. Cat# 04530-05) to the tubing
building up a silica layer on the top of the sandstone plug.
Add 10g of Alumina Basic Act. 1 (Dynamic Adsorbents Inc. Cat# 02078-05)
building up an alumina layer on the top of the silica layer
Pour deasphalted crude into the tubing, and let it gravitate through alumina layer
and silica layer
Use hexane to elute saturates (straight-chain hydrocarbons) from the column
(gravitating flow)
Subsequently use benzene to elute the aromatic hydrocarbons (gravitating flow)
Finally use methanol to elute the resins from the column (gravitating flow)
Three fractions collected from the silica-alumina column were quantitatively
analyzed by GCFID and GCMS instruments

66
Calculate their percentage by weight of the original crude oil
Saturates, Aromatics, Resins and Asphaltenes (SASA) fractions of crude oils from four oil fields
(W, SK, M and H Site) are determined (Table 2.1).
Table 2.1. SARA analysis of four crudes
W Site SK site M Site H Site
Saturates 50.4% 57.2% 52.5% 55.0%
Aromatics 10.0% 40.5% 47.0% 4.9%
Resins 39.6% 2.3% 0.4% 40.1%
Asphaltenes 2.6% 1.8% 1.5% 6.0%
Crude oil fractions could have impact on the interfacial tensions (IFTs), which is the most critical
parameter of EOR. The interstitial water may be one of the major factors controlling the
behavior of chemical solutions in the sandstones. Some papers indicate chemical reactions
between surfactant solution, resins fraction of crude oil and alkaline solutions of the interstitial
water of sandstones could produce in situ surfactants. Further analyses indicate that for different
crude oils, saturates could contain various quantities of branched-chain paraffins and straight-
chain paraffins, aromatics could contain various amounts of paraffins, aromatics and pathalic
acid, resins could contain various amounts of alcohols and petroleum acids (See Figures 2.1, 2.2
and 2.3 in the followings). More studies are need to determine the detailed compositions.

67
Figure 2.1. Chromatography data show composition of saturates
Figure 2.2. Chromatography data show composition of aromatics
0
500
1000
1500
2000
2500
3000
3500
4000
War Party Skiatook Miller 29 SE Hewitt
Co
nce
ntr
atio
n, m
g/L
Branched-chain paraffins Straight-chain paraffins
0
500
1000
1500
2000
2500
3000
War Party Skiatook Miller 29 SE Hewitt
Co
nce
ntr
atio
n, m
g/L
Paraffins Aromatics Phthalic acid
W Site SK Site M Site H Site

68
Figure 2.3. Chromatography data show composition of resins
2.1.2. Fingerprints analysis
Asphaltenes are capable to occlude species (e.g., alkanes ) inside the skeleton, keeping them
from biodegradation. These remnants of the “original oil” become fingerprints for studying
crudes in correlation with their genesis. It has been extremely difficult to determine compositions
of asphaltenes by using a normal method due to noise on chromatogram (see figure on right).
Chemical treatment could reduce noise greatly.
Pyrolysis of asphaltenes could release these occluded species and was considered to be an useful
tool to study the correlation of crudes. However, a commercial pyroprobe is very expensive (see
Table 2.2).
Table 2.2. Price range for the common CDS pyroprobes
CDS Pyroprobe Cost range, $
CDS 5200 28,000-42,000
CDS 5000 21,000-25,000
CDS 4000 12,000-15,000
CDS 2000 (used) 8,000-9,000 This product is not supported by CDS
1.E+00
1.E+01
1.E+02
1.E+03
1.E+04
1.E+05
1.E+06
1.E+07
1.E+08
War Party Skiatook Miller 29 SE Hewitt
Pea
k A
rea
Alchohols Petroleum acids

69
Chemical treatment can also free the occluded species from asphaltenes molecules. The
hydrocarbons obtained after oxidation of asphaltenes are remnants of the “original oil” occluded
by the asphaltenes molecule. According to Z. Liao and A. Geng (Organic Geochemistry, 2002),
a chemical method was developed for the fingerprints analysis of asphaltenes.
Before chromatography analysis, asphaltenes was treated chemically by mixture of
H2O2/CH3COOH
Take a 500 mg of asphaltenes into a 250-mL flat bottom flask
Add 50 mL benzene into the flask to dissolve asphaltenes
Mix 1 mL of 30% H2O2 and 10 mL of glacial acetic acid (CH3COOH) in a 50 mL beaker
Transfer the oxidative solution into the flask containing asphaltenes
Keep the mixture fully agitation at room temperature for 12 hours
Use a separating funnel to separate the benzene from glacial acetic acid
The benzene solvent was concentrated in a Turbo Vap-II evaporator to 1.0 mL for
chromatography analysis

70
The chromatotography data are presented in Figure 2.4
Figure 2.4. Analysis of asphaltenes from W Site and H Site crude oils Left: Asphaltenes from W Site crude analyzed at 400
oC (upper chromatogram), and chemically treated and
analyzed at 250 oC (lower chromatogram)
Right: Asphaltenes from H Site crude analyzed at 400 oC (upper chromatogram), and chemically treated and
analyzed at 250 oC (lower chromatogram)
The lab data show asphaltenes from different crude oils contain various components, which
indicate these crudes may come from different original materials and reservoir conditions.
2.2. Petrophysical study of reservoir sandstones
2.2.1. NMR study of sandstone
Fluvial-Dominated Deltaic Sandstone (FDD) reservoirs are the most important light-oil
reservoirs in the state of Oklahoma. Geologically, FDD reservoirs are of Pennsylvanian-age.
Pennsylvanian contains five series. Desmoines series of the Middle Pennsylvanian represents
the most important oil-bearing sandstone formations, which contribute crude production greater
than 50% of recovery from the whole Pennsylvanian system. In this study, the main target
formations would be among these oil-bearing sandstone formations. They are Bartlesville, Red
Fork, Skinner-Prue, Cleveland and Peru sandstone formations.

71
A total of 23 core plugs were collected from the Oklahoma Geological Survey’s Oklahoma
Petroleum Information Center (OGS-OPIC). These core plugs represent five major oil-bearing
sandstone formations in Oklahoma. Detailed information of these core plugs are described in
Table 2.3.
Table 2.3. List of Core Plugs Collected From
GS-OPIC
OGS-
OPIC
File #
Drilling
Operator Well Name
Sandstone
Formation
Original Depth
(Feet) Plug #
937
Jenkins &
Basin Holzer Cleveland 3782 1
937
Jenkins &
Basin Holzer Cleveland 3803 2
937
Jenkins &
Basin Holzer Cleveland 3812 3
937
Jenkins &
Basin Holzer Cleveland 3815 4
937
Jenkins &
Basin Holzer Cleveland 3823 5
272 Gulf Deep Fork Un Skinner-Prue 2447 6
272 Gulf Deep Fork Un Skinner-Prue 2454 7
272 Gulf Deep Fork Un Skinner-Prue 2456 8
272 Gulf Deep Fork Un Skinner-Prue 2467 9
2325 Lear Petr Byfield Red Fork 5699 10
2325 Lear Petr Byfield Red Fork 5720 11
1930 Ong Trindle Bartlesville 6597 12

72
1930 Ong Trindle Bartlesville 6603 13
1930 Ong Trindle Bartlesville 6606 14
1930 Ong Trindle Bartlesville 6609 15
2404 Ratiff Penick Peru 7947 16
2404 Ratiff Penick Peru 7954 17
2404 Ratiff Penick Peru 7956 18
2404 Ratiff Penick Peru 7962 19
4658
Continental &
Res Corp Grace Red Fork 4969 20
4658
Continental &
Res Corp Grace Red Fork 4971 21
4658
Continental &
Res Corp Grace Red Fork 4973 22
4658
Continental &
Res Corp Grace Red Fork 4975 23
It is planned to use these core plugs for mineralogical and petrophysical study, such as
sandstones compositions, porous texture by using different instruments, including X-Ray
Diffraction (XRD), Fourier Transform Infra-Red (FTIR) spectroscopy and Nuclear Magnetic
Resonance spectroscopy. We investigated Berea sandstone using NMR method. The NMR T2
spectrum indicate that the pore size of the column filled with crushed Berea sandstone have
different T2 relaxation times for water, crude oil and surfactant. The NMR T2 relaxation time of
core with crude oil-saturated differed from that of core with water-saturated may suggest NMR
would be a tool for the evaluation of pore geometry distribution and oil saturation degree of
reservoir rock. Unfortunately, we can’t continue petrophysical study of core plugs collected

73
from OGS-OPIC.
Figure 2.5. NMR data of 500MD Berea sandstone column saturated with oil, water and
surfactant.
Figure 2.6. NMR data of 50MD Berea sandstone column saturated with oil, water and
surfactant.
0.0%
0.1%
0.2%
0.3%
0.4%
0.5%
0.6%
0.7%
0.01 0.1 1 10 100 1000 10000
Incr
. Po
rosi
ty, %
T₂ Relaxation Time (ms)
Water Saturated Oil Saturated Surfactant
0.0%
0.2%
0.4%
0.6%
0.8%
1.0%
1.2%
1.4%
0.01 0.1 1 10 100 1000 10000
Incr
. Po
rosi
ty,
%
T₂ Relaxation Time (ms)
Water Saturated Oil Saturated Surfactant

74
2.2.2. Geochemical study of reservoir quality
2.2.2.1. Crude SARA Fractionation
Asphaltenes separation following IP Standard Method
Asphaltene residue was dissolved with benzene for GCMS analysis.
Deasphalted crude
Open column chromatographic method by using silica/alumina adsorbents and
subsequent elution with hexane, benzene and methanol for saturates, aromatics and resins
separation. The three fractionations were analyzed by GCFID and GCMS.
SASA fractions in four crude oils
Table 2.4.
W Site SK Site M Site H Site
Saturates 50.4% 57.2% 52.5% 55.0%
Aromatics 10.0% 40.5% 47.0% 4.9%
Resins 39.6% 2.3% 0.4% 40.1%
Asphaltenes 2.6% 1.8% 1.5% 6.0%
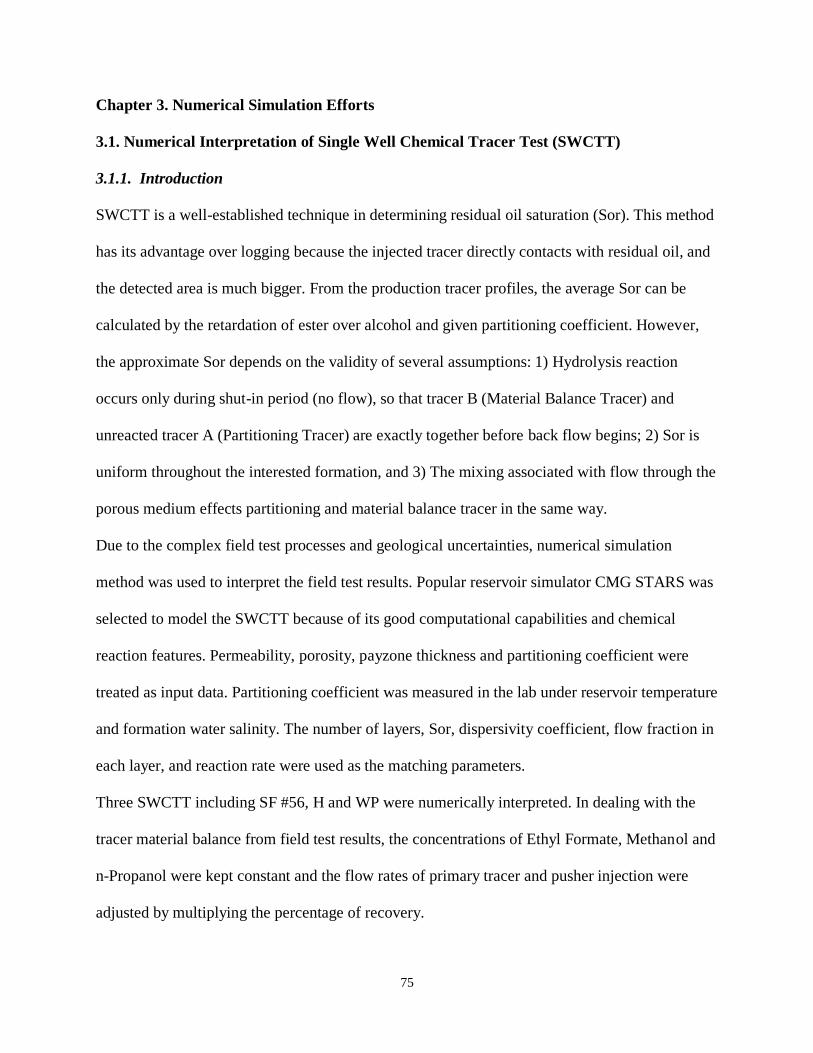
75
Chapter 3. Numerical Simulation Efforts
3.1. Numerical Interpretation of Single Well Chemical Tracer Test (SWCTT)
3.1.1. Introduction
SWCTT is a well-established technique in determining residual oil saturation (Sor). This method
has its advantage over logging because the injected tracer directly contacts with residual oil, and
the detected area is much bigger. From the production tracer profiles, the average Sor can be
calculated by the retardation of ester over alcohol and given partitioning coefficient. However,
the approximate Sor depends on the validity of several assumptions: 1) Hydrolysis reaction
occurs only during shut-in period (no flow), so that tracer B (Material Balance Tracer) and
unreacted tracer A (Partitioning Tracer) are exactly together before back flow begins; 2) Sor is
uniform throughout the interested formation, and 3) The mixing associated with flow through the
porous medium effects partitioning and material balance tracer in the same way.
Due to the complex field test processes and geological uncertainties, numerical simulation
method was used to interpret the field test results. Popular reservoir simulator CMG STARS was
selected to model the SWCTT because of its good computational capabilities and chemical
reaction features. Permeability, porosity, payzone thickness and partitioning coefficient were
treated as input data. Partitioning coefficient was measured in the lab under reservoir temperature
and formation water salinity. The number of layers, Sor, dispersivity coefficient, flow fraction in
each layer, and reaction rate were used as the matching parameters.
Three SWCTT including SF #56, H and WP were numerically interpreted. In dealing with the
tracer material balance from field test results, the concentrations of Ethyl Formate, Methanol and
n-Propanol were kept constant and the flow rates of primary tracer and pusher injection were
adjusted by multiplying the percentage of recovery.

76
3.1.2 SF56 Site
In the SF field, the Bartlesville formation is characterized by moderate permeability ranging
from 50 to 100 mD , porosity of 15-19%, pay thickness of 20 ft and light crude of ~4 cP oil at
reservoir temperature.
The numerical simulation results of pre- and post SWCTT at SF well #56 are shown in Figures
3.1 and Figure 3.2, and the matching parameter are summarized in Table 3.1. Numerical
simulation results indicate the residual oil saturation was reduced from 0.49 and 0.22 to both
0.15 in each layer.
3.1.3 H Site
In the H site, the Deese formation is characterized by low permeability of 25 mD, porosity of 15-
19%, pay thickness of 9 ft and higher oil viscosity of 25 cP.
The numerical simulation results of pre- and post SWCTT at H Site are shown in Figure 3.3 and
Figure 3.4, and the matching parameter are summarized in Table 3.2.
3.1.4 W Site
W Reservoir, which is located in the state of Oklahoma, USA, as shown in Figure 3.5, is
characterized by permeability ranging from 500 to 1000 mD, porosity of 20%, pay thickness of
12 ft and light crude of ~3.5 cP oil at reservoir temperature of 52 .
Figures 3.6 through 3.8 present the matching profiles of pre-SWCTT with different Sor. With
Sor of 0.20, 0.16 and 0.11, all results are well matched with reaction rate of 1.40×10⁻⁴
s-1
,
1.20×10⁻⁴
s-1
, and 7.9x10⁻⁵
s-1
. Since reaction rate of 7.9x10⁻⁵
s-1
is the one most close to the
reaction rate measured at lab, Sor of 0.11 is the best matching results for pre-SWCTT of W Site.
The matching profile of material balance tracer Methanol in pre-SWCTT is shown in Figure 3.9.

77
Figure 3.10 shows the matching results for post-SWCTT with Sor of 3%, indicating good
surfactant flooding efficiency. And Figure 3.11 shows the matching profile of material balance
tracer Methanol in post-SWCTT. Table 3.3 shows all matching parameters.
3.2. Interwell tracer test (IWTT) at SK Site
3 kg of conservative tracer 2-FBA was injected in 30 min into Well PA9. And its breakthrough
time was 35 days in Well PA4, which is 422 ft far from PA9. The average injection rate of Well
PA9 was 138 bbls/day, and the production rate of Well A4 was constant at 150 bbls/day. The
plot of tracer concentration versus time is shown in Figure 3.12 and followed by analytical
calculation of water flow fraction of injected water and swept volume.
Method of moments was used to estimate the injected water flow fraction and swept volume.
Constant a is evaluated at the point of data extrapolation from the equation
(1)
The first temporal moment is then estimated as
(2)
To estimate the amount of 2-FBA produced at Well PA4,
(3)
Water flow fraction from Well PA9 to Well PA4 is
(4)
The net swept volume is then given by
(5)
A quadrant pattern was selected to match the tracer production history in Well PA4, as shown in
Figure 3.13. The injection rate was adjusted to 46.5 bbls/day according to the flow fraction. And

78
the production rate of Well PA4 was set same as the injection rate to maintain material balance
in the simulation. Matching parameters include permeability, formation thickness and
dispersivities.
The fitting parameters are summarized in Table 3.4, and the matched result is presented in Figure
3.14.
3.3. Simulation of Column Test
3.3.1. Converting Surfactant Scan to Salinity Scan
To develop optimum surfactant formulation for high salinity reservoirs, the strategy is to do
phase behavior and IFT test by varying the ratio of surfactants with different hydrophilic-
lipophilic properties. Hydrophilic Lipophilic Difference (HLD) equation correlates the important
variables in the achievement of the low IFT in a W/O/S/electrolyte system, and is shown in Eq.6.
(6)
where, S = salinity, g of NaCl per 100ml brine.
ACN = number of carbon atoms in an alkane
K = slope of the logarithm of optimum salinity as a function of CAN
f(A) = function of alcohol type and concentration
= characteristic parameter of surfactant
= temperature coefficient of optimum salinity expressed in units of In S per °C
T = temperature, °C
Characteristic curvature (Cc) from HLD equation is a new parameter to quantitatively describe
the surfactant hydrophilic-lipophilic property. The HLD approaches zero when the surfactant
mixture approaches optimum.

79
Hand’s rule is the phase behavior model implemented in UTCHEM to calculate the phase
saturation and composition at different salinity by treating surfactant as a pseudo component.
There are five Hand’s rule parameters in UTCHEM to calculate the phase behavior, which are
HBNC70, HBNC71, HBNC72, CSEL7 and CSEU7. The concepts of these parameters are
summarized in Table 3.5.
Table 3.6 summarizes the HLD parameters of surfactant AF-10-41S and Steol Cs 460, which are
candidate surfactant for War Party. Figure 3.15 shows the IFT behavior of Steol Cs 460 scan
with AF-10-41S as the main surfactant at the W Site formation salinity and temperature,
indicating the system with AF-10-41S of 0.1 wt% and Steol Cs 460 of 0.2 wt% is the optimum
system. And Table 7 shows the calculation of HLD of Steol Cs 460 scan, where the HLD of the
system with AF-10-41S of 0.1 wt% and Steol Cs 460 of 0.16 wt% close to zero. This report
adjusted the of the mixture from 0.0075 to 0.006 to let the calculated HLD be consistent with
the IFT measurement.
In order to express the phase behavior and IFT at different surfactant ratio by Hand’s rule, this
report defines “optimum Cc” expressing the optimum surfactant mixture characteristic at the
reservoir salinity, and convert the Cc value of surfactant mixture to pseudo-salinity by keeping
the HLD unchanging. The optimum Cc of surfactant mixture AF-10-41S and Steol Cs 460 is -
2.06 at W Site formation condition. Table 8 shows the converted pseudo-salinity scan results and
Figure 3.16 presents the IFT behavior of pseudo-salinity scan. Hand’s rule parameters are then
obtained by matching the equilibrium IFT of pseudo-salinity scan. Figure 3.17 shows the
matched results and Table 3.5 summarizes the matched Hand’s rule parameters.
3.3.2. History Matching of Sand Pack Flooding

80
Sand pack was firstly saturated with oil, and was water flooded 3PV, followed by 1 PV of 0.75
wt% of optimum surfactant formulation, and then followed by 3 PV of water flooding. Figure
3.18 plots the cumulative oil recovery during surfactant flooding and post chemical water
flooding process for Berea sand and Ottawa sand, respectively. The porosities of Berea and
Ottawa sand pack are 0.407 and 0.381, and water flooding Sor for Berea and Ottawa sand pack
are 0.284 and 0.240.
UTCHEM uses Eq. 7 to calculate the residual oil saturation vs. capillary number,
(7)
where is trapping parameter as a matching parameter. This report uses typical values of
trapping parameters from sandstone, as shown in Table 3.9.
Relative permeability curves and adsorption were used as matching parameters. In UTCHEM,
relative permeability curves are expressing by Corey’s model, as shown in Eqs. 8 and 9,
for l = w, o, or m (8)
where the phase normalized saturation are given by
for l = w, o, or m (9)
The matched relative permeability curves parameters are summarized in Table 10, and the
matched relative permeability curves are plotted in Figures 3.19 to 3.22. The matched adsorption
for Berea and Ottawa sand pack are 5.4 mg/g and 2.5 mg/g. And the matched results of
surfactant flooding cumulative oil recovery curves for Berea and Ottawa sand pack are shown at
Figures 3.23 and 3.24.

81
Table 3.1. – Matching parameters of SWCTT simulation for SF #56 Site
Matching Parameter Pre Post
1st Layer 2nd Layer 1st Layer 2nd Layer
Tracer injection fraction 0.05 0.95 0.09 0.91
Pusher injection fraction 0.08 0.92 0.14 0.86
Back flow fraction 0.23 0.77 0.39 0.61
Reaction rate constant, s-1 4.0e-5 4.0e-5 2.4e-5 3.5e-5
Dispersion coefficient (EtF) 0.0008 0.0065 0.001 0.04
Dispersion coefficient (EOH) 0 0.003 0 0.04
Residual Oil Saturation 0.49 0.22 0.15 0.15
Table 3.2. – Matching parameters of SWCTT simulation for H Site
Matching Parameter Pre Post
1st Layer 2nd Layer 1st Layer 2nd Layer
Tracer injection fraction 0.45 0.55 0.39 0.61
Pusher injection fraction 0.41 0.59 0.69 0.31
Back flow fraction 0.63 0.37 0.82 0.18
Reaction rate constant, s-1 7.0e-5 7.0e-5 4.5e-5 4.5e-5
Dispersion coefficient (EtF) 0.05 0.02 0.01 0.01
Dispersion coefficient (EOH) 0.04 0.03 0.012 0.015
Residual Oil Saturation 0.20 0.12 0.03 0.03
Table 3.3. – Matching parameters of SWCTT simulation for W Site
Matching Parameter Pre Post
Simulation Simulation
Porosity 0.3 0.27
Reaction Rate (s-1) 9.50E-05 6.60E-05
Residual Oil Saturation 0.11 0.03
Dispersion coefficient (EtF) 0.009 0.013
Dispersion coefficient (EOH) 0.009 0.03
Tracer Injection Rate, m3/day 12.5 13
Pusher Injection Rate, m3/day 27.5 19
Production Rate, m3/day 24.65 22
Table 3.4. – Matching parameters of interwell tracer test for Well PA4 at SK site
Matching Parameter Permeability, mD Formation
Thickness, ft Longitude
Dispersivity, ft Transverse
Dispersivity, ft
Value 393 4 8 0.4
Table 3.5. – Hand’s rule parameters for W Site formulation

82
Hand’s rule parameter
Value Note
HBNC70 0.0700 Maximum height of binodal curve of added surfactant at zero salinity
HBNC71 0.0650 Maximum height of binodal curve of added surfactant at optimal salinity
HBNC72 0.0900 Maximum height of binodal curve of added surfactant at twice optimal salinity
CSEL7, meq/ml 4.1600 Lower effective salinity limit for type III phase region for added surfactant
CSEU7, meq/ml 5.0000 Upper effective salinity limit for type III phase region for added surfactant
Table 3.6. – HLD parameters of two surfactants
Surfactants Cc Value K value Molecular Weight
AF - 10-41s -1.34 0.062 537.37 0.005
Steol Cs 460 -2.36 0.17 441 0.01
Table 3.7. – HLD calculation of Steol Cs 460 scan
AF 10-41S Steol Cs 460 Cc-mix K-mix -mix Ln(S) EACN HLD
0.1 0.14 -1.98305 0.116 0.0075 3.288402 9.2 27 0.035651
0.1 0.16 -2.0142 0.116 0.0075 3.288402 9.2 27 0.004507
0.1 0.18 -2.04059 0.116 0.0075 3.288402 9.2 27 -0.02188
0.1 0.2 -2.06323 0.116 0.0075 3.288402 9.2 27 -0.04453
0.1 0.22 -2.08288 0.116 0.0075 3.288402 9.2 27 -0.06418
0.1 0.24 -2.10009 0.116 0.0075 3.288402 9.2 27 -0.08139
0.1 0.26 -2.11529 0.116 0.0075 3.288402 9.2 27 -0.09659
Table 3.8. – HLD calculation of pseudo-salinity scan
AF 10-41S Steol Cs 460 Cc-mix K-mix -mix Ln(S) EACN HLD
0.1 0.2 -2.06323 0.1135 0.006 3.341585 9.2 27 0.072151
0.1 0.2 -2.06323 0.1135 0.006 3.310441 9.2 27 0.041007
0.1 0.2 -2.06323 0.1135 0.006 3.28405 9.2 27 0.014616
0.1 0.2 -2.06323 0.1135 0.006 3.261402 9.2 27 -0.00803
0.1 0.2 -2.06323 0.1135 0.006 3.241753 9.2 27 -0.02768
0.1 0.2 -2.06323 0.1135 0.006 3.224544 9.2 27 -0.04489
0.1 0.2 -2.06323 0.1135 0.006 3.209348 9.2 27 -0.06009
Table 3.9. – Parameters for capillary desaturation curve
Phase Trapping Parameter
water 2000
oil 8000
microemulsion 1000
Table 3.10. – Matched parameters for relative permeability curves
Parameter Value
Note Berea Ottawa
S1RW 0.33 0.4 Residual saturation of aqueous phase displaced by oil at low capillary number
for entire reservoir
S2RW 0.30 0.26 Residual saturation of oleic phase displaced by water at low capillary number

83
for entire reservoir
S3RW 0.3 0.40 Residual saturation of microemulsion phase displaced by water at low
capillary number for entire reservoir
P1RW 0.3 0.20 End point relative permeability of water at low capillary number for entire
reservoir
P2RW 0.95 0.95 End point relative permeability of oil at low capillary number for entire
reservoir
P3RW 0.4 0.4 End point relative permeability of microemulsion at low capillary number for
entire reservoir
E1W 12 12 Phase relative permeability exponent for aqueous phase at low capillary
number for entire reservoir
E2W 1.5 1.5 Phase relative permeability exponent for oleic phase at low capillary number
for entire reservoir
E3W 4 1.5 Phase relative permeability exponent for microemulsion phase at low
capillary number for entire reservoir
S1RC 0 0 Residual saturation of aqueous phase displaced by oil at low capillary number
for entire reservoir
S2RC 0 0 Residual saturation of oleic phase displaced by water at low capillary number
for entire reservoir
E3RC 0 0 Residual saturation of microemulsion phase displaced by water at low
capillary number for entire reservoir
P1RC 1 1 End point relative permeability of water at low capillary number for entire
reservoir
P2RC 1 1 End point relative permeability of oil at low capillary number for entire
reservoir
P3RC 1 1 End point relative permeability of microemulsion at low capillary number for
entire reservoir
E1C 1 1 Phase relative permeability exponent for aqueous phase at low capillary
number for entire reservoir
E2C 1 1 Phase relative permeability exponent for oleic phase at low capillary number
for entire reservoir
E3C 1 1 Phase relative permeability exponent for microemulsion phase at low
capillary number for entire reservoir

84
Figure 3.1. – Pre-SWCTT interpretation for SF #56
Figure 3.2. – Post-SWCTT interpretation for SF #56
0
100
200
300
400
500
600
700
800
900
0 100 200 300 400 500
pp
m
Cumulative water (bbl)
EtF_Field
EtF_Total
EtF_1st Layer
EtF_2nd Layer
EOH_Field
EOH_Total
EOH_1st Layer
EOH_2nd Layer
0
100
200
300
400
500
600
700
0 100 200 300 400 500
pp
m
Cumulative water (bbl)
EtF_Field
EtF_Total
EtF_1st Layer
EtF_2nd Layer
EOH_Field
EOH_Total
EOH_1st Layer
EOH_2nd Layer

85
Figure 3.3. – Pre-SWCTT interpretation for H Site
Figure 3.4. – Post-SWCTT interpretation for H Site
0
50
100
150
200
250
300
350
400
0 50 100 150 200 250 300 350 400
Co
nce
ntr
atio
n, p
pm
Volume, bbl
EtF_Field
EtF_Total
EtF_1st Layer
EtF_2nd Layer
EOH_Field
EOH_Total
EOH_1st Layer
EOH_2nd Layer
0
100
200
300
400
500
600
0 50 100 150 200
Co
nce
ntr
atio
n, p
pm
Volume, bbl
EtF_Field
EtF_Total
EtF_1st Layer
EtF_2nd Layer
EOH_Field
EOH_Total
EOH_1st Layer
EOH_2nd Layer
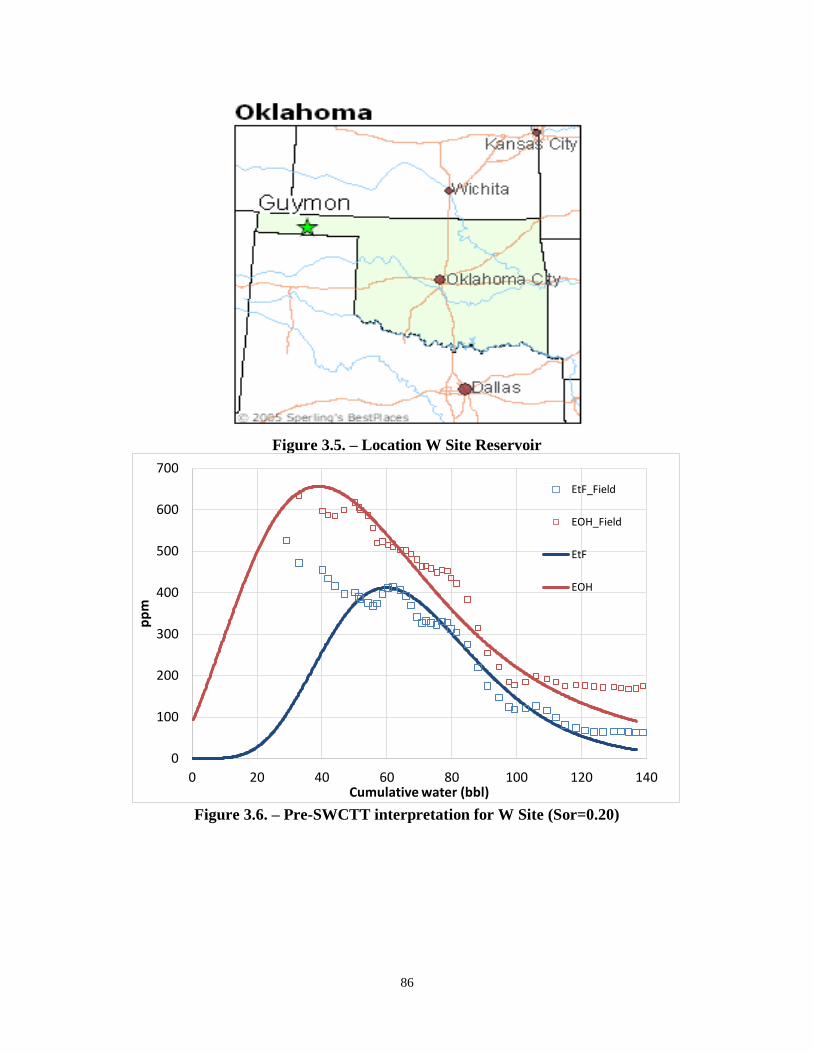
86
Figure 3.5. – Location W Site Reservoir
Figure 3.6. – Pre-SWCTT interpretation for W Site (Sor=0.20)
0
100
200
300
400
500
600
700
0 20 40 60 80 100 120 140
pp
m
Cumulative water (bbl)
EtF_Field
EOH_Field
EtF
EOH
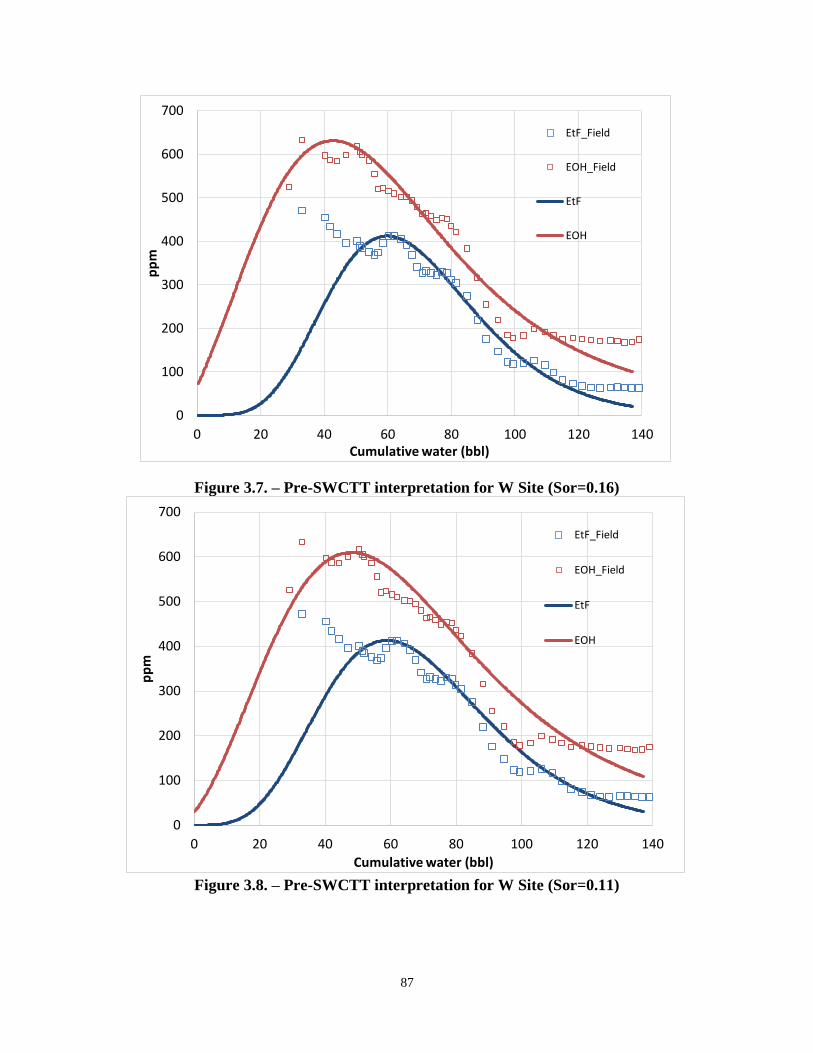
87
Figure 3.7. – Pre-SWCTT interpretation for W Site (Sor=0.16)
Figure 3.8. – Pre-SWCTT interpretation for W Site (Sor=0.11)
0
100
200
300
400
500
600
700
0 20 40 60 80 100 120 140
pp
m
Cumulative water (bbl)
EtF_Field
EOH_Field
EtF
EOH
0
100
200
300
400
500
600
700
0 20 40 60 80 100 120 140
pp
m
Cumulative water (bbl)
EtF_Field
EOH_Field
EtF
EOH
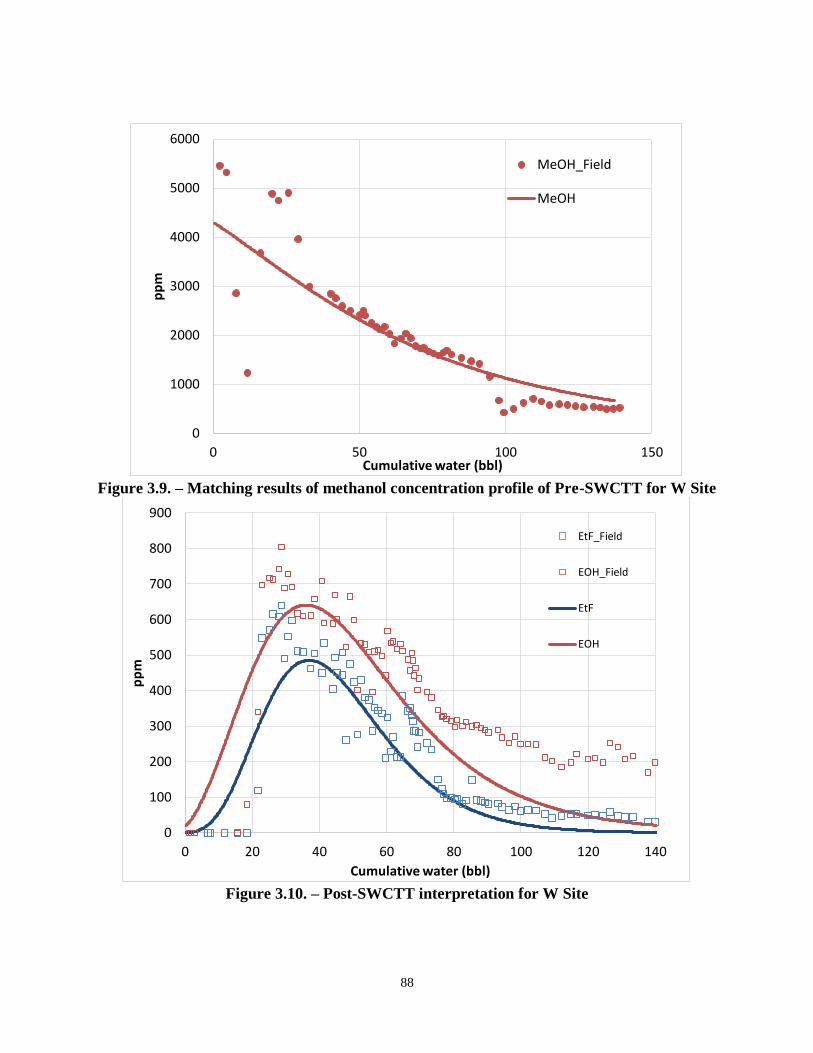
88
Figure 3.9. – Matching results of methanol concentration profile of Pre-SWCTT for W Site
Figure 3.10. – Post-SWCTT interpretation for W Site
0
1000
2000
3000
4000
5000
6000
0 50 100 150
pp
m
Cumulative water (bbl)
MeOH_Field
MeOH
0
100
200
300
400
500
600
700
800
900
0 20 40 60 80 100 120 140
pp
m
Cumulative water (bbl)
EtF_Field
EOH_Field
EtF
EOH
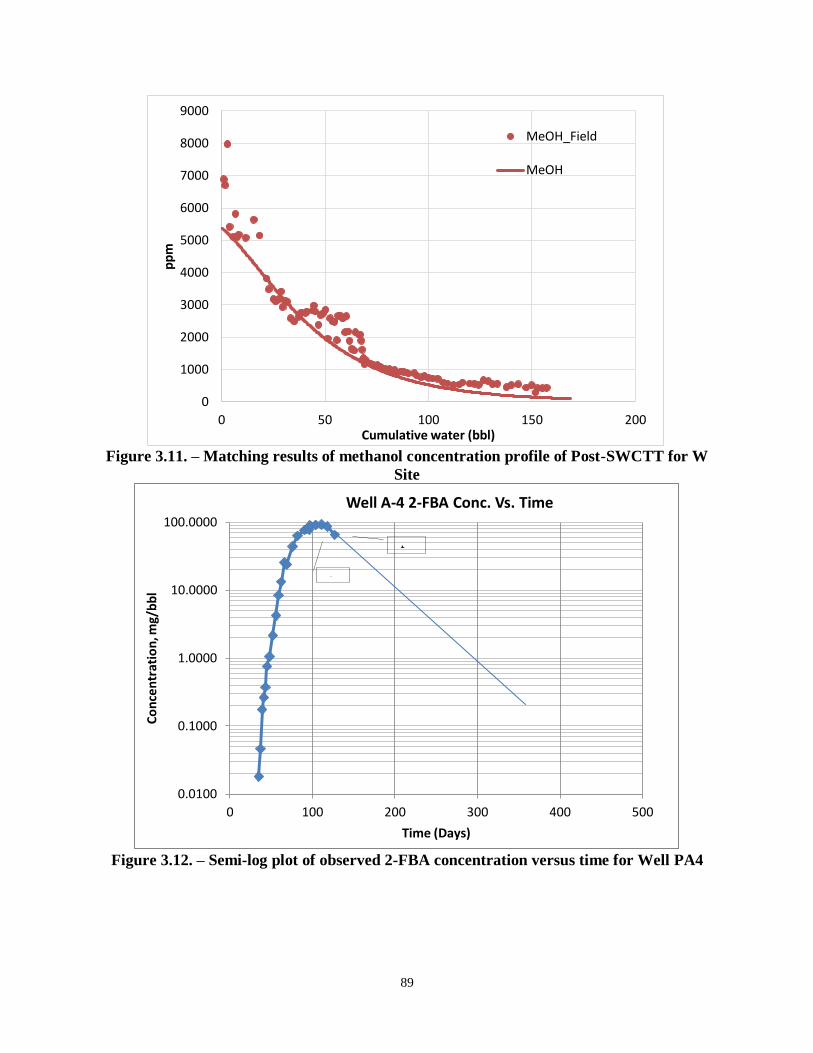
89
Figure 3.11. – Matching results of methanol concentration profile of Post-SWCTT for W
Site
Figure 3.12. – Semi-log plot of observed 2-FBA concentration versus time for Well PA4
0
1000
2000
3000
4000
5000
6000
7000
8000
9000
0 50 100 150 200
pp
m
Cumulative water (bbl)
MeOH_Field
MeOH
0.0100
0.1000
1.0000
10.0000
100.0000
0 100 200 300 400 500
Co
nce
ntr
atio
n, m
g/b
bl
Time (Days)
Well A-4 2-FBA Conc. Vs. Time
t, C
tb,
Cb
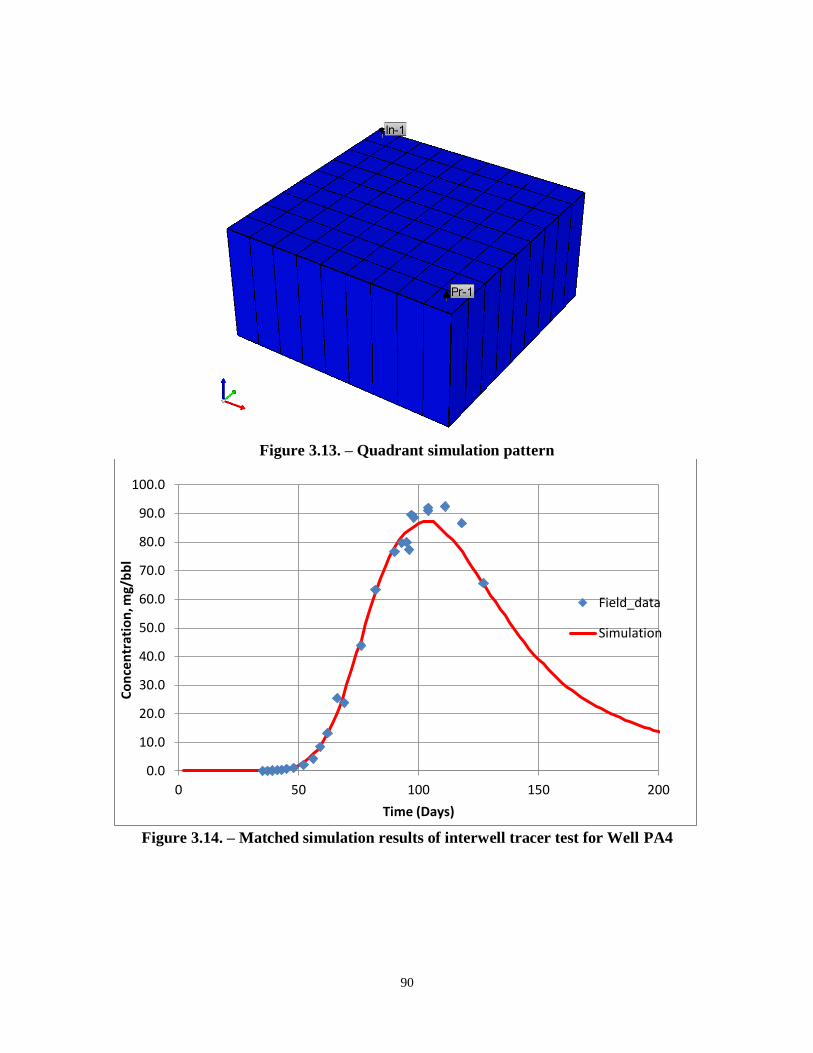
90
Figure 3.13. – Quadrant simulation pattern
Figure 3.14. – Matched simulation results of interwell tracer test for Well PA4
0.0
10.0
20.0
30.0
40.0
50.0
60.0
70.0
80.0
90.0
100.0
0 50 100 150 200
Co
nce
ntr
atio
n, m
g/b
bl
Time (Days)
Field_data
Simulation

91
Figure 3.15. – IFT behavior of Steol CS 460 with AF-10-41s as main surfactant
Figure 3.16. – IFT behavior of pseudo-salinity and HLD scan
1.E-03
1.E-02
1.E-01
0.05 0.1 0.15 0.2 0.25 0.3
IFT,
mN
/m
Steol Cs 460, wt%
AF 10-41s
-0.09 -0.07 -0.05 -0.03 -0.01 0.01 0.03 0.05 0.07 0.09
1.E-03
1.E-02
1.E-01
24.00 25.00 26.00 27.00 28.00 29.00
HLD
IFT,
mN
/m
Sanility, wt%
Pseudo-salinity
HLD

92
Figure 3.17. – IFT behavior matching by Hand’s rule parameters
Figure 3.18. – Cumulative oil recovery of surfactant flooding
0.0001
0.001
0.01
0.1
25 25.5 26 26.5 27 27.5 28 28.5 29 29.5
IFT,
mN
/m
TDS, wt%
Experiment UTCHEM-IFT-OM UTCHEM-IFT-WM
0%
20%
40%
60%
80%
4 5 6 7 8
Cu
mu
lati
ve O
il R
eco
very
, %
PV
Brea, AF 10-41s Ottowa, AF 10-41s

93
Figure 3.19. – Matched relative permeability curves for Berea sand pack flooding at low
capillary number
Figure 3.20. – Matched relative permeability curves for Berea sand pack flooding at high
capillary number
0
0.1
0.2
0.3
0.4
0.5
0.6
0.7
0.8
0.9
1
0 0.2 0.4 0.6 0.8 1
Rela
tive P
erm
eabili
ty
Water Saturation
Water
OIL
0
0.1
0.2
0.3
0.4
0.5
0.6
0.7
0.8
0.9
1
0.0 0.2 0.4 0.6 0.8 1.0
Rela
tive
Pe
rme
ab
ility
Water Saturation
Water
Oil

94
Figure 3.21. – Matched relative permeability curves for Ottawa sand pack flooding at low
capillary number
Figure 3.22. – Matched relative permeability curves for Ottawa sand pack flooding at high
capillary number
0
0.1
0.2
0.3
0.4
0.5
0.6
0.7
0.8
0.9
1
0.0 0.2 0.4 0.6 0.8 1.0
Re
lative
Pe
rme
ab
ility
Water Saturation
Water
Oil

95
Figure 3.23. – Matched cumulative recovery of Brea sand pack surfactant flooding
Figure 3.24. – Matched cumulative recovery of Ottawa sand pack surfactant flooding
0
0.5
1
1.5
2
2.5
3
0 1 2 3 4 5
oil
reco
vere
d, m
l
PV
Experiment
Simulation
0
0.5
1
1.5
2
2.5
3
3.5
4
4.5
5
1 2 3 4
oil
reco
vere
d, m
l
PV
Experiment
Simulation

96
Chapter 4. Conclusions & Recommendations
We have accomplished the key tasks as listed below in this endeavor:
1. Several potential binary and ternary surfactant-only formulations are successfully developed
for high salinity formations in this study based on batch and sand-packed column experiments,
2. For tight formation, injection of polymer slug created some technical challenges to achieve
high oil recovery (< 40% oil recovered in the column), thus we successfully remove polymer (s)
from the surfactant formulations,
3. The newly developed surfactant-only system and formulations (between 0.5 to 0.75 total wt%)
were tested in multiple single-well locations and interwell pilot test to verify their performance,
4. Pre- and post-chemical flood tracer tests were used to assess the residual saturation and the
performance of oil recovery by surfactant injection,
5. Developed numerical simulation approaches and completed the effort in numerical
interpretation for multiple sites and tracer tests,
a. Single Well Chemical Tracer Test (SWCTT) – 5 sites,
b. Interwell tracer test (IWTT) – 1 site,
c. Simulation of laboratory column test and core flood experiments – a variety of mimic
reservoir conditions
6. Developed and completed geochemical study of crude oil-composition analyses, including
a. crude SARA fraction analysis,
b. fingerprints analysis,
In addition, we also completed petrophysical study of reservoir sandstones using tool such as the
Nuclear Magnetic Resonance spectroscopy (NMR) method to investigate Berea sandstone.
7. On the technical transfer, we have made multiple RPSEA workshop presentations (e.g., KS,
TX, CA, IN). In additional, we presented technical papers at national conferences (ACS, SPE).

97
We also submitted several paper abstracts to national conferences (AOCS, AIChE). We also
published two journal papers and several papers are in submission stage.
The following are the significant findings of this study:
1. Applying fundamental theory (Hydrophilic-Lipophilic Difference, HLD, and concept)
can significantly reduce surfactant screening time when compared to the conventional
method.
2. The developed binary and ternary surfactant-only system can markedly improve recovery
of common crude and viscous oil (e.g., 23 cp @ 50 0C) as confirmed in laboratory sand-
pack and core flood experiments. There was exceptional correspondence between
performance of the surfactant formulations between sand packs, core floods, and single
well tests, which raises the issue of the necessity of performing the core floods prior to
performing a single well test.
3. Results of multiple field single-well tests indicate significant trapped oil (> 90%
reduction of Sor) can be mobilized from the target zone at various reservoir conditions
and even tight formation (i.e, permeability of 15 mD).
4. Field pilot multi-wells test (Sept. 2013 – Sept., 2014) indicated that significant surfactant
losses (likely due to adsorption) might interfere the field data interpretation and recovery
performance. This indicates the need for development of a reliable field-scale adsorption
test, as adsorption is the controlling variable in the economics of surfactant-only chemical
flooding.
5. In simulation efforts, due to the complex field test processes and geological uncertainties,
numerical simulation method was used to interpret the field test results. Popular reservoir
simulator CMG STARS as well as UTChem were selected to model the SWCTT because

98
of good computational capabilities and chemical reaction features. The HLD method was
adopted to modify UTChem for surfactant-only flooding without use of a salinity
gradient.
6. Based on the resulting matching profiles of pre-SWCTT and post-SWCTT Sor at
multiple reservoirs and locations, we successfully exhibited good surfactant flooding
efficiency under various reservoir locations.
7. Based on fingering effort, we observed that crude oil fractions could have impact on the
interfacial tensions (IFTs), which is the most critical parameter of EOR.
8. Asphaltenes from different crude oils contain various components, which indicate these
crudes may come from different original materials and reservoir conditions.
Recommendations of future work:
1. Field pilot multi-wells test: additional sites would be selected and screened for
potential surfactant flooding. And more pilot tests are anticipated in next twelve to
twenty four months (2016-17) based on the encouraging results of multiple single-well
tests and some challenging tasks we met and lessons learned from the first field pilot
interwell test.
2. Streamline the design protocols for field pilot test based on the conclusions of this
RPSEA effort. Use of the HLD equation and concept greatly reduces formulation
efforts and sand pack performance is an excellent surrogate for performance in the
single well test; in general oil mobilization in the single well test exceeded that in the
sand pack tests.

99
3. Modify the single well test to measure surfactant retention by the reservoir rock.
Surfactant adsorption should now be considered the most important remaining barrier
to commercialization of surfactant-only cEOR.
4. Examine various approaches to reduction of surfactant adsorption, beyond possible
modification of the structure of the surfactant. The use of sacrificial agents, including
polyelectrolytes and nanocarriers should be a focus of future surfactant-only chemical
flooding EOR research.
Acknowledgments
The project is funded by Research Partnership to Secure Energy for America (RPSEA). Midcon
Energy III and Chemical Flooding Technologies, LLC provided many assistances for the field
single-well test.
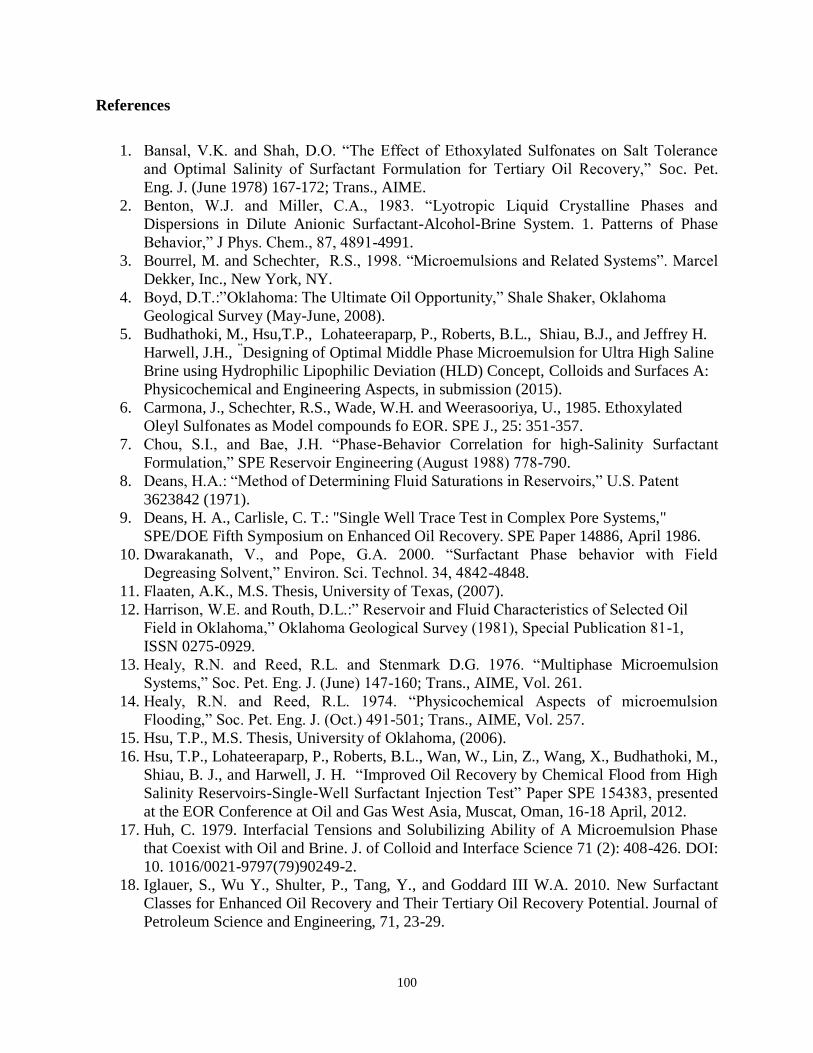
100
References
1. Bansal, V.K. and Shah, D.O. “The Effect of Ethoxylated Sulfonates on Salt Tolerance
and Optimal Salinity of Surfactant Formulation for Tertiary Oil Recovery,” Soc. Pet.
Eng. J. (June 1978) 167-172; Trans., AIME.
2. Benton, W.J. and Miller, C.A., 1983. “Lyotropic Liquid Crystalline Phases and
Dispersions in Dilute Anionic Surfactant-Alcohol-Brine System. 1. Patterns of Phase
Behavior,” J Phys. Chem., 87, 4891-4991.
3. Bourrel, M. and Schechter, R.S., 1998. “Microemulsions and Related Systems”. Marcel
Dekker, Inc., New York, NY.
4. Boyd, D.T.:”Oklahoma: The Ultimate Oil Opportunity,” Shale Shaker, Oklahoma
Geological Survey (May-June, 2008).
5. Budhathoki, M., Hsu,T.P., Lohateeraparp, P., Roberts, B.L., Shiau, B.J., and Jeffrey H.
Harwell, J.H., “
Designing of Optimal Middle Phase Microemulsion for Ultra High Saline
Brine using Hydrophilic Lipophilic Deviation (HLD) Concept, Colloids and Surfaces A:
Physicochemical and Engineering Aspects, in submission (2015).
6. Carmona, J., Schechter, R.S., Wade, W.H. and Weerasooriya, U., 1985. Ethoxylated
Oleyl Sulfonates as Model compounds fo EOR. SPE J., 25: 351-357.
7. Chou, S.I., and Bae, J.H. “Phase-Behavior Correlation for high-Salinity Surfactant
Formulation,” SPE Reservoir Engineering (August 1988) 778-790.
8. Deans, H.A.: “Method of Determining Fluid Saturations in Reservoirs,” U.S. Patent
3623842 (1971).
9. Deans, H. A., Carlisle, C. T.: "Single Well Trace Test in Complex Pore Systems,"
SPE/DOE Fifth Symposium on Enhanced Oil Recovery. SPE Paper 14886, April 1986.
10. Dwarakanath, V., and Pope, G.A. 2000. “Surfactant Phase behavior with Field
Degreasing Solvent,” Environ. Sci. Technol. 34, 4842-4848.
11. Flaaten, A.K., M.S. Thesis, University of Texas, (2007).
12. Harrison, W.E. and Routh, D.L.:” Reservoir and Fluid Characteristics of Selected Oil
Field in Oklahoma,” Oklahoma Geological Survey (1981), Special Publication 81-1,
ISSN 0275-0929.
13. Healy, R.N. and Reed, R.L. and Stenmark D.G. 1976. “Multiphase Microemulsion
Systems,” Soc. Pet. Eng. J. (June) 147-160; Trans., AIME, Vol. 261.
14. Healy, R.N. and Reed, R.L. 1974. “Physicochemical Aspects of microemulsion
Flooding,” Soc. Pet. Eng. J. (Oct.) 491-501; Trans., AIME, Vol. 257.
15. Hsu, T.P., M.S. Thesis, University of Oklahoma, (2006).
16. Hsu, T.P., Lohateeraparp, P., Roberts, B.L., Wan, W., Lin, Z., Wang, X., Budhathoki, M.,
Shiau, B. J., and Harwell, J. H. “Improved Oil Recovery by Chemical Flood from High
Salinity Reservoirs-Single-Well Surfactant Injection Test” Paper SPE 154383, presented
at the EOR Conference at Oil and Gas West Asia, Muscat, Oman, 16-18 April, 2012.
17. Huh, C. 1979. Interfacial Tensions and Solubilizing Ability of A Microemulsion Phase
that Coexist with Oil and Brine. J. of Colloid and Interface Science 71 (2): 408-426. DOI:
10. 1016/0021-9797(79)90249-2.
18. Iglauer, S., Wu Y., Shulter, P., Tang, Y., and Goddard III W.A. 2010. New Surfactant
Classes for Enhanced Oil Recovery and Their Tertiary Oil Recovery Potential. Journal of
Petroleum Science and Engineering, 71, 23-29.

101
19. Jin, L.C., Jamili, A., Li, Z.T., Lu, J., Luo, H.S., Shiau, B.J., Delshad, M., Harwell, J.H.,
“Physics based HLD-NAC Phase Behavior Model for Surfactant/Crude Oil/Brine
Systems,” Journal of Petroleum Science and Engineering, in submission (2015b).
20. Jin, L.C., Jamili, A., Harwell, J.H., Shiau, B.J., Roller, C., “Modeling and Interpretation
of Single Well Chemical Tracer Tests (SWCTT) for pre and post Chemical EOR in two
High Salinity Reservoirs”, SPE-173618-MS, SPE Production and Operations
Symposium, 1-5 March, Oklahoma City, Oklahoma, USA (2015a).
21. Khariy, H., Harith, Z. T. Petroleum Science and Technology 31 (2013) 516-529.
22. Kleinberg, R.L., Farooqui, S.A., Horsefield, M.A., J. Colloid Interface Science 158
(1993) 195-198.
23. Levitt, D.B., M.S. Thesis, University of Texas, (2006).
24. Levitt, D.B., Jackson A.C., Heinson C., Britton L.N., Malik T., Dwarakanath V., and
Pope G.A. 2009. The Identification and Evaluation of High-Performance EOR
Surfactants, SPE Rese. Eval. Eng. 12(2), 243-253.
25. Liao, Z., Geng, A., Organic Geochemistry 33 (2002) 1477-1486.
26. Liu, S., Zhang D.L., Yan W., Peurto M., Hirasaki G.J., and Miller C.A. 2008. Favorable
Attributers of Alkali-Surfactant-Polymer Flooding, SPE 13(1), 5-16.
27. Nelson, R.C. and Pope, G.A. 1978. Phase Relationship in Chemical Flooding, SPE J.
18(5): 325-338: Trans., AIME, 265. SPE-6773-PA. DOI: 102118/6733-PA.
28. Norohna, J.C. and Shah, D.O., 1982. Ultra-low IFT, Phase Behavior and Microstructure
in Oil/Brine/Surfactant/alcohol System. AICHE. Symp., Ser. 212 (78): 42-57.
29. Novosad, J., Maini, B., and Batycky, J. “A Study of Surfactant Flooding at High Salinity
and Hardness”, JAOCS, 59 (10), 1982, p. 833A-839A.
30. Pithapurwala, Y.K., Sharma, A.K., and Shah, D.O. “Effect of Salinity and Alcohol
Partitioning on Phase Behavior and Oil Displacement Efficiency in Surfactant-Polymer
Flooding”, JAOCS, 63(6), 1986, p. 804-813.
31. Pope, G.A., Wang, B., and Tsaur, K. 1979. A Sensitivity Study of Micellar/Polymer
Flooding. PSE j. 19 (6): 357-368. SPE-7079-PA. DOI: 102118/7079-PA.
32. Pope, G.A., Weerasooriya, S., and Liyenage, P.J. 2010. A New Process of Manufacturing
and Stabilizing High-Performance EOR Surfactants at Low Cost for High-Temperature,
High-Salinity Oil Reservoirs, Paper SPE 129923, presented at the Symposium on
Improved Oil Recovery Tulsa, Oklahoma, April.
33. Puerto, M., Hirasaki, G.J., Miller, C.A., and Barnes J.R. 2010. Surfactant Systems for
EOR in High-Temperature, High-Salinity Environments. Paper SPE 129675, presented at
the Symposium on Improved Oil Recovery Tulsa, Oklahoma, 24-28 April.
34. Rosen, M.J., Wang, H., Shen, P., and Zhu, Y. 2005. “Ultralow Interfacial Tension for
Enhanced oil Recovery at Very Low Surfactant Concentrations,” Langmuir, 21, 3749-
3756.
35. Sanz, C.A. and Pope, G.A. 1995. “Alcohol-Free Chemical Flooding From Surfactant
Screening to Coreflood Design,” SPE 28956, Proceeding of the SPE International
Symposium on Oilfield Chemistry, San Antonio, TX, February 14-17.
36. Shah, D.O. and Schechter, R.S., 1977. Improved Oil Recovery by Surfactant and Polymer
Flooding. Acadermic Press, New York, NY.
37. Sheely, C.Q. Jr. and Baldwin, D.E. Jr.: “Single Well Tracer Method to Evaluate
Enhanced Recovery,” U.S. Patent No. 4,099,565 (July 11, 1978).
102
38. Shiau, B.J., “In-situ Surfactant and Chemical Oxidation Flushing for Complete
Remediation of Contaminants and Method of Using Same.” U.S. Patent 7,021,863, April
14, 2006.
39. Shiau, B.J., “In-situ Surfactant and Chemical Oxidation Flushing for Complete
Remediation of Contaminants and Method of Using Same.” U.S. Patent 6,913,419, July
5, 2005.
40. Shiau, B.J., Hsu, T.P., Robert, B.L., and Harwell, J.H., 2010b. “Improved Chemical
Flood Efficiency by In Situ CO2 Generation”, Paper SPE 129893, presented at the
Symposium on Improved Oil Recovery Tulsa, Oklahoma, 24-28 April.
41. Shiau, B. J., Hsu, T.P., Lohateeraparp, P., Wan, W., Lin, Z.X. Roberts, B.L., and
Harwell, J.H. 2012. “Improved Oil Recovery by Chemical Flood from High Salinity
Reservoirs,” SPE 154260, presented at the SPE Improved Oil Recovery Symposium,
Tulsa, Oklahoma, 14–18 April.
42. Shiau, B.J., Sabatini, D.A., and Harwell, J.H., 1995. “Properties of Food Grade (Ediable)
Surfactants Affecting Subsurface Remediation of Chlorinated Solvents.” Environmental
Science and Technology, Vol. 29, No. 12. Pp.2929-2935.
43. Smith, D.H., 1986. “Tricritical Points and the Design of High-Salinity Surfactant for
Low-Tension Enhanced Oil Recovery.” Paper SPE/DOE 14914, presented at the
SPE/DOE Fifth Symposium on Enhanced Oil Recovery Tulsa, Oklahoma, 20-23 April.
44. Standard Method for Testing Petroleum and its Products, Institute of Petroleum (12th
Edition).
45. Tomich, J.F., Dalton Jr.,R.L., Deans, H.A. and Shallenberger, L.K.: ”Single-Well Tracer
Method to Measure Residual Oil Saturation,” JPT (Feb. 1973), pp 211-218.
46. Wan, W., Harwell, J.H., Shiau, B.J., “Characterization of Crude Oil Equivalent Alkane
Carbon Number (EACN) for Surfactant Flooding Design,” Journal of Dispersion Science
and Technology, (2014).
47. Weston, J.W., Harwell, J.H., Shiau, B.J., Kabir, M.,” Disrupting Admicelle Formation
and Preventing Surfactant, Adsorption on Metal Oxide Surfaces Using Sacrificial
Polyelectrolytes dx.doi.org/10.1021/la501074x, Langmuir 2014, 30, 6384−6388.
48. Winsor, P.A. 1954. Solvent Properties of Amphiphilic Compounds. Landon:
Butterworth’s Scientific Publications.
49. Wu, B., Cheng, H., Childs, J.D., and Sabatini, D.A. “Surfactant-enhanced Removal of
hydrophobic Oils from Source Zones”, Physicochemical Groundwater Remediation,
2002, Ch11, 245-249.
50. Yao, Y., Liu, D., Che, Y., Tang, D., Huang, W., Fuel 89 (2010) 1371-1380.
51. Zaitoun, A., Fonseca, C., Berger, P., Bazin, B., and Monin, N. 2003. New Surfactant for
Chemical Flood in High-Salinity Reservoir. Paper SPE 80237, presented at the
International Symposium on Oilfield Chemistry Houston, Texas, 5-7 February.


![Ternary Logic Gates and Ternary SRAM Cell ….pdf · According to blueprint of Weste & Harris in [4] for design of a binary SRAM, a ternary SRAM is constructed similarly. A ternary](https://static.fdocuments.in/doc/165x107/5a8290bb7f8b9aa24f8e2227/ternary-logic-gates-and-ternary-sram-cell-pdfaccording-to-blueprint-of-weste.jpg)