Final Report SERDP ER-1747 Gschwend 150701dReference herein to any specific commercial product,...
39
FINAL REPORT Robust Means for Estimating Black Carbon-Water Sorption Coefficients of Organic Contaminants in Sediments SERDP Project ER-1747 JULY 2015 Philip M. Gschwend Massachusetts Institute of Technology Distribution Statement A
Transcript of Final Report SERDP ER-1747 Gschwend 150701dReference herein to any specific commercial product,...

FINAL REPORT Robust Means for Estimating Black Carbon-Water Sorption
Coefficients of Organic Contaminants in Sediments
SERDP Project ER-1747
JULY 2015
Philip M. GschwendMassachusetts Institute of Technology
Distribution Statement A

This report was prepared under contract to the Department of Defense Strategic Environmental Research and Development Program (SERDP). The publication of this report does not indicate endorsement by the Department of Defense, nor should the contents be construed as reflecting the official policy or position of the Department of Defense. Reference herein to any specific commercial product, process, or service by trade name, trademark, manufacturer, or otherwise, does not necessarily constitute or imply its endorsement, recommendation, or favoring by the Department of Defense.

REPORT DOCUMENTATION PAGE
Standard Form 298 (Rev. 8/98) Prescribed by ANSI Std. Z39.18
Form Approved OMB No. 0704-0188
The public reporting burden for this collection of information is estimated to average 1 hour per response, including the time for reviewing instructions, searching existing data sources, gathering and maintaining the data needed, and completing and reviewing the collection of information. Send comments regarding this burden estimate or any other aspect of this collection of information, including suggestions for reducing the burden, to Department of Defense, Washington Headquarters Services, Directorate for Information Operations and Reports (0704-0188), 1215 Jefferson Davis Highway, Suite 1204, Arlington, VA 22202-4302. Respondents should be aware that notwithstanding any other provision of law, no person shall be subject to any penalty for failing to comply with a collection of information if it does not display a currently valid OMB control number. PLEASE DO NOT RETURN YOUR FORM TO THE ABOVE ADDRESS.
1. REPORT DATE (DD-MM-YYYY) 2. REPORT TYPE 3. DATES COVERED (From - To)
4. TITLE AND SUBTITLE 5a. CONTRACT NUMBER
5b. GRANT NUMBER
5c. PROGRAM ELEMENT NUMBER
5d. PROJECT NUMBER
5e. TASK NUMBER
5f. WORK UNIT NUMBER
6. AUTHOR(S)
7. PERFORMING ORGANIZATION NAME(S) AND ADDRESS(ES) 8. PERFORMING ORGANIZATION REPORT NUMBER
10. SPONSOR/MONITOR'S ACRONYM(S)
11. SPONSOR/MONITOR'S REPORT NUMBER(S)
9. SPONSORING/MONITORING AGENCY NAME(S) AND ADDRESS(ES)
12. DISTRIBUTION/AVAILABILITY STATEMENT
13. SUPPLEMENTARY NOTES
14. ABSTRACT
15. SUBJECT TERMS
16. SECURITY CLASSIFICATION OF:a. REPORT b. ABSTRACT c. THIS PAGE
17. LIMITATION OF ABSTRACT
18. NUMBER OF PAGES
19a. NAME OF RESPONSIBLE PERSON
19b. TELEPHONE NUMBER (Include area code)
07/01/2015 Technical December 2009 - June 2015
Robust Means for Estimating Black Carbon-Water Sorption Coefficients of Organic Contaminants in Sediments
Gschwend, Philip M.
Massachusetts Institute of Technology 15 Vassar Street Ralph M. Parsons Laboratory Bldg 48, Room 216G, Cambridge, MA 02139
ER-1747
Strategic Environmental Research and Development Program 4800 Mark Center Drive, Suite 17D08 Alexandria, VA 22350-3605
W912HQ-10-C-0005
ER-1747
SERDP
Approved for public release; distribution is unlimited.
The overarching objective of this project is to improve the fundamental understanding of organic chemical sorption to BCs in sediments while providing a practical means for evaluating this interaction quantitatively. This can be done by elucidating the polyparameter linear free energy relationship (ppLFER) parameters needed to evaluate HOC partitioning between aqueous solution and the water-wet surfaces of BCs, i.e., the compounds' KBC and Freundlich n values, for any compound of interest.
37
Philip M. Gschwend
617-253-1638

i
Table of Contents page
List of Tables iii
List of Figures iii
List of Acronyms, Abbreviations, and Symbols iv
Keywords iv
Acknowledgments iv
Abstract 1
1. Objective 3
2. Background 3
2.1 Current Practice Using focKoc to Estimate Kd. 3
2.2 The Polyparameter LFER (ppLFER) Approach for Estimating Kd Values. 5
3. Materials and Methods 6
3.1 Chemical Sorbates. 6
3.2 Black Carbon Sorbents. 6
3.3 Batch Equilibration Experiments Using A Wood Char. 6
3.4 Frontal Analysis Testing Using Diesel Soot. 7
3.5 Sorption Data Analysis. 7
4. Results and Discussion 8
4.1 Sorption Kinetics to Wood Char. 8
4.2 Sorption Isotherms to Wood Char. 8
4.3 Polyparameter Linear Free Energy Relationship for Sorption to Wood Char. 8
4.4 Testing the Method Robustness of Frontal Analysis to Assess Sorption to Soot. 10
4.5 Sorption Isotherms to Diesel Soot. 12
4.6 Polyparameter Linear Free Energy Relationship for Sorption to Soot 13

ii
5. Discussion 14
5.1 Advantages of Frontal Analysis for Sorption Testing. 14
5.2 Comparison of Freundlich Isotherm Parameters among Black Carbons. 15
5.3 Intermolecular Interaction Interpretations Based on the ppLFER Model Fits 15
5.4 Prediction of log Kd on Wood Char and Diesel Soot. 18
5.5 Prediction of Freundlich Coefficients and Exponents. 20
5.6 Prediction of log Kd of PAHs and PCBs in Soils and Sediments. 23
6. Conclusions and Implications for Future Research/Implementation
28
7. Literature Cited
29
8. Appendices List of Scientific/Technical Publications
32
page List of Tables Table 1. Freundlich isotherm fitting parameters for adsorption on wood char. 10 Table 2. Freundlich isotherm fitting parameters for adsorption on soot. 13 Table 3. Comparison of reported Freundlich isotherm parameters of selected sorbates on soot, char and activated carbon by different methods. 16 Table 4. Comparison of reported ppLFER models for adsorption to soot, char, carbon nanotube and activated carbon. 18 List of Figures Figure 1. Freundlich isotherms for 14 probe sorbates on chestnut wood char. 9 Figure 2. Nitrate breakthrough curves on 1% soot column within a month. 11 Figure 3. Isotherms of anisole at different flow rates obtained on 1% soot column at: (a) 0.1 mL/min, (b) 0.2 mL/min, and (c) 0.4 mL/min. 11 Figure 4. Reproducibility of bromobenzene isotherms on (a) 1% and (b) 0.1% soot columns by frontal analysis. 12

iii
page Figure 5. Surface-area normalized adsorption coefficients of benzene on char, granular activated carbon, and soot. 17 Figure 6. Overall correlation of the individual observed sorption coefficients with the predicted sorption coefficients on chestnut wood char. 19 Figure 7. Prediction of log Kd on soot by ppLFER models: (a) model 1 with 3 parameters and (b) model 2 with 4 parameters. 19 Figure 8. Observed and predicted log Kd values on soot at various sorbate activities for (a) phenanthrene, (b) atrazine, and (c) dimethyl phthalate. 20 Figure 9. Correlations of observed Freundlich coefficients, Kf [(mg/kg)/(mg/L)n], and Freundlich exponents, n, for wood char isotherms with ppLFER-predicted values for those parameters. 22 Figure 10. Prediction of Freundlich coefficient log Kf for soot based on ppLFER models using: (a) model 1 with 3 parameters and (b) model 2 with 4 parameters. 23 Figure 11. Prediction of Freundlich exponent n based on ppLFER models using: (a) model 1 with 3 parameters and (b) model 2 with 4 parameters. 23 Figure 12. Observed (data from Huang et al. 1997) and predicted log Kd values of phenanthrene at 100 µg/L on different EPA soils and sediments. 25 Figure 13. Observed (data from Huang et al. 1997) and predicted log Kd values of phenanthrene at 10 µg/L on different EPA soils and sediments. 25 Figure 14. Observed (data from Huang et al. 1997) and predicted log Kd values of phenanthrene at 1 µg/L on different EPA soils and sediments. 25 Figure 15. Observed (data from Accardi-Dey and Gschwend 2003) and predicted log Kd values for phenanthrene on the combusted Boston Harbor sediment. 26 Figure 16. Observed (data from Accardi-Dey and Gschwend 2002) and predicted log Kd values for pyrene on the combusted/untreated South Dorchester Bay and North Quincy Bay sediments. 26 Figure 17. Observed (data from Lohmann et al. 2005) and predicted log Kd values for some PAHs and PCBs in Boston Harbor sediment from South Dorchester Bay. 27 Figure 18. Observed (data from McGroddy 2003) and predicted log Kd values of PAHs and PCBs found from measures of sediment and porewater concentrations in a Peddocks Island (Boston Harbor) sediment box core. 27

iv
List of Acronyms, Abbreviations, and Symbols BCs black carbons such as soots and chars BSAFs biota-sediment accumulation factors Csed chemical concentration in sediment Cw chemical concentration in water DAD diode array detector DoD Department of Defense ECD electron capture detector EPA Environmental Protection Agency EqP equilibrium partitioning FA frontal analysis fbc fraction black carbon by weight FID flame ionization detector foc fraction organic carbon by weight GC gas chromatography HOCs hydrophobic organic compounds HPLC high pressure liquid chromatography KAC activated carbon normalized sorption coefficient KBC black carbon normalized sorption coefficient Koc organic carbon normalized sorption coefficient Kow octanol-water partition coefficient Kd solid-water sorption coefficient PAHs polycyclic aromatic hydrocarbons PCBs polychlorinated biphenyls PE polyethylene ppLFER polyparameter linear free energy relationship PRCs performance reference compounds VIF variance inflation factor Keywords black carbon, soot, char, sorption, ppLFER, PAHs, PCBs Acknowledgments The research was supported by the Strategic Environmental Research and Development Program (SERDP) under contract W912HQ-10-C-0005.

1
Robust Means for Estimating Black Carbon-Water Sorption Coefficients of Organic Contaminants in Sediments
Abstract
Objective: Sediment beds at many sites are contaminated by diverse hydrophobic organic compounds (HOCs) such as PAHs, PCBs, and pesticides. In an effort to manage such contaminated solids, regulators try to use data on the sediment concentrations (Csed) of these HOCs. The key parameter allowing use of an HOC's sediment concentration is that compound's solid-water sorption coefficient, Kd. However, using the current practice of estimating Kd from a sediment's organic carbon content (foc) and the compound's organic-carbon normalized sorption coefficient (Koc) has been found to be very inaccurate for estimating HOC mobility and bioavailability at many sites. We now believe this inaccuracy derives in large part from ignoring the sorption of HOCs to black carbons (BCs) like soots and chars in the sediment. Hence, it was the overarching goal of this research to improve our fundamental understanding of organic chemical sorption to BCs in sediments, while at the same time providing a practical means for estimating this interaction quantitatively. Approach: Adsorption isotherms were determined for structurally diverse arrays of probe sorbates to two representative BCs, a NIST diesel soot and a wood char. Since the char particles could be readily settled, sorption testing was done using batch methods. However, since the soot was very finely divided, this BC was coated on clean sand and this aggregate was used as a stationary phase in liquid chromatography frontal analysis of each sorbate run at a series of increasing concentrations. The resultant concentration-dependent Kd values were analyzed for the importance of various intermolecular interactions by fitting the data for each BC sorbent to find a polyparameter linear free energy relationship (ppLFER). Results: All of the sorbate-sorbent combinations fit by Freundlich isotherms very well. Sorption to the wood char Kd data for the diverse sorbate set also fit the following ppLFER: log Kd,char = [(4.03±0.14) + (-0.15±0.04) log ai ] • V + [(-0.28±0.04) log ai ] • S + (-5.20±0.21)•B (N=128, R2=0.98, SE=0.41) where V (in cm3 mol-1/100) is McGowan’s characteristic volume, S is the polarity/polarizability parameter, B is hydrogen basicity, and ai is the sorbate activity. This fitted expression implies that sorption to the char was strongly encouraged by London dispersive forces, was strongly discouraged by moieties that hydrogen bond with water by accepting protons, and was modestly encouraged by sorbate polarity (note log ai is always a negative number). In contrast, sorption to the diesel soot fit a similar ppLFER: log Kd,soot (L/kg) = (4.26±0.11)•V + [(-0.30±0.02) log ai )]•E + (-3.16±0.15)•B + (-1.95±0.10) (N=86, R2=0.96, SE=0.16)

2
While similar, sorption to soot proved weaker than char sorption, even when sorption coefficients were normalized to the sorbents' surface areas. One important application of such ppLFERs is predicting Kd of other compounds. The soot ppLFER successfully predicted the Kd of phenanthrene and dimethyl phthalate to soot, but atrazine was generally overestimated, especially at lower activities. We suspect the nonplanar nature of atrazine caused this (all the training sorbates were planar). We also examined the accuracy of our ability to estimate Kd values for PAHs and PCBs on sediments and soils. Generally, predicted values of phenanthrene agreed well with reported ones; however, ppLFER-based estimates for larger HOCs compared much less favorably. We suspect that larger sorbates cannot access the same microporous surface areas as done by our sorbate training set. Conclusions and Benefits: Our results showed that one can develop fundamental understandings of sorption to black carbon surfaces using diverse sorbates and ppLFER synthesis of the results. And use of such ppLFER fits with independent measures of the black carbon contents of sediments and soils reasonably estimated Kd values reported by other investigators for phenanthrene. Hence, this approach appears promising for real world samples. However, extrapolations well outside the tested ppLFER parameter space were not accurate. We suspect two steric issues came into play: (a) non-planar sorbates interact with the BC surfaces less effectively than our planar sorbate probes, and (b) larger HOCs may not enjoy as much access to highly sorptive sites in microporous regions of BCs as our somewhat smaller probe sorbates, thereby reducing their sorption coefficients. Future work needs to examine these effects. Finally, our experience with sorption to diesel soot and wood char indicates that these BCs exhibit different affinities for like sorbates. As a result, application of Kd,soot or Kd,char values will require information on the nature of the BC in any soil or sediment of interest. Hence, we need to develop an analytical methodology that can accurately quantify soots, chars, and any other BC types (e.g., coal dust) in natural solids.

3
1. Objective It was the overarching goal of this research to improve our fundamental understanding of organic chemical sorption to black carbons (BCs) in sediments, while at the same time providing a practical means for estimating this interaction quantitatively. This was done by using a polyparameter linear free energy relationship (ppLFER) framework to evaluate the structural dependencies of hydrophobic organic compound (HOC) partitioning between aqueous solutions and the water-wet surfaces of black carbons such as soots and chars.
2. Background 2.1 Current Practice Using focKoc to Estimate Kd.
Sediment beds at many DoD sites are contaminated by diverse hydrophobic organic compounds or HOCs (SERDP/ESTCP 2008). HOCs such as PAHs, PCBs, and chlorinated pesticides are persistent and tend to bioaccumulate. Many are mutagens and/or carcinogens, and all of them contribute to disruption of membrane functions (e.g., DiToro et al., 2000a and b). HOC-contaminated sediments may cause long-term pollution of their surroundings if they are not remediated.
In an effort to manage such contaminated solids, regulators try to use data on the sediment concentrations (Csed) of these HOCs. Concentrations are evaluated in an effort to maintain acceptable levels of HOC mobility and bioaccumulation in the food web. Commonly, this is done by assuming equilibrium partitioning (EqP) of the HOCs among the solid phases, porewater, and associated infaunal organisms. While HOCs that are not metabolized may indeed achieve such equilibrium distributions, the key parameter allowing us to use an HOC's sediment concentrations in this model is that compound's solid-water sorption coefficient, Kd [(mol/kgsediment)/(mol/Lwater)]. This parameter allows us to estimate porewater concentrations, Cw, from the ratio, Csed/Kd. Until now, regulators have commonly assumed that a Kd value can be estimated from the product, focKoc (Karickhoff et al., 1979; Chiou et al. 1979; Schwarzenbach and Westall, 1981), where foc is the organic carbon content of the sediment (kgoc/kgsediment) and Koc is the HOC's organic carbon-normalized solid-water partition coefficient [(mol/kgoc)/(mol/Lwater)].
However, such EqP modeling using Kd = focKoc has been found to be very inaccurate for estimating HOC mobility and bioavailability at many sites. If EqP were accurate, then one should find close correspondence between measured porewater concentrations and sediment concentrations normalized by focKoc. But this is clearly not the case, as Cw is commonly up to a factor of 100 less than Csed/focKoc (Fernandez et al. 2009.) Likewise, biota-sediment accumulation factors (BSAFs) measured for a wide range of benthic infauna are often 1 to 2 orders of magnitude below the corresponding EqP expectation (e.g., Tracey and Hansen, 1996; Hellou et al., 2002: Kraaij et al., 2002). This common finding suggests that regulators are being overly conservative in this use of the EqP approach; said another way, the "bioavailability" of the HOCs of concern is not being estimated accurately.
This situation suggests that there is a major problem with respect to estimating solid-water partition coefficients, Kd values, based on an focKoc model. We now know that the sediments (and soils) include "black carbons" (BCs) such as soots and biomass chars, and that

4
these special components of the organic carbon content must be distinguished from the rest of the organic matter to estimate Kd values accurately (e.g., Gustafsson et al., 1997; Ghosh et al., 2000, 2001, 2003; Accardi-Dey and Gschwend, 2002, 2003; Lohmann et al., 2005.) Although typically only contributing 1 to 10% of the total organic carbon, BC exhibits an affinity for many HOCs that is about 100 times greater than biogenic/diagenetic organic matter in sorbing HOCs from an aqueous phase. For example, Lohmann et al. (2005) suggested that more than 90% of the PAHs and about 50% of the PCBs in Boston Harbor and New York Harbor sediments were bound by BC. These observations are all consistent with our expectation that past efforts to quantify HOC mobility and bioavailability have underestimated Kd values as the product, focKoc . Thus, we proposed that EqP estimations could be greatly improved by using a refined expression (Accardi-Dey and Gschwend, 2002):
Kd = focKoc + fBCKBCCw
n-l (1)
where foc is the non-BC organic carbon, Koc is the compound-specific organic carbon-water partition coefficient, fBC is the BC weight fraction in the sediment, KBC is the compound specific BC-water adsorption coefficient, and Cw
n-l is the dissolved HOC concentration raised to a power, n-1, to reflect the nonlinearity of adsorption to the BC surface. One may ask, "If this black carbon sorption effect has made estimating Kd values difficult and even impractical, why not simply circumvent this difficulty by using passive sampling approaches to assess porewater concentrations?" While passive sampling methods do indeed assist us greatly, there are several reasons we still must also know Kd values. First, management and clean up decisions for any particular site should be based on a "weight of evidence" approach; that is, multiple lines of reasoning should be used to build confidence in what we believe is going on at any particular site. Hence, it will certainly be more convincing to all the site's stakeholders if the Cpassive sampler / Kpassive-sampler water observations are consistent with corresponding Cbiota/Kbiota water and Csed/Kd ratios. Undoubtedly, the best decisions will be made when multiple lines of evidence can be used to (a) understand site conditions and (b) anticipate how the site will respond to alternative remedial options. Next, use of in situ passive samplers requires us to correct observations on the target HOCs using performance recovery compounds (PRCs), and the overall accumulation of any individual compound at any particular site depends on its Kd value (Fernandez et al., 2009). Consequently, we need to understand factors that go into the Kd sorption parameter in order to know how to use a few HOCs as PRCs to calibrate PE update for other diverse target HOCs. Currently, we use an empirical correlation which assumes each HOC's Kd is simply proportional to its Kow. This assumption may be inaccurate if one considers PRCs and target HOCs from different compound classes, since each group will exhibit a different array of intermolecular interactions driving sorption. Further, passive sampling data may reflect an under-saturated steady state condition such as during times of year when bioirrigation is much faster than desorption. In this case, the passive sampling data would under-represent the hazard posed by the bed sediment for times of year when bioirrigation was not so intense. In contrast, the ratio of Csed/Kd (with KBC dependency) reflects equilibrium; and this condition represents the worst-case "chemical

5
activity" organisms may feel on exposure to the bed sediment. So while short-term bioaccumulation and bed-water column exchanges may be best estimated using passive sampling data, HOC bioaccumulation by long-lived infauna (e.g., clams, worms) would benefit from knowledge of KBC. So if we are interested in processes that require sorption kinetics understanding (e.g., release of HOCs from resuspended sediments), then we need Kd (as function of KBC). In situ passive sampling observations do not give this. Finally, information on BC sorption would be of great help with respect to remediation problems. For example, since adsorption to BC is nonlinear, one cannot take passive sampling-inferred porewater data, decide by what factor we need to reduce porewater levels to be safe (e.g., 10x), and then reason that we need to reduce sediment concentrations by the same factor (i.e., 10x too). Actually the sediment concentration reduction would be less since Kd would increase with lower dissolved concentrations. So to judge the necessary change, one needs to understand Kd (and the BC-related sorption parameters). 2.2 The Polyparameter LFER (ppLFER) Approach for Estimating Kd Values. Recently, investigators have used "polyparameter linear free energy relationships" (ppLFERs) to understand diverse partitioning problems (see text by Schwarzenbach et al. 2003 for review). Briefly, this approach involves training an expression that relates the logarithm of the thermodynamic coefficient of interest (e.g., KBC) to the sum of the energies arising from changing intermolecular interactions (London dispersive, dipole-induced dipole, dipole-dipole, hydrogen bond donation, hydrogen bond accepting) experienced by solutes moving between aqueous solution and sorption sites of interest (e.g., on a water-wet soot surface):
log Kd = vV + eE + sS + aA + bB + c (2)
where V (in cm3 mol-1/100) is McGowan’s characteristic volume, E (in cm3/100) is the excess molar refraction, S is the polarity/polarizability parameter, and A and B are the hydrogen acidity and basicity, respectively. In a simple sense, this series of terms is intended to capture: the changes in HOC-medium interactions involving changes in London dispersion forces (especially vV term), the dipole-induced dipole and the dipole-dipole attractions (i.e., eE and sS terms), and the HOC's hydrogen-bonding donation and its hydrogen-bonding acceptance (i.e., aA and bB) in moving from one state (e.g., dissolved in water) to another (e.g., sorbed on BC). Chromatographic analyses have been used to determine the V, E, S, A, and B parameters for thousands of specific organic compounds including PAHs, PCBs, and pesticides. Moreover, the database of HOCs evaluated for the relevant properties (e.g., V, S, and B) is continuously growing, so most of the parameter values are already available for contaminants of interest to the DoD including: parent and alkylated PAHs (Abraham et al., 1994), all 209 PCB congeners (Abraham and Al-Hussaini, 2005), chlorinated insecticides like DDT, DDE, and endrin (Gotz et al., 2007; Tulp et al., 2008), and nitroaromatic compounds like TNT (Tulp et al., 2008). Thus, for new partitioning cases of interest, the coefficients, v, e, s, a, b, and c can be trained using a relatively small number of probe compounds (i.e., with previously established V, E, S, A, and B parameters) to capture the differential intermolecular interactions controlling the partitioning of any compounds distributing the two phases of interest (e.g., the aqueous phase versus a water-wet BC).

6
Shih and Gschwend (2009) used 14 structurally diverse sorbates to develop a ppLFER
predictor of sorption of HOCs to a particular black carbon representative, activated carbon (AC), from water (w):
log Ki AC/w (L/kg) = (1.89±0.07 - 0.22±0.06 log Ciw) •V + (-2.36±0.07 + 0.30±0.05 log Ciw) • B
+ (0.90±0.05 - 0.48±0.03 log Ciw) • S + (2.98±0.07 - 0.26±0.06 log Ciw) (3)
where log Ciw is the sorbate, i, concentration in water in mg/L. The sorption estimations using this approach were very good (R2 = 0.98 for N = 176). Notably, this investigation also handled the concentration dependency of the sorption coefficients (i.e., Freundlich n values). The coefficients in this ppLFER expression are now established for this activated carbon-water system, and so new HOCs of interest whose V, S, and B are known can now have their activated carbon-water sorption coefficients estimated. The purpose of the work reported here is to extend this progress to include black carbons such as soots and chars. Ultimately, the goals are to investigate the questions: (a) is the extent of sorption to all black carbons from water the same when normalized by the BC's surface area and (b) can we establish the means to estimate such sorption for any HOCs of interest.
3. Materials and Methods
3.1 Chemical Sorbates. Chemical sorbates (Tables 1 and 2) were selected to have varied functional groups so as to cover a range of the ppLFER parameter space (Lu et al. 2015, Plata et al. 2015). While these probe compounds do not cover the entire known range of the parameters (Tulp et al. 2008, Zissimos et al. 2002), their structures allow them to participate in diverse intermolecular interactions, and this is reflected by their relatively broad range in aqueous solubilities. Sorbate-saturated aqueous solutions were prepared by equilibrating excess quantities of each sorbate with buffer solutions (5 mM CaCl2 and 100 µM NaHCO3 in 18 MΩ UV-oxidized water with pH around 6) for at least 1 week in pre-combusted, ground-glass-stoppered flasks. 3.2 Black Carbon Sorbents. Wood char, prepared from chestnut hardwood, as described in Hammes et al. (2006), was purchased from the Schmidt Laboratory at the University of Zurich. Soot from diesel-powered forklifts (NIST SRM 2975) was purchased from the National Institute of Standards and Technology (NIST; Gaithersburg, MD). To ensure uniform sorbate exposure to char and soot surfaces, the finely divided char and soot particles were suspended in ethyl acetate, spread over pre-combusted, acid-washed, Ottawa sand, and then stirred semi-continuously while air drying. 3.3 Batch Equilibration Experiments Using A Wood Char. Isotherms of adsorption to char were investigated using batch equilibration experiments in pre-combusted, 7-mL, 18-mL, or 50-mL ground-glass-stoppered centrifuge tubes. All-glass containers were used to avoid sorbate losses to Teflon™ or other polymers. Sorbate concentrations were quantified following 7-to-14 day

7
equilibration times, which we determined were sufficient to establish sorptive equilibrium for this char. Analytes with relatively low aqueous solubilities (<6,000 mg/L) were quantified using a purge and trap pre-concentrator (Tekmar LCS 2000) interfaced to a gas chromatograph (GC; Perkin Elmer AutoSystem XL) with a flame ionization detector (FID) for hydrocarbons or an electron capture detector (ECD) for halogenated compounds. Analytes with relatively high aqueous solubilities (>6,000 mg/L) were quantified via direct aqueous injection onto a GC-FID (Carlo Erba HRGC 5300 Mega Series MFG 500). Both instruments were equipped with a DB-624 capillary column (60 m x 3.80 µm x 0.320 mm) and temperature programs varied with the analyte. Detailed information can be found in Plata et al. (2015). 3.4 Frontal Analysis Testing Using Diesel Soot. Isotherms of adsorption to soot were investigated by frontal analysis (FA) in order to quicken the pace of sorption testing and to allow us to handle the very finely divided soot. An Agilent 1100 HPLC system with a binary pump and a diode array detector (DAD) (Agilent Technologies, Santa Clara, CA) was modified to accomplish this study. About 2.3 g of soot-Ottawa sand mixtures or pure Ottawa sand were packed into HPLC columns (8.1 cm length, 0.48 cm diameter), resulting in columns referred as 1%, 0.1% and sand-only columns in this study. The columns were flushed with buffer solutions (5 mM CaCl2 and 100 µM NaHCO3) at 0.2 mL/min for 2 weeks to fully wet the soot surfaces before running samples. Sorbate solutions were directly introduced into the 1% or the 0.1% soot-sand column successively at 0.2 ml/min from low to high concentrations at room temperature (22±0.5 ºC). The same sorbate solutions were run through the sand-only column operated under the same conditions. The amount adsorbed on the soot sorbent can be calculated by an integral mass balance. Detailed information can be found in Lu et al. (2015). 3.5 Sorption Data Analysis. The logarithmic form of the Freundlich equation was used to fit Ci,s as a function of Ci,w: log Ci,s = log Kf + n•log Ci,w (4) where Kf [(mg/kg)/(mg/L)n] and n (dimensionless) are the Freundlich coefficient and exponent, respectively, and Ci,s and Ci,w are the equilibrium concentrations in the solid phase (mg/kg) and aqueous phase (mg/L), respectively. Then all independent measures of Kd (i.e., Ci,s/Ci,w) values were used to fit the activity-dependent ppLFER model (Shih and Gschwend 2009): log Kd = (v1 + v2 log ai)•V + (e1 + e2 log ai)•E + (s1 + s2 log ai)•S + (a1 + a2 log ai)•A + (b1 + b2 log ai)•B + (c1 + c2 log ai) (5) where ai is the sorbate activity, the ratio of sorbate's aqueous concentration to its (subcooled) liquid solubility. Coefficients were determined both by backward and forward stepwise multiple linear regression analysis of experimental values using Microsoft™ Excel, StatPlus™ and IBM SPSS™ 23. Detailed information can be found in Plata et al. (2015) and Lu et al. (2015).

8
To ascertain the ability of this ppLFER approach to prediction of Kd values of additional HOCs reported in the literature, we considered both absorption into OC and adsorption onto BC. Consequently, new estimates of sorption were made using expressions of the form: Kd = foc Koc + fsoot Ksoot + fother BC Kother BC (6) in which foc is the weight fraction of the biogenic/diagenic absorptive organic carbon, fsoot and fother BC are weight fractions adsorptive soot-carbon or other BC-carbon (e.g., char) in the soil and sediment, and Koc, Ksoot, and Kother BC are the OC- and BC-carbon-normalized solid-water partition coefficients, respectively.
4. Results 4.1 Sorption Kinetics to Wood Char. Sorption kinetics were assessed using toluene. Dissolved toluene concentrations approached equilibrium in less than 1 week. Thus, we concluded that our incubation timeframe should be at least 1 week to establish equilibrium, while at the same time minimizing the effects of other sorbate losses during the incubations (e.g., since bubbles often appeared in the batch tests, sorbates like hexane substantially partitioned into this gases). More sorptive probe compounds, such as pyrene or polychlorinated biphenyls, experience even greater retardation of diffusive transport into porous char. Thus, they require longer equilibration times and were not included in the set of probe sorbates. 4.2 Sorption Isotherms to Wood Char. The Freundlich equation (Eq. 4) fit the data well, with correlation coefficients of at least 0.96, except for heptane (R2 = 0.77) and di-isopropyl ether (R2 = 0.87; Figure 1 and Table 1). Within each compound class (e.g., alkanes or alcohols), sorbates with the highest aqueous solubility exhibited the lowest affinity for char (lowest sorption), except for diethyl ether (Figure 1); this may have reflected greater access of diethyl ether to the char's micropores than was experienced by the larger, branched ethers (methyl t-butyl ether and di-isopropyl ether). For alkanes, alcohols, and ketones, the seven-carbon sorbate always had a larger Kf than the respective six-carbon compounds (Table 1), likely reflecting their increased hydrophobicities due to the addition of a methylene. 4.3 Polyparameter Linear Free Energy Relationship for Sorption to Wood Char. To capture the degree of saturation-dependent behavior of sorption, we fit the expanded ppLFER expression (Eq. 5) which includes a dependence on aqueous saturation, noting that aqueous saturation and sorption saturation must occur together. Using the 128 independent Kd observations (Figure 1), we optimized the fit via the multiple regression statistic F and found: log Kd = [(4.03±0.14) + (-0.15±0.04) log ai ] • V + [(-0.28±0.04) log ai ] • S + (-5.20±0.21)•B (N=128, R2=0.98, SE=0.41) (7)

9
Figure 1. Freundlich isotherms for 14 probe sorbates on chestnut wood char. Solid and dashed lines are best-fit curves, from which we derive characteristic Freundlich parameters, log Kf (intercept) and n (slope). For our data set, the sorbate coefficients for the A (hydrogen acidity/electron accepting capacity) and E (molar refraction/polarizability) terms were not significantly different from zero, suggesting the corresponding intermolecular interactions did not substantially influence sorption to char as compared to remaining dissolved in water. Char-water partitioning depended directly on the dispersion interactions (V term), inversely on the electron donating character (B term), and

10
weakly on the sorbate's polarity (S term). Interestingly, the V term exhibited clear dependence on the degree of aqueous (and hence inferred char surface) saturation, becoming more important at higher dilution (implying less char coverage). The B term exhibited no significant dependence on aqueous saturation over the investigated range, and the S term was only important at low activities (e.g., ai <0.001). The physical-chemical implications of these dependencies are described in the discussion section.
Table 1. Freundlich isotherm fitting parameters for adsorption on wood char.
Sorbate log Kf n R2 SE Na activity rangeb
hexane 4.37 ± 0.11 0.78 ± 0.06 0.96 0.19 9 1 x10⁻⁴ - 6x10⁻² heptane 4.61± 0.42 0.81 ± 0.14 0.85 0.21 8 1x10⁻⁴ - 4x10⁻² benzene 3.08 ± 0.06 0.75 ± 0.04 0.98 0.15 9 1x10⁻⁴ - 7x10⁻² toluene 3.21 ± 0.07 0.79 ± 0.04 0.97 0.24 13 7x10⁻⁷- 5x10⁻² nitrobenzene 3.74 ± 0.02 0.46 ± 0.02 0.99 0.05 8 2x10⁻⁴- 2x10⁻⁴ 1,1,2-trichloroethane 2.77 ± 0.04 0.69 ± 0.03 0.99 0.12 9 6x10⁻⁶- 9x10⁻³ trichloroethene 3.93 ± 0.07 0.89 ± 0.03 0.99 0.14 11 5x10⁻⁷- 1x10⁻³ 3-hexanone 3.02 ± 0.08 0.59 ± 0.05 0.96 0.17 9 4x10⁻⁵- 5x10⁻² 2-heptanone 3.07 ± 0.06 0.62 ± 0.04 0.97 0.19 12 6x10⁻⁶- 9x10⁻² diethyl ether -0.89 ± 0.06 0.77 ± 0.03 0.99 0.07 8 1x10⁻⁴- 3x10⁻² methyl tert-butyl ether 1.26 ± 0.12 1.02 ± 0.07 0.97 0.20 8 4x10⁻⁵- 4x10⁻² di-isopropyl ether 2.06 ± 0.08 0.59 ± 0.08 0.87 0.22 9 2x10⁻⁵- 3x10⁻³ 1-hexanol 2.87 ± 0.02 0.53 ± 0.01 0.99 0.03 8 3x10⁻⁴- 4x10⁻² 1-heptanol 3.32 ± 0.02 0.66 ± 0.02 0.99 0.05 6 2x10⁻⁴- 1.5x10⁻² aN=number of observations; brange of equilibrium activities tested
4.4. Testing the Method Robustness of Frontal Analysis to Assess Sorption to Soot. The frontal analysis method (FA) was validated by (1) testing the repeatability of daily nitrate breakthrough behavior, (2) showing consistent adsorption of anisole at different flow rates, and (3) confirming the reproducibility of bromobenzene isotherms using with the 1% or 0.1% soot columns. Nitrate breakthrough curves showed no significant differences within a month on 1% soot column (Figure 2). This was seen considering both the breakthrough volumes and half maximum concentrations. This indicated that the system was stable and nitrate could be used as conservative tracer for this study. Additional work showed that nitrate (an anionic tracer) and acetone (a nonionic tracer) exhibited indistinguishable breakthrough volumes in the column. In order to determine effects of flow rates on adsorption to soot, the anisole isotherm was measured at different flow rates on the 1% soot column (Figure 3). At all three flow rates, the isotherm fitted Freundlich equation well (R2>0.998). More importantly, the log Kf and n values were close to each other.

11
Figure 2. Nitrate breakthrough curves on 1% soot column within a month.
Figure 3. Isotherms of anisole at different flow rates obtained on 1% soot column at: (a) 0.1 mL/min, (b) 0.2 mL/min, and (c) 0.4 mL/min.

12
Measurements of the carbon-normalized Ksoot of bromobenzene at 0.05, 0.1, 0.2, 0.3 and 0.4 mL/min were 2.29 ± 0.02, 2.28 ± 0.01, 2.29 ± 0.02, 2.32 ± 0.05 and 2.34 ± 0.05 L/kg, respectively. Although there were no significantly differences among them (p > 0.05), somewhat larger variations (±0.05 vs. ±0.02) existed at higher flow rates (0.3 and 0.4 mL/min). Therefore, 0.2 mL/min was chosen for all sorption testing. In this study, 1,2,4-trichlorobenzene, naphthalene, 1-methylnaphthalene, 1-chloronaphthalene and phenanthrene were analyzed using the 0.1% soot column due to their high adsorption affinity, while all other chemicals were analyzed using the 1% soot column. In order to support our assumption of the reasonableness of merging the two datasets together, reproducibility of bromobenzene sorption on two columns was tested (Figure 4). Overall, the isotherms determined on both columns fitted the Freundlich equation well, although fitting was slightly better on the 1% soot column. This may due to that retention time of bromobenzene on the 0.1% column being too short to allow accurate assessment of the additional holdup volume as compared to the sand column control; the integration of the amount adsorbed would have larger error compared that on the 1% soot column. This also indicated that suitable soot content should be chosen to obtain reliable results. There were no significant differences among n values obtained on two columns (p>0.05). For the log Kf values, there were some significant differences between some pairs, but the accuracy was enough for this study. Therefore, we concluded that FA was a robust method to determine adsorption coefficients of organic pollutants to soot.
Figure 4. Reproducibility of bromobenzene isotherms on (a) 1% and (b) 0.1% soot columns by
frontal analysis. 4.5 Sorption Isotherms for Diesel Soot. All the sorption data using the diesel soot fit the Freundlich equation well with R2 > 0.994 (Table 2). All the isotherms involved at least 4 solute concentrations except phenanthrene, and most of them covered more than two orders of magnitude of sorbate activity (exception were phenanthrene, 1,2,4- trichlorobenzene, and fluorobenzene). Generally, with increasing log Kow or decreasing water solubility, the Freundlich isotherm parameter log Kf increased while the n value decreased. For example, the log Kf and n value for benzene, naphthalene and phenanthrene were 1.37, 3.24, 3.54 and 0.71, 0.55 and 0.31, respectively. This trend would also be observed for fluorobenzene, chlorobenzene and 1,2,4-trichlorobenzene.

13
Table 2 Freundlich isotherm fitting parameters for adsorption on soot.
Sorbate log Kf n R2 SE N activity range
trichloroethene 1.55±0.02 0.75±0.02 0.999 0.028 5 1.63×10⁻⁴~3.67×10⁻² benzene 1.37±0.01 0.71±0.01 1.000 0.017 6 3.89×10⁻⁴~2.07×10⁻¹
acetophenone 2.00±0.01 0.70±0.01 0.999 0.027 5 6.60×10⁻⁶~2.84×10⁻³
aniline 1.47±0.02 0.80±0.02 0.999 0.035 5 1.34×10⁻⁶~1.10×10⁻³
anisole 2.10±0.01 0.58±0.01 1.000 0.011 5 1.04×10⁻⁴~4.77×10⁻²
toluene 1.72±0.02 0.79±0.01 0.999 0.033 5 1.62×10⁻⁴~2.13×10⁻¹
fluorobenzene 1.64±0.06 0.72±0.04 0.994 0.054 4 1.89×10⁻³~1.42×10⁻¹
chlorobenzene 2.33±0.02 0.66±0.02 0.999 0.021 4 1.74×10⁻³~8.37×10⁻²
1,2,4-trichlorobenzene 3.06±0.01 0.54±0.01 0.999 0.010 5 6.83×10⁻³~1.66×10⁻¹
bromobenzene 2.35±0.01 0.67±0.01 1.000 0.007 4 2.06×10⁻³~2.03×10⁻¹
nitrobenzene 2.22±0.01 0.51±0.01 0.999 0.014 5 8.10×10⁻⁵~1.18×10⁻²
2,4-dinitrotoluene 2.75±0.01 0.55±0.01 1.000 0.012 5 3.10×10⁻⁴~6.57×10⁻²
phenol 1.47±0.03 0.77±0.03 0.996 0.058 5 2.09×10⁻⁶~6.58×10⁻⁴
4-chlorophenol 2.35±0.02 0.62±0.02 0.995 0.046 7 5.98×10⁻⁶~2.64×10⁻³
4-cresol 1.99±0.01 0.68±0.01 1.000 0.014 5 1.37×10⁻⁵~3.08×10⁻³
naphthalene 3.24±0.02 0.55±0.02 0.995 0.045 5 1.47×10⁻⁴~1.16×10⁻²
1-Methylnaphthalene 3.03±0.01 0.53±0.01 1.000 0.01 5 5.82×10⁻⁴~1.80×10⁻¹
1-chloronaphthalene 3.36±0.01 0.42±0.01 0.997 0.02 5 1.35×10⁻³~1.48×10⁻¹
dimethylphthalate 2.25±0.03 0.66±0.02 0.996 0.048 5 9.30×10⁻⁵~4.63×10⁻²
atrazine 2.37±0.02 0.81±0.02 0.998 0.03 4 8.13×10⁻⁵~6.34×10⁻³
phenanthrene 3.54±0.01 0.31±0.01 0.999 0.00 3 1.17×10⁻²~5.76×10⁻²
4.6 Polyparameter Linear Free Energy Relationship for Sorption to Soot. To fit the soot sorption data to a ppLFER model, we first excluded the phenanthrene and atrazine data so they could be used later as test sets. Next, we examined the fit for outliers and leverage points; 3 out of 5 dimethylphthalate data points were removed due to their high leverage (high V, S and B value combination). Therefore, dimethylphthalate will also be discussed as a sorbate in the validation set. After removing this small subset of the data, two similar best-fit ppLFER models were found to fit the carbon-normalized soot sorption coefficients. Since we are fitting 86 measures of Ksoot, we suggest the ppLFER fitting should be limited to 4 or 5 coefficients. So in "model 1", 4 coefficients were fit, while in the second case 5 coefficients were found: Model 1 (fit 4 coefficients including the intercept): log Ksoot (L/kg) = (4.26±0.11)•V + [(-0.30±0.02) log ai )]•E + (-3.16±0.15)•B + (-1.95±0.10)

14
(N=86, R2=0.96, SE=0.16) (8) Model 2 (fit 5 coefficients including the intercept): log Ksoot (L/kg) = (3.85±0.08)•V + [(-0.37±0.01) log ai )] •E + (-0.59±0.06)•A + (-3.06±0.09)•B + (-1.67±0.07) (N=86, R2=0.98, SE=0.11) (9) Since the ppLFER parameters are not fully orthogonal to one another, we checked the multicollinearity of these fittings. To this end, the Variance Inflation Factor (VIF) was calculated by SPSS. For both models, VIF values of each parameters ranged from 1.1 to 1.9, much lower than the limit of VIF = 10. If including both atrazine and phenanthrene in the regression, the 4- and 5-parameters best-fit models would be: Model 3 (fit 4 coefficients including phenanthrene and atrazine data)" log Ksoot (L/kg) = (4.14±0.10)•V + [(-0.31±0.02) log ai )]•E + (-3.36±0.10)•B + (-1.82±0.10) (N=96, R2=0.96, SE=0.17) (10) and Model 4 (fit 5 coefficients including the phenanthrene and atrazine data): log Ksoot (L/kg) = (3.78±0.08)•V + [(-0.38±0.01) log ai )]±•E + (-0.63±0.07)•A + (-3.22±0.08)•B + (-1.57±0.07) (N=97, R2=0.98, SE=0.13) (11) Compared to Eqs. 8 and 9, Eqs. 10 and 11 had no significant differences in the coefficients on each parameter. Therefore, Eqs. 8 and 9 (model 1 and model 2) will be used in the following discussion.
5.0 Discussion 5.1 Advantages of Frontal Analysis for Sorption Testing. Performing sorption testing with diesel soot was much more challenging in many ways than working with activated carbon or wood char. The soot is expensive; the soot is difficult to handle without accidentally spreading it around the research facility; and given its small size and hydrophobicity, the soot does not lend itself to ready phase separations. Hence, we chose frontal analysis as method that would mitigate these difficulties.

15
We found that frontal analysis was accurate and much more time efficient compared to other methods previously used (Bucheli and Gustafsson 2000, Endo et al. 2009, Nguyen and Ball 2006, Nguyen et al. 2004) (Table 3). For example, it took about 60 days to reach equilibrium in batch adsorption studies of 1,2,4-trichlorobenzene (Nguyen and Ball 2006, Nguyen et al. 2004), while FA, testing took about 6 h. The frontal analysis method gave results that were comparable to those seen with other methods (Table 3). For example, the log Kf and n values of naphthalene were almost the same by both FA and batch methods. The values of 1,2,4-trichlorobenzene obtained by FA were slight lower than those obtained by batch and batch-flocculation methods. This may be caused by a narrow sorbate activity range (from 6.83 ×10⁻³ to 1.66×10⁻¹) (Table 2) used in this study due to the limit of DAD detector, while in batch and batch-flocculation studies, a wider range (about 10-4 to 0.6) was used (Nguyen and Ball 2006, Nguyen et al. 2004). Overall, we believe FA is a cost effective (one can reuse the soot repeatedly), fast, and accurate method to determine the sorption isotherms of organic compounds to soot. 5.2 Comparison of Freundlich Isotherm Parameters among Black Carbons. The log Kf values of adsorption to NIST 2975 soot, NIST 1650b, and hexane soot were similar (Nguyen and Ball 2006) (Table 3). This may be due to similar surface areas and pore size distributions of these soot aggregates (Nguyen and Ball 2006). However, the n value of NIST 1650b soot was higher than those seen with the other soots. This may due to more extractable hydrocarbons coatings on 1650b. According to NIST, the extractable mass of 1650b and 2975 are 20.2 ± 0.4% and 2.7 ± 0.2%, respectively (NIST 2013a, b). This extractable fraction may act as a absorbent and thus make the overall isotherm more linear (Nguyen and Ball 2006). The log Kf values of adsorption to soot, char, and granular activated carbon (GAC) followed the trend: GAC > char > soot and the n values followed the trend: soot ≈ char > GAC (Table 3). Since adsorption to BC is strongly affected by the sorbent's surface area, surface-area normalized Kd values for benzene were calculated. After normalization, adsorption to soot was much weaker than those to char or GAC (Figure 5). This may be attributed to pore size distribution of soot: most of the pores are mesopores and macropores while only about 3~4% are micropores (Nguyen and Ball 2006) and the micropores do not extend inside the soot (Pignatello 2013). The different adsorption capacities of soot and char might be used as a characterization method to distinguish different types of BC in environment. For example, adsorption of phenanthrene and atrazine was higher in combusted Lake Ketelmeer sediment (Cornelissen and Gustafsson 2004) than seen for soot by this and previous studies (Nguyen and Ball 2006) (Table 3). This may indicate the (co)presence of char in that sediment. 5.3 Intermolecular Interaction Interpretations Based on the ppLFER Model Fits The coefficients of these ppLFER parameters reflect the differences in the sorbate's interactions with the solvent (water) versus the sorbent (char or soot). For the ppLFER of chestnut wood char (Eq. 7), the positive coefficient on the V term may result from moving hydrophobic moieties out of water and to a hydrophobic surface. The activity dependency is consistent with view that the most favorable sorption sites are deeper in the porous char and thereby enable greater removal from the aqueous solution. The B term's effect of lowering sorption suggests that loss of hydrogen-bond interactions with water cannot be replaced by interactions with the surface of the char. Interestingly, the differential A interaction is not seen suggesting that proton donation to water and to char surfaces are similarly favored, and so there is no net gain on sorption. This is

16
consistent with the view that aromatic π electrons on the char surface can donate electron density to a hydrogen-bonding sorbate but cannot accept electron density from electron-donating sorbates. Other terms made smaller contributions to Kd, as was observed for activated carbon. In the case of the wood char, the contribution of the polarity parameter (S) to Kd was weak but activity dependent, becoming more positive at lower sorbate coverage. This may imply that dipole-dipole interactions with char are stronger at lower char surface coverages. Table 3. Comparison of reported Freundlich isotherm parameters of selected sorbates on soot, char
and activated carbon by different methods.
Sorbate Sorbent Method log Kf n Ref.
benzene NIST soot 2975 frontal analysis, 4hr 1.37 0.71 This study chestnut wood char batch, 14 d 3.08 0.75 This study granular activated carbon batch, 14 d 4.50 0.29 Shih, 2009
toluene NIST soot 2975 frontal analysis, 4 hr 1.72 0.79 This study chestnut wood char batch, 14 d 3.21 0.79 This study granular activated carbon batch, 14 d 4.80 0.30 Shih, 2009
nitro-benzene
NIST soot 2975 frontal analysis, 6 hr 2.22 0.51 This study chestnut wood char batch, 14 d 3.74 0.46 This study granular activated carbon batch, 14 d 4.88 0.19 Shih, 2009
naph-thalene
NIST soot 2975 frontal analysis, 8 hr 3.24 0.55 This study NIST soot 2975 batch, 28 d 3.21 0.60 Endo, 2009 NIST soot 2975/methanol extracted
batch, 28 d 3.29 0.41 Endo, 2009
1,2,4-trichlorobenzene
NIST soot 2975 frontal analysis, 6 hr 3.06 0.54 This study NIST soot 2975 batch, flocculation,
59 d 3.43 0.66 Nguyen, 2004
NIST soot 2975 batch, 60 d 3.42 0.66 Nguyen, 2006NIST soot 1650b batch, 60 d 3.80 0.82 Nguyen, 2006
oxidized hexane soot batch, 60 d 3.53 0.67 Nguyen, 2006
phenan-threne
NIST soot 2975 frontal analysis, 33 hr 3.54 0.31 This study NIST soot 2975 batch, flocculation,
59 d 3.68 0.43 Nguyen, 2004
NIST 1650 air-bridge, 134 d 5.37 1 Bucheli, 2000 375ºC combusted Lake Ketelmeer sediment
batch POM-SPE, 35 d 4.24 0.54 Cornelissen, 2007
NIST soot 2975 batch, 60 d 3.72 0.41 Nguyen, 2006NIST soot 1650b batch, 60 d 3.58 0.6 Nguyen, 2006hexane soot batch, 60 d 3.64 0.52 Nguyen, 2006oxidized hexane soot batch, 60 d 3.48 0.52 Nguyen, 2006
atrazine NIST soot 2975 frontal analysis, 10 hr 2.37 0.81 This study 375ºC combusted Lake Ketelmeer sediment
batch POM-SPE, 35d 3.01 0.97 Cornelissen, 2007
4-chloro-phenol
NIST soot 2975 frontal analysis, 13 hr 2.35 0.62 This study carbon black batch, 1 d 3.50 0.4 Shih, 2012 rice straw char batch, 1 d 3.11 0.56 Shih, 2012

17
Figure 5. Surface-area normalized adsorption coefficients of benzene on char, granular activated carbon, and soot.
For the ppLFER of diesel soot (Eqs. 8 and 9), V and E gave positive contributions to the adsorption while B and A gave negative contributions. Moreover, the overall contributions followed the order: V > B > (log ai)E > A. The strong positive contribution of V and E implies that the London dispersion interactions were the dominant forces encouraging sorption to the soot. The activity dependency of E suggested that at lower degree of saturation on soot, the importance of polarizability was larger. The negative contribution of A and B terms showed that both H-bonding accepting and donating capacities decrease adsorption to soot, indicating that stronger H-bonds existed between sorbates and water. Previous investigators have developed ppLFER models of sorption to GAC (Kamlet et al. 1985, Luehrs et al. 1996, Poole and Poole 1997, Shih and Gschwend 2009) and multi-walled carbon nanotubes (MWCNT) (Apul et al. 2013, Zhao et al. 2014). In all of these studies (Table 4), V and B terms were always the most important ones; V always encouraged adsorption to BC, while B term always suppressed this process. One may infer similarity in all these BC-water systems: water-wet black carbons prefer dispersive interaction with HOCs (V term), while they typically have a much poorer ability to accept electron density from sorbates (B term) than water. A negative (log a)•V term was observed on the adsorption to GAC and MWCNT (Shih and Gschwend 2009, Zhao et al. 2014), indicating deeper sorbate penetration occurs required at lowers degree of surface saturation.
18
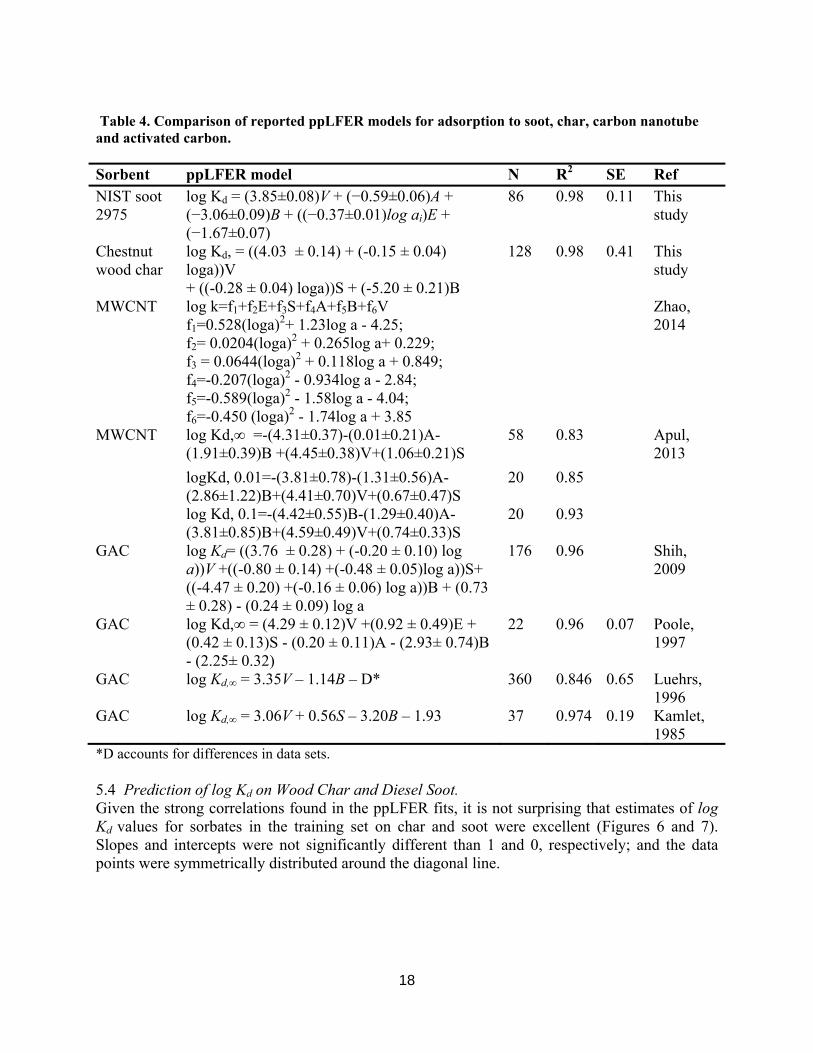
Table 4. Comparison of reported ppLFER models for adsorption to soot, char, carbon nanotube and activated carbon. Sorbent ppLFER model N R2 SE Ref NIST soot 2975
log Kd = (3.85±0.08)V + (−0.59±0.06)A + (−3.06±0.09)B + ((−0.37±0.01)log ai)E + (−1.67±0.07)
86 0.98 0.11 This study
Chestnut wood char
log Kd, = ((4.03 ± 0.14) + (-0.15 ± 0.04) loga))V + ((-0.28 ± 0.04) loga))S + (-5.20 ± 0.21)B
128 0.98 0.41 This study
MWCNT log k=f1+f2E+f3S+f4A+f5B+f6V f1=0.528(loga)2+ 1.23log a - 4.25; f2= 0.0204(loga)2 + 0.265log a+ 0.229; f3 = 0.0644(loga)2 + 0.118log a + 0.849; f4=-0.207(loga)2 - 0.934log a - 2.84; f5=-0.589(loga)2 - 1.58log a - 4.04; f6=-0.450 (loga)2 - 1.74log a + 3.85
Zhao, 2014
MWCNT log Kd,∞ =-(4.31±0.37)-(0.01±0.21)A-(1.91±0.39)B +(4.45±0.38)V+(1.06±0.21)S
58 0.83 Apul, 2013
logKd, 0.01=-(3.81±0.78)-(1.31±0.56)A-(2.86±1.22)B+(4.41±0.70)V+(0.67±0.47)S
20 0.85
log Kd, 0.1=-(4.42±0.55)B-(1.29±0.40)A-(3.81±0.85)B+(4.59±0.49)V+(0.74±0.33)S
20 0.93
GAC log Kd= ((3.76 ± 0.28) + (-0.20 ± 0.10) log a))V +((-0.80 ± 0.14) +(-0.48 ± 0.05)log a))S+ ((-4.47 ± 0.20) +(-0.16 ± 0.06) log a))B + (0.73 ± 0.28) - (0.24 ± 0.09) log a
176 0.96 Shih, 2009
GAC log Kd,∞ = (4.29 ± 0.12)V +(0.92 ± 0.49)E + (0.42 ± 0.13)S - (0.20 ± 0.11)A - (2.93± 0.74)B - (2.25± 0.32)
22 0.96 0.07 Poole, 1997
GAC log Kd,∞ = 3.35V – 1.14B – D* 360 0.846 0.65 Luehrs, 1996
GAC log Kd,∞ = 3.06V + 0.56S – 3.20B – 1.93 37 0.974 0.19 Kamlet, 1985
*D accounts for differences in data sets. 5.4 Prediction of log Kd on Wood Char and Diesel Soot. Given the strong correlations found in the ppLFER fits, it is not surprising that estimates of log Kd values for sorbates in the training set on char and soot were excellent (Figures 6 and 7). Slopes and intercepts were not significantly different than 1 and 0, respectively; and the data points were symmetrically distributed around the diagonal line.

19
Figure 6. Overall correlation of the individual observed sorption coefficients with the ppLFER predicted sorption coefficients on chestnut wood char.
Figure 7. Prediction of log Kd on soot by ppLFER models: (a) model 1 with 4 fitted parameters and (b) model 2 with 5 fitted parameters. Error bars represent one standard error. However, one of the most important applications of ppLFER models is predicting Kd of other compounds that cannot be easily measured (e.g., due to lack of suitable detection methods). Of course, ppLFER predictions should be most accurate for test compounds whose properties fall within the ranges of training sets. In this study, dimethyl phthalate, phenanthrene, and atrazine were tested for the predictive power and extrapolating ability of the two ppLFER models for soot. Dimethyl phthalate and atrazine have larger V and B terms than the 18 sorbates in the training set (0.2 and 0.4, 0.4 and 0.5 units larger, respectively), while phenanthrene has much larger E term (0.64 unit larger). Both models successfully predicted the log Kd of phenanthrene and dimethyl phthalate (Figure 8). The log Kd of atrazine was generally overestimated by 1 logarithmic unit, especially at lower activities. There might be several causes of this inaccuracy. First, all the sorbates in the training set are planar in structure, while atrazine is non-planar.

20
Bucheli and Gustafsson (2003) reported that ortho-substituted PCBs (non-planar) had lower adsorption affinities to soot than non-ortho congeners (planar), indicating planar structures enhanced surface juxtaposition and thereby adsorption to soot. Therefore, the ppLFER models may overestimate the interactions between non-planar sorbates and soot. Second, adsorption to soot might be a "pore-filling" process and due to the larger size of atrazine, there might be steric hindrance for atrazine to penetrate in to micropores. Further studies with more non-planar and larger compounds would be necessary to test these hypotheses. Overall, these two models had some degree of extrapolability and special attention should be paid to larger and/or non-planar molecules.
Figure 8. Observed and predicted log Kd values on soot at various sorbate activities for (a) phenanthrene, (b) atrazine, and (c) dimethyl phthalate. Error bars represent one standard error. 5.5 Prediction of Freundlich Coefficients and Exponents. The Freundlich isotherm parameters, Kf and n, are influenced by a sorbate's structural parameters, and the ppLFER's dependence on the degree of saturation allowed us to investigate this relationship. Freundlich coefficients and exponents would be calculated by re-organizing the ppLFER expressions so the reflect terms that are independent of sorbate concentration are grouped together and are set equal to log Kf, and the terms that depend on sorbate saturation are also combined and give an estimate of n (recall ai = Ciw/Ciw,sat). The results for the tested BCs follow.

21
for chestnut wood char: log Kf (mg/kg)/(mg/L)n) = (4.03±0.14)•V + (-5.20±0.10)•B + [(-0.15±0.04)•V + (-0.28±0.04)•S]•log Cw,sat (12) for diesel soot (model 1): log Kf (mg/kg)/(mg/L)n) = (4.26±0.11)•V + (-3.16±0.15)•B - [(-0.30±0.02)•E]•log Cw,sat + (-1.95±0.10) (13) for diesel soot, model 2: log Kf (mg/kg)/(mg/L)n) = (3.85±0.11)•V + (-3.06±0.09)•B + (-0.59±0.06)•A - [(-0.37±0.01)•E]•log Cw,sat + (-1.67±0.07) (14) In all these cases, the V and B terms dominate the Freundlich Kf values. Likewise, for the Freundlich exponents: chestnut wood char: n = 1 + (-0.15±0.04)•V + (-0.28±0.04)•S (15) diesel soot, model 1: n = 1 + (-0.30±0.02)•E (16) Diesel soot, model 2: n = 1 + (-0.37±0.01)•E (17) Interestingly, the Freundlich exponent for both the wood char and the diesel soot involves polar interactions in some way. The accuracy of this approach is suggested by the goodness of fit of the observed data with those predicted by Eqs. 12-17 (Figures 9-11). As was observed for granular activated carbon (Shih and Gschwend 2009), the V and B terms are also the major contributors to the Freundlich coefficient observed for char and soot. Dispersive forces (captured by the V term) encourage sorption and increase Kf, whereas electron donation capacity (reflected by the B term) decreases Kf. For char, a sorbate's polarizability (S term) makes a minor contribution to the Freundlich coefficient and that contribution is higher for solutes with larger aqueous solubilities. This is, perhaps, not surprising and is consistent with experience. For soot, no activity-dependent S term was observed, possibly due to lack of oxygen-containing functional groups on soot. The Freundlich exponent, n, captures the non-linearity of the sorption process. In the case of sorption from water to water-wet char, this exponent exhibited a dependence on dispersive forces and polarity (i.e., the V and S terms, respectively). The S parameter has been correlated with the Freundlich exponent in studies of sorption of organic chemicals to peat soil and GAC (Endo et al. 2008, Shih and Gschwend 2009). For GAC, Shih and Gschwend (2009) noted that the electron donating basicity (B term) made a small contribution to the Freundlich exponent, but

22
this was not observed for our char (perhaps due to differences in the oxygen functionality of the two materials). For non-polar compounds (e.g., with S≈0), the dispersive forces dominate the sorption behavior. For a typical polar sorbate (e.g., with V≈1 and S≈0.5), the Freundlich exponent will have roughly equal contributions from the dispersion and polarity terms, but these will be dominated by the constant (+1). We note that the constant in the n expression for our char (+1) was greater than seen previously for GAC (+0.76) (Shih and Gschwend 2009); this could imply that the isotherm nonlinearity also has some dependency on sorbent properties (e.g., GAC vs. wood char). For example, the exponent could capture the chemical nature of the char surface and physical distribution of pore spaces. The Freundlich exponents for char were systematically higher than those for GAC (Shih and Gschwend 2009) and, as noted earlier, could not be predicted by the same LFER. Thus, sorbent-specific free energy relationships may be needed for distinct types of black carbon sorbent materials. Knappe's group has demonstrated that pore structure and surface composition (e.g., oxygen content) have a significant influence on the sorption behavior of organic chemicals (Li et al. 2002, 2005), and differences in the physicochemical profile of the sorption surface may explain apparent differences in sorption properties of distinct BCs. For diesel soot, and E term influenced the n values, indicating polarizability has more important impact. However, overall, prediction of n was much less accurate compared to prediction of log Kf values (Figures 9-11). This may be due to only using only one or two parameters (V and S or only E term) in Equations 12-14. It is possible that n is affected by more intermolecular interactions, for example, combination of V, S, and E terms. With more parameters in the fitting, better prediction of n would be achieved. Freundlich coefficients and exponents of phenanthrene, atrazine, and dimethylphthalate were also predicted. The corresponding log Kf and n values estimated by Model 2 were 3.50, 3.06, 2.26 and 0.24, 0.44, 0.71, respectively. The predicted n value for atrazine was substantially different from its observed value of 0.81. As discussed above, this may be the result of atrazine's non-planarity which limits this molecule's interactions with the BC surface.
Figure 9. Correlations of observed Freundlich coefficients, Kf [(mg/kg)/(mg/L)n], and Freundlich exponents, n, for wood char isotherms with ppLFER-predicted values for those parameters. Diagonal dashed lines are the one-to-one lines, while solid lines are linear best fits. Error bars represent one standard deviation; invisible error bars are smaller than the symbol.

23
Figure 10. Prediction of Freundlich coefficient log Kf for soot based on ppLFER models using: (a) model 1 with 3 parameters and (b) model 2 with 4 parameters. The red dash lines are 1:1 ideal fitting lines. Error bars represent one standard error.
Figure 11. Prediction of Freundlich exponent n based on ppLFER models using: (a) model 1 with 3 parameters and (b) model 2 with 4 parameters. The red dash lines are 1:1 ideal fitting lines. Error bars represent one standard error.
5.6 Prediction of log Kd of PAHs and PCBs in Soils and Sediments. Ultimately, the purpose of this research is to enable accurate estimation of Kd values for HOCs of interest in soils and sediments containing BC as well as biogenic/diagenic organic matter. Hence, we sought to use the results from the wood char and diesel soot sorption testing in the context of an expression such at that in Eq. 6 to estimate the sorption coefficients of some PAHs and PCBs previously measured in soils and sediments where BC was also determined. The accuracy of our estimated log Kd values for PAHs and PCBs varied. Generally, predicted values of phenanthrene agreed well with reported ones. However, estimated for larger HOCs compared less favorably (Figures 12-18). For example, Huang et al. reported isotherms of phenanthrene on 12 EPA soils and sediment with aqueous concentration from about 1 to 1000
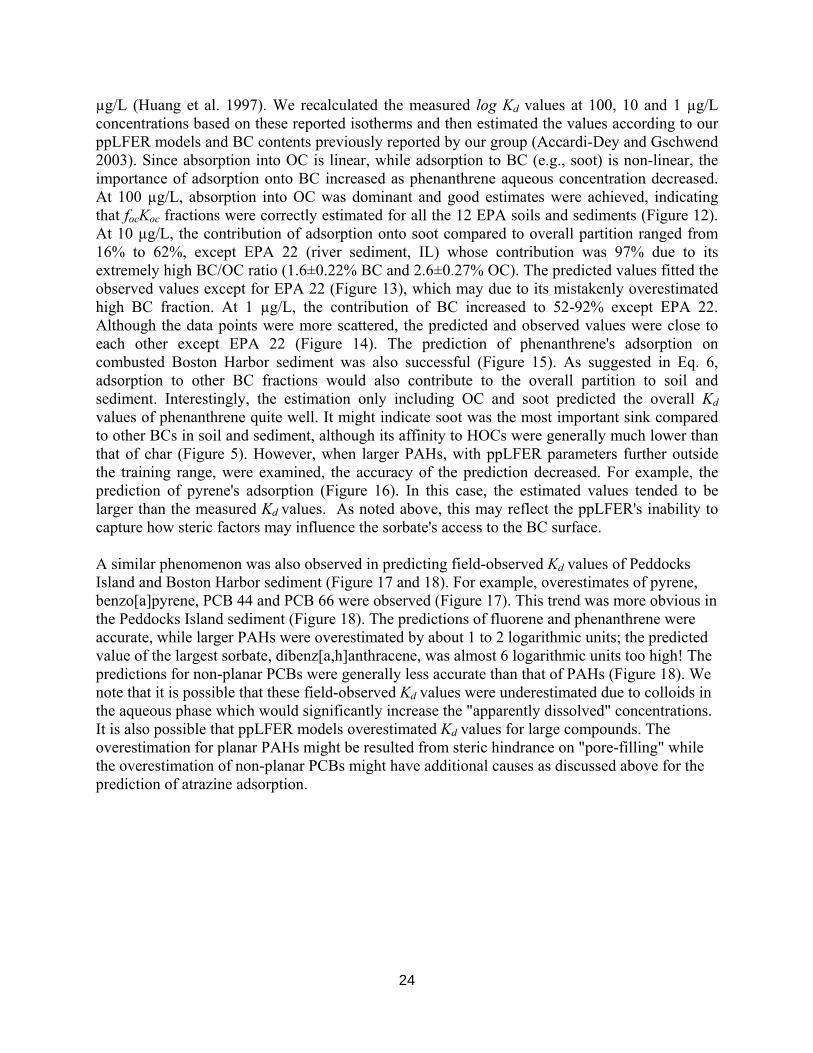
24
µg/L (Huang et al. 1997). We recalculated the measured log Kd values at 100, 10 and 1 µg/L concentrations based on these reported isotherms and then estimated the values according to our ppLFER models and BC contents previously reported by our group (Accardi-Dey and Gschwend 2003). Since absorption into OC is linear, while adsorption to BC (e.g., soot) is non-linear, the importance of adsorption onto BC increased as phenanthrene aqueous concentration decreased. At 100 µg/L, absorption into OC was dominant and good estimates were achieved, indicating that focKoc fractions were correctly estimated for all the 12 EPA soils and sediments (Figure 12). At 10 µg/L, the contribution of adsorption onto soot compared to overall partition ranged from 16% to 62%, except EPA 22 (river sediment, IL) whose contribution was 97% due to its extremely high BC/OC ratio (1.6±0.22% BC and 2.6±0.27% OC). The predicted values fitted the observed values except for EPA 22 (Figure 13), which may due to its mistakenly overestimated high BC fraction. At 1 µg/L, the contribution of BC increased to 52-92% except EPA 22. Although the data points were more scattered, the predicted and observed values were close to each other except EPA 22 (Figure 14). The prediction of phenanthrene's adsorption on combusted Boston Harbor sediment was also successful (Figure 15). As suggested in Eq. 6, adsorption to other BC fractions would also contribute to the overall partition to soil and sediment. Interestingly, the estimation only including OC and soot predicted the overall Kd values of phenanthrene quite well. It might indicate soot was the most important sink compared to other BCs in soil and sediment, although its affinity to HOCs were generally much lower than that of char (Figure 5). However, when larger PAHs, with ppLFER parameters further outside the training range, were examined, the accuracy of the prediction decreased. For example, the prediction of pyrene's adsorption (Figure 16). In this case, the estimated values tended to be larger than the measured Kd values. As noted above, this may reflect the ppLFER's inability to capture how steric factors may influence the sorbate's access to the BC surface. A similar phenomenon was also observed in predicting field-observed Kd values of Peddocks Island and Boston Harbor sediment (Figure 17 and 18). For example, overestimates of pyrene, benzo[a]pyrene, PCB 44 and PCB 66 were observed (Figure 17). This trend was more obvious in the Peddocks Island sediment (Figure 18). The predictions of fluorene and phenanthrene were accurate, while larger PAHs were overestimated by about 1 to 2 logarithmic units; the predicted value of the largest sorbate, dibenz[a,h]anthracene, was almost 6 logarithmic units too high! The predictions for non-planar PCBs were generally less accurate than that of PAHs (Figure 18). We note that it is possible that these field-observed Kd values were underestimated due to colloids in the aqueous phase which would significantly increase the "apparently dissolved" concentrations. It is also possible that ppLFER models overestimated Kd values for large compounds. The overestimation for planar PAHs might be resulted from steric hindrance on "pore-filling" while the overestimation of non-planar PCBs might have additional causes as discussed above for the prediction of atrazine adsorption.

25
Figure 12. Observed (data from Huang et al. 1997) and predicted log Kd values of phenanthrene at 100 µg/L on different EPA soils and sediments. The red dash lines are 1:1 ideal fitting lines. Error bars represent one standard error.
Figure 13. Observed (data from Huang et al. 1997) and predicted log Kd values of phenanthrene at 10 µg/L on different EPA soils and sediments. The red dash lines are 1:1 ideal fitting lines. Error bars represent one standard error.
Figure 14. Observed (data from Huang et al. 1997) and predicted log Kd values of phenanthrene at 1 µg/L on different EPA soils and sediments. The red dash lines are 1:1 ideal fitting lines. Error bars represent one standard error.

26
Figure 15. Observed (data from Accardi-Dey and Gschwend 2003) and predicted log Kd values for phenanthrene on the combusted Boston Harbor sediment. The red dash lines are 1:1 ideal fitting lines. Error bars represent one standard error.
Figure 16. Observed (data from Accardi-Dey and Gschwend 2002) and predicted log Kd values for pyrene on the combusted/untreated South Dorchester Bay and North Quincy Bay sediments. The red dash lines are 1:1 ideal fitting lines. Error bars represent one standard error.

27
Figure 17. Observed (data from Lohmann et al. 2005) and predicted log Kd values for some PAHs and PCBs in Boston Harbor sediment from South Dorchester Bay. The red dash lines are 1:1 ideal fitting lines. Error bars represent one standard error.
Figure 18. Observed (McGroddy 1993) and predicted log Kd values of PAHs and PCBs found from measures of sediment and porewater concentrations in a Peddocks Island (Boston Harbor) sediment box core. The red dash lines are 1:1 ideal fitting lines. Error bars represent one standard error.

28
6. Conclusions and Implications for Future Research/Implementation Overall, three primary lines of evidence support the results presented here and build confidence in the approach: (1) the Freundlich parameters, Kf and n, individually make sense (e.g., polar compounds have n values closer to 1 and hydrophobic sorbates have larger Kf); (2) the ppLFER yielded best-fit parameters from individual observations, and so the meaningful parameters are statistically justified; and (3) previous researchers have observed positive relationships between Kd and V term and negative relationships between Kd and B term for similar forms of black carbon, suggesting the accuracy of wood char and diesel soot data presented here. Further, the fit also indicates that considering sorption as a function of the degree of surface saturation (where complete saturation is assumed to correspond to saturation in solution) yields a ppLFER that is understandable with respect to sorbate-sorbent interactions. Secondly, our study strongly indicated that FA was a robust method to investigate adsorption of organic compounds to soot. This method is reliable, accurate and time efficient, and it overcomes several disadvantages of the traditional batch method: difficult soot-water separation, long equilibrium time, high sorbents consumption, and uncertainty regarding equilibrium. This method would be also applicable to other carbonaceous materials, such as char, activate carbon and carbon nanotubes. It may also be used to investigate the adsorption to BC and OC in environmental samples, such as soil, sediment and dust. Thirdly, our results support the hypothesis that two distinct types of black carbon, wood char and diesel soot, interact with organic sorbates via subtly different combinations of intermolecular interactions, which arise from the physical and chemical character of the respective sorbent materials. This implies a need for sorbent-specific black-carbon distribution coefficients (e.g., Kchar , Ksoot , Kcoal) in order to predict contaminant distribution in natural sediments or amended cleanup sites. Fortunately, we have demonstrated that a relatively small set of sorbate probe compounds can be used to generate a ppLFER that enables estimation of BC-water distribution coefficients for sorbates of interest where sorption data are unavailable (with the caution that the LFER is best used within the investigated Abraham/McGowan parameter space (i.e., need to avoid large extrapolations.) Fourthly, successful prediction of phenanthrene's Kd values on soil and sediment by ppLFER indicated that soot might be the most important sink, although the role of other BCs should be further investigated. Poor estimations of larger PAHs and PCBs' adsorption coefficients indicated that a larger molecular size and non-planar structure might hinder their adsorption to soot and other BCs. Estimations for these larger molecules based on knowledge gained from smaller compounds might be problematic. Fifthly, natural systems with more than one source of BC may require quantification of each BC type to accurately predict contaminant distribution. While independent measures to quantify distinct BC fractions are available, no single method exists to differentiate all possible fractions of BC in environmental matrices. Such a method would be useful if important chemical differences between BC types are confirmed.

29
Lastly, understanding the predominant interactions controlling partitioning to hydrophobic sorbent materials will enable selection of optimal adsorbent for target pollutants, thereby minimizing biological exposure to the contaminant, as well as the mass and cost of sorbent required.
7. Literature CitedAbraham, M.H., H.S. Chadha, G.S. Whiting, and R.C. Mitchell. (1994) Hydrogen bonding. 32.
An analysis of water-octanol and water-alkane partitioning and the ∆log P parameter of Seiler. J. Pharm. Sci. 83, 1085-1100.
Abraham, M.H. and A.J.M. Al-Hussaini. (2005) Solvation parameters for the 209 PCBs: Calculation of physicochemical properties. J. Environ. Monitoring, 7, 295-301.
Accardi-Dey A. and Gschwend P.M. (2002) Assessing the combined roles of natural organic matter and black carbon as sorbents in sediments. Environ. Sci. Technol. 36, 21-29.
Accardi-Dey, A. and Gschwend, P.M. (2003) Reinterpreting literature sorption data considering both absorption into organic carbon and adsorption onto black carbon. Environ. Sci. Technol. 37(1), 99-106.
Apul, O.G., Wang, Q.L., Shao, T., Rieck, J.R. and Karanfil, T. (2013) Predictive model development for adsorption of aromatic contaminants by multi-walled carbon nanotubes. Environ. Sci. Technol. 47(5), 2295-2303.
Bucheli, T.D. and Gustafsson, O. (2000) Quantification of the soot-water distribution coefficient of PAHs provides mechanistic basis for enhanced sorption observations. Environ. Sci. Technol. 34(24), 5144-5151.
Bucheli, T.D. and Gustafsson, O. (2003) Soot sorption of non-ortho and ortho substituted PCBs. Chemosphere 53(5), 515-522.
Chiou, C. T.; Peters, L. J.; Freed, V. H. (1979) A physical concept of soil-water equilibria for nonionic organic compounds. Science 206, 831-832.
Cornelissen, G. and Gustafsson, O. (2004) Sorption of phenanthrene to environmental black carbon in sediment with and without organic matter and native sorbates. Environ. Sci. Technol. 38(1), 148-155.
DiToro, D.M., J.A. McGrath, and D.J. Hansen. (2000a) Technical basis for narcotic chemicals and polycyclic aromatic hydrocarbon criteria. Environ. Toxicol. Chem. 19, 1951-1970.
DiToro, D.M. and J.A. McGrath. (2000b) Technical basis for narcotic chemicals and polycyclic aromatic hydrocarbon criteria. II Mixtures and sediments. Environ. Toxicol. Chem. 19,
1971-1982. Endo, S., Grathwohl, P., Haderlein, S.B. and Schmidt, T.C. (2008) Compound-specific factors influencing sorption nonlinearity in natural organic matter. Environ. Sci. Technol. 42(16), 5897-5903. Endo, S., Grathwohl, P., Haderlein, S.B. and Schmidt, T.C. (2009) Effects of native organic
material and water on sorption properties of reference diesel soot. Environ. Sci. Technol. 43(9), 3187-3193. Fernandez, L.A.; J.K. MacFarlane, A.P. Tcaciuc, and P.M. Gschwend. (2009) Measurement of
freely dissolved PAH concentrations in sediment beds using passive sampling with low density polyethylene strips. Environ. Sci. & Technol., 43, 1430-1436. Ghosh, U.; Gillette, J.S.; Luthy, R.G.; Zare, R.N. (2000) Microscale location, characterization,
and association of polycyclic aromatic hydrocarbons on harbor sediment particles. Environ. Sci. Technol., 34, 1729-1736.

30
Ghosh, U.; Talley, J.W.; Luthy, R.G. (2001) Particle-scale investigation of PAH desorption kinetics and thermodynamics from sediments. Environ. Sci. Technol., 35, 3468-3475.
Ghosh, U.; Zimmerman, J.R.; Luthy, R.G. (2003) PCB and PAH speciation among particle types in contaminated sediments and effects on PAH bioavailability. Environ. Sci. Technol., 37, 2209-2217.
Gotz, C.W., M. Scheringer, M. MacLeod, C.M. Roth, and K. Hungerbuhler. (2007) Alternative approaches for modeling gas-particle partitioning of semivolatile organic chemicals: Model development and comparison. Environ. Sci. Technol. 41, 1272-1278.
Gustafsson, O.; Haghseta, F.; Chan, C.; MacFarlane, J.K.; Gschwend, P.M. (1997) Quantification of the dilute sedimentary soot phase: Implications for PAH speciation and
bioavailability. Environ. Sci. Technol., 31(1), 203-209. Hammes, K., Smernik, R.J., Skjemstad, J.O., Herzog, A., Vogt, U.F. and Schmidt, M.W.I.
(2006) Synthesis and characterisation of laboratory-charred grass straw (Oryza saliva) and chestnut wood (Castanea sativa) as reference materials for black carbon
quantification. Organic Geochemistry 37(11), 1629-1633. Hansen, D.J., D.M. DiToro, J.A. McGrath, R.C. Swartz, D.R. Mount, R.M. Burgess, R.J.
Ozretich, H.E. Bell, and T.K. Linton. (2003) Procedures for the Derivation of Equilibrium Partitioning Sediment Benchmarks (ESBs) for the Protection of Benthic
Organisms: PAH Mixtures. EPA/600/R-02/013. November 2003. Hellou, J.; Steller, S.; Zitko, V.; Leonard, J.; King, T.; Milligan, T.G.; Yeats, P. (2002)
Partitioning of polycyclic aromatic hydrocarbons between water and particles compared to bioaccumulation in mussels: a harbour case.Mar. Env.Res., 53, 357-379.
Huang, W.L., Young, T.M., Schlautman, M.A., Yu, H. and Weber, W.J. (1997) A distributed reactivity model for sorption by soils and sediments .9. General isotherm nonlinearity and applicability of the dual reactive domain model. Environ. Sci. Technol. 31(6), 1703-1710.
Kamlet, M.J., Doherty, R.M., Abraham, M.H. and Taft, R.W. (1985) Linear solvation energy relationships .33. An analysis of the factors that influence adsorption of organic-
compounds on activated carbon. Carbon 23(5), 549-554. Karickhoff, S. W.; Brown, D. S.; Scott, T. A. (1979) Sorption of hydrophobic pollutants on
natural sediments. Water Res. 13, 241-248. Kraaij, R.H.; Tolls, J.; Sijm, D.; Cornelissen, G.; Heikens, A.; Belfroid, A. (2002) Effects of
contact time on the sequestration and bioavailability of different classes of hydrophobic organic chemicals to benthid oligochaetes (Tubificidae). Env. Tox. Chem., 21(4), 752-
759. Li, L., Quinlivan, P.A. and Knappe, D.R.U. (2002) Effects of activated carbon surface chemistry
and pore structure on the adsorption of organic contaminants from aqueous solution. Carbon 40(12), 2085-2100.
Li, L., Quinlivan, P.A. and Knappe, D.R.U. (2005) Predicting adsorption isotherms for aqueous organic micropollutants from activated carbon and pollutant properties. Environ. Sci. Technol. 39(9), 3393-3400.
Lohmann, R.; MacFarlane, J.K.; Gschwend, P.M. (2005) Importance of black carbon to sorption of native PAHs, PCBs, and PCDDs in Boston and New York Harbor sediments. Environ. Sci. Technol., 39, 141-148.
Lu, Z., MacFarlane, J.K. and Gschwend, P.M. (2015) Adsorption of organic compounds to soot: frontal analysis and polyparameter linear free energy relationship.

31
Luehrs, D.C., Hickey, J.P., Nilsen, P.E., Godbole, K.A. and Rogers, T.N. (1996) Linear solvation energy relationship of the limiting partition coefficient of organic solutes between water and activated carbon. Environ. Sci. Technol. 30(1), 143-152.
McGroddy, S. E. Sediment-porewater partitioning of PAHS and PCBS in Boston Harbor, MA Ph.D. Dissertation, University of Massachusetts, Boston, MA, 1993
Nguyen, T.H. and Ball, W.P. (2006) Absorption and adsorption of hydrophobic organic contaminants to diesel and hexane soot. Environ. Sci. Technol. 40(9), 2958-2964.
Nguyen, T.H., Sabbah, I. and Ball, W.P. (2004) Sorption nonlinearity for organic contaminants with diesel soot: Method development and isotherm interpretation. Environ. Sci. Technol.
38(13), 3595-3603. NIST (2013a) Certificate of analysis standard reference material 1650b diesel particulate matter, Gaithersburg, MD. NIST (2013b) Certificate of analysis standard reference material 2975 diesel particulate matter
(industrial forklift), Gaithersburg, MD. Pignatello, J.J. (2013) Adsorption of dissolved organic compounds by black carbon, Springer, Dordrecht. Plata, D.L., Hemingway, J.D. and Gschwend, P.M. (2015) Polyparameter linear free energy
relationship for wood char-water sorption coefficients of organic sorbates. Environ. Toxicol. Chem. in press.
Poole, S.K. and Poole, C.F. (1997) Retention of neutral organic compounds from solution on carbon adsorbents. Analytical Communications 34(9), 247-251.
Schwarzenbach, R.P., P.M. Gschwend, and D.M. Imboden. Environmental Organic Chemistry, 2nd Edition, Wiley-Interscience, New York, N.Y., 1313 pp., 2003.
SERDP/ESTCP Expert Panel Workshop on Research & Development Needs for Understanding & Assessing the Bioavailability of Contaminants in Soils & Sediments. Workshop Report, November, 2008.
Shih, Y.-H., Su, Y.-F., Ho, R.-Y., Su, P.-H. and Yang, C.-Y. (2012) Distinctive sorption mechanisms of 4-chlorophenol with black carbons as elucidated by different pH. Science of the Total Environment 433, 523-529.
Shih, Y.H. and Gschwend, P.M. (2009) Evaluating activated carbon-water sorption coefficients of organic compounds using a linear solvation energy relationship approach and sorbate chemical activities. Environ. Sci. Technol. 43(3), 851-857.
Tracey, G.A. and Hansen D.J. (1996) Use of biota-sediment accumulation factors to assess similarity of nonionic organic chemical exposure to benthically-coupled organisms of differing trophic mode. Arch. Environ. Contam. Tox., 30, 467-475.
Tulp, H.C., Goss, K.U., Schwarzenbach, R.P. and Fenner, K. (2008) Experimental determination of LSER parameters for a set of 76 diverse pesticides and pharmaceuticals. Environ. Sci. & Technol. 42(6), 2034-2040.
Zhao, Q., Yang, K., Li, W. and Xing, B.S. (2014) Concentration-dependent polyparameter linear free energy relationships to predict organic compound sorption on carbon nanotubes. Scientific Reports 4.
Zissimos, A.M., Abraham, M.H., Klamt, A., Eckert, F. and Wood, J. (2002) A comparison between the two general sets of linear free energy descriptors of Abraham and Klamt. Journal of Chemical Information and Computer Sciences 42(6), 1320-1331.

32
8. AppendicesScientific/Technical Publications
Plata, D.L., J.D. Hemingway, and P.M. Gschwend. Polyparameter linear free energy relationship for wood char–water sorption coefficients of organic sorbates. Environ. Toxicol. & Chem. 34, 2015.
Lu, Z., J.K. MacFarlane, and P.M. Gschwend. Adsorption of organic compounds to soot: frontal analysis and polyparameter linear free energy relationship. submitted.
Plata, D.L. and P.M. Gschwend, “Black Carbon-Water Sorption Coefficients of Organic Contaminants”. poster presentation at SERDP and ESTCP’s annual Partners in Environmental Technology, Dec. 2011.