Final report - Review of access pricing on the NSW grain ... · Review of access pricing on the NSW...
120
Independent Pricing and Regulatory Tribunal Review of access pricing on the NSW grain line network Transport — Final Report April 2012
-
Upload
phungquynh -
Category
Documents
-
view
213 -
download
0
Transcript of Final report - Review of access pricing on the NSW grain ... · Review of access pricing on the NSW...
Independent Pricing and Regulatory Tribunal
Review of access pricing on the
NSW grain line network
Transport — Final ReportApril 2012


Review of access pricing on the NSW grain line network
Transport — Final Report April 2012

ii IPART Review of access pricing on the NSW grain line network
© Independent Pricing and Regulatory Tribunal of New South Wales 2012
This work is copyright. The Copyright Act 1968 permits fair dealing for study, research, news reporting, criticism and review. Selected passages, tables or diagrams may be reproduced for such purposes provided acknowledgement of the source is included.
ISBN 978-1-921929-79-3 S9-77
The Tribunal members for this review are:
Dr Peter J Boxall AO, Chairman
Mr James Cox PSM, Chief Executive Officer and Full Time Member
Ms Sibylle Krieger, Part Time Member
Inquiries regarding this document should be directed to a staff member:
Melanie Mitchell (02) 9113 7743
Brett Everett (02) 9290 8423
Independent Pricing and Regulatory Tribunal of New South Wales PO Box Q290, QVB Post Office NSW 1230 Level 8, 1 Market Street, Sydney NSW 2000
T (02) 9290 8400 F (02) 9290 2061
www.ipart.nsw.gov.au

Contents
Review of access pricing on the NSW grain line network IPART iii
Contents
1 Executive Summary 1 1.1 What have we been asked to do? 2 1.2 How have we approached the task? 2 1.3 What are our key recommendations? 4 1.4 Overview of other complementary recommendations 12 1.5 What is the structure of this report? 12 1.6 A complete list of our recommendations. 13
2 Context for this review 15 2.1 What is the grain line network? 15 2.2 Who are the key stakeholders? 17 2.3 What are the key problems facing the grain line network? 17 2.4 What were the outcomes of previous reviews of the grain line network? 20
3 What are the costs of maintaining the network and what proportion is recovered from users? 21 3.1 Final Findings 21 3.2 What are the efficient below-rail costs of the network? 21 3.3 What is the level of cost recovery? 27
4 Are the current access prices and government subsidy appropriate? 32 4.1 Final Findings 32 4.2 What are the external benefits of the network? 33 4.3 What level of government subsidy is justified by the external benefits of the
network? 35
5 Does rail have a competitive advantage over road for transporting grain? 42 5.1 Final Findings 42 5.2 Supply chain costs of transporting grain to port by rail and road 43 5.3 Total supply chain cost of transporting grain to port by rail and road 48
6 Are there any non-price solutions that would improve cost recovery? 54 6.1 Final Findings 54 6.2 Can cost recovery be improved without increasing access prices? 55 6.3 Stakeholder submissions 55 6.4 IPART findings 56

Contents
iv IPART Review of access pricing on the NSW grain line network
7 What is an appropriate access price level and arrangement? 59 7.1 Final Findings 59 7.2 What is an appropriate increase in access prices? 60 7.3 What is an appropriate access price structure? 62 7.4 How should the access price be implemented? 66
8 What is the impact of our recommended access price on stakeholders? 69 8.1 Final Findings 70 8.2 What is the impact of our recommended access price increase on rail users? 70 8.3 What is the impact on government? 76
9 Complementary measures to promote sustainability on the grain line network 81 9.1 Final Findings 81 9.2 Do the regulatory arrangements governing the CRN warrant change? 82 9.3 Does the government subsidise heavy vehicle road use? 87 9.4 How could the government undertake a more integrated approach to
funding rail and road projects? 92
Appendices 96 A Terms of Reference 99 B Map of NSW Country Regional Network 102 C Outlook for the NSW grain industry 103 D Cost-benefit assessment of line upgrades 109 E Glossary 111
1 Executive Summary
Review of access pricing on the NSW grain line network IPART 1
1 Executive Summary
Grain is one of the State’s major commodities. In 2011/12, the export value of wheat is expected to exceed $1.5 billion, making it the most valuable non-mineral export commodity.1 The grain line network plays an important role in transporting grain from grain growing regions in the far north, west and south of the State to port and to large domestic users. In the absence of the grain line network, over 1.5 million tonnes of grain would need to be transported to a main line consolidation facility or to a port/large domestic user by road. This would increase the number of trucks on rural and regional roads and the costs to communities of maintaining these roads.
The grain line network is old, and many parts of it have fallen below a standard considered fit for the purpose of transporting grain. Currently, the government funds over 95% of ongoing maintenance costs and has engaged John Holland to provide maintenance and operations services on the network for the next 10 years in a contract worth around $1.5 billion.
While use of the grain lines instead of the road network generates positive external benefits for the wider community, at current levels of usage and access prices, rail users contribute less to maintenance costs than the value of benefits they gain privately from using the network. However, increasing levels of competition from a competitive and innovative road supply chain constrain the price that rail users can be charged for use.
Historically, limited government funding and competing budget priorities have resulted in lengthy periods of uncertainty about the sustainability of many lines and discouraged industry investment in the rail supply chain. Governments have long been aware of this issue and have reviewed the grain line network several times.
In 2009, the NSW Grain Freight Review commissioned by the Australian Government examined the efficiency of the grain supply chain in NSW and the ongoing viability of the grain line network. It recommended that most grain lines should remain open, because the total costs of increased grain traffic on the road network would outweigh the costs of keeping the lines open.2
1 ABS, Value of Agricultural Commodities Produced, 7503.0, 2009-2010. 2 Department of Infrastructure, Transport, Regional Development and Local Government, NSW
Grain Freight Review, 2009.
1 Executive Summary
2 IPART Review of access pricing on the NSW grain line network
In light of this, the NSW Grain Freight Review recommended that most lines be stabilised at a minimum ‘fit-for-purpose’ standard through a non-recoverable NSW government grant, contingent on industry investment in other supply chain improvements. It recommended that the NSW Government review future access charges to determine an appropriate user contribution to the cost of ongoing maintenance of the lines.
Our Final Report recommends a grain line access price increase from $2.61 to $5.22 per thousand gross tonne kilometres over a period of 2 years. While the impact of this increase is expected to be small for users (around 1.4% of the total rail transportation cost to port) it is an important move towards improving cost recovery on some lines and increasing user contribution to the share of benefits they receive from using the lines.
1.1 What have we been asked to do?
In December 2010, the former NSW Government asked the Independent Pricing and Regulatory Tribunal of NSW (IPART) to investigate and recommend future access pricing arrangements to promote the sustainability of the network, taking into account:
the efficient costs of providing grain freight services over the next 5 years
the impact of recommended prices on the road network and requirements for government funding of the grain line network, and
the ability and willingness of the grain industry to pay the recommended access prices (see Appendix A for the full terms of reference).
We have completed our review and formulated our final recommendations on access pricing and arrangements, as well as complementary reforms to improve the sustainability of some of the lines. The purpose of this report is to explain our final recommendations to the NSW Government and the key findings that support them.
1.2 How have we approached the task?
Throughout this review, stakeholders argued strongly and unanimously that to promote the sustainability of the network, any changes in access prices should not remove rail’s competitive advantage over road for grain haulage. They argued that it would encourage current rail users to shift to road transport, which would further reduce the sustainability of the network and may lead to the closure of some or all lines. This would increase heavy vehicle traffic on rural and regional roads, which in turn would increase road maintenance and other costs that this traffic imposes on the community.
1 Executive Summary
Review of access pricing on the NSW grain line network IPART 3
We undertook our own analysis to estimate the cost of transporting grain by rail or road to port. We also determined the efficient costs of maintaining the network and the external benefits that it generates for the wider community by displacing grain trucks from the road network.
To do this, we obtained expert advice from Mr Mike Smart from Sapere Research Group Limited (Sapere) and Deloitte Touché Tohmatsu (Deloitte). Reports by Deloitte and Sapere are summarised in our Draft Report and in the following chapters of our Final Report and are also available on our website.3
We consulted stakeholders by inviting submissions on our Issues Paper, Draft Report and participation at a public roundtable hearing. We have considered all information and views from stakeholders and incorporated them into our decision-making on Final Recommendations.
The key steps in our approach to making our Final Findings and Recommendations were to:
1. Determine the efficient costs of maintaining the network, including capital investment required to stabilise lines at their current operating standard and expected future ongoing maintenance costs.
2. Examine whether users are paying an appropriate contribution towards the costs of maintaining the network, taking into account the net external benefits generated by the network compared to transporting grain by road.
3. Estimate the cost to users of transporting grain from farm to port by rail and road for each grain line route and compare the 2 supply chains to quantify rail’s cost advantage over road at current access prices.
4. Consider whether there are other options to improve cost recovery without increasing access prices. Other options include:
a) reducing below-rail maintenance costs
b) increasing the amount of traffic on the lines
c) track upgrades as a mechanism to reduce operating costs and attract additional demand.
5. Having determined in step 4 that non-price solutions were unlikely to improve cost recovery levels, we revisited the results of the supply chain cost analysis in step 3 and determined how much access prices could be increased without eroding rail’s cost advantage over road.
6. Decide on appropriate access pricing arrangements and implementation.
7. Evaluate the impact of our recommended access price on rail users’ willingness to pay, government funding and other stakeholders.
3 www.ipart.nsw.gov.au
1 Executive Summary
4 IPART Review of access pricing on the NSW grain line network
8. Consider the need for complementary measures to promote the sustainability of the network, including any changes to the current regulatory regime, heavy vehicle user charging and government funding of rail and road infrastructure projects.
1.3 What are our key recommendations?
Following consideration of stakeholder submissions to the Draft Report and further analysis of our own, our Final Recommendations are largely unchanged from the Draft Recommendations. We recommend that:
The access price that applies to the grain line network should be increased to $5.22 per thousand gross tonne kilometres in real terms (an increase of 100% on the current price), phased in over the next 2 years. The impact of the price increase on users is expected to be small – around 1.4% of the total rail cost to port.
Prices should then be increased in line with the change in CPI for the remaining 3 years of the 5-year period under review.
Access prices could be reviewed towards the end of the 5-year period to determine the potential for a further increase towards improving cost recovery and user contribution to the share of benefits they receive from using the lines. This should take into account any changes to maintenance costs, road and rail supply chain costs, heavy vehicle user charging and net external benefits among other factors.
The structure of the access price should be simplified so it comprises one variable price for the whole network. This should be published each year to improve transparency.
The access price should apply to all traffic that uses the network, including non-grain freight.
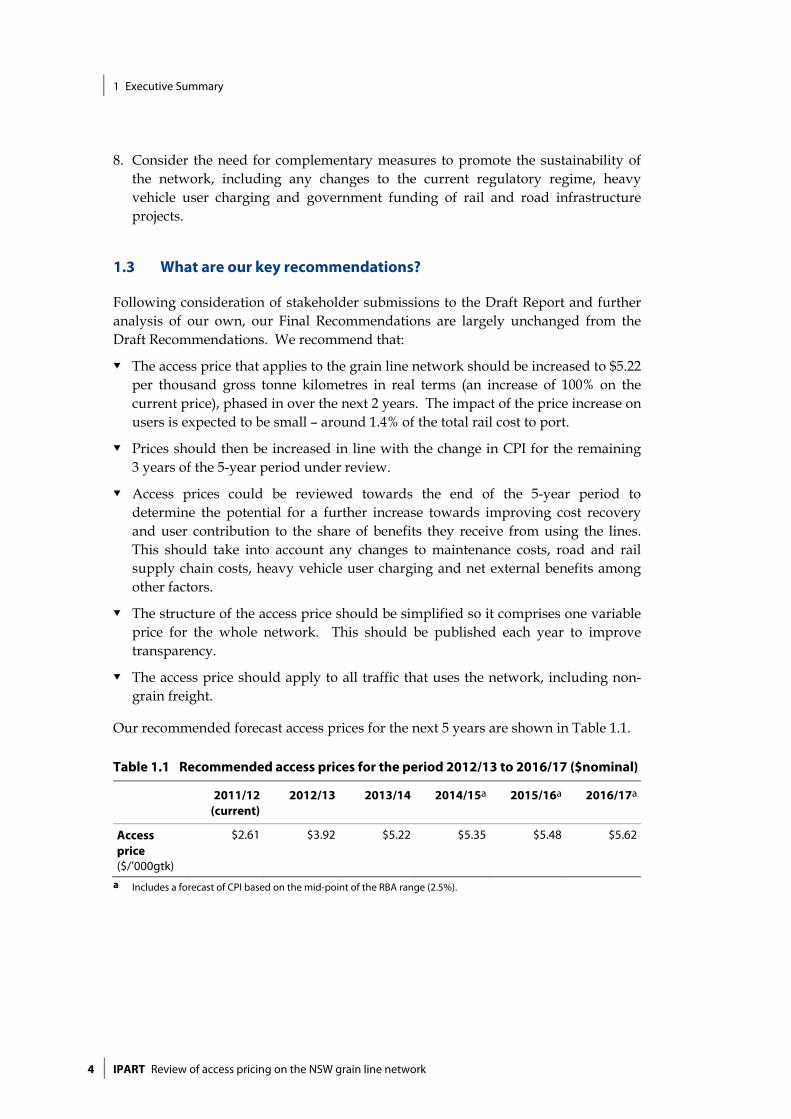
Our recommended forecast access prices for the next 5 years are shown in Table 1.1.
Table 1.1 Recommended access prices for the period 2012/13 to 2016/17 ($nominal)
2011/12 (current)
2012/13 2013/14 2014/15a 2015/16a 2016/17a
Access price ($/’000gtk)
$2.61 $3.92 $5.22 $5.35 $5.48 $5.62
a Includes a forecast of CPI based on the mid-point of the RBA range (2.5%).
1 Executive Summary
Review of access pricing on the NSW grain line network IPART 5
1.3.1 Why should grain line access prices increase?
Unsustainable level of cost recovery
The owner and operator of the grain line network – the Country Rail Infrastructure Authority (CRIA), an agency within Transport for NSW – recovers about 2.3% of the current costs it incurs in operating and maintaining the network through access revenue. It relies on government subsidies to fund the remaining 97.7% of these costs (see Table 1.2), including a substantial capital investment of around $145 million ($2011/12) to 2020 to stabilise the lines at their current operating standard. This is on top of the annual investment of $20.4 million ($2011/12) for ongoing maintenance.
Post-stabilisation in 2020, we calculate that the government will recover 4.4% of ongoing maintenance costs at current access prices. In particular, some lines will recover less than 1% of ongoing maintenance costs. This low level of cost recovery is not sustainable and in the past, has led to lengthy periods of poor service levels, uncertainty and underinvestment in the rail supply chain.
1 Executive Summary
6 IPART Review of access pricing on the NSW grain line network
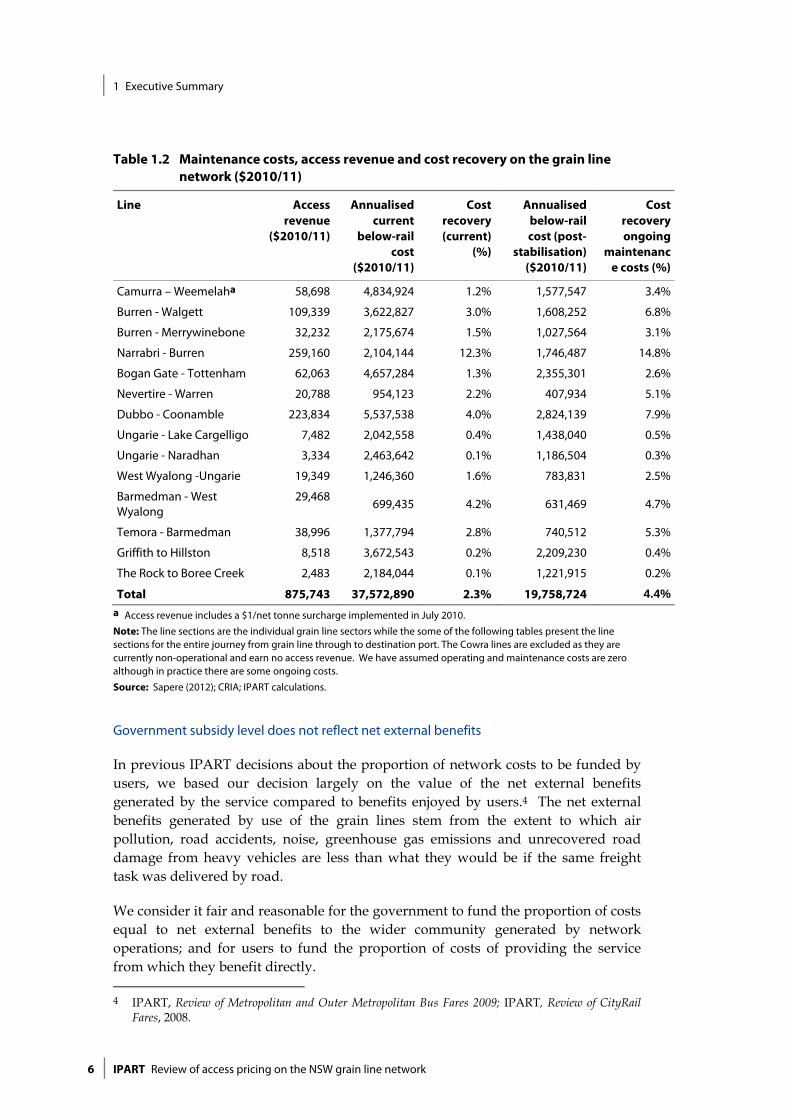
Table 1.2 Maintenance costs, access revenue and cost recovery on the grain line network ($2010/11)
Line Access revenue
($2010/11)
Annualised current
below-rail cost
($2010/11)
Cost recovery (current)
(%)
Annualised below-rail cost (post-
stabilisation) ($2010/11)
Cost recovery ongoing
maintenance costs (%)
Camurra – Weemelaha 58,698 4,834,924 1.2% 1,577,547 3.4%
Burren - Walgett 109,339 3,622,827 3.0% 1,608,252 6.8%
Burren - Merrywinebone 32,232 2,175,674 1.5% 1,027,564 3.1%
Narrabri - Burren 259,160 2,104,144 12.3% 1,746,487 14.8%
Bogan Gate - Tottenham 62,063 4,657,284 1.3% 2,355,301 2.6%
Nevertire - Warren 20,788 954,123 2.2% 407,934 5.1%
Dubbo - Coonamble 223,834 5,537,538 4.0% 2,824,139 7.9%
Ungarie - Lake Cargelligo 7,482 2,042,558 0.4% 1,438,040 0.5%
Ungarie - Naradhan 3,334 2,463,642 0.1% 1,186,504 0.3%
West Wyalong -Ungarie 19,349 1,246,360 1.6% 783,831 2.5%
Barmedman - West Wyalong
29,468 699,435 4.2% 631,469 4.7%
Temora - Barmedman 38,996 1,377,794 2.8% 740,512 5.3%
Griffith to Hillston 8,518 3,672,543 0.2% 2,209,230 0.4%
The Rock to Boree Creek 2,483 2,184,044 0.1% 1,221,915 0.2%
Total 875,743 37,572,890 2.3% 19,758,724 4.4%
a Access revenue includes a $1/net tonne surcharge implemented in July 2010.
Note: The line sections are the individual grain line sectors while the some of the following tables present the line sections for the entire journey from grain line through to destination port. The Cowra lines are excluded as they are currently non-operational and earn no access revenue. We have assumed operating and maintenance costs are zero although in practice there are some ongoing costs.
Source: Sapere (2012); CRIA; IPART calculations.
Government subsidy level does not reflect net external benefits
In previous IPART decisions about the proportion of network costs to be funded by users, we based our decision largely on the value of the net external benefits generated by the service compared to benefits enjoyed by users.4 The net external benefits generated by use of the grain lines stem from the extent to which air pollution, road accidents, noise, greenhouse gas emissions and unrecovered road damage from heavy vehicles are less than what they would be if the same freight task was delivered by road.
We consider it fair and reasonable for the government to fund the proportion of costs equal to net external benefits to the wider community generated by network operations; and for users to fund the proportion of costs of providing the service from which they benefit directly. 4 IPART, Review of Metropolitan and Outer Metropolitan Bus Fares 2009; IPART, Review of CityRail
Fares, 2008.
1 Executive Summary
Review of access pricing on the NSW grain line network IPART 7
External benefits are not generated by the existence of the network itself, but depend on the degree of use of the network. As such, they vary substantially by harvest (year) and by line. Our analysis shows that using historical volumes of grain and general freight on the network over the last 5 years as a proxy for expected volumes in the next 5 years, costs are 2.7 times higher than the net external benefits generated at current access prices. Expected future ongoing maintenance costs would still be 1.4 times higher than net external benefits.
Our findings indicate that the current government subsidy on the lines is too high. While some level of government subsidy is appropriate; our analysis suggests that the current subsidy is considerably greater than the external benefits to the wider community and that the user contribution to maintenance costs should increase.
Cost recovery is not likely to be improved through other means
In submissions and at our roundtable, stakeholders suggested that cost recovery could be increased through alternative means including:
reducing below-rail maintenance costs
increasing the amount of traffic on the lines
track upgrades as a mechanism to reduce operating costs and attract additional demand.
We considered the merits of these options and determined that none of them have the potential to increase access revenue by any meaningful amount. Therefore, as a first step towards improving sustainability, we consider that access prices need to increase so that users fund a greater proportion of maintenance costs.
1.3.2 Why have we recommended an increase to $5.22 per thousand gross tonne kilometres?
Unlike public transport services, the grain line network is not a large natural monopoly. It faces direct competition from road for the grain transportation task. Achieving user cost recovery in line with the average proportion of benefits of the network enjoyed by users may force considerable volumes of grain traffic onto roads.
Throughout this review, stakeholders have argued strongly and unanimously that any increase in access prices should not remove rail’s cost advantage over road for transporting grain, so as not to shift current grain traffic from rail to road. We accept that this is a widespread concern and have designed our approach to ensure that the cost advantage of transporting grain on the grain line network is maintained as a result of our recommended access price, noting that this cost advantage is the result of a substantial government subsidy.
1 Executive Summary
8 IPART Review of access pricing on the NSW grain line network
We sought advice from stakeholders about how rail and road compete and investigated the total rail and road supply chain costs. We then made a conservative estimate of rail’s cost advantage over road and tested this using alternative assumptions put forward by stakeholders.
We found that rail had an average $17.12 per tonne cost advantage over road. Under the most extreme sensitivity testing scenario, rail cost advantage is reduced by 20% to an average of $13.65 per tonne. None of the lines exhibited a negative rail cost advantage.
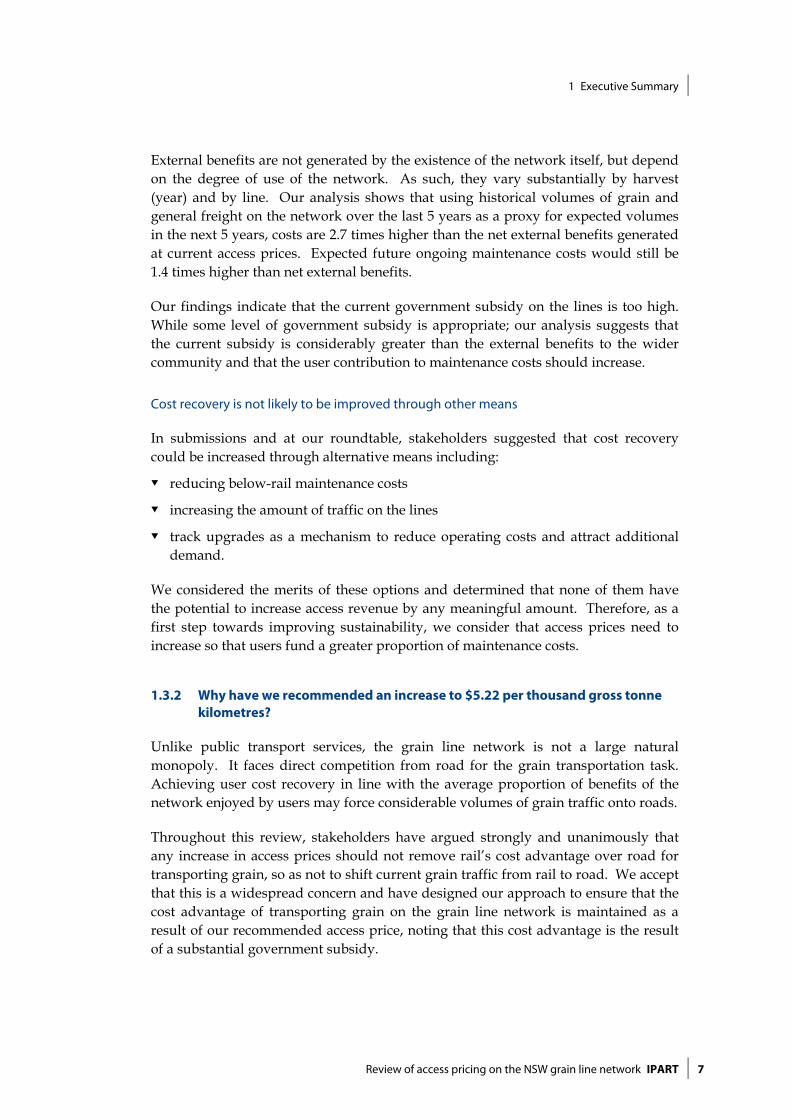
We recommend an access price increase that will keep rail supply chain costs well below equivalent road supply chain costs, to minimise the risk that the access price will trigger a substantial loss of rail market share. An access price increase to $5.22 per thousand gross tonne kilometres in real terms will maintain rail’s substantial cost advantage over road (on average $16.56 per tonne). The results of our analysis are summarised in Table 1.3.
Table 1.3 Rail’s cost advantage over road with our recommended increase in access price ($2011/12)
Line Rail supply chain costs (with 100%
access price increase) ($/tonne)
Road supply chain costs
($/tonne)
Rail’s cost advantage
(current access price)
($/tonne)
Rail’s cost advantage
(with 100% access price
increase) ($/tonne)
Weemelah – Newcastlea 42.82 63.13 19.78 20.30
Walgett – Newcastle 42.49 65.65 24.10 23.15
Merrywinebone – Newcastle 40.81 65.04 24.98 24.23
Tottenham – Port Kembla 49.91 63.74 14.47 13.83
Warren – Port Kembla 52.32 66.19 13.98 13.87
Coonamble – Port Kembla 50.71 69.27 19.39 18.56
Greenethorpe – Port Kemblab
36.69 42.78 6.62 6.09
Cowra – Port Kemblab 36.30 44.53 8.79 8.23
Lake Cargelligo – Port Kembla
45.30 62.15 17.84 16.85
Naradhan – Port Kembla 44.86 62.62 18.70 17.76
Hillston – Port Kembla 47.09 67.93 21.43 20.83
Boree Creek – Port Kembla 43.33 58.32 15.30 14.99
Average 44.39 60.94 17.12 16.56 a Current access price on Camurra – Weemelah include a $1/ tonne surcharge introduced in July 2010. Proposed new access price would drop the surcharge and increase the remaining charge by 100%. The net effect of these steps is to reduce the access price on this line and increase rail’s cost advantage. b Lines currently non-operational.
Note: The line sections are for the entire journey from grain line through to destination port.
Source: IPART calculations.
1 Executive Summary
Review of access pricing on the NSW grain line network IPART 9
Based on stakeholder feedback, we recommend a simplified price structure and publication of prices to provide users with transparency and certainty about the costs of using the network and how these costs will change over time. We recommend that the same access price be charged for grain and non-grain freight using the network.
1.3.3 What is the impact of our recommended access price increase on stakeholders?
Impact on rail users
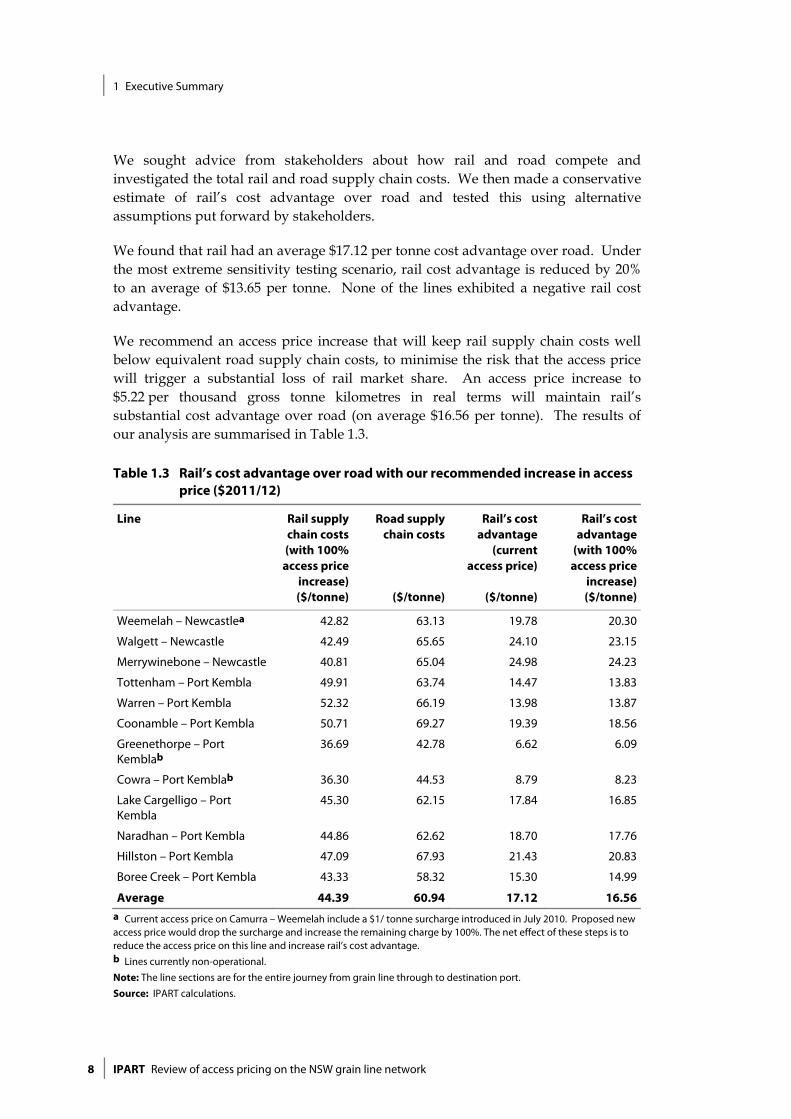
Grain line access prices make up a small component of the cost of transporting grain to port and an even smaller proportion of the average price of grain. This is illustrated in Figure 1.1.
Our recommended access price increase equates to approximately 56 cents per tonne of grain on an average 120 km grain line journey. Including the increase, the grain line access price is around 3% of the cost of transporting grain to port by rail and less than 1% of the total price per tonne of grain.
Figure 1.1 New grain line access price as a proportion of supply chain costs ($/tonne)
Data source: Deloitte (2011); GrainCorp submission (2011); GrainCorp, Bulk Wheat Port Terminal Services Fee Schedule, Annexure A, June 2011; Toepfer International, Daily Grain Prices for NSW, 26/03/12; IPART calculations.
Given that the recommended access price comprises such a small proportion of the total rail transportation costs, we consider that it is unlikely to have a significant impact on users’ willingness to pay and hence, their transportation decisions.
1 Executive Summary
10 IPART Review of access pricing on the NSW grain line network
Impact on government cost recovery
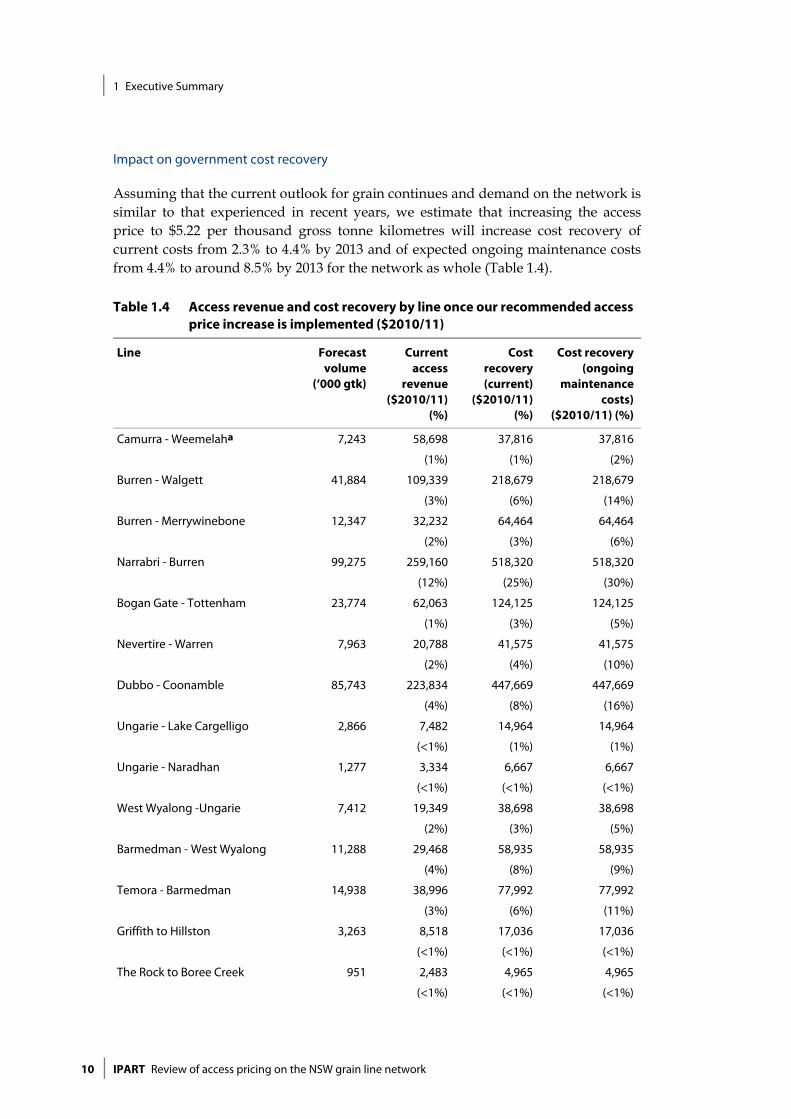
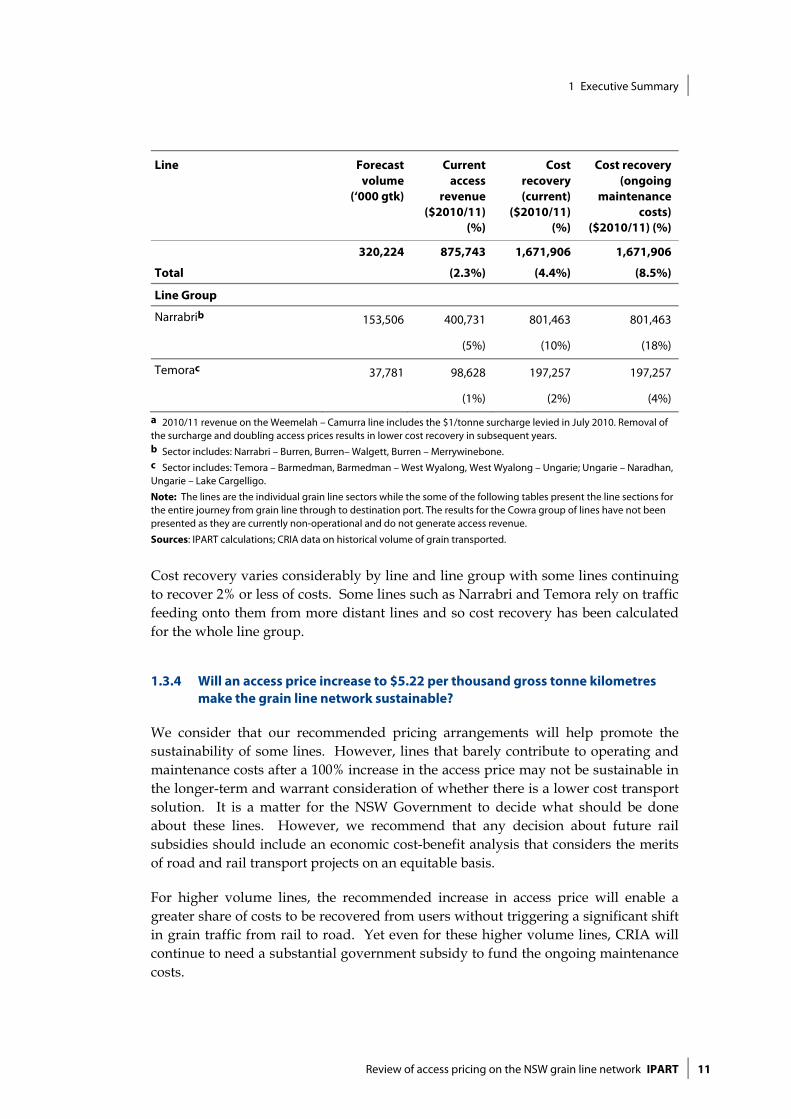
Assuming that the current outlook for grain continues and demand on the network is similar to that experienced in recent years, we estimate that increasing the access price to $5.22 per thousand gross tonne kilometres will increase cost recovery of current costs from 2.3% to 4.4% by 2013 and of expected ongoing maintenance costs from 4.4% to around 8.5% by 2013 for the network as whole (Table 1.4).
Table 1.4 Access revenue and cost recovery by line once our recommended access price increase is implemented ($2010/11)
Line Forecast volume
(‘000 gtk)
Current access
revenue ($2010/11)
(%)
Cost recovery (current)
($2010/11) (%)
Cost recovery (ongoing
maintenance costs)
($2010/11) (%)
Camurra - Weemelaha 7,243 58,698
(1%)
37,816
(1%)
37,816
(2%)
Burren - Walgett 41,884 109,339
(3%)
218,679
(6%)
218,679
(14%)
Burren - Merrywinebone 12,347 32,232
(2%)
64,464
(3%)
64,464
(6%)
Narrabri - Burren 99,275 259,160
(12%)
518,320
(25%)
518,320
(30%)
Bogan Gate - Tottenham 23,774 62,063
(1%)
124,125
(3%)
124,125
(5%)
Nevertire - Warren 7,963 20,788
(2%)
41,575
(4%)
41,575
(10%)
Dubbo - Coonamble 85,743 223,834
(4%)
447,669
(8%)
447,669
(16%)
Ungarie - Lake Cargelligo 2,866 7,482
(<1%)
14,964
(1%)
14,964
(1%)
Ungarie - Naradhan 1,277 3,334
(<1%)
6,667
(<1%)
6,667
(<1%)
West Wyalong -Ungarie 7,412 19,349
(2%)
38,698
(3%)
38,698
(5%)
Barmedman - West Wyalong 11,288 29,468
(4%)
58,935
(8%)
58,935
(9%)
Temora - Barmedman 14,938 38,996
(3%)
77,992
(6%)
77,992
(11%)
Griffith to Hillston 3,263 8,518
(<1%)
17,036
(<1%)
17,036
(<1%)
The Rock to Boree Creek 951 2,483
(<1%)
4,965
(<1%)
4,965
(<1%)
1 Executive Summary
Review of access pricing on the NSW grain line network IPART 11
Line Forecast volume
(‘000 gtk)
Current access
revenue ($2010/11)
(%)
Cost recovery (current)
($2010/11) (%)
Cost recovery (ongoing
maintenance costs)
($2010/11) (%)
Total
320,224 875,743
(2.3%)
1,671,906
(4.4%)
1,671,906
(8.5%)
Line Group
Narrabrib 153,506 400,731
(5%)
801,463
(10%)
801,463
(18%)
Temorac 37,781 98,628
(1%)
197,257
(2%)
197,257
(4%)
a 2010/11 revenue on the Weemelah – Camurra line includes the $1/tonne surcharge levied in July 2010. Removal of the surcharge and doubling access prices results in lower cost recovery in subsequent years. b Sector includes: Narrabri – Burren, Burren– Walgett, Burren – Merrywinebone. c Sector includes: Temora – Barmedman, Barmedman – West Wyalong, West Wyalong – Ungarie; Ungarie – Naradhan, Ungarie – Lake Cargelligo.
Note: The lines are the individual grain line sectors while the some of the following tables present the line sections for the entire journey from grain line through to destination port. The results for the Cowra group of lines have not been presented as they are currently non-operational and do not generate access revenue.
Sources: IPART calculations; CRIA data on historical volume of grain transported.
Cost recovery varies considerably by line and line group with some lines continuing to recover 2% or less of costs. Some lines such as Narrabri and Temora rely on traffic feeding onto them from more distant lines and so cost recovery has been calculated for the whole line group.
1.3.4 Will an access price increase to $5.22 per thousand gross tonne kilometres make the grain line network sustainable?
We consider that our recommended pricing arrangements will help promote the sustainability of some lines. However, lines that barely contribute to operating and maintenance costs after a 100% increase in the access price may not be sustainable in the longer-term and warrant consideration of whether there is a lower cost transport solution. It is a matter for the NSW Government to decide what should be done about these lines. However, we recommend that any decision about future rail subsidies should include an economic cost-benefit analysis that considers the merits of road and rail transport projects on an equitable basis.
For higher volume lines, the recommended increase in access price will enable a greater share of costs to be recovered from users without triggering a significant shift in grain traffic from rail to road. Yet even for these higher volume lines, CRIA will continue to need a substantial government subsidy to fund the ongoing maintenance costs.
1 Executive Summary
12 IPART Review of access pricing on the NSW grain line network
1.4 Overview of other complementary recommendations
We have recommended some other complementary measures to assist in delivering improvements to the sustainability of the network. These measures include:
Industry coordination - through a more structured and collaborative approach to decision making on the network between the below and above-rail operators and industry stakeholders.
Mode-neutral freight strategy - we support the NSW Government’s goal in its NSW 2021 plan to invest in strategic and coordinated infrastructure. We consider that the plan should be mode-neutral and identify the best transport options in selected regional routes, rather than funding competing rail and road infrastructure.
Line viability – for lines that have a low cost recovery and external benefit outlook, the NSW Government should consider the best transport solution via a comprehensive demonstration of the costs and benefits prior to any future capital investment.
Road cost offset – for rail lines that are not the best transport option following the NSW Government’s analysis, the funding earmarked for maintaining these lines could be used to offset any increased road maintenance costs or to bring forward stabilisation works on more viable lines.
Heavy vehicle road user charging - while recognising that heavy vehicles may pay for their use of roads in aggregate, reforms are required to ensure that these charges better reflect the actual costs of use of different types and locations of roads. This will enable more transparent decisions about government subsidies to road and rail.
1.5 What is the structure of this report?
The following chapters and appendices explain our final findings and recommendations in detail:
Chapter 2 discusses the context for the review, including the grain line network, key stakeholders, problems facing the network and outcomes from previous reviews.
Chapter 3 identifies the efficient costs of maintaining the network including stabilisation costs and ongoing maintenance costs post-2020.
Chapter 4 assesses whether the user contribution to current and expected future ongoing maintenance costs are appropriate.
Chapter 5 explains our final findings on how the costs of the rail and road supply chains compare and tests the impact of varying assumptions.
Chapter 6 considers whether there are non-price solutions to increase cost recovery.
1 Executive Summary
Review of access pricing on the NSW grain line network IPART 13
Chapter 7 explains our final findings on the extent to which access prices could be increased without eroding rail’s cost advantage as well as appropriate access pricing arrangements and implementation.
Chapter 8 assesses the impact of our final recommendations on rail users and government cost recovery.
Chapter 9 discusses our final recommendations on complementary reforms to improve the sustainability of the network including the current regulatory arrangements, heavy vehicle user charging and future funding of road and rail transport projects.
Appendices 1-5 provide background information and a glossary of terms.
1.6 A complete list of our recommendations.
We recommend that:
1 Any future upgrades of grain lines to a Class 2 standard or higher should be: 58
– negotiated on the basis of a comprehensive cost benefit analysis that includes consideration of non-grain traffic 58
– funded primarily by the parties to whom the benefits accrue, through an appropriate funding mechanism. 58
2 An increase of the grain line access price to $5.22 per thousand tonne kilometres provides a good balance between improving cost recovery and maintaining rail’s modal share in the short-term. 61
3 At the end of the 5-year period, the NSW Government could review the access price to determine whether there is scope to increase it to a level that is more commensurate with user share of benefits, taking into account constraints from road competition amongst other factors. 62
4 The access price structure should be simplified so that a single variable access price is applied across all lines. 66
5 The access price should be published. 66
6 The access price should apply to all traffic that uses the grain line network, including non-grain freight. 66
7 The access price increase should be phased in over 2 years. 67
8 Should the NSW Government pursue a review of the regulatory arrangements for some or all of the grain lines; it would be prudent to extend that review to incorporate the current regulatory and structural arrangements that apply to the
1 Executive Summary
14 IPART Review of access pricing on the NSW grain line network
NSW Government’s ownership interests in the greater CRN and Hunter Valley rail network. 83
9 The NSW Government should consider the establishment of an industry coordination forum to facilitate greater coordination of operations and investment in the network. The forum could advise on maintenance priorities, investment decisions and funding contributions. 87
10 Further analysis on the long-run marginal costs of road wear caused by heavy vehicles that transport grain is required to understand the overall government subsidy to road and rail freight transport infrastructure. 90
11 The NSW Government should continue to pursue national reforms to national heavy vehicle charging, such that it better reflects the actual costs of heavy vehicle use of regional and local road infrastructure. 91
12 The NSW Government should take a mode-neutral approach to the future provision of subsidies for freight transport infrastructure. This should include a comprehensive demonstration of the costs and benefits for rail and road transport projects on a like basis. 95
13 Should the NSW Government decide to suspend operations on any of the current lines, the funding earmarked for maintenance on those lines could be used to offset any increased road maintenance costs or to bring forward stabilisation works on more viable lines. 95

2 Context for this review
Review of access pricing on the NSW grain line network IPART 15
2 Context for this review
This chapter provides background on the unique characteristics of the grain line network. It explains how the recommendations of previous reviews have led to this review and its scope.
2.1 What is the grain line network?
The NSW grain line network is a collection of lines that connect the grain growing regions in the North-West, Central-West and South-West of the State to the main line rail network. A diagram of the lines is included in Appendix B. Many of the lines are over 100 years old and are mainly Class 5 and Class 3 standard, which enables them to carry only light axle locomotives at low speeds.5
In our Issues Paper, we defined the network as the 19 lines that were assessed as part of the NSW Grain Freight Review (2009). On 1 July 2011, the operation of 2 of these lines was transferred to the Australian Rail Track Corporation (ARTC) – Moree to Camurra and Camurra to North Star. As such, these 2 lines are no longer included in our review.
We also noted that the Cowra lines were no longer operational, but their potential re-opening was subject to a Ministerial Taskforce review. As such, these lines have been considered as part of our review.
CRIA also advised that following the termination of the previous management contract with ARTC, there were some minor boundary changes to the interface points between the ARTC leased network and the CRN for some grain lines. Table 2.1 provides an updated list of the grain lines considered in this review and their current classification. Table 2.2 provides a description of the line classifications.
5 See Table 2.2 for definitions.

2 Context for this review
16 IPART Review of access pricing on the NSW grain line network
Table 2.1 NSW grain line network: sectors included in the scope of our review
Region Sector code
Class Sector Route km
Northern 478 5 Weemelah to Camurra 83.7
480 3/5 Burren to Narrabri (via Wee Waa) 83.5
481 5 Walgett to Burren 88.2
482 5 Merrywinebone to Burren 52.6
Western
732 5 Tottenham to Bogan Gate 112.4
743 3/5 Warren to Nevertire (via Auscott) 20.3
761 3/5 Coonamble to Dubbo (via Gilgandra) 150.2
Southern 645 5 Boree Creek to The Rock 56.6
660 3 Koorawatha to Demondrillea 74.1
661 3 Cowra to Koorawathaa 27.3
663 3 Greenethorpe to Koorawathaa 21.5
672 3 Barmedman to Temora 36.3
673 3 West Wyalong to Barmedman 31.5
674 3 Ungarie to West Wyalong 40.4
675 5 Lake Cargelligo to Ungarie 71.4
678 3 Naradhan to Ungarie 60.4
687 5 Hillston to Griffith 108.1
Total 1,118.5 a Currently non-operational, subject to Ministerial Taskforce review.
Source: CRIA.
Table 2.2 Standard classification of lines
Class Max. axle load
(tonnes)
Max. train operating speed
(freight) (km/h)
Rail section
(km)
Nominal ballast depth (mm)
1 25 80 53/60 270
2 21 80 47 270
3 19 70 40 200
4 19 50 36 150
5 19 40 30 150
Source: Rail Infrastructure Corporation (now CRIA), Standard Classification of Lines, version 4, November 2001.
The network forms a small part of the grain supply chain for grain destined for export or domestic milling. Grain may start its journey on the grain line network, move onto the Country Regional Network (CRN) and complete the journey on the Australian Rail Track Corporation’s (ARTC) interstate network, which may also include movements on the RailCorp network. It may also complete all or part of its journey on the road network. Therefore, any changes to access prices on the grain line network will have an impact on the overall grain supply chain, including road transport operations.
2 Context for this review
Review of access pricing on the NSW grain line network IPART 17
2.2 Who are the key stakeholders?
The lines are owned by the NSW Government. CRIA, an agency within Transport for NSW, is responsible for overseeing the operation and maintenance of the lines and negotiating access arrangements with above-rail operators.
The primary operator on the lines is GrainCorp, which has an agreement with Transport for NSW to provide grain haulage services on the grain lines.
There are many other stakeholders who have an interest in the funding and governance arrangements associated with the grain lines, including: grain growers, grain handlers, above-rail operators, flour and cotton facilities, road agencies and road transport operators.
2.3 What are the key problems facing the grain line network?
The grain line network has a number of significant problems which threaten its sustainability and cause uncertainty for industry. These include:
low and variable freight volumes
low levels of cost recovery
a high reliance on government funding, which puts the maintenance and sustainability of the lines at risk of budget fluctuations and priorities
a high degree of competition with road.
2.3.1 Low and variable freight volumes
The volume of traffic on the grain lines depend primarily on grain production and the market for which grain is destined. This is because grain makes up 95% of all traffic transported on the grain lines. The other 5% of traffic is a combination of general freight (including containerised grain), minerals and some passenger traffic.
Grain is grown across NSW, but is concentrated in the western slopes and plains. Grain production depends on market and climatic conditions and varies considerably from year to year. Demand volatility is also a result of exchange rate fluctuations or global supply issues, which may have impacts on grain production in NSW.
2 Context for this review
18 IPART Review of access pricing on the NSW grain line network
NSW grain is used primarily for domestic consumption, with the remainder serving the export market. Within the domestic market grain is used for human consumption (milling) or feedstock. Each market has its own supply chain characteristics. Grain for feedstock is transported almost entirely by road due to the flexibility of this transport mode and the dispersed nature of the end-use market. The majority of grain supplying the export market and domestic human consumption is transported by rail; however, in the case of exports, this volume can fluctuate considerably as domestic demand is met first.
In response to our Issues Paper, GrainCorp provided the following transportation estimates and characteristics for each market:6
2.2 mega tonnes (Mt) domestic human and industrial market: A stable base that receives most of its grain (wheat) by rail. Major consumers include Manildra Milling, Allied Mills, and Weston Milling.
2.5 Mt animal feed market: Less stable demand, with little or no rail access, served by road transport. Consumers include feedlots, intensive livestock production, dairies and compound stockfeed producers.
0.8 Mt container export market: Stable demand facilitated by export traders, with good rail access, container trains operating from country packing facilities to Port Botany.
>2.5 Mt bulk export market: Variable demand dependent upon grain production with rail and road access into Carrington (Newcastle) and Port Kembla export elevators.
Historically, comparing a ‘drought’ year and a ‘bumper’ harvest, grain volumes transported on the grain line network have varied by as much as 50%. The variation on individual lines is even more unpredictable with volumes changing up to 175% from year to year. More information on the outlook for the NSW grain industry and its structure is in Appendix C.
2.3.2 Low cost recovery and high reliance on government funding
Maintaining the grain lines to a safe operating standard is expensive. The network is maintained at a ‘fit-for-purpose’ standard, which provides a minimum level of service for operators.7 The NSW Government subsidises around 97% of the cost of providing this level of service.
6 GrainCorp submission to Issues Paper, July 2011, p 3. 7 ‘Fit for purpose’ means that lines are able to operate to the specifications of their classification
level. For example, a Class 5 line should be able to run 19 tonne axle load trains at 40 km/h and a Class 3 line should be able to run 19 tonne axle load trains at 70km/h.
2 Context for this review
Review of access pricing on the NSW grain line network IPART 19
The current asset replacement and maintenance regime is driven by stakeholder requirements relative to the available long-term funding. The regime assumes that funding will continue to be available each year for the maintenance and renewal of assets required to maintain the existing level of service.
The extent of network maintenance is therefore subject to government budget priorities and the industry has experienced a lengthy period of uncertainty regarding the ongoing viability of the network. Where funding has not been available, many parts of the network have fallen below the fit-for-purpose standard. This has affected decisions on whether to invest in associated above-rail assets and led to various reviews of the costs and benefits of maintaining lines or optimising the network.
Throughout this review, stakeholders have expressed support for greater certainty and stability on the network and many have argued that the network plays an important role in the transport of grain in NSW. However, while the network continues to rely heavily on the continued availability of government funds, it is likely that current uncertainties about fluctuating track condition and threatened line closures will persist.
2.3.3 Competition with road
The relatively short lengths and low volumes on the grain lines, as well as the dispersed markets for grain, mean that they compete directly with the road network. Around 70% of grain destined for export or domestic milling is transported on the grain line network and the main line to port.8 The remainder is transported by road.
Past reviews of the grain supply chain have assumed that road and rail compete for the export line haul task between a silo and port. The Grain Industry Advisory Committee (GIAC) review (2004) and NSW Grain Freight Review (2009) both assumed that grain is delivered from silo to port, whether it goes by rail or road. However, some stakeholders to our review have argued that competing road movements are direct from farm to port.
A growing trend of on-farm storage, containerisation of grain and higher productivity trucks means that farm-to-port road haulage could become an increasingly competitive option for grain transportation in the future.
8 GrainCorp submission to Issues Paper, July 2011, p 5.
2 Context for this review
20 IPART Review of access pricing on the NSW grain line network
2.4 What were the outcomes of previous reviews of the grain line network?
Over the last decade, there have been a handful of government and industry led reviews to determine the future of the grain lines. In 2004, the GIAC undertook a cost-benefit analysis on the lines to determine which lines were cost-effective in the longer-term and which lines should be closed in favour of road.
The GIAC review found that cost recovery across the 15 grain lines it examined ranged from 0.8% to 6.3%, and was 3% on average. The review identified 3 lines where the cost of maintaining the line was significantly greater than the cost of upgrading the road network and 7 lines where retaining the rail line was marginally cheaper.
The NSW Government responded to these recommendations by suspending services on 4 lines and committing funding of $69 million over 3 years to keep the remaining lines open.
In 2008, it was announced as part of the NSW Government mini-budget that services would be suspended on another 5 lines. However, this decision was delayed pending the outcome of the NSW Grain Freight Review.
In 2009, the Australian Government initiated the NSW Grain Freight Review. This review considered broader issues in the NSW grain supply chain, but also conducted a cost-benefit analysis of the viability of the lines. The review found that cost recovery was around 6% across the network, but recommended that most lines be stabilised at a fit-for-purpose standard. The review recommended that access charges should be reviewed to determine an appropriate level of user contribution to ongoing maintenance.
Since the NSW Grain Freight Review there have been various changes in the grain supply chain; most notably the industry adjustment to the removal of the AWB single-desk marketing monopoly. During the single desk regime, grain for domestic use and export was transported almost entirely by rail. The market now allows for multiple competing grain handlers and grain growers to make strategic decisions about where they sell their grain and the way grain is transported. This has led to a more competitive market for grain transport.
3 What are the costs of maintaining the network and what proportion is recovered from users?
Review of access pricing on the NSW grain line network IPART 21
3 What are the costs of maintaining the network and what proportion is recovered from users?
The first step in determining the cost recovery on the network is identifying the efficient costs of maintaining the network. This chapter examines the expected costs of maintaining the network to 2020 and beyond, including the capital investment required to stabilise the lines.
Based on actual access revenue received in 2010/11, we compute the current level of cost recovery and examine the expected level of cost recovery of ongoing maintenance costs once stabilisation is complete.
3.1 Final Findings
IPART finding
1 The average cost of maintaining the grain line network up until 2020 is $38,911 per track kilometre or $38.5 million per annum. This includes an annual capital investment of $18.1 million for stabilisation ($2011/12).
2 Post-2020, the average cost of ongoing maintenance of the grain line network is $20,608 per track kilometre or $20.4 million per annum ($2011/12).
3 At current access prices and demand levels, 2.3% of current costs and 4.4% of ongoing maintenance costs are recovered from network users with the remainder being funded by government subsidy.
Since the Draft Report, we received detailed data on estimated network maintenance costs from CRIA. From this information and based on feedback from submissions, we estimated the efficient cost of ongoing maintenance and capital investment required for stabilisation. We have updated our estimates of cost recovery on the network based on both estimates of costs.
3.2 What are the efficient below-rail costs of the network?
In our Draft Report, we noted that we had not received detailed information about future maintenance costs from CRIA in time to include them in our analysis.
Instead, we compared a range of publicly available estimates and estimated the below-rail cost of maintaining the network to be around $26,350 per kilometre per

3 What are the costs of maintaining the network and what proportion is recovered from users?
22 IPART Review of access pricing on the NSW grain line network
annum. This estimate was derived from actual historical maintenance expenditure, taking into account likely future efficiency improvements.
3.2.1 Stakeholder submissions
Some stakeholders raised the point that our estimate of below-rail costs in the Draft Report did not take into account the underlying condition of the track. As such, there could be scope for maintenance cost savings going forward.
Peter and Libby Skipworth stated that an increase in maintenance following a period of poor maintenance history and the impacts of natural disaster mean that current costs may be substantially higher than they would be under a regular maintenance schedule.9 Asciano suggested that cost savings could result from the new management contract with John Holland, which was awarded following a competitive tender process.10
NSW Farmers noted that the NSW Grain Freight Review (2009) recommended that a majority of lines should be stabilised at a minimum standard of operation, with these stabilisation costs to be funded by the NSW Government through a non-recoverable grant. The recommendations were subsequently agreed to by the former NSW Government in its preliminary response to the review. NSW Farmers pointed out that the below-rail costs used in the Draft Report did not distinguish between stabilisation and ongoing maintenance costs.11
NSW Farmers also suggested that estimated costs should be tested against those from rail operations in other jurisdictions.12
3.2.2 IPART’s findings
Following the release of the Draft Report, we sought further information from CRIA about the costs of maintaining the grain lines. We sought to identify the component of costs that result from stabilisation works compared to future ongoing maintenance costs post-stabilisation.
CRIA provided IPART with its estimation of projected costs by line based on its long-term Total Asset Management (TAM) plan. The costs are categorised into routine maintenance (RM) and major periodic maintenance (MPM) of structures and track. They include direct costs such as labour, materials and plant as well as a reasonable margin to cover necessary overheads. They do not include project management, depot or transportations costs, although these would also form valid components of service delivery.
9 Peter and Libby Skipworth submission, p 1. 10 Asciano submission, p 9. 11 NSW Farmers submission, p 1. 12 Ibid, p 2.
3 What are the costs of maintaining the network and what proportion is recovered from users?
Review of access pricing on the NSW grain line network IPART 23
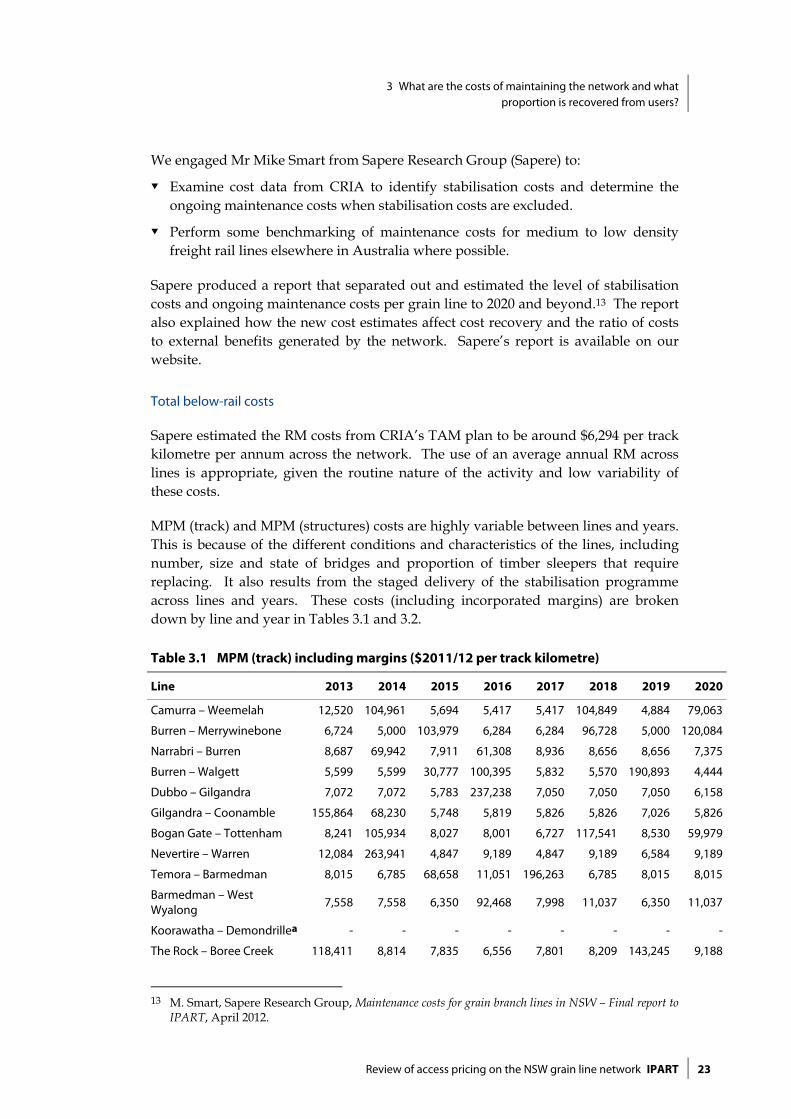
We engaged Mr Mike Smart from Sapere Research Group (Sapere) to:
Examine cost data from CRIA to identify stabilisation costs and determine the ongoing maintenance costs when stabilisation costs are excluded.
Perform some benchmarking of maintenance costs for medium to low density freight rail lines elsewhere in Australia where possible.
Sapere produced a report that separated out and estimated the level of stabilisation costs and ongoing maintenance costs per grain line to 2020 and beyond.13 The report also explained how the new cost estimates affect cost recovery and the ratio of costs to external benefits generated by the network. Sapere’s report is available on our website.
Total below-rail costs
Sapere estimated the RM costs from CRIA’s TAM plan to be around $6,294 per track kilometre per annum across the network. The use of an average annual RM across lines is appropriate, given the routine nature of the activity and low variability of these costs.
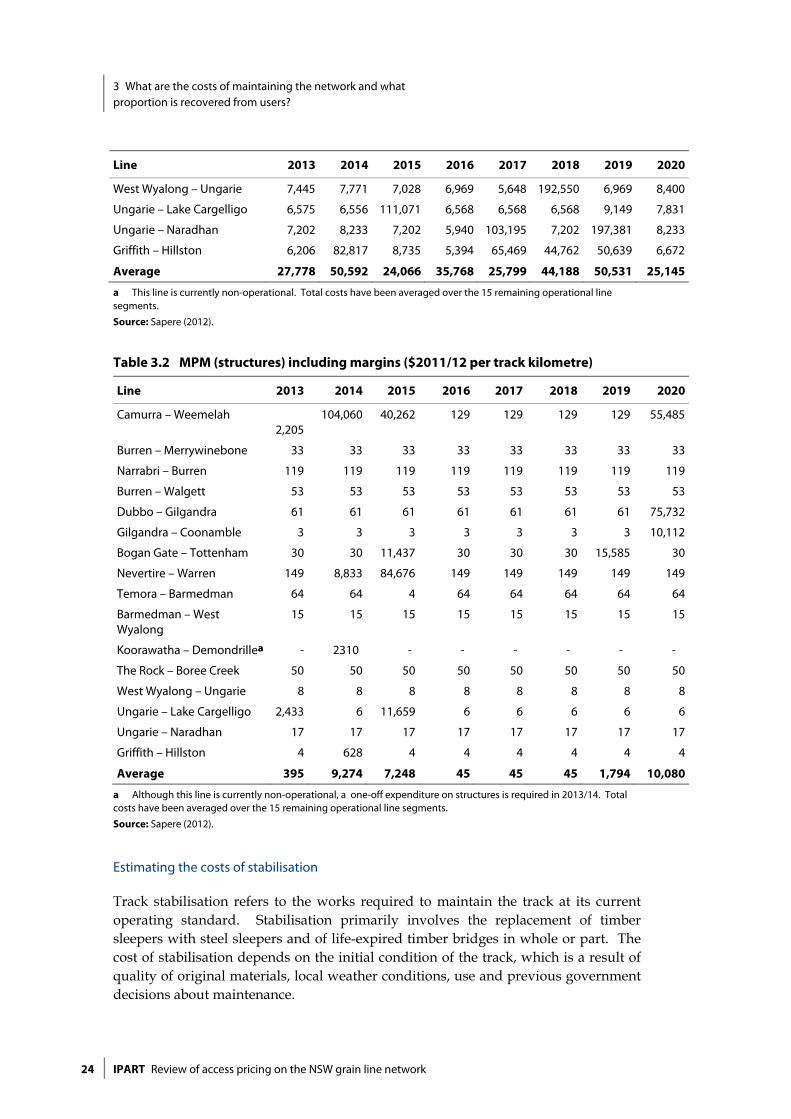
MPM (track) and MPM (structures) costs are highly variable between lines and years. This is because of the different conditions and characteristics of the lines, including number, size and state of bridges and proportion of timber sleepers that require replacing. It also results from the staged delivery of the stabilisation programme across lines and years. These costs (including incorporated margins) are broken down by line and year in Tables 3.1 and 3.2.
Table 3.1 MPM (track) including margins ($2011/12 per track kilometre)
Line 2013 2014 2015 2016 2017 2018 2019 2020
Camurra – Weemelah 12,520 104,961 5,694 5,417 5,417 104,849 4,884 79,063
Burren – Merrywinebone 6,724 5,000 103,979 6,284 6,284 96,728 5,000 120,084
Narrabri – Burren 8,687 69,942 7,911 61,308 8,936 8,656 8,656 7,375
Burren – Walgett 5,599 5,599 30,777 100,395 5,832 5,570 190,893 4,444
Dubbo – Gilgandra 7,072 7,072 5,783 237,238 7,050 7,050 7,050 6,158
Gilgandra – Coonamble 155,864 68,230 5,748 5,819 5,826 5,826 7,026 5,826
Bogan Gate – Tottenham 8,241 105,934 8,027 8,001 6,727 117,541 8,530 59,979
Nevertire – Warren 12,084 263,941 4,847 9,189 4,847 9,189 6,584 9,189
Temora – Barmedman 8,015 6,785 68,658 11,051 196,263 6,785 8,015 8,015
Barmedman – West Wyalong
7,558 7,558 6,350 92,468 7,998 11,037 6,350 11,037
Koorawatha – Demondrillea - - - - - - - -
The Rock – Boree Creek 118,411 8,814 7,835 6,556 7,801 8,209 143,245 9,188
13 M. Smart, Sapere Research Group, Maintenance costs for grain branch lines in NSW – Final report to
IPART, April 2012.
3 What are the costs of maintaining the network and what proportion is recovered from users?
24 IPART Review of access pricing on the NSW grain line network
Line 2013 2014 2015 2016 2017 2018 2019 2020
West Wyalong – Ungarie 7,445 7,771 7,028 6,969 5,648 192,550 6,969 8,400
Ungarie – Lake Cargelligo 6,575 6,556 111,071 6,568 6,568 6,568 9,149 7,831
Ungarie – Naradhan 7,202 8,233 7,202 5,940 103,195 7,202 197,381 8,233
Griffith – Hillston 6,206 82,817 8,735 5,394 65,469 44,762 50,639 6,672
Average 27,778 50,592 24,066 35,768 25,799 44,188 50,531 25,145
a This line is currently non-operational. Total costs have been averaged over the 15 remaining operational line segments.
Source: Sapere (2012).
Table 3.2 MPM (structures) including margins ($2011/12 per track kilometre)
Line 2013 2014 2015 2016 2017 2018 2019 2020
Camurra – Weemelah 2,205
104,060 40,262 129 129 129 129 55,485
Burren – Merrywinebone 33 33 33 33 33 33 33 33
Narrabri – Burren 119 119 119 119 119 119 119 119
Burren – Walgett 53 53 53 53 53 53 53 53
Dubbo – Gilgandra 61 61 61 61 61 61 61 75,732
Gilgandra – Coonamble 3 3 3 3 3 3 3 10,112
Bogan Gate – Tottenham 30 30 11,437 30 30 30 15,585 30
Nevertire – Warren 149 8,833 84,676 149 149 149 149 149
Temora – Barmedman 64 64 4 64 64 64 64 64
Barmedman – West Wyalong
15 15 15 15 15 15 15 15
Koorawatha – Demondrillea - 2310 - - - - - -
The Rock – Boree Creek 50 50 50 50 50 50 50 50
West Wyalong – Ungarie 8 8 8 8 8 8 8 8
Ungarie – Lake Cargelligo 2,433 6 11,659 6 6 6 6 6
Ungarie – Naradhan 17 17 17 17 17 17 17 17
Griffith – Hillston 4 628 4 4 4 4 4 4
Average 395 9,274 7,248 45 45 45 1,794 10,080
a Although this line is currently non-operational, a one-off expenditure on structures is required in 2013/14. Total costs have been averaged over the 15 remaining operational line segments.
Source: Sapere (2012).
Estimating the costs of stabilisation
Track stabilisation refers to the works required to maintain the track at its current operating standard. Stabilisation primarily involves the replacement of timber sleepers with steel sleepers and of life-expired timber bridges in whole or part. The cost of stabilisation depends on the initial condition of the track, which is a result of quality of original materials, local weather conditions, use and previous government decisions about maintenance.
3 What are the costs of maintaining the network and what proportion is recovered from users?
Review of access pricing on the NSW grain line network IPART 25
The inclusion of stabilisation costs in the TAM plan causes a high degree of variability or cost ‘spikes’ in MPM costs between lines and years as illustrated in Tables 3.1 and 3.2. This is caused by programs of sleeper replacement in the case of MPM (track) and bridge works in the case of MPM (structures). The non-sleeper component of MPM (track) is less variable between years as maintenance is more predictable.
To separate out the impact of stabilisation costs from ongoing maintenance costs, Sapere split the MPM (track) costs into sleeper and non-sleeper components. This was done by calculating the median cost of MPM (track) per line per year. The sleeper component is represented by the annual unit cost in a year where cost exceeds the median value, minus the median value. The non-sleeper component is either the annual unit cost or the median value in a year where the annual unit cost exceeds the median.
MPM (structures) unit costs exhibit similar cost spikes in years where there are stabilisation works planned for bridges on a particular line. To isolate stabilisation costs from ongoing MPM (structures) costs, Sapere carried out the same process using the median value.
Sapere then calculated the ongoing maintenance cost for sleepers once major works are completed using the following assumptions:
the average life of a new steel sleeper is 50 years
the average cost of installing a steel sleeper is between $170 - $220 per sleeper
there are approximately 1,667 sleepers per kilometre of track
around 2% of sleepers require replacing each year.
Sapere estimated that the ongoing annual cost of sleeper maintenance would be around $6,931 per track kilometre ($2011/12). The resulting annual maintenance cost per track kilometre for each line is in Table 3.3.

3 What are the costs of maintaining the network and what proportion is recovered from users?
26 IPART Review of access pricing on the NSW grain line network
Table 3.3 Annual maintenance cost per line ($2011/12 per track kilometre)
Line Routine Mainten
ance
MPM track MPM structures Total cost
Non-sleeper
Current sleeper
Post-stabilisa
tion sleeper
Current Post-stabilisa
tion
Current Post-stabilisation
Camurra – Weemelah
6,294 6,159 27,074 6,931 20,278 129 59,805 19,513
Burren – Merrywinebone
6,294 6,971 29,533 6,931 33 33 42,831 20,229
Narrabri – Burren 6,294 8,555 11,416 6,931 119 119 26,384 21,900
Burren – Walgett 6,294 5,581 30,554 6,931 53 53 42,481 18,858
Dubbo – Gilgandra 6,294 6,910 23,114 6,931 7,629 61 43,946 20,196
Gilgandra – Coonamble
6,294 5,818 21,455 6,931 1,014 3 34,580 19,046
Bogan Gate – Tottenham
6,294 8,576 25,572 6,931 2,726 30 43,167 21,831
Nevertire – Warren 6,294 7,735 25,874 6,931 9,470 149 49,373 21,109
Temora – Barmedman
6,294 7,864 25,136 6,931 64 64 39,357 21,153
Barmedman – West Wyalong
6,294 7,429 9,156 6,931 15 15 22,894 20,669
Koorawatha – Demondrillea
- - - - 231 - 231 -
The Rock – Boree Creek
6,294 9,002 24,472 6,931 50 50 39,818 22,277
West Wyalong – Ungarie
6,294 6,792 18,748 6,931 8 8 31,841 20,024
Ungarie – Lake Cargelligo
6,294 7,573 14,269 6,931 1,414 6 29,549 20,804
Ungarie – Naradhan
6,294 7,024 28,746 6,931 17 17 42,080 20,266
Griffith – Hillston 6,294 8,020 20,944 6,931 67 4 35,324 21,249
Average 6,294 7,334 22,404 6,931 2,879 49 38,911 20,608
a Although this line is currently non-operational, a one-off expenditure on structures is required in 2013/14. Total costs have been averaged over the 15 remaining operational line segments.
Source: Sapere (2012).
Adding together the RM and MPM components, the average annual cost of maintaining the grain lines up until 2020 is $38,911 per track kilometre ($2011/12). However, this ranges from $22,894 per track kilometre on the Barmedman – West Wyalong line to $59,805 per track kilometre on the Camurra – Weemelah line due to differences in track condition. This equates to an annual stabilisation investment of around $145 million ($2011/12) over the next 8 years.
3 What are the costs of maintaining the network and what proportion is recovered from users?
Review of access pricing on the NSW grain line network IPART 27
After 2020, the total cost of maintaining the grain lines will decrease to around $20,608 per track kilometre ($2011/12) with a much smaller range between lines. This equates to an ongoing annual maintenance investment of $20.4 million ($2011/12).
Comparison to other benchmarks
In its report, Sapere looked at how these unit maintenance costs compare to the unit maintenance costs on the Victorian rail freight network. Adjusting for inflation, Sapere calculated the Victorian unit maintenance costs to be around $21,498 per track kilometre per year for Class 2 and 3 lines and around $14,873 per track kilometre per year for Class 4 and 5 lines.
The post-stabilisation unit maintenance cost for the NSW grain line network falls within this range. The pre-stabilisation unit maintenance cost is much higher than these estimates due to the level of capital investment required to stabilise the lines at their current operating standard and prevent further deterioration. Sapere concluded that there was no evidence that these stabilisation costs could be reduced further other than by delaying the completion date for stabilisation.
3.3 What is the level of cost recovery?
In the Draft Report, we calculated cost recovery per line using our below-rail cost estimate of $26,350 per track kilometre and historical grain traffic volumes from CRIA.
We concluded that cost recovery in 2010/11, which was a good harvest year, was extremely low, averaging only 3% across the network and ranging from 12% to less than 1% between lines. This means that the NSW Government subsidised 97% of the cost of providing and maintaining the grain line infrastructure. By comparison, the proportion of government subsidy provided to CityRail for the provision of public passenger rail services was around 78% in 2010/11.
3.3.1 Stakeholder submissions
Peter and Libby Skipworth suggested that using a maintenance cost estimate that does not take into account increased maintenance costs associated with poor maintenance history and the impact of natural disasters may negatively skew the cost recovery ratio.14
14 Peter and Libby Skipworth submission, p 1.
3 What are the costs of maintaining the network and what proportion is recovered from users?
28 IPART Review of access pricing on the NSW grain line network
3.3.2 IPART’s findings
Current level of cost recovery
The NSW Grain Freight Review (2009) recommended that the cost of stabilising lines should be met through a non-recoverable government grant, with a review of access charges to determine an appropriate level of user contribution to ongoing maintenance. We note that the former NSW Government agreed to these recommendations in its preliminary response to the review.
However, the cost of stabilisation works is an important component of the cost to the NSW Government of maintaining the grain line network. Even if the costs are met by non-recoverable government grant, they are still a significant capital investment that is funded primarily through taxpayer funds. These funds are limited and investing them in the grain line network means that they cannot be invested in other projects.
Therefore, we consider that it is relevant to illustrate the total cost of maintaining the grain line network, including stabilisation costs and to measure the cost recovery on this basis. Table 3.4 shows cost recovery based on the current annualised below-rail cost (including stabilisation costs)15 and actual access revenue received in 2010/11.
15 We deflated $2011/12 costs using the Sydney capital city CPI index in order to compare costs to
access revenue received in 2010/11 and accurately calculate cost recovery.

3 What are the costs of maintaining the network and what proportion is recovered from users?
Review of access pricing on the NSW grain line network IPART 29
Table 3.4 Cost recovery including stabilisation costs ($2010/11)
Line Annualised below-rail cost ($2010/11)
Access revenue ($2010/11)
Cost recovery %
Camurra – Weemelaha 4,834,924 58,698 1.2%
Burren - Walgett 3,622,827 109,339 3.0%
Burren - Merrywinebone 2,175,674 32,232 1.5%
Narrabri - Burren 2,104,144 259,160 12.3%
Bogan Gate - Tottenham 4,657,284 62,063 1.3%
Nevertire - Warren 954,123 20,788 2.2%
Dubbo - Coonamble 5,537,538 223,834 4.0%
Ungarie - Lake Cargelligo 2,042,558 7,482 0.4%
Ungarie - Naradhan 2,463,642 3,334 0.1%
West Wyalong -Ungarie 1,246,360 19,349 1.6%
Barmedman - West Wyalong
699,435 29,468 4.2%
Temora - Barmedman 1,377,794 38,996 2.8%
Griffith to Hillston 3,672,543 8,518 0.2%
The Rock to Boree Creek 2,184,044 2,483 0.1%
Total 37,572,890 875,743 2.3%a Access revenue includes a $1/tonne surcharge implemented in July 2010. Note: The costs have been adjusted by the Sydney CPI December quarterly index in order to compare with access revenue for the same period. Cowra lines have not been included as they are currently non-operational and earn no access revenue.
Source: CRIA; Sapere (2012); IPART calculations.
Based on current annualised below-rail costs, cost recovery is around 2.3% across the network ranging from 12.3% (Narrabri – Burren) to virtually zero (The Rock – Boree Creek, Hillston – Griffith, Ungarie – Naradhan, Ungarie – Lake Cargelligo).
Expected cost recovery based on future ongoing maintenance costs
Once stabilisation works are completed, the annual ongoing maintenance cost is almost halved. Table 3.5 show cost recovery by line, based on the expected ongoing maintenance cost post-2020 and actual access revenue received in 2010/11.
3 What are the costs of maintaining the network and what proportion is recovered from users?
30 IPART Review of access pricing on the NSW grain line network
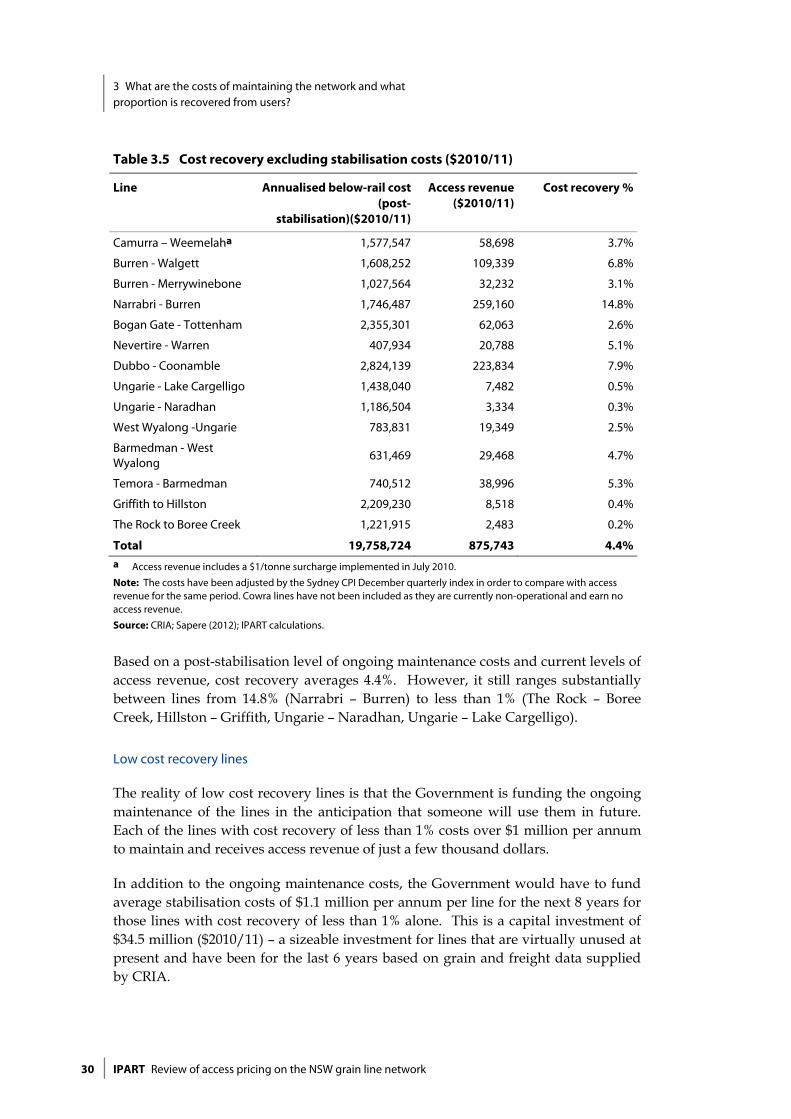
Table 3.5 Cost recovery excluding stabilisation costs ($2010/11)
Line Annualised below-rail cost (post-
stabilisation)($2010/11)
Access revenue ($2010/11)
Cost recovery %
Camurra – Weemelaha 1,577,547 58,698 3.7%
Burren - Walgett 1,608,252 109,339 6.8%
Burren - Merrywinebone 1,027,564 32,232 3.1%
Narrabri - Burren 1,746,487 259,160 14.8%
Bogan Gate - Tottenham 2,355,301 62,063 2.6%
Nevertire - Warren 407,934 20,788 5.1%
Dubbo - Coonamble 2,824,139 223,834 7.9%
Ungarie - Lake Cargelligo 1,438,040 7,482 0.5%
Ungarie - Naradhan 1,186,504 3,334 0.3%
West Wyalong -Ungarie 783,831 19,349 2.5%
Barmedman - West Wyalong
631,469 29,468 4.7%
Temora - Barmedman 740,512 38,996 5.3%
Griffith to Hillston 2,209,230 8,518 0.4%
The Rock to Boree Creek 1,221,915 2,483 0.2%
Total 19,758,724 875,743 4.4% a Access revenue includes a $1/tonne surcharge implemented in July 2010. Note: The costs have been adjusted by the Sydney CPI December quarterly index in order to compare with access revenue for the same period. Cowra lines have not been included as they are currently non-operational and earn no access revenue.
Source: CRIA; Sapere (2012); IPART calculations.
Based on a post-stabilisation level of ongoing maintenance costs and current levels of access revenue, cost recovery averages 4.4%. However, it still ranges substantially between lines from 14.8% (Narrabri – Burren) to less than 1% (The Rock – Boree Creek, Hillston – Griffith, Ungarie – Naradhan, Ungarie – Lake Cargelligo).
Low cost recovery lines
The reality of low cost recovery lines is that the Government is funding the ongoing maintenance of the lines in the anticipation that someone will use them in future. Each of the lines with cost recovery of less than 1% costs over $1 million per annum to maintain and receives access revenue of just a few thousand dollars.
In addition to the ongoing maintenance costs, the Government would have to fund average stabilisation costs of $1.1 million per annum per line for the next 8 years for those lines with cost recovery of less than 1% alone. This is a capital investment of $34.5 million ($2010/11) – a sizeable investment for lines that are virtually unused at present and have been for the last 6 years based on grain and freight data supplied by CRIA.

3 What are the costs of maintaining the network and what proportion is recovered from users?
Review of access pricing on the NSW grain line network IPART 31
The next chapter considers whether this level of government funding is justified on the basis of the net external benefits generated by the lines or if there is a case for users to make a greater contribution to costs through higher access prices.

4 Are the current access prices and government subsidy appropriate?
32 IPART Review of access pricing on the NSW grain line network
4 Are the current access prices and government subsidy appropriate?
In previous IPART reviews, such as CityRail, we determined the amount of government subsidy based on the level of external benefits generated by the service. The remainder of costs are assumed to generate private benefits, for which users should pay.
The net external benefits generated by operations on the grain line network include the extent to which air pollution, road accidents, noise, greenhouse gas emissions and unrecovered road damage from heavy vehicles are less than what they would be if the same freight task was delivered by road.
This chapter presents our findings on the comparison between expected future net external benefits generated by operations on the grain lines and expected future government subsidy requirements. This comparison assumes access prices at current levels and 2 maintenance cost scenarios: (1) efficient costs including stabilisation investment, (2) efficient costs after stabilisation has taken place.
4.1 Final Findings
IPART finding
4 The current government subsidy to the grain line network (including capital investment for stabilisation) is almost 3 times greater than the average external benefits generated by use of the network over a typical 5-year period.
5 The expected ongoing government subsidy to the grain line network (excluding capital investment for stabilisation) is 1.4 times greater than the average external benefits generated by use of the network over a typical 5-year period.
From the Draft Report, we updated our calculations of external benefits to take into account our new estimates of maintenance costs (including and excluding stabilisation costs), which affect the estimated level of the implied government subsidy. Based on feedback in submissions to the Draft Report, we included non-grain freight in our total volume of traffic using the network.

4 Are the current access prices and government subsidy appropriate?
Review of access pricing on the NSW grain line network IPART 33
Given that net external benefits depend on the volume of traffic, we included an analysis of the net external benefits by line. This showed that, on average over a typical 5-year period, some lines generate a level of net external benefits that is proportionate to the government subsidy they receive, but other lines cost far more to maintain than the benefits they generate.
4.2 What are the external benefits of the network?
In our Draft Report, we calculated the external costs associated with transporting grain to port by rail and road and looked at the difference between the 2 estimates. We found that rail had a net benefit over road for each of the grain line routes to port.
Our analysis was based on external cost unit rate estimates from 2 difference sources including a Queensland study, which was quoted in a submission by Dr Philip Laird16, and a report by Booz Allen Hamilton17 undertaken for the Ministerial Taskforce considering the case for reopening of the Cowra grain lines in NSW. These external cost unit rates are replicated in Table 4.1 below.
Table 4.1 Externality unit rates used in the Draft Report
Transport mode Location Laird externality unit rates (c/ntk)
Booz externality unit rates (c/ntk)
Road Urban 3.88 2.11
Road Non-urban 2.79 0.31
Rail Urban 0.61 0.75
Rail Non-urban 0.24 0.09
Source: Laird submission (2011); Booz (2011).
The rates proposed by Dr Laird represent a combined value of the external costs of accidents, air pollution, noise pollution, greenhouse gas emissions, congestion, and incremental road damage for urban and non-urban regions. They include an allowance of 1 cent per net tonne kilometre for under-recovered road system costs. That is, the difference between the road user charge component of the diesel excise and the actual pavement damage caused by trucks.
16 Laird submission to Issues Paper, June 2010. 17 Booz Allen Hamilton, Final Report Re-Opening the Cowra Rail Lines: Cost Benefit Analysis and
Policy Options, October 2011.
4 Are the current access prices and government subsidy appropriate?
34 IPART Review of access pricing on the NSW grain line network
The Booz Allen Hamilton estimates take into account air pollution, greenhouse gases, noise, water, nature & landscape and urban separation, but do not include any allowance for unrecovered road costs. While, in aggregate, road costs are assumed to be recovered wholly through heavy vehicle charges, in practice, we considered that it is likely that there is some degree of under-recovery on some road types. As such, we added the same estimate of unrecovered road costs (1 cent per net tonne kilometre) to the Booz externality rates to make them comparable to the Laird estimates.
4.2.1 Stakeholder submissions
The ARTC agreed with IPART’s approach that social benefits should be paid for by the wider community (through government subsidy), whereas private benefits should be paid for by users to whom they accrue.18
However, Mr Lewis Davies argued that IPART had not considered all of the external costs associated with rail and road transport.19
Dr Philip Laird suggested that a breakdown of the external costs from the Booz Allen Hamilton report should be included.20
4.2.2 IPART’s findings
Analysis of external unit costs
In February 2012, the Ministerial Taskforce overseeing the business case for the revival of the Cowra lines produced its final report.21 The report referred to the Booz Allen Hamilton cost benefit analysis report and provided a breakdown of the externality unit costs of rail and road. These costs include air pollution, greenhouse gases, noise, water, nature and landscape and urban separation. Road congestion and road accident costs were calculated separately, as were road maintenance cost savings. Adding in these costs makes the estimates slightly higher than those used in the Draft Report.
In his submission, Dr Philip Laird also provided a breakdown of the factors included in his estimates of the externality unit cost rates. A comparison of the Booz Allen Hamilton and Laird unit costs is in Table 4.2.
18 ARTC submission, p 4. 19 Mr Lewis Davies submission, p 1. 20 Dr Philip Laird submission, p 2. 21 Ministerial Taskforce Blayney – Cowra – Demondrille Rail Lines, Final Report, February 2012.

4 Are the current access prices and government subsidy appropriate?
Review of access pricing on the NSW grain line network IPART 35
Table 4.2 Comparison of Laird and Booz Allen Hamilton externality unit cost rates (c/ntk)
External cost Road Rail
Laird Booz Laird Booz
Air pollution Urban 0.92 1.09 0.31 0.37
Rural 0.18 0.01 0.06 -
Noise Urban 0.31 0.29 0.12 0.16
Rural 0.10 0.03 0.06 0.02
Greenhouse gas Both 0.25 0.08 0.08 0.03
Water Urban - 0.11 - 0.01
Rural - 0.07 - 0.01
Nature & landscape Urban - 0.29 - 0.09
Rural - 0.12 - 0.03
Urban separation Urban - 0.25 - 0.09
Rural - - - -
Accidents Urban 0.85 0.41 0.04 0.04
Rural 0.85 0.41 0.04 0.04
Congestion Urban 0.14 0.10 - -
Rural - - - -
Road maintenancea Both 1.41 1.26 - -
Total Urban 3.88 3.88 0.61 0.79
Rural 2.79 1.98 0.24 0.13
a The Booz Allen Hamilton unit cost denotes total road maintenance cost savings for freight traffic travelling to port as estimated by the former Roads and Traffic Authority in consultation with Transport for NSW. It is therefore likely to overestimate the unrecovered portion of costs as some of these maintenance costs are funded by heavy vehicle road users through fuel excise charges.
Source: Laird submission (2012); Booz Allen Hamilton (2011)
While the cost inclusions and values differ somewhat, the resulting externality unit cost rates are similar. We have decided to calculate the updated net external benefits of the network based on the Laird rates, which are slightly more conservative than the Booz Allen Hamilton estimates. Using the Booz Allen Hamilton estimates will give a lower estimate of net rail benefits.
4.3 What level of government subsidy is justified by the external benefits of the network?
In our Draft Report, we compared the net external benefits of transporting grain to port by rail to the implied historical government subsidy provided over the 5-year period from 2006/07 to 2010/11. The implied government subsidy was calculated as the average annual maintenance cost of the network minus the annual access revenue received. This varied based on the volume of grain in each year.
4 Are the current access prices and government subsidy appropriate?
36 IPART Review of access pricing on the NSW grain line network
We found that the government subsidy exceeded the net external benefits in each year. This result was the same whether the Laird or the Booz external cost unit rates were used; however, the Laird estimates led to a lower cost benefit ratio in each case.
4.3.1 Stakeholder submissions
GrainCorp considered that IPART’s analysis of the cost benefit ratio in the Draft Report was incomplete as it did not take into account the correct net government subsidy for regional roads. GrainCorp calculated that the average net subsidy for rail over 2010 and 2011 was 0.12c/ntk compared with 0.47c/ntk for regional roads using the Laird externality unit rates.22
NSW Farmers and Peter and Libby Skipworth suggested that the time period investigated in the Draft Report represented a period of prolonged dry conditions and as such, underestimated the external benefits of rail.23
Lachlan Regional Transport Committee and Orana Organisation of Councils both commented that, in general, our Draft Report had taken a narrow view in considering only grain traffic and that some lines carry considerable non-grain freight, which was not acknowledged.24
4.3.2 IPART’s findings
External benefits based on new estimates of below-rail costs
Our revised calculations of below-rail maintenance costs from Chapter 3 have implications for the ratio of external benefits to subsidy costs. This is because the infrastructure maintenance cost affects the government subsidy requirement.
The comparison between external benefits and subsidy costs is made on a whole journey basis. By displacing a truck journey, rail haulage reduces externalities along the entire route from silo to port, so it is the net tonne kilometres travelled for the whole journey that should be considered.
The below-rail subsidy for the entire journey is also the relevant point of comparison. Main line access prices are assumed to be sufficient to cover the direct cost of grain train operations, so no further subsidy is required for this part of the grain haul to port. The main line infrastructure provider, ARTC, is assumed to fully recover its maintenance and operational costs from access charges. To the extent that grain also traverses parts of the CRN before connecting with the main line network, we have also assumed no subsidy. While this may not be completely accurate, any subsidy on the CRN is likely to be much smaller than the significant subsidy given to the grain 22 GrainCorp submission, p 5. 23 NSW Farmers submission, pp 2-3; Peter and Libby Skipworth submission, p 1. 24 Lachlan Regional Transport Committee submission, p. 3; Orana Organisation of Councils
submission, p 3.

4 Are the current access prices and government subsidy appropriate?
Review of access pricing on the NSW grain line network IPART 37
line network. As such, our cost benefit ratio calculations are likely to be conservative and may overestimate the net benefits of the whole journey.
Given that future traffic levels are unknown, projections are calculated on the basis of actual traffic levels in each of the 5 years from 2006/07 to 2010/11. This historic period includes both high harvest years (2010 and 2011), a very low year (2008) and 2 intermediate years (2007 and 2009). As such, we consider that it represents a typical 5-year outlook for the grain lines.
While grain comprises 95% of all traffic on the network, the exclusion of non-grain freight has implications for selected lines. Although it is uncertain whether all non-grain freight is transported to port (which affects the value of external benefits it generates), we have included it in our revised externality calculations, because access revenue from transporting this freight is taken into account.
Table 4.3 shows our recalculation of the cost benefit ratio per year based on the current cost of maintaining the network (including stabilisation) and Table 4.4 shows the cost benefit ratio based on the future ongoing maintenance costs (excluding stabilisation) post-2020. Both tables have been updated to incorporate non-grain freight.
Table 4.3 Road and rail externalities based on current maintenance cost ($2010/11)
2006/07 2007/08 2008/09 2009/10 2010/11 Average
Total grain and non-grain freight transported on network (‘000 ntk)
468,536 228,283 614,988 834,982 869,443 603,247
Rail external costsa ($) 1,124,486 547,880 1,475,972 2,003,958 2,208,663 1,447,792
Road external costsb ($) 11,764,933 5,732,194 15,442,356 20,966,410 21,831,713 15,147,521
Rail subsidy consistent with rail external benefits (road – rail external costs) ($)
10,640,447 5,184,314 13,966,384 18,962,452 19,745,050 13,699,730
Implied government subsidy ($)
37,126,462 37,366,786
36,983,483 36,711,883 36,697,147 36,977,152
Ratio of subsidy to external benefit
3.5 7.2 2.7 1.9 1.9 2.7
a 0.24 c/ntk x grain transported. b 2.79 c/ntk x grain transported.
Source: Laird submission (2011); Sapere (2012); IPART calculations.
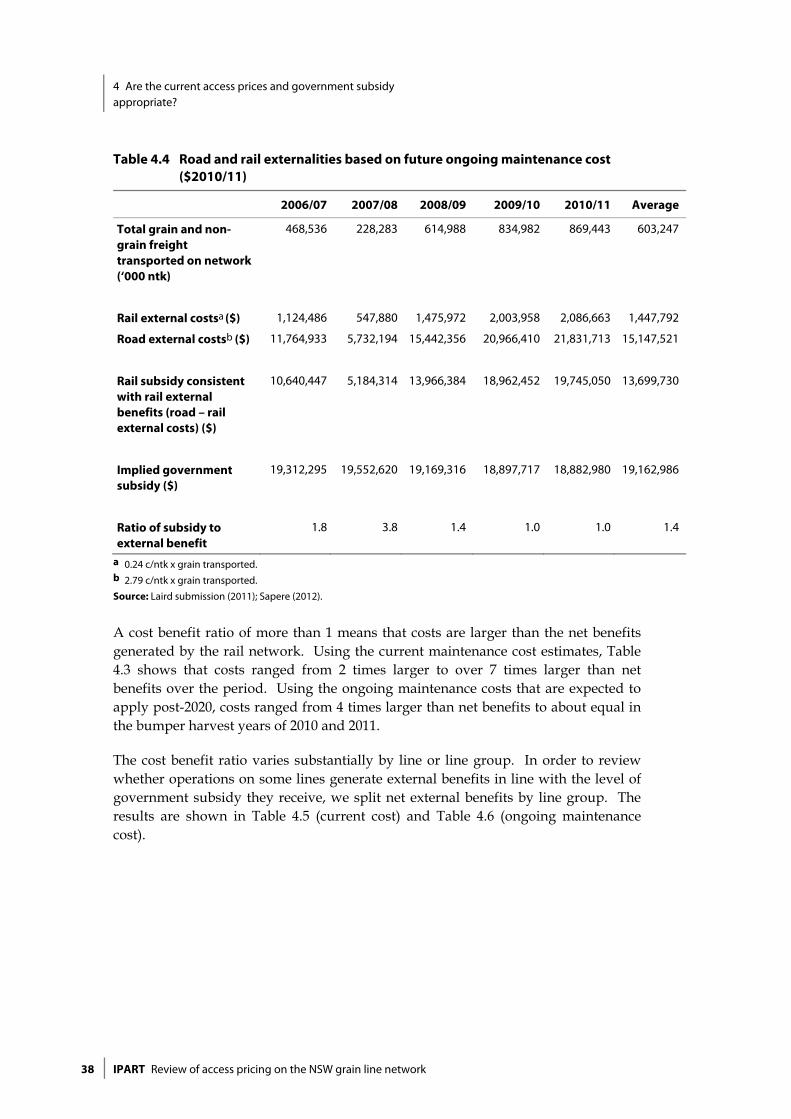
4 Are the current access prices and government subsidy appropriate?
38 IPART Review of access pricing on the NSW grain line network
Table 4.4 Road and rail externalities based on future ongoing maintenance cost ($2010/11)
2006/07 2007/08 2008/09 2009/10 2010/11 Average
Total grain and non-grain freight transported on network (‘000 ntk)
468,536 228,283 614,988 834,982 869,443 603,247
Rail external costsa ($) 1,124,486 547,880 1,475,972 2,003,958 2,086,663 1,447,792
Road external costsb ($) 11,764,933 5,732,194 15,442,356 20,966,410 21,831,713 15,147,521
Rail subsidy consistent with rail external benefits (road – rail external costs) ($)
10,640,447 5,184,314 13,966,384 18,962,452 19,745,050 13,699,730
Implied government subsidy ($)
19,312,295 19,552,620 19,169,316 18,897,717 18,882,980 19,162,986
Ratio of subsidy to external benefit
1.8 3.8 1.4 1.0 1.0 1.4
a 0.24 c/ntk x grain transported. b 2.79 c/ntk x grain transported.
Source: Laird submission (2011); Sapere (2012).
A cost benefit ratio of more than 1 means that costs are larger than the net benefits generated by the rail network. Using the current maintenance cost estimates, Table 4.3 shows that costs ranged from 2 times larger to over 7 times larger than net benefits over the period. Using the ongoing maintenance costs that are expected to apply post-2020, costs ranged from 4 times larger than net benefits to about equal in the bumper harvest years of 2010 and 2011.
The cost benefit ratio varies substantially by line or line group. In order to review whether operations on some lines generate external benefits in line with the level of government subsidy they receive, we split net external benefits by line group. The results are shown in Table 4.5 (current cost) and Table 4.6 (ongoing maintenance cost).
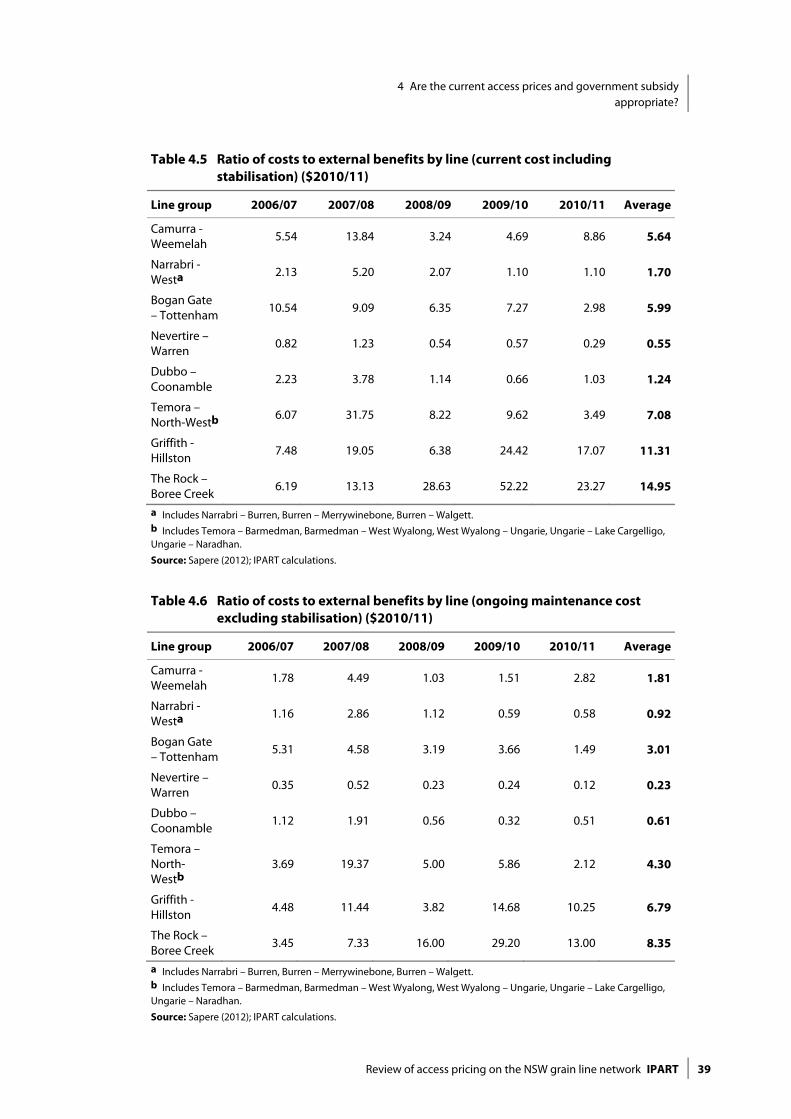
4 Are the current access prices and government subsidy appropriate?
Review of access pricing on the NSW grain line network IPART 39
Table 4.5 Ratio of costs to external benefits by line (current cost including stabilisation) ($2010/11)
Line group 2006/07 2007/08 2008/09 2009/10 2010/11 Average
Camurra - Weemelah
5.54 13.84 3.24 4.69 8.86 5.64
Narrabri - Westa
2.13 5.20 2.07 1.10 1.10 1.70
Bogan Gate – Tottenham
10.54 9.09 6.35 7.27 2.98 5.99
Nevertire – Warren
0.82 1.23 0.54 0.57 0.29 0.55
Dubbo – Coonamble
2.23 3.78 1.14 0.66 1.03 1.24
Temora – North-Westb
6.07 31.75 8.22 9.62 3.49 7.08
Griffith - Hillston
7.48 19.05 6.38 24.42 17.07 11.31
The Rock – Boree Creek
6.19 13.13 28.63 52.22 23.27 14.95
a Includes Narrabri – Burren, Burren – Merrywinebone, Burren – Walgett. b Includes Temora – Barmedman, Barmedman – West Wyalong, West Wyalong – Ungarie, Ungarie – Lake Cargelligo, Ungarie – Naradhan.
Source: Sapere (2012); IPART calculations.
Table 4.6 Ratio of costs to external benefits by line (ongoing maintenance cost excluding stabilisation) ($2010/11)
Line group 2006/07 2007/08 2008/09 2009/10 2010/11 Average
Camurra - Weemelah
1.78 4.49 1.03 1.51 2.82 1.81
Narrabri - Westa
1.16 2.86 1.12 0.59 0.58 0.92
Bogan Gate – Tottenham
5.31 4.58 3.19 3.66 1.49 3.01
Nevertire – Warren
0.35 0.52 0.23 0.24 0.12 0.23
Dubbo – Coonamble
1.12 1.91 0.56 0.32 0.51 0.61
Temora – North-Westb
3.69 19.37 5.00 5.86 2.12 4.30
Griffith - Hillston
4.48 11.44 3.82 14.68 10.25 6.79
The Rock – Boree Creek
3.45 7.33 16.00 29.20 13.00 8.35
a Includes Narrabri – Burren, Burren – Merrywinebone, Burren – Walgett. b Includes Temora – Barmedman, Barmedman – West Wyalong, West Wyalong – Ungarie, Ungarie – Lake Cargelligo, Ungarie – Naradhan.
Source: Sapere (2012); IPART calculations.
4 Are the current access prices and government subsidy appropriate?
40 IPART Review of access pricing on the NSW grain line network
Based largely on non-grain freight traffic, the Nevertire – Warren line exhibits a positive benefit ratio.25 This is because it is only a 20 km stretch of line, but captures the external benefits of the whole journey to port. Based on ongoing maintenance costs only, the Narrabri West group and Dubbo – Coonamble line have a cost benefit ratio less than 1 on average over the period, boosted by good harvest years. By contrast, some lines have a cost benefit ratio far in excess of 1, even based on ongoing maintenance costs in good harvest years.
Net subsidy of rail compared to net subsidy of regional roads
In its submission, GrainCorp argued that, over 2010 and 2011 on average, the implied government subsidy for the grain lines was 0.12c/ntk, which is less than the implied subsidy for regional roads of 0.47c/ntk, based on our estimate of unrecovered local road costs in Chapter 12 of our Draft Report.
We note that the average volume transported on the whole network across 2010 and 2011 was 731,098 thousand net tonne kilometres, not 731,098 tonnes as assumed by GrainCorp. Dividing the average net benefit of $8,789,741 by number of net tonne kilometres equates to $0.012 per ntk, which is actually 1.2c/ntk.
GrainCorp compares this to our estimated unrecovered road cost of 0.47c/ntk, which is arguably an implicit subsidy that the government provides to heavy vehicle road users. As noted in our Draft Report, 0.47c/ntk is the estimated unrecovered road cost, based on a typical B-double vehicle travelling on local roads 100% of the time. However, the net external benefits are calculated on grain transported from grain line silo to port. A typical B-double would not travel on local roads for the whole distance to port. The National Transport Commission (NTC) estimates that heavy vehicles travel only 10% of the time on local roads.26 In its report for the Ministerial Taskforce for the Cowra lines, Booz Allen Hamilton also bases its externality calculations on a 10:90 split between rural and urban travel. Based on this proportion, the unrecovered road cost for the whole journey to port is likely to average around 0.18c/ntk.
Finally, the 2 estimates are not directly comparable because the Laird external cost unit rates already take into account unrecovered road costs. An allowance of 1.41c/ntk is made (inflated to $2011/12). To compare the 2 estimates, this would need to be added back into the implied rail subsidy. The actual comparison is between 2.61c/ntk and 0.18c/ntk, which indicates that the rail subsidy is over 14 times higher than our estimate of the implicit subsidy to road through unrecovered heavy vehicle road costs.
25 Assuming that non-grain freight travels all the way to port. If non-grain freight is not
transported to port by rail, the external benefits along this route would be reduced substantially.
26 NTC, Heavy Vehicle Charges Determination RIS Vol II Appendices, 2007, p 17.

4 Are the current access prices and government subsidy appropriate?
Review of access pricing on the NSW grain line network IPART 41
Period of assessment for external benefits
While some submissions suggested that the time period from 2007 to 2011 represented a period of prolonged dry conditions and underestimated the external benefits of rail, other submissions, including the submission from GrainCorp, noted that the 2010 and 2011 years were higher than average harvest years.
By nature, the grain market is highly dependent on weather, exchange rates and other conditions. Some years will produce a small harvest and other years will produce a large harvest. We consider that 2007 to 2011 represents a typical grain harvest period. While 2010 and 2011 were higher than average harvest years, 2008 appears to have been a lower than average harvest year. On balance, we consider that this period represents the likely variation in harvests that can be expected over the next 5 years.
Conclusion
Our calculation of net external benefits is extremely conservative. It uses conservative estimates of rail and road externality unit costs and compares the net benefits of rail over the whole journey to port with the subsidy to the grain line component only – both including and excluding stabilisation costs.
We consider the cost benefit ratio over different harvest years and for individual line routes. Based on a typical 5-year period of use, it appears that average total costs are 2.7 times higher than the net external benefits generated. Expected future ongoing maintenance costs would be 1.4 times higher than net external benefits.
While a couple of lines appear to generate benefits in line with or in excess of the average subsidy they receive, most lines have a cost benefit ratio in excess of 1, even based on ongoing maintenance costs in good harvest years. This demonstrates that there is a case for users to increase the contribution that they make towards maintenance costs for the network as a whole.
Some of the lines receive a level of subsidy that far exceeds their net benefits. The inclusion of such lines in our analysis serves to increase the average cost benefit ratio. If the subsidy to these lines was removed, this would improve the average cost benefit ratio of the network substantially, which would decrease the amount by which access prices need to increase to recover a higher user share of costs.
5 Does rail have a competitive advantage over road for transporting grain?
42 IPART Review of access pricing on the NSW grain line network
5 Does rail have a competitive advantage over road for transporting grain?
In Chapter 3 and Chapter 4 we established that there is a gap between current cost recovery and the level that should result if government subsidy was set based on the average external benefits of the grain line network. This gap exists even when cost recovery is limited to ongoing maintenance costs, excluding the costs of stabilisation.
However, the extent to which the access prices can be increased is constrained by the comparable cost of transporting grain by road. Grain growers face a market price of grain less the cost of transportation. In order to maximise the price they receive, they will sell their grain to a grain trader offering the best price (less transport costs).
In our Draft Report, we established the costs of transporting grain from farm to port by rail and road along each of the grain line routes. We engaged Deloitte Touché Tohmatsu (Deloitte) to examine the rail and road transport options along each of the grain line routes and model the operating costs of transporting grain from up country storage to port under each option. To these results we added other logistical costs to calculate the total supply chain cost per tonne of grain for each line. We then calculated rail’s cost advantage over road for each line, based on the existing government subsidy.
This chapter revisits our approach to establishing the rail and road supply chain costs and tests some of our modelling assumptions. It presents our revised findings on rail cost advantage over road for each line, based on the government subsidy as determined in Chapter 3.
5.1 Final Findings
IPART finding
6 After considering stakeholder submissions and sensitivity testing of assumptions in our supply chain cost model, we confirm our Draft Finding that rail has a substantial cost advantage over road for transporting grain to port on each of the grain line routes at current access prices.
Stakeholders made a number of comments on the assumptions in the Deloitte model of rail and road operating costs and our supply chain cost model used to generate our Draft Findings. We conducted sensitivity testing on these assumptions using stakeholder input and other available information and confirmed that rail cost advantage is not eroded substantially under any of the scenarios we tested.
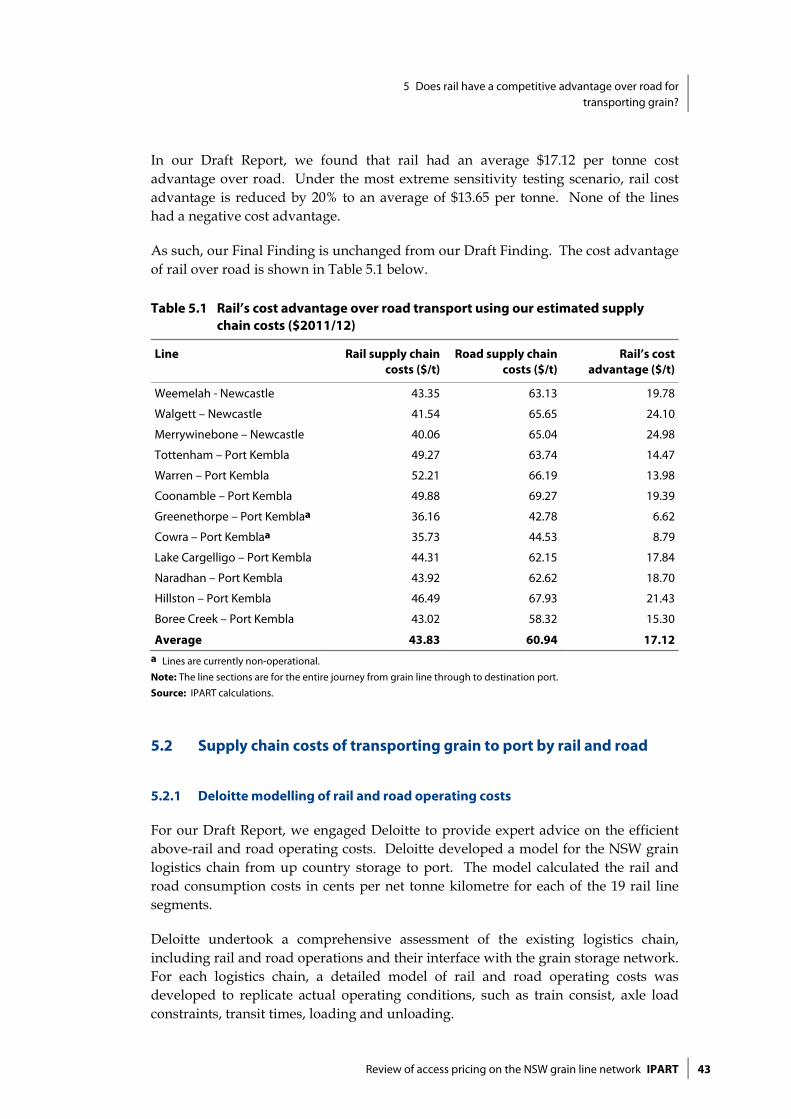
5 Does rail have a competitive advantage over road for transporting grain?
Review of access pricing on the NSW grain line network IPART 43
In our Draft Report, we found that rail had an average $17.12 per tonne cost advantage over road. Under the most extreme sensitivity testing scenario, rail cost advantage is reduced by 20% to an average of $13.65 per tonne. None of the lines had a negative cost advantage.
As such, our Final Finding is unchanged from our Draft Finding. The cost advantage of rail over road is shown in Table 5.1 below.
Table 5.1 Rail’s cost advantage over road transport using our estimated supply chain costs ($2011/12)
Line Rail supply chain costs ($/t)
Road supply chain costs ($/t)
Rail’s cost advantage ($/t)
Weemelah - Newcastle 43.35 63.13 19.78
Walgett – Newcastle 41.54 65.65 24.10
Merrywinebone – Newcastle 40.06 65.04 24.98
Tottenham – Port Kembla 49.27 63.74 14.47
Warren – Port Kembla 52.21 66.19 13.98
Coonamble – Port Kembla 49.88 69.27 19.39
Greenethorpe – Port Kemblaa 36.16 42.78 6.62
Cowra – Port Kemblaa 35.73 44.53 8.79
Lake Cargelligo – Port Kembla 44.31 62.15 17.84
Naradhan – Port Kembla 43.92 62.62 18.70
Hillston – Port Kembla 46.49 67.93 21.43
Boree Creek – Port Kembla 43.02 58.32 15.30
Average 43.83 60.94 17.12a Lines are currently non-operational.
Note: The line sections are for the entire journey from grain line through to destination port.
Source: IPART calculations.
5.2 Supply chain costs of transporting grain to port by rail and road
5.2.1 Deloitte modelling of rail and road operating costs
For our Draft Report, we engaged Deloitte to provide expert advice on the efficient above-rail and road operating costs. Deloitte developed a model for the NSW grain logistics chain from up country storage to port. The model calculated the rail and road consumption costs in cents per net tonne kilometre for each of the 19 rail line segments.
Deloitte undertook a comprehensive assessment of the existing logistics chain, including rail and road operations and their interface with the grain storage network. For each logistics chain, a detailed model of rail and road operating costs was developed to replicate actual operating conditions, such as train consist, axle load constraints, transit times, loading and unloading.

5 Does rail have a competitive advantage over road for transporting grain?
44 IPART Review of access pricing on the NSW grain line network
The operating scenarios that were modelled for each line segment were:
Rail direct to port: Grain is transferred using 48 Class locomotives from silo to port. The axle load remains constant for the entire journey. Speed increases based on track attribute.
Rail to consolidation facility: Grain is transferred by rail to silo using a 48 Class locomotive. From the mainline grain consolidation facility, an 81 Class locomotive with increased axle load is used. Speed increases based on track attribute.
Road to consolidation facility: Grain is transferred from silo to mainline grain consolidation facility by B-Double truck. From the mainline facility, grain is transferred to port by 81 Class locomotives.
Road to port: Grain is transferred from silo to port using B-Doubles.
The cost components for the rail haulage scenarios included capital costs of locomotives and wagons, train crew, fuel, train loading and unloading and other relevant costs.
Excluding grain line rail access charges, Deloitte’s above-rail operating costs for the rail direct to port scenario ranged from 3.4 to 4.3 cents per net tonne kilometre (c/ntk), with an average cost of 3.9c/ntk. The operating costs for the rail to consolidation facility scenario had a larger range of 3.3 to 4.4c/ntk, with an average of 4.0c/ntk.
The road to port operating cost estimates ranged from 9.2 to 9.6 cents per net tonne kilometre (c/ntk) and an average of 9.3c/ntk. For the road to consolidation facility scenario, which includes using rail from the consolidation facility to port, the operating costs ranged from 3.5 to 5.c/ntk, with an average of 4.8c/ntk. These average costs were much lower, because the longest component of the journey is from main line consolidation facility to port by rail, which is cheaper per net tonne kilometre.
5.2.2 Stakeholder submissions
Stakeholders made a number of comments about the assumptions underpinning the Deloitte model of rail and road operating costs.
Locomotive types
Both the Railway Technical Society of Australasia and the Lachlan Regional Transport Committee suggested that there are other types of locomotives available to the Australian market that are capable of being run on the grain lines. Such

5 Does rail have a competitive advantage over road for transporting grain?
Review of access pricing on the NSW grain line network IPART 45
locomotives are newer and more fuel efficient and are likely to have lower operating costs.27
Payload and utilisation rates of locomotives and wagons on the grain lines and main lines
GrainCorp stated that the utilisation rates of locomotives and wagons on the grain lines and main lines are much lower in reality than the assumptions made by Deloitte in their operating cost model. GrainCorp stated that utilisation was likely to be around 65%, as opposed to the 70% to 100% assumed by Deloitte.
GrainCorp also stated that payloads were around 15% lower in reality than those assumed by Deloitte.28
Train crew costs
Table 3 in GrainCorp's submission referenced a crew cost rate that was around 100% higher than that assumed by Deloitte.29
Fuel efficiency
The Livestock and Bulk Carriers noted that road vehicles are becoming increasingly fuel efficient.30
Fuel price volatility
Dr Philip Laird noted that the volatility of oil prices will affect future road and rail operating costs.31
5.2.3 IPART’s findings
Based on stakeholder feedback from submissions, we engaged Deloitte to provide further expert advice and conduct sensitivity testing on the following operating cost assumptions:
1. Capital costs of wagons and locomotives
2. Train crew costs
3. Fuel prices
4. Fuel efficiency
5. Locomotive and wagon utilisation rates and payloads.
27 Railway Technical Society of Australasia submission, p 3; Lachlan Regional Transport
Committee submission, p 2. 28 GrainCorp submission, p 6. 29 Ibid, p 5. 30 Livestock and Bulk Carriers submission, p 2. 31 Dr Philip Laird submission, pp 2-4.
5 Does rail have a competitive advantage over road for transporting grain?
46 IPART Review of access pricing on the NSW grain line network
Deloitte’s additional report on sensitivity testing is available on our website.
Locomotive type
Deloitte considered the possibility of using alternative locomotives on the network and concluded that only the GM and 700 Class locomotives would have the potential to reduce operating costs. These locomotives deliver higher horsepower (1,800 - 2,000hp) than the 48 Class locomotives (1,000hp), enabling fewer locomotives to be used and hence, reducing operating costs.
However, Deloitte concluded that the GM and 700 Class locomotives are only able to be run on Class 3 lines, of which there are few in the grain network, with a majority of lines being Class 5. In addition, some lines are only Class 3 for part of the journey. Deloitte concluded that to run these locomotives part of the way on a grain line and switch to a light axle locomotive would be uneconomical. Deloitte identified 2 routes on which the GM Class and 700 Class locomotives could be run feasibly and economically. These were from Temora – Naradhan and Cowra – Demondrille (currently non-operational).
Other locomotive types suggested by stakeholders had similar operating characteristics to the 48 Class or were determined by Deloitte to be totally uneconomical in light of very high capital costs and low return (due to the low volume of grain transported on the grain lines and low utilisation rate).
The results of Deloitte's sensitivity testing of locomotive type showed that using the GM Class or 700 Class produced similar results. It reduced operating costs in the rail direct to port and rail to consolidation facility scenarios by an average of 6% and 5% respectively.
Payload and utilisation rates of locomotives and wagons on the grain lines and main lines
Deloitte advised that while GrainCorp’s suggested utilisation rate of 65% for 48 Class locomotives may be realised in practice, the utilisation rate for 81 Class locomotives should be retained at 100% in light of their potential use for non-grain traffic.
Deloitte modelled a 15% reduction in payload in conjunction with a reduced utilisation rate of 65% for 48 Class locomotives on the grain line component, but kept the utilisation rate for 81 Class locomotives on the main lines at 100%.
Reducing utilisation rate resulted in a higher operating cost for each train cycle as fixed costs are spread over less tonnage. Reducing payloads also increased the operating cost because more train cycles are required to transport the same volume of grain.
On average, this resulted in a substantial increase in operating costs in the rail direct to port and rail to consolidation facility scenario of 15% and 13% respectively. It also resulted in a 6% increase in operating costs in the road to consolidation facility
5 Does rail have a competitive advantage over road for transporting grain?
Review of access pricing on the NSW grain line network IPART 47
scenario, because this scenario assumes that grain ultimately travels by rail from consolidation facility to port.
Train crew costs
Deloitte examined the Enterprise Bargaining Agreement costs that were used previously in its modelling assumptions and determined that there had been no changes to these costs since the original study was undertaken. Deloitte recommended that no sensitivity testing was necessary on these costs.
Fuel efficiency
Deloitte examined commentary in submissions about fuel efficiency and found that there was likely to be an improvement in the fuel efficiency of both road and rail vehicles over the period subject to IPART's pricing review.
Deloitte assumed that in the best case scenario, 92 Class locomotives would replace 81 Class locomotives, reducing fuel consumption from an estimated 4.1 litres/'000gtk to 3.1 litres/'000gtk or approximately 25%. However, Deloitte concluded that it was unlikely that any upgrade would result in significant change on current fuel consumption rates to the 48 Class locomotives.
Deloitte modelled a fuel efficiency improvement of 25% over road and rail scenarios and determined that this would reduce operating costs by an average of 4% in the rail to consolidation facility scenario, 6% in the road to consolidation facility scenario and 9% in the direct road to port scenario.
In general, fuel efficiency improvements decreased operating costs for road scenarios more than rail because fuel costs account for a greater proportion of road vehicle costs than rail.
Fuel price volatility
Deloitte agreed that the uncertainty of fuel pricing would impact on the relative competitiveness of rail and road supply chains. Deloitte reviewed projections developed by the United States Energy Information Administration and determined that a reasonable price variation of 20% could potentially apply over the pricing period.
Deloitte updated the previous Sydney Terminal Gate price for diesel (from September 2011) and modelled a +/-20% change in this price. The results showed that for a decrease in fuel prices, both rail to port scenarios experienced a 4% decrease in operating costs, road to consolidation facility experienced a 5% decrease in operating costs and direct road to port experienced a 7% decrease in operating costs.
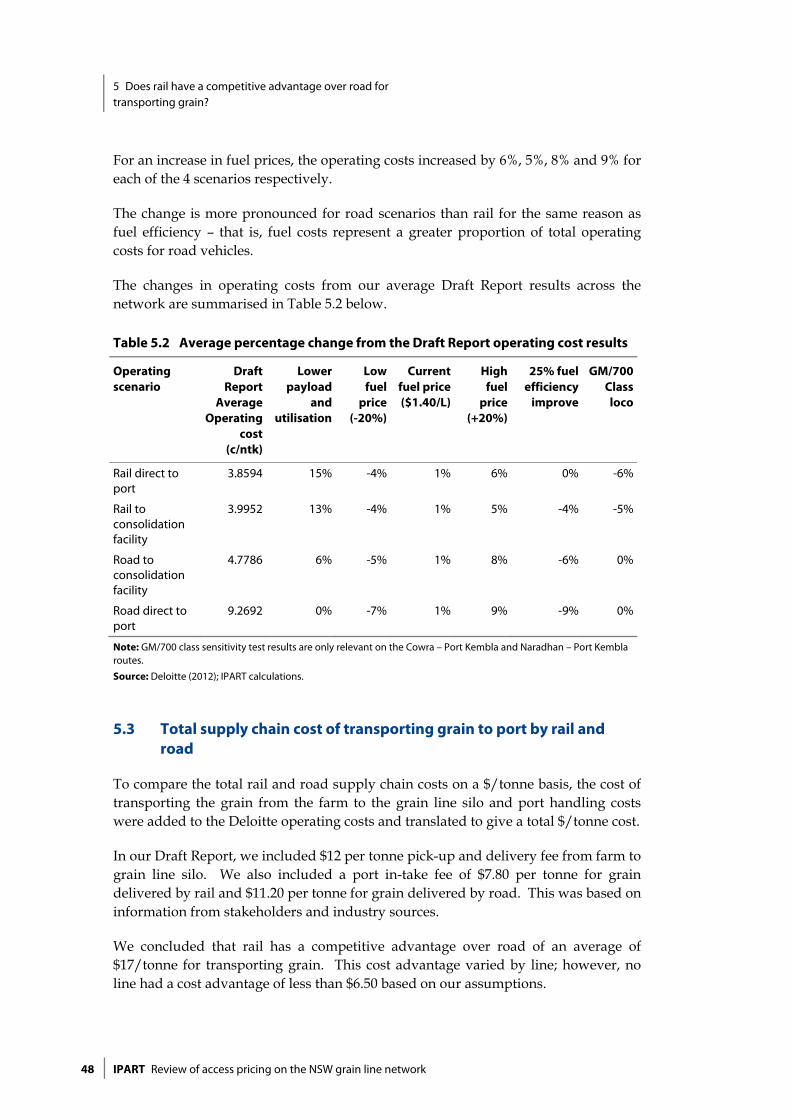
5 Does rail have a competitive advantage over road for transporting grain?
48 IPART Review of access pricing on the NSW grain line network
For an increase in fuel prices, the operating costs increased by 6%, 5%, 8% and 9% for each of the 4 scenarios respectively.
The change is more pronounced for road scenarios than rail for the same reason as fuel efficiency – that is, fuel costs represent a greater proportion of total operating costs for road vehicles.
The changes in operating costs from our average Draft Report results across the network are summarised in Table 5.2 below.
Table 5.2 Average percentage change from the Draft Report operating cost results
Operating scenario
Draft Report
Average Operating
cost (c/ntk)
Lower payload
and utilisation
Low fuel
price (-20%)
Current fuel price ($1.40/L)
High fuel
price (+20%)
25% fuel efficiency
improve
GM/700 Class loco
Rail direct to port
3.8594 15% -4% 1% 6% 0% -6%
Rail to consolidation facility
3.9952 13% -4% 1% 5% -4% -5%
Road to consolidation facility
4.7786 6% -5% 1% 8% -6% 0%
Road direct to port
9.2692 0% -7% 1% 9% -9% 0%
Note: GM/700 class sensitivity test results are only relevant on the Cowra – Port Kembla and Naradhan – Port Kembla routes.
Source: Deloitte (2012); IPART calculations.
5.3 Total supply chain cost of transporting grain to port by rail and road
To compare the total rail and road supply chain costs on a $/tonne basis, the cost of transporting the grain from the farm to the grain line silo and port handling costs were added to the Deloitte operating costs and translated to give a total $/tonne cost.
In our Draft Report, we included $12 per tonne pick-up and delivery fee from farm to grain line silo. We also included a port in-take fee of $7.80 per tonne for grain delivered by rail and $11.20 per tonne for grain delivered by road. This was based on information from stakeholders and industry sources.
We concluded that rail has a competitive advantage over road of an average of $17/tonne for transporting grain. This cost advantage varied by line; however, no line had a cost advantage of less than $6.50 based on our assumptions.

5 Does rail have a competitive advantage over road for transporting grain?
Review of access pricing on the NSW grain line network IPART 49
5.3.1 Stakeholder submissions
Loading and unloading costs
GrainCorp stated that the costs of unloading and loading at rail and road junctions had not been included in the supply chain cost model. These costs are incurred where grain is transhipped from grain line train to main line train and from road to the mainline silo, including storage costs. GrainCorp estimated these costs to be in the order of around $3/tonne for rail-rail and $6/tonne for road-rail transhipments.32
The marginal user versus the average user
Asciano suggested that our supply chain cost model should consider the rail cost advantage of the marginal user, rather than the average user.33
Comparison of costs over grain line segments
GrainCorp suggested that IPART's comparison of road and rail operating costs and the subsequent impact of grain line access prices should be conducted over the relevant grain line segment.34
5.3.2 IPART’s findings
Table 5.3 compares the change in rail cost advantage from our Draft Report in each of the sensitivity test scenarios conducted by Deloitte. Table 5.4 shows the change for the Naradhan – Port Kembla and Cowra – Port Kembla routes from substituting GM and 700 Class locomotives.
The scenario that has the largest (negative) impact on rail cost advantage is fuel efficiency (-25.4%). However, average rail cost advantage is still $12.77/tonne. None of the lines record a road cost advantage over rail. The 2 routes with the smallest rail cost advantage are Greenethorpe - Port Kembla and Cowra - Port Kembla, where the grain line segment is non-operational in each case.
32 GrainCorp submission, p 7. 33 Asciano submission, pp 7-8. 34 Ibid.
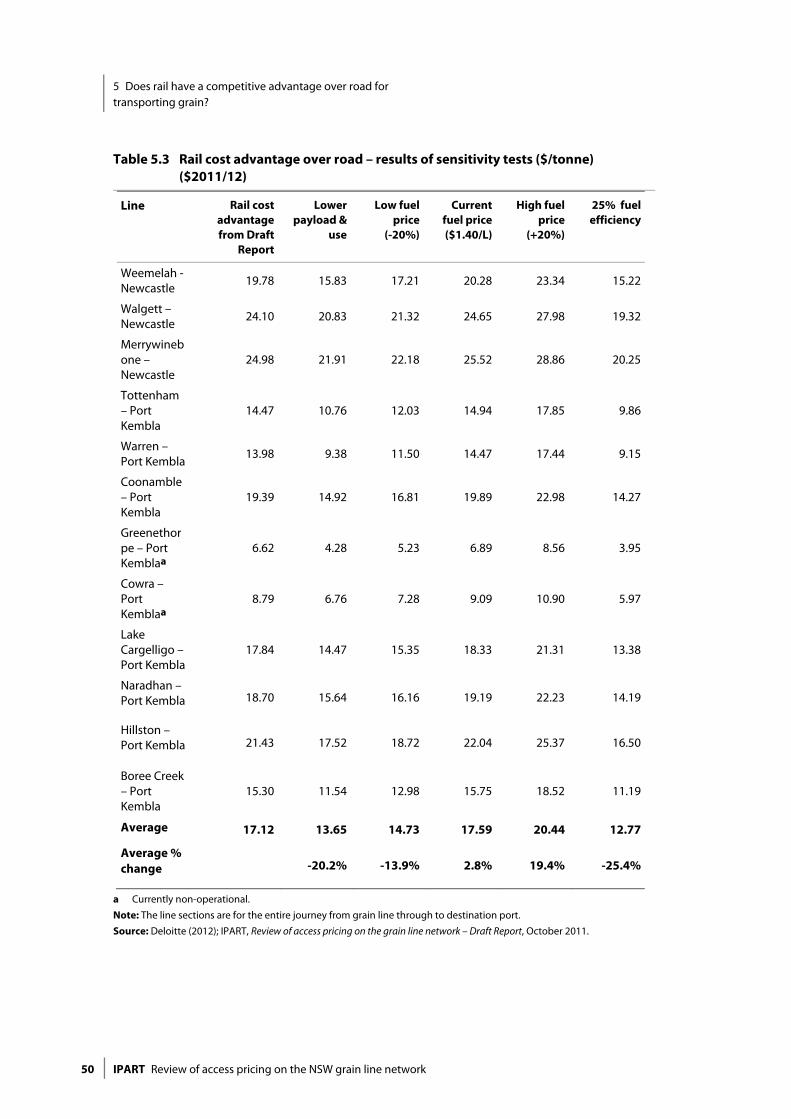
5 Does rail have a competitive advantage over road for transporting grain?
50 IPART Review of access pricing on the NSW grain line network
Table 5.3 Rail cost advantage over road – results of sensitivity tests ($/tonne) ($2011/12)
Line Rail cost advantage from Draft
Report
Lower payload &
use
Low fuel price
(-20%)
Current fuel price ($1.40/L)
High fuel price
(+20%)
25% fuel efficiency
Weemelah - Newcastle
19.78 15.83 17.21 20.28 23.34 15.22
Walgett – Newcastle
24.10 20.83 21.32 24.65 27.98 19.32
Merrywinebone – Newcastle
24.98 21.91 22.18 25.52 28.86 20.25
Tottenham – Port Kembla
14.47 10.76 12.03 14.94 17.85 9.86
Warren – Port Kembla
13.98 9.38 11.50 14.47 17.44 9.15
Coonamble – Port Kembla
19.39 14.92 16.81 19.89 22.98 14.27
Greenethorpe – Port Kemblaa
6.62 4.28 5.23 6.89 8.56 3.95
Cowra – Port Kemblaa
8.79 6.76 7.28 9.09 10.90 5.97
Lake Cargelligo – Port Kembla
17.84 14.47 15.35 18.33 21.31 13.38
Naradhan – Port Kembla 18.70 15.64 16.16 19.19 22.23 14.19
Hillston – Port Kembla 21.43 17.52 18.72 22.04 25.37 16.50
Boree Creek – Port Kembla
15.30 11.54 12.98 15.75 18.52 11.19
Average 17.12 13.65 14.73 17.59 20.44 12.77
Average % change -20.2% -13.9% 2.8% 19.4% -25.4%
a Currently non-operational.
Note: The line sections are for the entire journey from grain line through to destination port. Source: Deloitte (2012); IPART, Review of access pricing on the grain line network – Draft Report, October 2011.
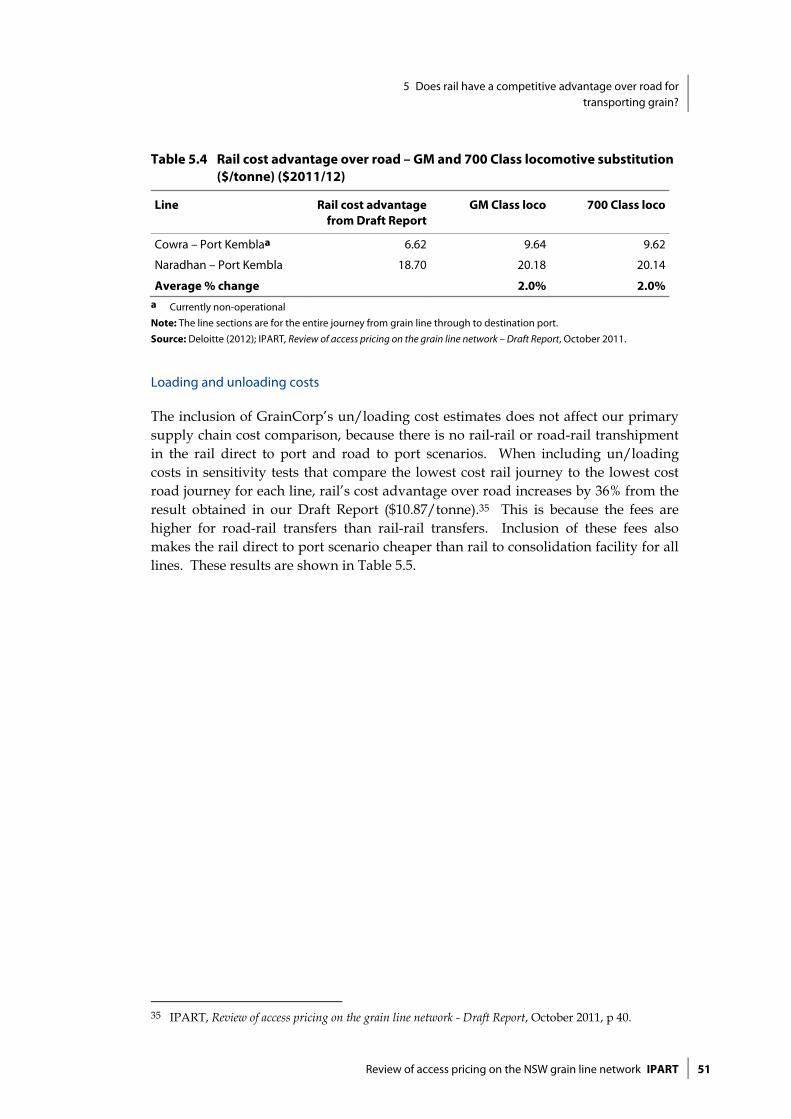
5 Does rail have a competitive advantage over road for transporting grain?
Review of access pricing on the NSW grain line network IPART 51
Table 5.4 Rail cost advantage over road – GM and 700 Class locomotive substitution ($/tonne) ($2011/12)
Line Rail cost advantage from Draft Report
GM Class loco 700 Class loco
Cowra – Port Kemblaa 6.62 9.64 9.62
Naradhan – Port Kembla 18.70 20.18 20.14
Average % change 2.0% 2.0%a Currently non-operational
Note: The line sections are for the entire journey from grain line through to destination port. Source: Deloitte (2012); IPART, Review of access pricing on the grain line network – Draft Report, October 2011.
Loading and unloading costs
The inclusion of GrainCorp’s un/loading cost estimates does not affect our primary supply chain cost comparison, because there is no rail-rail or road-rail transhipment in the rail direct to port and road to port scenarios. When including un/loading costs in sensitivity tests that compare the lowest cost rail journey to the lowest cost road journey for each line, rail’s cost advantage over road increases by 36% from the result obtained in our Draft Report ($10.87/tonne).35 This is because the fees are higher for road-rail transfers than rail-rail transfers. Inclusion of these fees also makes the rail direct to port scenario cheaper than rail to consolidation facility for all lines. These results are shown in Table 5.5.
35 IPART, Review of access pricing on the grain line network - Draft Report, October 2011, p 40.
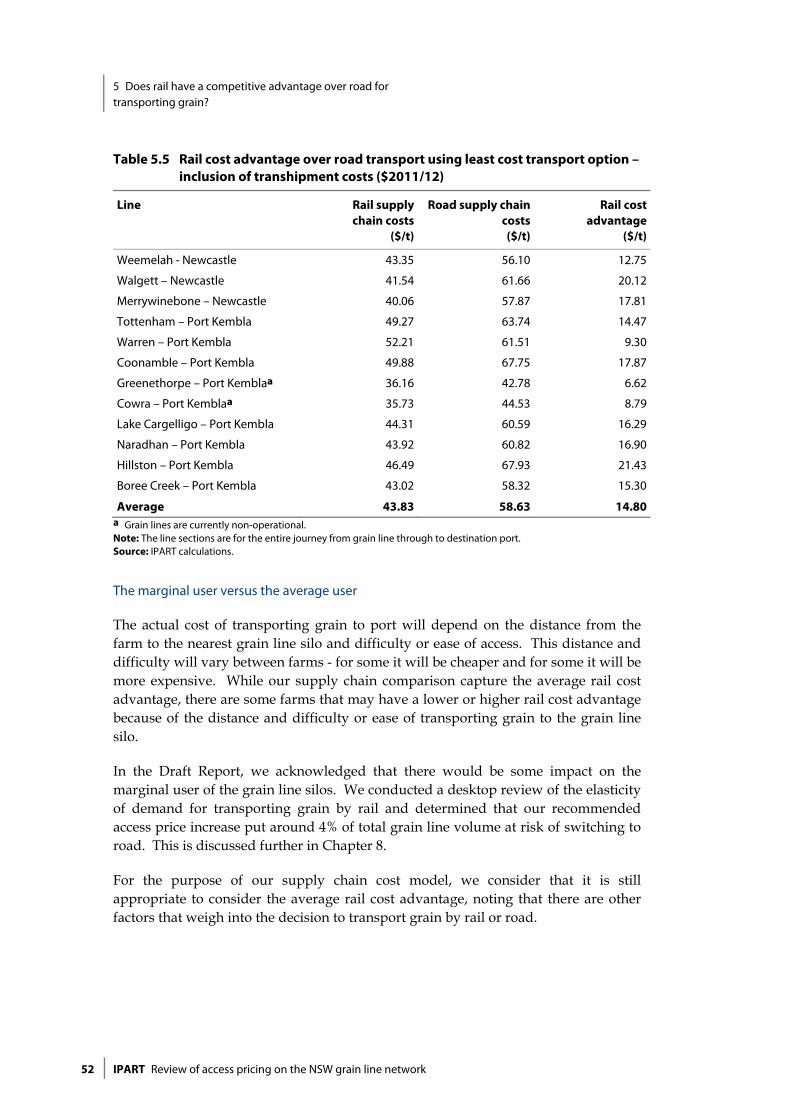
5 Does rail have a competitive advantage over road for transporting grain?
52 IPART Review of access pricing on the NSW grain line network
Table 5.5 Rail cost advantage over road transport using least cost transport option – inclusion of transhipment costs ($2011/12)
Line Rail supply chain costs
($/t)
Road supply chain costs ($/t)
Rail cost advantage
($/t)
Weemelah - Newcastle 43.35 56.10 12.75
Walgett – Newcastle 41.54 61.66 20.12
Merrywinebone – Newcastle 40.06 57.87 17.81
Tottenham – Port Kembla 49.27 63.74 14.47
Warren – Port Kembla 52.21 61.51 9.30
Coonamble – Port Kembla 49.88 67.75 17.87
Greenethorpe – Port Kemblaa 36.16 42.78 6.62
Cowra – Port Kemblaa 35.73 44.53 8.79
Lake Cargelligo – Port Kembla 44.31 60.59 16.29
Naradhan – Port Kembla 43.92 60.82 16.90
Hillston – Port Kembla 46.49 67.93 21.43
Boree Creek – Port Kembla 43.02 58.32 15.30
Average 43.83 58.63 14.80 a Grain lines are currently non-operational. Note: The line sections are for the entire journey from grain line through to destination port. Source: IPART calculations.
The marginal user versus the average user
The actual cost of transporting grain to port will depend on the distance from the farm to the nearest grain line silo and difficulty or ease of access. This distance and difficulty will vary between farms - for some it will be cheaper and for some it will be more expensive. While our supply chain comparison capture the average rail cost advantage, there are some farms that may have a lower or higher rail cost advantage because of the distance and difficulty or ease of transporting grain to the grain line silo.
In the Draft Report, we acknowledged that there would be some impact on the marginal user of the grain line silos. We conducted a desktop review of the elasticity of demand for transporting grain by rail and determined that our recommended access price increase put around 4% of total grain line volume at risk of switching to road. This is discussed further in Chapter 8.
For the purpose of our supply chain cost model, we consider that it is still appropriate to consider the average rail cost advantage, noting that there are other factors that weigh into the decision to transport grain by rail or road.
5 Does rail have a competitive advantage over road for transporting grain?
Review of access pricing on the NSW grain line network IPART 53
Comparison of costs over grain line segments
GrainCorp and CRIA previously advised that the relevant journey over which users consider prices is from the farm to port. CRIA advised that it quotes access prices for train paths for the whole route on the CRN and does not distinguish grain line access prices from general CRN access prices. Prices offered at port also take into account the total cost of transporting grain from a particular point in the supply chain.
We consider that this is realistic of how users make their decisions about transporting grain by rail or road. We have therefore made our supply chain cost comparisons using average cost of transporting grain over the whole journey port by rail or road.
5.3.3 Conclusion
Our sensitivity testing of assumptions based on stakeholder submissions confirms that there is a substantial rail cost advantage over road for each of the grain line routes to port. This cost advantage is enjoyed at the expense of a sizeable government subsidy, which exceeds the external benefits generated by the grain lines. As noted in Chapter 4, while some level of government subsidy is appropriate, there is scope for users to make a greater contribution to the costs of maintaining the grain line network.
6 Are there any non-price solutions that would improve cost recovery?
54 IPART Review of access pricing on the NSW grain line network
6 Are there any non-price solutions that would improve cost recovery?
In the previous chapters we established that the current and expected ongoing level of government subsidy exceeds the average external benefits generated by the grain line network. We also found that rail has a considerable cost advantage over road for transporting grain to port (at current access prices). This cost advantage is realised under a range of alternative modelling assumptions offered by stakeholders. This indicates that there is both reason and scope to increase user contribution to grain line maintenance costs, without having a detrimental effect on the demand for rail transport.
Increasing access prices is one way to increase cost recovery on the grain line network. However, there may be other options to improve cost recovery without increasing access prices. This chapter investigates the merits of alternative methods of increasing cost recovery.
6.1 Final Findings
IPART finding
7 Non-price solutions are unlikely to increase cost recovery on the grain line network by any meaningful amount.
8 An increase in access prices will increase cost recovery and provide pricing certainty for users.
9 The above-rail operating cost savings likely to result from upgrading the grain line network to Class 2 do not outweigh the significant below-rail investment required. Further, that these cost savings accrue primarily to private parties.
Our Final Findings are unchanged from the Draft Report. In light of stakeholder information throughout our review and our own analysis, we consider that none of the non-price options investigated are likely to increase cost recovery by any meaningful amount.
6 Are there any non-price solutions that would improve cost recovery?
Review of access pricing on the NSW grain line network IPART 55
6.2 Can cost recovery be improved without increasing access prices?
In our Draft Report, we considered a number of suggestions from stakeholders about how cost recovery could be increased without increasing access prices on the grain lines. These included:
reducing below-rail maintenance costs
increasing the amount of traffic on the lines
track upgrades as a mechanism to reduce operating costs and attract additional demand.
We concluded that none of the non-price options put forward were likely to increase cost recovery by any meaningful amount. In particular, we determined that the above-rail operating cost savings that were likely to result from upgrading the network to Class 2 (and hence allow heavier axle loads) would not outweigh the significant below-rail investment required to achieve those cost efficiencies.
6.3 Stakeholder submissions
Stakeholders did not have many comments about non-price solutions to increase cost recovery. Asciano suggested that in light of the new maintenance contract with John Holland, there may be some potential for material operating and maintenance cost savings on the grain lines going forward.36
Peter and Libby Skipworth and the Railway Technical Society of Australasia noted that it was unlikely that upgrades to the lines could be fully funded by existing users as grain growers have little ability to pass on costs and there are few other users with which to share these costs.37
Other stakeholders, such as the Lachlan Regional Transport Committee and Orana Organisation of Councils, made general comments about current non-grain traffic on the network, but did not offer new information about potential additional non-grain traffic.38
36 Asciano submission, p 9. 37 Peter and Libby Skipworth submission, p 2; Railway Technical Society of Australasia
submission, p 4. 38 Lachlan Regional Transport Committee submission, p 3; Orana Organisation of Councils
submission, p 3.

6 Are there any non-price solutions that would improve cost recovery?
56 IPART Review of access pricing on the NSW grain line network
6.4 IPART findings
6.4.1 Can below-rail maintenance costs be reduced?
In our Draft Report, we concluded that while, in principle, below-rail costs could be reduced by increasing efficiency or reducing the scope of maintenance activities, there was limited ability to do either. While below-rail costs may be reduced by suspending operations on some of the lines, this may increase other costs, such as road maintenance, and would need to be considered as part of a comprehensive cost benefit analysis.
In Chapter 3, we considered the efficient costs of maintaining and stabilising each of the grain lines. The results indicated that once stabilisation was complete, expected ongoing maintenance costs were in the order of around $20,608 per track kilometre per annum ($2011/12). These costs are within the range estimated by Worley-Parsons (2006) in relation to the cost of maintaining the Victorian regional freight-only network.39 As such, we consider that they represent efficient costs and are unlikely to be able to be reduced by any meaningful amount through further improvements to efficiency.
On the other hand, stabilisation costs can be reduced by postponing works. In Chapter 3, stabilisation costs were found to be in the order of around $18.1 million annum until 2020. This would be a significant saving, but would delay improvement of the condition of the track, which may have the effect of increasing ongoing maintenance costs. However, even if the scope of stabilisation works was reduced, cost recovery of ongoing maintenance costs would still be only 4.4% per annum on average.
6.4.2 Can rail volumes be increased at current access prices?
In our Draft Report, we noted that, in principle, cost recovery could be increased if volumes of traffic on the grain lines increased. This may occur through increasing rail’s market share for transporting grain or by attracting additional non-grain traffic to the network.
We concluded that the grain lines already transport around 70% of grain received at grain line silos destined for export or domestic (human) consumption. With increasing competition from road transport as heavy vehicle productivity and access improves, and on-farm storage costs decrease, it is unlikely that rail's market share of grain could be increased substantially.
In addition, as noted by GrainCorp and Asciano at our public roundtable held before the Draft Report, in a large harvest year there is not enough above-rail capacity to transport all grain by rail so some use of road transport is unavoidable.
39 Sapere (2012), p 10.
6 Are there any non-price solutions that would improve cost recovery?
Review of access pricing on the NSW grain line network IPART 57
While some lines also carry non-grain freight, non-grain freight has contributed an average of around 5% of total traffic over the last 5 years. Other than the Warren – Nevertire line, which experienced a sizeable increase in non-grain freight transported in 2010/11 only, the levels of non-grain freight on the network have been relatively stable over this period. In the absence of any evidence from stakeholders or other available sources that volumes of non-grain freight are likely to increase significantly over the period under review, we consider that the previous 5-year period provides a realistic indication of the expected level of non-grain freight on the network.
6.4.3 Can upgrading the lines to carry a higher axle load improve cost recovery?
In our Draft Report we considered whether upgrading the network to Class 2 across the board would improve operating efficiency and achieve cost savings that could translate to lower prices for users and hence, encourage greater volumes of traffic. The results of our cost benefit analysis are replicated in Appendix D.
We found that the above-rail cost savings that could be achieved from more efficient operations on a Class 2 network did not justify the approximate $0.5 billion investment required to upgrade the network to Class 2 at this time. Further, we noted that as these savings accrue to private parties, it would be reasonable to expect these parties to contribute the bulk of the investment costs. This was consistent with findings of the NSW Grain Freight Review (2009), which determined that none of the grain lines should be upgraded to Class 2 standard.
Advice from stakeholders indicates that the primary benefit of upgrading the network arises because grain wagons (which have a capacity of 69 tonne payload) can only be partly loaded (to 53 tonnes) on Class 3 or Class 5 grain lines, because of the 19 tonne axle load limit.40 The partly-loaded wagons are then hauled all the way to port.41 This is because it is considered to be logistically difficult and more costly to top up the wagons on the main line. Costs per train-kilometre are fairly independent of the train payload. It costs the same to transport a wagon that is partly-loaded as a wagon that is full. If a main line train could operate on the grain network and the wagons could be filled with more grain, the greater load could be transported for much the same rail operating cost.
To enable this, the network would need to be upgraded to Class 2 standard. Based on advice from CRIA, the cost of upgrading the grain line network to Class 2 standard (21 tonne axle load capacity) is approximately $0.5 billion. A Class 2 track would allow trains to increase their payload limit from 53 tonnes to 61 tonnes.
40 Roundtable transcript, August 2011, pp 67 and 76. 41 ibid, pp 22-23.
6 Are there any non-price solutions that would improve cost recovery?
58 IPART Review of access pricing on the NSW grain line network
Using GrainCorp’s estimate of its average train operating cost of 7 cents per net tonne kilometre, a cost savings of approximately 0.92 cents per net tonne kilometre could be achieved.42 If these cost savings were passed onto customers, it could make the grain lines more competitive and potentially, attract more traffic. Using a 5% discount rate and calculating cost savings over a 50-year period, we found the net present value of the net benefits was negative for all line segments. Using Deloitte’s estimates of efficient operating costs, the operating cost savings are even smaller (in the order of 0.5 cents per net tonne kilometre).
While it is ultimately the government's decision to decide how to invest any additional access revenue received from an increase in access prices, our analysis indicates that there no case on economic grounds for investing funds into upgrading any of the lines to Class 2 standard at this time. In addition, it is unlikely that the amount of increased access revenue generated would be sufficient to cover the investment required to upgrade any of the lines.
Recommendation
1 Any future upgrades of grain lines to a Class 2 standard or higher should be:
– negotiated on the basis of a comprehensive cost benefit analysis that includes consideration of non-grain traffic
– funded primarily by the parties to whom the benefits accrue, through an appropriate funding mechanism.
6.4.4 Conclusion
We consider that none of the non-price options investigated are likely to increase cost recovery by any meaningful amount. In the event that cost recovery cannot be improved by non-price methods, we consider that an increase in access prices is necessary to improve cost recovery and provide greater sustainability for some lines on the network.
42 0.92 cents = 7 cents – (7 cents x (53/61 tonnes)).
7 What is an appropriate access price level and arrangement?
Review of access pricing on the NSW grain line network IPART 59
7 What is an appropriate access price level and arrangement?
This chapter discusses our analysis and sets out our recommendations on an appropriate access price level, structure and implementation plan over the next 5 years. It draws on our findings from the previous chapters.
7.1 Final Findings
IPART finding
10 Doubling grain line access prices from $2.61 to $5.22 per thousand gross tonne kilometres provides a good balance between increasing user contribution to costs in the short-term, without a significant loss of rail’s market share.
11 Doubling grain line access prices over the next 5 years will not improve the sustainability of all lines, nor will it lead to a fair and reasonable user contribution to average network costs in the longer-term.
12 There is strong support for a single, variable access charge that applies to the whole grain line network and is published.
Our first Final Finding is largely unchanged from our Draft Finding. Based on our revised estimates of the efficient costs of maintaining the network, external benefits generated by use of the network and inability of non-price options to contribute to cost recovery, we consider that an increase in access prices is necessary to increase user contribution to network costs. Based on our sensitivity testing of rail and road supply chain costs, we consider that an access price increase to $5.22 per thousand gross tonne kilometres will achieve a balance between increasing user share of costs in the short-term, without causing a significant loss of rail’s market share.
However, given that average external benefits do not justify the level of government subsidy and taking into account rail’s substantial cost advantage over road, which results from that subsidy, we consider that there could be scope for further movement in the access price to a level that is more commensurate with user share of benefits from the network in future.
Finally, we note that there is still strong support for a simplified access charge that is transparent and applies to all traffic on the network.
7 What is an appropriate access price level and arrangement?
60 IPART Review of access pricing on the NSW grain line network
7.2 What is an appropriate increase in access prices?
In our Draft Report, we recommended that access prices should be increased to $5.22 per thousand gross tonne kilometres (an increase of 100% on the current access price) over the next 2 years in order to increase cost recovery and user contribution to the maintenance costs of the grain network. We made this recommendation after considering the following:
the current level of cost recovery on the network is extremely low and unsustainable
our analysis showed that the level of government subsidy exceeded the net external benefits generated by the network
rail enjoys a substantial cost advantage over road as a result of an inappropriately generous government subsidy
a 100% access price increase on the grain lines would not result in a shift of any meaningful volume of traffic to road.
7.2.1 Stakeholder submissions
Most stakeholders did not disagree that an increase in grain line access prices was warranted. However, they expressed a range of concerns about the size of the increase and its potential consequences for supply chain participants, including road network users and agencies responsible for road maintenance. They also expressed concerns about how additional access revenue would be used. These concerns are explored in further detail in Chapter 8 which considers the impact of our recommended price increase on rail users, government and other stakeholders.
7.2.2 IPART’s findings
The extent to which access prices can be increased is largely a matter of judgment, taking into consideration a number of factors, which are discussed below.
Immediate increase in access prices
In Chapter 3, we examined the efficient cost of maintaining the network over the next 10 years and separated the stabilisation cost component from ongoing maintenance costs. We found that at current volumes and access prices, the annual cost recovery was around 2.3% of current costs and 4.4% of ongoing maintenance costs (excluding the costs of stabilisation works). While this varied between lines, cost recovery did not exceed 15% on any line and for some lines; it was less than 1%. This level of cost recovery and reliance on government funds has been unsustainable in the past and has led to continued uncertainty about the ongoing operation of some or all of the grain lines.
7 What is an appropriate access price level and arrangement?
Review of access pricing on the NSW grain line network IPART 61
In Chapter 4, we considered the level of net external benefits generated by use of the network in lieu of the competing road network. We found that over a typical 5-year period, the government subsidy to the network at current access prices exceeds the average net external benefits generated for the wider community. While some lines appear to justify the level of subsidy they receive in good harvest years, many lines receive a subsidy well in excess of the external benefits they generate, which reduces the average benefit across the network.
This suggests that, on average, the current government subsidy is too high and user contribution towards maintenance costs of the network should increase.
In Chapter 5, we considered the extent to which user share of costs could be increased without shifting grain traffic to road. We tested stakeholders' claims about various supply chain cost assumptions and concluded that rail still has a substantial cost advantage over road on average. This was also the case for each of the lines individually.
Therefore, we consider that our previous recommendation of a 100% increase to the access price is still appropriate for the 5-year period under our review. This results in an access price of $5.22 per thousand gross tonne kilometres.
The expected impact of our recommended access price increase on stakeholders is considered in Chapter 8.
Recommendation
2 An increase of the grain line access price to $5.22 per thousand tonne kilometres provides a good balance between improving cost recovery and maintaining rail’s modal share in the short-term.
Long-term view for access prices
An access price increase to $5.22 per thousand gross tonne kilometres over the next 5 years represents a balance between increasing cost recovery and user contribution to maintenance costs without risk of losing rail share to road under current circumstances. However, this increase makes only a marginal improvement to cost recovery across the network, largely compounded by a very low cost recovery on selected lines. Further, our recommended increase in the access price falls short of achieving a fair balance between user and government share of benefits across the network on average.
Given rail’s substantial cost advantage over road, which results from an overly generous government subsidy, we consider that is scope for further movement in grain line access prices to a level that is more commensurate with user share of benefits from the network in future. As such, we recommend that at the end of the current pricing period, the NSW Government could review the grain line access price to determine whether further increases are necessary and possible.

7 What is an appropriate access price level and arrangement?
62 IPART Review of access pricing on the NSW grain line network
Such a review could consider, but should not be limited to, the following factors among others:
changes in the efficient costs of maintaining the network
changes in the level of external benefits generated by use of the network relative to road
changes in the rail and road supply chain costs that may impact on rail’s competitive advantage over road, including input costs, changes in vehicle technology and institutional arrangements that govern how grain may be transported
outlook for grain prices and harvest volumes
changes to the dynamics of the grain market – whether more or less grain is being exported or used in the domestic market
changes to the regulatory framework, including the impact of any new governance arrangements that that government may implement as a result of, or in conjunction with, this review.
We consider that this recommendation strikes an appropriate balance between providing certainty to the grain industry, while still moving towards a fairer funding outcome in the longer-term.
Recommendation
3 At the end of the 5-year period, the NSW Government could review the access price to determine whether there is scope to increase it to a level that is more commensurate with user share of benefits, taking into account constraints from road competition amongst other factors.
7.3 What is an appropriate access price structure?
In our Draft Report, we stated that access pricing arrangements should provide:
Transparency: Access seekers have access to the information they need to inform their expectations and decisions about what they will pay for access to the routes they use on the network.
Certainty: Access seekers can predict changes in price and service levels to make decisions about above-rail infrastructure investment.
Administrative simplicity: The arrangements are practical and not costly for the infrastructure owner to implement or the access seeker to comply.
We recommended that a tariff that consists of a single variable component would simplify the current arrangements and improve certainty for access seekers, without making a significant difference to revenue recovery for the network owner. We also recommended that the reference tariff should be published.
7 What is an appropriate access price level and arrangement?
Review of access pricing on the NSW grain line network IPART 63
We determined that there was little benefit in implementing a differentiated price between lines, because it would cause additional complexity and potential distortions to traffic flows that were unlikely to justify the benefits from pricing for better line cost reflectivity.
We also concluded that the benefits of having a peak price or discount in poor harvest seasons came at the expense of additional administrative complexity for the rail owner and reduced certainty for the access seeker.
Lastly, we recommended that the same access price be charged for the transportation of both bulk grain and non-grain freight. This was in order to avoid providing an artificial incentive to containerise grain or vice versa. It could also be viewed as a form of price discrimination on the basis of users’ willingness to pay, which is complex for the rail owner to determine and administer.
7.3.1 Stakeholder submissions
In its submission, the ARTC stated that a single variable access price transfers market risk onto the owner of the infrastructure, given that line maintenance is largely time-based, rather than volume-based.43
Peter and Libby Skipworth noted that differentiation of prices by line would better reflect the lack of investment in certain lines in recent years.44
7.3.2 IPART’s findings
Tariff structure
In Chapter 3, we broke down the expected future maintenance costs of the network into components of RM, MPM (track) – sleeper and non-sleeper - and MPM (structures). The largest proportion of future costs for the grain lines is sleeper-based capital investment, which is reflective of the current condition of the lines. Excluding the current requirement for sleeper stabilisation works, the primary costs associated with maintenance are both sleeper and non-sleeper MPM. These costs tend to be incurred on an annual basis regardless of the level of track use. Routine maintenance, which makes up a smaller proportion of costs, is more likely to be influenced by the use of a line.
43 ARTC submission, pp 3-4. 44 Peter and Libby Skipworth submission, p 2.
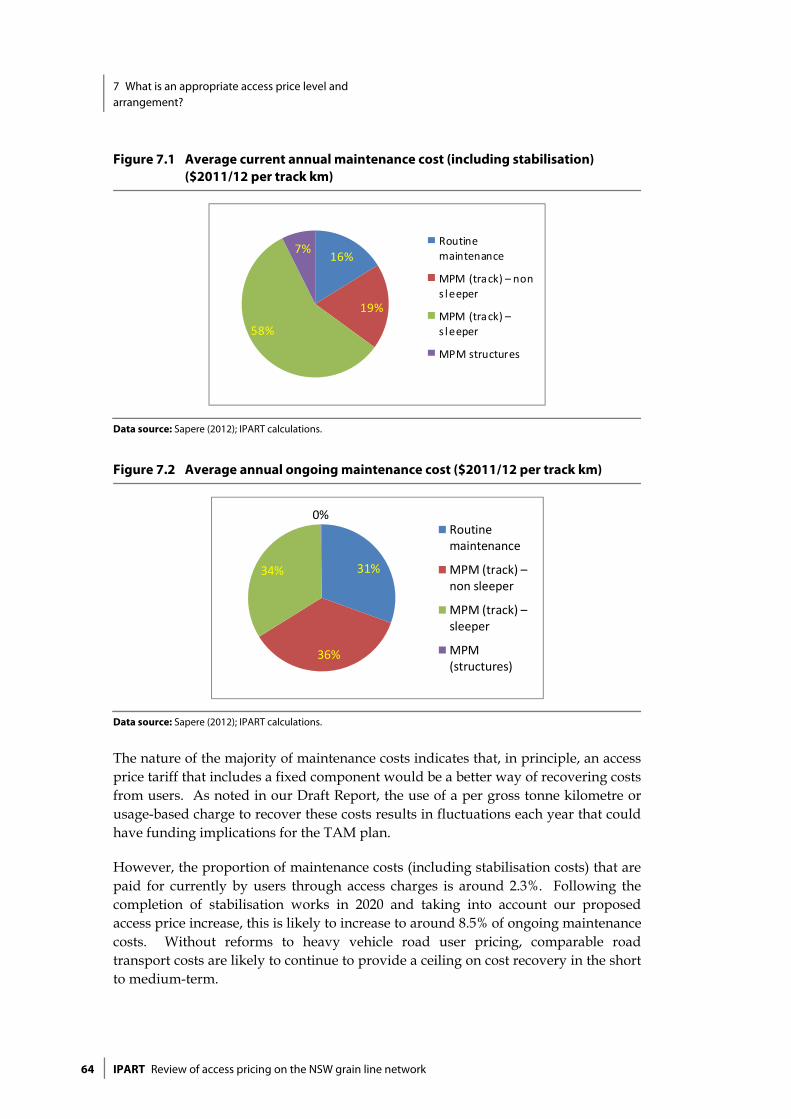
7 What is an appropriate access price level and arrangement?
64 IPART Review of access pricing on the NSW grain line network
Figure 7.1 Average current annual maintenance cost (including stabilisation) ($2011/12 per track km)
16%
19%
58%
7%Routinemaintenance
MPM (track) – non s leeper
MPM (track) –s leeper
MPM structures
Data source: Sapere (2012); IPART calculations.
Figure 7.2 Average annual ongoing maintenance cost ($2011/12 per track km)
31%
36%
34%
0%Routinemaintenance
MPM (track) –non sleeper
MPM (track) –sleeper
MPM(structures)
Data source: Sapere (2012); IPART calculations.
The nature of the majority of maintenance costs indicates that, in principle, an access price tariff that includes a fixed component would be a better way of recovering costs from users. As noted in our Draft Report, the use of a per gross tonne kilometre or usage-based charge to recover these costs results in fluctuations each year that could have funding implications for the TAM plan.
However, the proportion of maintenance costs (including stabilisation costs) that are paid for currently by users through access charges is around 2.3%. Following the completion of stabilisation works in 2020 and taking into account our proposed access price increase, this is likely to increase to around 8.5% of ongoing maintenance costs. Without reforms to heavy vehicle road user pricing, comparable road transport costs are likely to continue to provide a ceiling on cost recovery in the short to medium-term.
7 What is an appropriate access price level and arrangement?
Review of access pricing on the NSW grain line network IPART 65
Considering the extremely small contribution that users make towards maintenance costs, we consider that the benefits of a two-part tariff with a fixed cost component to recover the fixed maintenance cost components would be muted. The majority of maintenance costs are paid for by a government subsidy, which is fixed in advance. Therefore, any fluctuations in revenue received from access fees are not likely to have a significant impact on ongoing works in the TAM plan.
At our Roundtable that was held prior to the Draft Report, the simplicity of a single, variable access price was supported by many stakeholders, including both the rail owner CRIA and rail operator GrainCorp. As such, we consider that the access price should be levied as a single, variable tariff.
Differentiated pricing
Price differentiation by line may provide better price signals for users. A higher or lower price informs users about the relative cost of maintaining the line and may encourage more users to use lower cost lines. Based on our analysis of costs from Chapter 3, it would be possible to differentiate prices on the basis of line or line group. It is apparent from the analysis of costs by line that some lines have a current annual maintenance cost that is over twice that of some other lines. Charging a higher price for a higher cost line would mean that the same proportion of costs could be recovered from users on each line. This removes the cross-subsidy between lines that recover a higher proportion of their costs to lines that recover virtually none of their costs.
In Chapter 4, we demonstrated that lines or line groups generate different levels of external benefits. Differentiating price in accordance with the level of external benefits provided by that line would remove the incentive to use lines that generate low levels of benefits and provided greater incentives to use lines that generate a high level of benefits.
However, this has no significant impact unless the higher cost or lower benefit line is eventually suspended or additional volumes of traffic are encouraged on the low cost, high benefit lines. As discussed in Chapter 6, a lower-priced line may encourage some existing traffic from neighbouring lines to switch, but is unlikely to encourage significant volumes of new traffic. Although it may also have the effect of shifting grain traffic to road along some routes, which may not be an efficient outcome if that generates a higher level of external costs.
At our Roundtable that was held prior to the Draft Report, it was debated whether there was merit in differentiating the access price by line to reflect the different line costs. Stakeholders were widely in favour of a single price that applied to all lines. While we note that a single price for all grain lines causes users on some lines to pay a higher proportion of costs, that may also be in excess of the proportion of benefits they receive from using the line, differentiated pricing by line is unlikely to justify the additional complexity and potential distortions in traffic flows if it does not ultimately lead to lower costs in future.

7 What is an appropriate access price level and arrangement?
66 IPART Review of access pricing on the NSW grain line network
Recommendation
4 The access price structure should be simplified so that a single variable access price is applied across all lines.
5 The access price should be published.
6 The access price should apply to all traffic that uses the grain line network, including non-grain freight.
7.4 How should the access price be implemented?
In our Draft Report, we recommended that the access price increase should be phased in over a period of 2 years and increased by CPI each year thereafter until the end of the period (2016/17).
We recognised that an increase of $2.61 per thousand gross tonne kilometres was a substantial change to the current arrangements and as such, there was merit in implementing the increase over 2 years. However, we considered that phasing in the increase over a longer period was unnecessary given that the increase represented a small increase in overall supply chain costs in absolute terms. The benefits from the increase in access revenue resulting from the access price increase would be offset by drawing out the time taken to implement the increase.
7.4.1 Stakeholder submissions
Stakeholders expressed divided opinions over the implementation of the access price increase. Peter and Libby Skipworth claimed that while a 2-year phase-in period would allow communication with stakeholders about the increase, it would delay effective assessment of the impact of price increases on the government subsidy to the grain lines.45
Other stakeholders claimed that the 2-year period may be too short. NSW Farmers stated that seasonable fluctuations in harvests mean that incomes can vary dramatically between years.46 As such, a longer transition period would assist to reduce the impact of such a change. Asciano stated that the differences in rail’s competitive advantage between lines and sensitivity of this analysis to the assumptions indicate that a more incremental price change is more appropriate.47
45 Peter and Libby Skipworth submission, p 2. 46 NSW Farmers submission, p 3. 47 Asciano submission, p 7.
7 What is an appropriate access price level and arrangement?
Review of access pricing on the NSW grain line network IPART 67
7.4.2 IPART’s findings
The magnitude of our recommended access price increase and its relativity to other supply chain costs is discussed in more detail in section 8.1.2. However, in short, a 100% increase to the current access price translates to approximately 56 cents per tonne over the average length of a grain line (120 km), which is an extremely conservative increase in absolute terms.
In Chapter 5, we conducted sensitivity testing on some of the key assumptions in our supply chain cost model and concluded that while some assumptions increased the rail supply chain cost or reduced the road supply chain cost, rail’s cost advantage over road remained substantial in each case. For each line, a significant rail cost advantage was maintained.
Implementing the access price increase over a longer timeframe means that the increase in access revenue will be realised over a longer timeframe as well. Although the immediate increase in revenue is small compared to the costs of maintaining the network, this could delay the use of that revenue for stabilisation and maintenance works on some lines.
Based on the results of our supply chain modelling and sensitivity testing, we consider that there is no reason to implement the price increase over a longer timeframe. We consider that a 2-year implementation period provides a good balance between allowing users time to adjust to the new prices, but ensuring that improvements to cost recovery are realised sooner rather than later.
Recommendation
7 The access price increase should be phased in over 2 years.
Conclusion
For the purpose of our access price decision, we consider that a balance should be achieved between the following factors:
access prices should reflect the efficient costs of maintaining the network
the user share of these costs (through access prices) should, in principle, be based the relative proportions of external and private benefits from use of the network
the user share of costs should not cause a substantial loss of rail cost advantage so as to cause large volumes of grain traffic to shift to the road network.
We consider that an increase to $5.22 per thousand gross tonne kilometres in real terms (a 100% increase on the current access price) strikes an appropriate balance between improving cost recovery and user contribution towards the benefits they receive from using the network, without eroding rail’s competitive advantage on the lines in the short-term. Given the relatively small magnitude of this increase, this should be phased in over the next 2 years.

7 What is an appropriate access price level and arrangement?
68 IPART Review of access pricing on the NSW grain line network
Table 7.1 sets out our recommended forecast access prices that should apply to grain and non-grain traffic on the network under our draft recommendations over the next 5 years.
Table 7.1 Recommended access prices for the period 2012/13 to 2016/17 ($nominal)
2011/12 (current)
2012/13 2013/14 2014/15a 2015/16a 2016/17a
Access price ($/’000gtk)
$2.61 $3.92 $5.22 $5.35 $5.48 $5.62
a Includes a forecast of CPI based on the mid-point of the RBA range (2.5%).

8 What is the impact of our recommended access price on stakeholders?
Review of access pricing on the NSW grain line network IPART 69
8 What is the impact of our recommended access priceon stakeholders?
In Chapter 7, we recommended that an increase in the grain line access price was warranted to increase cost recovery, user contribution in line with benefits received from using the lines and improve sustainability of the grain line network.
The terms of reference asks us to consider that impact of our pricing recommendations on:
the ability and willingness of industry to pay
the whole supply chain for grain including the road network and any potential flow-on effects to local government
the level of government funding provided for Community Service Obligations (CSOs), given that government provides the majority of the funding for the operation and maintenance costs of the network.
In assessing the extent to which access prices should increase, we have taken into account stakeholders’ unanimous views that any increase in access prices should not shift current grain traffic from rail to road. This chapter considers the impact of our recommended access price increase on rail’s cost advantage over road for each of the lines and the magnitude of the cost increase as a proportion of rail users’ transportation costs and the average price of grain.
We consider evidence on the price elasticity of demand for grain rail haulage in NSW and other jurisdictions and the likely impact on marginal users. That is, users who pay the highest costs to transport grain from farm to port based on their location from the grain lines.
This chapter also considers the increase in access revenue likely to be received by government and discusses how this additional revenue may be used.
8 What is the impact of our recommended access price on stakeholders?
70 IPART Review of access pricing on the NSW grain line network
8.1 Final Findings
13 Doubling the access price will:
– result in only a 56 cents per tonne reduction in rail cost advantage over an average 120 km grain line journey
– increase access revenue to around $1.7 million per annum
– improve recovery of current costs (including stabilisation) from around 2.3% to 4.4% and of ongoing maintenance costs from around 4.4% to 8.5%, noting that the cost recovery varies significantly by line.
14 The level of cost recovery on some of the lines is not sustainable even with a 100% increase to the current access price.
Our Final Findings are largely unchanged from our Draft Findings. The impact of our recommended access price increase on rail users will be minimal as the increase itself is small and grain line access prices are only a small proportion of the cost of transporting grain to port.
The increase will not result in a significant reduction in rail’s cost advantage over road. Hence, it will not shift significant volumes of grain traffic to the road network and will therefore have a minimal impact on road users, agencies and other stakeholders.
Government recovery of costs will roughly double in the next 2 years, with a more significant improvement to cost recovery on high use lines than low use lines. These low use lines are not likely to be sustainable even with our recommended increase in access price.
8.2 What is the impact of our recommended access price increase on rail users?
In our Draft Report, we determined that the absolute increase in access prices was a small proportion of the total costs faced by grain rail users. We conducted a desktop review of the price elasticity of demand for grain rail haulage and determined that only 4% of grain traffic would be at risk shifting to road. We also reviewed the recent experience with increasing freight rail access prices in Victoria and considered the demand impact of previous step increases in grain access prices in NSW. We concluded that the impact of our recommended access price increase on rail users would be small.
8 What is the impact of our recommended access price on stakeholders?
Review of access pricing on the NSW grain line network IPART 71
8.2.1 Stakeholder submissions
The ARTC argued that increasing access prices on the grain lines would consume rail's competitive advantage across the whole rail network and constrain other parts of the network from investing in grain services.48
GrainCorp stated that a 100% increase in grain line access prices would make the lines among the highest priced rail freight lines in Australia.49 GrainCorp suggested that prices should instead be pegged at the ARTC rate, which represents an increase of around 50% on current levels.50
The Cabonne Council, Mr Greg Standen, Asciano and the Orana Regional Organisation of Councils were concerned that our proposed 100% increase would have the effect of shifting grain rail traffic (and costs) to road.
Asciano stated that in November 2010, grain line access prices effectively increased by 30% and that the impact of this increase should be considered prior to implementing further access price increases.51
8.2.2 IPART findings
Impact of our recommended access price increase on rail’s cost advantage over road
Doubling the grain line access price for each of the grain lines leads to the following change in rail supply chain costs and cost advantage over road (Table 8.1).
48 ARTC submission, pp 3-4. 49 GrainCorp submission, p 2. 50 Ibid, p 11. 51 Asciano submission, p 6.
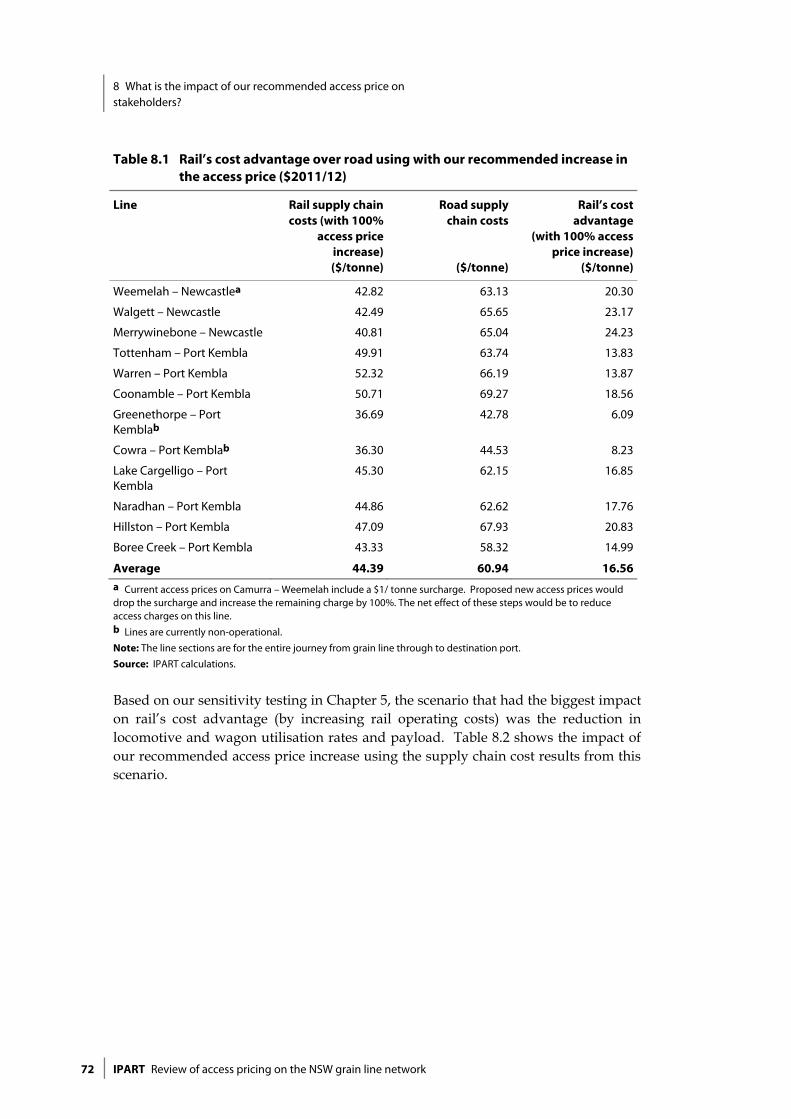
8 What is the impact of our recommended access price on stakeholders?
72 IPART Review of access pricing on the NSW grain line network
Table 8.1 Rail’s cost advantage over road using with our recommended increase in the access price ($2011/12)
Line Rail supply chain costs (with 100%
access price increase) ($/tonne)
Road supply chain costs
($/tonne)
Rail’s cost advantage
(with 100% access price increase)
($/tonne)
Weemelah – Newcastlea 42.82 63.13 20.30
Walgett – Newcastle 42.49 65.65 23.17
Merrywinebone – Newcastle 40.81 65.04 24.23
Tottenham – Port Kembla 49.91 63.74 13.83
Warren – Port Kembla 52.32 66.19 13.87
Coonamble – Port Kembla 50.71 69.27 18.56
Greenethorpe – Port Kemblab
36.69 42.78 6.09
Cowra – Port Kemblab 36.30 44.53 8.23
Lake Cargelligo – Port Kembla
45.30 62.15 16.85
Naradhan – Port Kembla 44.86 62.62 17.76
Hillston – Port Kembla 47.09 67.93 20.83
Boree Creek – Port Kembla 43.33 58.32 14.99
Average 44.39 60.94 16.56 a Current access prices on Camurra – Weemelah include a $1/ tonne surcharge. Proposed new access prices would drop the surcharge and increase the remaining charge by 100%. The net effect of these steps would be to reduce access charges on this line. b Lines are currently non-operational.
Note: The line sections are for the entire journey from grain line through to destination port.
Source: IPART calculations.
Based on our sensitivity testing in Chapter 5, the scenario that had the biggest impact on rail’s cost advantage (by increasing rail operating costs) was the reduction in locomotive and wagon utilisation rates and payload. Table 8.2 shows the impact of our recommended access price increase using the supply chain cost results from this scenario.
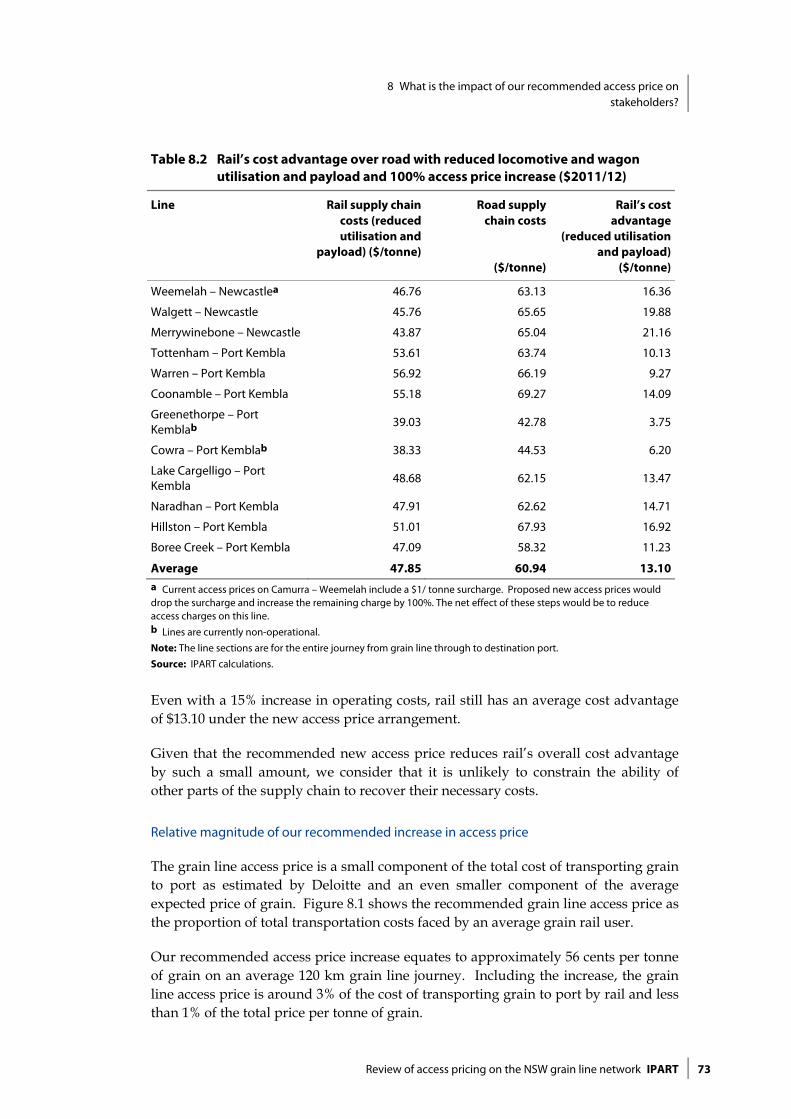
8 What is the impact of our recommended access price on stakeholders?
Review of access pricing on the NSW grain line network IPART 73
Table 8.2 Rail’s cost advantage over road with reduced locomotive and wagon utilisation and payload and 100% access price increase ($2011/12)
Line Rail supply chain costs (reduced utilisation and
payload) ($/tonne)
Road supply chain costs
($/tonne)
Rail’s cost advantage
(reduced utilisation and payload)
($/tonne)
Weemelah – Newcastlea 46.76 63.13 16.36
Walgett – Newcastle 45.76 65.65 19.88
Merrywinebone – Newcastle 43.87 65.04 21.16
Tottenham – Port Kembla 53.61 63.74 10.13
Warren – Port Kembla 56.92 66.19 9.27
Coonamble – Port Kembla 55.18 69.27 14.09
Greenethorpe – Port Kemblab 39.03 42.78 3.75
Cowra – Port Kemblab 38.33 44.53 6.20
Lake Cargelligo – Port Kembla
48.68 62.15 13.47
Naradhan – Port Kembla 47.91 62.62 14.71
Hillston – Port Kembla 51.01 67.93 16.92
Boree Creek – Port Kembla 47.09 58.32 11.23
Average 47.85 60.94 13.10a Current access prices on Camurra – Weemelah include a $1/ tonne surcharge. Proposed new access prices would drop the surcharge and increase the remaining charge by 100%. The net effect of these steps would be to reduce access charges on this line. b Lines are currently non-operational.
Note: The line sections are for the entire journey from grain line through to destination port.
Source: IPART calculations.
Even with a 15% increase in operating costs, rail still has an average cost advantage of $13.10 under the new access price arrangement.
Given that the recommended new access price reduces rail’s overall cost advantage by such a small amount, we consider that it is unlikely to constrain the ability of other parts of the supply chain to recover their necessary costs.
Relative magnitude of our recommended increase in access price
The grain line access price is a small component of the total cost of transporting grain to port as estimated by Deloitte and an even smaller component of the average expected price of grain. Figure 8.1 shows the recommended grain line access price as the proportion of total transportation costs faced by an average grain rail user.
Our recommended access price increase equates to approximately 56 cents per tonne of grain on an average 120 km grain line journey. Including the increase, the grain line access price is around 3% of the cost of transporting grain to port by rail and less than 1% of the total price per tonne of grain.
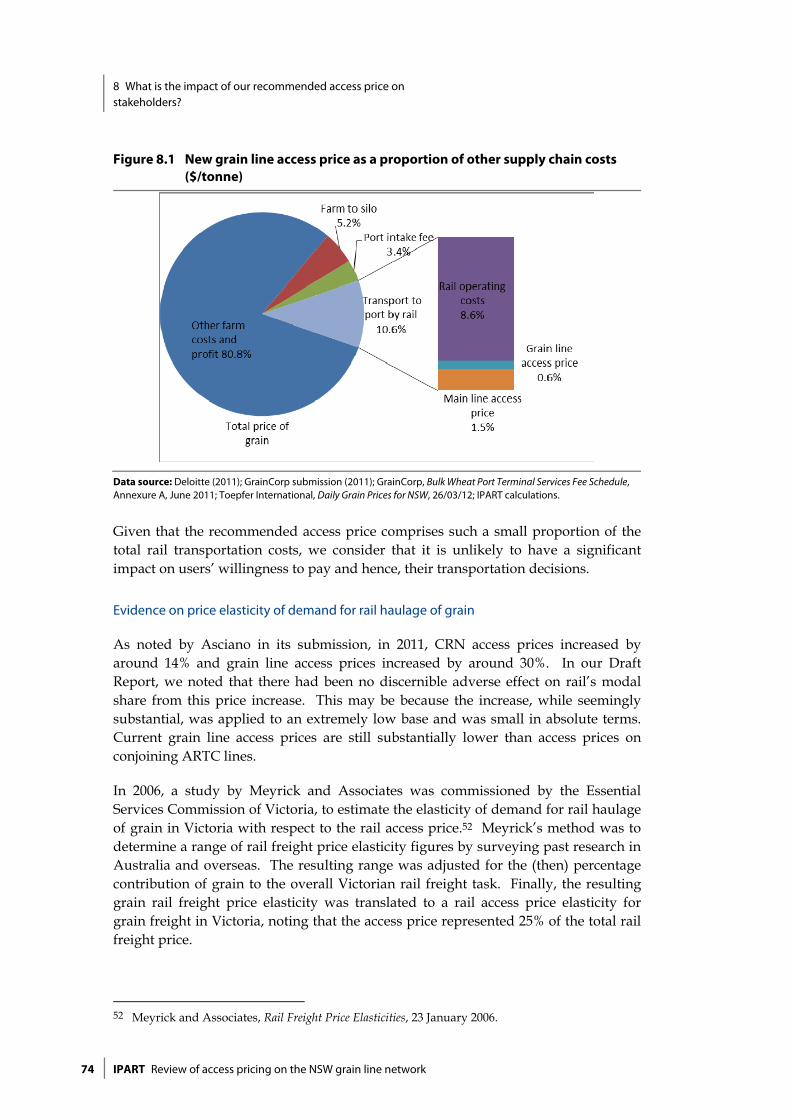
8 What is the impact of our recommended access price on stakeholders?
74 IPART Review of access pricing on the NSW grain line network
Figure 8.1 New grain line access price as a proportion of other supply chain costs ($/tonne)
Data source: Deloitte (2011); GrainCorp submission (2011); GrainCorp, Bulk Wheat Port Terminal Services Fee Schedule, Annexure A, June 2011; Toepfer International, Daily Grain Prices for NSW, 26/03/12; IPART calculations.
Given that the recommended access price comprises such a small proportion of the total rail transportation costs, we consider that it is unlikely to have a significant impact on users’ willingness to pay and hence, their transportation decisions.
Evidence on price elasticity of demand for rail haulage of grain
As noted by Asciano in its submission, in 2011, CRN access prices increased by around 14% and grain line access prices increased by around 30%. In our Draft Report, we noted that there had been no discernible adverse effect on rail’s modal share from this price increase. This may be because the increase, while seemingly substantial, was applied to an extremely low base and was small in absolute terms. Current grain line access prices are still substantially lower than access prices on conjoining ARTC lines.
In 2006, a study by Meyrick and Associates was commissioned by the Essential Services Commission of Victoria, to estimate the elasticity of demand for rail haulage of grain in Victoria with respect to the rail access price.52 Meyrick’s method was to determine a range of rail freight price elasticity figures by surveying past research in Australia and overseas. The resulting range was adjusted for the (then) percentage contribution of grain to the overall Victorian rail freight task. Finally, the resulting grain rail freight price elasticity was translated to a rail access price elasticity for grain freight in Victoria, noting that the access price represented 25% of the total rail freight price.
52 Meyrick and Associates, Rail Freight Price Elasticities, 23 January 2006.

8 What is the impact of our recommended access price on stakeholders?
Review of access pricing on the NSW grain line network IPART 75
Meyrick estimated that the price elasticity of demand for rail haulage of grain in Victoria with respect to the rail access price was -0.2, which is highly inelastic to the rail access price; that is, changes in access price would have little impact on the use of the grain network.
If the Meyrick access price elasticity estimate was applied to the NSW grain line network, then the effect of a doubling of current grain line access prices would risk only 4% of grain traffic.53 As such, we consider that our access price recommendation will not result in any notable volume of grain traffic shifting to the road network and hence, will have minimal impact on road users, agencies and other stakeholders.
Comparison with other jurisdictions
Reference access prices are not readily published in other jurisdictions. We reviewed access prices that are charged currently on the ARTC and Victorian freight-only rail networks. These are shown in Table 8.3.
Table 8.3 Freight access price comparison ($’000GTK)
Network Grain lines ARTC Victorian V-Line
Access price ($’000gtk) $5.22 $3.38a $4.13
a Average across NSW network. Source: ARTC pricing schedule applicable rates effective from 1 July 2011; http://www.vline.com.au/about/networkaccess/pricing.html
Comparison with the ARTC network is difficult. The grain lines are high cost lines with low volumes of traffic. They cannot be compared directly to higher speed, higher volume rail networks, such as the ARTC’s interstate network.
The Victorian network also poses some challenges for comparison. For instance, the average journey to port is considerably shorter in Victoria, which gives road a greater advantage over rail. In addition, around 95% of lines are Class 4 and 5, compared with around 70% on the NSW grain line network, with the remainder being Class 3. The Worley Parsons (2006) study demonstrates that, on average, the Victorian lines are slightly lower cost to maintain than the NSW grain lines.
In addition, over the last 10 years, Victoria has had substantial increases in the rail access price for grain and also a dramatic loss of rail market share. In 2006, the ESC determined pricing for the Access Arrangement for Pacific National in Victoria. This decision substantially increased access prices (in excess of 300%) such that the new access prices were approximately 5 times higher than current NSW grain line access prices and between 3.25 and 3.5 times higher than nearby ARTC access prices.
53 Assuming the grain line is approximately 120 km of the average port journey, doubling the
grain line access prices would increase average access prices for the whole journey by only 20%. 20% X -0.2 = 4% loss of traffic.
8 What is the impact of our recommended access price on stakeholders?
76 IPART Review of access pricing on the NSW grain line network
Between 2001/02 and 2007/08, the 3-year moving average share of grain transported by rail decreased from around 90% to below 40%. The grain haulage task in V/Line’s regional system declined from 1,954 million gross tonne kilometres in 2000/01 to 187.8 million gross tonne kilometres in 2008/09.54 These facts do not necessarily imply a cause and effect relationship between the regulatory access price determinations and rail’s subsequent decline in modal share as there were other factors in play that may have contributed to this decline. However, we understand that the initial decision by the ESC led directly to credible threats by the grain industry to withdraw entirely from the use of rail for export grain.
In response, the Victorian Department of Transport agreed to pay rebates to grain shippers that had the effect of reducing the grain access prices to levels comparable to the ARTC access prices. In effect, the access price actually paid by grain shippers was lower than these ESC-determined levels due to this rebate system. Nevertheless, a strong incentive was given to the Victorian road haulage industry by this sequence of events. Road’s modal share of export grain grew steadily, to the point where road is now the primary transport mode for Geelong grain, and port intake fee differentials between road and rail are now virtually zero for Victorian ports.
A lesson we have drawn from the Victorian experience is that there is pricing point which, if reached, can have significant and lasting consequences for rail’s modal share. Therefore we consider it appropriate to take a conservative view of the extent to which access prices can be increased to ensure that this is not the effect in NSW.
8.3 What is the impact on government?
In our Draft Report, we:
Used data from CRIA on grain and other freight volumes on the grain line network in 2010/11 and assumed that this demand will continue in the near future. We assumed that there would be no demand effect from our recommended increase in access prices. While the estimates of rail demand elasticity discussed in Chapter 8 suggest there may be some small demand response from a price change the effect is likely to be small and outweighed by the generally positive outlook for grain production in the near term.
Estimated cost recovery levels over the next 5 years based on these volumes and our recommended access prices.
Compared this to current cost recovery levels.
54 Essential Services Commission of Victoria, Review of the Victorian Rail Access Regime Final Report
Volume III, Appendix D, pp 36-37.
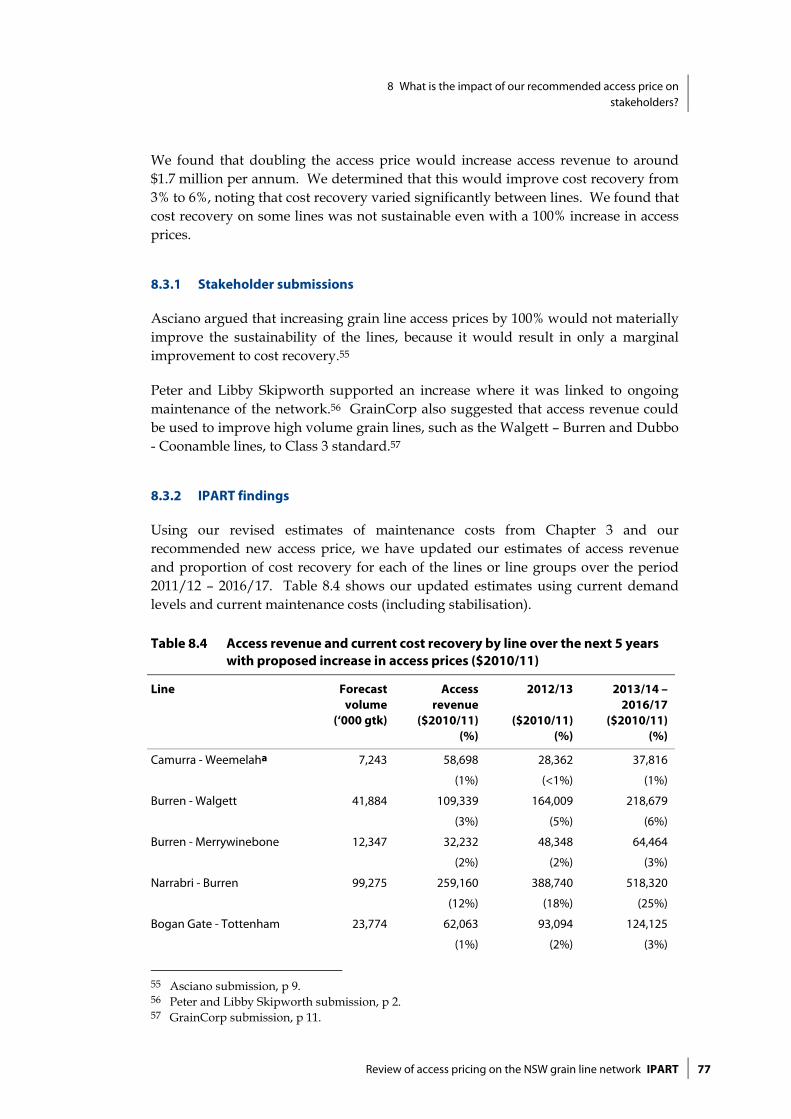
8 What is the impact of our recommended access price on stakeholders?
Review of access pricing on the NSW grain line network IPART 77
We found that doubling the access price would increase access revenue to around $1.7 million per annum. We determined that this would improve cost recovery from 3% to 6%, noting that cost recovery varied significantly between lines. We found that cost recovery on some lines was not sustainable even with a 100% increase in access prices.
8.3.1 Stakeholder submissions
Asciano argued that increasing grain line access prices by 100% would not materially improve the sustainability of the lines, because it would result in only a marginal improvement to cost recovery.55
Peter and Libby Skipworth supported an increase where it was linked to ongoing maintenance of the network.56 GrainCorp also suggested that access revenue could be used to improve high volume grain lines, such as the Walgett – Burren and Dubbo - Coonamble lines, to Class 3 standard.57
8.3.2 IPART findings
Using our revised estimates of maintenance costs from Chapter 3 and our recommended new access price, we have updated our estimates of access revenue and proportion of cost recovery for each of the lines or line groups over the period 2011/12 – 2016/17. Table 8.4 shows our updated estimates using current demand levels and current maintenance costs (including stabilisation).
Table 8.4 Access revenue and current cost recovery by line over the next 5 years with proposed increase in access prices ($2010/11)
Line Forecast volume
(‘000 gtk)
Access revenue
($2010/11)(%)
2012/13
($2010/11) (%)
2013/14 – 2016/17
($2010/11)(%)
Camurra - Weemelaha 7,243 58,698
(1%)
28,362
(<1%)
37,816
(1%)
Burren - Walgett 41,884 109,339
(3%)
164,009
(5%)
218,679
(6%)
Burren - Merrywinebone 12,347 32,232
(2%)
48,348
(2%)
64,464
(3%)
Narrabri - Burren 99,275 259,160
(12%)
388,740
(18%)
518,320
(25%)
Bogan Gate - Tottenham 23,774 62,063
(1%)
93,094
(2%)
124,125
(3%)
55 Asciano submission, p 9. 56 Peter and Libby Skipworth submission, p 2. 57 GrainCorp submission, p 11.

8 What is the impact of our recommended access price on stakeholders?
78 IPART Review of access pricing on the NSW grain line network
Line Forecast volume
(‘000 gtk)
Access revenue
($2010/11)(%)
2012/13
($2010/11)(%)
2013/14 – 2016/17
($2010/11) (%)
Nevertire - Warren 7,963 20,788
(2%)
31,181
(3%)
41,575
(4%)
Dubbo - Coonamble 85,743 223,834
(4%)
335,752
(6%)
447,669
(8%)
Ungarie - Lake Cargelligo 2,866 7,482
(<1%)
11,223
(<1%)
14,964
(1%)
Ungarie - Naradhan 1,277 3,334
(<1%)
5,000
(<1%)
6,667
(<1%)
West Wyalong -Ungarie 7,412 19,349
(2%)
29,024
(2%)
38,698
(3%)
Barmedman - West Wyalong
11,288 29,468
(4%)
44,201
(6%)
58,935
(8%)
Temora - Barmedman 14,938 38,996
(3%)
58,494
(4%)
77,992
(6%)
Griffith to Hillston 3,263 8,518
(<1%)
12,777
(<1%)
17,036
(<1%)
The Rock to Boree Creek 951 2,483
(<1%)
3,724
(<1%)
4,965
(<1%)
Total
320,224 875,743
(2.3%)
1,253,929
(3.3%)
1,671,906
(4.4%)
Line Group
Narrabrib 153,506 400,731
(5%)
601,097
(7%)
801,463
(10%)
Temorac 37,781 98,628
(1%)
147,942
(2%)
197,257
(2%)
a 2010/11 revenue on the Weemelah – Camurra line includes the $1/tonne surcharge levied in July 2010. Removal of the surcharge and doubling access prices results in lower cost recovery in subsequent years. b Sector includes: Narrabri – Burren, Burren– Walgett, Burren – Merrywinebone. c Sector includes: Temora – Barmedman, Barmedman – West Wyalong, West Wyalong – Ungarie; Ungarie – Naradhan, Ungarie – Lake Cargelligo.
Note: The line sections are the individual grain line sectors while the some of the preceding tables presented the line sections for the entire journey from grain line through to destination port. The results for the Cowra group of lines have not been presented as they are currently non-operational and do not generate access revenue.
Sources: IPART calculations; Sapere (2012); CRIA data on historical volume of grain transported.

8 What is the impact of our recommended access price on stakeholders?
Review of access pricing on the NSW grain line network IPART 79
The overall increase in access revenue and cost recovery in 2012/13 and 2013/14 onwards is modest even on those lines with higher volumes of grain traffic. Table 8.5 shows our updated estimates using current demand levels and expected ongoing maintenance costs (excluding stabilisation) post-2020.
Table 8.5 Access revenue and ongoing maintenance cost recovery (excluding stabilisation) by line over the next 5 years with proposed increase in access prices ($2010/11)
Line Forecast volume
(‘000 gtk)
Access revenue
($2010/11)(%)
2012/13
($2010/11) (%)
2013/14 – 2016/17
($2010/11) (%)
Camurra - Weemelaha 7,243 58,698
(4%)
28,362
(2%)
37,816
(2%)
Burren - Walgett 41,884 109,339
(7%)
164,009
(10%)
218,679
(14%)
Burren - Merrywinebone 12,347 32,232
(3%)
48,348
(5%)
64,464
(6%)
Narrabri - Burren 99,275 259,160
(15%)
388,740
(22%)
518,320
(30%)
Bogan Gate - Tottenham 23,774 62,063
(3%)
93,094
(4%)
124,125
(5%)
Nevertire - Warren 7,963 20,788
(5%)
31,181
(8%)
41,575
(10%)
Dubbo - Coonamble 85,743 223,834
(8%)
335,752
(12%)
447,669
(16%)
Ungarie - Lake Cargelligo 2,866 7,482
(<1%)
11,223
(<1%)
14,964
(1%)
Ungarie - Naradhan 1,277 3,334
(<1%)
5,000
(<1%)
6,667
(<1%)
West Wyalong -Ungarie 7,412 19,349
(3%)
29,024
(4%)
38,698
(5%)
Barmedman - West Wyalong
11,288 29,468
(5%)
44,201
(7%)
58,935
(9%)
Temora - Barmedman 14,938 38,996
(5%)
58,494
(8%)
77,992
(11%)
Griffith to Hillston 3,263 8,518
(<1%)
12,777
(<1%)
17,036
(<1%)
The Rock to Boree Creek 951 2,483
(<1%)
3,724
(<1%)
4,965
(<1%)
Total
320,224 875,743
(4.4%)
1,253,929
(6.3%)
1,671,906
(8.5%)
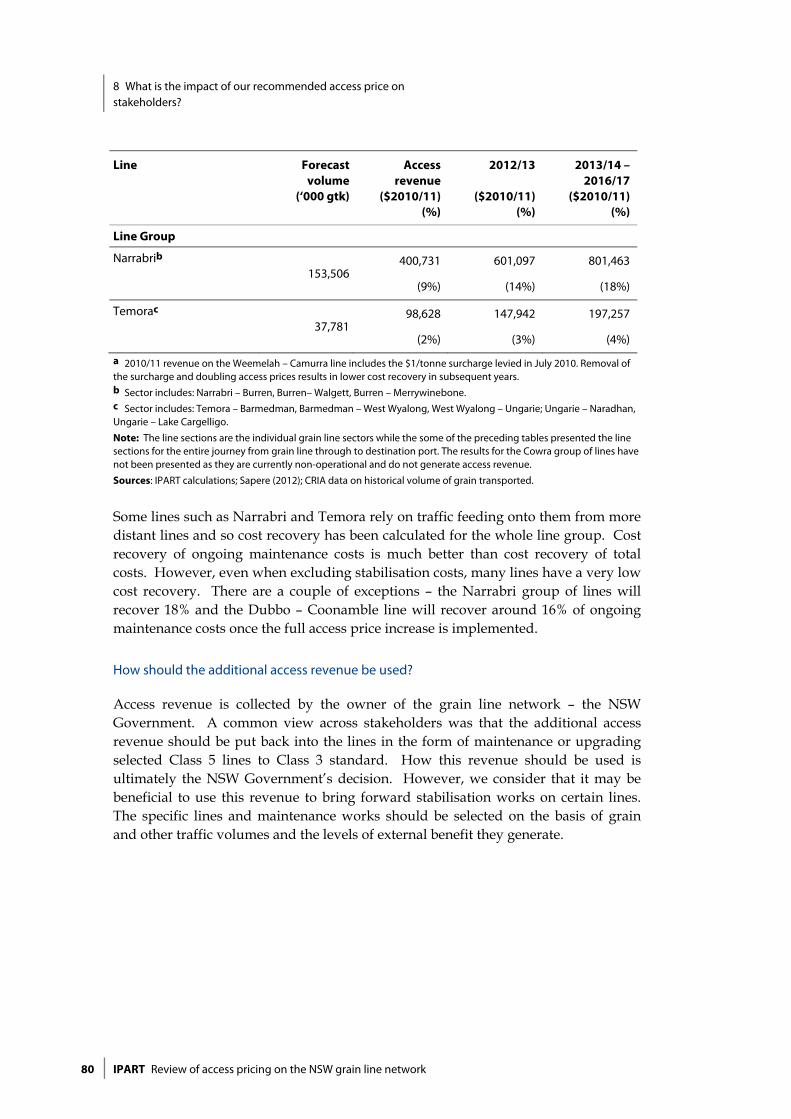
8 What is the impact of our recommended access price on stakeholders?
80 IPART Review of access pricing on the NSW grain line network
Line Forecast volume
(‘000 gtk)
Access revenue
($2010/11)(%)
2012/13
($2010/11)(%)
2013/14 – 2016/17
($2010/11) (%)
Line Group
Narrabrib 153,506
400,731
(9%)
601,097
(14%)
801,463
(18%)
Temorac 37,781
98,628
(2%)
147,942
(3%)
197,257
(4%)
a 2010/11 revenue on the Weemelah – Camurra line includes the $1/tonne surcharge levied in July 2010. Removal of the surcharge and doubling access prices results in lower cost recovery in subsequent years. b Sector includes: Narrabri – Burren, Burren– Walgett, Burren – Merrywinebone. c Sector includes: Temora – Barmedman, Barmedman – West Wyalong, West Wyalong – Ungarie; Ungarie – Naradhan, Ungarie – Lake Cargelligo.
Note: The line sections are the individual grain line sectors while the some of the preceding tables presented the line sections for the entire journey from grain line through to destination port. The results for the Cowra group of lines have not been presented as they are currently non-operational and do not generate access revenue.
Sources: IPART calculations; Sapere (2012); CRIA data on historical volume of grain transported.
Some lines such as Narrabri and Temora rely on traffic feeding onto them from more distant lines and so cost recovery has been calculated for the whole line group. Cost recovery of ongoing maintenance costs is much better than cost recovery of total costs. However, even when excluding stabilisation costs, many lines have a very low cost recovery. There are a couple of exceptions – the Narrabri group of lines will recover 18% and the Dubbo – Coonamble line will recover around 16% of ongoing maintenance costs once the full access price increase is implemented.
How should the additional access revenue be used?
Access revenue is collected by the owner of the grain line network – the NSW Government. A common view across stakeholders was that the additional access revenue should be put back into the lines in the form of maintenance or upgrading selected Class 5 lines to Class 3 standard. How this revenue should be used is ultimately the NSW Government’s decision. However, we consider that it may be beneficial to use this revenue to bring forward stabilisation works on certain lines. The specific lines and maintenance works should be selected on the basis of grain and other traffic volumes and the levels of external benefit they generate.

9 Complementary measures to promote sustainability on the grain line network
Review of access pricing on the NSW grain line network IPART 81
9 Complementary measures to promote sustainability on the grain line network
In Chapter 8 we determined that an increase in access prices alone is unlikely to improve the sustainability of the whole network. This chapter considers what changes, if any, could be made to the regulatory, structural and funding arrangements that apply to the CRN to improve sustainable operation of the grain lines.
9.1 Final Findings
15 The current regulatory arrangements do not impose a significant direct regulatory cost to warrant change at this time.
16 Under the current governance and funding arrangements, the government bears the business risk of the lines not being used.
17 There is unanimous stakeholder support for greater industry engagement and coordination of decisions about the grain line maintenance and operation to increase certainty and potentially investment in the grain supply chain.
18 Any cost under-recovery on the competing road network will constrain the ability for efficient cost recovery on the grain line network. This leads to the government subsidising 2 modes of competing transport infrastructure.
19 A mode-neutral approach to the funding of freight transport infrastructure is likely to reduce the overall level of government subsidy required.
Our Final Findings are largely unchanged from our Draft Findings. While the NSW Rail Access Undertaking imposes a regulatory cost on stakeholders, this does not appear to be burdensome enough to warrant change at this time. However, the Undertaking may restrict the government’s ability to implement a more appropriate governance arrangement for some or all of the grain lines to increase industry share of the business risk associated with line use. In the short-term, industry participation in decision-making about the grain lines through a coordinated forum could improve certainty and potentially investment in the network.
Given that road competes strongly with rail along the grain line routes, any under-recovery of heavy vehicle road costs impacts on the ability of government to recover costs on the grain line network and leads to the government subsidising 2 competing modes of transport infrastructure. For this reason, a mode-neutral approach to
9 Complementary measures to promote sustainability on the grain line network
82 IPART Review of access pricing on the NSW grain line network
funding for competing freight transport infrastructure could reduce the overall government subsidy required.
For a mode-neutral funding approach, it is necessary to develop a better understanding of the long-run marginal cost of road wear caused by heavy vehicles that transport grain. Further, a more cost-reflective heavy vehicle user charging system should be pursued.
9.2 Do the regulatory arrangements governing the CRN warrant change?
9.2.1 Direct regulatory costs imposed by the Undertaking
Rail in NSW (other than those lines leased by the ARTC) is governed by the NSW Rail Access Undertaking (the Undertaking), which sets broad principles for access regulation and pricing on the network to mitigate the ability of the rail owner to restrict access or charge monopoly prices. However, given the competition with road, CRIA is constrained in its ability to charge above-efficient costs (and, in fact, to recover its ongoing costs of maintenance).
In our Draft Report, we considered whether there was public policy value in continuing the highly regulated approach to grain access pricing, given the transaction and administrative costs that are generated and the absence of competition in above-rail services. We concluded that the low traffic volumes, spare capacity and road competition on the grain line network meant that such rigorous access and price regulation under the Undertaking does not appear to be warranted. However, we determined that the stakeholders that bore the direct costs of this regulation did not consider them to be unnecessarily burdensome. As such, we recommended that the potential direct cost savings from a review of the access regime would not justify a change to the current regime at the current time.
We recommended that should the government pursue a review of the regulatory arrangements for some or all of the grain lines; it would be prudent to extend that review to incorporate the current arrangements that apply to the greater CRN and Hunter Valley rail network.
9.2.2 Stakeholder submissions
The ARTC did not support extending a regulatory and structural review to the Hunter Valley coal network.58
The Railway Technical Society of Australasia and Cabonne Council suggested that the current rail safety regulations for the lines were too onerous and inflexible.59 58 ARTC submission, p 5. 59 Railway Technical Society of Australasia submission, pp 3-4; Cabonne Council submission, p 1.
9 Complementary measures to promote sustainability on the grain line network
Review of access pricing on the NSW grain line network IPART 83
9.2.3 IPART findings
Review of the NSW Undertaking
The ARTC leases sections of rail network that run through NSW making up its Interstate Network. In 2004, ARTC also entered into a lease arrangement with the NSW Government for parts of the NSW intra-state rail network, including a majority of the Hunter Valley network.
The ARTC managed networks are subject to undertakings under Part IIIA of the Competition and Consumer Act 2010 (the Act). Two undertakings are currently in place, one for the national interstate rail network and one for the Hunter Valley rail network. The ACCC accepted the access undertaking from ARTC for the Hunter Valley rail network on 29 June 2011. This undertaking applies for a 5-year term.
The NSW Government is responsible for managing the grain line network as part of the greater CRN and 5 remaining sectors of the Hunter Valley rail network, which are managed by RailCorp. In addition to the CRN, these sections of the Hunter Valley network are also subject to the NSW Rail Access Undertaking. We consider that if the NSW Government was to undertake a review of the Undertaking and how it applies to the CRN, the remaining sectors of the Hunter Valley network that are also under the NSW Government’s jurisdiction should be included in that review for consistency.
We have re-worded our recommendation to clarify that it applies to the sections of the Hunter Valley rail network that are owned by the NSW Government only.
Recommendation
8 Should the NSW Government pursue a review of the regulatory arrangements for some or all of the grain lines; it would be prudent to extend that review to incorporate the current regulatory and structural arrangements that apply to the NSW Government’s ownership interests in the greater CRN and Hunter Valley rail network.
Rail safety regulations
The safety standards that must be followed on the grain line network and greater CRN are set out in a range of legislative instruments including the Rail Safety Act 2008, Transport Administration Act 1988, Passenger Transport Act 1990, Transport Legislation Amendment (Waterfall Rail Inquiry Recommendations) Act 2005 and also the Occupational Health and Safety Act 2000.
Compliance with safety regulations would be necessary under any rail access arrangement. These regulations underpin the operation of the grain line network, including allowable axle loads and speeds.

9 Complementary measures to promote sustainability on the grain line network
84 IPART Review of access pricing on the NSW grain line network
Currently, the Independent Rail Safety Regulator (ITSR) is responsible for accreditation, compliance and enforcement of safety regulation for all activities associated with rail operations in NSW. However, ITSR works with the inter-jurisdictional Rail Safety Regulators’ Panel to ensure that the application of safety regulations are consistent with equivalent legislation in other states and territories.
In December 2012, a new National Rail Safety Regulator (NRSR) will be established. ITSR will continue to oversee rail safety regulation in NSW but will do so under delegation from the NRSR through a service level agreement. This means that the Rail Safety Act 2008 will be replaced with new NSW legislation that will apply the national rail safety law.
As such, a review of rail safety regulations is a matter for the NSW Government in connection with the establishment of the NRSR and the greater national coordination of such regulations.
9.2.4 Indirect costs imposed by the Undertaking
In our Draft Report, we noted that in addition to the direct costs of complying with the NSW Undertaking, there are also indirect costs that stem from restrictions on the governance arrangements that may apply to the network.
Under the current governance arrangements, the NSW Government subsidises the below-rail track to maintain a standard of operability and provides an in-kind subsidy to the above-rail operator through the loan of train wagons. In return it receives access revenue from above-rail operators. Any operator can apply for access to the network under fair and reasonable terms.
Under this arrangement, the NSW Government bears the risk of the track not being used. Given that a majority of maintenance costs are fixed, the lines require a threshold volume of traffic in order to achieve a sustainable cost recovery. If volumes are below this threshold, maintenance costs are still incurred, but access revenue is not received.
Historically, the government has responded to this risk by minimising the standard of service that is provided on the grain lines to a fit-for-purpose level and suspending operations on tracks that were deemed to have the highest risk of non-utilisation.
An increase in access prices is one element of increasing industry share of the revenue risk, but an alternative governance arrangement may also contribute to a better volume and revenue risk sharing arrangement. We noted that any move to an alternative governance model would require market testing and investigation of whether the industry would be prepared to share these risks in exchange for greater certainty on the network. A model that allows exclusive access to the network or sections of the network would require a change to the current regulatory Undertaking.

9 Complementary measures to promote sustainability on the grain line network
Review of access pricing on the NSW grain line network IPART 85
9.2.5 Stakeholder submissions
There was considerable interest from stakeholders in the governance and structural arrangements that apply to the grain line network. The Lachlan Regional Transport Committee suggested that there could be potential for a better model to be developed that would involve a transfer of some risk away from government. However, this should be balanced by opportunities for or guarantees of continued government support. The Lachlan Regional Transport Committee advocated a regional approach to management of railways (separated from the management of the main and interstate lines), such as that used in Canada, and that this could encourage greater local economic development.60
The Railway Technical Society of Australasia also recommended that the NSW Government undertake a study of new rail operating models; in particular, the Canadian short-line rail model.61
Transport for NSW noted that it was currently exploring models to improve risk allocation between government and industry and to make public funding of the grain lines more dependent upon the establishment of a robust business case.62
Alternatively, the ARTC did not consider that regulatory and structural arrangements had had any significant impact on the similarly adverse circumstances faced by many grain lines around Australia.63
9.2.6 IPART findings
While a detailed examination of governance arrangements that apply to the grain line network is formally outside of the scope of our review, we note that this has been an area of interest to many stakeholders.
Under the current governance arrangements, government subsidy to the grain lines is not tied to any agreement with industry to use the lines. Because users’ contribution only a small proportion to maintenance costs on the network and make no contribution to the capital costs of stabilisation, they bear almost none of the business risk of the lines not being used.
The Ministerial Taskforce overseeing the business case for re-opening the Cowra lines commissioned Booz Allen Hamilton to examine the merits of different governance arrangements that could apply to those lines. Booz Allen Hamilton investigated the merits of alternatives to the current governance model to improve the allocation and sharing of the business risk between government and industry.
60 Lachlan Regional Transport Committee submission, p 4. 61 Railway Technical Society of Australasia submission. 62 Transport for NSW submission, p 2. 63 ARTC submission, p 5.
9 Complementary measures to promote sustainability on the grain line network
86 IPART Review of access pricing on the NSW grain line network
Booz Allen Hamilton suggested that vertically integrated operator, similar to the Canadian short-line model, would be appropriate for container haulage between Cowra and Blayney, with third-party access for mineral and grain haulage. It would be co-funded from state, local and private sources for ongoing infrastructure requirements.
The right to operate the lines would be decided by competition ‘for the market’, achieved through the periodic auction of an exclusive franchise. The successful franchisee would bear revenue risk and share volume risk with the funding entity.
The Ministerial Taskforce recommended that the NSW Government endorse further exploration of the franchising of the operation of the Cowra lines as a vertically integrated railway.
Given the characteristics of the Cowra lines are very similar to other grain lines, we consider that the application of a similar governance arrangement in a broader context could be explored. Should an exploration or ‘pilot study’ of the governance arrangements on the Cowra lines be successful, the merits of such arrangements should also be considered for other grain lines.
9.2.7 Industry engagement and coordination
In our Draft Report, we found that in the short-term, some of the risk-sharing benefits that could be obtained under an alternative governance model may be achieved through a more structured and collaborative approach to decision making on the network between the below and above-rail operators.
We recommended the establishment of an industry coordination forum similar to that suggested by the NSW Grain Freight Review (2009) – to encourage participants in the grain supply chain to coordinate their operations and investment more effectively.
9.2.8 Stakeholder submissions
Throughout our review, there has been much support for a more collaborative approach to the operation of the grain line network between government and industry. Many stakeholders supported the formation of a grain industry coordination forum.
GrainCorp considered that such a group should include participation of the NSW Government, John Holland, rail providers and industry to plan the long-term future of the grain line network and improve the coordination of investment and network optimisation.64
64 GrainCorp submission, p 11.

9 Complementary measures to promote sustainability on the grain line network
Review of access pricing on the NSW grain line network IPART 87
Peter and Libby Skipworth suggested that such a forum should be sufficiently resourced, including with appropriately skilled members, and have full access to relevant information, decisions makers and timeframes for meaningful input into grain logistics.65
9.2.9 IPART findings
We consider that network users could benefit from a more formalised approach to industry engagement and coordination. The establishment of an industry coordination forum could facilitate greater coordination of operations and investment in the network. The forum could advise on maintenance priorities, investment decisions and funding contributions.
Recommendation
9 The NSW Government should consider the establishment of an industry coordination forum to facilitate greater coordination of operations and investment in the network. The forum could advise on maintenance priorities, investment decisions and funding contributions.
9.3 Does the government subsidise heavy vehicle road use?
In our Draft Report, we noted that while the government subsidises roads, that expenditure is to provide access, amenity, or for non-motorised road users. It is not intended to subsidise heavy vehicle use of roads. Heavy vehicles are charged, in aggregate, for the average costs associated with their road use through the Pay As You Go (PAYGO) system.
Under PAYGO, the National Transport Commission (NTC) determines the proportion of road maintenance costs that stem directly from heavy vehicle road use, as well as a proportion of common costs. This is then allocated across heavy vehicle types based on their estimated road use. Heavy vehicles pay for these costs through the equivalent of 2-part access charge consisting of a fuel excise levied per litre of diesel and a fixed annual vehicle registration fee.
65 Peter and Libby Skipworth submission, p 3.
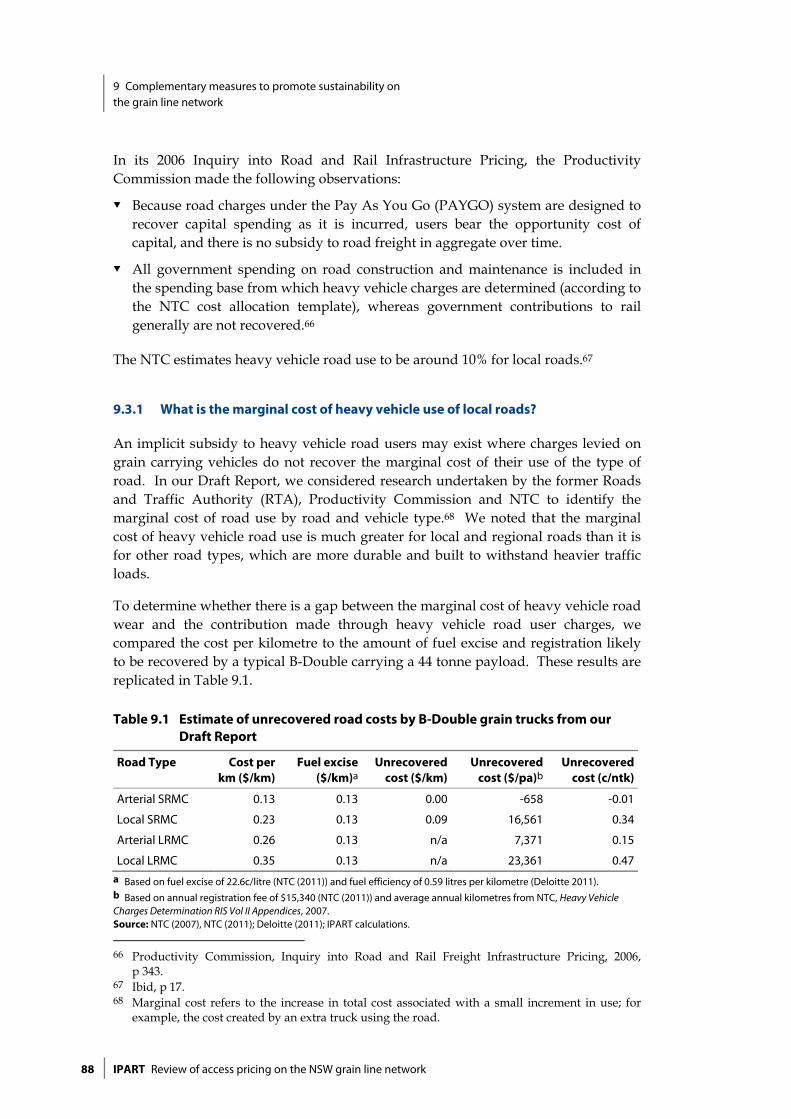
9 Complementary measures to promote sustainability on the grain line network
88 IPART Review of access pricing on the NSW grain line network
In its 2006 Inquiry into Road and Rail Infrastructure Pricing, the Productivity Commission made the following observations:
Because road charges under the Pay As You Go (PAYGO) system are designed to recover capital spending as it is incurred, users bear the opportunity cost of capital, and there is no subsidy to road freight in aggregate over time.
All government spending on road construction and maintenance is included in the spending base from which heavy vehicle charges are determined (according to the NTC cost allocation template), whereas government contributions to rail generally are not recovered.66
The NTC estimates heavy vehicle road use to be around 10% for local roads.67
9.3.1 What is the marginal cost of heavy vehicle use of local roads?
An implicit subsidy to heavy vehicle road users may exist where charges levied on grain carrying vehicles do not recover the marginal cost of their use of the type of road. In our Draft Report, we considered research undertaken by the former Roads and Traffic Authority (RTA), Productivity Commission and NTC to identify the marginal cost of road use by road and vehicle type.68 We noted that the marginal cost of heavy vehicle road use is much greater for local and regional roads than it is for other road types, which are more durable and built to withstand heavier traffic loads.
To determine whether there is a gap between the marginal cost of heavy vehicle road wear and the contribution made through heavy vehicle road user charges, we compared the cost per kilometre to the amount of fuel excise and registration likely to be recovered by a typical B-Double carrying a 44 tonne payload. These results are replicated in Table 9.1.
Table 9.1 Estimate of unrecovered road costs by B-Double grain trucks from our Draft Report
Road Type Cost per km ($/km)
Fuel excise ($/km)a
Unrecovered cost ($/km)
Unrecovered cost ($/pa)b
Unrecovered cost (c/ntk)
Arterial SRMC 0.13 0.13 0.00 -658 -0.01
Local SRMC 0.23 0.13 0.09 16,561 0.34
Arterial LRMC 0.26 0.13 n/a 7,371 0.15
Local LRMC 0.35 0.13 n/a 23,361 0.47 a Based on fuel excise of 22.6c/litre (NTC (2011)) and fuel efficiency of 0.59 litres per kilometre (Deloitte 2011). b Based on annual registration fee of $15,340 (NTC (2011)) and average annual kilometres from NTC, Heavy Vehicle Charges Determination RIS Vol II Appendices, 2007. Source: NTC (2007), NTC (2011); Deloitte (2011); IPART calculations.
66 Productivity Commission, Inquiry into Road and Rail Freight Infrastructure Pricing, 2006,
p 343. 67 Ibid, p 17. 68 Marginal cost refers to the increase in total cost associated with a small increment in use; for
example, the cost created by an extra truck using the road.

9 Complementary measures to promote sustainability on the grain line network
Review of access pricing on the NSW grain line network IPART 89
The results indicated that there is a likely shortfall in cost recovery on local roads and a long-run shortfall in cost recovery on both local and arterial roads. However, we noted that our estimates represented the shortfall that would occur if the B-Double in question travelled 100% of the time on that particular road type.
In comparison, the unpublished former RTA short-run marginal cost estimates were substantially higher than the Productivity Commission estimates. They were based on data from the NSW state road network and extrapolated to provide a preliminary estimate of marginal costs for other regional and local roads in NSW.
9.3.2 Stakeholder submissions
The ATA and Livestock and Bulk Carriers argued strongly that heavy vehicles are charged accordingly for their use of roads through the fuel excise and registration charges. The ATA noted that the grain lines have no other users, so rail (users) should pay its full costs.69 The Livestock and Bulk Carriers stated that heavy vehicles pay not only for their impact on roads, but also a contribution to capital costs.70
GrainCorp stated that the net subsidy for grain lines was less than the implicit subsidy for regional roads. GrainCorp stated that this subsidy should be taken into account in our analysis of road and rail externalities and recommendation on rail access prices.71
9.3.3 IPART findings
The ATA and Livestock and Bulk Carriers make valid points about the way road and rail infrastructure are subsidised. The heavy vehicle charging system is designed so that road users are charged for the road maintenance they cause and a proportion of common capital costs. In comparison, the grain line users do not pay for capital costs (by way of stabilisation costs or upgrades) and pay for a very small proportion of ongoing maintenance costs.
In Chapter 4, we addressed GrainCorp’s concerns about how our analysis on the implicit subsidy for heavy vehicle travel on local roads compared with the level of government subsidy for rail and how this was taken into account in our externality analysis. In its Heavy Vehicle Charges Determination, the NTC concluded that heavy vehicles travel only 10% on local roads, although estimates have been as high as 16% of local road use.72 Taking these proportions into consideration, an average B-Double journey from grain line silo all the way to port may under-recover between 0.18c/ntk and 0.20c/ntk on average using the Productivity Commission’s estimates. In Chapter 4, we used a generous estimate of 1.41c/ntk in our externality analysis.
69 ATA submission, p 1. 70 Livestock and Bulk Carriers submission, p 2. 71 GrainCorp submission, p 5. 72 NTC, Heavy Vehicle Charges Determination RIS Vol II Appendices, 2007, p 17.
9 Complementary measures to promote sustainability on the grain line network
90 IPART Review of access pricing on the NSW grain line network
Whether the current heavy vehicle charging framework recovers the true cost of heavy vehicle use of roads is a matter of ongoing debate. Our preliminary results on heavy vehicle road cost under-recovery using the Productivity Commission estimates may be an important finding. However, more up-to-date analysis on the long-run marginal costs of heavy vehicle use of local and regional roads in NSW should be undertaken to understand the overall government subsidy of freight transport infrastructure – both road and rail.
Recommendation
10 Further analysis on the long-run marginal costs of road wear caused by heavy vehicles that transport grain is required to understand the overall government subsidy to road and rail freight transport infrastructure.
9.3.4 How will national heavy vehicle charging reforms impact road and rail pricing?
In our Draft Report, we noted that research on the marginal cost of road wear of heavy vehicles was being undertaken as part of the COAG Road Reform Plan (CRRP) feasibility study into mass-distance-location based charging for heavy vehicles, although the results from much of this research have not yet been published. We noted that progress had been slow and there are no indications that any significant changes would be made to the heavy vehicle charging system in the near future.
We considered that it was possible that many challenges to the progression of the CRRP process had arisen because of the scale of the task at hand; that is, attempting to address heavy vehicle charging for all vehicles in all markets in all states. In this regard, we suggested that there may be merit in the NSW Government conducting its own trials of heavy vehicle pricing initiatives using the grain industry as a test case. We recommended that further analysis on the marginal costs of heavy vehicle road wear be undertaken.
We also recommended that that the NSW Government should also continue to pursue national reforms to national heavy vehicle charging, such that it better reflects the actual costs of heavy vehicle use of rural and local road infrastructure. Should there be progress with the CRRP process or related heavy vehicle pricing initiatives such that they materially affect road supply chain costs, we considered that access prices on the grain line network should be reviewed.

9 Complementary measures to promote sustainability on the grain line network
Review of access pricing on the NSW grain line network IPART 91
9.3.5 Stakeholder submissions
Peter and Libby Skipworth supported a further investigation of the long-run marginal costs of heavy vehicle road wear. However, they noted that investigation and reform of cost recovery of heavy vehicles on regional roads raised concerns with the impact of any increase in costs to producers and future viability of the grain industry.73
The ARTC agreed that the NSW Government should continue to pursue reforms to national heavy vehicle charging and potentially, conduct its own trials of heavy vehicle pricing initiatives using the grain industry as a test case.74
9.3.6 IPART findings
Any significant changes to the prices that heavy vehicles pay for road use will affect the calculations of the external costs of road and hence, the net external benefits of rail. They will also affect the supply chain costs for road and hence, the level of rail cost advantage. As a result, grain line access prices cannot be considered in isolation to heavy vehicle charges.
However, acknowledging stakeholders concerns about certainty on the grain lines, we consider that this could be undertaken as part of a broader review at the end of the 5-year regulatory period as per our Recommendation 3. Prior to the implementation of any future changes to access prices, the impact on stakeholders should be taken into account.
In the meantime, we recommend that there may be merit in the NSW Government conducting its own trials of heavy vehicle pricing initiatives using the grain industry as a test case. We recommend that this should be done in conjunction with further analysis on the marginal costs of heavy vehicle road wear to wholly understand the costs and benefits involved.
Recommendation
11 The NSW Government should continue to pursue national reforms to national heavy vehicle charging, such that it better reflects the actual costs of heavy vehicle use of regional and local road infrastructure.
73 Peter and Libby Skipworth submission, p 3. 74 ARTC submission, p 5.
9 Complementary measures to promote sustainability on the grain line network
92 IPART Review of access pricing on the NSW grain line network
9.4 How could the government undertake a more integrated approach to funding rail and road projects?
In our Draft Report, we noted that that road and rail are effectively substitutes along the grain line routes and as such, the government should take a mode-neutral approach to policy and planning along these corridors. We noted NSW the Government’s goal in its NSW 2021 plan to invest in strategic and coordinated infrastructure.
Some of the grain lines transport such low volumes of grain and other traffic that they recover virtually none of the cost of keeping the line open, even with a 100% increase in access prices. Further, lines that carry low volumes of traffic generate a very small net external benefit. We concluded that it was therefore questionable whether these lines would be sustainable in the longer-term.
Stakeholders expressed concern about past and potential grain line closures including:
the increased wear on local and regional roads and associated externalities, such as accidents, pollution and congestion
the inefficiencies of transporting grain to port by road.
We noted that suspension of operations on a line would lead to a saving of the difference between the track maintenance cost and the access revenue. This saving may be more than sufficient to offset the cost of road damage and other externalities that would ensue from the modal shift to road. Further, savings could be used to establish pilot programs for road transport and compensate for downstream impacts, such as truck movements at port.
We considered that while it was a matter for the government to decide what should be done about unsustainable lines, our analysis indicated that there were merits in engaging with industry to consider the best mode of transport along selected regional freight corridors, rather than providing competing infrastructure. We recommended that a comprehensive demonstration of the costs and benefits should be conducted as part of this decision making process.
9.4.1 Stakeholder submissions
Our Draft Recommendation of a mode-neutral funding approach to road and rail transport infrastructure funding was endorsed by many stakeholders.
The ARTC agreed that the NSW Government should take a mode-neutral approach to the provision of subsidies for freight transport infrastructure and that a comprehensive cost benefit analysis should be undertaken on corridors where rail
9 Complementary measures to promote sustainability on the grain line network
Review of access pricing on the NSW grain line network IPART 93
has a very low cost recovery level. This analysis should also have regard to the cost recovery of road transport.75
The ATA considered that freight should be moved in the most efficient way, as our country competes globally. It stated that the money being spent on rail lines may not be the best return of investment for the community.76
The Livestock and Bulk Carriers stated that rail and road are interlinked and neither mode should be disadvantaged by policy making in regard to the other. They stated that funds should be invested in areas where the best return is going to be achieved. They also questioned whether NSW could afford to invest in 2 first class land transport systems to service regional NSW industries, especially where one requires a 94% government subsidy.77
The Railway Technical Society of Australasia was concerned that no direct consideration is given to the avoidance of costs of fatalities and injuries in the provision of rail infrastructure, whereas it is included in the benefit-cost analysis for road infrastructure.78
Some stakeholders expressed concern about the uncertainty created by questioning the viability of selected grain lines and how a cost benefit analysis on these lines would be carried out.
GrainCorp considered that IPART’s recommendations created further uncertainty for investment.79
The Cabonne Council and Peter and Libby Skipworth were concerned that there was not a clear funding mechanism for diverting funds to roads in the event of grain line closures that this did not address the externalities associated with these changes.80
9.4.2 IPART findings
Funding of rail and road infrastructure
Where rail and road compete for the same grain haulage task, it makes little sense for the government to subsidise both forms of transport infrastructure. Increasing the level of subsidy to one mode; for example, through an under-recovery of heavy vehicle road wear costs, causes a necessary increase in subsidy to the other mode; for example, through subsidising access prices to maintain the competitive advantage. This results in an escalating spiral of government subsidy costs.
75 ARTC submission, p 5. 76 ATA submission, p 1. 77 Livestock and Bulk Carriers submission, p 2. 78 Railway Technical Society of Australasia submission, p 4. 79 GrainCorp submission, p 8. 80 Cabonne Council submission, p 1; Peter and Libby Skipworth submission, p 3.
9 Complementary measures to promote sustainability on the grain line network
94 IPART Review of access pricing on the NSW grain line network
It also results in the stifling of innovation and reduced efficiency that would otherwise occur through competition, because operators are not required to reduce their own operating costs to maintain market share.
Our report makes the costs and benefits of the grain lines transparent so that users and taxpayers alike can understand where government funds are being spent and for what benefit.
Unfortunately, this highlights the fact that some lines receive almost 100% government subsidy in order to remain operational and generate an extremely low level of benefits that are not commensurate with the level of subsidy they receive. The reality is that these lines are not sustainable in the long-term.
We have noted throughout our report that if these lines were not operational, the average cost recovery and net external benefits of the network would increase. This would result in lower necessary access price increases for the whole network.
Decisions about the future of selected grain lines are a matter for the NSW Government. However, given the competition between road and rail along the grain lines, such decisions cannot be taken in isolation. On many occasions, stakeholders to our review have pointed out that if not for the grain lines, heavy vehicle grain volumes on local and regional roads would increase significantly. This would cause increased external costs to the communities through which those vehicles travel.
As such, we recommend that future decisions about government subsidies to grain transport infrastructure on a particular corridor be made on the basis of a comprehensive cost benefit analysis that includes consideration of road and rail costs on a like basis.
NSW Grain Freight Review recommendations about line viability
While the NSW Grain Freight Review (2009) recommended that much of the network should be maintained and stabilised at a fit-for-purpose condition, it recommended that the Weemelah to Camurra and Boree Creek to The Rock lines should only be retained if the government and users could negotiate a cost-sharing agreement acceptable to all parties. If negotiations could not result in a satisfactory cost-sharing agreement, then the lines should be closed.
In July 2010, negotiations resulted in a $1/tonne surcharge being applied to the Weemelah line. However, this did not improve cost recovery on this line. In 2010/11, traffic volumes decreased by almost 50% compared to 2009/10 levels, while traffic volumes on the rest of the network remained fairly consistent.
9 Complementary measures to promote sustainability on the grain line network
Review of access pricing on the NSW grain line network IPART 95
Our estimates from Chapter 3 and 4 indicate that maintenance costs including stabilisation investment on the Weemelah line will cost $59,805 per track kilometre per annum over the next 8 years, while average external benefits generated are less than 1/6 of this cost. The Boree Creek – The Rock line will cost $39,818 per track kilometre and generates external benefits less than 1/16 of this amount. Our recommended increase in access prices does not substantially improve cost recovery on either of these lines.
Should the government decide to suspend operations on some lines following the recommendations of the NSW Grain Freight Review and our Final Report, we consider that funding earmarked for maintenance on those lines could be used to offset any increased road maintenance costs that may result or to bring forward stabilisation works on more viable lines.
Recommendation
12 The NSW Government should take a mode-neutral approach to the future provision of subsidies for freight transport infrastructure. This should include a comprehensive demonstration of the costs and benefits for rail and road transport projects on a like basis.
13 Should the NSW Government decide to suspend operations on any of the current lines, the funding earmarked for maintenance on those lines could be used to offset any increased road maintenance costs or to bring forward stabilisation works on more viable lines.
9 Complementary measures to promote sustainability on the grain line network
96 IPART Review of access pricing on the NSW grain line network
Appendices

9 Complementary measures to promote sustainability on the grain line network
Review of access pricing on the NSW grain line network IPART 97

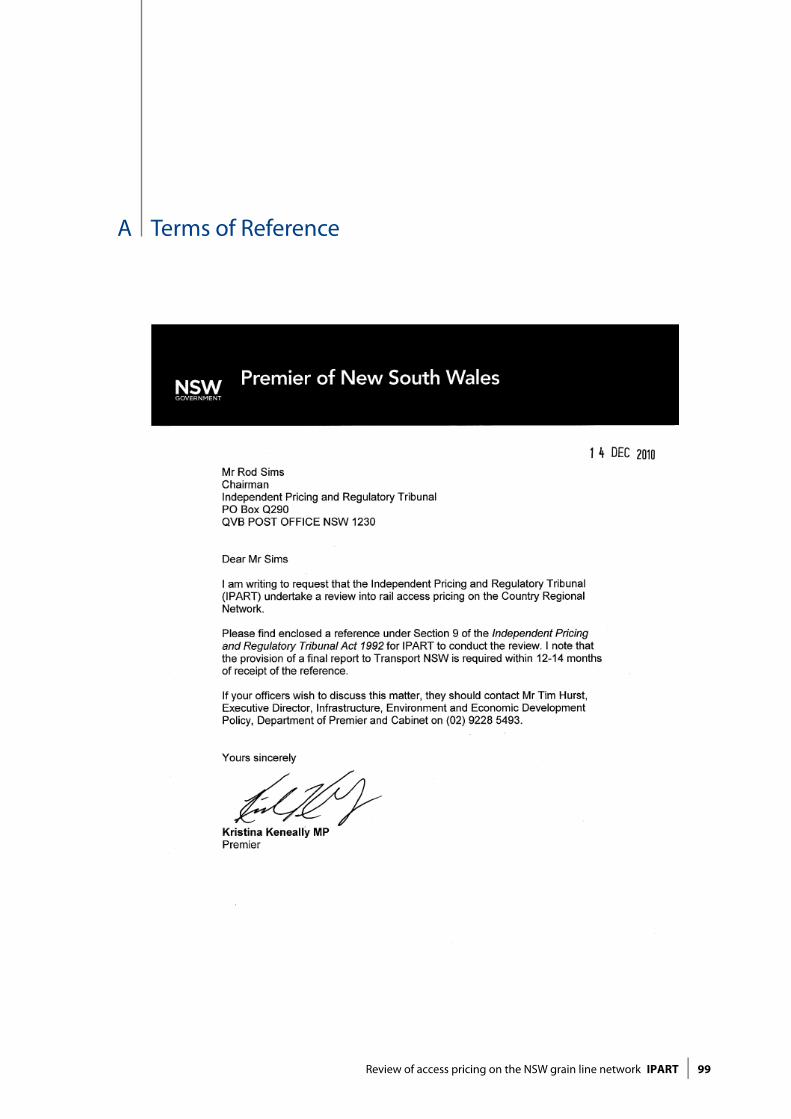
A Terms of Reference
Review of access pricing on the NSW grain line network IPART 99
A Terms of Reference
A Terms of Reference
100 IPART Review of access pricing on the NSW grain line network
A Terms of Reference
Review of access pricing on the NSW grain line network IPART 101
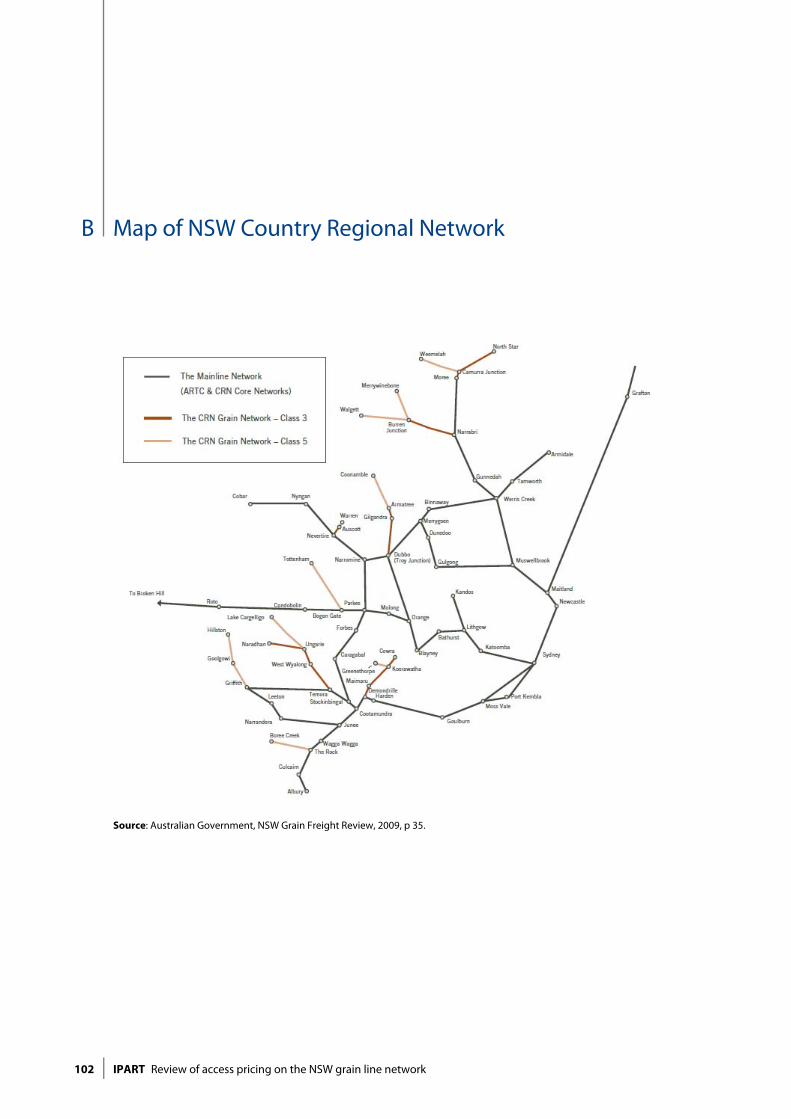
9 Complementary measures to promote sustainability on the grain line network
102 IPART Review of access pricing on the NSW grain line network
B Map of NSW Country Regional Network
Source: Australian Government, NSW Grain Freight Review, 2009, p 35.
C Outlook for the NSW grain industry
Review of access pricing on the NSW grain line network IPART 103
C Outlook for the NSW grain industry
Understanding the NSW grain market and its structure is important in determining access price calculations. Demand for grain lines will largely depend on market and climatic conditions. Forecasting grain production is difficult over the long term particularly on a regional level. This is primarily due to high levels of uncertainty in rainfall and other climatic variables. Market volatility is also likely as a result of exchange rate fluctuations or global supply issues, for example, and this may also have significant impacts on grain production in NSW over the medium to long term.
If we assumed that climatic and market conditions were to remain favourable, then the forecast for the NSW grain markets in the medium-term are positive. Yields and production are set to increase, leading to an increase in exports. This coupled with stability in the domestic market suggests an increase in demand for NSW grain freight lines over the medium term.
This appendix provides an overview of NSW grain market and discusses key market trends.
C.1 Outlook for grain over short to medium term
C.1.1 Production
The medium –term outlook for grain production in Australia is expected to reach 45 million tonnes by 2014/15 under an assumption of favourable seasonal conditions.81 This is mainly due to a projected increase in are sown to grain to increase from 22.5 million hectares to 23.5 million hectares over the same time period, but also due to expected higher yields resulting from improvements in productivity.82 There is however, expected to be some competition for land from sheep with flock size projected to increase by 4 million head by 2014/15, still significantly lower than the 110 million head in early 2000s.83
81 ABARES, Australian Commodities, 18(1), March 2011, p 37. 82 ABARES, Australian Commodities, 17(1), March 2010, pp 31-32. 83 Ibid., p 32.
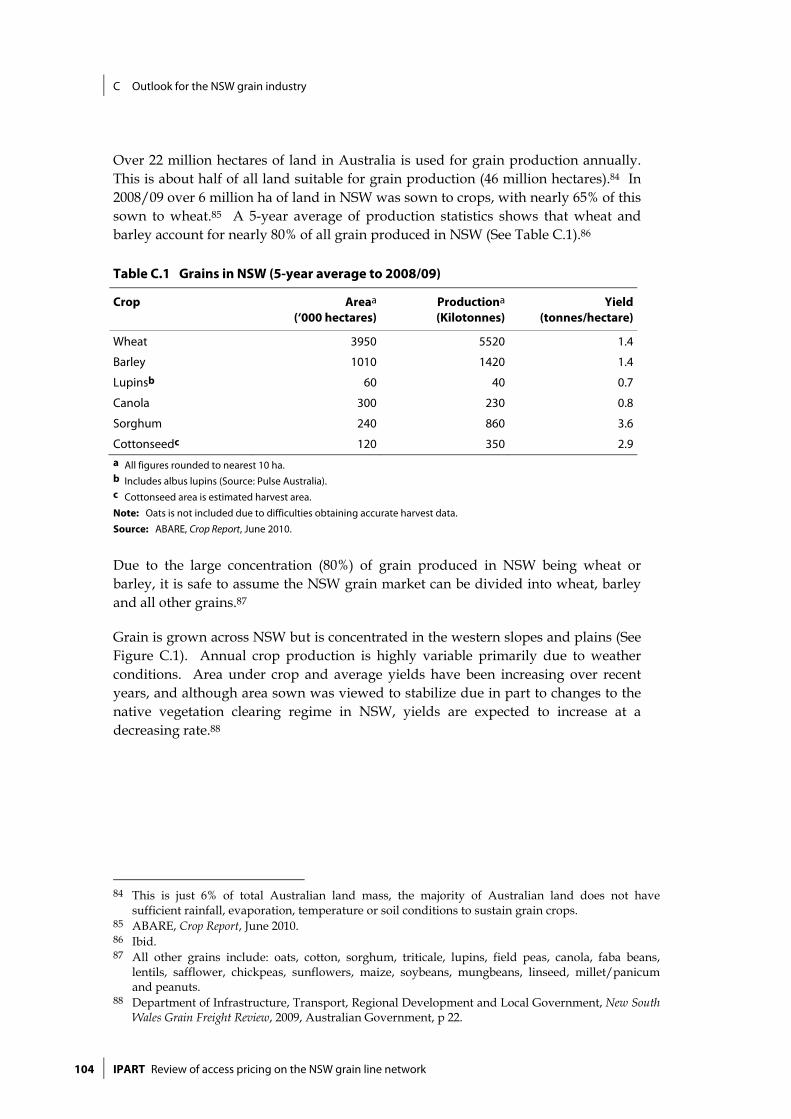
C Outlook for the NSW grain industry
104 IPART Review of access pricing on the NSW grain line network
Over 22 million hectares of land in Australia is used for grain production annually. This is about half of all land suitable for grain production (46 million hectares).84 In 2008/09 over 6 million ha of land in NSW was sown to crops, with nearly 65% of this sown to wheat.85 A 5-year average of production statistics shows that wheat and barley account for nearly 80% of all grain produced in NSW (See Table C.1).86
Table C.1 Grains in NSW (5-year average to 2008/09)
Crop Areaa
(‘000 hectares)Productiona
(Kilotonnes)Yield
(tonnes/hectare)
Wheat 3950 5520 1.4
Barley 1010 1420 1.4
Lupinsb 60 40 0.7
Canola 300 230 0.8
Sorghum 240 860 3.6
Cottonseedc 120 350 2.9 a All figures rounded to nearest 10 ha. b Includes albus lupins (Source: Pulse Australia). c Cottonseed area is estimated harvest area.
Note: Oats is not included due to difficulties obtaining accurate harvest data.
Source: ABARE, Crop Report, June 2010.
Due to the large concentration (80%) of grain produced in NSW being wheat or barley, it is safe to assume the NSW grain market can be divided into wheat, barley and all other grains.87
Grain is grown across NSW but is concentrated in the western slopes and plains (See Figure C.1). Annual crop production is highly variable primarily due to weather conditions. Area under crop and average yields have been increasing over recent years, and although area sown was viewed to stabilize due in part to changes to the native vegetation clearing regime in NSW, yields are expected to increase at a decreasing rate.88
84 This is just 6% of total Australian land mass, the majority of Australian land does not have
sufficient rainfall, evaporation, temperature or soil conditions to sustain grain crops. 85 ABARE, Crop Report, June 2010. 86 Ibid. 87 All other grains include: oats, cotton, sorghum, triticale, lupins, field peas, canola, faba beans,
lentils, safflower, chickpeas, sunflowers, maize, soybeans, mungbeans, linseed, millet/panicum and peanuts.
88 Department of Infrastructure, Transport, Regional Development and Local Government, New South Wales Grain Freight Review, 2009, Australian Government, p 22.
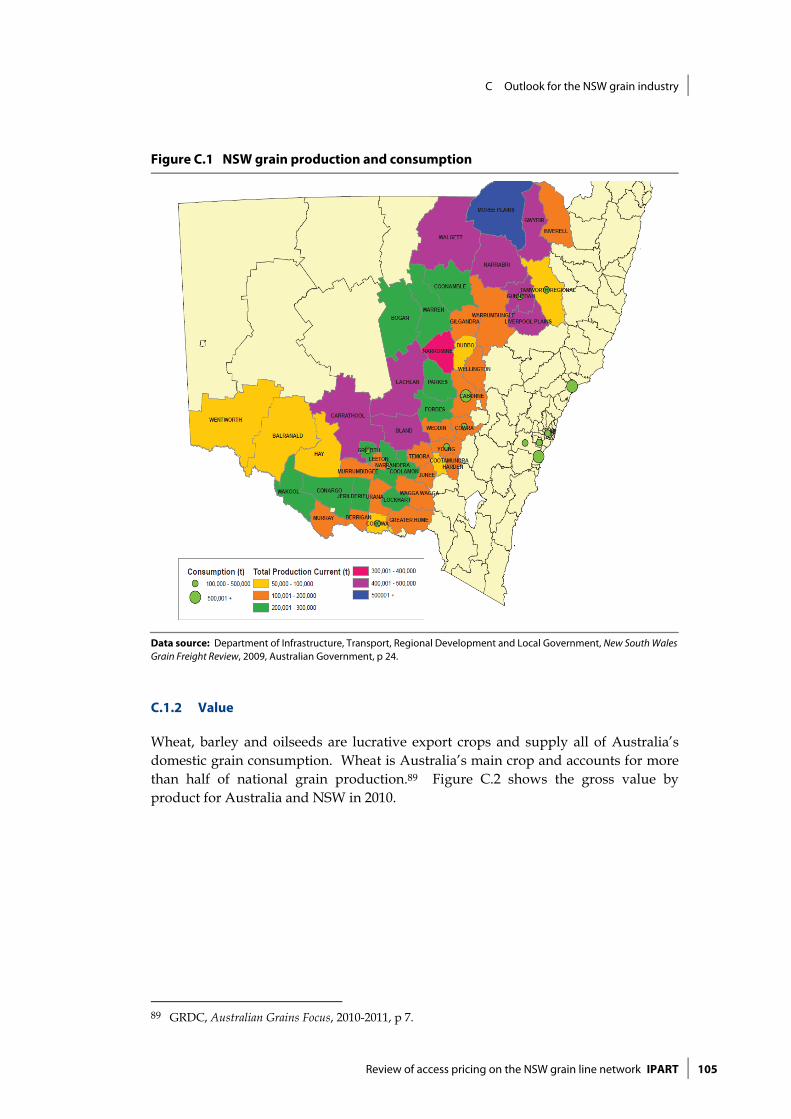
C Outlook for the NSW grain industry
Review of access pricing on the NSW grain line network IPART 105
Figure C.1 NSW grain production and consumption
Data source: Department of Infrastructure, Transport, Regional Development and Local Government, New South Wales Grain Freight Review, 2009, Australian Government, p 24.
C.1.2 Value
Wheat, barley and oilseeds are lucrative export crops and supply all of Australia’s domestic grain consumption. Wheat is Australia’s main crop and accounts for more than half of national grain production.89 Figure C.2 shows the gross value by product for Australia and NSW in 2010.
89 GRDC, Australian Grains Focus, 2010-2011, p 7.

C Outlook for the NSW grain industry
106 IPART Review of access pricing on the NSW grain line network
Figure C.2 Gross Value by Product in Australia and NSW
0
1000
2000
3000
4000
5000
Wheat
OatsBarley
Sorghum
RiceOther cereals
Cotton
HayLupins
Other legumes
Canola
Other oilseeds
All other crops
Product
Gro
ss V
alue
($A
mill
ions
)
AUSTRALIA 2010 $m NSW 2010 $m
Data source: ABS, 2011 (7503.0 – Value of Agricultural Commodities Produced, Australia, 2009-2010).
C.1.3 Domestic trends
ABARES 2011 medium-term outlook suggests Australian wheat exports will increase to 17 million tonnes by 2015/16, in line with increases in production. This is a continuation of the trend over the past 20 years, in which Australian wheat exports have shown a strong positive correlation with production volumes.90
Domestic demand for grain for human consumption is expected to remain stable and is expected to grow only slowly in future. There is potential for more rapid growth in the domestic processing of grain for export as value-added product into growing Asian markets. Recent market data predicts a decline in livestock numbers across NSW in response to the high Australian dollar and a decline in international demand for meat and livestock.
Production will fluctuate dependent on seasonal conditions. The Bureau of Meteorology has suggested that the current La Nina event will gradually decay and approach neutral conditions by mid-2011. This could potentially affect production in eastern Australia.91
90 ABARES, Australian Commodities, 18(1), March 2011, p 50; See data tables in Appendix A for more
details. 91 Ibid., p 33.
C Outlook for the NSW grain industry
Review of access pricing on the NSW grain line network IPART 107
C.1.4 Global trends
ABARES 2011 medium-term outlook suggests support for high world grain prices due to continued income and population growth in key import markets, which will lead to higher demand for feed grains and protein meal, and for industrial use, such as biofuels production.92
By 2015/16, world wheat consumption is projected to rise by around 1% a year to 689 million tonnes. Consumption of wheat as food is projected to rise by 4% to 473 million tonnes.
C.1.5 Exchange rate
A good part of current pressure on agriculture arises because of the increasing exchange rate (from $AU1=$US0.49 around 2000, to greater than parity today). This has dramatically reduced the profitability of Australian agriculture (ceteris paribus). It is expected that the Australian dollar will remain strong in the short term, and primary producers have been encouraged to manage their exchange rate risk due to volatile financial markets which may have an impact on market sentiment and may lead to exchange rate fluctuations.93
C.2 NSW Industry structure
NSW grain is primarily used for domestic consumption (56%), with the remainder serving the export market (44%). Within the domestic market there are 3 main flows: human consumption (15%), animal feed (23%) and interstate flows (18%).94 The majority of grain supplying the export market and domestic human consumption is transported by rail (59%).
C.2.1 Domestic market
There are 4 main mills/malters in NSW: Manildra, Allied, George Weston Foods and Joe White Malting. Over 90% of the grain sourced is transported to Manildra, Allied and George Weston Foods by rail. NSW grain will continue to predominately supply the domestic market; however, this market is not likely to increase greatly in the near future. Human consumption is likely to increase only slowly with population growth. The majority of grain for animal feed is transported by road.95
92 ABARES, Australian Commodities, 18(1), March 2011, pp 33-35. 93 Ibid, 18(2), June 2011, p 12. 94 Department of Infrastructure, Transport, Regional Development and Local Government, NSW
Grain Freight Review, 2009, p 3. 95 Ibid, p 27.
C Outlook for the NSW grain industry
108 IPART Review of access pricing on the NSW grain line network
C.2.2 Export market
In previous years, NSW grain exports have been low (2002-03), however bumper harvests due to good climatic conditions have meant higher than average exports in the last couple of years. Grain exports are rail based due to centralized storages of bulk handlers and better accessibility to ports by rail.
Although volatile, exports have a significant influence on the shape of the industry. In NSW, the dominant market player is GrainCorp with 82% market share (2002-06) who compete with 7 other bulk exporters, including AWB Ltd.96
96 Productivity Commission, Wheat Export Marketing Arrangements, Inquiry Report #51, July 2010, p 20.
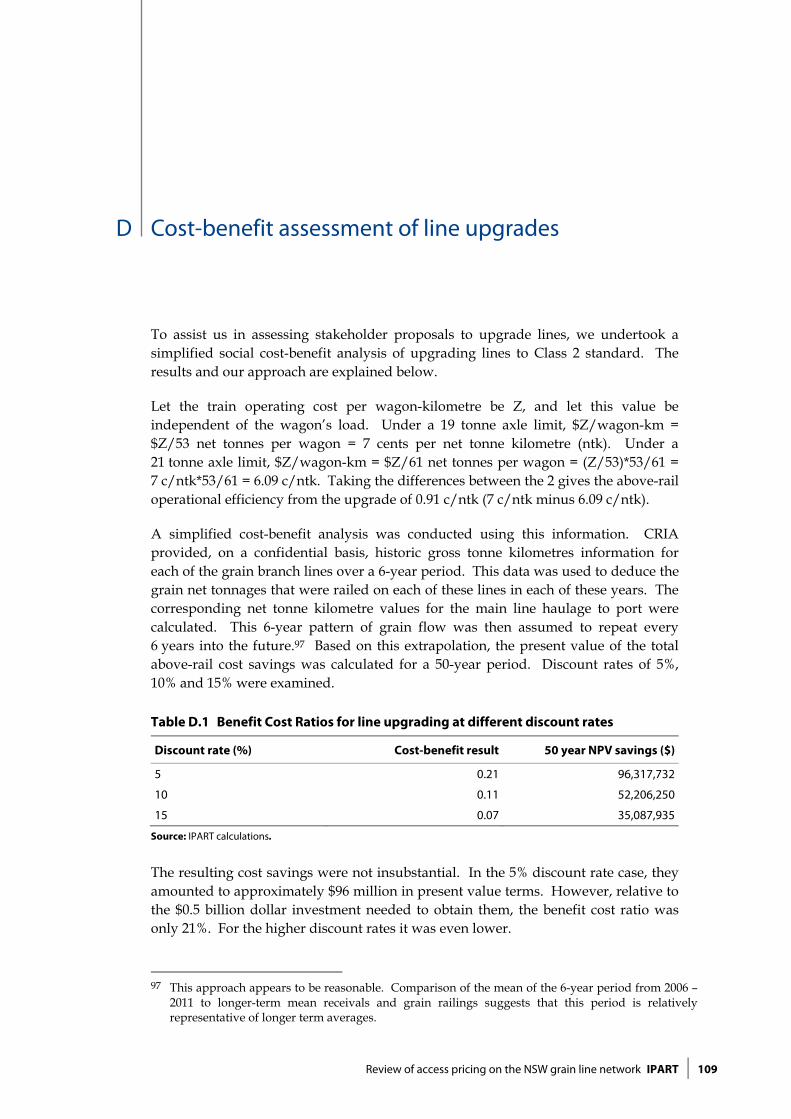
D Cost-benefit assessment of line upgrades
Review of access pricing on the NSW grain line network IPART 109
D Cost-benefit assessment of line upgrades
To assist us in assessing stakeholder proposals to upgrade lines, we undertook a simplified social cost-benefit analysis of upgrading lines to Class 2 standard. The results and our approach are explained below.
Let the train operating cost per wagon-kilometre be Z, and let this value be independent of the wagon’s load. Under a 19 tonne axle limit, $Z/wagon-km = $Z/53 net tonnes per wagon = 7 cents per net tonne kilometre (ntk). Under a 21 tonne axle limit, $Z/wagon-km = $Z/61 net tonnes per wagon = (Z/53)*53/61 = 7 c/ntk*53/61 = 6.09 c/ntk. Taking the differences between the 2 gives the above-rail operational efficiency from the upgrade of 0.91 c/ntk (7 c/ntk minus 6.09 c/ntk).
A simplified cost-benefit analysis was conducted using this information. CRIA provided, on a confidential basis, historic gross tonne kilometres information for each of the grain branch lines over a 6-year period. This data was used to deduce the grain net tonnages that were railed on each of these lines in each of these years. The corresponding net tonne kilometre values for the main line haulage to port were calculated. This 6-year pattern of grain flow was then assumed to repeat every 6 years into the future.97 Based on this extrapolation, the present value of the total above-rail cost savings was calculated for a 50-year period. Discount rates of 5%, 10% and 15% were examined.
Table D.1 Benefit Cost Ratios for line upgrading at different discount rates
Discount rate (%) Cost-benefit result 50 year NPV savings ($)
5 0.21 96,317,732
10 0.11 52,206,250
15 0.07 35,087,935
Source: IPART calculations.
The resulting cost savings were not insubstantial. In the 5% discount rate case, they amounted to approximately $96 million in present value terms. However, relative to the $0.5 billion dollar investment needed to obtain them, the benefit cost ratio was only 21%. For the higher discount rates it was even lower.
97 This approach appears to be reasonable. Comparison of the mean of the 6-year period from 2006 –
2011 to longer-term mean receivals and grain railings suggests that this period is relatively representative of longer term averages.

D Cost-benefit assessment of line upgrades
110 IPART Review of access pricing on the NSW grain line network
Applying the same analysis on a line-by-line basis for a 5% discount rate obtained the following results.
Table D.2 Benefit Cost Ratios for upgrading by line at 5% discount rate
Line Cost-benefit result 50 year NPV savings ($)
Camurra - Weemelah 0.12 7,058,621
Narrabri group of linesa 0.92 33,632,837
Bogan Gate - Tottenham 0.08 6,299,556
Nevertire - Warren 0.31 2,778,817
Dubbo - Coonamble 0.44 30,590,235
Temora group of linesb 0.11 11,049,747
The Rock – Boree Creek 0.04 1,429,129
Griffith - Hillston 0.05 3,478,791 a Narrabri to Walgett and Narrabri to Merrywinebone. b Temora to Naradhan and Temora to Lake Cargelligo.
Source: IPART calculations.
While this calculation is necessarily fairly simple, it is extremely conservative. In practice, a discount rate higher than 5% would be used in investment decision making as well as potentially a shorter time period over which the benefits are assessed.
In our view, it is not conceivable that the cost-benefit ratio for the grain line network would be sufficiently high to justify such an investment by government. However, there may be merit in upgrading selected lines in future, subject to a comprehensive economic cost-benefit analysis.
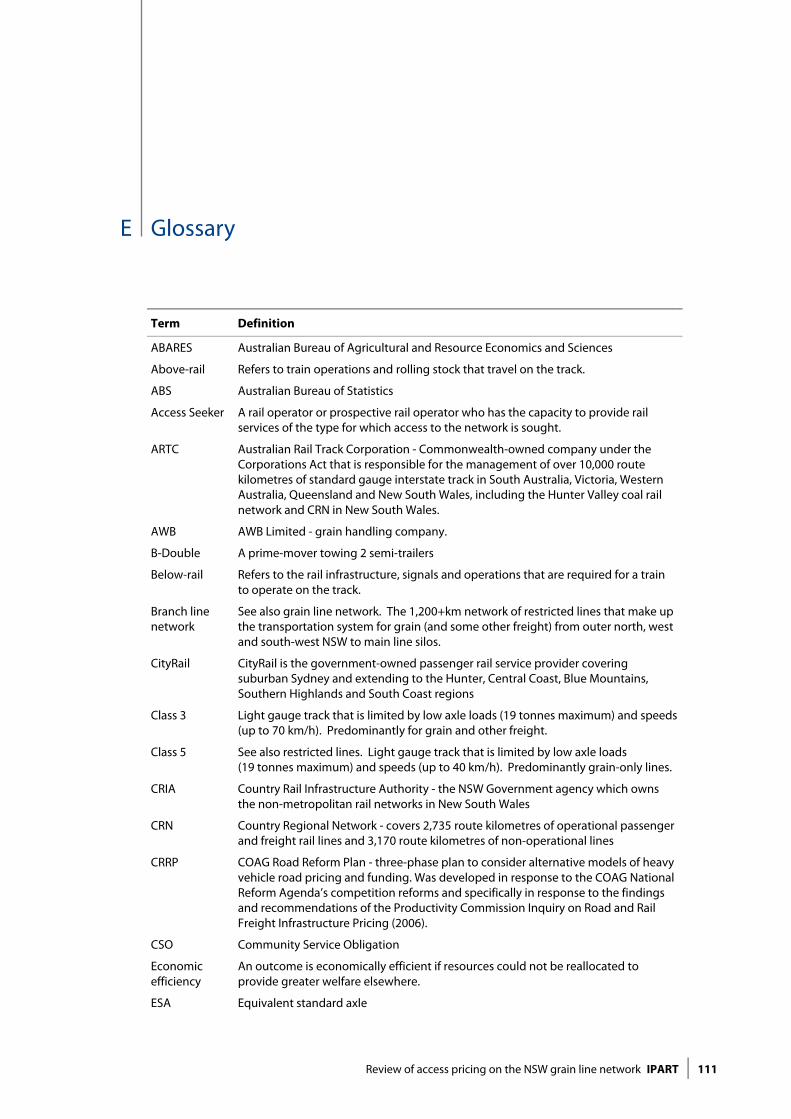
E Glossary
Review of access pricing on the NSW grain line network IPART 111
E Glossary
Term Definition
ABARES Australian Bureau of Agricultural and Resource Economics and Sciences
Above-rail Refers to train operations and rolling stock that travel on the track.
ABS Australian Bureau of Statistics
Access Seeker A rail operator or prospective rail operator who has the capacity to provide rail services of the type for which access to the network is sought.
ARTC Australian Rail Track Corporation - Commonwealth-owned company under the Corporations Act that is responsible for the management of over 10,000 route kilometres of standard gauge interstate track in South Australia, Victoria, Western Australia, Queensland and New South Wales, including the Hunter Valley coal rail network and CRN in New South Wales.
AWB AWB Limited - grain handling company.
B-Double A prime-mover towing 2 semi-trailers
Below-rail Refers to the rail infrastructure, signals and operations that are required for a train to operate on the track.
Branch line network
See also grain line network. The 1,200+km network of restricted lines that make up the transportation system for grain (and some other freight) from outer north, west and south-west NSW to main line silos.
CityRail CityRail is the government-owned passenger rail service provider covering suburban Sydney and extending to the Hunter, Central Coast, Blue Mountains, Southern Highlands and South Coast regions
Class 3 Light gauge track that is limited by low axle loads (19 tonnes maximum) and speeds (up to 70 km/h). Predominantly for grain and other freight.
Class 5 See also restricted lines. Light gauge track that is limited by low axle loads (19 tonnes maximum) and speeds (up to 40 km/h). Predominantly grain-only lines.
CRIA Country Rail Infrastructure Authority - the NSW Government agency which owns the non-metropolitan rail networks in New South Wales
CRN Country Regional Network - covers 2,735 route kilometres of operational passenger and freight rail lines and 3,170 route kilometres of non-operational lines
CRRP COAG Road Reform Plan - three-phase plan to consider alternative models of heavy vehicle road pricing and funding. Was developed in response to the COAG National Reform Agenda’s competition reforms and specifically in response to the findings and recommendations of the Productivity Commission Inquiry on Road and Rail Freight Infrastructure Pricing (2006).
CSO Community Service Obligation
Economic efficiency
An outcome is economically efficient if resources could not be reallocated to provide greater welfare elsewhere.
ESA Equivalent standard axle

E Glossary
112 IPART Review of access pricing on the NSW grain line network
Fixed costs Costs not dependent on the level of use of the network.
GIAC Grain Industry Advisory Committee
Grain Consolidation Facility
Grain storage and receival facilities located on main rail lines which are used to transfer grain from trains operating on the grain line network to main line trains for transporting to port.
Grain line network
See also branch line network. The 1,100+km network of restricted lines that make up the transportation system for grain (and some other freight) from outer north, west and south-west NSW to main line silos.
GrainCorp Grain handling company contracted by the NSW Government under the Grain Haulage Agreement to provide grain rail haulage services on the branch line network to reach the nearest available hub for the deposit of grain (en route to port).
GTK Gross tonne kilometre
Hunter Valley Network
Section of rail track in the Hunter Valley that runs from Werris Creek and Merrygoen to Port Waratah and Kooragang. Used to transport coal primarily.
Long-run marginal cost
The change in total cost that arises when the quantity changes by one unit, including a proportion of capital costs.
Monopoly prices
Prices that may be charged by the sole owner of a service or producer of a good, which is significantly higher than the cost of producing the good or service.
MPM Major Periodic Maintenance – track upgrades, including, but not limited to, formation reconditioning, sleeper and rail renewal, junction renewals and refurbishments, high performance track reconstruction and maintenance resurfacing.
NRSR National Rail Safety Regulator
Natural monopoly
An industry characterised by large infrastructure requirements that are uneconomic to duplicate.
NSW Rail Access Undertaking
Governs the provision of third party access to the rail network in NSW, which is not covered by a separate access arrangement.
NTC National Transport Commission
NTK Net tonne kilometre
PAYGO Pay As You Go - system of recovering heavy vehicle charges nationally
Price discrimination
When identical goods or services are transacted at different prices from the same provider.
Productivity Commission
The Productivity Commission is the Australian Government's independent research and advisory body on a range of economic, social and environmental issues affecting the welfare of Australians.
RailCorp Rail Corporation New South Wales - NSW Government agency responsible for maintaining the metropolitan rail network and providing access to freight operators in the metropolitan area.
Restricted lines
See also Class 5 lines. Light gauge track that is limited by low axle loads (19 tonnes maximum) and speeds (up to 40 km/h). Predominantly grain-only lines.
Routine maintenance
Inspections and unplanned minor maintenance carried out annually or more frequent cycles, including track inspections, patrolling, replacing broken track components, corridor maintenance, fence maintenance and signal testing.
RTA NSW Roads and Traffic Authority
Short-run The change in total cost that arises when the quantity changes by one unit.


E Glossary
Review of access pricing on the NSW grain line network IPART 113
marginal cost
Stabilise Prevent the track from deteriorating beyond its current condition of use.
TAM Plan Total Asset Management Plan
Undertaking See NSW Rail Access Undertaking