Final Report Regional Bus Study - WMATA · The Report presents a plan to address the short and long...
96
Washington Metropolitan Area Transit Authority Loudoun Montgomery Prince George's Fairfax DC Arlington Alexandria Fairfax City Falls Church Regional Bus Study September 2003 Final Report
Transcript of Final Report Regional Bus Study - WMATA · The Report presents a plan to address the short and long...

Washington Metropolitan AreaTransit Authority
Loudoun
Montgomery
Prince George's
Fairfax
DC
Arlington
Alexandria
Fairfax City
Falls Church
Regional Bus Study
September 2003
Final Report

Table of Contents Preface ............................................................................................................................ i Executive Summary ..................................................................................................... iii 1 Introduction ............................................................................................................ 1
2 Regional Bus Study Methodology ........................................................................ 3
2.1 Operational Analysis ......................................................................................... 3
2.2 Consumer Market Research ............................................................................. 4 2.2.1 Riders ........................................................................................................................ 4 2.2.2 Non-Riders ................................................................................................................ 5
2.3 Analysis of Future Markets and Growth ............................................................ 8
2.4 Public Input and Consensus Building................................................................ 8
2.5 Development of Service and Facility Strategies................................................ 9
3 Recommended Operating Plan for the Region.................................................. 13
3.1 Overview......................................................................................................... 13
3.2 Service Improvements .................................................................................... 13 3.2.1 Overview of Strategy ............................................................................................... 13 3.2.2 Description of Improvements................................................................................... 14 3.2.3 Phasing ................................................................................................................... 34 3.2.4 Resources and Impacts........................................................................................... 34
3.3 Capital Improvements ..................................................................................... 46 3.3.1 Fleet ........................................................................................................................ 46 3.3.2 Facilities .................................................................................................................. 52 3.3.3 ITS........................................................................................................................... 68 3.3.4 Bus Maintenance and Storage Garages ................................................................. 77 3.3.5 Capital Cost Summary ............................................................................................ 79
4. Next Steps................................................................................................................ 81


Final Report
i
Preface This Final Report is the final product of the Regional Bus Study initiated and conducted by WMATA in cooperation with the jurisdictions in its service area. The Report presents a plan to address the short and long term requirements for both regional and non-regional bus services in the District of Columbia, Montgomery County and Prince George’s County in Maryland, Arlington, Fairfax and Loudoun Counties and the Cities of Alexandria, Fairfax and Falls Church in Virginia. The Plan is presented in more detail in the Revised Operating Plan.
The Final Report and Revised Operating Plan incorporate comments received on the Draft Operating Plan and Draft Final Report that were issued in 2002. They reflect analysis and planning efforts carried out largely during the period from 2000 to 2002. These analysis and planning efforts relied on available route ridership data dating from 1998 through 2000, 1990 census data and on-board and telephone surveys conducted for this study during 2000. The revisions incorporated in this Final Report addressed specific comments on the Draft Report and the Draft Plan. They do not reflect an attempt to update the Plan to reflect conditions that have changed since the Draft Plan was issued or since the analyses were conducted. Furthermore, it should be noted that, besides the changing economic conditions and ridership demand, changes in service were made over the course of the Regional Bus Study both to implement recommendations of the study and to address other service issues. The Plan should provide ongoing guidance to WMATA and the jurisdictions as they continue to improve services to meet the changing needs of the service area.
The Regional Bus Study was conducted by a consultant team led by the Consulting Division of Multisystems (now part of TranSystems Corporation). The team included DMJM+Harris, TransManagement, NuStats International, Maintenance Design Group, McCollom Management Consulting, Weslin Research Incorportated and A.G. Dobbins and Associates.
The consultant team wishes to acknowledge the guidance of the current and prior WMATA Project Managers, Arthuro Lawson, Richard Stevens, Ronald Downing and Christopher Jenks as well as the assistance and advice of the Project Steering Committee and the staffs of all the participating agencies.
Washington Metropolitan Area Regional Bus Study
ii
Final Report
iii
Executive Summary
Introduction In 1999, recognizing the substantial growth of jobs and people in the region, the Metro Board set a goal to double the number of riders between 2000 and 2025. The Regional Bus Plan has identified what improvements will be needed to the existing services and facilities to meet the Board’s ridership goal. The two-year study, which analyzed both Metrobus and the bus services operated by local jurisdictions, was designed to assess the needs of a region that has decentralized and grown rapidly. The study was conducted as a follow up to the work of the Regional Mobility Panel that met in the late 1990s to identify how to meet and finance future bus service needs. The study was carried out by a multidisciplinary team of consultants led by Multisystems, now part of TranSystems Corporation.
Understanding the System Analysis of the service offered by Metrobus and the seven locally provided bus services established a baseline understanding of the system and the individual routes
The region was divided into five sub-regions for analysis: (1) the District of Columbia; (2) Prince George’s County, Maryland; (3) Montgomery County, Maryland; (4) Fairfax and Loudoun Counties, and the City of Fairfax, Virginia; and (5) Alexandria, Arlington, and Falls Church, Virginia. Routes were evaluated using a set of measures that included hours of service, frequency, travel time, crowding, productivity (passengers carried per hour of service provided) and reliability. Areas with poor service or no service also were identified. The project team (staff from Metro and the nine local jurisdictions and study consultants) then set thresholds for nine different types of service and evaluated each route against them. For instance, a suburban circulator service is not expected to be as productive or to operate as many hours of service or at the same frequency as an urban crosstown route.
The operations analysis determined that current weekday service and coverage is good in urban areas, in the inner suburbs, and in areas with large numbers of people dependent on transit. But several key improvements to increase the viability and productivity of current routes were identified:
• Alleviate crowding on many routes in the District • Expand the hours of service operation, including on weekends • Expand coverage in the outer suburbs • Improve frequency and travel time on certain routes • Improve reliability throughout the system
The project team also compared the overall service offered in the region, both bus and rail, to five other regions: Philadelphia, Boston, Chicago, Atlanta, and San Francisco. It was found that the Washington region provides more bus and rail service per person, with the result being relatively higher use of the rail rapid transit system, but somewhat less use of bus service per hour of service provided.

Washington Metropolitan Area Regional Bus Study
iv
Defining the Market During the course of the study, customers were consulted to help identify service improvements. More than 40,000 bus riders in all jurisdictions were surveyed during late spring and summer 2000. The survey provided information about the riders, their travel patterns, and their views of both bus and rail service. Bus service is generally viewed favorably by the riders, but not as favorably as Metrorail. Improvements on the top of many riders’ lists are on-time arrival, more frequent service, longer hours of service and less crowded vehicles. However, views differed depending on location. For example, District riders were more concerned about crowding, while suburban riders were more concerned about hours of service and frequency.
Non-riders were also consulted through a regional telephone survey of 1,000 individuals in order to understand what would attract new people to transit. Better information about available service was what many non-riders felt was most needed to encourage them to use the bus for some trips. Mirroring the suburban riders’ views, improved frequency was also cited by many non-riders, as well as shorter travel times and bus stops closer to home and destinations. Better bus access to Metrorail and better coordination between bus and rail schedules may also encourage more non-riders to use transit. Overall, the survey revealed that the largest growth market for bus service is in the suburbs, but over half of this market is suburb-to-suburb trips, which are difficult to provide with traditional transit routes. As a result, the study looked at alternative types of service in suburban areas using small buses as well as ways to provide service for the growing activity centers in the suburbs where the higher demand level is most likely to support improved service.
The study also took a hard look at the impact of expected future growth on system needs. Overall, the core of the region will continue to have the largest number of jobs, but growth of both jobs and residents will be greatest in the suburbs. Examination of current and projected density of housing and jobs throughout the region identified several areas that lack service today but would support transit in 2020.
Another important source of information for the study were two rounds of public outreach and information. Meetings were held in each of the five sub-regions including a broad range of business, civic, and government leaders. The needs identified in these meetings were consistent with other market research, which showed high general interest in better system information and improved frequencies. Information about the study and the opportunity to comment was also provided to the public at www.wmata.com since early on in the study.
Proposed Improvements for the Region Extended hours of service, neighborhood circulators, and transfer centers with up-to-the-minute information are just a few of the improvements proposed by the Regional Bus Study. The strategies identified in the study’s Final Operating Plan build on recent successes in increasing ridership by expanding service into new markets as well as serving current customers better in all of the nine participating jurisdictions. Many existing bus routes are targeted to have more frequent service over longer periods of the day, including new or increased weekend service. These latter improvements are designed to alleviate crowding on routes and to accommodate new riders in current service areas. Other changes are aimed at increasing feeder bus service to Metrorail, and increasing service within growing activity centers and neighborhoods. To better

Final Report
v
serve the diverse region, the study defines a new Family of Services concept. This concept anticipates a hierarchy of services ranging from more flexible, demand-responsive neighborhood service using smaller vehicles to a network of high-performance service using larger buses. The latter would operate on streets that would give buses priority, with some traveling on dedicated lanes. Vehicle types would vary with the need and service area characteristics.
High-quality bus service in the Washington region will rely on successfully linking each of the following elements into a single, seamless system: vehicles, services, stops and stations, running ways, operating and maintenance shops and yards, and passenger and operating support systems. The Final Operating Plan envisions a regional bus system with service and facility improvements that:
• Provide a seamless, easy to use transit system across the region, with coordinated fares, routes, schedules, information and marketing among Metrobus, Metrorail, local bus operators, and commuter rail systems.
• Reflect a range of quality services, referred to as a Family of Services, that are tailored to the needs of the different markets in this highly complex, cosmopolitan region.
• Improve access to and within regional activity centers, such as Tysons Corner, downtown D.C., and Bethesda, for example.
• Provide more reliable service. • Provide bus service to relieve rail system crowding.
New and better transit centers, park-and-ride lots, stations and stops will play an essential role in improving the image of the bus system and the experience of traveling by bus, ensuring convenient transfers between different bus lines as well as between bus services and other means of travel. These facilities will offer high-visibility entry points to the system with useful information and will encourage transit-friendly development like that experienced around Metrorail stations. Overall, the transit system will provide the requisite quality of service to help Metro and the jurisdictions address future growth outside the core area. To support the proposed increase in service, approximately 12 new bus garages will be needed in the region.
Significant improvements to the running ways used by buses will reduce trip times, ensure safe access to the bus, and generally increase service reliability, which our surveys tell us is so important to customers. The plan establishes several types of priority corridors where improvements would range from traffic signals that give priority to buses, to bus-only lanes with high-quality transfer centers. On selected high-use routes, a new type of service called RapidBus is proposed that offers a quality of service comparable to rail transit without the need for rail tracks. It is designed to provide very frequent service using special buses, to operate on separate right-of-way to the extent possible, and to provide up-to-the-minute transit service information at attractive stations. An example of what can be achieved by bus service and facility improvements can be found in the Dulles Corridor, where the combination of increased locally operated and Metrobus service, transit centers with parking, and the priority lanes provided by the Dulles Access Road has resulted in a 150% increase in ridership since 1998.
These improvements are planned in two phases: Near Term (from 2004 to 2010) and Long Term (from 2011 to 2025). Near Term improvements will meet immediate needs with fairly easy-to-make investments, such as new vehicles for neighborhood circulators or improved bus stop information. Improvements requiring more time or significant investment – such as separate

Washington Metropolitan Area Regional Bus Study
vi
rights-of-way – will be phased in over a longer period. New routes and extended hours of service would be introduced to respond to growth and development during this time and as funds permit.
Specific recommendations by area (state-level jurisdiction) are described in the following sections. More detail on the recommendations for each of five subregions is provided in the Final Operating Plan (Deliverable Z).
District of Columbia The District is at the core of the regional bus system and the service is extensive. The existing service achieves a high level of productivity. Proposed areas for improvement include:
• Improve reliability and reduce travel time in key corridors • Continue to address overcrowding • Increase evening and weekend frequency and extend service hours • Improve crosstown connections • Improve local access and Downtown distribution
Proposed new or improved services (through 2010)
RapidBus service: • Georgia Avenue/Seventh Street Corridor from the Silver Spring Metrorail to Downtown • Wisconsin Avenue/Pennsylvania Avenue Corridor from the Friendship Heights Metrorail
through Downtown to the Naylor Road Metrorail • H Street/Benning Road Corridor from the Minnesota Avenue Metrorail to Farragut
Square • After 2010, additional RapidBus corridors may include:
o 8th Street/Florida Avenue/U Street o Martin Luther King Avenue o M Street (SE/SW) o Connecticut Avenue/Columbia Road
New crosstown services: • Anacostia Metrorail to Georgia Avenue Metrorail via Brentwood Road and the
Washington Hospital Center • Minnesota Avenue Metrorail to Rhode Island Avenue Metrorail via Brentwood Road • Georgia Avenue-Petworth Metrorail to Rosslyn Metrorail via Columbia Heights, DuPont
Circle, and Georgetown • Bethesda Metrorail to Rosslyn Metrorail via Wisconsin Avenue
Extended crosstown services: • Extend Crosstown Line (H2,3,4) to Friendship Heights and Bethesda • Extend Military Road Crosstown Line (E2,3,4) to Bethesda

Final Report
vii
Activity center circulators: • Implement a Downtown circulator (subject of a separate ongoing study) • Extension of the Navy Yard Shuttle Line to Union Station, the Convention Center and the
Southwest Waterfront
Proposed facility improvements • Signal prioritization, intersection improvements, enhanced bus stops and better rider
information in the RapidBus service corridors (listed above) and in other priority bus corridors: o Downtown Circulator o 14th Street o 16th Street o Connecticut Avenue
• Improve bus facilities at key Metrorail Stations to facilitate transfers: o Union Station o Minnesota Avenue o Deanwood o Rhode Island Avenue o Brookland/CUA o Georgia Avenue-Petworth
• Reinstate a bus shelter program with specific amenities based on ridership • New/expanded bus garages to support service expansion
Benefits and impacts of the plan • Enhanced service quality in major transit corridors, improved reliability and travel time,
and reduced crowding • Improved access to non-downtown locations • Additional 480,000 annual hours of bus service by 2010, a 32% increase over existing
service • Projected increase of 13.7 million annual bus riders by 2010, a 17% increase • Doubling of transit ridership by 2025 throughout the region • Reduced traffic congestion and contribution to improved air quality in the District and the
region
Maryland1 The inner parts of Prince George’s and Montgomery County are densely developed and have a reasonably high level of service. Montgomery County operates many routes serving almost all developed parts of the county and has several high ridership corridors. Prince George's County is experiencing rapid growth and has significant short and long-term needs for increased service
1 Montgomery and Prince George’s County

Washington Metropolitan Area Regional Bus Study
viii
Proposed areas for improvement include: • Extend service hours and increase evening and weekend frequency • Improve cross-county and circumferential connections • Restructure under-performing routes • Serve high-growth areas • Build ridership in priority corridors
Proposed new or improved services (through 2010)
RapidBus service: • East-West Highway (Montgomery Mall to College Park Metrorail) • Maryland 450/Annapolis Road (New Carrollton Metrorail to Rhode Island Avenue
Metrorail) • Veirs Mill Road (Shady Grove Metrorail to Silver Spring Metrorail) • Georgia Avenue (Montgomery General Hospital to Wheaton Metrorail)
New circumferential services: • Suitland Metrorail to College Park Metrorail via Addison Road, Deanwood, and Prince
George’s Plaza stations • Branch Avenue Metrorail to New Carrollton Metrorail via Forestville, Ritchie, Landover
Mall, and MLK Highway • Extension of J1,2,3 from Silver Spring Metrorail to College Park Metrorail via Langley
Park
Expanded coverage/Neighborhood circulators: • Two new routes in Takoma Park • Neighborhood circulators in Cheverly and Landover Hills • Potomac circulator • Shuttles from Springdale/Glenarden to New Carrollton Metrorail • Oxon Hill shuttle from Kingsway and Lumar to Southern Avenue Metrorail via Rosecroft • Flexible service in Ednor, Damascus, and Bowie/Belair
Restructuring/Expanding existing service: • Comprehensive restructuring of service in the U.S. 29 corridor (Montgomery County)
and in Bowie/Belair (Prince George's County) • Improved efficiency in Greenbelt and Hyattsville • Extended span of service on 27 Metrobus lines, 36 Ride On routes, and 11 The Bus
routes • Improved frequency of service on 18 Metrobus lines, 9 Ride On routes, and 4 The Bus
routes

Final Report
ix
Proposed facility improvements • Signal prioritization, intersection improvements, enhanced bus stops and better rider
information in: the RapidBus service corridors (listed above) and the following other priority bus corridors: o I-270 o University Boulevard o New Hampshire Avenue o Randolph Road o U.S. Route 1 o MLK Jr. Highway o Iverson Street/Silver Hill Road
• Improve bus facilities at key Metrorail Stations to facilitate transfers: o Takoma o Wheaton o Bethesda o Shady Grove o White Flint o Rockville o New Carrollton o College Park o Naylor Road
• Construct/expand transit centers at other locations o Plum Orchard Road o Montgomery College o White Oak o Montgomery General o Langley Park o Randolph Road o Laurel o Bowie Park & Ride o Market Place o Pointer Ridge o Indian Head Highway o Iverson Mall
• New/expanded bus garages to support service expansion
Benefits and impacts of the plan • Enhanced service quality in major transit corridors, expanded span of service, improved
frequency and coverage • Improved cross-county and circumferential connections • Additional 349,000 annual bus hours of service, an increase of 21.8%
o 21% of that increase for creating RapidBus high frequency 7 day per week overlay service on existing high ridership routes
o 14% for new fixed-route bus services o 7% for new circulator and shuttle services

Washington Metropolitan Area Regional Bus Study
x
o 58% for existing service modifications and circulators. • Projected increase in annual bus passenger trips of 27% or 16 million by 2010
o 7 million riders in Prince George's County o 9 million riders in Montgomery County
• Doubling of transit ridership by 2025 throughout the region • Reduced traffic congestion and contribution to improved regional air quality
Northern Virginia2 Northern Virginia has a number of travel markets that are unserved or underserved. Some corridors are served by very long regional routes and some routes have inconvenient neighborhood diversions. Transit service has not kept pace with the rapid growth in the Outer Virginia service area. Finally, several major activity centers have limited connections to Metrorail.
Proposed areas for improvement include: • Modify routes to reduce travel time and simplify route structure • Develop new routes to serve growth areas, including reverse commute markets • Implement high performance services in heavily traveled corridors • Increase evening and weekend service availability • Increase service frequency on existing routes • Develop community-based circulators using small buses
Proposed new or improved services (through 2010):
RapidBus service: • Columbia Pike • Dulles Corridor (as proposed in a separate study) • After 2010, additional RapidBus corridors may include:
o Shirley Highway Express o Richmond Highway o Extension of Columbia Pike RapidBus to Chantilly via Little River Turnpike/US 50
New local routes: • Old Town Alexandria • Cameron Station to Old Town • Alexandria crosstown route • Annandale – East Falls Church via Little River Turnpike/Leesburg Pike • Tysons Corner – Dulles Town Center via Leesburg Pike • Centreville – City of Fairfax via US 29
2 For the Regional Bus Study, Northern Virginia was divided into two analysis areas: 1) Inner Virginia – Cities of Falls Church and Alexandria, and Arlington County; 2) Outer Virginia – City of Fairfax, and Loudoun and Fairfax Counties.

Final Report
xi
Expanding coverage/neighborhood circulators, shuttles: • Bailey’s Crossroads circulator • Skyline City – Fairlington/Shirlington shuttle • North Arlington flexible service– to replace Metrobus 15 and 22 Lines • Vienna station circulator • McLean – West Falls Church connector • Springfield employer shuttle • Shirley Industrial Park shuttle • Merrifield/Dunn Loring station circulator • Burke Centre subscription routes • Ashburn neighborhood circulators
Restructuring existing service: • Split long, inter-jurisdictional routes to improve travel time and reliability • Add Saturday and evening service on selected routes • Reconfigure Metrobus 16 line service • Bailey’s Crossroads/Culmore local circulator • Extend Metrobus 1 Line to Rosslyn • Extend Metrobus 5A Line to Dulles North park-and-ride lot • Relocate Metrobus 11P Terminus to meet new market needs • Simplify Metrobus 7 and 8 Lines • Extend SmartMover to a McLean park-and-ride lot • Restructure express routes from Chantilly and Centreville to Vienna to expand access for
residents and reverse commuters
Proposed facility improvements • Signal prioritization, intersection improvements, enhanced bus stops and better rider
information in: o RapidBus service corridors o Other priority bus corridors
• New transit center/park-and-rides at Landmark Mall, Southern Towers, and in the I-66, US 50, State 267, and Richmond Highway corridors
• Enhance Metrorail station facilities and other transit centers to encourage transfers • Reinstate a bus shelter program with specific amenities based on ridership • Running way improvements on Columbia Pike and Shirley Highway Corridors • New/expanded bus garages to support service expansion
Benefits and impacts of the plan • Enhances service quality for current customers • Introduces new services to attract new riders and serve growing activity centers • Improves cross-county service and connections between counties • Additional 487,000 annual bus hours of service by 2010, an increase of 55% in Outer
Virginia area and a 29% increase for Inner Virginia area
Washington Metropolitan Area Regional Bus Study
xii
• Projected increase in annual bus passenger trips of 12.3 million by 2010 o 8.8 million riders, a 64% increase, in Outer Virginia o 3.5 million riders, a 21% increase, in Inner Virginia
• Doubling of transit ridership by 2025 throughout the region • Helps reduce traffic congestion and improve regional air quality

Final Report
1
1 Introduction The Regional Bus Study was commissioned in January 2000 by the Washington Metropolitan Area Transit Authority (WMATA) in cooperation with nine jurisdictions, which are served by a combination of Metrobus service and local jurisdictional bus services. The nine jurisdictions are:
• District of Columbia
• Montgomery County, Maryland
• Prince George’s County, Maryland
• Arlington County, Virginia
• Fairfax County, Virginia
• Loudoun County, Virginia
• City of Alexandria, Virginia
• City of Fairfax, Virginia
• City of Falls Church, Virginia
Besides the nine jurisdictions, regional, state and Federal agencies directly participated in the study through a Technical Steering Committee that met eight times before this draft plan was developed. These agencies include:
• Mass Transit Administration of the State of Maryland
• Department of Transportation of the State of Maryland
• Department of Transportation of the Commonwealth of Virginia
• Department of Rail and Public Transportation of the Commonwealth of Virginia
• Northern Virginia Transportation Commission
• Metropolitan Washington Council of Governments
• Federal Transit Administration
The Regional Bus Study was commissioned in response to the findings of a prior Regional Mobility Panel. That study addressed the impacts of a decentralizing trend over the past twenty years, in which jurisdictional bus services grew and Metrobus declined. While there were many positive impacts of the jurisdictional bus services, there were also problems that arose such as duplication of service and lack of coordination of service schedules, fares and user information. The Regional Mobility Panel defined which services are regional in nature and should be provided by WMATA and which services are non-regional in nature and could be provided by either WMATA or local providers at the discretion of the jurisdictions. WMATA also developed a revised cost structure that enabled Metrobus to compete with other potential providers of non-regional service. The Regional Mobility Panel specifically called for a study to be undertaken which would address the current and future needs for bus service throughout the region. The goal was to develop a description of the future bus network of services and facilities regardless of who would provide these services or manage these facilities.

Washington Metropolitan Area Regional Bus Study
2
As the Regional Bus Study was initiated, the regional and local providers continued to improve their services and initiate and advance various regional coordination efforts such as fare coordination. Concurrently, the WMATA Board and Governor of Maryland identified ridership goals that would guide the study direction – The WMATA Board set a goal of doubling transit ridership by 2025 and the Governor of Maryland set a goal of doubling ridership by 2020. WMATA and the various jurisdictions and operators continued to work on a number of short and long range plans. WMATA conducted a Core Capacity Study to address how to meet demand on Metrorail; as the Regional Bus Study progressed, it became apparent that coordination of the two studies would be critically important.
The purpose and goals of the study can be defined as follows:
• Create a more integrated transit network of Metrobus, Metrorail and local bus systems
• Improve system quality and image
• Implement the policy of doubling ridership by 2025
• Respond to the recommendations of the Core Capacity Study to provide bus services that would offer crowding relief for Metrorail and provide better access to Metrorail stations
The Regional Bus Study was conducted by a multi-disciplinary consultant team, led by Multisystems, Inc. The team included specialists in bus planning, transportation engineering, market research, financing, public participation and garage design in order to meet the broad based scope of work. The study scope included the following primary elements:
• Operational Analysis
• Consumer Market Research
• Analysis of Future Markets and Growth
• Public Input and Consensus Building
• Development of Service and Facility Strategies and Costs
• Planning for Operations and Maintenance Bases (Garages)
The various research tasks that laid the foundation for the Plan are described in the next chapter. Chapter 3 provides a summary of the recommended operating plan for the entire region.

Final Report
3
2 Regional Bus Study Methodology The initial stage of the Regional Bus Study included several diagnostic analyses of bus service and travel behavior that provided a foundation for developing the plan for the future bus system. These included a Comprehensive Operational Analysis (COA) of the region’s bus system and Market Research Analysis regarding traveler attitudes and travel patterns. These were accompanied by a technical steering committee and stakeholder review process throughout the project. These tasks are described briefly below.
2.1 Operational Analysis A comprehensive operational analysis of the Metrobus and seven locally provided bus services that operate in the nine-jurisdiction area was conducted. This task included two system-wide analyses as well as a detailed route level analysis.
The former consisted of both peer and trend analyses of system-wide performance measures. Peer metropolitan areas were identified based on similar bus system, transit system and area characteristics; they were Philadelphia, Boston, Chicago, Atlanta and San Francisco. Measures used included the level of service provided (bus and total transit vehicle hours and vehicle miles per capita, bus share of transit vehicle hours and vehicle miles, bus and transit route miles per square mile, weekday vs. Saturday and Sunday vehicle hours and vehicle miles), the consumption of service (bus and transit ridership and passenger miles per capita, passengers per vehicle hour and passenger-miles per vehicle mile), cost effectiveness (cost per passenger and per passenger mile) and efficiency (cost per vehicle hour and per vehicle mile) as well as a contrasting of urban and suburban service. The trend analysis examined these same measures over a period of five years.
The peer analysis concluded that the Washington region provides more bus and transit service per capita than its peers. It also showed that the additional service is skewed toward weekdays and towards suburban areas when compared to other metropolitan areas. While the Washington region achieves a higher rail and total transit ridership, bus ridership is similar to its peers. With similar bus ridership but more bus service than its peers, Washington’s bus service is less productive. Cost-efficiency (expenditure per unit of service) is on par with the peer systems but cost-effectiveness (cost per rider) is not as good due to the greater number of service hours provided. The region’s performance is influenced to a large extent by its largest operator – WMATA’s Metrobus service. Trend analysis showed that service and ridership rebounded after service cuts and fare hikes in FY 96. Productivity and cost per service hour have remained relatively unchanged since FY 95. Since FY 96, farebox recovery remained stable at about 30%. The peer and trend analyses are summarized in study Deliverable L.
The largest share of the effort in this task was devoted to the route level analysis. Working with the Technical Steering Committee, the consultant team developed a set of design and performance measures. The design measures included coverage, span of service, frequency of service, and route travel time. The performance measures included productivity, crowding and reliability. The measures of coverage and reliability were measured on a system-wide basis, while all other measures were evaluated at the route level. Thresholds were developed, also in coordination with the Technical Steering Committee, to evaluate each route. These thresholds varied by type of route.

Washington Metropolitan Area Regional Bus Study
4
The route types included:
• Radial line haul
• Express
• Commuter
• Urban circulator
• Urban crosstown
• Urban feeder/distributor
• Suburban local
• Suburban circumferential
• Suburban feeder/distributor
These thresholds served as diagnostic indicators that service may be deficient in some manner, and that some the subsequent service planning effort would need to consider some corrective action. These thresholds were not assumed to be hard and fast standards that dictated specific actions.
The operational analysis concluded that current weekday service and coverage is good in the urban areas, in inner suburban areas and in areas with large numbers of transit dependents. The key improvements that are needed are:
• Alleviating crowding on many routes in the District
• Increasing productivity on some suburban routes
• Increasing the span of service and the coverage in outer suburbs
• Improving frequency and travel time on certain routes
• Enhancing reliability throughout the bus system
The emphasis among these items varies by subregion. The route analysis is summarized in study Deliverables M and N.
2.2 Consumer Market Research The study included consumer research among both riders and non-riders. This new research was augmented by and built upon prior market research efforts in the region.
2.2.1 Riders An on-board survey of riders on Metrobus, Ride On and The Bus was conducted by the Regional Bus Study consultant team. A similar survey was administered to riders on local bus systems in Virginia by the Northern Virginia Transportation Commission. The combined survey effort included 40,000 bus riders; the sample included weekend as well as weekday riders. The survey provided a demographic profile of riders, travel pattern information including origins and destinations and attitudinal data. A single summary report and origin-destination pattern and transfer analysis based on the combined surveys was developed as a study deliverable.
Among the more interesting findings of the rider surveys is that bus service is viewed quite favorably by riders but not as favorably as Metrorail. As shown in Figure 2-1 below, the most important improvements to be made in the view of riders are on-time performance, frequency of service, service span and crowding. Alleviating crowding was more important to riders in the District, while improving service span and frequency was more important to suburban riders.

Final Report
5
Figure 2-1: Improvements Desired by Bus Riders
2.2.2 Non-Riders Non-riders were interviewed by telephone throughout the region. One thousand interviews were conducted, with special efforts to obtain adequate samples of senior citizens and reverse commuters as well as both urban and suburban riders. One of the most important improvements to non-riders was better information about the services offered. Mirroring the suburban riders, improved frequency was desired. Other key improvements were service that is closer to the origin/destination, more direct service between origin and destination and faster service. Physical amenities were relatively less important to non-riders; better shelters was cited most often among these. (See Figure 2-2 below.)
Besides identifying the characteristics that non-riders perceived needed improvement, the survey analysis included trade-off questions that identified the relative value of certain service attributes in attracting riders. The analysis supported the hypothesis that providing feeder service to Metrorail or to other high quality services with a seamless transfer would attract riders but that there was a strong aversion to conventional bus-to-bus transfers.
49%
31%25%
22%
13% 12% 10% 10% 9% 8% 8% 7%
0%
10%
20%
30%
40%
50%
60%
On-time A
rriva
l
More Freq
uent S
ervice
Longer Hours
Less C
rowding
Closer B
us Stops
Go More
Places
Faster
Service
Better
Shelters
Sched
ule Info/Signag
e
Better
Vehicl
e Conditio
n
Lower Fare
s
Better
Customer
Service

Washington Metropolitan Area Regional Bus Study
6
Figure 2-2: Improvements Desired by Non-Riders
Another significant finding of the analysis was that suburban riders are the largest potential growth market considering the combination of propensity to ride and the size of the non-rider market. Figure 2-3 shows the results of a potential market assessment based on the telephone survey of non-riders. Looking at work trips specifically, we found that half of the new rider potential is among intra-suburban travelers. (The other half of the market works in the core, whether residing in suburban or urban areas.) However, a critical issue is that meeting the minimum service requirements of suburban riders may mean substantial improvements to existing service that could be quite costly. Senior citizen non-riders had a low propensity to ride even if substantial improvements were made; this presumes that these individuals retain their auto-mobility. Reverse commuters are a growing market with a high interest in improved service but still a small share of the non-rider market. The non-rider survey analysis is described in study Deliverable P.
Improvements Desired by Non-Riders
30%
21%18% 16% 16%
13% 13%9%
6%
0%5%
10%15%20%25%30%35%
Better
Informati
on
Better
Shelters
More Conve
nient S
tops
Faster
Service
More Freq
uent S
ervice
Service t
o Destin
ation
Comfortable
Buses
Service
to M
etrorai
l
Better
Reliab
ility

Final Report
7
Figure 2-3: Potential Rider Markets
Suburban 62%
Urban25%
Senior9%
Reverse commuter
4%

Washington Metropolitan Area Regional Bus Study
8
2.3 Analysis of Future Markets and Growth The study included a detailed examination of the impact of anticipated future growth on bus system requirements. Overall, the analysis concluded that the regional core will remain the largest single concentration of jobs but that growth is projected to be greatest in the suburbs, which will account for 83% of the population growth and 71% of the employment growth in the next twenty years. Geographic information system tools were used to represent the current bus network of routes and bus stops and to evaluate current system coverage during peak, midday, evening, Saturday and Sunday time periods. The system coverage was compared to density of households and jobs to determine whether coverage was currently adequate. Thresholds of three households per acre and four jobs per acre were used to identify areas that would support fixed route transit. A density of at least two but less than three households per acre was used to identify areas that would support flexible transit coverage. Projections of population and employment growth based on the Metropolitan Washington Council of Governments regional forecast (Version 6A) were used to identify areas that would support transit in the future but do not support such coverage currently. The analysis showed that there were few areas that would fall into this category.
Supplementing the above analysis of households and jobs, were two more in-depth analyses. One was an analysis of demographic characteristics that support transit such as senior citizen and youth populations, low-income households and low vehicle availability. The other was a compilation of and examination of key employment centers and other activity centers. The study utilized interim information from the ongoing study of regional activity centers being conducted by MWCOG. An important aspect of the analysis was the evaluation of travel to regional activity centers, which will become a more important focus of travel. The key finding was that the catchment area for travel to most regional activity centers is largely confined to a limited radius and that transit service has not offered levels of service that are competitive with the automobile in these markets. This leads to the conclusion that improving service to regional activity centers is an important strategy and that these regional activity centers should then serve as important transfer nodes to facilitate more disperse travel patterns. The GIS analysis of future growth and travel markets is described in Deliverable O; a database of activity centers is included in study Deliverable R. An overall summary of the market for transit in the future based on this analysis and the consumer market research is described in Deliverable S.
2.4 Public Input and Consensus Building Outreach to the public was a critical component of the study from its outset. Two rounds of public outreach and participation were undertaken to provide input into the development of the Draft Operating Plan and a subsequent round took place in June 2002 to obtain public comments on the results. The goals of the outreach effort were to engage the area stakeholders, communicate study issues, obtain stakeholder input, translate stakeholder issues into viable concepts and achieve consensus. Besides meetings with the WMATA Board members, the representatives of the various local jurisdictions and the Technical Steering Committee, methods of engaging the broader public included stakeholder meetings, a web page, a project fact sheet, an upcoming project communiqué and public meetings. The first round of public input consisted of 19 meetings with civic, business, institutional and government interest groups. These

Final Report
9
stakeholders identified a number of critical issues for the Regional Bus Study to address including the following:
Service:
• Extended (earlier and later) service hours • Midday service for seniors, tourists and lunchtime travelers • Better linkage between the activity and employment centers inside the Beltway • Good access to rail and to community destinations • Better coordination between all transit and shuttle services • Updated routing to match current travel patterns • Improved travel time
Information:
• More information at bus stops and rail stations • Subregional and systemwide maps • Better and more user-friendly information (and service) for tourists • More marketing
Amenities:
• Safe access to stops particularly in suburbs • Better lighting • Bus shelters • Clean and reliable vehicles
The second round of stakeholder meetings provided an opportunity for stakeholders to react to initial and evolving service concepts. After these meetings, service concepts were refined.
The third round of public participation took place in June 2002; this round included public meetings in each subregion to obtain comments on the Draft Operating Plan from stakeholders who were involved in earlier steps of the study and from the public at-large.
2.5 Development of Service and Facility Strategies For the purposes of both analysis and service planning, the region was divided into five subregions:
• District of Columbia
• Montgomery County
• Prince George’s County
• Inner Virginia (Arlington County, City of Alexandria and City of Falls Church)
• Outer Virginia (Fairfax County, Loudoun County, and City of Fairfax)

Washington Metropolitan Area Regional Bus Study
10
The division into these subregions enabled the planners to focus on the issues and problems of a particular subregion. Despite the division into subregions, the planning applied consistent methods and approaches and regional issues were also addressed.
The first step of the process (begun in November 2000) was for each subregional service planner to meet with the relevant WMATA and jurisdictional staff to review key issues that had been identified and to review the findings of all prior research tasks. Then the service planners developed documentation of issues and potential solutions. These preliminary service concepts were then reviewed extensively and refined. A qualitative screening process was used to identify those concepts and strategies that should be refined and subjected to detailed evaluation. The screening criteria included the following:
Need:
• Ridership Potential • Addresses Specific Deficiency Identified in the Operational Analysis • Improves Travel Time or Reliability • Provides a Transit Alternative in a Congested Area • Improves Mobility For Transit Dependents • Serves Unserved Growth Area
Opportunity:
• Pursues a Market with High Potential • Creates a More Seamless Network • Improves Operational Efficiency • Has Potential to Foster Economic Development
Feasibility:
• Public Support
• Institutional Barriers and Implementation Time
• Operating and Capital Cost
After applying the above criteria, the concepts that passed the screening were refined and evaluated. The detailed evaluation included estimation of the cost and ridership impacts. In this way, a variety of quantitative measures could be considered for each strategy including:
• Net Increase in Riders
• Net Increase in Operating Costs
• Net Increase in Revenue
• Net Increase in Peak Vehicles Required (as a proxy for capital costs)
The analysis was focused on determining the incremental impact of the strategy. Ridership methods were at a level appropriate for bus service planning, using common industry elasticities for incremental improvements in frequency or travel time, considering likely mode shares and

Final Report
11
market sizes for extended and new services, and considering typical productivities and analogous situations in some cases. Cost methods were based on the current operating costs of Metrobus and local services; operating costs for new non-regional service was calculated using a blended rate since the operator of such service is unknown and is not within the scope of this study. The service strategies evaluation is documented in study Deliverable U. The operating cost methodology is detailed in study Deliverable W.
A similar process was undertaken for capital facilities and systems. A review of the existing passenger facilities, running ways and ITS systems was conducted. Concepts for potential improvements were identified and coordinated with the service planning efforts for each subregion. Refinements were made in response to comments from the Technical Steering Committee, WMATA staff and jurisdictional staff. The costs of the refined concepts were estimated and the results are documented in study Deliverable V.

Washington Metropolitan Area Regional Bus Study
12

Final Report
13
3 Recommended Operating Plan for the Region
3.1 Overview Attracting ridership is the driving force behind the plan. The plan has been designed to address unmet needs and under-tapped ridership markets in the Near and the Long Term and to position the bus system so that it will have the capacity, the structure and the attractiveness to meet growing and changing demand and to serve regional mobility goals.
The overall strategy for the Final Operating Plan consists of the following:
• Provide an array of services matched to the needs of specific market segments
• Use ITS technologies to provide real-time customer information, to increase efficiency of bus operations and to improve service reliability
• Invest in vehicles and facilities that enhance and support bus operations and encourage new ridership.
The Final Operating Plan includes a Near Term Element consisting of specific actions for the period from 2003 through 2010, and a Long Term Element addressing the nature and scale of improvements for the period from 2011 through 2025. The two elements derive from separate but coordinated analyses that are at very different levels of detail. The Near Term Element is designed to be input to detailed service planning and scheduling and programming by the provider agencies, while the Long Term Element is designed to provide a guiding direction and a vision for the future.
The specific plan consists of the following components:
• Service Improvements
o Improvements to the Existing Routes
o New Routes for Changing Markets
o New High Performance Services
• Capital Improvements
o Fleet
o Passenger Facility Amenities
o Running Way Treatments
o ITS Technology
These components are described below.
3.2 Service Improvements 3.2.1 Overview of Strategy The overall strategy behind the service improvement plan is to match services better to the market needs. The primary market needs fall into two major categories – under-served markets and un-served markets.

Washington Metropolitan Area Regional Bus Study
14
For under-served markets, the needs include:
• Better frequency and span of service
• Safer stops and more shelters
• Better customer information
• Improved regional coordination of services
• Better connectivity between/among neighborhoods and activity centers
• Faster and more direct service
Among un-served markets, the needs include:
• Reverse commute service
• Service in new growth areas
• More transit options
The services to meet the needs for the under-served markets revolve around modifications to existing services, while the services to meet the needs of un-served markets revolve around new services that constitute the Family of Services Concept. The modifications to existing services include:
• Better reliability
• Improved frequency
• Expanded availability (span)
• Other route adjustments
The Family of Services concept would include the following innovations:
• Neighborhood and activity center circulators
• A network of RapidBus and other priority corridor services
• Services to alleviate crowding in Metrorail trains, stations and parking facilities
Each new service would have a unique identity and image that would establish these specialty services.
The following section describes these improvements.
3.2.2 Description of Improvements Improvements to the Existing Routes Improvements to existing routes are recommended in order to provide a higher quality of service to existing riders and markets and to attract additional riders in the existing service corridors. Improvements include:
• Frequency
• Span of Service
• Route Restructuring

Final Report
15
Each is described below.
The comprehensive operational analysis (COA) served to identify routes that do not meet a set of design and performance thresholds. Although the thresholds used on the COA are by their nature somewhat arbitrary, within the context of the Regional Bus Study they provided guidance for minimum acceptable service levels.
The resulting recommendations include relatively modest changes to service frequency and span along with proposals for restructuring routes in specific corridors. Some proposed changes address stakeholder requests to serve new markets or underserved areas.
Increased Frequency
Improvements to frequency of service were a direct result of the comprehensive operations analysis, which included a route-by-route evaluation against a set of measures and thresholds developed in consultation with the WMATA staff and Technical Steering Committee. The schedules used as the basis for the recommended frequency changes were those in use during the fall of 2001. In general, the goal for the Near Term was to achieve the level of frequency of service identified in the COA -- service every 15 minutes in the peak and every 30 minutes in the off-peak in the urban areas, and every 30 minutes in the peak and every 60 minutes in the off-peak in the suburban areas -- as shown in Table 2-1. In some cases, routes that did not meet frequency thresholds also did not meet productivity thresholds. Increasing frequency on these routes would result in even lower productivities. Through discussions with the staff and Technical Steering Committee representatives in each jurisdiction, recommendations were developed to increase frequency where productivity permitted. Service frequency increases were also identified to alleviate crowding and to fill in service gaps. The routes with resulting recommendations for increased frequency are shown in Figure 3-1.
In the Long Term, it is anticipated that demand will grow and quality of service can be further enhanced. The COA thresholds for frequency of service in the long term were modified to those shown in Table 3-2.
Extended Span of Service
Improvements to service span were also a direct result of the comprehensive operations analysis, based on the measures and thresholds developed in consultation with the WMATA staff and Technical Steering Committee.
In general, the goal for the Near Term was to achieve the level of span of service identified in the COA as shown in Table 3-1. These included extending service later into the evening, earlier in the morning, and on Saturdays and Sundays. Most weekday span extensions were small in scale. Ridership potential was based on the productivity of the service in the nearest time period with service. In some cases, routes that did not meet span thresholds also had low ridership during the nearest time periods and did not meet productivity thresholds. As a result, span extensions to meet the COA thresholds were not recommended in these cases. Potential ridership on weekends was based examining the relationship between weekday and Saturday or Saturday and Sunday on similar types of routes. Where ridership met thresholds, the weekend service was recommended. Through discussions with the staff and Technical Steering Committee representatives in each jurisdiction, recommendations were developed to increase span where ridership and productivity permitted. The routes with resulting recommendations for increased span are shown in Figure 3-2.

Washington Metropolitan Area Regional Bus Study
16
In the Long Term, it is anticipated that demand will grow and quality of service can be further enhanced. The COA thresholds for span of service in the long term were modified to those shown in Table 3-2.
Table 3-1: COA Service Thresholds SPAN OF SERVICE
Weekday
Type of Service
First AM arrival not later than
Last AM arrival not earlier than
First PM departure not
later than
Last PM departure not earlier than
Radial line haul—Urban 7:00 N/A N/A 22:00
Radial line haul—Suburban 7:00 N/A N/A 20:00
Commuter 7:00 9:00 16:00 18:30
Express 7:00 9:00 16:00 18:30
Urban circulator No specific threshold
Urban crosstown 7:00 N/A N/A 22:00
Urban feeder/distributor 7:00 N/A N/A 19:00
Suburban circumferential 7:00 N/A N/A 18:30
Suburban feeder/distributor 7:00 N/A N/A 19:00
Suburban local 7:00 N/A N/A 19:00
Weekend Saturday Sunday
Type of Service First AM arrival not later than
Last PM departure not earlier
than
First AM arrival not later than
Last PM departure not earlier than
Radial line haul—Urban 7:00 22:00 8:00 22:00
Radial line haul—Suburban 8:00 20:00 8:00 20:00
Urban circulator No specific threshold No specific threshold
Urban crosstown 7:00 22:00 8:00 22:00
Urban feeder/distributor 7:00 19:00 8:00 19:00
Suburban circumferential 8:00 18:00 No service required
Suburban feeder/distributor 8:00 19:00 No service required
Suburban local 8:00 19:00 No service required

Final Report
17
Table 3-1: COA Service Thresholds (continued)
FREQUENCY OF SERVICE
Type of Service
Weekday Peak Period Weekday Off-Peak and Weekend
Urban Classes: Headway not greater than 15 minutes 30 minutes
Suburban Classes: Headway not greater than 30 minutes 60 minutes
Express Routes: Peak period trips not fewer than 4 trips 0 trips
TRAVEL TIME
Type of Service
Ratio of Scheduled End-to-End AM Peak Bus Running Time to Zone-to-Zone Auto Travel Time
All types other than Express 2.0
Express 1.5
PRODUCTIVITY
Type of Service
Weekday
Peak Period
Weekday
Whole Day
Weekday Off-Peak and Weekend
Radial Line Haul Routes: Boardings per VRH 30 24 18
Urban Classes (buses >=30 ft.): Boardings per VRH 30 24 18
Suburban Classes (buses >=30 ft.): Boardings per VRH 15 12.5 10
Express Routes: Boardings per trip 23 23 23
All Classes (buses <30 ft.): Boardings per VRH 12 11 10
CROWDING
Type of Service
Weekday Peak Period Load Factor
Weekday Off-Peak and
Weekend Load Factor
All Classes other than Urban Crosstown and Express 1.2 1.0
Urban Crosstown 1.1 1.0
Express Routes with premium fare 1.0 1.0

Washington Metropolitan Area Regional Bus Study
18
Table 3-2: Long Term Service Thresholds SPAN OF SERVICE
Weekday
COA thresholds Future thresholds
Type of Service
First AM arrival not later than
Last PM departure not earlier than
First AM arrival not later than
Last PM departure not earlier than
Radial line haul—Urban 7:00 22:00 6:00 24:00
Radial line haul—Suburban 7:00 20:00 6:00 22:00
Urban circulator No specific threshold 6:00 24:00
Urban crosstown 7:00 22:00 6:00 24:00
Urban feeder/distributor 7:00 19:00 6:00 20:00
Suburban circumferential 7:00 18:30 6:00 20:00
Suburban feeder/distributor 7:00 19:00 6:00 20:00
Suburban local 7:00 19:00 6:00 20:00
Saturday
COA thresholds Future thresholds
Type of Service
First AM arrival not later than
Last PM departure not earlier than
First AM arrival not later than
Last PM departure not earlier than
Radial line haul—Urban 7:00 22:00 6:00 24:00
Radial line haul—Suburban 8:00 20:00 7:00 22:00
Urban circulator No specific threshold 6:00 24:00
Urban crosstown 7:00 22:00 6:00 24:00
Urban feeder/distributor 7:00 19:00 7:00 20:00
Suburban circumferential 8:00 18:00 7:00 20:00
Suburban feeder/distributor 8:00 19:00 7:00 20:00
Suburban local 8:00 19:00 7:00 20:00

Final Report
19
Table 3-2: Long Term Service Thresholds (continued) SPAN OF SERVICE (continued)
Sunday
COA thresholds Future thresholds
Type of Service
First AM arrival not later than
Last PM departure not earlier than
First AM arrival not later than
Last PM departure not earlier than
Radial line haul—Urban 8:00 22:00 7:00 24:00
Radial line haul—Suburban 8:00 20:00 7:00 22:00
Urban circulator No specific threshold 7:00 24:00
Urban crosstown 8:00 22:00 7:00 24:00
Urban feeder/distributor 8:00 19:00 8:00 20:00
Suburban circumferential No service required 10:00 18:00
Suburban feeder/distributor No service required 8:00 20:00
Suburban local No service required 8:00 20:00
FREQUENCY OF SERVICE
COA thresholds Future thresholds
Area Peak Off-peak Peak Off-peak
Urban 15 30 10 20
Suburban 30 60 15 30

��
��
�� ����
��
�� ��
�������� ��
����
��
��
��
��
��
��
��
��������
����������������
������������
��
���������������� ������������
������������������������
��
����
����
������������
��
��
���� ����
��
��
��
��
��
���� ����
����
�� ��
����
��
��
��
��
��
��
���������
����� �����
��� ����������
��������������������
������
� ��������������������
������������ ���������������������������������������������

��
��
�� ����
��
�� ��
�������� ��
����
��
��
��
��
��
��
��
��������
����������������
������������
��
���������������� ������������
������������������������
��
����
����
������������
��
��
���� ����
��
��
��
��
��
���� ����
����
�� ��
����
��
��
��
��
��
��
���������
����� �����
��� ����������
��������������������
������
� ��������������������
������������ ���������������������������������� �
Washington Metropolitan Area Regional Bus Study
22
Restructuring
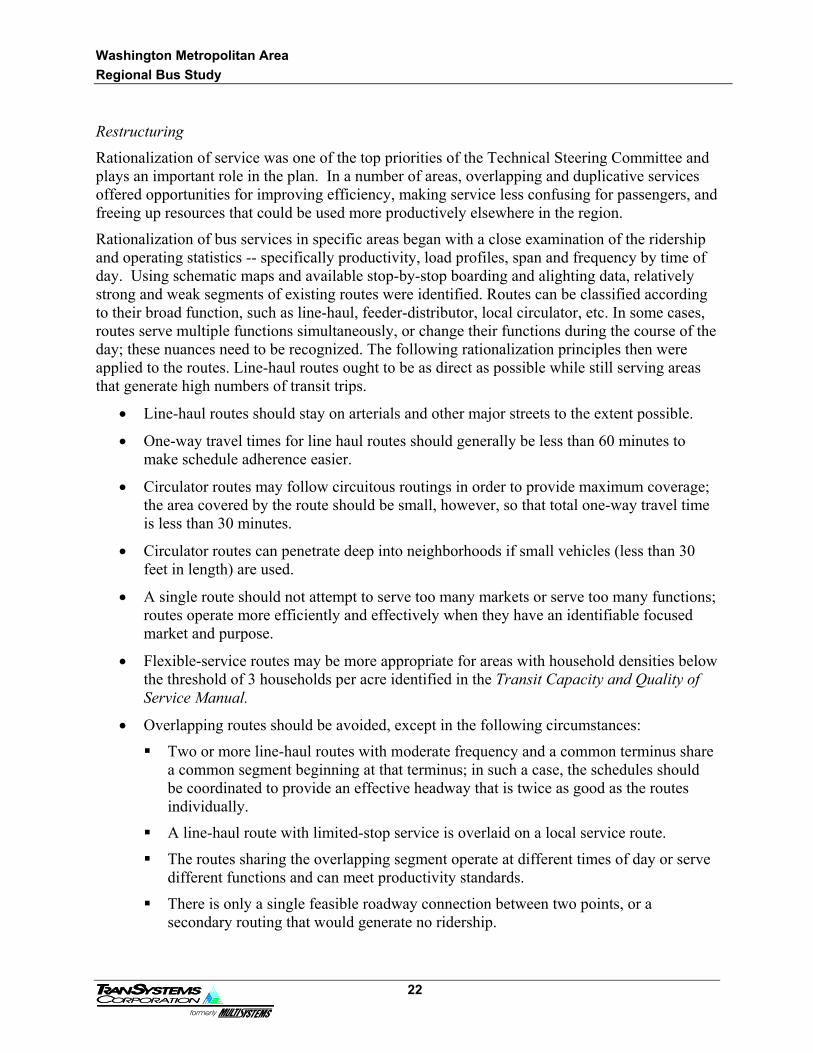
Rationalization of service was one of the top priorities of the Technical Steering Committee and plays an important role in the plan. In a number of areas, overlapping and duplicative services offered opportunities for improving efficiency, making service less confusing for passengers, and freeing up resources that could be used more productively elsewhere in the region.
Rationalization of bus services in specific areas began with a close examination of the ridership and operating statistics -- specifically productivity, load profiles, span and frequency by time of day. Using schematic maps and available stop-by-stop boarding and alighting data, relatively strong and weak segments of existing routes were identified. Routes can be classified according to their broad function, such as line-haul, feeder-distributor, local circulator, etc. In some cases, routes serve multiple functions simultaneously, or change their functions during the course of the day; these nuances need to be recognized. The following rationalization principles then were applied to the routes. Line-haul routes ought to be as direct as possible while still serving areas that generate high numbers of transit trips.
• Line-haul routes should stay on arterials and other major streets to the extent possible.
• One-way travel times for line haul routes should generally be less than 60 minutes to make schedule adherence easier.
• Circulator routes may follow circuitous routings in order to provide maximum coverage; the area covered by the route should be small, however, so that total one-way travel time is less than 30 minutes.
• Circulator routes can penetrate deep into neighborhoods if small vehicles (less than 30 feet in length) are used.
• A single route should not attempt to serve too many markets or serve too many functions; routes operate more efficiently and effectively when they have an identifiable focused market and purpose.
• Flexible-service routes may be more appropriate for areas with household densities below the threshold of 3 households per acre identified in the Transit Capacity and Quality of Service Manual.
• Overlapping routes should be avoided, except in the following circumstances:
Two or more line-haul routes with moderate frequency and a common terminus share a common segment beginning at that terminus; in such a case, the schedules should be coordinated to provide an effective headway that is twice as good as the routes individually.
A line-haul route with limited-stop service is overlaid on a local service route.
The routes sharing the overlapping segment operate at different times of day or serve different functions and can meet productivity standards.
There is only a single feasible roadway connection between two points, or a secondary routing that would generate no ridership.

Final Report
23
• Routes should have consistent and understandable patterns at all times of operation
• Doubling back and retracing steps should be avoided whenever possible.
• Transit centers can increase mobility in suburban areas by facilitating transfers between higher-frequency, shorter routes that would replace low-frequency direct routes.
These principles are general in nature and must be applied with care, taking into account any special or unusual features of the subject area. Application of these principles to an area results in a range of typical service strategies:
• Splitting long routes
• Straightening line-haul routes
• Shifting coverage from line-haul routes to circulator routes
• Separating overlapping routes onto different streets
• Removing instances of doubling back
• Consolidating route patterns (or routes within a line)
• Consolidating service along a segment into one line where service is now split among two or more
• Eliminating very low productivity routes (less than 10 boardings per vehicle revenue hour) and reallocating resources elsewhere
• Restructuring service around new transit centers (and extending routes to reach new activity centers and to improve overall connectivity)
One of the most important improvements in Virginia was the splitting of long routes. The increasingly dispersed development in Virginia has led to the extension of WMATA radial routes from Inner Virginia to Outer Virginia. These long routes are difficult to operate reliably. There was considerable support from the Technical Steering Committee for splitting these long routes into separate services.
The rationalization of service was one of Prince George’s County’s top priorities from the outset of the process of identifying service improvement strategies. In a number of areas of the county, overlapping and duplicative services offered opportunities for improving efficiency, making service less confusing for passengers, and freeing up resources that could be used more productively elsewhere in the county.
Use of Articulated Buses
The use of articulated buses can alleviate current crowding on heavily utilized bus lines without increasing frequency or can reduce the number of buses needed on the most heavily utilized line where frequency has already been increased to address crowding. This is a cost-effective way to address crowding in certain circumstances. Clearly, this strategy is appropriate on bus lines that have very high frequencies. This condition is limited to lines largely in the District of Columbia and on selected corridors in Maryland. Articulated buses are recommended to boost productivity and alleviate crowding on a number of routes in the Near Term period. Articulated buses are also incorporated in the design of some RapidBus corridors. In the Long Term period, articulated

Washington Metropolitan Area Regional Bus Study
24
buses are considered for a larger number of routes. An increase in use of articulated buses is accounted for in the fleet requirements.
New Routes for New Markets
New Fixed Route Coverage and Connections
The plan incorporates new fixed route coverage for those areas that have no fixed route coverage at the present time but whose household and job density would support fixed route service in the future. The study examined the existing fixed route coverage and contrasted the coverage with year 2000 and year 2020 density of households and jobs based on Council of Government projections. The findings were that coverage was quite good and that relatively few areas lacked coverage. Based on COG projections for 2025, the current bus system covers roughly 65% of the area that will have a density sufficient to support fixed route transit (at least 3 households per acre or 4 jobs per acre). The Long Term plan recommendations were based on providing future bus service to cover 95% of such areas; this means covering an additional 7.4% of the region. The number of vehicle hours needed to provide this level of coverage was then estimate. For the Near Term Plan recommendations, specific route restructuring to increase coverage was undertaken in consultation with the jurisdictional and WMATA staff. Besides completely new coverage, the plan incorporates improved connections between key origins and destinations. In each subregion, the need for such improvements was examined and specific adjustments proposed; these are documented in the subregional chapters of this report.
New/Improved Feeder Service
A significant problem the study needed to address was how to improve access to the Metrorail system. WMATA was able to identify Metrorail stations where there is a current or projected future parking capacity problem (this was examined as part of the Core Capacity Study). As the service plans for each subregion evolved, special attention was paid to improving bus access to these stations. Improvements included increased frequency or span of service on existing routes, new routes and re-routing to maximize coverage of feeder routes or remove unnecessary circuity; these are documented in the subregional chapters of this report.
New Circulators and Demand-Responsive Services
Besides traditional fixed route service, the study identified opportunities for new small bus circulator service that would operate on a fixed route, on a flexible route or in a demand-responsive mode. These services were recommended where density would not support conventional fixed route line bus service or where the specific circumstances of urban neighborhoods or activity center development suggested that small bus circulators would be more suited to the environment. In the Near Term recommendations for each subregion, the specific circulator and demand responsive services are described. For the Long Term plan, the number of vehicle hours was estimated for the 6.1% of the region that would not be able to support fixed route bus service but would have the requisite density for flexible services. Figure 3-3 shows the location of proposed circulators and demand-responsive services.

��
��
�� ����
��
�� ��
�������� ��
����
��
��
��
��
��
��
��
��������
����������������
������������
��
���������������� ������������
������������������������
��
����
����
������������
��
��
���� ����
��
��
��
��
��
���� ����
����
�� ��
����
��
��
��
��
��
��
�� ����
�� ��
������
��
����
�� �� ����
������������ ������
�������������������������
��������������
��������������������
������
����������� ��!�"##"
�������������� ����������������������������������������

Washington Metropolitan Area Regional Bus Study
26
New Cross-Regional Services
An analysis of cross-regional service needs was conducted as part of the study. Although in a broad definition, cross regional services could include radial, reverse and circumferential service, we defined cross-regional service to include those services that are circumferential, inter-suburban and inter-subregional. This is because radial and reverse commuter services were evaluated in all subregions, while the inter-subregional and circumferential service required a supplemental analysis. The increasing importance of suburban employment and activity centers has generated more travel between suburban subregions. However, despite the common perception is that many travelers make long trips across the region from one suburb to another, analysis of trip table data for home to work commuting for year 2000 based on COG information (1994 home interview survey data expanded using COG supplied growth factors) indicated that most suburban activity centers draw the great majority of their employees from a limited catchment area that usually within the subregion. As a result, we found that less than 9% of home-based work trips. Three primary cross-regional markets were identified: Montgomery – Prince George’s, Montgomery – Outer Virginia (Tyson’s-Dulles), Prince George’s – Inner and Outer Virginia. Other inter-jurisdiction travel patterns are within defined subregions (Loudoun – Fairfax). WMATA has introduced service in these markets with mixed success. Specific recommendations were made to improve service in these markets. There are opportunities for increasing the service across the Montgomery-Prince George’s County Line since these two areas are highly interactive. Due to the sheer size of the Tyson’s market, the Montgomery/Outer Virginia market focuses on this destination. Some modifications to the Smart Mover (14) services operated in this market were proposed to enhance the opportunity for access to the service for travel in the reverse direction (Virginia to Montgomery). Adjustments were also recommended to expand the market for the N11/13 service between Prince George’s to Alexandria that has not been well utilized.
New High Performance Services New high performance and high-quality services include RapidBus and Premium Express Bus services as described below. The latter would play a role in relieving crowding on Metrorail.
RapidBus
RapidBus service, also known as Bus Rapid Transit (BRT) is a flexible, rubber-tired form of rapid transit that combines stations, vehicles, services, running way, and ITS (Intelligent Transportation System) elements into an integrated system with a unique identity. RapidBus may include a variety of features to minimize travel time and maximize convenience for passengers. These features may include signal priority, dedicated right-of-way, automated and off-vehicle fare collection, automated information systems, low floor buses and/or level boarding and enhanced amenities at stations. Buses can be painted with special graphics to provide a system identity consistent with the rest of the given line’s stations, running ways, etc. The concept of a unique identity is an important element of RapidBus. Just as a rail line has an identity that makes it stand out from the local bus network, this same type of identity is essential to the success of a RapidBus service. This identity provides a landmark for passengers entering the system and also provides an immediate understanding of the areas of the city or region served by the RapidBus service. Physical improvements to help provide this identity include unique bus shelters, special markings in the street such as a painted traffic lane or bus pad area, unique vehicles, unique signing, and detailed information (including real time information) on schedules and routings available at the station/stop.

Final Report
27
Running way improvements for RapidBus applications may include exclusive right-of-way, though space constraints often make this infeasible, or improvements to enhance roadway operations where exclusive right-of-way is not available. Though desirable, it is not necessary to construct a fully dedicated transitway over the entire distance of a busy corridor to guarantee a high level of speed, safety and reliability. RapidBus applications are designed to be appropriate to the market they serve and their physical surroundings and can be incrementally implemented in a variety of environments, from rights-of-way totally dedicated to transit (surface, elevated, underground) to mixed traffic rights-of-way on streets and highways.
In virtually every fully-integrated, full-feature RapidBus application to date, there has been the same customer, community and developer acceptance observed with the implementation of any high-quality rapid transit mode such as light rail. Implementation of Metro Rapid in LA’s Wilshire-Whittier and Ventura Blvd Corridors has resulted in increases of, respectively, 20% and 50% in total corridor bus ridership.
RapidBus is envisioned in the following application in the Washington region:
• To be overlaid on the conventional bus network • To establish new regional connections • To extend the reach of Metrorail • To build the transit market and influence development
An analysis of potential RapidBus corridors included assessing where running way improvements are physically feasible and which corridors have high enough ridership to justify at least some level of investment to improve the speed of bus operations. Where existing and potential ridership and service frequency combine with running way improvement possibilities, RapidBus service was considered and evaluated to the extent allowed by the data. In a few corridors, data did not permit a thorough analysis, but this does not imply that they are not recommended for implementation in the long range; they should be retained as RapidBus prospects and analyzed later when better data are available.
For each potential route, estimates of ridership and operating cost were developed using a series of spreadsheet models. For ridership, ridecheck data by stop was used to determine the proportion of riders on existing local services who would be able to take advantage of a limited-stop RapidBus route. This proportion was dependent on how many of the stops on the route were designated as RapidBus stops. The spreadsheet calculated how many of the existing riders would switch to a limited-stop RapidBus and how many would remain on the local service. For those switching to RapidBus, a ridership growth factor based on the experience in Los Angeles was applied. For those remaining on the local bus, if the service level was to be cut back in conjunction with the introduction of RapidBus service, the local ridership lost because of the reduction in frequency was estimated.
The supply statistics associated with RapidBus were estimated based on the length of the route, the assumed speed, and the assumed headway. The length was calculated from the geographical information system after the route was digitized. The speed was assumed to be 25% faster than the speed of the local bus routes in the corridor, based on the experience in Los Angeles. A baseline headway of 10 minutes during peak periods and 20 minutes in off-peak periods was used. If the projected loads on the RapidBus would dictate a higher service level, it was increased
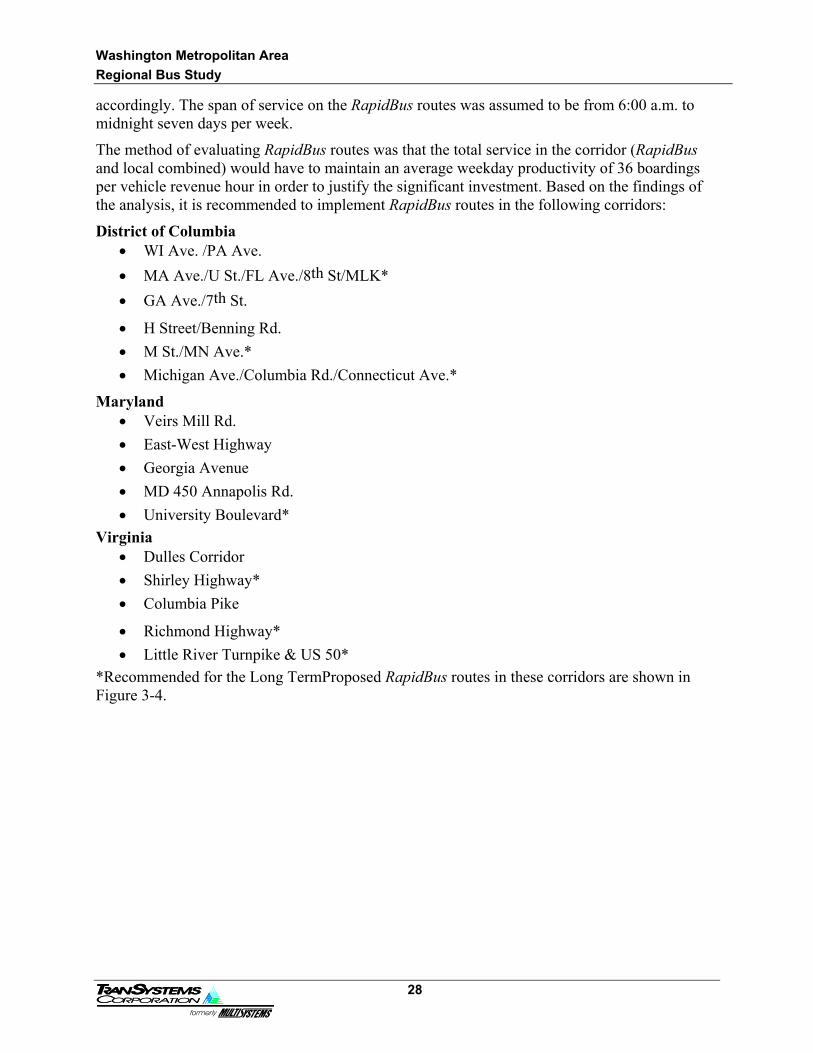
Washington Metropolitan Area Regional Bus Study
28
accordingly. The span of service on the RapidBus routes was assumed to be from 6:00 a.m. to midnight seven days per week.
The method of evaluating RapidBus routes was that the total service in the corridor (RapidBus and local combined) would have to maintain an average weekday productivity of 36 boardings per vehicle revenue hour in order to justify the significant investment. Based on the findings of the analysis, it is recommended to implement RapidBus routes in the following corridors:
District of Columbia • WI Ave. /PA Ave. • MA Ave./U St./FL Ave./8th St/MLK* • GA Ave./7th St.
• H Street/Benning Rd. • M St./MN Ave.* • Michigan Ave./Columbia Rd./Connecticut Ave.*
Maryland • Veirs Mill Rd. • East-West Highway • Georgia Avenue • MD 450 Annapolis Rd. • University Boulevard*
Virginia • Dulles Corridor • Shirley Highway* • Columbia Pike
• Richmond Highway* • Little River Turnpike & US 50*
*Recommended for the Long TermProposed RapidBus routes in these corridors are shown in Figure 3-4.

������������ ������� �������������
��
��
�� ��
��
��
�� ��
�������� ��
����
��
��
��
��
��
��
��
��������
������������
����
��
���� ������
��
��������������
�� ������������
������������������������
��
��
��
����
���� ��������
��
��
����
����
��
��
��
��
��
���� ����
��
��
�� ��
����
��
��
��
��
��
��
���������� ������������������������������������������������ ����������� ��
������ ������������
���� �
��������������� � �!""!
��
����
��
���� ������
��
���������� ����
�� ��
����
��
����
���������� ������
����
����
��
��������
����
��
����

Washington Metropolitan Area Regional Bus Study
30
Express Bus Services
Premium express bus services have a role to play in the region, typically serving commuter markets where significant demand exists between an outlying area and a key employment center (typically in the core) and where travel times via local bus service would be very high. Express service is recommended where rail service is not provided and where high-speed highways offer a significant time advantage for the non-stop segment. Express bus service can operate directly to the destination or to a Metrorail station. Due to the high growth in Outer Virginia and the availability of High Occupancy Vehicle (HOV) lanes on and I-395 (Shirley Highway) and I-66, express services are more common there. Most service operates to the Pentagon where many riders work and many others board Metrorail. In Maryland, express bus service is more limited by the highway and HOV lane system. Traditionally, express bus service has not been operated in parallel with rail service. As described in the next section, there are instances where such service makes sense given overcrowded conditions on Metrorail.
Rail Relief Services
As Metrorail service was implemented over the last quarter century in the Washington metropolitan area, bus service has been restructured to complement Metrorail service. Bus routes play a feeder and distributor role, carrying passengers to and from Metrorail stations. They also serve local travel needs in both urban and suburban areas. Finally, radial bus routes operate in corridors where there is no Metrorail service.
Metro policy has been not to operate bus service that duplicates rail service. This policy has ensured that the investment in Metrorail has been well utilized, that available bus resources are efficiently allocated and that passengers have the opportunity to avoid traffic congestion whenever possible. This policy has served the region well. However, the popularity of the Metrorail system has led to some overcrowded conditions. These problems are being addressed through the procurement and deployment of new rail cars. Despite the deployment of additional rail cars, there are periods of time when capacity will not be sufficient to meet demand. This has led to a reconsideration of Metro policy regarding the operation of parallel bus service (in Metrorail corridors).
As part of the Regional Bus Study, this new role for bus service – relief of crowding on Metrorail -- was studied, in coordination with the “Core Capacity Study”. A series of recommendations were developed and presented to the Metro staff and Board. The approved recommendations are part of this Final Operating Plan and are part of “Core Capacity Study” recommendations.
The objectives of the parallel bus service are:
• Relieve overcrowding on Metrorail • Provide bus travel times competitive with rail • Provide frequency similar to rail during peak periods
The proposed improvements revolve around three basic concepts:
• Operate new express bus services on highways, particularly on HOV lanes • Extend services that terminate at Metrorail stations into downtown • Provide downtown circulation service using buses

Final Report
31
The analysis addressed which Metrorail corridors would lack sufficient capacity and when these problems would occur. The expected delivery dates for new rolling stock and the expected Metrorail operating plan were reviewed. By 2014, 8 car trains will be operated on all lines. However, prior to 2014, additional bus service is needed to address capacity issues. Capacity would be lacking first on the Orange Line at Rosslyn. The recommendations include new bus services parallel to the Orange Line for the period from 2006 to 2010. By 2010, capacity on both branches of the Red Line and on the Green Line (from the south), and Blue/Yellow lines (from the southwest) is exceeded; additional bus services are recommended to address these issues. These recommendations are outlined in the following Table 3-3 and Figure 3-5. A total of 150 buses will be needed to provide rail crowding relief service and this number is accounted for in the Core Capacity Study recommendations approved by the WMATA Board. While standard (40-foot) transit buses would be used in most corridors, service on I-66 to relieve Orange Line crowding would best be provided with over-the-road (“highback”) coaches; the Union Station circulators could be integrated with the Orange Line service if this type of vehicle is considered suitable. Rail crowding relief is just part of the bus service recommendations in the Core Capacity Study; another 480 buses are projected to provide station access services to relieve overcrowded parking facilities and to supplement the parking expansion program.

��
��
����
��
��
�� ��
�� �� ����
��
��
��
��
��
��
��
��
��������
������������
����
��
���� ������
��
���������� ����
�� ������
��
����
��������������������
����
��
��
��
����
���� ��������
��
��
����
����
��
��
��
��
��
���� ����
��
��
�� ��
����
��
��
��
��
��
��
��
���� ����
��
��
����
���� ����
�� ��
����
��
����
����
������ ������
����
��
����
���������
������������� ������������ ������������� �������������� ����������
��������������
�������������
��������������������
������
������������ �!�"#�$%%$
������������ ���������������������������

Final Report
33
Table 3-3: Proposed Rail Relief Bus Services
Rail Line
Corridor Possible Service Description Estimate of AM
Diversions from Rail
Vehicles per hour
Fleet including
Spares
Starting in Year
Annual VRH
Bus Type
Orange West
Express route from Fairfax Govt. Center to Union Station
via I-66 with stops at Vienna, Potomac Park, Farragut, MacPherson, Metro Center, and Gallery Place
2,430
15 28 2006 58,353 Over the Road
Orange WestExpress route from Vienna Metrorail to Crystal City
via I-66 with stops at Rosslyn, Pentagon, and Pentagon City
7406 8 2006 15,159 Over the Road
Orange West
Express route from Reston/Herndon to Union Station
via I-66 with stops at Rosslyn (alternate trips), Potomac Park, Farragut, MacPherson, Metro Center, and Gallery Place
750
8 19 2006 38,410 Over the Road
Orange West
Express route from West Falls Church Metrorail to Union Station
via I-66 with stops at Potomac Park, Farragut, MacPherson, Metro Center, and Gallery Place
1,310
10 15 2006 29,318 Over the Road
Blue SouthwestExpress route from Franconia-Springfield to Farragut Square
via I-395, Rte. 27, Memorial Bridge, Constitution, 18th/19th
5506 12 2010 22,206 Over the Road
Green South
Extend A2, A4 and A7 to Farragut Square
extend A2, A4 and A7 from Anacostia Metrorail to Farragut Square via SE Freeway, 7th, Penn, 11th, and H/I
970
8 12 2010 22,957 Standard
Green South
Re-route W15, W17 to Farragut Square
Modify W15 and W17 to go directly to Farragut Square on South Capitol, M, Maine, 7th, Penn, 11th, and H/I (instead of Southern Avenue Metrorail)
300
6 11 2010 20,086 Standard
Green South
Extend H11 to Farragut Square
Extend H11 from Naylor Road Metrorail to Farragut Square on Suitland Parkway, South Capitol, M, Maine, 7th, Penn, 11th, and H/I
220
6 11 2010 21,256 Standard
Green South
Extend K12, K13 to Farragut Square
Extend K12, K13 from Suitland Metrorail to Farragut Square on Suitland Parkway, South Capitol, M, Maine, 7th, Penn, 11th, and H/I
420
6 12 2010 22,808 Standard
Green South
Extend C11 to Farragut Square
Extend C11 from Branch Avenue Metrorail to Farragut Square on Branch Ave., Suitland Parkway, South Capitol, M, Maine, 7th, Penn, 11th, and H/I
670
6 13 2010 25,022 Standard
Red EastUnion Station H Street distributor
Distributor route from Union Station to Potomac Park on Mass. Ave., H/I St., and 18th/19th
45012 0 2010 10,921
Standard or same as Orange
Line
Red EastUnion Station L'Enfant Plaza distributor
Distributor route from Union Station to L'Enfant Plaza and Smithsonian. Via I-395
1406 0 2010 3,997
Standard or same as Orange
Line
Red WestConnecticut Avenue Limited
limited stop service from Chevy Chase Circle along Connecticut, H/I, and 11th to Federal Triangle
5806 9 2010 17,997 Standard
TOTAL 9,530 101 150 308,491

Washington Metropolitan Area Regional Bus Study
34
3.2.3 Phasing Near Term This Final Operating Plan emphasizes changes in bus service during the Near Term, that is, the period between 2004 and 2010. For this time period, it is reasonable to propose very specific bus service changes. Such changes were developed with the current system deficiencies in mind, as well as an understanding of emerging concerns. The analysis began with a “wish list” of possible improvement strategies developed in coordination with both WMATA and jurisdictional planners. Then these strategies were subjected to a screening evaluation that consisted of a qualitative assessment relative to several criteria. The evaluation process was described in Section 2.5. Based on the screening evaluation, some strategies were dropped from further consideration. The remaining strategies were refined and evaluated quantitatively before a final determination as to the status of each. Once the quantitative evaluation was completed, strategies were recommended for Near Term implementation, for consideration as part of the Long Term plan or they were not recommended. If a strategy was recommended for inclusion in the Long Term plan, it is described in this Final Operating Plan as such. However, it should be emphasized that the specific strategies recommended for inclusion in the Long Term plan do not constitute the entire Long Term plan but just some specific elements that would be part of the overall Long Term vision.
Within the Near Term period, we have recommended which changes are high-priority and should be addressed first. The determination of which services are high priority was made based on the expected performance measures and several qualitative factors; WMATA and jurisdictional staff were consulted. It is expected that the determination of priority will undergo further review by the staff and in consultation with the public. Furthermore, since the plan has been developed without taking into account specific budget constraints, it is likely that further prioritization will be needed to match recommendations to funding availability.
Long Term The Long Term was defined as the period from 2011 to 2025. For this period of the plan, it is not reasonable to conduct detailed bus service planning. The approach to this period of the plan was to create a vision of the bus system of the future and to quantify the major parameters such as fleet size, types of vehicles, types of service, total vehicle hours, operating budget and required facilities and systems. As a result, the Long Term plan does not consist of specific route recommendations except in the case (described above) where a specific service change was evaluated for consideration in the Near Term period and which upon more detailed examination was recommended for inclusion instead in the Long Term plan.
3.2.4 Resources and Impacts Vehicle Hour Impacts
The vehicle hour impacts of the Near and Long Term plans are shown in Figure 3-6. Note that the total number of additional vehicle hours for the region is 1.2 million by 2010 (the Near Term) (a 29% increase over Year 2000) and 4.2 million by 2025 (a 100% increase). The largest improvements in the Near Term occur in the District where the largest amount of existing service is located and in Virginia where growth has occurred in recent years but where transit service has not kept pace with this growth. By 2025, the number of vehicle hours operated in Montgomery
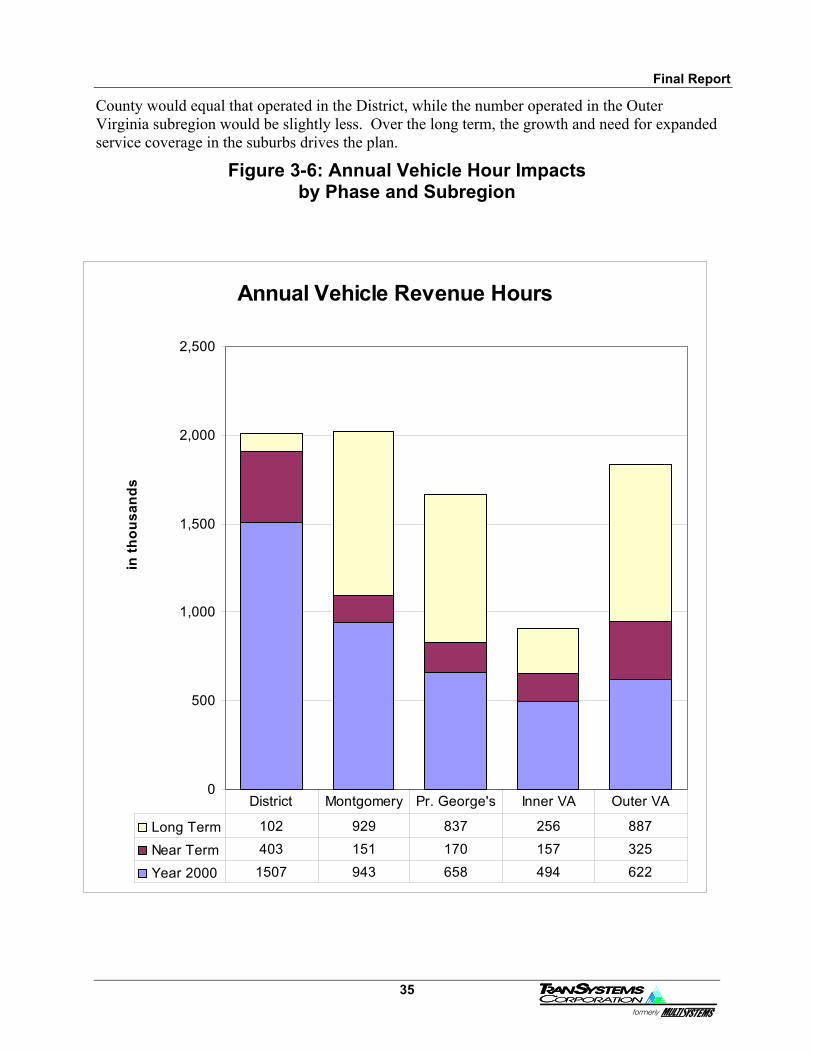
Final Report
35
County would equal that operated in the District, while the number operated in the Outer Virginia subregion would be slightly less. Over the long term, the growth and need for expanded service coverage in the suburbs drives the plan.
Figure 3-6: Annual Vehicle Hour Impacts by Phase and Subregion
Annual Vehicle Revenue Hours
0
500
1,000
1,500
2,000
2,500
in th
ousa
nds
Long Term 102 929 837 256 887
Near Term 403 151 170 157 325
Year 2000 1507 943 658 494 622
District Montgomery Pr. George's Inner VA Outer VA

Washington Metropolitan Area Regional Bus Study
36
The Near Term improvements by subregion and by type of improvement are shown in Figure 3-7. Figure 3-7a shows that the largest share of vehicle hours for improvements is proposed for the District and for Outer Virginia. Figure 3-7b shows that the largest share of service improvements is due to new fixed routes, followed by RapidBus improvements and modifications to existing service, which have approximately equal shares. The smallest share of vehicle hours is due to circulators and demand responsive services.
Figure 3-7c provides more detail on the emphasis on types of improvements by subregion. The greatest number of opportunities for RapidBus services was found in the District, followed by Montgomery County and Inner Virginia. The Dulles Corridor Bus Rapid Transit project, which is already planned, is not included in the chart. In Outer Virginia, besides the Dulles Corridor project, the greatest opportunities for improvement were identified for neighborhood and activity center circulator services (both fixed and flexible) and new north-south cross-county bus routes. As a result, the chart clearly shows that the majority of increased service for the District consists of new RapidBus routes, while the majority of increased service for Outer Virginia consists of new conventional and circulator routes. In Prince George’s County, the Near Term emphasis was on span and frequency improvements to bring the level of service on par with the remainder of the region.
Figure 3-7: Annual Near Term Vehicle Hour a. by Subregion
in thousands
402.6
151.5170.1
156.9
325.4
District Montgomery Pr. George's Inner VA Outer VA

Final Report
37
Figure 3-7: Annual Near Term Vehicle Hour Impacts b. by Type of Improvement
in thousands
315.7
166.0
417.2
307.5
Rapid Bus Circulators
New Fixed Route Modification to Existing
c. by Subregion and Type of Improvement
0
50
100
150
200
250
300
350
400
450
in th
ousa
nds
Modifications to ExistingService
13 70 104 32 89
New Fixed Routes 130 22 34 80 150
Circulators 59 3 16 2 86
Rapid Bus 200 57 16 43 0
District Montgomery Pr. George's Inner VA Outer VA

Washington Metropolitan Area Regional Bus Study
38
Operating Cost Impacts Over the plan period, the operating costs for bus service will be affected by a number of factors. The first factor is inflationary cost increases. Even if there were no service increases, the cost of providing bus service would increase due to growing costs for wages, benefits, fuel and other resources. Based on past experience and current conditions, the cost estimates for the Regional Bus Study have assumed that a 2.13% annual growth rate from 2000 to 2002 and a 3% annual inflation factor after 2002 is to be expected.
The second factor is service increases due to background growth. Since population and employment growth is expected to continue and since increasing traffic congestion will encourage higher transit mode shares, there are expected to be ridership increases even without service improvements. To accommodate this ridership, some services will need to be increased; other services will be able to accommodate additional riders with available capacity.
The third factor influencing operating costs is the list of service improvement strategies. For the Near Term, these service improvements are specified in some detail. For the long term, they are rougher estimates of the amount of service that will need to be provided. The operating costs were estimated based on the number of annual service hours to be provided and the nature of the service. Modifications to existing service were assumed to reflect the costs of the current operators. Consistent with the Regional Mobility Panel recommendations, new regional services were assumed to be operated by Metrobus. New non-regional services were assumed to be operated at a generic non-regional cost per hour that was developed based on a weighted average of the current provider costs across the region. The resulting rates were of course inflated for future years as described above.
The increase in operating costs in year of expenditure dollars is shown in Table 3-4. By 2010, operating costs are anticipated reach $727 million per year for the region compared to $374 million in 2000, an increase of $353 million or 94%. (Note that this total excludes the costs of rail relief bus services which are estimated at $45 million in 2010.) Nearly half of the increase between 2000 and 2010 ($149 million or 42%) is due to inflation. A small part, $15 million (4%), is due to background growth. The largest share, $189 million (54%), is due to service improvements recommended in the plan, including ITS strategies. In current (2002) dollars, these Near Term improvements total only $104 million. Figure 3-8 shows the share by subregion of 2010 operating costs due to the Near Term improvements (excluding costs due to background growth).
As shown in Table 3-4, the plan envisions continued service increases beyond 2010. By 2025, the operating cost for bus service in the region would total $1.55 billion, an increase of $1.17 billion over year 2000 costs. Once again, inflation for the base service is a large factor, particularly over a 25-year time frame; inflation accounts for $441 million or 38% of the increase. Service improvements account for $652 million or 56%. Background growth accounts for only $79 million or 7%. Figure 3-9 shows the growth in annual operating expenses over the period from 2000 to 2025.

Final Report
39
Table 3-4: Operating Cost Estimate (in millions of year of expenditure dollars)
* excluding any rail relief 2014 and after
$815 $523 $374 Current System
$79 $15 Background Growth
$652* $189 Improvements
$1,546 $727 $374 Total Operating Expenses
FY 2025FY 2010 FY 2000 Base

Washington Metropolitan Area Regional Bus Study
40
Figure 3-8: Distribution of Near Term Improvement Operating Costs by Subregion
2010 Operating Cost
District34%
Montgomery14%
Inner Virginia8%
Outer Virginia31%
Prince George's
13%

Final Report
41
Figure 3-9: Growth in Annual Operating Expenses
Annual Operating Expenses
$0
$200,000,000
$400,000,000
$600,000,000
$800,000,000
$1,000,000,000
$1,200,000,000
$1,400,000,000
$1,600,000,000
$1,800,000,000
2000 2005 2010 2015 2020 2025
Total Base Service Background Growth Near Term ImprovementsLong Term Improvements ITS Operating Cost Operating Cost: Rail Relief
Near Term Long Term

Washington Metropolitan Area Regional Bus Study
42
Ridership and Revenue Impacts Consistent with the WMATA Board goal, the Long Term plan envisions a doubling of ridership by 2025. Figure 3-10 shows how each improvement strategy contributes to the additional ridership. A little over one third of the ridership increase would be due to normal growth in the region, based on COG projections. Nearly one third of the ridership increase would result from enhancements to existing services and image, while the remaining one third would be due to new markets.
Figure 3-10: Contributions to Doubling of Ridership
RapidBus, Priority, and Strategic
Corridors8%
Expand fixed-route coverage
23%
Introduce flexible-route service
2%
Enhance image of bus system
8%
Extend span of service
4%
Improve frequency19%
Forecast growth36%

Final Report
43
Ridership in the year 2000 on the entire regional bus system totaled 171.6 million. By 2002, there had already been a 6% increase. By 2010, a total annual ridership of 220.8 million is envisioned as a result of both background growth and Near Term improvements. By 2025, ridership would total 340.8 million including the impact of further background growth and the cumulative impact of the Near Term and Long Term service improvements. Figure 3-11 below shows how bus ridership increases to 2010 (Near Term) and 2025 (Long Term), in two phases, broken down by subregion. (Year 2002 ridership is shown as the base year in this figure.)
It is evident that while the District retains the largest number of riders, the faster rates of growth in ridership are in suburban areas. To a large extent, this simply reflects the COG projections of population and employment growth, which fuel background growth and also influence the Long Term plan improvements designed to accommodate and attract new riders. Outer Virginia (Fairfax and Loudoun Counties and City of Fairfax) grows particularly fast. By 2025, this subregion’s share of bus riders will grow from 8% to 14%. Overall, the majority of riders in 2000 are from inside the Core (District and Inner Virginia), while in 2025 the majority will be from outside the Core.
Figure 3-12a shows the trend in ridership for the entire period addressed by this study. Each component of ridership can be seen as a separate wedge in this chart.
The revenues associated with these passengers are shown in Figure 3-12b; the lumpiness in the curve is due to the assumption that fare increases of 3% would occur every three years. Total annual revenue across the region is estimated to increase from $101.7 million in 2000 to $143.7 million in 2010 and $248.7 million in 2025.
Note that these ridership and revenue figures exclude the effect of rail relief bus services.
Figure 3-11: Growth in Ridership by Subregion Annual Bus Riders
0
20
40
60
80
100
120
140
in m
illio
ns
Long Term 28.6 31.9 26.3 9.7 23.5
Near Term 13.7 7.9 5.7 3.6 8.8
2002 87.5 38.7 23.4 17.3 14.3
District Montgomery Pr. George's Inner VA Outer VA

Washington Metropolitan Area Regional Bus Study
44
Figure 3-12a: Growth in Ridership Annual Passengers
0
50,000,000
100,000,000
150,000,000
200,000,000
250,000,000
300,000,000
350,000,000
400,000,000
2000 2005 2010 2015 2020 2025
Total Base Service Background GrowthNear Term Improvements Long Term Improvements
Near Term Long Term

Final Report
45
Figure 3-12b: Growth in Revenue
Annual Passenger Revenues
$0
$50,000,000
$100,000,000
$150,000,000
$200,000,000
$250,000,000
$300,000,000
2000 2005 2010 2015 2020 2025
Total Base Service Background Growth Near Term Improvements Long Term Improvements
Near Term Long Term

Washington Metropolitan Area Regional Bus Study
46
Net Operating Costs The net operating costs after accounting for revenues are anticipated to increase from $271.8 million in 2000 to $538.5 million in 2010 and $1.30 billion in 2025. The farebox return decreases from 27.2% in 2000 to 21.1% in 2010 and to 16.1% in 2025. These net operating cost and farebox return figures exclude the operating cost and fares associated with the rail relief services which are viewed as part of the rail service.
3.3 Capital Improvements All transit systems have six basic elements: vehicles, services, stops and stations, running ways, operating and maintenance shops and yards, and passenger and operating support systems. The provision of high quality bus service in the Washington region will rely on successfully linking each of these elements into a single integrated system.
The capital improvement recommendations reflect the objectives for the regional bus system developed as the first step in the study. These objectives, reflecting stakeholder, current rider, and non-rider concerns, include:
1. Providing a seamless, easy to use transit system across the region, with coordinated fares, routes, schedules, and marketing among Metrobus, Metrorail, local bus operators, and commuter rail systems.
2. Developing a coordinated range of quality services that are tailored to the needs of the different markets in this highly complex, cosmopolitan region.
3. Providing increased regional mobility for all citizens as well as quality transportation alternatives to the auto.
4. Improving access to, among, and within, regional activity centers.
5. Providing reliable service and more effective customer information.
The fleet and facility recommendations outlined in this section reflect the needs associated with the service changes recommended to address these objectives.
3.3.1 Fleet Fleet Requirements
The following tables show the requirements for additional fleet to implement the plan recommendations over the short and long term. The total number of vehicles in the region is expected to grow from just under 2,000 in the year 2000 to over 2,500 in the year 2010 and to over 3,500 in the year 2020. Table 3-5 shows the fleet requirements by operator. The largest growth in fleet is for Metrobus at 739 vehicles, but the fastest growth is for local providers (60% versus 54% for Metrobus). Metrobus accounts for 46% of the fleet increase while local providers accounts for 23%. The remaining 31% is due to new non-regional service; a specific provider could not be assigned to this new service as part of this study. Based on the Regional Mobility Panel recommendations, new non-regional service may be provided by either Metrobus or local jurisdictional providers, at the discretion of the local jurisdictions.
Table 3-6 shows the fleet requirements by subregion. The largest increases from year 2000 to year 2025 occur in Montgomery County and Outer Virginia, each with over 450 additional

Final Report
47
vehicles. Prince George’s County has the next highest increase at over 360 vehicles. These three “suburban” subregions account for 80% of the additional fleet while the District and Inner Virginia account for only 20%. In the Near Term, the picture is quite different. The largest increase in vehicles by 2010 occurs in Outer Virginia (just over 175) but the next highest is in the District (just under 150). Figure 3-13 shows the growth in fleet size for the region, graphically, so that the relative components of each subregion can be compared.
Fleet Composition The plan will require more diversity in the fleet mix to match the services to be offered. Table 3-7 shows the different types of vehicles and their features and applicability to different services. Table 3-8 shows the anticipated composition of the fleet in the year 2010 and 2025 and how it compares to the current fleet. While standard size buses will continue to be the largest share of the fleet in the future, the share is expected to decline from 87% of the fleet to 80% in 2010 to 69% in 2025. Small buses will grow from 8% to 10% in 2010 to 20% in 2025. The shares of articulated buses and over-the-road coaches are also expected to grow.
Fleet Replacement Besides the need to purchase vehicles associated with the service modifications and expansion envisioned in this study, there will be fleet replacement needs as older vehicles reach the end of their normal life span. Replacement vehicles will also be needed for vehicles purchased to support the plan and for vehicles that exist in the base case. Because WMATA funds vehicle replacement from different sources, we have not identified fleet replacement needs in this plan.
Fleet Costs The cost of fleet acquisition to support the plan is based on unit costs for the various vehicle types inflated to the year of purchase. The assumed costs in 2002 dollars for each type of vehicle are as follows:
• Standard Transit Bus $332,500
• Small Bus $242,600
• Articulated or High Capacity Bus $504,700
• Over the Road Coach $412,500

Washington Metropolitan Area Regional Bus Study
48
Table 3-5: Fleet Requirements by Operator
Table 3-6: Fleet Requirements by Subregion
Year MetrobusLocal
Provider
NewNon-
Regional Total
2000 1,363 599 0 1,962
2010 1,747 655 129 2,531
2025 2,102 958 496 3,556
YearDistrict of Columbia
Mont. County
Prince George’s County
Inner Virginia
Outer Virginia Total
2000 623 455 313 227 344 1,962
2010 768 538 436 267 522 2,531
2025 833 914 674 339 796 3,556

Final Report
49
Figure 3-13: Growth in Fleet Size by Subregion
623 768 833
455538
914313
436
674
227
267
339
344
522
796
0
500
1,000
1,500
2,000
2,500
3,000
3,500
4,000
2000 2010 2025
Outer VirginiaInner VirginiaPrince George’s CountyMontgomery CountyDistrict of Columbia
1,962
2,531
3,556
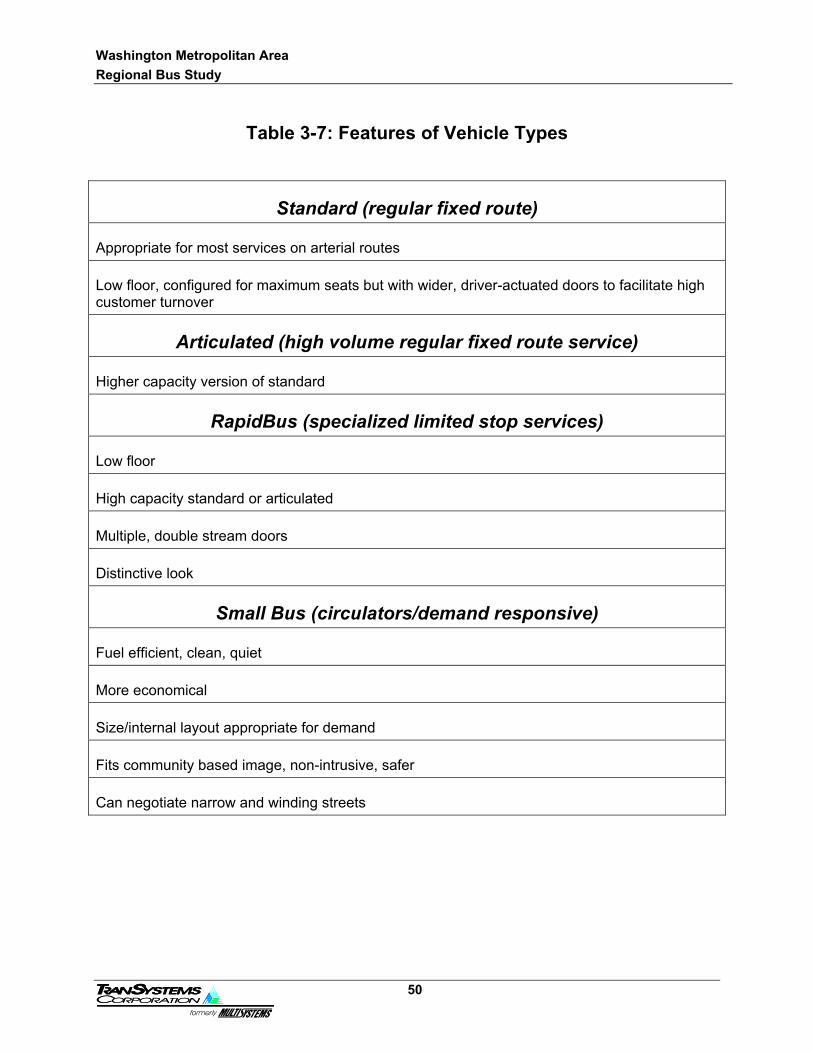
Washington Metropolitan Area Regional Bus Study
50
Table 3-7: Features of Vehicle Types
Standard (regular fixed route)
Appropriate for most services on arterial routes
Low floor, configured for maximum seats but with wider, driver-actuated doors to facilitate high customer turnover
Articulated (high volume regular fixed route service)
Higher capacity version of standard
RapidBus (specialized limited stop services)
Low floor
High capacity standard or articulated
Multiple, double stream doors
Distinctive look
Small Bus (circulators/demand responsive)
Fuel efficient, clean, quiet
More economical
Size/internal layout appropriate for demand
Fits community based image, non-intrusive, safer
Can negotiate narrow and winding streets

Final Report
51
Table 3-8: Fleet Composition
YearArtic. Buses
Standard Buses
Small Vehicles
Over-the-Road
Coaches Total
Number
2000 74 1,707 157 24 1,962
2010 152 2,022 252 105 2,531
2025 266 2,439 720 131 3,556
Shares
2000 4% 87% 8% 1% 100%
2010 6% 80% 10% 4% 100%
2025 7% 69% 20% 4% 100%

Washington Metropolitan Area Regional Bus Study
52
3.3.2 Facilities As recommendations for physical facilites were developed to support the Long Term vision for the regional transit system, four factors influencing future physical facility requirements were taken into account:
• Growing demand at existing facilities
• Specific growth areas
• New types of services designed to meet future demand
• A system structure best able to accommodate future needs
Facility improvements will be contribute to the Long Term vision by making the transit system more seamless and more convenient, fostering increased mobility, improving access and circulation and enhancing the perceived system reliability.
• Seamless Transit System – Creating a more seamless system is a key objective of the Long Term vision. The 2025 transit system would comprise a coordinated network of high capacity routes complemented by a comprehensive set of supporting local and feeder services. This family of services structure would have to be supported by a network of transit centers of different scale and function that would facilitate convenient transfers between different types of services as well as between automobiles and transit. The transit center facilities outlined in the following sections represent an intermediate step toward fully implementing this network.
• Increased Mobility –The regional network of transit centers will allow the system to serve a wider array of origin-destination pairs by supporting transfers between local services and regional services. These could occur both at the origin end of a transit user’s trip and at regional activity center destinations. Running way improvements would be used to support the regional services between major activity centers.
• Improved Access and Circulation – Transit centers will provide access to the regional network of high performance line haul services from local services and improved circulation at activity centers.
• Reliable Service and Good Information – Customer facilities will become key focal points of the regional transit network and the customer information system. The vision incorporates real-time information at stations, stops, and transit centers that keeps riders fully apprised of the status of their bus service. This kind of high quality information is an essential piece of a system that attracts all types of riders, not just transit dependents.
Running Ways As noted earlier, one of the key elements of a transit system is the running way that transit vehicles travel on, whether that running way be a public street or an exclusive guideway for either bus or rail. Running ways are critical to ensuring travel safety, vehicle speed and reliability as well as contributing to system identity. Thus, the primary objectives of running way improvements incorporated in this plan are:
Final Report
53
1. Improve speed and reliability
2. Give buses priority to offer a travel time advantage
3. Leverage highway programs to incorporate transit needs
4. Manage traffic
5. Provide unique identity and image for the service
Among the enhancements to running ways considered in the Plan are:
1. Removing on-street parking during peak service hours of the day
2. Providing signal priority to transit vehicles
3. Providing left hand turn lanes to enhance traffic operations
4. Providing bus only lanes or queue jumpers
The wide diversity in the corridors identified for improvements mean that different right-of-way applications will be feasible in different corridors. In many of the urban corridors, space constraints will limit feasible right-of-way applications to parking restrictions and some left hand turn improvements. In some instances reversible lanes may also be feasible, though space constraints may make even this application difficult. In more suburban corridors, exclusive bus lanes or HOV lanes will be feasible and are recommended. Another right-of-way element is queue jumpers where a lane is provided for the bus to go around long queues of cars at intersections. This allows buses to get through a traffic signal in a single cycle, rather than being forced to sit through multiple cycles while stuck in a long line of cars. Queue jumpers are a relatively low-cost right-of-way application, but one that can be quite effective in enhancing bus travel times. Roadway markings, including potentially a painted lane along the entire corridor, or at the least at each bus stop/station, can be essential elements in providing identity for RapidBus corridors. Improved running way facilities constitute one element of the RapidBus concept, which incorporates a wide range of elements to make RapidBus service more similar to light rail service. Of course, RapidBus services also have the flexibility to utilize existing right-of-way and run in mixed traffic when necessary.
One of the goals of this study was to identify corridors throughout the region with sufficient transit demand to warrant running way improvements to support faster and more reliable transit service. Corridors with daily transit ridership over 5,000 were considered as candidates for running way improvements and other RapidBus treatments in the Near Term time frame (years 2003 – 2010). This threshold was based on the following assumptions:
1. Policy Headway - The foundation for RapidBus (or limited stop service) service is a policy headway of 10 minutes (a frequency of 6 buses per hour in the peak direction). This headway provides a high enough frequency that passengers can arrive at a stop randomly and be assured that there will not be an excessive wait for service.
2. Total Bus Capacity – The assumption is that bus capacity (based on a 40-foot coach) at the peak load point would be 50. This represents a fully seated load plus a small number of standees. Based on this per bus capacity, the hourly capacity provided is 300 passengers per hour (peak direction).

Washington Metropolitan Area Regional Bus Study
54
3. RapidBus Market Share – It was assumed that RapidBus would capture 50% of the corridor market and that 50% of that market would board in the peak four hours (two hours in the morning, two hours in the evening). The total bus capacity in these four hours is 1,200, based on the calculations described in #2, above. The total RapidBus market would then be 2,400.
4. Calculation of Minimum Ridership – The remaining market (50% assumption – 2,400 riders) in the corridor would remain on local buses. The combined local and RapidBus markets result in minimum corridor ridership for RapidBus treatment of approximately 5,000 riders.
Using this ridership figure, candidate corridors for running way improvements for implementation in the Near Term were identified. Field visits were then completed to identify potential physical improvements. The majority of the corridors discussed in the following sections have heavy traffic volumes and space constraints; therefore, the potentially feasible running way improvements in these corridors would be limited to enhancements within the existing roadway cross section and improvements to the corridor signal system to provide bus priority. Recommendations for running way improvements are summarized in Figure 3-14. A total of 230 miles of corridor improvements in twenty-five corridors were identified region-wide. While many of these corridors are proposed for RapidBus service in the Near or Long Term, any of the corridors can be a “priority corridor” that has running way treatments to benefit conventional bus services. They are described by subregion, below:
District of Columbia -The following corridors have been identified as priority corridors in the District of Columbia for the Near Term and Long Term periods:
Near Term:
• Seventh Street/Georgia Avenue • Wisconsin Avenue/M Street
• Pennsylvania Avenue SE • H Street/Benning Road
Long Term:
• 14th Street • 16th Street • M Street (SW/SE) • U Street/Florida Avenue/8th Street • Michigan Avenue/Columbia Road • MLK Jr. Avenue/South Capitol Street • Minnesota Avenue (Between Pennsylvania Ave. and Minnesota Ave. Metrorail) • Massachusetts Avenue – (Between McLean Gardens and Florida Avenue)
These corridors have been combined together for RapidBus routes (for instance one recommended RapidBus service would run along Wisconsin Avenue, M Street, and Pennsylvania Avenue SE).

Final Report
55
Since there are space constraints and heavy traffic volumes in all of these corridors, recommendations focus on:
• Signal priority, queue jumpers
• Parking restrictions, left turn restrictions enhancements
• Corridor identity
Montgomery County - The following corridors have been identified as priority corridors in Montgomery County for the Near Term and Long Term periods:
Near Term: • Georgia Avenue (exclusive busway to Glenmont)
• Frederick Road/Veirs Mill Road/Georgia Avenue (south of Wheaton)
• East-West Highway/Wayne Avenue/Flower Avenue/Piney Branch Road
• Democracy Boulevard, Old Georgetown Road, Wisconsin
Long Term: • U.S 29 (exclusive busway)
• I-270 Transitway
• University Boulevard
• New Hampshire Avenue
• Randolph Road
Since the corridors not designated for exclusive busways generally have space constraints and heavy traffic volumes, recommendations for these corridors focus on:
• Signal priority, queue jumpers
• Parking restrictions
• Left turn enhancements
• Corridor identity
Prince George’s County - The following corridors have been identified as priority corridors in Prince George’s County for the Near Term and Long Term periods:
Near Term:
• U.S. 1
• Annapolis Road (Maryland State Route 450)

Washington Metropolitan Area Regional Bus Study
56
Long Term:
• Martin Luther King Jr. Highway
• Iverson Street/Silver Hill Road/Walker Mill Road
• East-West Highway
• University Boulevard/Campus Drive/Greenbelt Road
• Indian Head Highway (exclusive busway)
• Maryland State Route 5 (exclusive busway)
Since the corridors not designated for exclusive busways have space constraints and heavy traffic volumes, the following strategies are generally recommended for these corridors:
• Signal priority, queue jumpers
• Parking restrictions
• Left hand turn enhancements/restrictions
• Corridor identity
Inner Virginia - The following priority corridors are proposed for running way improvements in Inner Virginia for the Near Term and Long Term periods:
Near Term:
• Columbia Pike
LongTerm:
• Shirley Highway - Exclusive busway with direct connections to Shirley Highway HOV lanes from off-line stations at Lorton, Franconia-Springfield, Duke Street/Landmark, Shirlington, and Pentagon City.
The type of improvements recommended in the Columbia Pike corridor includes:
• Signal priority, queue jumpers
• Parking restrictions
• Left hand turn enhancements/restrictions
• Corridor identity

Washington RegionalBus Study
Regional View
2/22
/02
Fairfax Co.
Loudoun Co.
Prince George's Co.
MontgomeryCo.
Washington, DC
ArlingtonCo.
Alexandria
.-,270
.-,495
.-,95
.-,66.-,66
.-,95
Existing Road Network
Legend
Water Bodies
Rail Lines
Running Way Improvements
0 4 8 Miles
N
Running Way Improvements
Figure 3-14 Recommended Running Way Improvements

Washington Metropolitan Area Regional Bus Study
58
Outer Virginia - The following priority corridors are proposed for running way improvements in Outer Virginia for the Near Term and Long Term periods:
Near Term:
• Dulles corridor – this corridor is already under study (DEIS and preliminary engineering are underway); a staged development is proposed transitioning from BRT (RapidBus) to BRT/rail to rail.
• Long Term: • I-66 corridor - this corridor has been under study; a major investment study has identified
a Metrorail extension as the preferred alternative. A study proposal is to build facilities and transition from BRT to rail per the Dulles model.
• Richmond Highway (U.S. 1) – this corridor has space constraints and heavy traffic volumes; signal priority, left turn restrictions/enhancements, and corridor identity features are proposed. An opportunity may be available to make physical improvements in conjunction with a roadway improvement project in this corridor.
• Little River Turnpike/US 50 – This is an extension of the Columbia Pike Priority Corridor.
The implementation of the above running way improvements would be phased in coordination with the recommended service strategies. Over the Near Term, the emphasis would be on the corridors proposed for RapidBus and other corridors assigned a high priority, including those with opportunities to leverage highway improvements and transit investments.
Customer Facilities Transit centers, park-and-ride lots, stations and stops will play an essential role in enhancing the waiting experience of passengers, supporting efficient bus operations, inducing and supporting transit friendly development, facilitating convenient transfers between different bus lines as well as between bus services and other modes, providing access to the entire multi-modal transit system through the provision of parking capacity, and establishing an identity for different services. Thus, the objectives of customer facility improvements are:
1. Safe and secure access and facilities
2. Improved access for pedestrians, bicyclists
3. Real-time service information
4. Basic customer amenities
5. Improved bus system image and visibility
6. Improved transfer environment
Additional guidance to the planning process was that the recommendations for customer facilities be coordinated across the region and that they leverage any available highway program funds. The customer facility recommendations outlined in this section are presented in a hierarchy based on facility scale. Outlined first is a discussion of bus stops and suggested criteria for bus stop amenities. Second is a discussion of intermodal transfer facilities, including transit centers and park-and-ride lots. This second group of facilities encompasses a wide range of facility type, from small on-street transfer facilities to large off-street transit centers that include layover facilities and potentially additional passenger amenities such as small retail

Final Report
59
centers, transit pass sales outlets, and detailed transit information. Often these large off-street facilities will also be supported by park-and-ride facilities.
Bus Stops and Shelters
Bus stops are the entry point to the transit system for the large majority of the riders in the Washington region but often these stops are of poor design, are inadequate for the number of passengers using them, have poor and sometimes misleading information, and are often not well maintained. It is proposed that a comprehensive and consistent set of standards based on daily boardings be applied region-wide as a means of upgrading this important element of the bus system. Proposed standards are outlined below and in Table 3-9.
It is proposed that all bus stops regardless of passenger volume should have:
• a level concrete pad for waiting passengers.
• reasonable pedestrian access, including a paved access path to the concrete waiting pad and slope that does not exceed 6% over 100 feet. If reasonable access cannot be provided, the stop should be removed.
• adequate lighting, based on existing lighting standards.
• up-to-date and accurate bus stop signs, including an accurate listing of routes using the stop and an accurate information telephone number.
Stops with more than 50 boardings per day (including transfers) should also have a standard shelter and a trash receptacle. Stops with more than 100 boardings per day (including transfers) should also have:
• detailed schedule information, including scheduled times of arrival for each line serving the stop
• a larger shelter, or alternatively, two standard shelters
• a bench(es) in the shelter.
Stops with more than 300 boardings per day (including transfers) should have:
• a system map
• real-time travel information in the longer term.
Stops serving multiple routes with over 500 boardings per day (including transfers) should be examined in greater detail for conversion to a transit center.
A consistent design for bus stops across the region will help to provide a single regional transit identity and will be a step towards realizing the goal of a seamless region-wide system outlined in the Long Term vision.
The Metrobus shelter program has been inactive since the 1980s. It is recommended that Metrobus re-institute a regional shelter program in coordination and cooperation with local jurisdictions. There should be a consistent shelter design theme for the entire system and there should be safety standards that address shelter (and bus stop) location and pedestrian access. It may be most cost-effective to pursue a regional franchise approach where contractor(s) install and maintain shelters.

Washington Metropolitan Area Regional Bus Study
60
An analysis of bus stops with over 500 boardings or 100 transfers (based on available existing data) was conducted to develop the transit center recommendations outlined in the next section. Since the scope of this study precluded an analysis of all bus stops in the region, it is recommended that further analysis be conducted of all bus stops as an implementation activity to apply the above criteria.
Table 3-9: Amenities for Bus Stops by Activity Level
Transit Centers
Transit center functions range from facilitating operations by providing off-street layover space to supporting large numbers of transfers between automobiles and transit and between different transit services. A transit center serving local routes may have simple bus pull-outs, shelters, and detailed system information. Large scale regional transit centers, in turn, can be regional focal points for the transit system and may include large-scale bus facilities, large-scale parking facilities, additional passenger services and information, and may also be foundations for joint development. Ultimately, a network of transit centers throughout the region would support the Long Term vision of a family of services meeting different market needs.
The ideal location and design concept for each transit center will vary as a function of its intended purpose. For example, transit centers that provide park and ride access to express commuter bus services must relate well to freeways and other major highways, especially those
Route map and schedules
Customer Boarding Activity per Day
300 - 500
Real time travel information
System map
Benches in shelter Larger/Multiple shelter(s) Detailed schedule
Trash receptacle
Standard shelter
Bus stop signs
Adequate lighting
Safe access
Level concrete pad
Over 500
100 - 300
50 - 100 < 50
Amenity
Route map and schedules
Customer Boarding Activity per Day
300 - 500
Potential conversion to transit center
System map
Benches in shelter Larger/Multiple shelter(s) Detailed schedule
Trash receptacle
Standard shelter
Bus stop signs
Adequate lighting
Safe access
Level concrete pad
Over 500
100 - 300
50 - 100 < 50
Amenity
Final Report
61
with HOV or bus-only lanes. Other transit centers exist primarily to facilitate transfers between different bus lines by providing a convenient, safe, secure and attractive transfer environment. Having adequate space, good street and highway access and being at the focal point of many different services will be of paramount importance to this type of transit center. The criteria used to site transit centers are outlined below. The relative emphasis placed on the different criteria depends on the particular function of the transit center.
High Activity Location – One of the keys to a transit center’s success is being sited in a high activity location. These locations can provide a focal point for transit-oriented development and often generate their own transit trips. Examples of this type of location are regional shopping centers/edge cities, traditional downtowns, suburban commercial concentrations, hospitals, and inter-city rail and bus stations.
High Transfer Volumes – Ultimately, a transit center is a transfer point of some kind, whether that transfer is between automobiles and a rail line, between buses and Metrorail or commuter rail, among two or more bus lines, between local transit and intercity bus and/or rail, or between pedestrians and bus. A transit center should be located where high numbers of passengers currently transfer or are expected to transfer. This would be at the intersection of many routes and modes serving different markets and functions.
Accessibility to Adjacent Communities and the Transportation System– A successful transit center must be accessible to all modes, including pedestrians, bicycles, automobiles (especially for those centers that have a park-and-ride or kiss-and-ride element to them), and neighborhood circulators. For a transit center that will be predominantly serving auto access trips, high visibility from, and easy access/egress to major roadways is important.
Safety and Security – A sense of security both for passengers and for parked cars and bicycles is essential.
Transit Center Spacing – The spacing of transit centers will be dependent on the type of service structure and markets they are meant to support. If the purpose is to support a system of timed transfers, two key factors will play a role in their location. The first is that the transit centers should be spaced at equal intervals, based on bus run times, ideally 30 minutes apart. This criterion was loosely applied for the recommendations included in this document, but should be considered in developing the regional network in the Long Term if timed transfers are to be scheduled. A second factor is that its catchment area must have sufficient population and commercial development to support a reasonably high level of transit service through or originating at the center. General population standards would be a minimum of 25,000 residents within the location’s catchment area. Closer spacing than that suggested by the above criteria may be appropriate where the arterial grid is more closely spaced together, where there is a regional medical facility or university or a mega activity center or edge city (e.g., Tysons Corner).
Relationship to Congestion on the Highway System - A transit center that is also a park-and-ride should be located in an accessible environment outside the point where highway congestion in the peak direction starts. It would also have a catchment area that represents 10 to 15 minutes drive time to the center, would have adequate population to support express commuter bus services in the peak period (assuming a reasonable work mode share) and demand for off-peak service at policy headways.

Washington Metropolitan Area Regional Bus Study
62
Metrorail Stations - Metrorail stations throughout the region play an essential role as transit centers in facilitating transfers not only between bus and rail but also between different bus routes.
Because of the different functions transit centers play, and the wide range of physical characteristics at the sites of each proposed transit center, identifying a single set of design elements that would be applied throughout the region is not feasible. However, it is possible to identify a range of possible facility elements that could be incorporated into each proposed transit center based on the center’s specific function and site capabilities. These elements may include:
Off Street Bus Bays – If feasible at a proposed site, off-street bus bays can provide a more comfortable and efficient boarding area for riders and a layover space that does not negatively impact local traffic operations or create undue negative environmental impacts (noise, exhaust fumes) on adjacent land uses.
Sheltered Waiting Areas – Sheltered waiting areas are essential means of improving the riders’ overall transit experience. The design of these shelters can contribute to making the transit center a focal point for the transit system and to the overall transit system identity.
Pedestrian and Bicycle Access – A transit center, especially in an urbanized area, should be an integral part of the pedestrian and bicycle circulation system. Safe and convenient walk and bike access to the transit center, including bicycle parking, will be essential to the center’s success.
Dynamic Signage/Information –Detailed information on transit options, service frequencies, and scheduled arrival times should be provided. Real-time information is also recommended. At larger transit centers and park-and-ride facilities, a kiosk could be used to provide timetables, system maps, and pass sales.
Parking - Whether parking is recommended at a transit center is directly related to the function each center will be serving. Parking is not recommended at transit centers serving heavily developed urbanized areas, but is recommended at transit centers that would support high performance service, such as long distance express or RapidBus, generally would have a majority of riders who access the transit center via automobile. With few exceptions, a prototype parking facility of 425 parking spaces is proposed, based on headways associated with high quality services, in conjunction with assumptions on bus loading, access mode shares to transit, and vehicle occupancy.
Kiss-and-Ride and Taxi Facilities – These facility elements are another key component in supporting a transit center that is truly intermodal in nature.
Other Amenities – Depending on the scale and purpose of the proposed transit center, other amenities such as public telephones, vending machines, newspaper machines, and in some instances, a small news and candy stand, may be provided.
Using the location criteria described in the previous section as a framework, and considering the proposed service plans in each part of the region, recommendations for new or enhanced passenger facilities were identified. This identification of required facilities was based on the findings of the demographic, activity center, and service analysis completed in previous steps of

Final Report
63
this study, discussions with WMATA and local jurisdiction planners, and field visits to each of the subregions. Factors used to identify specific transit center needs included:
1. Proposed splits of long regional routes to increase reliability and provide better balance between demand and capacity -- a transit center and layover location may be required to support these splits.
2. Introduction of circulator services as feeders to trunk services -- a facility will be required to support transfers and to provide a layover location for the circulator services.
3. Increased service that would require increased passenger facility/layover capacity at route terminal points.
4. High performance express or RapidBus services that will require parking and terminal facilities.
5. Significant concentrations of employment and retail activity – customer facilities would support access to the activity center as well as circulation within the activity center (many of the existing large activity centers in the region already have a transit center).
6. High transfer activity among one or more between lines.
7. Current or anticipated bus facility capacity constraints at Metrorail stations identified during discussions with Metrobus bus planners and local jurisdictions.
A total of 88 customer facilities are recommended for the region as a whole, 60 of which are recommended for implementation in the Near Term. Some of these are expansions of existing facilities and others are new transit centers or park-and-ride lots. The location and type of recommended customer facilities are shown in Figure 3-15. Note that in addition to transit centers and park-and-rides, there are several corridors where bus stop improvements are recommended and these are denoted in the figure legend as “linear” customer facilities. The distribution of transit centers and park-and-ride facilities by subregion is shown in Table 3-10 and is briefly summarized below.
District of Columbia Improvements focus on three issues: layover facilities, a downtown transit terminal and key corridors. Three off-street layover facilities are recommended in the District of Columbia; these facilities serve terminal points and heavily traveled corridors. Improvements and added bays are required at several Metrorail stations, which function as the transit centers in the District. Besides these locations, there is a need for a downtown facility to serve local, express, and tourist buses. Finally, improvements to bus stops are recommended on a corridor-wide basis for priority corridors and RapidBus corridors.
Montgomery County A review of large activity centers in Montgomery County found that they were well served in terms of customer facilities. However, analysis of bus requirements at Metrorail stations identified a wide range of bus facility needs. The Ride-On Strategic Plan already identifies a large number of proposed customer facilities. Besides these, there is a need for a facility at Plum Orchard Road and Broadbirch in conjunction with proposed service changes and one facility at Montgomery College to serve high passenger volumes there. Finally, enhanced bus stop

Washington Metropolitan Area Regional Bus Study
64
Table 3-10: Recommended Customer Facilities
Short Term Bus Transit Centers
Subregion Without Parking With Parking Total
District of Columbia 8 0 8
Montgomery County 17 3 20
Prince George's County 12 1 13
Inner Virginia 9 0 9
Outer Virginia 9 1 10
Total Region 55 5 60
Long Term Bus Transit Centers
Subregion Without Parking With Parking Total
District of Columbia 3 0 3
Montgomery County 4 2 6
Prince George's County 3 2 5
Inner Virginia 0 1 1
Outer Virginia 6 7 13
Total Region 16 12 28
Total Period Bus Transit Centers
Subregion Without Parking With Parking Total
District of Columbia 11 0 11
Montgomery County 21 5 26
Prince George's County 15 3 18
Inner Virginia 9 1 10
Outer Virginia 15 8 23
Total Region 71 17 88

2/22
/02
#S
#S
#S
#S
#S
#S
#S
#S
#S
#S
#S
#S
#S
#S
#S
#S
#S
#S
#S#S
#S
#S
#S
#S
#S
#S
#S #S
#S#S
#S
#S
#S
#S
#S
#S
#S#S
#S
#S
#S
#S
#S#S#S
#S
#S
#S
#S
#S
#S
#S
#S
#S
#S
#S
#S
#S
#S
#S
#S
#S
#S #S
#S#S
#S#S
#S
#S
#S
#S
#S #S
#S
#S
#S
#S
#S
#S
#S
#S
#S
#S
#S
Fairfax Co.
Loudoun Co.
Prince George's Co.
MontgomeryCo.
Washington, DC
ArlingtonCo.
Alexandria
.-,270
.-,495
.-,95
.-,66.-,66
.-,95
Customer FacilityImprovements
Washington RegionalBus Study
Regional View
N
0 2 4 Miles
Improved#S
Linear#S
New#S
Rail Lines
Water Bodies
Existing Road Network
Customer Facilities
Legend
Figure 3-15 Recommended Customer Facilities
Washington Metropolitan Area Regional Bus Study
66
facilities would be required to support RapidBus initiatives in the county proposed as part of the Regional Bus Study.
Prince George’s County The primary Metrorail bus facility requirements in Prince George’s County are at New Carrollton, College Park, and Naylor Road. Customer facilities are also required at four major activity centers – National Harbor, Laurel, College Park, and Andrews Air Force Base. As a result of the service recommendations included in the plan, three new facilities are required at Bowie Park-and-Ride, Pointer Ridge, and Market Place. Two new facilities are needed at Cheverly and Iverson Mall to serve large numbers of boardings and transfers. Finally, new facilities are needed in the Indian Head Highway, Greenbelt Road, and Maryland State Route 5 corridors to support RapidBus and express bus service recommendations.
Inner Virginia To support service proposals for Inner Virginia, improvements to existing Metrorail bus facilities will be needed at the King Street, Ballston, and Rosslyn Metrorail stations and two new facilities will be needed at Landmark Mall and Southern Towers. Expansion of existing customer facilities will be needed at Shirlington. High passenger volumes also suggest the need for improved facilities at Duke Street and King Street. A review of needs at activity centers identified the need for a new facility at Southern Towers as part of the service recommendations. In addition, customer facilities will be needed to support the RapidBus and priority corridor recommendations at Columbia Pike, Shirley Highway, and Jefferson Davis Highway.
Outer Virginia New customer facilities in the Dulles Corridor are being proposed and are going through the preliminary engineering phase of study including the NEPA process. Besides the Dulles Corridor, needs were identified at both existing Metrorail stations and in support of new service proposals. Four facilities were identified at Metrorail stations including at Huntington and Franconia-Springfield. Facilities are proposed to support the RapidBus service recommendation on Columbia Pike (Bailey’s Crossroads, Annandale) and priority corridors on Richmond Highway and the I-66 corridor (at Stone Road, Stringfellow Road, Fair Oaks Mall, Chain Bridge Road). High passenger volumes call for customer facilities at Seven Corners
Costs of Physical Improvements Table 3-11 shows the capital cost estimates in 2002 dollars for the facility improvements in each subregion, including both customer facilities and running way improvements. For the purposes of this analysis it is assumed the identified parking facilities will need to be constructed and that the land used for parking will need to be purchased. In reality, there may be cases, where existing land or parking lots can be used.

Final Report
67
Table 3-11: Facility Improvement Capital Cost Estimates By Subregion
Near-Term Long-Term Total District of Columbia
Transit Centers $5,084,705 $2,032,650 $7,117,355
Running Way Improvements $5,023,758 $1,610,879 $6,634,636
Total -District of Columbia $10,108,463 $3,643,529 $13,751,991
Montgomery County Transit Centers $18,248,305 $11,892,445 $30,140,750
Running Way Improvements $27,953,667 $54,826,839 $82,780,506
Total - Montgomery County $46,201,972 $66,719,284 $112,921,256
Prince George’s County Transit Centers $12,990,395 $10,939,180 $23,929,575
Running Way Improvements $2,948,727 $70,896,055 $73,844,782
Total - Prince George’s County $15,939,122 $81,835,235 $97,774,357
Inner Virginia Transit Centers $6,831,725 $2,500,000 $9,331,725
Running Way Improvements $1,501,667 $30,000,000 $31,501,667
Total - Inner Virginia $8,333,392 $32,500,000 $40,833,392
Outer Virginia Transit Centers $14,067,540 $27,097,950 $41,165,490
Running Way Improvements $0 $115,167,152 $115,167,152
Total - Outer Virginia $14,067,540 $142,265,102 $156,332,642

Washington Metropolitan Area Regional Bus Study
68
3.3.3 ITS Overall Strategy The Regional Bus Study has identified several critical goals and objectives that must be met in the future in order for current riders and potential riders to be fully satisfied with the bus services provided in the region. Riders indicated that improving on-time performance (service reliability) was the most important service attribute to improve, while non-riders indicated that better information about transit services was most important. Strategic deployment of various intelligent transportation systems (ITS) for transit throughout the region constitutes one way of achieving these goals.
Several innovative ITS systems have been or are being implemented by individual transit agencies in the region (e.g., WMATA’s RideGuide, Ride On’s automatic vehicle location (AVL) system, District of Columbia Division of Transportation and other traffic signal priority demonstrations, Fairfax CUE’s NextBus real-time arrival information system, and WMATA’s SmarTrip program). In some sense, the Washington region has moved to the forefront through the deployment of these ITS projects and the evolving plans for additional ones. The development of the ITS recommendations for the Regional Bus Study began with a review of the current status of ITS in the region (provided by the Metropolitan Washington Council of Governments (MWCOG)) and of WMATA’s ITS Strategic Plan (Phase II). Despite the substantial progress made to date, these individual deployments represent initial implementations of basic technologies that are not integrated in a regional sense. While this is not atypical of other major metropolitan areas in the U.S., the Washington metropolitan area has the potential to be a showplace for further ITS deployment that is integrated across the region. These factors led the Regional Bus Study consulting team to create a strong agenda for transit ITS in the region, which builds on individual agency deployment successes thus far.
The ITS recommendations of the Regional Bus Study are divided into two parts: (1) overall requirements for regional ITS deployment, and (2) specific technology recommendations.
Overall Requirements for Regional Transit ITS Deployment:
• The region must continue to invest in transit ITS technologies that enhance both operations and customer service in order to improve service reliability, provide better information, create a seamless system, offer high quality service and attract new riders.
• Transit ITS strategies must be deployed using a phased approach. This means that key backbone technologies must be deployed before certain other functions can be implemented. For example, an automatic vehicle location (AVL) system must be deployed before real-time arrival information can be provided to the public. And a sound data communication system with sufficient capacity must be deployed before AVL can be implemented. Further, the usefulness of AVL data would be greatly enhanced if a compatible, state-of-the-art scheduling system were implemented in conjunction with or just prior to the deployment of AVL.
• Recognizing that the regional transit agencies may procure ITS from a variety of vendors, regional policy should either require or encourage the purchase of compatible systems that can be easily integrated within the region. There is a clear advantage for all regional transit
Final Report
69
agencies to purchase the same hardware and software, but there are many institutional barriers to achieving this. However, different systems from different vendors can be integrated at the regional level if the specifications are designed to ensure compatibility. Perhaps the best example of this type of regional ITS integration is set forth in the Chicago area’s functional requirements and conceptual design for an Illinois Transit Hub (ITH), a system that would be used to process, format and distribute multi-modal transit information from and to participating agencies (developed recently as part of the Chicago’s Regional Transit ITS Plan).
• Transit agencies cannot accomplish integrated ITS deployment successfully on their own. Besides cooperation among transit providers in the region, coordination with highway agencies will be necessary. State Departments of Transportation (DOTs), specifically the Maryland State Highway Administration, Virginia DOT and District Division of Transportation, should be active partners in the deployment of transit ITS in the region. The current development of a Regional ITS Architecture by the MWCOG requires cooperation, coordination and information sharing among the region’s transit, highway, public safety and other transportation agencies. (The development of The Capital Wireless Integrated Network (CapWIN) also exemplifies the use of a stakeholder-driven process to deploy a regional integrated transportation and criminal justice information wireless network.) The continued deployment of transit ITS should capitalize on this stakeholder-driven process to (1) provide transit with the expertise and guidance of those transportation agencies that have deployed ITS; (2) ensure that transit ITS is fully integrated with other regional ITS; (3) optimize the allocation of limited funds for regional ITS deployment; and (4) ensure that the region has a seamless, multimodal transportation system.
Prioritized Technology Recommendations: 1. Review and Enhance Communications Systems. In the short-term, the local agencies in
each subregion should review the capacity and design of their existing communication systems, and either enhance or replace them as required to provide the transmission of data between dispatch and vehicles within each transit agency.
2. Procure and Deploy AVL. AVL is the backbone of several of the subsequent recommendations that will improve operations and customer service. Further, AVL provides increased safety and security, which has recently become a key transit goal. Combined with specific design strategies, such as splitting routes, agencies that have deployed AVL systems have reported a five to 25% increase in on-time performance. While Ride On and CUE already have AVL, all other regional transit agencies, including WMATA should deploy AVL in the short-term. In the long-term, viewing access must be provided to all of the AVL data in the region, requiring that a data sharing mechanism be developed for the.
3. Procure and Deploy New Scheduling System. A new scheduling system, capable of interfacing with and supporting an AVL system should be implemented at WMATA in the short-term.
4. Procure and Deploy Traffic Signal Priority (TSP). Building on pilot projects in the region, this technology must be deployed in specific corridors to improve service reliability and to support Rapid Bus service concepts. TSP has the potential to improve travel times for Rapid Bus and other limited stop routes by ensuring that the vehicle stays on schedule. Among the candidate corridors for TSP are Wisconsin Avenue and Massachusetts Avenue in

Washington Metropolitan Area Regional Bus Study
70
the District, Veirs Mill Road and University Boulevard in Maryland, and Richmond Highway, Little River Turnpike and Columbia Pike in Virginia.
5. Improve Pre-trip Transit Information. In the short-term, The RideGuide should be enhanced to include services in the region that are not currently included, such as the Loudoun County Commuter Bus service. We also recommend that other regional bus services, such as the Washington Flyer, be added. Once AVL is deployed, the RideGuide should also include real-time information on delays and incidents, and e-mail/cell phone alerts should be provided to customers when there are delays and incidents.
6. Deploy Real-time Transit Information at In-terminal and Wayside Locations3. Deployment of in-terminal and wayside media that display real-time information on bus (and train) arrivals and departures must be provided at key bus stops and transfer locations. This includes real-time bus arrival information at rail transfer locations (outside the fare areas) and real-time rail arrival information at bus transfer locations. The criteria for placing real-time signs at major bus stops may include (1) a large number of passengers boarding at that stop; (2) bus service less frequent than every 15 minutes; and (3) multiple routes operating at that stop. Real-time signs and monitors should be placed at all transit centers.
7. Deploy Transfer Connection Protection (TCP) Capability. Once AVL is deployed on WMATA buses, TCP capability should be deployed intra-agency to ensure that passenger transfers among WMATA buses are protected – thus, improving service reliability from the passenger’s perspective. TCP also facilitates the splitting of routes, creating a more seamless environment for transferring passengers. Passengers may accept transfers more readily once TCP functionality is deployed. TCP should be deployed on selected Metrobus routes with low frequency of service and a high number of transfers. Ride On may also be able to implement this in the short term given its AVL capability. In the longer-term, TCP capability should be extended regionally to include intra-agency and inter-agency trips on transit operations that connect with WMATA service4.
8. Deploy In-Vehicle Transit Information. While WMATA has already deployed annunciation technology on-board many of its buses, the whole WMATA bus fleet should be outfitted with this technology in the short-term. Other regional transit agencies should deploy this technology as well in the short-term. Further, in the long-term, as real-time arrival information is available, it should be provided on-board (e.g., when the bus will arrive at the next stop, and when connecting buses will be arriving at transfer points).
9. Enhance Pre-Trip Transit Information Further. In the long-term, real-time information about parking availability at park-and-ride facilities should be provided via variable message signs (VMS) along the relevant highways, and via portable media (wireless application protocol (WAP)-enabled cell phones. Further, a regional transit information hub that will collect and disseminate transit information for all of the transit services in the Washington area should be considered.
3 This includes the implementation of communication technology to transmit real-time information to in-
terminal/wayside media. 4 This includes the capability for agencies with TCP capability to communicate/exchange data with each other.
Final Report
71
10. Link Transit and Highway Monitoring/Control Facilities. In the long-term, transit agencies in each subregion should link to their subregion’s transportation management center (TMC) (e.g., Montgomery County) in addition to the transit hub. Further, the TMCs in the region should be linked together so that transit and traffic information can be shared among agencies.
11. Enhance/Improve Multimodal Traveler Information. In the long-term, regional travel information should be improved by linking all regional transit agencies’ dispatch centers directly to SmarTraveler (or other contractor) once they have AVL.
One additional ITS system that was recommended by WMATA staff after the aforementioned recommendations were developed is a bus video monitoring system. This system, which should be deployed in the short-term, will enhance safety and security by providing a high-resolution, fixed-mounted digital camera with storage capability on each WMATA bus in a secure enclosure.
Figure 3-16 shows the potential integration of a wide variety of ITS strategies to improve information to the customer and the service provider.
Phased Recommendations Table 3-12 shows a recommendation for specific phasing of the ITS recommendations.
ITS Cost Estimate The capital cost and operating and maintenance cost for each component of the ITS recommendations have been estimated in current year dollars and are presented in Table 3-14 below. The estimated costs for traffic signal priority projects are presented by individual corridor in Table 3-15; these costs were based on costs for a planned project in the Georgia Avenue corridor being undertaken by the District of Columbia. These costs have been incorporated in the financial plan and distributed over the Near Term time period and inflated appropriately. For the Long Term time period, the costs of the additional Long Term signal priority projects were considered and a replacement cost for technology after a 15-year period. These replacement costs were also inflated. The Long Term costs of technology are just meant to be a placeholder in the overall plan budget since they are subject to great uncertainty.

Washington Metropolitan Area Regional Bus Study
72
Real-timeInformation
RegionalTransit
AgenciesRegional Transportation
Management Centers
• Travel times•Congestion monitoring
Vehicle Location and Status
Bus Stop SignTransfer Center Monitor
Vehicle Locationand Status, OtherData and Voice
Variable Message Sign on Highway Ride Guide
Park and Ride Lots
Park and Ride Lots
Status
District VA MD
AVL/CAD Control andCustomer Information Center
On - board Automated Annunciation/ Signage
GPS Satellites
Figure 3-16: ITS Framework for Flow of Information

Final Report
73
Table 3-12: Phasing of ITS Deployment Actions by Agency
Agency
Communications (Review Capacity
and Design)
Actual Communications Systems Upgrade
Scheduling Systems Upgrade AVL/CAD
Transfer Connection Protection
In Terminal/ Wayside
Information
In Vehicle Transit
Information: Annunciation
In Vehicle Transit
Information: Real Time
Bus Video Monitoring
System
WMATA NA Programmed ProgrammedNear Term-High Priority Near Term Near Term Near Term Near Term Near Term
RideOn Near Term-High
Priority Long Term Long Term In place Near Term NearTerm Near Term Long Term Long Term
Fairfax Connector
Near Term-High Priority Long Term Long Term
Near Term-High Priority Long Term Near Term Long Term Long Term Long Term
CUE Near Term-High
Priority Long Term Long Term Near Term-High Priority Long Term Near Term Long Term Long Term Long Term
DASH Near Term-High
Priority Long Term Long Term Near Term-High Priority Long Term Near Term Long Term Long Term Long Term
ART Near Term-High
Priority Long Term Long Term Near Term-High Priority Long Term Near Term Long Term Long Term Long Term
The Bus Near Term-High
Priority Long Term Long Term Near Term-High Priority Long Term Near Term Long Term Long Term Long Term
Regional Actions
Pre-Trip Transit Information:
VMS Parking Information Near Term
Ride Guide and E-Mail Near Term
Regional Transit Hub Long Term
Link Transit and Highway Monitoring and Control Long Term
Multimodal Traveler Information Long Term

Washington Metropolitan Area Regional Bus Study
74
Table 3-13: Transit Signal Priority Recommendations
By Corridor Subregion Length Rapid Bus Phasing
Georgia Ave. (Existing Project) District 4.7 Yes Programmed
Near Term – High Priority:
7th St. (Extension of GA Ave. Corridor) District 2.6 Yes Near Term – High Priority
Extension of J-2 Route (to College Park)* Prince George’s
/Montgomery 9 Yes Near Term – High Priority
Near Term – Not High Priority:
Wisconsin Ave, Penn. Ave. to Branch Ave District 12.1 Yes Near Term
H Street Benning Road (to MN Ave) District 5.1 Yes Near Term
Veirs Mill Rd. (Rockville to Wheaton) Montgomery 13.9 Yes Near Term
Georgia Ave. (Montgomery segment) Montgomery 10.1 Yes Near Term
East West Hwy (Silver Spring to New Carrollton) Prince George’s 5.2 Yes Near Term
MD 450 Annapolis Rd (New Carrollton To RI Ave.) Prince George’s 3 Yes Near Term
Columbia Pike (Braddock to Annandale) Inner/Outer VA 7.8 Yes Near Term
Long Term:
M St. and MN Ave. (Extension of GA Ave. Corridor) District 6.6 Yes Long Term
Mass. Ave., FL Ave, U St, 8th St. & MLK to PG Line District 12.5 Yes Long Term
Michigan Ave., CT Ave District 4.7 Yes Long Term
University Blvd. (extending somewhat into PG) Montgomery 8.8 Yes Long Term
US 1 Baltimore Ave Prince George’s 7.5 No Long Term
Richmond Highway (Ft. Belvoir to Alexandria) Outer VA 4.5 Yes Long Term
Little River Turnpike (Extension of Col Pike Corridor to GMU) Outer VA 4 Yes Long Term
US 50 (Extension of Col Pike Corridor to Chantilly) Outer VA 9.3 Yes Long Term
* East West Hwy in Montgomery; uses other roadways in Prince George’s County
** Reflecting most recent comments from jurisdictions

Final Report
75
Table 3-14: Estimated ITS Costs for Near Term Projects
Cost Item Capital Cost
(millions)
Annual O&M Cost
(millions) Priority
Communications (Review) $ 0.3 $ - Near Term - High Priority
Automatic Vehicle Location (AVL) $ 8.2 $ 0.50 Near Term – High Priority
Traffic Signal Priority (TSP) $ 1.1 $ 0.01 Near Term – High Priority
Traffic Signal Priority (TSP) $ 6.2 $ 0.07 Near Term
Pre-trip Transit Information (Ride Guide Improvements) $ 0.3 $ 0.12 Near Term
Real-time Transit Information $ 25.0 $ 2.85 Near Term
Transfer Connection Protection (TCP) Capability $ 0.1 $ 0.01 Near Term
In-vehicle Transit Information $ 9.6 $ 0.58 Near Term
Pre-trip Transit Information (VMS Parking Info) $ 2.3 $ 0.14 Near Term
*Bus Video Monitoring System $ 13.7 $ 0.83 Near Term
Total for Near Term Projects $ 67.0 $ 5.13 * This is a priority project for WMATA, added to the ITS recommendations of the Regional Bus Study.
**The costs of other ITS projects over the long term have not been estimated on an individual basis, except for traffic signal priority in several corridors estimated at $4.5 million.

Washington Metropolitan Area Regional Bus Study
76
Table 3-15: Signal Priority Costs by Corridor
Corridor SubregionRapid Bus
Revised Timing
Capital Cost (Millions)+
Operating Cost
Georgia Ave. (Existing Project) District Yes Programmed
$0.7--DPW cost, used as basis for
costing others $0.008
7th St. (Extension of GA Ave. Corridor) District Yes Near Term-High Priority $0.66 $0.008
Extension of J-2 Route (to College Park)*
Prince George’s/
Montgomery Yes Near Term-High Priority $0.48 $0.006
Subtotal of Near Term – High Priority $1.13 $0.01 Wisconsin Ave, Penn. Ave. to Branch Ave District Yes Near Term $0.32 $0.004 H Street Benning Road (to MN Ave) District Yes Near Term $0.72 $0.009 Veirs Mill Rd. (Rockville to Wheaton) Montgomery Yes Near Term $1.61 $0.019 Georgia Ave. (Montgomery segment) Montgomery Yes Near Term $1.60 $0.019 East West Hwy (Silver Spring to New Carrollton)
Prince George’s Yes Near Term $0.00 $0.000
MD 450 Annapolis Rd (New Carrollton To RI Ave.)
Prince George’s Yes Near Term $1.39 $0.017
Columbia Pike (Braddock to Annandale) Inner/Outer
VA Yes Near Term $0.57 $0.007 Subtotal of Near Term - Not High Priority $6.21 $0.07 M St. and MN Ave. (Extension of GA Ave. Corridor) District Yes Long Term $1.13 $0.014 Mass. Ave., FL Ave, U St, 8th St. & MLK to PG Line District Yes Long Term $0.73 $0.009 Michigan Ave., CT Ave District Yes Long Term $0.67 $0.008 University Blvd. (extending somewhat into PG) Montgomery Yes Long Term $0.49 $0.006
US 1 Baltimore Ave Prince
George’s No Long Term $0.64 $0.008 Richmond Highway (Ft. Belvoir to Alexandria) Outer VA Yes Long Term $0.45 $0.005 Little River Turnpike (Extension of Col Pike Corridor to GMU) Outer VA Yes Long Term $0.39 $0.005 Subtotal of Long Term $4.51 $0.054 US 50 (Extension of Col Pike Corridor to Chantilly) Outer VA Yes Long Term not costed not costed
* East West Hwy in Montgomery; uses other roadways in Prince George’s County + includes 20% for engineering and 20% for system integration

Final Report
77
3.3.4 Bus Maintenance and Storage Garages As part of the Regional Bus Study, an assessment of current and future maintenance and storage facilities for the bus system was undertaken. The results of this assessment and specific recommendations for expansion of garage capacity are summarized in a separate report – the Regional Bus Study Final Garage Plan. The results are summarized briefly in this section and the associated costs have been incorporated in the cost estimates for the Final Operating Plan.
There are currently 10 Metrobus garages and 8 local garages supporting the bus services in the region. Based on an assessment of the efficient capacity of these garages, the conclusion is that there is currently very little additional capacity to support expansion of the bus fleet in the region. Metrobus garages could accommodate about 217 additional buses. A large part of this additional capacity is at Landover and at Bladensburg assuming its planned expansion and renovation. Local garages have a total additional capacity of 94, almost all of which is at Prince George’s County’s facility. It is clear from this assessment that new garages and/or garage expansion would be needed to support the substantial growth in the fleet that is envisioned in this Final Operating Plan. This lack of capacity is a problem in the very short term as well as in the longer term. For example, it is expected that Metrobus will need to accommodate 300 buses in the next six years. Making the situation even more constrained is the need or desire to close and replace several garages as soon as possible; these facilities are either obsolete or are on land that local jurisdictions want to use for alternative development.
Table 3-16, below, summarize the garage needs over the Long Term. Based on an assessment of future garage options and needs, it has been determined that 9 additional Metrobus garages and 3 additional local garages will be needed for a total of 12 for the region. It is also estimated that 3 existing garages will need to be replaced. The second part of the table shows the expected phasing in of the new garages and the impact on capacity. Locating garages has been very difficult. Metrobus has identified the need to expand garage capacity of the system in the past and has been unable to site new garages. The region has little industrial-zoned land that would be suitable for garage locations and often local jurisdictions have alternative plans for available sites. To address this problem, the recommendations of the Regional Bus Study are to utilize innovative approaches to siting and designing bus garages. Among these are the use of “urban” design to mitigate neighborhood impacts and opposition. This involves more enclosed facilities and indoor parking. Another innovative approach is joint development. This might mean mixed-use development with the private sector or locating garages on WMATA or other government-owned land. For example, garages might be located adjacent to or on air rights over rail yards or might be developed in conjunction with park and ride facilities. They could be located adjacent to or under freeway structures or interchanges. Finally, new bus garages should include special bus-only ramps to provide direct access for buses to the facility that would minimize impact on adjacent areas.
It is clear that new bus garages are critical to the feasibility of the Final Operating Plan and that actions must be undertaken immediately to begin the process of siting and developing this essential element of bus system capacity. As part of the Regional Bus Study, several model garages of various sizes were developed to assess the costs of bus garages and several packages of garage improvements were considered to address the needs. In current (2002) dollars, the costs of such improvements total $596 million, about 17% of which is for land acquisition. About $238 million of the total cost would occur by 2006 and another $133 million by 2012.

Washington Metropolitan Area Regional Bus Study
78
SubregionThru 2006 2007-12 2013-25 TOTAL Thru 2006 2007-12 2013-25 TOTAL
District 1 1 2 250 100 350Montgomery 1 1 2 100 100 200Prince George's 1 1 2 150 100 250Inner Virginia 2 1 3 150 100 250Outer Virginia 1 1 1 3 100 150 150 400TOTAL 4 3 5 12 500 400 550 1450
Number of Facilities Added Capacity
These costs have been incorporated in the financial plan and inflated to year of expenditure dollars and are reflected in the overall costs of capital improvements presented in the next section.
Table 3-16: Garage Needs a. Number of Garages by Subregion and Provider5
Metrobus Local
Subregion Existing New Replacement Existing New Replacement
District of Columbia
4 1 1 0 0 0
Montgomery County6
1 2 0 2 2 0
Prince George’s County
2 2 0 1 0 0
Inner Virginia 3 1 1 2 0 1 Outer Virginia 0 3 0 3 1 0 TOTAL 10 9 2 8 3 1
b. Phasing of New Garages and Capacity
5 Since new non-regional service may be provided by either Metrobus or local jurisdiction providers at the discretion of the jurisdictions, the balance of needs by provider reflected in this table may be subject to change. The above table assumes that Metrobus would provide 100% of the new non-regional service; an alternative assumption that Metrobus would provide only 50% of new non-regional service was also studied and resulted in a somewhat different package of facility improvements. 6 In addition to the two local garages operated by Montgomery County, the County contracts with First Transit to operate 85 County-owned small vehicles out of two contractor-provided facilities.

Final Report
79
3.3.5 Capital Cost Summary The following section provides a summary of the cost estimates for all capital investment aspects of the Final Operating Plan. Assumptions Capital cost estimates reflect recent local and national experience. More specifically, the costs for vehicles reflect recent procurement experience at WMATA. Bus garage costs were based on national experience adjusted to local costs. Technology costs were based on a mixture of local and national experience. Customer and running way facilities were largely based on local experience. Specific assumptions are listed in Table 3-17, below:
Table 3-17: Capital Cost Assumptions
Bus Capital Costs:
- Articulated Bus (2002) $504,665
- Standard Bus (2002) $332,496
- Small Bus (2002) $242,605
- Over-the-Road (2002) $412,500
Annual Capital Cost Increase 3.0%
Bus Life 15
Garage Construction Cash Flow:
- First Year 15%
- Second Year 45%
- Third Year 40%
Annual Land Cost Increase 3.0%
The implementation was assumed to occur uniformly over the two time periods -- Near Term (2004-2010) and Long Term (2011-2025).
Capital Cost Results The total capital cost of the Plan is estimated to be $2.6 billion over the entire plan period in year of expenditure dollars. In the years through 2010, the anticipated expenditures would total $858 million. The breakdown by type of capital item is shown in Table 3-18 below. Note that in the period up to 2010, the largest capital item is for maintenance and storage facilities. This is because there is a lack of adequate capacity to add fleet without these facilities. The next largest item is fleet. After 2010, the emphasis is on fleet followed by running way improvements and additional maintenance and storage facilities.

Washington Metropolitan Area Regional Bus Study
80
Table 3-18: Capital Costs by Type of Item and Phase* Type By FY 2010 FY 2011-2025 Total Fleet ** $259 $670 $929 Customer Facilities $66 $88 $154 Maintenance/ Storage Facilities ** $420 $361 $781 ITS $76 $127 $203 Running Way Improvements $43 $441 $484 Total $864 $1,687 $2,551
*Year of Expenditure (000,000’s) ** Includes $830 million of expenditure identified in the Core Capacity Study as well, including rail relief buses

Final Report
81
4. Next Steps This Final Operating Plan has been prepared without taking into account financial constraints of the operating agencies and jurisdictions responsible for bus service in the region. As a result, the Plan is not a commitment to provide the service but a program of desirable improvements that support the goals of the region and the jurisdictions. Further consultation with the jurisdictions that fund bus service in the region will determine which of the specific improvements can be funded in the Near Term and how much additional funding can be obtained to address the those improvements that cannot be funded under current financial conditions. It is envisioned that the Plan will be refined to reflect financial constraints as well as:
• Public comments on the recommendations • Refinement of priorities and phasing • Results of pre-implementation detailed service planning • New information on needs that arise during the continuing process.
It is clear that implementing the Plan will require considerable cooperation among the agencies responsible for bus service and transportation in the region. This cooperation has been advanced through the Regional Bus Study. It is recommended that a Regional Transit Service Planning Group be established to continue to guide implementation and refinement of the Plan. Activities to be undertaken would include:
• Further discussions with the public and other stakeholders to obtain feedback on service strategies and implementation timing
• Development of an action plan with the local jurisdictions and the Regional Transit Service Planning Group to:
o Develop a priority list of annual service implementation strategies for the Near Term (through 2010)
o Identify service improvements to be implemented as part of the FY 2004 operating budget – Priority Corridors and regional emergency response plan
o Identify capital requirements – vehicles, garages, ITS, customer facilities and amenities – necessary to support recommended service improvements
o Initiate procurement actions during FY 2004 to obtain necessary capital equipment to ensure implementation of the operating program
Based on initial Strategic Plan feedback, integrate the Regional Bus Study, Core Capacity Study, and Transit Service Expansion Plan into one comprehensive transit development program. Such a program would result in:
• Prioritized and integrated rail and bus plan recommendations, along with prioritized projects from the Transit Service Expansion Plan, into a 6-year fundable capital and operating program
• Estimated O&M implications of the 6-year funding program • A comprehensive funding plan (that includes alternative funding sources to the extent
possible) • Prioritized and integrated package of recommendations, along with O&M costs and
revenue projections, in one 6-year Transit Development Program (TDP)