Final Report Perception Platform for Autonomous Vehicles
70
Aalto University, School of Electrical Engineering Automation and Electrical Engineering (AEE) Master's Programme ELEC-E8002 & ELEC-E8003 Project work course Year 2017 Final Report Project #16 Perception Platform for Autonomous Vehicles Date: 22.5.2017 Ville Kukkonen Amin Modabberian Pietu Roisko Pyry Viita-aho Ilmari Vikström
Transcript of Final Report Perception Platform for Autonomous Vehicles

Aalto University, School of Electrical Engineering Automation and Electrical Engineering (AEE) Master's Programme ELEC-E8002 & ELEC-E8003 Project work course Year 2017
Final Report
Project #16 Perception Platform for Autonomous Vehicles
Date: 22.5.2017
Ville Kukkonen
Amin Modabberian Pietu Roisko
Pyry Viita-aho Ilmari Vikström

Information page Students Ville Kukkonen Amin Modabberian Pietu Roisko Pyry Viita-aho Ilmari Vikström Project manager Ville Kukkonen Official Instructor Arto Visala Other advisors Andrei Sandru Starting date 5.1.2017 Completion date 22.5.2017 Approval The Instructor has accepted the final version of this document Date: 24.5.2017
Page 2 of 29

Abstract
Autonomous vehicles have received a lot of media coverage and research attention during the past five to ten years. In an effort to continue the work on developing a teaching and research platform for autonomous vehicles at Aalto University, our project team was tasked with furthering the perception capabilities of an platform equipped with sensors such as a LiDAR and an omnidirectional camera. In addition to calibrating the sensors and integrating them with Robot Operating System (ROS) running on the embedded computer of the platform, some of the fundamental capabilities of autonomous vehicles were implemented. The functional features now include a Simultaneous Localization and Mapping (SLAM) algorithm, capable of mapping the environment and localizing the vehicle within the map; a kinematic model of the vehicle, which provides odometry information derived from the optical encoders on the wheels and steering wheel, further fused with the high quality Inertial Navigation System (INS) information to provide accurate location information; transforming the spherical image feed captured by the omnidirectional camera to a panoramic form for later computer vision applications. In addition, the existing configuration files were centralized to a cohesive package, and the system was refactored to utilize the conventional roslaunch tool for startup, replacing the older shell scripts. While there is still work remaining before the system can truly operate autonomously, the efforts of our project should provide a stable foundation on which to further build the desired features.
Page 3 of 29

Table of Contents Introduction 5
Objective 5
Project plan 5
Milestones 5
Work packages 6
Localization 8
Novatel Inertial Navigation System 9
Kinematic model 11
Simultaneous Localization and Mapping 13
Camera 15
Integration and calibration 15
Panoramic transform 18
LiDAR 19
Calibration 19
Operation 20
Depth-based point cloud segmentation 22
General changes 23
Code reorganization 23
Transform frames 24
Reflection of the Project 26
Reaching objective 26
Timetable 26
Risk analysis 26
Project Meetings 27
Quality management 27
Discussion and Conclusions 28
Page 4 of 29

1. Introduction As a part of an ongoing effort to develop a teaching and research platform for autonomous vehicles at Aalto University, our team was tasked with implementing some fundamental perception capabilities on the platform. Originally purchased in 2013, the Polaris Ranger electric all-terrain vehicle has in previous projects and as part of various master’s theses been fitted with the necessary sensors and actuators that enable it to function autonomously. Previous work includes the physical installation of a LiDAR, an omnidirectional camera, optical encoders for wheels and steering wheel, as well as PLC controllers and actuators capable of controlling the vehicle. Recently, the PLC controllers were connected to the onboard computer via a CAN bus, and the drivers for interacting with the controllers were integrated to Robot Operating System (ROS). However, higher level capabilities were still absent.
2. Objective In an effort to enable the platform to perceive its surroundings, all the sensors needed to be integrated to ROS and calibrated properly. The original objective was to detect standing pedestrians and parked cars, which proved too optimistic. The work items were later refined to include segmenting the point cloud generated by the onboard Velodyne LiDAR and texturizing it with information from the omnidirectional camera, developing a functional kinematic model and fusing the location information with the onboard INS information, as well as utilizing a SLAM algorithm that uses the fused odometry information.
3. Project plan Main points of the project plan are repeated here for context. The full project plan is available as an appendix of this report.
3.1. Milestones
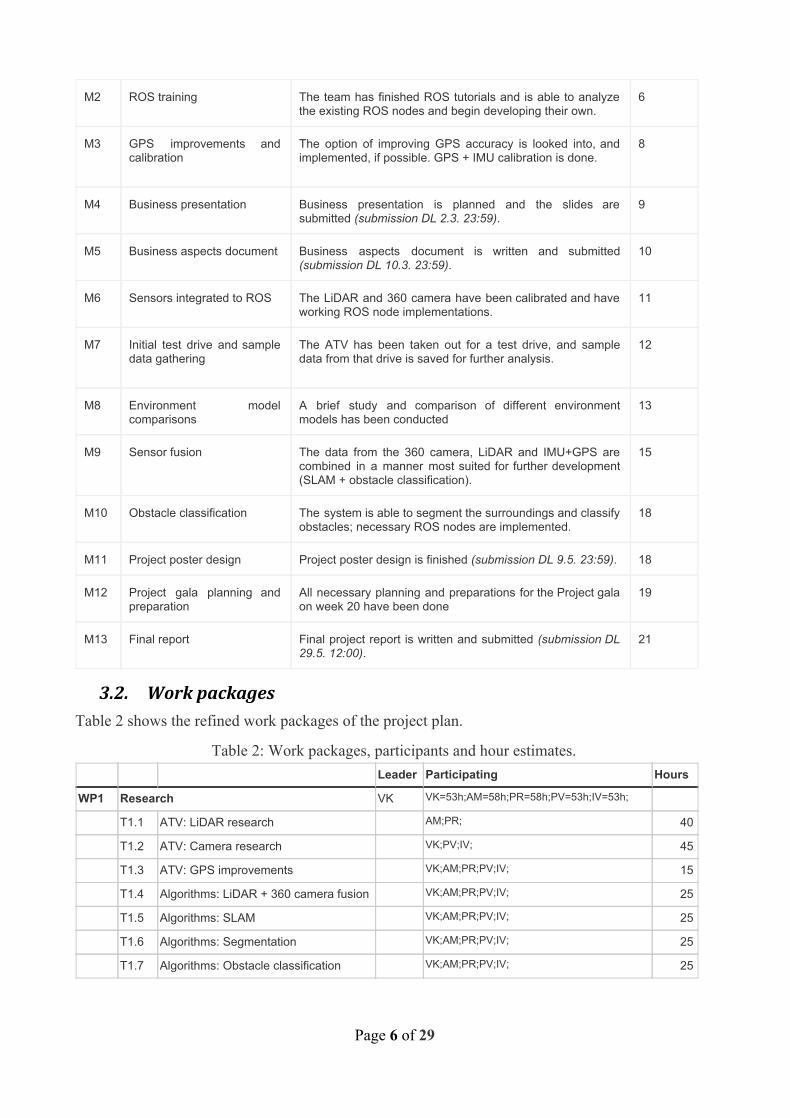
The milestones defined in the project plan are presented in Table 1 below. As can be seen, a considerable amount of time was required and allocated for learning ROS and the existing system, along with the initial integration and calibration. Milestone M9 (Sensor fusion) was completed partially, and M10 (obstacle classification) was not completed at all.
Table 1: Project milestones.
Milestone Description Deadline (week)
M0 Project Plan Project plan is approved and delivered (submission DL 26.1. 23:59).
4
M1 Research Background research is done and the team has working knowledge of the ATV, including the most significant sensors. Also possible algorithms and approaches to sensor fusion for LiDAR + 360 camera have been researched briefly.
6
Page 5 of 29
M2 ROS training The team has finished ROS tutorials and is able to analyze the existing ROS nodes and begin developing their own.
6
M3 GPS improvements and calibration
The option of improving GPS accuracy is looked into, and implemented, if possible. GPS + IMU calibration is done.
8
M4 Business presentation Business presentation is planned and the slides are submitted (submission DL 2.3. 23:59).
9
M5 Business aspects document
Business aspects document is written and submitted (submission DL 10.3. 23:59).
10
M6 Sensors integrated to ROS The LiDAR and 360 camera have been calibrated and have working ROS node implementations.
11
M7 Initial test drive and sample data gathering
The ATV has been taken out for a test drive, and sample data from that drive is saved for further analysis.
12
M8 Environment model comparisons
A brief study and comparison of different environment models has been conducted
13
M9 Sensor fusion The data from the 360 camera, LiDAR and IMU+GPS are combined in a manner most suited for further development (SLAM + obstacle classification).
15
M10 Obstacle classification The system is able to segment the surroundings and classify obstacles; necessary ROS nodes are implemented.
18
M11 Project poster design Project poster design is finished (submission DL 9.5. 23:59). 18
M12 Project gala planning and preparation
All necessary planning and preparations for the Project gala on week 20 have been done
19
M13 Final report Final project report is written and submitted (submission DL 29.5. 12:00) .
21
3.2. Work packages
Table 2 shows the refined work packages of the project plan.
Table 2: Work packages, participants and hour estimates. Leader Participating Hours
WP1 Research VK VK=53h;AM=58h;PR=58h;PV=53h;IV=53h;
T1.1 ATV: LiDAR research AM;PR; 40
T1.2 ATV: Camera research VK;PV;IV; 45
T1.3 ATV: GPS improvements VK;AM;PR;PV;IV; 15
T1.4 Algorithms: LiDAR + 360 camera fusion VK;AM;PR;PV;IV; 25
T1.5 Algorithms: SLAM VK;AM;PR;PV;IV; 25
T1.6 Algorithms: Segmentation VK;AM;PR;PV;IV; 25
T1.7 Algorithms: Obstacle classification VK;AM;PR;PV;IV; 25
Page 6 of 29

T1.8 Business aspects: open source and
perception modules VK;AM;PR;PV;IV; 75
WP2 ROS Training VK VK=16h;AM=16h;PR=16h;PV=16h;IV=16h;
T2.1 Development environment setup VK;AM;PR;PV;IV; 15
T2.2 Tutorials VK;AM;PR;PV;IV; 45
T2.3 Going through existing code VK;AM;PR;PV;IV; 20
WP3 GPS improvements PV VK=15h;AM=15h;PR=10h;PV=10h;IV=10h;
T3.1 Optionally enabling higher accuracy mode, if feasible
PR;PV;IV; 15
T3.2 Pose estimation fixes, if feasible VK;AM; 30
T3.3 GPS + IMU calibration PR;PV;IV; 15
WP4 LiDAR integration AM AM=30h;PR=30h;
T4.1 Calibration AM;PR; 20
T4.2 Sanity check on existing code AM;PR; 40
WP5 Camera integration IV VK=40h;PV=40h;IV=40h;
T5.1 Calibration VK;PV;IV; 30
T5.2 Implementing or integrating ROS node VK;PV;IV; 90
WP6 Odometry fusion VK VK=95h;AM=45h;
T6.1 GPS fix to map frame VK; 50
T6.2 Wheel odometry from atv_can VK;AM; 30
T6.3 Kalman filter VK;AM; 60
WP7 Obstacle detection from point cloud AM VK=40h;AM=40h;
T7.1 Planes, e.g. walls VK;AM; 80
WP8 Combining image data and point cloud PR PR=30h;PV=30h;IV=30h;
T8.1 Mapping pixels to points PR;PV;IV; 90
WP9 Business aspects AM VK=7h;AM=7h;PR=7h;PV=7h;IV=7h;
T9.1 Business presentation preparations VK;AM;PR;PV;IV; 10
T9.2 Business aspects document VK;AM;PR;PV;IV; 25
WP10 Final gala VK VK=10h;AM=10h;PR=10h;PV=10h;IV=10h;
T10.1 Stand etc. design VK;AM;PR;PV;IV; 25
T10.2 Poster design VK;AM;PR;PV;IV; 15
T10.3 Gala preparations VK;AM;PR;PV;IV; 10
WP11 Documentation and reporting VK VK=18h;AM=18h;PR=18h;PV=18h;IV=18h;
T11.1 Ensuring existing documentation quality VK;AM;PR;PV;IV; 15
T11.2 Documenting new features VK;AM;PR;PV;IV; 25
T11.3 Final report VK;AM;PR;PV;IV; 50
Page 7 of 29

4. Localization Localization requires data from odometry and inertial navigation system (INS), which consists of an inertial measurement unit (IMU) and a GPS. A ROS package called robot_localization is used to fuse the different sources of pose information. robot_localization is a collection of state estimation nodes that are implementations of a nonlinear state estimator for robots moving in 3D space. These state estimators are ekf_localization_node and ukf_localization_node, implementing Extended Kalman Filter (EKF) and Unscented Kalman Filter (UKF), respectively. Additionally, robot_localization provides navsat_transform_node, which transforms geographic coordinates of GPS messages to pose information in the robot’s world frame [1].
robot_localization fuses continuous sensor data to produce accurate local state estimates. Additionally it can also fuse data with global pose estimate to provide an accurate global state estimate. Supported message types for state estimation are nav_msgs/Odometry, geometry_msgs/PoseWithCovarianceStamped, geometry_msgs/TwistWithCovarianceStamped and sensor_msgs/IMU. Initial estimate covariance P0 and noise covariance can be configured with Q the parameters initial_estimate_covariance and process_noise_covariance, respectively. Noise covariance can be adjusted with the covariance matrices passed with messages mentioned aboveRk [2][3].
navsat_transform_node converts GPS data to Universal Transverse Mercator (UTM) coordinates. Using the UTM coordinates from the first received sensor_msgs/NavSatFix , a nav_msgs/Odometry to account for movement from the odometry origin, and a sensor_msgs/IMU data to determine the heading of the platform, the node generates a transform from the UTM grid to robot’s world frame, taking into account the movement from the starting location if a GPS fix is not established on system start [2]. The utilized setup is shown in Figure 1.
Figure 1. Block diagram of Polaris Ranger localization.
ekf_localization uses data of kinematic model and INS as inputs to calculate the filtered odometry. Output of the robot_localization is further used with point cloud data to map the environment.
Page 8 of 29

4.1. Novatel Inertial Navigation System Inertial Navigation System (INS) is navigation aid tasked to calculate the position, orientation and velocity of a moving object using a computer (usually a microcontroller), accelerometers (motion sensors) and gyroscope (rotation sensors). These variable are often calculated with dead reckoning algorithm, which will be discussed in section 4.2 [4].
SPAN-IGM-S1 (Synchronous Position, Attitude and Navigation) unit, shown in Figure 2, is located on top plate of the ATV next to the Global Navigation Satellite System (GNSS) antenna. The SPAN-IGM system is the black box which has the center drawn with yellow axis. It internally contains a Novatel OEM615 receiver, shown in Figure 3, which supports both GPS and GLONASS, and an integrated Inertial measurement unit (IMU) with 3 accelerometers and 3 gyroscopes. The antenna (Novatel GPS-703-GGG), shown in Figure 4, is mounted onto the horizontal bar of the car's frame, which supports the top plate.
Figure 2: SPAN-IGM-S1 system, which contains Novatel OEM615 receiver and IMU. [5]
Figure 3: Dual-Frequency GNSS Receiver: OEM615. [6]
Page 9 of 29

Figure 4: GNSS antenna: Novatel GPS-703-GGG. [7]
NovAtel Connect is a GUI tool which was used to visualise the data from the SPAN-IGM-S1 and to calibrate the offset between the antenna and the base unit. A screenshot of the application is shown in Figure 5. [7]
Figure 5: NovAtel Connect window [7]
Antenna offset was measured with respect to the base unit. The information is required for the Novatel SPAN filter. The offset from the base unit to the GPS antenna, in the coordinate frame denoted on the base unit, was measured to be x: 0.210 m, y: 0.170 m, z: 0.092 m.
The Novatel ROS driver was set up to report pose and velocity information with the INSPVA (Inertial Navigation System Position, Velocity and Attitude) messages, detailed in Figure 6, instead of the previously configured BESTUTM (Best available UTM data). Thus, the SPAN filter on the Novatel INS is utilized in the positioning. The SPAN filter requires an aligning procedure, detailed in SPAN-IGM User Manual (OM-20000141) section 3.2.1. Practically this means that until the alignment is done, the odometry readings are not reliable, and with the used Novatel ROS driver the measurements are not reported at all. The alignment requires a good GNSS position and a velocity of at least 5 m/s, where straight line driving is recommended. [8]
Page 10 of 29

Figure 6: INSPVA output definition from SPAN on OEM6 Firmware Reference Manual section 5.2.26. [8]
4.2. Kinematic model Kinematic model of the platform is implemented with the dead reckoning method. The idea of dead reckoning is estimating a relative position based on the initial point information. It uses data received from IMU or encoders and therefore does not rely on external variables [9]. Here, the readings of encoders on the wheels and steering are utilized. The encoders measure the angular rate of change occurred in the wheel.
The atv_can node publishes linear velocity of each wheel and steering angle of the vehicle. polaris_kinematics_node then uses this data to define the kinematic model of the ATV for robot_localization nodes as an input.
In 4-wheeled outdoor vehicles the inside front wheel rotates sharper than outside wheel. This angle (Ø) is called Ackermann angle. It provides additional accuracy to the dead reckoning model while supporting traction and ground clearance [10]. Position and steering angle of the vehicle with respect to instantaneous center of curvature (ICC) is shown in Figure 7.
Page 11 of 29

Figure 7. The Ackermann angle of vehicle. Turning radius of the vehicle can be measured by marking the inner side of the wheel with a chalk while driving in a circle outside, and measuring the diameter.
The Ackermann angle is calculated as follows
otφ otφ φ = c i − c 0 = LR+d/2 − L
R−d/2 = Ld (1),
where . Measuring the steering angle is required for measuring and updating the otφ c = sinφcosφ
orientation of the vehicle as shown in Figure L1 and calculated in Eq. 1-3.
Figure 8. Pose angle gives information of the direction of the vehicle.
Page 12 of 29

The vehicle uses information of steering angle (or rotary angle) and linear velocity of each wheels from CAN bus and use them to calculate the position and orientation of the vehicle as shown in Eq. 2, 3 and 4,
x os(θ /2)xk+1 = k + vavg × h × c k + φk (2),
y in(θ /2)yk+1 = k + vavg × h × s k + φk (3),
θ h/L)θk+1 = k + tan(− ) φk × vavg × ( (4),
where and are position of the vehicle in xy-plane, is the orientation of the vehicle, is xk yk θk φk the steering angle at time , is the calculated average velocity of all four wheels, is sampling k vavg h time and is distance of rear and frontal wheel axis (longitudinal wheel separation). and L yxk+1, k+1
are updated position and orientation of the vehicle respectively. represents the yaw angle,θk+1 θ since only x- and y-plane are taken into account and thus, roll and pitch are excluded.
A disadvantage of dead reckoning is that the model is vulnerable to errors, which are caused by slippage, noise (from encoder signals), measurement inaccuracies, mismatches in the system parameters or even inclination of the ground [9].
The inaccuracy of raw odometry increases over time as shown in Figure L2 as red path. However, these inaccuracies can be prevented, when the only the rates of change from the raw data are used, and it is further combined with INS data and fused with EKF. The result is smoother and less vulnerable to errors as shown in Figure 9 as green path.
Figure 9. Raw odometry (red) vs filtered odometry (green).
4.3. Simultaneous Localization and Mapping To localize itself, the vehicle must know both its pose and position in the environment. The vehicle only have access to measurements and controls. Simultaneous localization and mapping (SLAM) describes the result of this problem. In SLAM, the vehicle acquires a map of its environment, while simultaneously localize itself relative to that map [11].
Here, the used SLAM implementation is from the gmapping ROS package. Gmapping requires as
Page 13 of 29

input a topic of nav_msgs/Odometry messages, and a topic of sensor_msgs/LaserScan messages. The laser scan messages are derived from the Velodyne point cloud with the package lidar2scan, which essentially squeezes the measurements to a plane to produce 2D measurements. The odometry used is the fused result introduced previously. An example of a test run with SLAM is shown in Figure 10.
Figure 10. Filtered odometry
The maximum range of used laser scans in the gmapping parameters is set to 20 meters, as greater values tended to cause issues when driving by nearby trees. The exact root cause of this behavior is not completely clear, but empirical tuning of the parameters and several test runs proved this to fix the issues.
Page 14 of 29

5. Camera
5.1. Integration and calibration The camera used is a Basler “ace aca1600-20gm", seen in figure 11, and it is mounted on top of the car facing upwards, at parabolic mirror. The mirror and lense combination is a commercial setup, seen in figure 12. Using this setup a 360 degree image of the surroundings can be captured, as shown in Figure 13.
The captured image is a transformed by a function which is affected by the optics of the camera and the mirror curvature as well as the alignment of these two. The resulting projection function is a linear combination of these. [12]
Figure 11: Basler ace acA1600-20gm
Figure 12: Omnidirectional lens VS-C450MR-TK
Figure 13. A sketch of the imaging setup.
Page 15 of 29

For the camera calibration, we used OCamCalib toolbox, which is a omnidirectional camera calibration toolbox for Matlab which is designed by Davide Scaramuzza [13]. The toolbox takes as its input sample images taken with the camera and calculates a transformation function. The sample images need to contain a pre-defined checkerboard pattern in order for the algorithm to work. The toolbox detects the checkerboard pattern, as seen in Figure 15. The end result is a fourth order polynomial, as seen in figure 14 and table 3, which describes the radial distortion of the image. Additionally, the obtained poses of the images in relation to the camera are shown in Figure 16.
However, the end resulting projection function did not work as intended. There was some unclarity related to whether this was due to our processing setup or the toolbox not producing correct values. The result was tuned with empirical tests in order to correct the transformation.
Table 3. Calibration result parameters.
Figure 14. The forward projection function graph.
Page 16 of 29

Figure 15. Circular image showing the calibration process
Figure 16. Sample images in relation to the vehicle.
Page 17 of 29

5.2. Panoramic transform The images capture with the omnidirectional camera are captured as spherical due to the imaging setup. The image was converted from polar coordinates to cartesian coordinates in order to produce a panoramic image of the surroundings.
Due to the processing setup, the image was first converted to cartesian coordinates, and then transformed with the projection function discussed in section 5.1. This resulted in a panoramic image of the surroundings, as shown in figure 17.
Figure 17. Panoramic image transformed from catadioptric image.
Page 18 of 29

6. LiDAR Light Detection And Ranging (LiDAR) is a device used to generate a 3D presentation of the surroundings by measuring distances to multiple points at a time. A LiDAR is equipped with a mirror, which rapidly rotates and projects the lasers into the environment in a 2D-plane.
Distance of the travelled laser can be either defined by measuring the time-of-flight or phase difference in the modulated wave [14]. Distance based on time-of-flight can be calculated with equation 5,
r = n × 2Δt ×c (5)
where is the time between emission and reflection, is speed of light, is refractive index of tΔ c n air. In phase difference measurement a continuous modulated beam is emitted to the target and the phase difference is calculated as shown in equation 6,
t Δ = 2πΔϕ − fm (6)
where is the modulation frequency, is the phase difference and is the time difference. f m ϕ Δ tΔ tΔcan be thus used in equation 1 to calculate the distance between the LiDAR and the target [14].
6.1. Calibration The LiDAR device used for this project is a Velodyne HDL-32E High definition LiDAR sensor. It scans the environment vertically by firing 32 lasers with vertical angles from -30.67 to 10.67 degrees detecting 700000 points per second as the projected laser array rotates at a rate of 5-20 Hz [15]. Greater rotation rates will result in a more sparse point cloud, while slower rotation rates will result in a denser point cloud at the expense of refresh rate. Currently, the rotation rate is set to 10 Hz, or 600 rpm.
Parameters of Velodyne HDL-32E sensor can be adjusted and changed with a web browser, provided that the IP address of the device is known. On the Polaris, the Velodyne LiDAR has been assigned a static IP address of 10.42.0.3. A screenshot of the interface is shown in Figure 18.
Page 19 of 29

Figure 18. Velodyne LiDAR configuration web interface.
Each HDL-32E device is provided with a .xml-file, which contains the necessary calibration data crafted for its particular LiDAR device. To be used with the ROS Velodyne driver, the calibration data needs to be converted from a .xml file to an .yaml file. It can be done using the gen_calibration.py Python program under the velodyne_pointcloud package with the following command:
rosrun velodyne_pointcloud gen_calibration.py 32db.xml <path_of_result_file>.yaml
The resulting file is utilized by the driver to account for minor differences between devices in the precise directions of the lasers.
6.2. Operation The LiDAR communicates the readings via Ethernet as UDP packets [15]. The preconfigured ROS packages take care of the low level operations, outputting a point cloud in the form of sensor_msgs/PointCloud2 messages, that can be visualized directly and passed on to further processing such as segmentation.
Full diagram of all Velodyne nodes and topics are shown in Figure 19. Only /velodyne/velodyne_points is utilized currently, but for lower level processing the raw packets are available under /velodyne/velodyne_packets.
Page 20 of 29

Figure 19. Velodyne HDL-32E High definition LiDAR sensor nodes and topics.
The point cloud generated from the LiDAR measurements is shown in Figure 20. The point cloud only includes measurements that are within 0.8 m to 80 m from the LiDAR, effectively removing most of the reflections from the frame of the vehicle itself. This does have the disadvantage that very close-by objects can not be detected, but other methods of detecting those needs to be utilized.
Figure 20. Point cloud generated by LiDAR.
Page 21 of 29

6.3. Depth-based point cloud segmentation
Figure 21. Visualization of depth-based point cloud clustering.
In order to classify obstacles from the point cloud, the point cloud needs to be segmented to find the boundaries of probable objects. Essentially, for each measured neighboring point, the system has to determine if the points are a part of the same object. depth_clustering is a ROS package that implements depth-based clustering specifically designed to be used with Velodyne LiDARs [16]. depth_clustering was added to the system, with results as shown in Figure 21. Full integration is not yet completed, as the bounding boxes or extracted segments of the point cloud are not communicated back to ROS but visualized with a tool that is a part of the depth_clustering package.
The segmentation works by calculating the angle between two horizontally adjacent measured β points, as shown in Figure 22. In effect, if is greater than a predefined threshold, the two points β are considered to belong to the same object. [17]
Figure 22. Presentation of the segmentation principles, where a large enough signifies that the pointsβ belong to the same object. [17]
Page 22 of 29

7. General changes In addition to the new capabilities, the existing system was reorganized and some adjustments were made.
7.1. Code reorganization
The previous team had implemented a shell script, which launched the different ROS nodes in new terminal tabs, with a small delay between the commands. This was originally done due to voltage regulation problems, which caused the embedded computer to lose power if too much load was applied concurrently. However, the voltage regulation problem was resolved by Andrei, and the team was free to utilize the more conventional roslaunch system to start all required nodes.
In an effort to centralize the launch configurations and other parameters, a package called polaris was created under the workspace. Under the package, the primary launch files to run the system in different situations are to be located inside the launch directory, while launch files and configurations for individual subsystems are to be located under the config directory. A launch file called default.launch, which launches all subsystems, is intended to be used for the ordinary operation of the system. Other modes of operation, such as recording certain topics to a rosbag or playing back rosbag files with given systems operating on the playback data may be implemented as launch files as well.
The nodes were organized into namespaces in an effort to improve the usefulness of the rosgraph output for debugging purposes, shown in Figure 24. As can be seen, the system already has a considerable number of interacting nodes, and managing this complexity is something that will continue to require conscious effort as more nodes are added.
Page 23 of 29

7.2. Transform frames
Figure 23. Frames of the system, where base_link is located in the center of the rear axle.
Offsets and relative orientations between different parts of the vehicle were measured in order to prepare transform frames, shown in Figure 23. The base_link frame is adjusted to be located in the center of the rear axle, and the sensor frames were set in relation to that. Of note is the fact that velodyne_tf , i.e. the frame of the Velodyne LiDAR, is pointing backwards. This is necessary for the point cloud to be perceived in the correct orientation, given the orientation the sensor has been installed in.
Page 24 of 29

Figure 24. Nodes and topics of the system.
Page 25 of 29

8. Reflection of the Project
8.1. Reaching objective In the beginning of the project, the objective was originally stated as “further developing the perception capabilities of the platform”, which was then refined and broken down by the project team to individual features. Most of the more advanced features were not completed, due to unexpected difficulties and rather ambitious goals. However, the fundamentals were achieved, and a lot was learned.
8.2. Timetable In the beginning of the project, where most of the work items were ones that were better understood, the timetable was realized very well. However, as the team started working on implementing new features, problems surfaced. For example, when developing the node that transformed the original spherical image to panoramic, a memory leak was caused by accidentally using a different version of OpenCV during runtime than what was used in compilation. Diagnosing and fixing the problem took two to three weeks, and already set the progress back a lot. Other sources of delay were problems in tuning some of the parameters of the kinematic model and the gmapping node used for SLAM.
8.3. Risk analysis
In the original report we had listed different risks and performed a risk analysis in order to pinpoint things that could affect the end result. Most crucial risks were identified and listed in the project plan. No “high” likelihood risks were identified. During the project all “moderate” likelihood risks did occur. This can be seen as a accurately made risk analysis. The following section lists the risks, that occurred. Risk R9 in the project plan was “Project scope is too wide”. This risk was classified as having moderate likelihood and impact. During the early and middle stages we realized that our scope was indeed too wide. For example object detection would require the system to be fully functional before it could be performed, but we were struggling with the basic setup for most of the course. This led us to refactor our goals in the beginning of April. Risk R11 was listed as “Absence of an adviser or group member”. The team did a lot of work, but some put more time into this project than others. This was mostly solved with good communication and refactoring of responsible areas. Additionally R1, listed as “Our software contains critical bugs” was one of the main causes of the delays in the project. Calibration and fine tuning of constants took a lot longer than expected. Systems are not easy to put to work together and this needs to be taken into account in future projects. The preventive- and countermeasures listed in the original risk analysis were not
Page 26 of 29

applicable. The original risk analysis stated good software engineering principles, such as testing, would prevent problems with the software, but we ended up debugging mostly existing software and the ROS setup, instead of our own code.
On the other hand risks that were categorized as having a moderate likelihood, such as “New hardware component(s) are needed” did occur in the start of the project, but they were quickly fixed and did not affect the outcome of the project. These were related to getting wifi on to the computer and setting up the power source for the LIDAR. Additionally, the role of software engineering was lower than expected.
8.4. Project Meetings Project meetings, where the project team met with the instructor and advisor, were organized once a week, with a prepared agenda delivered by email to all participants. Memos of the meetings were written to a document in Google Drive for later inspection, along with the agenda. Besides the project meetings, the team met at the garage to work on the tasks and discuss outstanding issues, but no formal memos were written of these meetings.
A prepared agenda helped keep the meetings focused and to the point, and ensured that everything was covered.
8.5. Quality management In the project plan, various aspects of project quality were identified, along with their goals and methods of measurement. Below, some notable quality factors are discussed.
Successful communication was realized with the weekly project meetings and active use of Telegram chat.
Completeness , i.e. the measure of finished milestones, was not perfect. However, the most important milestones of the revised project plan were met.
Realisticity of plans, particularly in the first version of the project plan, was not satisfactory. Considerable adjustments had to be made, reducing the scope of the project. This was caused by poor understanding of the work involved in implementing the planned features, and optimistic estimates of work hours available on a weekly basis. Even after the project plan revision, not all planned milestones were met. The realisticity could really only have been improved by having more experience of similar projects.
Unit test code and code standards did not play a large part, as the amount of custom code was small. For the most part, the project was about tuning the parameters of various pre-made packages and making sure that the configurations work together. For the code that was written, however, no unit tests were prepared. This caused some challenges, as proper unit tests could have caught at least one issue that caused problems along the way.
Most of the quality aspects were not explicitly measured along the way. Asking for feedback about clarity of communication and gathering information of stakeholders’ understanding of the project progress could have proven useful.
Page 27 of 29

9. Discussion and Conclusions
Overall, the project was very educational and granted the team knowledge in the basics of autonomous vehicles software, as well as hardware. The project had its fair share of problems crop up, but the most important objectives were realized. In the beginning, a lot of time was spent on studying ROS and the current state of the platform, with little concrete result to show from that time. Given the current experience and knowledge of the team, a similar project could be developed further in the same amount of time.
Most of the challenges were related to integrating different ROS packages together, as well as studying the less ubiquitous calibration and integration of the catadioptric camera system. Given the limited amount of time, not much custom code could be expected to be completed, and the project was more about finding the correct packages and figuring out how they work together. For the camera system, however, the starting point was a bit more difficult as most packages assume a more standard camera. In the end, it might have been more straightforward to utilize multiple “normal” cameras and calibrate them together, as opposed to building custom handling for the catadioptric system.
Robot Operating System turned out to be a useful framework with a diverse ecosystem of packages for many needs, but it was not without its problems. One issue that is still a bit unclear is how dependencies of packages are to be managed; system-wide installations of different libraries and packages are not easily transferrable to other development setups, and some packages rely on different versions of the same library. For example, OpenCV was one library that caused a lot of pains, as some packages required version 3, whereas most relied on version 2.
Given our efforts, building higher level functionality such as path planning and proper obstacle detection and classification should be more feasible for a future team. We have done our best to keep the system configuration as simple and manageable as possible to ease further development.
As for suggestions for the future development, a method of detecting nearby obstacles needs to be added. This could be in the form of sonars in the front and rear bumpers of the car, or even additional smaller LiDAR devices.
Equipping Polaris Ranger with additional IMU and GPS units and fusing them with efk_localization_node along with odometry, could lead to more accurate results as discussed in [18]. This will reduce errors caused by faulty sensors or each individual unit (GPS and IMU) can be assigned to measure a single or multiple desired variables. Thus, rapid growth of errors in yaw, x and y measurements can be better controlled and reduced.
List of Appendices 1. Project plan 2. Business aspects document
Page 28 of 29

References [1] T. Moore. (2016). robot_localization wiki [Online]. Available: http://docs.ros.org/jade/api/robot_localization/html/index.html
[2] T. Moore. (2015). Working with the robot_localization package [Online]. Available: http://roscon.ros.org/2015/presentations/robot_localization.pdf
[3] T. Moore. (2015). Working with the robot_localization package [Online]. Available: https://vimeo.com/142624091
[4] Basic Principles of Inertial Navigation Seminar on inertial navigation systems. [Online]. Tampere University of Technology, page 5. Retrieved 22 January 2015. Available: http://aerostudents.com/files/avionics/InertialNavigationSystems.pdf
[5] OEM615™ Dual-Frequency GNSS Receiver [Online], NovAtel Inc., Available: http://www.novatel.com/products/gnss-receivers/oem-receiver-boards/oem6-receivers/oem615/
[6] SPAN-IGM-S1 [Online], NovAtel Inc., Available: http://www.novatel.com/products/span-gnss-inertial-systems/span-combined-systems/span-igm-s1/
[7] GPS-703-GGG Triple-Frequency Pinwheel® GNSS Antenna [Online], NovAtel Inc., Available: http://www.novatel.com/products/gnss-antennas/high-performance-gnss-antennas/gps-703-ggg/
[8] SPAN® on OEM6® Firmware Reference Manual, Rev. 8, NovAtel Inc., 2016.
[9] B. Cho et al., “A dead reckoning localization system for mobile robots using inertial sensors and wheel revolution encoding”, Journal of Mechanical Science and Technology, vol. 25, no. 11, pp. 2907–2917, 2011. DOI 10.1007/s12206-011-0805-1. Available: https://link.springer.com/article/10.1007/s12206-011-0805-1
[10] J. Xiao. (2008, Nov 29). Introduction to ROBOTICS [Online]. Available: https://www.slideshare.net/adorepump/introduction-to-robotics-presentation
[11] S. Thrun et al., Probabilistic Robotics (Intelligent Robotics and Autonomous Agents). MIT Press, 2005.
[12] M. Strohmeier, “Development and Evaluation of a Human-Robot Interface for an Autonomous All-Terrain Transportation Vehicle in order to Localize, track and Follow a Human”, M.Sc. thesis, Aalto University, School of Electrical Engineering, Finland, 2014.
[13] D. Scaramuzza et al., “A Toolbox for Easily Calibrating Omnidirectional Cameras”. IEEE/RSJ International Conference on Intelligent Robots and Systems (IROS 2006), Beijing, China, October 2006.
[14] G. Vosselman and H. Maas, Airborne and Terrestrial Laser Scanning. Whittles Publishing, 2010.
[15] HDL-32E High Definition LiDAR Sensor User’s Manual And Programming Guide, Rev. K, Velodyne LiDAR, 2016.
[16] I. Bogoslavskyi. (2017, January 12) Fast and robust clustering of point clouds generated with a Velodyne sensor. [Online]. Available https://github.com/niosus/depth_clustering
[17] I. Bogoslavskyi and C. Stachniss, “Fast Range Image-Based Segmentation of Sparse 3D Laser Scans for Online Operation”. Proc. of The International Conference on Intelligent Robots and Systems, 2016.
[18] T. Moore and D. Stouch. “A Generalized Extended Kalman Filter Implementation for the Robot Operating System”, Advances in Intelligent Systems and Computing, vol 302. Springer, 2016. Available: http://docs.ros.org/jade/api/robot_localization/html/_downloads/robot_localization_ias13_revised.pdf
Page 29 of 29

Aalto University ELEC-E8002 & ELEC-E8003 Project work course Year 2017
Project plan
Project #16 Perception for an autonomous ATV
Date: 5.4.2017
Ville Kukkonen
Amin Modabberian Pietu-Pekka Roisko
Pyry Viita-aho Ilmari Vikström

Information page Students Ville Kukkonen Amin Modabberian Pietu-Pekka Roisko Pyry Viita-aho Ilmari Vikström Project manager Ville Kukkonen Official Instructor Arto Visala Other advisors Andrei Sandru Starting date 5.1.2017 Approval The Instructor has accepted the final version of this document Date: 25.1.2017 The updated version accepted by instructor Date: April 21, 2017
1

1) Background Autonomous vehicles are a hot topic, although early technological implementations have been used in military and aerospace industry. However, self-driving cars have recently gained popularity. Both private and academic sectors are participating in developing and enhancing such technology. Well known examples are Google Self-driving Car, Tesla Autopilot and STANLEY by Stanford University [1]. At Aalto University, autonomous driving has been studied in the context of semi-autonomous heavy duty work machines. Nonlinear model predictive control (NMPC) methodology has been researched for motion control of agricultural vehicle and forest applications. The vehicle used for this project is a Polaris R12RC08FA All-Terrain Vehicle (ATV). Thus far two master theses have been written about the ATV [2][3]. The vehicle is also to be used for educational purposes in the course ELEC-E8111 Autonomous Mobile Robots. The purpose of this project is to continue developing and implementing a research and teaching platform for perception of autonomous vehicles on the ATV. The results of perception, modelled local environment of the vehicle, will be used for map localization, updating the a priori map, local path planning and motion control. Basic control of the ATV has been implemented with engine control units (ECUs), communicating via CAN and receiving instructions from an embedded computer, with which more enhanced high-level functionality will be implemented. The ATV operates both manually and automatically. The manual mode is identical to that of any other regular driving vehicle. Automatic mode is operated by the two ECUs, programmed with PLC tools. The embedded computer on the ATV runs Robot Operating System (ROS) on Ubuntu 14.04. Features implemented in the previous projects include odometry for the vehicle, ROS platform and GPS integration. The primary focus of this project is on the perception of the ATV [4]. By the end of spring 2017 the ATV should be able to identify various obstacles and map its environment by using a LiDAR and a 360-degree omnidirectional camera. Besides technical aspects, business side of the project is required to be taken into consideration as well. Main concerns are profitability of open source software in the field of robotics and reasonable approaches in providing perception software as an independent, generic product. The platform should be easy to use in future projects, which implies well designed, easily extensible software, systematic testing and good documentation. The project will last for 5 months and is carried out by 5 members. Additionally Professor Arto Visala and the manager of previous project Andrei Sandru will assist the current group during this period.
2

2) Expected output At the end of the project the ATV shall be able to map and visualize the surrounding environment using a 360-degree omnidirectional camera and a LiDAR. The ATV will primarily be used for research and education purposes, especially for the course ELEC-E8111, providing a simple and robust platform for further development. Major expected outputs and requirements are listed below. Functional requirements
● All sensors and instruments shall be integrated with ROS. ● The ATV shall be tested in a closed environment. ● Simultaneous Localization and Mapping (SLAM) shall be demonstrated with LiDAR. ● Accuracy of the GPS shall be tested.
○ Higher accuracy mode for the GPS should be looked into and enabled, if feasible. ○ Data returned by the GPS should be looked into and fixed.
● LiDAR and optical camera data should be combined. ○ Environment should be mapped in such form that it can be used in map based
localization and updated during runtime. ○ Pure Visual SLAM shall be demonstrated, if there is sufficient time left.
● LiDAR should be utilized with Inertial Measurement Unit (IMU) for odometry. ● The ATV shall be able to classify simple obstacles (e.g. parked cars, walking pedestrians, walls).
○ In order to guarantee safety, the systems shall be able to detect walking humans. User interface requirements
● Programming interface design shall be simple and well documented for modifications. ● Documentation for the ATV and its instruments shall be further organized and enhanced.
3

3) Phases of project Table 1 below defines the major milestones of the project, along with their respective deadlines. The deadlines are tentative, as there is a lot of uncertainty about the complexity of the tasks and the work required to complete them. Each milestone is assigned an identifier, such as “M0”, for later referencing. Deadlines, given in calendar week numbers, mean that the task should be completed by the end of that week. Some milestones include further details about external deadlines, such as the submission deadlines for course documents.
Table 1: Major milestones of the project.
Milestone Description Deadline (week)
M0 Project Plan Project plan is approved and delivered (submission DL 26.1. 23:59).
4
M1 Research Background research is done and the team has working knowledge of the ATV, including the most significant sensors. Also possible algorithms and approaches to sensor fusion for LiDAR + 360 camera have been researched briefly.
6
M2 ROS training The team has finished ROS tutorials and is able to analyze the existing ROS nodes and begin developing their own.
6
M3 GPS improvements and calibration
The option of improving GPS accuracy is looked into, and implemented, if possible. GPS + IMU calibration is done.
8
M4 Business presentation Business presentation is planned and the slides are submitted (submission DL 2.3. 23:59) .
9
M5 Business aspects document
Business aspects document is written and submitted (submission DL 10.3. 23:59).
10
M6 Sensors integrated to ROS The LiDAR and 360 camera have been calibrated and have working ROS node implementations.
11
M7 Initial test drive and sample data gathering
The ATV has been taken out for a test drive, and sample data from that drive is saved for further analysis.
12
M8 Environment model comparisons
A brief study and comparison of different environment models has been conducted
13
M9 Sensor fusion The data from the 360 camera, LiDAR and IMU+GPS are combined in a manner most suited for further development (SLAM + obstacle classification).
15
4

M10 Obstacle classification The system is able to segment the surroundings and classify obstacles; necessary ROS nodes are implemented.
18
M11 Project poster design Project poster design is finished (submission DL 9.5. 23:59). 18
M12 Project gala planning and preparation
All necessary planning and preparations for the Project gala on week 20 have been done
19
M13 Final report Final project report is written and submitted (submission DL 29.5. 12:00) .
21
5

4) Work breakdown structure The listing below contains the work breakdown structure of the project. There are areas of great uncertainty, where the actual work to be done is affected by choices that are to be made along the way; these will be fleshed out in more detail as more research into algorithms, approaches and existing ROS implementations has been made. Perception for an autonomous ATV (1400 hours)
1. Research (255 h) 1.1. Getting to know the ATV (80 h)
1.1.1. Learning the LIDAR (40 h) 1.1.2. Learning the 360 camera (40 h)
1.2. Researching algorithms (papers + ROS nodes) (100 h) 1.2.1. SLAM (25 h) 1.2.2. Sensor fusion (25 h) 1.2.3. Segmentation (25 h) 1.2.4. Classification (25 h)
1.3. Business (75 h) 1.3.1. Future of autonomous vehicles (37.5 h) 1.3.2. Open source in business (37.5 h)
2. GPS improvements and calibration (75 h) 2.1. Try to get the most accurate mode working (30 h) 2.2. Investigate and possibly fix issues with pose (30 h) 2.3. Calibration (15 h)
3. Learning ROS (75 h) 3.1. Setting up development environments (15 h) 3.2. Doing the tutorial (45 h) 3.3. Analyze nodes used currently (15 h)
4. Reading data from LIDAR to ROS (50 h) 4.1. Calibration (10 h) 4.2. Making sure existing ROS node is working properly (40 h)
5. Reading data from camera to ROS (100 h) 5.1. Calibration (20 h) 5.2. ROS node design & implementation (80 h)
6. Test drive the ATV (75 h) 6.1. Preparations for data collection (50 h) 6.2. Short test drive and sample data collection (25 h)
7. Laser odometry and SLAM (130 h) 7.1. Research environment model alternatives and implement one (30 h) 7.2. Choosing and implementing odometry from laser measurements (40 h) 7.3. Updating or replacing the used SLAM node (60 h)
8. Sensor fusion (150 h) 8.1. Texturize point cloud (75 h) 8.2. Visualize results (75 h)
9. Obstacle classification (225 h)
6

9.1. Segmentation (75 h) 9.2. Teaching with model data (human figures, cars, walls) (75 h) 9.3. Classification (75 h)
10. Final gala (100 h) 10.1. Design stand (30 h) 10.2. Design poster (20 h) 10.3. Preparations for gala (10 h) 10.4. Attend the gala (40 h)
11. Reporting and documentation (165 h) 11.1. Ensuring quality of existing documentation (30 h) 11.2. Documenting new implementations (40 h) 11.3. Assembling reports to a final report (50 h) 11.4. Writing business aspects document (30 h) 11.5. Preparing business aspects presentation (15 h)
7

5) Work packages and Tasks of the project and Schedule
5.1) Work packages Table 2 below summarizes the work packages of the project, along with the estimated hours required and persons responsible for each. Others listed participate in the work package in other roles. For each person, the initials are used: VK = Ville Kukkonen, AM = Amin Modabberian, PR = Pietu-Pekka Roisko, PV = Pyry Viita-Aho and IV = Ilmari Vikström.
Table 2: Work packages, participants and estimates hours. Leader Participating Hours
WP1 Research VK VK=53h;AM=58h;PR=58h;PV=53h;IV=53h;
T1.1 ATV: LiDAR research AM;PR; 40
T1.2 ATV: Camera research VK;PV;IV; 45
T1.3 ATV: GPS improvements VK;AM;PR;PV;IV; 15
T1.4 Algorithms: LiDAR + 360 camera fusion VK;AM;PR;PV;IV; 25
T1.5 Algorithms: SLAM VK;AM;PR;PV;IV; 25
T1.6 Algorithms: Segmentation VK;AM;PR;PV;IV; 25
T1.7 Algorithms: Obstacle classification VK;AM;PR;PV;IV; 25
T1.8 Business aspects: open source and perception modules
VK;AM;PR;PV;IV; 75
WP2 ROS Training VK VK=16h;AM=16h;PR=16h;PV=16h;IV=16h;
T2.1 Development environment setup VK;AM;PR;PV;IV; 15
T2.2 Tutorials VK;AM;PR;PV;IV; 45
T2.3 Going through existing code VK;AM;PR;PV;IV; 20
WP3 GPS improvements PV VK=15h;AM=15h;PR=10h;PV=10h;IV=10h;
T3.1 Optionally enabling higher accuracy mode, if feasible
PR;PV;IV; 15
T3.2 Pose estimation fixes, if feasible VK;AM; 30
T3.3 GPS + IMU calibration PR;PV;IV; 15
WP4 LiDAR integration AM AM=30h;PR=30h;
T4.1 Calibration AM;PR; 20
T4.2 Sanity check on existing code AM;PR; 40
WP5 Camera integration IV VK=40h;PV=40h;IV=40h;
T5.1 Calibration VK;PV;IV; 30
8

T5.2 Implementing or integrating ROS node VK;PV;IV; 90
WP6 Odometry fusion VK VK=95h;AM=45h;
T6.1 GPS fix to map frame VK; 50
T6.2 Wheel odometry from atv_can VK;AM; 30
T6.3 Kalman filter VK;AM; 60
WP7 Obstacle detection from point cloud AM VK=40h;AM=40h;
T7.1 Planes, e.g. walls VK;AM; 80
WP8 Combining image data and point cloud PR PR=30h;PV=30h;IV=30h;
T8.1 Mapping pixels to points PR;PV;IV; 90
WP9 Business aspects AM VK=7h;AM=7h;PR=7h;PV=7h;IV=7h;
T9.1 Business presentation preparations VK;AM;PR;PV;IV; 10
T9.2 Business aspects document VK;AM;PR;PV;IV; 25
WP10 Final gala VK VK=10h;AM=10h;PR=10h;PV=10h;IV=10h;
T10.1 Stand etc. design VK;AM;PR;PV;IV; 25
T10.2 Poster design VK;AM;PR;PV;IV; 15
T10.3 Gala preparations VK;AM;PR;PV;IV; 10
WP11 Documentation and reporting VK VK=18h;AM=18h;PR=18h;PV=18h;IV=18h;
T11.1 Ensuring existing documentation quality VK;AM;PR;PV;IV; 15
T11.2 Documenting new features VK;AM;PR;PV;IV; 25
T11.3 Final report VK;AM;PR;PV;IV; 50
Total estimated work per person is as follows: Ville Kukkonen: 254 hours; Amin Modabberian: 269 hours; Pietu-Pekka Roisko: 209 hours; Pyry Viita-aho: 249 hours; Ilmari Vikström: 249 hours. The total sum is 1230 hours.
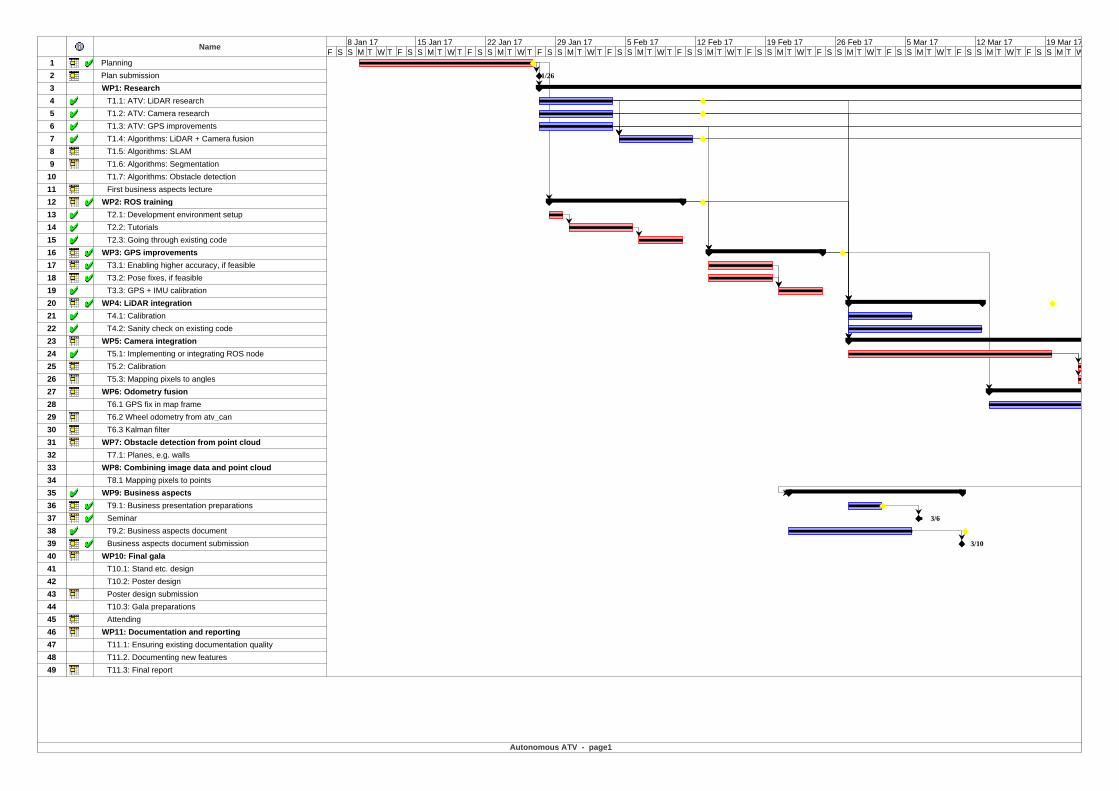
5.2) Detailed schedule The detailed schedule is included in Appendix A.
6) Work resources
6.1) Personal availability during the project Table 3. Number of hours available for the project (excluding lectures and seminars) per week.
Ville Kukkonen
Amin Modabberian
Pietu-Pekka Roisko
Pyry Viita-aho
Ilmari Vikström
9

Week 1 5 5 5 5 5
Week 2 5 6 5 5 5
Week 3 14 8 16 8 10
Week 4 14 14 5 8 10
Week 5 14 10 16 8 14
Week 6 14 16 8 16 14
Week 7 14 8 8 8 20
Week 8 12 16 0 16 14
Week 9 12 16 0 16 14
Week 10 12 16 14 16 14
Week 11 12 16 16 16 14
Week 12 12 16 16 16 14
Week 13 12 16 16 8 14
Week 14 12 16 16 16 14
Week 15 16 16 6 16 14
Week 16 16 0 0 0 14
Week 17 16 16 0 16 14
Week 18 16 16 16 16 14
Week 19 16 16 16 16 14
Week 20 16 16 16 16 14
Week 21 16 16 16 16 14
Total 276 275 211 258 274
6.2) Personal goals
Ville Learning the important algorithms and approaches used in autonomous vehicle perception; learning to implement or utilize those in ROS. Project management skills.
Pietu Learning product development and project coordination. Getting familiar with ROS and different tools. Understanding basic 3D reconstruction. Additionally, I am interested in measuring and calibration, so this project can probably give me insights in that too.
10

Amin Improving current programming skills and learning SLAM and ROS along with product development such that the knowledge can be applied easily in the future.
Pyry Learning 3D reconstruction, mobile robot localization and mapping, different approaches for SLAM, machine perception, sensors for mobile robots and ROS. I would like to improve my coding skills and skills related to robotic vision during the project.
Ilmari Working as a part of a product development team. I am looking forward to the implementation of machine perception which requires working with ROS, SLAM and sensor fusion. Most importantly I want to learn about different algorithms and measurement methods that are used in the field of mobile robots. I hope that the experiences gathered during this project can be applied in future projects/work also.
11

7) Cost plan and materials The instructor is responsible for project budget and buying materials. The procedure consists of the students identifying the required materials and providing the instructor with sufficient information for the required part or equipment. Once the instructor has approved it, the part or equipment can be bought by the instructor. In this project the main task is to develop the code. For this we already have required materials and tools. This means that material or part purchases should not be necessary, unless some equipment needs replacement.
8) Other resources There are multiple other resources available for us which we can utilize in this project. The ATV is located at K3 building on Konemiehentie. The area is somewhat packed but storing some small additional hardware there will not be a problem. There is a conference area (i.e. table and chairs) nearby which can be conveniently used for team meetings. This whole laboratory area cannot be accessed freely, thus all group members have filed a request for key cards to the laboratory area. All group members possess a laptop computer which can be used in the development of the project. The ATV is equipped with only one computer running Ubuntu 14.04 OS. Currently the idea is that all group members shall virtualize this OS on their own computer and develop the project without necessarily being at the laboratory. This makes the development more efficient since multiple people can work on different issues simultaneously. In case the ATV requires some physical changes or fixing, there are good tools (wrenches etc.) at the laboratory which can be borrowed and used. Use of electric powered manufacturing tools is not required at this stage of the project. Former project manager, Andrei Sandru, is the advisor of this project. He is able to provide research material and excellent documentation about the previous stages of the project. The group is able to utilize his knowledge about the structure, electrics and measurement devices which are installed onboard.
12

9) Project management and responsibilities
Project manager The project manager is responsible for tracking the overall progress of the project and reporting it to the instructor. Should the need arise, for example as a consequence of some risks being realized, the project manager is also responsible for negotiating and correcting the project scope and goals with the instructor in order to make sure the project is finished before the final deadline. The project manager is also responsible for ensuring the quality of reporting provided by work package leaders. Facilitating communication within the project group and to external stakeholders is a key responsibility of the project manager. This includes preparing project meeting agendas, delivering them to all participants and making sure everyone is up to date on project status and other important information.
Work package leaders Each work package is assigned a leader who is responsible for: ensuring the quality of work package results, reporting the task status to the project manager and seeing that proper reporting is added to the final report draft, no more than a week after the task is complete.
Instructor The instructor provides guidance for research efforts, feedback on project progress and help on project management, including facilitating communication to relevant external stakeholders.
Advisor The project advisor has experience working on the ATV, and as such provides assistance on issues and questions regarding the ATV and its equipment, as well as providing help on project management.
13

10) Project Meetings The student group meets weekly in a project meeting with the instructor and advisor. This meeting time is initially every Thursday at 16:00-18:00, but it may be changed later should the need arise. For each meeting, there shall be short memos recorded. The memos shall document the significant discussed topics and all the decisions in a bullet list format. Each memo shall note the date and participants of the meeting. All memos are stored in Google Drive in the dedicated file. The default agenda for the meetings is as follows:
1. Choosing who writes the memo 2. Checking the progress since last meeting 3. Checking the overall status of the project 4. Discussing any outstanding issues 5. Checking the work to be done for next meeting 6. Agreeing on the next meeting
11) Communication plan Project communication is critical in order to keep everyone informed on how the project is progressing and what is to be done next. Making sure that issues and concerns have a viable channel to be propagated is also important. Within the project, communication is split to several layers based on the urgency and format of the information. Brief and/or more urgent messages within the project group are primarily sent via the dedicated Telegram group, where all the students as well as the instructor and advisor are members. Longer messages and less urgent communication, such as delivering meeting agendas, may be carried out via traditional email. If something requires a very fast response, phone calls may be used as a kind of emergency channel. A Trello board will initially be used for tracking the project status, with the option to move to another platform or method if it proves to be too much work for the value it provides. Google Drive is used for collaborating on documents during the project, especially on the final report. There will be a final report draft that is edited as tasks and work packages are completed. As discussed in chapter 9, work package leaders are responsible for seeing that this is done and informing the project manager. Software code for the project will be stored and collaborated on in a private GitHub repository.
14

12) Risks Every project has many possible risks that may cause a delay to the project and change the project outcome from expected. All risks that might have moderate impact to the project should be taken in consideration in the planning phase so that if some of them happens they can either be prevented or at least the damage of them would be minimised. Table 4 contains most of the possible risks, which are assumed to have moderate impact to the project outcome. All these risks are identified and analyzed so that it is clear what should be done if some of them occurs. Each risk is listed with a description of the possible cause, damage caused, likelihood (LOW, MODERATE or HIGH), impact of damage for the project (LOW, MODERATE or HIGH) and possible preventative and countering actions. Much of the risks were already identified in the project plan of the previous project group working on the ATV. [4]
Table 4: List of possible risks. [4]
ID DESCRIPTION SOURCE DAMAGE LIKELIHOOD IMPACT PREVENTION COUNTER ACTION
R1 Our software contains critical bugs.
Human error, bug in external library
Vehicle behaves unexpectedly, damage is caused to electronics, or the system fails to work at all
MODERATE HIGH
Testing should be emphasized and good software engineering practices should be followed. Simulation should be performed before testing in real environment.
Debug software and fix issues.
R2 Illness of a group member
External, random, uncontrollable
A group member's ability to work on the project is significantly reduced for a period of time
LOW HIGH
Good hygiene is prefered. Wash hands often enough.
Reorganize project plan if needed to cope with such uncertainties.
R3 Street accident with ATV.
Human error, software bug, hardware, malfunction, external
Personal injury and/or damage to the vehicle/equipment property damage.
LOW HIGH
A group member will remain at all times on the driver's seat during tests. Absolute control over the vehicle is a must.
Inform appropriate person(s), replace components.
R4 Rain damage. External, random.
Damage to unprotected electrical components.
LOW HIGH
Waterproof all components as much as possible. Do not field test the
Replace components.
15

vehicle during rainy days.
R5 Other liquid damage. Human error.
Damage to unprotected electrical components.
LOW HIGH
Keep any liquids at a safe distance from any electrical equipment.
Replace components.
R6
Theft or other disappearance of expensive equipment.
External.
Postponed or even impossibility to implement the function related to the stolen component. Having to compensate for financial damage.
LOW HIGH
Store equipment securely and monitor equipment during use. Mark equipment to prevent taking of parts by other projects. Keep the key card in a safe place.
Report any incidence as soon as possible.
R7 Damage to embedded computer.
Improper use of the component, human error.
High level controller gets damaged from e.g. inversed supply polarity.
LOW HIGH
Triple check any connections before turning it on.
Inform supervisor, replace component if possible.
R8 Damage to EPEC controllers.
Improper use of the component, human error.
One or both controllers get damage from e.g. inversed supply polarity.
LOW HIGH
Triple check any connections before turning on any controller.
Inform supervisor, replace component if possible.
R9 Project scope is too wide
Planning error, underestimation of workload, overestimation of resources
Resources and time are insufficient to complete some of the planned tasks
MODERATE MODERATE
Resources and the feasibility of planned goals should be taken into account in planning. Workload should be estimated as higher than expected.
Reduce scope of project and/or allocate more time.
R10 New hardware component(s) are needed
Planning oversight; misinformation; broken parts
Components that were supposed to be available are not, or they are broken or otherwise unsuitable
MODERATE MODERATE
Make sure all the equipment is available and in working condition
Purchase new components
R11 Absence of an adviser or a group member
External Scheduled work will be delayed LOW MODERATE
Good communication between
There is always work that can also
16

instructor and assistant. Good communication inside the group.
be done without instructor. Be precise and follow the schedule.
R12 Data corruption Random
A file(s) become(s) corrupt and is no longer usable.
LOW MODERATE Always keep backup of files online.
Try to recover files, if it fails, redo.
13) Quality plan It is often important to distinguish between the quality of the process and the product. In this case we consider the quality of the project work and it’s results. Furthermore, the stakeholders often have different preferences about a project result. Measuring quality is difficult, but generally, a failure in quality causes the project to fail in some aspect. Quality can not be determined without data. When assessing quality we need to use measures, and when those are not available, indicators. In the end, the stakeholders form the assessing “judge”.
Table 5: Quality aspects.
Aspect of quality Goals How to measure
Overall project quality
Completeness All major milestones are reached
Which parts of the needed features were implemented. Does object identification work, etc.
Engagement of stakeholders Stakeholders feel that they have participated in the project and contributed to it.
Ask stakeholders how they feel about the project
Successful communication The stakeholders are aware of each other's work and the project status.
Are stakeholders frustrated about communication or the lack of it?
Documentation The end report and the project Gala audience understands the
17

gala distribute the knowledge and progress of the project.
key aspects.
Effective delegation The different tasks and work packages of the project have clearly defined leaders who are responsible for the success and quality of the WP or task.
Does everyone know who works on what.
Learning new things Each of the stakeholders have gained new knowledge and are content with their understanding of the project on a general level.
Ask stakeholders about how happy they are with their learning.
Planning phase quality
Realisticity of plans The project plan should be realistic
Did the result match with the plans. Were the deadlines met? Were there uncompleted objectives?
Accurate requirements and goals
The goals and requirements for the project and its subparts are clearly defined
What additional questions arise during the project?
Software quality
Unit tests and code standards are used.
Major parts of the software have distinct unit tests. Common coding standards are followed.
Code review
Automated testing Testing is automated. Code review
Documentation The software features are documented well.
Reading the documentation written by others.
As seen in table 5, the different phases of the project have different key metrics for measuring quality. There are certainly more that could be listed, but focusing on and meeting these key aspects will yield in a good quality result. As always, communication is key. The project manager is ultimately in charge of the quality, but delegating and reminding the work package responsives about these quality goals will help on the way. The project manager should facilitate a review and reporting regarding the quality plan during general meetings when necessary. The instructor should provide good rules of thumb regarding project management, and if possible, software engineering. Problems in quality will often result in frustration or failures. Once encountered they should be discussed during the general project meetings. Big decisions regarding quality should also be decided during these
18

meetings so that the stakeholders are aware of the changes. If someone is absent, he should be informed of the quality matters.
14) Changing this plan This plan is valid and shall be followed if no major difficulties arise during the project. All of the group members are responsible for informing the WP leader and project manager if it seems that one or more of the tasks are likely going to be overdue. The situation is discussed within the group members in a team meeting where severity of the difficulty shall be determined. In case one or more of the members are not physically available at the time of the meeting, the communication shall be carried out also via Telegram or phone call. The group aims for unanimity, but ultimately it is the project manager who makes the decision if a certain task requires more time than what was planned. Project manager makes the initiative to ask the instructor for the change. If the change is approved, both the original and the updated plan shall be presented in the documentation. Reasoning behind the change shall also be included in the documentation.
15) Measures for successful project When successful, this project should grant future groups a basis on which to implement autonomous navigation. In order to follow the process of the project, the work has been divided into work packages and tasks (see sec. 5). Our milestones represent deadlines and things we want to complete. The milestones can be reached, even though the underlying goals would be completed only partially. Especially work packages WP7-WP9 consists of many subgoals, whose workload is difficult to determine. Initial progress will give us a better idea of whether we need to reconsider the scope later on. Work packages WP7 and WP8 could theoretically be abandoned or adjusted, if time constraints seem too tight. One of the key aspects of in order for the project to succeed is to maintain good documentation throughout the project. Additionally, the quality goals defined in sec. 13 make a great outline for a successful project, and should be tracked in project meetings, where feasible. The final outcome is a combination of these. In order to succeed, we need to pass the milestones we have set out to reach. To succeed well we also need to cover the quality aspects. Results of the software development will be assessed by the project team and the instructor to ensure satisfactory quality. The assessments shall be carried out as demonstrations in a closed environment, with the results documented in the final report.
19

Changes ● 5.4.2017 Updated work packages and schedule. New work was discovered and the final work
packages were clarified/restructured to reflect new understanding and updated time estimations.
20

References [1] Sebastian Thrun, “Toward Robotic Cars”, ACM Digital Library (2010): 99-106, accessed January 23th, 2017, doi: 10.1145/1721654.1721679, Available at: http://dl.acm.org/citation.cfm?id=1721679 [2] M. Strohmeier, “Development and Evaluation of a Human-Robot Interface for an Autonomous All-Terrain Transportation Vehicle in order to Localize, track and Follow a Human” (M.Sc. thesis, Aalto University, School of Electrical Engineering, Finland, 2014). [3] A. Battiston, “Software in C++ for communication between CAN bus and ROS in a robot vehicle” (M.Sc. thesis, University of Padoua, Italy, 2015). [4] A. Sandru, M. Granholm, L. Kääriäinen, E. Koppali, “Teaching and Research Platform for Autonomous Vehicles” (Final report, Aalto University, School of Electrical Engineering, Finland, 2016).
21

Appendix A: Detailed schedule
22
F S S8 Jan 17
M T W T F S S15 Jan 17
M T W T F S S22 Jan 17
M T W T F S S29 Jan 17
M T W T F S S5 Feb 17
M T W T F S S12 Feb 17
M T W T F S S19 Feb 17
M T W T F S S26 Feb 17
M T W T F S S5 Mar 17
M T W T F S S12 Mar 17
M T W T F S S19 Mar 17
M T W T F S S26 Mar 17
M T W T F S S2 Apr 17
M T W T F S S9 Apr 17
M T W T F S S16 Apr 17
M T W T F S S23 Apr 17
M T W T F S S30 Apr 17
M T W T F S S7 May 17
M T W T F S S14 May 17
M T W T F S S21 May 17
M T W T F S S28 May 17
M T W T F S S4 Jun 17
M T W T F S S11 Jun 17
M T W T F S S18 Jun 17
M T W T F S S25 Jun 17
M T W1 Planning
2 Plan submission
3 WP1: Research
4 T1.1: ATV: LiDAR research
5 T1.2: ATV: Camera research
6 T1.3: ATV: GPS improvements
7 T1.4: Algorithms: LiDAR + Camera fusion
8 T1.5: Algorithms: SLAM
9 T1.6: Algorithms: Segmentation
10 T1.7: Algorithms: Obstacle detection
11 First business aspects lecture
12 WP2: ROS training
13 T2.1: Development environment setup
14 T2.2: Tutorials
15 T2.3: Going through existing code
16 WP3: GPS improvements
17 T3.1: Enabling higher accuracy, if feasible
18 T3.2: Pose fixes, if feasible
19 T3.3: GPS + IMU calibration
20 WP4: LiDAR integration
21 T4.1: Calibration
22 T4.2: Sanity check on existing code
23 WP5: Camera integration
24 T5.1: Implementing or integrating ROS node
25 T5.2: Calibration
26 T5.3: Mapping pixels to angles
27 WP6: Odometry fusion
28 T6.1 GPS fix in map frame
29 T6.2 Wheel odometry from atv_can
30 T6.3 Kalman filter
31 WP7: Obstacle detection from point cloud
32 T7.1: Planes, e.g. walls
33 WP8: Combining image data and point cloud
34 T8.1 Mapping pixels to points
35 WP9: Business aspects
36 T9.1: Business presentation preparations
37 Seminar
38 T9.2: Business aspects document
39 Business aspects document submission
40 WP10: Final gala
41 T10.1: Stand etc. design
42 T10.2: Poster design
43 Poster design submission
44 T10.3: Gala preparations
45 Attending
46 WP11: Documentation and reporting
47 T11.1: Ensuring existing documentation quality
48 T11.2. Documenting new features
49 T11.3: Final report
Name
1/26
3/27
3/6
3/10
5/9
5/16
Autonomous ATV - page1

F S S8 Jan 17
M T W T F S S15 Jan 17
M T W T F S S22 Jan 17
M T W T F S S29 Jan 17
M T W T F S S5 Feb 17
M T W T F S S12 Feb 17
M T W T F S S19 Feb 17
M T W T F S S26 Feb 17
M T W T F S S5 Mar 17
M T W T F S S12 Mar 17
M T W T F S S19 Mar 17
M T W T F S S26 Mar 17
M T W T F S S2 Apr 17
M T W T F S S9 Apr 17
M T W T F S S16 Apr 17
M T W T F S S23 Apr 17
M T W T F S S30 Apr 17
M T W T F S S7 May 17
M T W T F S S14 May 17
M T W T F S S21 May 17
M T W T F S S28 May 17
M T W T F S S4 Jun 17
M T W T F S S11 Jun 17
M T W T F S S18 Jun 17
M T W T F S S25 Jun 17
M T W
1/26
3/27
3/6
3/10
5/9
5/16
Autonomous ATV - page2

Aalto University ELEC-E8002 Project work course Year 2017
Business aspects
Project #16 Perception for an Autonomous All-Terrain
Vehicle
Date: 9.3.2017
Kukkonen Ville Modabberian Amin Roisko Pietu-Pekka
Viita-aho Pyry Vikström Ilmari

Information page Students Ville Kukkonen Amin Modabberian Pietu-Pekka Roisko Pyry Viita-aho Ilmari Vikström Project manager Ville Kukkonen Official instructor Arto Visala Other advisors Andrei Sandru Starting date 28.2.2017 Approval The instructor has accepted the final version of this document Date: 10.3.2017

Summary This document details a lightweight business plan for selling consultation and development services around an open source environment perception software library. The software utilizes the readings of sensors such as cameras and LiDARs to produce structured information of the environment, e.g. obstacle classification and mapping data. The primary use case for the software is within autonomous and semi-autonomous mobile robot applications, such as autonomous vehicles and modern industrial robots. Different open source licenses allow for different methods of monetization. For example, Robot Operating System (ROS) uses the BSD-3 license, which is very permissive and permits the use in commercial products. Many of the issues with less permissive licences may be avoided by keeping the core set of libraries as open source, and billing the customer for professional consultation all the way from choosing the sensors to integrating the software to their platform and application software. Many different actors already populate the market space of autonomous mobile robotics, doing large scale research in all of the different subtopics. However, there could be room for a consultancy specializing in a single aspect, namely perception. As autonomous systems are rather complex, specializing in one narrow field may yield competitive advantage in terms of experience and robustness of solutions. In addition, basing the systems on open source software amounts to higher transparency and more customization possibilities for the customer. Liability issues are one nontrivial source of concern, and this document details them to some extent but does not try to actually find a good solution to them, as it is beyond the scope of such a simple lightweight business plan.

1) Business idea The core product is consultation on the use of an open source perception software, and development for adapting the software to different platforms and client applications. Customers include car manufacturers and industrial robot providers, who need their products to perceive and react to their environments. Other major group of customers are research institutes who are looking to get into autonomous systems but are not that invested in implementing all the subsystems themselves. Customers get professional consultation on perception approaches and how to best utilize the environment information in their applications. Competitive advantage comes from the use of open source software for the perception, which provides transparency and provides opportunities for easier adjustments on a case by case basis. The main revenue source is the consultation work, but different hardware- or operating system specific adapter components may also be licensed, providing revenue in licensing fees. The licensing fees are one way to extract revenue from a customer after the initial consultation project is done. Another service is selling continued support for the customer.

2) Product/service The product consist of environment perception consultation and development of adapters for an open source environment perception software library that can be used for any autonomous robot or vehicle application. It is designed to be modified for more project specific features by the product developers and consultants. The core perception library implements algorithms to produce different forms of structured data based on the utilized sensors, such as LiDAR. The data about the environment may include obstacle classification, maps of the environment produced via SLAM algorithms, object tracking and other useful information. Additional capabilities may be incorporated to the library as the need arises, further expanding the available algorithms. The core library shall remain open source, inviting modifications not just from our business but other interested parties utilizing it as well. Consultation around the core library consists of a few separate fields of expertise, but each task has considerable connections and dependencies to the others. First, proper selection of hardware and sensors for an application is not a trivial task, but it is something that our consultants are prepared to solve. Second, the integration of the perception library capabilities to the chosen platform and sensors. Third, the selection and utilization of most important pieces of environment data for the application at hand. Integrating exotic platforms to use the perception library may require the development of tailor-made software adapters, which our development team will provide. On the other hand, integrating to a possibly already existing customer software is another point of contact where custom adapters may well be required, and those may also be developed by our team. The custom software adapters may be licensed, providing additional revenue on top of the billable consultation work. The product is primarily design for projects that utilized LiDAR or optical camera, but it also provides possibility for approaches such as sonar and RF. It can be utilized in autonomous ground, aerial and aquatic vehicles for non-military use. In other words the customers consists of universities, research institutes and private companies that manufacture and develop autonomous vehicles for research and civilian purposes. This easy-to-use solution allows the customer to focus on their expertise and not spend too great amount of time and resources on implementing the basics of perception, thus providing a better tailor made modification or new approaches within this field.

3) Market situation and competitors analysis The customers are mainly research institutes, universities and private companies which develop or research autonomous vehicles. Although this company would be “the first in the market”, all companies and institutes that work with autonomous vehicles are not potential customers. This is because many of these companies and institutes are already heavily invested in perception of autonomous vehicles and our product would not provide the needed additional value. There are, however, numerous car manufacturers that are not yet very invested in autonomous driving. These companies may want to enter the field of autonomous driving, but they may have a lack of know-how about the software side. For them it would be convenient and effective to outsource the environment perception issue. The estimate is that there are about 20 big car manufacturers that are very potential customers for us. In addition to the big players in the industry, universities and institutes are also potential customers. There are thousands of technology institutes in the world. Some of these institutes have interest on autonomous vehicles and some of them do not. Our estimate is that there are about 500 institutes and universities which are potential customers. The amount of sales is somewhat difficult to estimate. The field of autonomous driving is soon a multibillion business in the United States only. Even though our product focuses entirely on the perception part, entering the market and having even one or two of the big car manufacturers as customers would result in huge sales. As the software is licensed open source, the main income would come from consulting work. The amount of consulting work depends on the complexity of the proposed system and the amount of vehicles that are being manufactured. Companies which develop their own perception software are the most important competitors. The biggest of these companies are Tesla, Google and NVIDIA. There are also other competitors in the field of autonomous driving, but they are not discussed as the aforementioned are the most important. Tesla and Google are both big innovators in the field of autonomous driving. These two companies develop their own software which is implemented in their self-driving cars. Both of these companies are already far in the development and have their own functional hardware and software combinations. Looking at the 5-year market chart, both Tesla and Google are very profitable companies. On top of this, both of these companies possess top tier technological know-how. NVIDIA is widely known as a graphics processor developer and manufacturer. In the recent years NVIDIA has started developing a solution which provides environment sensing and

artificial intelligence implementation for their customers’ autonomous vehicles. Tesla and NVIDIA have partnered since the early development stages of Model S. On top of this, NVIDIAs product is aimed also for other companies invested in autonomous vehicles. The largest customers are Tesla, Audi, BMW, Volvo and Honda. [5] One of the most important competitive factor of our company is the flexibility of the system. The system is able to work with different types of hardware which is attractive from the viewpoint of the customer. The sales is done case-by-case, so our solution can be tailored to work with very project specific hardware also. One big competitive factor is the fact that companies can leave the environment sensing for experts and focus on some other aspects. This opens possibilities for other companies to develop new technologies and innovations. Another major competitive factor is also the fact that the development is focused on quite a narrow field. This ensures that the quality of the product can be kept excellent and up to date with limited resources.

4) Intellectual property Firstly, the terms proprietary and commercial use are to be defined. Proprietary software stands for software for which the publisher retains the intellectual property rights, such as copyright and patent rights. Commercial software on the other hand refers to software that is produced for sale. These matters come into play when the software is distributed, i.e. made. If the software is not distributed (used internally) no actions are required by the modifier. Intellectual property matters are complicated in our case. Our software relies on open source software (ROS), and third party proprietary software, such as drivers. Further, hardware inventions and algorithms can clearly be considered creative works and can be patented or used as trade secrets. In these cases the algorithm components must be distributed in separate form, such as a separate software layer or “libraries”. This matter is regarded as a trivial case and is not further discussed in this chapter. Program code is handled somewhat differently from other creative works. Software code can not be patented per-se, but it can be licensed under a variety of licenses that dictate how software is to be used and distributed. In general terms, OSS does not prohibit charging money for distributing the software. Also, there is no compulsion to release changes made for internal use. The biggest problems arise from combining software that use different licenses, because the licenses may not contradict each other. A multitude of licenses are used in open source software packages, but we’ll address the three most common ones and their hilighlights:
● GPL v2 ○ All software created by modifying the original software must be licensed as a
whole under GPL when distributed. Hence combining GPL with non-GPL code is not possible, unless the combined code can be licensed under GPL
○ Requires the full source code to be released under the same license terms as the original software.
● BSD (4-clause) ○ Older BSD license, not compatible with GPL. ○ Requires heavy attribution ○ Software can be redistributed for any purpose as long as the copyright notices
and the disclaimers of warranty are maintained ● BSD (3-clause)
○ Modern BSD license is compatible with GPL ○ Allows reuse in commercial and closed source projects

Our project utilizes the Robot Operating system, which is licensed under the BSD 3-Clause license. This license is very permissive and allows for reuse in commercial and closed source products. Additionally some proprietary hardware drivers are used, but they (should) permit the use in commercial applications. With the above in mind several business models are possible.
● Dual licensing ○ Releasing the software under a open source license such as GPL as well as a
proprietary license ○ Eg. Free open source version accomplishes basic tasks, but the company can
upsell an enterprise version. ● Selling optional proprietary extension
○ In our case the object classification module “models” to which the software compares objects can be licensed separately.
● Selling compatible hardware ○ If the adapters require certain hardware, it can be sold separately
● Selling service ○ Professional implementation help ○ Consulting services ○ Service and maintenance
● Providing the software as a service ○ Eg. Providing cloud computing “computer power” to the robot
● Selling the mobile robot as a whole ○ Eg. The software is released openly, but customers who want to save time and
energy will buy the complete “out of the box” solution. Possibly bundled with warranties and services as mentioned above.
In short, the use of OSS does pose some challenges to the business model, but especially the fact that ROS uses the BSD license, permits use in commercial use and converting the project to a closed source one.

5) Product development and technology Currently, multiple open source implementations exist for different aspects of environment perception. One of the first tasks is to utilize these separate packages to build a comprehensive suite that can be adapted to different use cases. This initial phase would require considerable amounts of development resources, but still likely much less than producing the algorithms and libraries from scratch. None of this work is actually to be done in this project. Rather, this project results in some familiarity with some of the different libraries, which is important for later integration and synthesis. The different actions required to accomplish a marketable product are:
● Integrating the minimum viable set of libraries and tools for perception. ● Acquiring personnel for the consultation work, i.e. experts on environment perception,
different hardware/software platforms and sensors. ● Acquiring or developing a development and testing platform, e.g. an autonomous
vehicle. ● Acquiring professional developers for the development of the different hardware
adapters. All these actions require considerable amounts of capital, so in practice finding funding would be the first task.

6) Conformance Searching the EU New Approach site [1] with search terms such as “robotic”, “autonomous”, “perception”, and “software” turned up nothing. Directives related to electric road vehicles were discovered, but these mostly concerned the charging systems and other electronic subsystems. It is possible some EU directives related to environment perception software exist, but we could not find them. The standards that seemed to have most relevance for our product were from IEEE, namely 1872-2015 - IEEE Standard Ontologies for Robotics and Automation [2] and 1873-2015 - IEEE Standard for Robot Map Data Representation for Navigation [3]. Without full review of these standards, it is difficult to say what work would be required to conform to them. The first one is more about standard nomenclature for robotics and automation in general, while the latter specifies data formats to use in map representations. 1873-2015 - IEEE Standard for Robot Map Data Representation for Navigation defines several different classes of maps, some metric and some topological. The standard goes on to define the data members that these maps should contain. Adjusting the existing open source mapping libraries to output data in a suitable format should be feasible with a reasonable amount of work. Again, without full review of both the standard formats and the existing library formats, the amount of work is hard to estimate in greater granularity, but previous experience suggests that altering the way a piece of data is formatted is wholly within the realm of possibility. Another concern are the liability clauses potential customers might require. For example, if our solution was to be used in a safety-critical application to detect humans in order to avoid collisions, customers might want us to assume responsibility of any possible errors in the detection. Addressing this concern is not an easy task, as perception is prone to errors from multiple sources: for example sensor hardware, computation hardware, the actual perception algorithms, and latency issues caused by nondeterminism in task scheduling might all manifest as errors in detecting an object. The issue has ties to the ongoing discussion about if an autonomous car does crash, then who should be blamed? We feel that addressing this issue properly is something that would require a team of experienced attorneys, and is beyond the scope of our lightweight business idea sketch.

7) SWOT-analysis A brief SWOT (Strengths, Weaknesses, Opportunities, Threats) analysis is shown in Figure 1. Currently, big companies are making large investments on autonomous perception, markets are still quite limited but the field is growing rapidly. The area is so new that there are not many solutions yet which could fulfill the needs of customers. Also the laws are still a lot behind compared to what technology would allow. For example self driving cars are still under the concern of law issues even if some companies could produce such cars already. Much of the risks as well as the SWOT was already analyzed by the previous group with a very similar concept [4], so we continued on their work. Table 1 shows the major risk factors for product development and the intended measures to prevent them. Most of the risks revolve around staffing and critical software errors. Figure 2 shows the Porter’s five forces analysis. As the plan is not to produce hardware, the only supplier segment to be concerned about is the set of experts that are to do consultation and development work.
Figure 1:. SWOT analysis [4]

Table 1: Risks for product development [4]
Description Source Damage Prevention Counter measures
Lack of workforce.
Project management or external.
The company’s ability to work on customers projects is significantly reduced for a period of time.
High quality planning, recruitment.
Hire new people or reduce the number of projects undertaken.
Unexpected bugs in open source components.
Human error; Bug in external library.
Bad reputation for the company; Refunds; Compromised user safety; Legal costs.
Testing should be emphasized, good software engineering practices should be followed. Simulation should be performed before testing in real environment.
Debug software and fix issues.
Economical depression. External. Loss of benefits,
bankruptcy. Monitor markets, sell in time. Reduce staff.
Marketing failure.
Analysis of market gone wrong.
Loss of potential customers. Planning. Implement new marketing
strategies.
Increase of competition. External. Loss of marketshare. Keep up the high quality
of work. Increase marketing.
Demonstration failure
Human error; Software bug; Hardware malfunction; External.
Damage to brand. Careful planning
Do something that takes the attention away from the mistake, for example new product.

Figure 2: Porter’s five forces

Supplement: Distribution of work and learning outcomes The team worked together to come up with the business idea and product concept, after which the sections of the business aspects report were distributed among the team as follows:
● Ville: chapters 1, 5 and 6 ● Amin: chapter 2 ● Ilmari: chapter 3 ● Pietu: chapter 4 ● Pyry: Chapter 7
Each chapter required some research, and the person who wrote the chapter was responsible for the research. The lectures were informative and gave a good overview of e.g. working with directives and standards, as well as product development and IPR. Working with the lightweight business made us think about business opportunities and revenue models around open source software. Also liability issues were one aspect that we had not thought of but was pointed out during the presentation. Overall the learning was not very deep as the timeframe limited the scope and level of detail we conducted our research, but we feel we got a good overview of multiple different aspects that go into developing a marketable technical solution.

Reference [1] http://www.newapproach.org/ProductFamilies/Keywords.asp [2] http://standards.ieee.org/findstds/standard/1872-2015.html [3] http://standards.ieee.org/findstds/standard/1873-2015.html [4] A. Sandru, M. Granholm, L. Kääriäinen, E. Koppali, “Teaching and Research Platform for Autonomous Vehicles” (Final report, Aalto University, School of Electrical Engineering, Finland, 2016). [5] http://www.nvidia.com/object/drive-automotive-technology.html


![Autonomous vehicles[1]](https://static.fdocuments.in/doc/165x107/54bf07bb4a7959cb478b4592/autonomous-vehicles1.jpg)