Final Report Odour Management in British Columbia: Review ... · Reputation Resources Results Odour...
277
FINAL REPORT ODOUR MANAGEMENT IN BRITISH COLUMBIA: REVIEW AND RECOMMENDATIONS Date: March 31, 2005 Project Number: W05-1108 Submitted by: RWDI AIR Inc. Consulting Engineers & Scientists 830 - 999 West Broadway Vancouver, British Columbia V5Z 1K5 P: (604) 730-5688 F: (604) 730-2915 Project Manager – Maria Furberg Project Director – Kathy Preston RSS Consulting Ltd – Bob Smith Submitted To: Stephanie Meyn Meteorologist BC Ministry of Water, Land and Air Protection 2 nd Fl, 10470 152 nd Street Surrey, BC V3R 0Y3 By Email: [email protected]
Transcript of Final Report Odour Management in British Columbia: Review ... · Reputation Resources Results Odour...

FINAL REPORT
ODOUR MANAGEMENT IN
BRITISH COLUMBIA:
REVIEW AND RECOMMENDATIONS
Date: March 31, 2005 Project Number: W05-1108 Submitted by: RWDI AIR Inc.
Consulting Engineers & Scientists 830 - 999 West Broadway Vancouver, British Columbia V5Z 1K5 P: (604) 730-5688 F: (604) 730-2915
Project Manager – Maria Furberg Project Director – Kathy Preston
RSS Consulting Ltd – Bob Smith
Submitted To: Stephanie Meyn Meteorologist BC Ministry of Water, Land and Air Protection 2nd Fl, 10470 152nd Street Surrey, BC V3R 0Y3 By Email: [email protected]

Library and Archives Canada Cataloguing in Publication Data RWDI AIR Inc.
Final report odour management in British Columbia : review and recommendations
Cover title. Running title: Odour management in British Columbia :
review and recommendations, final report “Project number: W05-1108” Report prepared by RWDI AIR Inc. in collaboration with
RSS Consulting Ltd., for the Ministry of Water, Land and Air Protection. Cf. Acknowledgements.
Includes bibliographical references: p. ISBN 0-7726-5386-0 1. Odor control - British Columbia. 2. Air quality
management - British Columbia. 3. Subject - British Columbia. I. British Columbia. Ministry of Water, Land and Air Protection. II. RSS Consulting. III. Title. IV. Title: Final report odor management in British Columbia : review and recommendations. V. Title: Odour management in British Columbia : review and recommendations, final report.
TD886R82 2005 363.739’26’09711 C2005-960141-8

Reputation Resources Results Odour Management in British Columbia: RWDI AIR Inc Review and Recommendations W05-1108 Final Report - i - March 2005
ACKNOWLEDGEMENTS
This project was carried out by the RWDI AIR Inc. in collaboration with RSS Consulting Ltd. on behalf of the Ministry of Water, Land and Air Protection (WLAP). The consulting team acknowledges the participation of the Steering Committee, which developed the terms of reference for the study and provided guidance throughout the project. The committee members and their affiliations are as follows:
Mr. Steve Sakiyama and Ms. Stephanie Meyn (WLAP), Mr. Greg Arnold and Mr. Ken Reid (Greater Vancouver Regional District), Ms. Natasha Essar (Environment Canada, Pacific & Yukon Region), and Mr. Rick Van Kleeck (Ministry of Agriculture, Food and Fisheries).
The consulting team also acknowledges and thanks those who shared their knowledge with us in interviews during the course of this project:
Mr. Greg Arnold (Greater Vancouver Regional District), Mr. Dirk Apgar (King County Department of Natural Resources, WA, USA) Dr. Ralf Both (Landesumweltamt Nordrhein-Westfalen, Essen, Germany) Mr. Peter Falsetta (Ministry of Agriculture, Food and Fisheries, British Columbia) Mr. Hiroshi Fujita (Office of Odor, Noise and Vibration, Ministry of the Environment, Japan) Mr. Chris Harris (South Australia Environment Protection Authority, Australia) Mr. Peter Hess (Bay Area Air Quality Management District, CA, USA) Ms. Nadia Kanhoush (Dept. of Environment and Conservation NSW, New South Wales, Australia) Mr. Peter Lawson (Dept. of Environment and Conservation NSW, New South Wales, Australia) Mr. Howard Markland (Greater Wellington Regional Council, New Zealand) Mr. Andrew Mattes (Dept. of Environment and Conservation NSW, New South Wales, Australia) Mr. Neil Parrish (Ontario Ministry of Environment) Mr. Andre Peeters Weem (Information Centre for the Environment, the Netherlands) Mr. Mark Robbins (Ministry of Agriculture, Food and Fisheries, British Columbia) Ms. Linda Vanderhoek (WLAP)


Reputation Resources Results Odour Management in British Columbia: RWDI AIR Inc Review and Recommendations W05-1108 Final Report - iii - March 2005
EXECUTIVE SUMMARY
The objective of this report is to provide the Ministry of Water, Land and Air Protection (WLAP), the Greater Vancouver Regional District (GVRD), and the other members of the Steering Committee with recommendations for odour management approaches that would be effective in British Columbia (BC), based on a review of successful odour management programs in other jurisdictions.
A review of odour management programs in jurisdictions around the world was conducted. It was found that there are ten different approaches that are used to manage odour.
1. Avoidance of Nuisance Laws: This type of law is based on either “nuisance” or “quality of life” narrative standards. The exact wording varies from jurisdiction to jurisdiction but essentially requires that odour from a facility will not result in a nuisance or cause pollution. This is the most common and oldest approach to managing odours. Odour regulations in 42 of the 50 states in the United States of America (USA) are of this type. Six of the jurisdictions that were interviewed have a law that is related to odour nuisance.
2. Ambient concentration criteria for individual chemicals: Many jurisdictions in North America and a few elsewhere in the world have quantitative ambient concentration criteria for individual chemicals that are odorous. The regulatory status of these criteria varies from guidelines or objectives to enforceable standards. Of the jurisdictions that were interviewed, four had ambient concentration criteria for specific chemicals.
3. Ambient concentration criteria for odour: Odour can be measured using an odour panel, which consists of a number of specially trained personnel, and an olfactometer. The general concept is to dilute a sample with odour free air until it can be detected by only 50% of the odour panel. The most common units for odour concentration are dilution to threshold (D/T) and odour units (OU). Ambient odour concentration criteria are used to manage odour in numerous jurisdictions in North America, Australasia, Europe, and Asia. Of the jurisdictions that were interviewed, six use ambient odour criteria. In many jurisdictions these criteria are used for design purposes only, not for enforcement.

Reputation Resources Results Odour Management in British Columbia: RWDI AIR Inc Review and Recommendations W05-1108 Final Report - iv - March 2005
4. Episode duration-frequency: Germany has a unique system for assessing whether an odour nuisance is significant that considers not only the intensity of an odour but also its duration and frequency. They assess the existing odour impact in the field, using a systematic process that is described below, and add to it the predicted odour impact of a new or modified facility. The total odour impact is compared with immission limit values, which are relative frequencies of odour-hours.
5. Minimum separation distances: Many jurisdictions manage nuisance, including odours, using fixed or variable minimum separation distances or buffer zones. South Australia has minimum separation distances for a large number of industries and types of facility. However, in most jurisdictions the use of separation distances is limited to agricultural sources, sewage treatment plants and composting. Of the jurisdictions that were interviewed, five use minimum separation distances.
6. Odour intensity scales: A number of jurisdictions have developed semi-quantitative odour intensity scales to assist field personnel when they are investigating an odour complaint. Odour intensity scales are used as guidelines. Three of the jurisdictions that were interviewed have odour intensity scales.
7. Odour index: The “Odour Index” is used in Japan to quantify the intensity of odours. The odour index is equal to ten times the log of the odour concentration. It differs from an odour intensity scale because it is a calculated value.
8. Complaint criteria: Most jurisdictions have a system in place for responding to odour complaints. In many cases, there is a policy to respond to all complaints. In some jurisdictions, such as Wellington, New Zealand, the Bay Area Air Quality Management District (BAAQMD) and Minnesota, there are complaint criteria in terms of a minimum threshold of complaints required before an investigation is launched or an odour is considered a nuisance. Some jurisdictions clearly set out how they will determine whether a complaint is justified or verified.
9. Quantitative emission criteria: Seven jurisdictions were found to have quantitative emission criteria for either odour or for specific chemicals. Four of these jurisdictions were interviewed. The other jurisdictions that have emission criteria but were not interviewed are Korea, Denmark and Switzerland. The format of the emission criteria appears to be different for each jurisdiction.

Reputation Resources Results Odour Management in British Columbia: RWDI AIR Inc Review and Recommendations W05-1108 Final Report - v - March 2005
10. Technology criteria: Many jurisdictions have requirements for implementation of state-of-the-science control technology or similar approaches that specify required levels of odour treatment controls or best management practices for new or existing facilities. These requirements are mostly qualitative in nature. Four of the jurisdictions that were interviewed have technology criteria.
To determine which of these approaches have been successfully applied, nine jurisdictions were interviewed using a standard set of questions that was developed in consultation with the Steering Committee.
1. Ontario, Canada: Ontario does not have an odour management program per se. It has a nuisance law that forbids the discharge of a contaminant that may cause an adverse effect and odour is included in the definition of a contaminant. Ontario also has a number of point of impingement (POI) standards and guidelines and ambient air quality criteria (AAQC) that are odour-based. In addition, there is a proposed ambient odour limit of 1 OU/m3 that has been used to-date on a case-by-case basis. Finally, Ontario makes use of minimum distance separation guidelines for agricultural operations and sewage treatment plants.
2. Bay Area Air Quality Management District, California, USA: The BAAQMD considers its odour management program to be successful. Its odour management framework consists of a nuisance law, quantitative ambient concentration limits for individual chemicals and odour, complaint criteria, and quantitative emission criteria. The BAAQMD has considerable resources with a staff of 350 with over 100 inspectors and field personnel as well as a team of lawyers who prosecute court cases. As a result, the most effective element of their odour management framework has been the general odour nuisance law and associated good case law.
3. King County, Washington, USA: The King County Department of Natural Resources and Parks Wastewater Treatment Division has an Odour Prevention Policy that defines odour prevention levels and includes recommendations for retrofitting existing facilities and for designing new facilities. The focus is on odour prevention not just odour control. One of the most interesting features of this policy is that it includes a number of methods of measuring the success of the program. To date, this program has been successful.
4. New South Wales, Australia: New South Wales (NSW), Australia has a very comprehensive policy for assessing and managing odour from stationary sources. It

Reputation Resources Results Odour Management in British Columbia: RWDI AIR Inc Review and Recommendations W05-1108 Final Report - vi - March 2005
includes an over-arching nuisance law, odour performance criteria, a three-level system of odour impact assessment, avoidance and mitigation strategies, negotiation between stakeholders, performance monitoring and complaint management, and regulation and enforcement options. Although this policy is still in draft form, it has been implemented since it was released in 2001. The odour management program set out in the policy is considered to be a big improvement on the previous ad-hoc system and is believed to be successful.
5. South Australia: The primary tool that South Australia uses to manage odour is minimum separation distance, both fixed and variable. A more detailed odour impact assessment using dispersion models may be required for development applications depending on the size or nature of the industry, the sensitivity of the location or the sensitivity of neighbouring receptors. South Australia also has a nuisance law, ambient odour criteria, and technology criteria. The odour management program of this jurisdiction is considered to be successful.
6. Wellington, New Zealand: The Wellington Regional Council developed an Air Quality Management Plan for the Wellington Region that includes odour. They make use of technology criteria in the form of the “Best Practicable Option” to prevent or minimise adverse effects. They do not have ambient or emission criteria but they could include an emission limit in a permit. They also have an odour intensity scale that is used by inspectors in the field. They also have a minimum threshold of 10 complaints before responding for facilities with chronic odour problems. This odour management program is not considered to be successful.
7. Germany: Germany has a unique approach to managing odours that incorporates all of the Frequency, Intensity, Duration, Offensiveness, Location (FIDOL) factors. The frequency, duration and intensity are measured using odour-hours. The immission limit values used to evaluate the measured odour-hours differ depending on the land use (residential vs. industrial and commercial). Recently, a system was developed to assess the hedonic tone or offensiveness of the odour as well. Pleasant odours are treated differently from neutral or unpleasant odours because they are less annoying. Several other approaches are also used to manage odours in Germany including an odour nuisance law, minimum separation distances (used primarily for agricultural and waste sources), an odour intensity scale, and quantitative emission criteria. The German odour management program is considered to be successful.
Reputation Resources Results Odour Management in British Columbia: RWDI AIR Inc Review and Recommendations W05-1108 Final Report - vii - March 2005
8. The Netherlands: The Netherlands has a relatively prescriptive, source-specific approach to managing odours. Some of the most interesting features of their approach are: the ambient odour criteria reflect the degree of offensiveness of the odour: criteria are more stringent for industries that emit odours that are more unpleasant; for many industries, emission factors have been developed for use in assessing the odour impact of a facility; source-specific odour abatement measures are provided; the licensing authority can revise existing permits as a result of new insights, facts or circumstances; and biannual national surveys are conducted to gauge the level of annoyance due to odours. The odour management program in the Netherlands is successful.
9. Japan: The odour management program is Japan is quite different from that of any other jurisdiction that was interviewed. The program itself is embodied in a national law. There are a number of ambient and emission standards that are enforceable by law and significant penalties for disobeying the law. There are also detailed measurement methodologies. They consider their odour management program to be successful at addressing issues related to large industry but not those related to household activities or smaller businesses.
Air quality complaints to BC regulatory agencies are frequently related to odour concerns. Sources of concern in BC include pulp and paper mills, petroleum refineries, fibre-reinforced plastic manufacture, auto body shops, rendering plants, agricultural activities, feed manufacture, composting operations, and landfills. A great deal of time and resources are expended by regulatory agencies in addressing odour-related complaints, which in many cases are not effectively resolved.
There are currently a number of regulatory agencies in BC that are involved in managing odour issues in the province. Under the authority of the provincial Environmental Management Act and GVRD Bylaw No. 937, WLAP and the GVRD are responsible for managing air quality, which can include odour issues. Pursuant to the Farm Practices Protection (Right to Farm) Act, the Ministry of Agriculture, Food and Fisheries (MAFF) is assigned the responsibility to resolve nuisance concerns, including odour concerns, relating to farm operations. Individual municipalities may also manage odour issues within their boundaries, typically relating to commercial or residential sources.
The GVRD has recently published a draft Odour Management Strategy that consists of a comprehensive, six-level approach to resolve odour issues in that jurisdiction. The nature,

Reputation Resources Results Odour Management in British Columbia: RWDI AIR Inc Review and Recommendations W05-1108 Final Report - viii - March 2005
severity, frequency and duration of specific odour problems, as indicated by the number of complaints and information gathered via inspection, determine the level of enforcement action. The draft Strategy clearly communicates to operators of odour-emitting sources and to the public how the GVRD intends to resolve odour problems as they occur.
New composting facilities in BC are regulated by the Organic Matter Recycling Regulation (pursuant to the Environmental Management Act and the Health Act) that requires that plans and specifications for new composting facilities must include an odour management plan. The accompanying “Compost Facility Requirements Guideline” points out that the least cost odour control option is to initially design the facility to reduce odours to the lowest possible level. The underlying principle is that “it is much better to prevent odours proactively than to play catch up after an odour problem has already occurred.”
The following recommendations were developed based on our understanding of which approaches might be successfully applied in British Columbia.
1. Air quality regulators in BC could develop an odour management program that incorporates a combination of several approaches, both reactive and proactive, that have proven to be successful in other jurisdictions, such as a nuisance law, ambient odour concentration criteria for design purposes, complaint criteria and technology criteria.
2. The Environmental Management Act definitions could be amended to refer to offensive odour as a substance that is controllable.
3. The Ministry of Water, Land and Air Protection could develop an odour complaint logging process that may include an odour hotline as well as a complaint database.
4. As a proactive measure to prevent new odour problems, air quality regulators in BC could adopt ambient odour criteria for design purposes and provide guidelines for odour impact assessments.
5. Air quality regulators in BC could use olfactometers to characterize odour source emission rates but further investigation of its use for ambient measurements and as a regulatory tool is needed.
6. Regulators could require, as a minimum, that state-of-the-art emission control equipment be installed at new facilities to control odours; that similar equipment be installed on existing odour-causing facilities; that best management practices (e.g., maintenance,

Reputation Resources Results Odour Management in British Columbia: RWDI AIR Inc Review and Recommendations W05-1108 Final Report - ix - March 2005
good housekeeping) be implemented; and that pollution prevention (reduction of process emissions) be practiced.
7. Regulators could develop an odour character index based on the FIDOL factors for use as an odour reporting and complaint verification tool.
8. Regulators could require the submission of Odour Management Plans with applications for new facilities or for existing facilities that become the subject of odour complaints.
9. Regulators in BC could develop scientifically-based, variable minimum distance separation guidelines for agricultural sources.
10. The Ministry of Water, Land and Air Protection (and the GVRD) could work with other ministries and local government to develop consistent and complementary requirements for locating facilities that have significant odour generation potential.
11. Regulatory agencies could involve the public and stakeholders in the resolution of odour problems directly by facilitating the formation of advisory committees.
12. As part of an odour management program for the province and the GVRD, key measures of success could be developed for future evaluation of the program.


Reputation Resources Results Odour Management in British Columbia: RWDI AIR Inc Review and Recommendations W05-1108 Final Report - xi - March 2005
TABLE OF CONTENTS
ACKNOWLEDGEMENTS ..........................................................................................................I
EXECUTIVE SUMMARY ....................................................................................................... III
1.0 INTRODUCTION............................................................................................................. 1
1.1 BACKGROUND INFORMATION ON ODOUR ................................................................ 1
1.2 OVERVIEW OF ODOUR ISSUES IN BRITISH COLUMBIA .............................................. 2
1.3 TERMS OF REFERENCE ............................................................................................. 3
1.4 STRUCTURE OF REPORT ........................................................................................... 4
2.0 ODOUR MANAGEMENT APPROACHES.................................................................. 5
2.1 AVOIDANCE OF NUISANCE LAWS............................................................................. 5
2.2 AMBIENT CONCENTRATION CRITERIA FOR INDIVIDUAL CHEMICALS....................... 7
2.3 AMBIENT CONCENTRATION CRITERIA FOR ODOUR................................................ 19
2.3.1 Olfactometry Standards ............................................................................ 32
2.4 EPISODE DURATION-FREQUENCY .......................................................................... 34
2.5 MINIMUM SEPARATION DISTANCES....................................................................... 36
2.5.1 Fixed Separation Distances....................................................................... 51
2.5.2 Variable Minimum Separation Distances ................................................. 51
2.6 ODOUR INTENSITY SCALES .................................................................................... 62
2.7 ODOUR INDEX........................................................................................................ 67
2.8 COMPLAINT CRITERIA............................................................................................ 67
2.9 QUANTITATIVE EMISSION CRITERIA ...................................................................... 71
2.10 TECHNOLOGY CRITERIA ........................................................................................ 80
3.0 REVIEW OF VARIOUS ODOUR MANAGEMENT PROGRAMS ........................ 82
3.1 ONTARIO................................................................................................................ 84
3.1.1 Regulatory Context ................................................................................... 84
3.1.2 Odour Criteria ........................................................................................... 85
3.1.3 Rationale for Establishing the Odour Criteria .......................................... 85
3.1.4 Responses to Specific Interview Questions .............................................. 86
3.2 BAY AREA AIR QUALITY MANAGEMENT DISTRICT, CALIFORNIA, USA................ 87
3.2.1 Regulatory Context ................................................................................... 88

Reputation Resources Results Odour Management in British Columbia: RWDI AIR Inc Review and Recommendations W05-1108 Final Report - xii - March 2005
3.2.2 Odour Criteria ........................................................................................... 88
3.2.3 Rationale for Establishing the Odour Criteria .......................................... 89
3.2.4 Responses to Specific Interview Questions .............................................. 90
3.3 KING COUNTY, WASHINGTON, USA...................................................................... 92
3.3.1 Regulatory Context ................................................................................... 93
3.3.2 Odour Criteria ........................................................................................... 93
3.3.3 Rationale for Establishing the Odour Criteria .......................................... 95
3.3.4 Responses to Specific Interview Questions .............................................. 95
3.4 NEW SOUTH WALES, AUSTRALIA .......................................................................... 97
3.4.1 Regulatory Context ................................................................................... 97
3.4.2 Odour Criteria ........................................................................................... 98
3.4.3 Rationale for Establishing the Odour Criteria .......................................... 99
3.4.4 Responses to Specific Interview Questions ............................................ 100
3.5 SOUTH AUSTRALIA .............................................................................................. 102
3.5.1 Regulatory Context ................................................................................. 103
3.5.2 Odour Criteria ......................................................................................... 104
3.5.3 Rationale for Establishing the Odour Criteria ........................................ 106
3.5.4 Responses to Specific Interview Questions ............................................ 106
3.6 WELLINGTON, NEW ZEALAND ............................................................................. 108
3.6.1 Regulatory Context ................................................................................. 109
3.6.2 Odour Criteria ......................................................................................... 110
3.6.3 Rationale for Establishing the Odour Criteria ........................................ 111
3.6.4 Responses to Specific Interview Questions ............................................ 112
3.7 GERMANY............................................................................................................ 115
3.7.1 Regulatory Context ................................................................................. 116
3.7.2 Odour Criteria ......................................................................................... 116
3.7.3 Rationale for Establishing the Odour Criteria ........................................ 119
3.7.4 Responses to Specific Interview Questions ............................................ 120
3.8 THE NETHERLANDS ............................................................................................. 122
3.8.1 Regulatory Context ................................................................................. 122
3.8.2 Odour Criteria ......................................................................................... 124

Reputation Resources Results Odour Management in British Columbia: RWDI AIR Inc Review and Recommendations W05-1108 Final Report - xiii - March 2005
3.8.3 Rationale for Establishing the Odour Criteria ........................................ 124
3.8.4 Responses to Specific Interview Questions ............................................ 125
3.9 JAPAN .................................................................................................................. 128
3.9.1 Regulatory Context ................................................................................. 128
3.9.2 Odour Criteria ......................................................................................... 129
3.9.3 Preventive Measures ............................................................................... 130
3.9.4 Rationale for Establishing the Odour Criteria ........................................ 131
3.9.5 Responses to Specific Interview Questions ............................................ 131
4.0 ODOUR ISSUES IN BRITISH COLUMBIA ............................................................ 133
4.1 WHEN DOES ODOUR BECOME A PROBLEM IN BC? .............................................. 133
4.1.1 Odour Issues in the GVRD ..................................................................... 133
4.1.2 Odour Issues Elsewhere in BC ............................................................... 135
4.2 EXISTING OR PROPOSED PROGRAMS IN BC.......................................................... 136
4.2.1 Environmental Management Act ............................................................ 136
4.2.2 Farm Practices Protection (Right to Farm) Act ...................................... 137
4.2.3 Compost Guideline / Organic Matter Recycling Regulation.................. 137
4.2.4 Draft GVRD Odour Management Strategy ............................................ 138
4.3 CASE STUDY: MONEY’S MUSHROOMS................................................................. 142
5.0 RECOMMENDATIONS FOR AN ODOUR MANAGEMENT PROGRAM IN
BRITISH COLUMBIA ................................................................................................ 145
6.0 BIBLIOGRAPHY......................................................................................................... 156
6.1 INTERNET............................................................................................................. 159
6.2 PERSONAL COMMUNICATIONS ............................................................................. 165
LIST OF TABLES
Table 1-1 Road Map to the Report ................................................................................................. 4
Table 2-1 Odour-based Concentration Criteria for Specific Compounds in Concentration Units . 9
Table 2-2 Ambient Odour Criteria in Odour Units (OU/m3, OU, OUE/m3) or Dilutions to
Threshold (D/T) .................................................................................................................... 20
Table 2-3 Comparison of Olfactometry Presentation Statistics.................................................... 33
Reputation Resources Results Odour Management in British Columbia: RWDI AIR Inc Review and Recommendations W05-1108 Final Report - xiv - March 2005
Table 2-4 Immission Limit Values Ilimit for Different Land Uses................................................. 34
Table 2-5 Immission Limit Values for Livestock Farming .......................................................... 35
Table 2-6 Minimum Separation Distances ................................................................................... 37
Table 2-7 Meteorological Conditions Used to Calculate the Six Frequency Curves of Odour
Annoyance Free Time used in OFFSET............................................................................... 55
Table 2-8 Calculation of N = Standard Pig Units, used in the Separation Guidelines for
Queensland Piggeries............................................................................................................ 58
Table 2-9 Values of Effluent Removal Factor, S1, used in the Separation Guidelines for
Queensland Piggeries............................................................................................................ 58
Table 2-10 Values of Receptor Type Factor, S2, used in the Separation Guidelines for
Queensland Piggeries............................................................................................................ 58
Table 2-11 Values of the Terrain Factor, S3, used in the Separation Guidelines for Queensland
Piggeries................................................................................................................................ 59
Table 2-12 Values of Surface Roughness Factor, S4, used in the Separation Guidelines for
Queensland Piggeries............................................................................................................ 59
Table 2-13 Odour Intensity Scales................................................................................................ 64
Table 2-14 Texas Commission on Environmental Quality Odour Classification Table .............. 66
Table 2-15 Relationship between Odour Intensity and Odour Index ........................................... 67
Table 2-16 Odour Emission Criteria............................................................................................. 73
Table 2-17 Values of Constant k as a Function of Volumetric Flowrate Q (m3/s) Used in
Calculation of Maximum Permissible Concentration of Odour Substances in Liquid Effluent
........................................................................................................................................... 79
Table 3-1 Summary of Odour Management Approaches Used by Jurisdictions that were
Interviewed ........................................................................................................................... 83
Table 3-2 Odour Prevention Level Characteristics....................................................................... 94
LIST OF FIGURES
Figure 1 Estimated setback distances (in feet) from farms at different odor annoyance-free
frequency requirements, leeward of the prevailing wind from animal operations. ............ 55

Reputation Resources Results Odour Management in British Columbia: RWDI AIR Inc Review and Recommendations W05-1108 Final Report - xv - March 2005
LIST OF APPENDICES
Appendix A Terms of Reference
Appendix B Supplemental Information for Japan
Appendix C Texas Commission on Environmental Quality Odour Complaint Investigation Procedures
Appendix D Transcripts from Interviews
LIST OF ACRONYMS
AAQC Ambient Air Quality Criteria ALARA As Low As Reasonably Achievable APCO Air Pollution Control Officer AQMP Air Quality Management Plan AWMA Air & Waste Management Association BAAQMD Bay Area Air Quality Management District BATEA Best Available Technology Economically Achievable BC British Columbia BImSchG German Federal Immission Control Act BPO Best Practicable Option D/T Dilution to Threshold DEQ Department of Environmental Quality DNRP Department of Natural Resources and Parks EPA Environmental Protection Agency/ Authority CEN European Committee for Standardization FIDOL Frequency Intensity Duration Offensiveness Location FIRB Farm Industry Review Board GOAA Guideline on Odour in Ambient Air GVRD Greater Vancouver Regional District ISO International Organization for Standardization kg/hr Kilograms per hour LSU Livestock Siting Unit lpm Litres per minute

Reputation Resources Results Odour Management in British Columbia: RWDI AIR Inc Review and Recommendations W05-1108 Final Report - xvi - March 2005
m3/s Cubic metres per second MAFF Ministry of Agriculture, Food and Fisheries MDS Minimum Distance Separation mg/m3 Milligrams per cubic metre MOE Ministry of Environment NCDAQ North Carolina Division of Air Quality NeR Netherlands Emission Guidelines for Air NSW New South Wales OC Odour Concentration OFFSET Odour From Feedlots Setback Estimation Tool OU Odour Units OU/m3 Odour units per cubic metre OUE/m3 European odour units per cubic metre POI Point Of Impingement ppm Parts per million RWSP Regional Wastewater Services Plan TA Luft Technical Instruction on Air Quality Control TCEQ State of Texas’ Commission on Environmental Quality USA United States of America WLAP Ministry of Water, Land and Air Protection WTD Waste Treatment Division WWTP Wastewater Treatment Plant µg/m3 Micrograms per cubic metre

Reputation Resources Results Odour Management in British Columbia: RWDI AIR Inc Review and Recommendations W05-1108 Final Report - 1 - March 2005
1.0 INTRODUCTION
The objective of this report is to provide the Ministry of Water, Land and Air Protection (WLAP), the Greater Vancouver Regional District (GVRD), and the other members of the Steering Committee with recommendations for odour management approaches that would be effective in British Columbia (BC), based on a review of successful odour management programs in other jurisdictions. RWDI AIR Inc., in conjunction with RSS Consulting, was retained to undertake this study.
1.1 BACKGROUND INFORMATION ON ODOUR
The issue of odours is very complex because odour, which is the sensation that is caused by a complex mixture of odorants, is very subjective and therefore difficult to measure. Various measurement techniques, such as gas chromatography or open-path Fourier transform infrared spectroscopy, have been developed to measure odour; however, such instruments measure only the concentrations of different odorants, which are then compared to odour threshold values, developed using human odour panels. Thus, to date, the best instrument for measuring odour is still the human nose. Some individuals have far more sensitive noses and therefore will detect an odour at much lower concentrations than others. In addition, one person may find an odour to be objectionable (e.g., roasting coffee or malt from a brewery) while another may not. To completely describe the nuisance characteristics of an odour five different dimensions, commonly referred to as “FIDOL”, are frequently considered:
• Frequency – the number of times an odour is detected during a time period, • Intensity – the concentration or strength of the odour, • Duration of the period in which the odour remains detectable, • Offensiveness or hedonic tone of the odour, and • Location of the odour.
Generally the more frequently an odour is detected the greater potential for nuisance. The time of occurrence of an odour can also be important. An odour that occurs when there is a greater likelihood of people being exposed to that odour is more likely to lead to a nuisance, while an odour that occurs while people are not at home is less likely to lead to a nuisance.
Intensity of an odour is a person’s perception of it strength. The intensity of an odour is related to the odour concentration, or the concentration of the compounds involved. A relationship

Reputation Resources Results Odour Management in British Columbia: RWDI AIR Inc Review and Recommendations W05-1108 Final Report - 2 - March 2005
exists between intensity and concentration, but is not direct. The intensity of an odour is not its character, quality, offensiveness or hedonic tone (unpleasantness or pleasantness).
The duration of odour impact depends on the variation in time of odorous emissions from the source. In addition, meteorological conditions can be a strong influence on the duration of odour impact. Stable meteorological conditions, which can be more common over night can lead to events of longer duration. Long periods of continuous odour exposure can have two effects; adaptation and sensitisation. Adaptation is where the perceived odour intensity decreases with repeated or continuous exposure. Sensitisation is where perceived intensity increases with repeated or continuous exposure.
The offensiveness, or hedonic tone, of an odour is related to the perceived pleasantness or unpleasantness of the odour. It is not related to the odour intensity or concentration.
A person’s sensitivity to odour can depend on the location of the receiving environment. A person living and working in an agricultural area may be more tolerant and less sensitive to agricultural odours than a person living in a suburban environment.
All of these FIDOL factors are subjective in nature and therefore difficult to measure. Of course, if something is difficult to measure, it is also difficult to set a regulation and that regulation is difficult to enforce. Nonetheless, the issue of odours is very important because odorants can be an extreme nuisance and, with sufficient exposure, they can induce adverse health effects, such as nausea and headaches.
The possible impacts of odours range from mere detection to a public nuisance or, at elevated concentrations, a health hazard. Most odours are believed to constitute a public nuisance rather than a health hazard (Bates and Caton, 2002). However, a number of physiological manifestations of offensive odours have been reported in published literature, including nausea, vomiting, headache, loss of appetite, sleeplessness, upset stomach, and throat irritation.
1.2 OVERVIEW OF ODOUR ISSUES IN BRITISH COLUMBIA
Air quality complaints to BC regulatory agencies are frequently related to odour concerns. Sources of concern in BC include pulp and paper mills, petroleum refineries, fibre-reinforced plastic manufacture, auto body shops, rendering plants, agricultural activities, feed manufacture, composting operations, and landfills. A great deal of time and resources are expended by these agencies in addressing odour-related complaints, which in many cases are not effectively

Reputation Resources Results Odour Management in British Columbia: RWDI AIR Inc Review and Recommendations W05-1108 Final Report - 3 - March 2005
resolved. The resolution of these complaints is problematic for a number of reasons: the subjectivity involved in odour complaints related to frequency, intensity, duration, offensiveness; the difficulty in measuring and identifying odorous compounds; and the determination as to whether odours are considered to be pollution under the Environmental Management Act.
The legislative context for odour issues in BC consists of the provincial Environmental Management Act, the GVRD Air Quality Management Bylaw No. 937, the provincial Organic Matter Recycling Regulation, and the provincial Farm Practices Protection (Right to Farm) Act. These acts and regulations are discussed in more detail in Section 4.2. The GVRD has recently published a draft Odour Management Strategy to address odour sources within its jurisdiction; however, such a strategy does not yet exist for odour sources in the rest of the province. Thus, there is a need to develop a comprehensive and cohesive approach to odour management in BC.
1.3 TERMS OF REFERENCE
The objectives of this project were to:
• Research and review odour management programs in other jurisdictions that have established and successfully used ambient and/or emission odour criteria; and
• Recommend odour management approaches for the GVRD and WLAP that would be effective in BC.
The full terms of reference for this project are included in Appendix A. The first task of the project was to conduct a review of ambient and emission standards, guidelines and objectives in other jurisdictions. Upon the completion of this task, a total of twelve jurisdictions of particular interest were selected, in consultation with the Steering Committee, for focussed interviews. A standard set of interview questions was developed and approved by the Steering Committee. Of the 12 jurisdictions selected for interview, nine jurisdictions kindly agreed to be interviewed. Information gathered in the research phase and in the focussed interviews was summarized. In order to understand the applicability of the observed odour management approaches to the province of BC, odour issues and their current legislative context in BC were assessed by contacting select agency staff for anecdotal information and reviewing relevant documents (e.g. the GVRD draft odour management strategy and the WLAP compost facility requirements guideline). The information on successful odour management approaches in other jurisdictions formed the basis for the recommended approaches for BC.

Reputation Resources Results Odour Management in British Columbia: RWDI AIR Inc Review and Recommendations W05-1108 Final Report - 4 - March 2005
1.4 STRUCTURE OF REPORT
Section 2 of the report describes different approaches to managing odours. Section 3 summarizes the odour management approaches of the jurisdictions that were interviewed. Section 4 provides the context of odour issues and current legislation in BC, and Section 5 provides recommendations for an odour management program in BC.
All tasks from the Terms of Reference have been addressed in this report. Table 1-1 lists each task and the section(s) where it is addressed.
Table 1-1 Road Map to the Report
Task from the Terms of Reference Corresponding Section in Report 1. Conduct initial conference call to determine terms of reference
Appendix A
2. Conduct a review of ambient standards/guidelines/ objectives
Subsections 2.2, 2.3, 2.4, 2.6, 2.7
3. Conduct a review of emission standards/guidelines/ objectives
Subsections 2.9 and 2.10
4. Provide recommendations for BC Section 5.0 5. Provide a more detailed description of odour management program components that have been successfully applied to the agricultural and industrial sectors
Section 3.0
6. Provide brief description of odour management programs where ambient and/or emission standards have been successfully applied and explain the rationale that other jurisdictions have used to establish them
- Descriptions of successful odour management programs: Section 3.0 - Rationale for establishing them: Subsections 3.1.3, 3.2.3, 3.3.3, 3.4.3, 3.5.3, 3.6.3, 3.7.3, 3.8.3, 3.9.4
7. Conduct a review to determine when an odour becomes a problem
Subsections 3.1.4.2, 3.2.4.2, 3.3.4.2, 3.4.4.2, 3.5.4.2, 3.6.4.2, 3.7.4.2, 3.8.4.3, 3.9.5.2, 4.1
8. Provide information on how an odour and/or emission standard is established
Subsections 3.1.3, 3.2.3, 3.3.3, 3.4.3, 3.5.3, 3.6.3, 3.7.3, 3.8.3, 3.9.4 Subsections 3.1.4.3, 3.2.4.4, 3.3.4.3, 3.4.4.3, 3.5.4.3, 3.6.4.3, 3.7.4.3, 3.8.4.4, 3.9.5.3
9. Report on the experience and procedures used in other jurisdictions regarding the efficacy of odour avoidance/ planning technical tools and other approaches
Subsections 3.1.4.4, 3.2.4.5, 3.3.4.4, 3.4.4.4, 3.5.4.4, 3.6.4.4, 3.7.4.4, 3.8.4.5, 3.9.5.4

Reputation Resources Results Odour Management in British Columbia: RWDI AIR Inc Review and Recommendations W05-1108 Final Report - 5 - March 2005
2.0 ODOUR MANAGEMENT APPROACHES
There are many different approaches to managing odours. These approaches can be classified as being related to either ambient odour or emissions of odour although in some jurisdictions, most notably Japan, the standards are applied to both emissions of odour and ambient odour. Nonetheless, most of the approaches relate to ambient odour. The various approaches uncovered during this study were classified under the following ten headings:
Ambient 1. Avoidance of nuisance law, 2. Ambient concentration criteria for individual chemicals (units of µg/m3 or ppm), 3. Ambient concentration criteria for odour (units of OU, OU/m3, OUE/m3 or D/T), 4. Episode duration-frequency (units of odour-hours), 5. Minimum separation distances (units of distance), 6. Odour intensity scales, 7. Odour index, 8. Complaint criteria,
Emission 9. Quantitative emission criteria (units of concentration or flow rate), and 10. Technology criteria.
Some of the approaches are qualitative in nature and therefore relatively subjective while others, such as ambient concentration limits for individual chemicals, are definitely quantitative. There are also semi-quantitative approaches, such as odour intensity scales where a few words are used to describe the odour intensity applicable to each level.
These approaches are not mutually exclusive and are often used in combination in a single odour management program. For instance, Western Australia makes use of quantitative odour concentration criteria, an odour intensity scale and minimum separation distances.
The various approaches are discussed in greater detail in the following subsections.
2.1 AVOIDANCE OF NUISANCE LAWS
The most common and also the oldest approach to managing odour is the Avoidance of Nuisance Law. Odour regulations in 42 of the 50 states in the United States of America (USA) are of this

Reputation Resources Results Odour Management in British Columbia: RWDI AIR Inc Review and Recommendations W05-1108 Final Report - 6 - March 2005
type (Epstein and Freeman, 2004). In Europe, nuisance laws date back to the late 19th century (Van Harreveld, 2005). This type of law is based on either “nuisance” or “quality of life” narrative standards. The exact wording varies from jurisdiction to jurisdiction but essentially requires that odour from a facility will not result in a nuisance or cause pollution. In many jurisdictions (e.g., New South Wales and Ontario) the only regulation related to odour is a nuisance law and all other aspects of the odour management program are simply guidelines that are not enforceable.
The following are some examples of nuisance laws (McGinley et al., 2000):
“A person shall not discharge from any source whatsoever such quantities of air contaminants or other material which will cause injury, detriment, nuisance, or annoyance to any considerable number of persons or to the public, or which endanger the comfort of, repose, health or safety of any such persons or the public, or which cause, or have a natural tendency to cause, injury or damage to business or property…The provisions of this rule shall not apply to odours emanating from agricultural operations necessary for growing crops or the raising of fowl or animals.” [South Coast Air Quality Management District, California, Rule 402, Adopted May 7, 1976]
“Anything which is injurious to health, or indecent or offensive to the senses, or an obstruction to the free use of property, so as to interfere with the comfortable enjoyment of life or property, is a nuisance.” [Minnesota Statutes, Section 561.01, 1976]
“…air contaminants (including odour) in qualities and duration to injure human health and welfare” [Alabama]
“…unreasonably interfere with the enjoyment of life and property.” [Alaska]
“…unreasonably interferes with the comfortable enjoyment of life or property of a substantial part of the community.” [Arizona]
“…Odour constitutes a nuisance if it unreasonably interferes with the enjoyment of life or use of property.” [Connecticut]
“…odours beyond his property…to create a public nuisance…defined includes affecting a considerable number of persons and injurious to health or interfere with the comfortable enjoyment of life and property. [Montana]
These laws are very general and therefore can be difficult to enforce. Epstein and Freeman (2004) claim that such standards fail to satisfy all involved parties:
• Neighbours are unsure what protection the standards provide;

Reputation Resources Results Odour Management in British Columbia: RWDI AIR Inc Review and Recommendations W05-1108 Final Report - 7 - March 2005
• Facility owners and operators are vulnerable to hostile neighbours who can leverage regulatory enforcement pressure by claiming a problem exists; and
• Regulators are caught in the middle without a clear or equitable means to resolve the situation.
Results of the interviews conducted for this study indicate that the effectiveness of a nuisance law is highly dependent on the ability of the regulator to win court cases and thereby develop good case law. For example, the Bay Area Air Quality Management District (BAAQMD) in California has a team of prosecutors that have been so successful in the courts that they find their general odour nuisance law and associated good case law have been more effective than the individual standards for different chemicals (Hess, 2005). By contrast, in Wellington, New Zealand, their odour regulation has been undermined by case law that requires a 360 degree sweep of a suspected odour source, to confirm it is the source, which has proved to be impractical (Markland, 2005). The BAAQMD odour management program is successful because of its nuisance law and good case law whereas the opposite is true for Wellington.
2.2 AMBIENT CONCENTRATION CRITERIA FOR INDIVIDUAL CHEMICALS
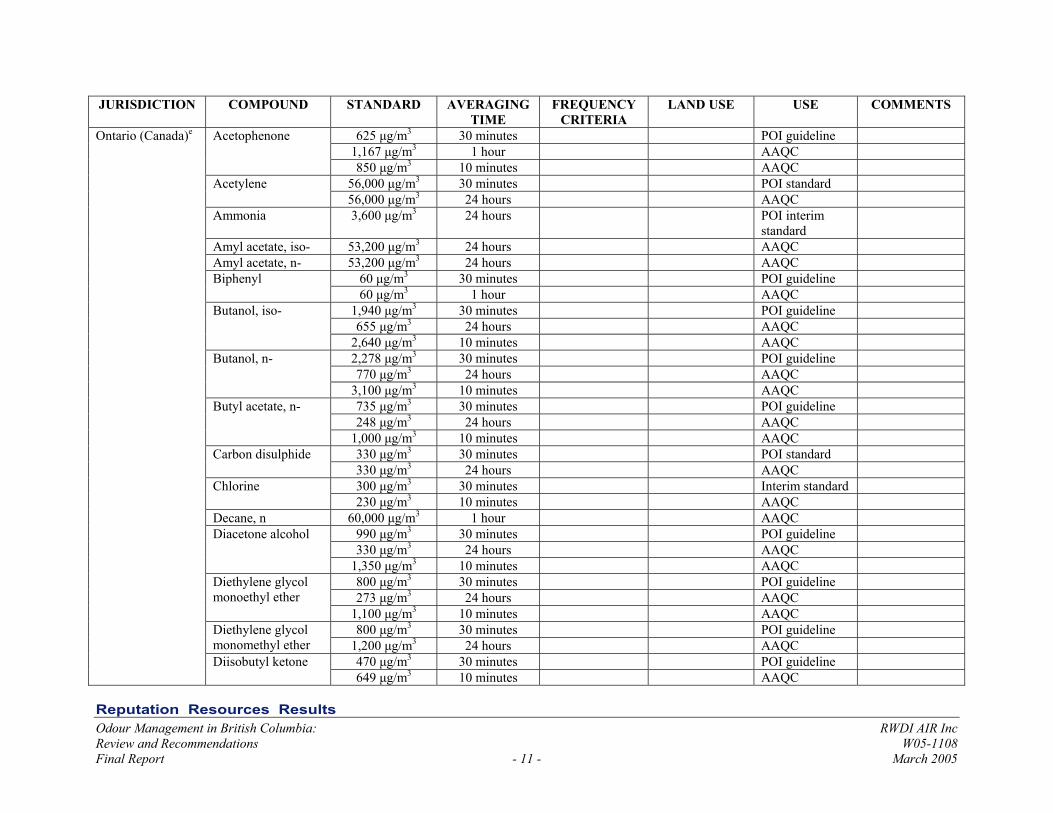
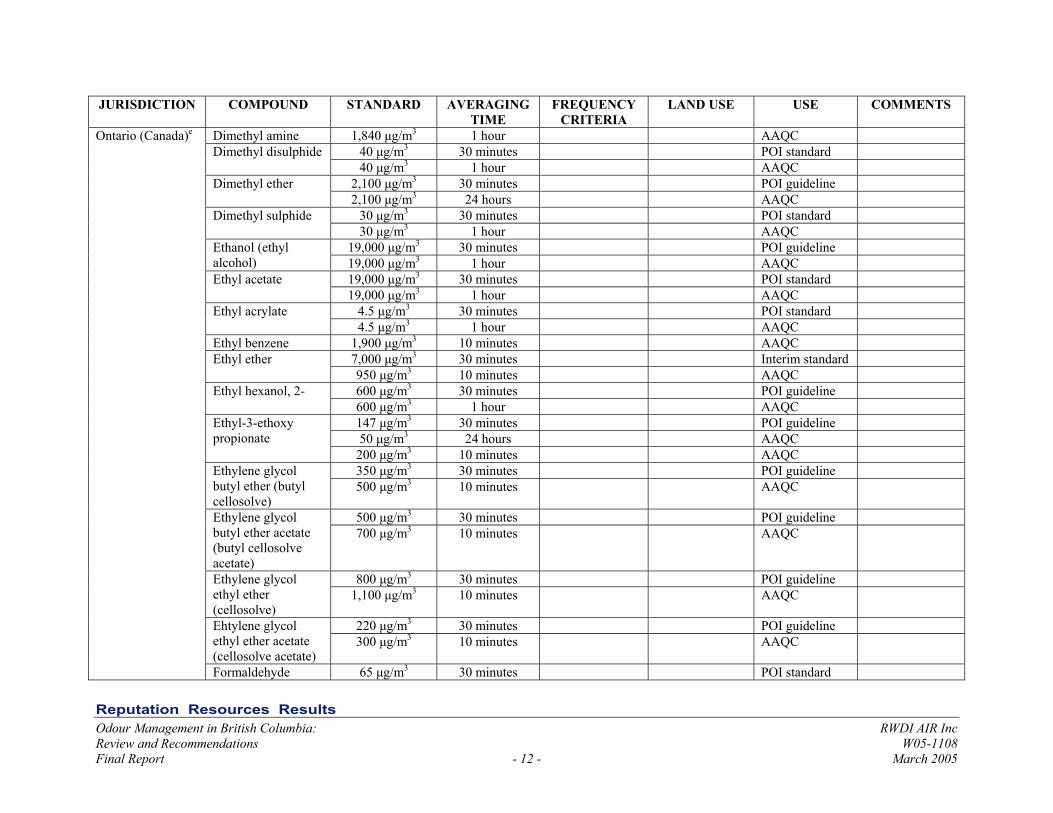
Many jurisdictions in North America and a few elsewhere in the world have quantitative ambient concentration criteria for individual chemicals that are odorous. All the criteria that were found during the literature search are summarized in Table 2-1. The regulatory status of these criteria varies from guidelines or objectives to enforceable standards. Most, but not all, of the criteria are associated with an averaging period. Very few have associated frequency criteria (e.g., observed concentrations must be less than the criteria value 98% of the time) and therefore are assumed to be maximum criteria. Similarly, few of the criteria are associated with a specific land use, and therefore are most likely applicable at any receptor beyond the facility boundary.
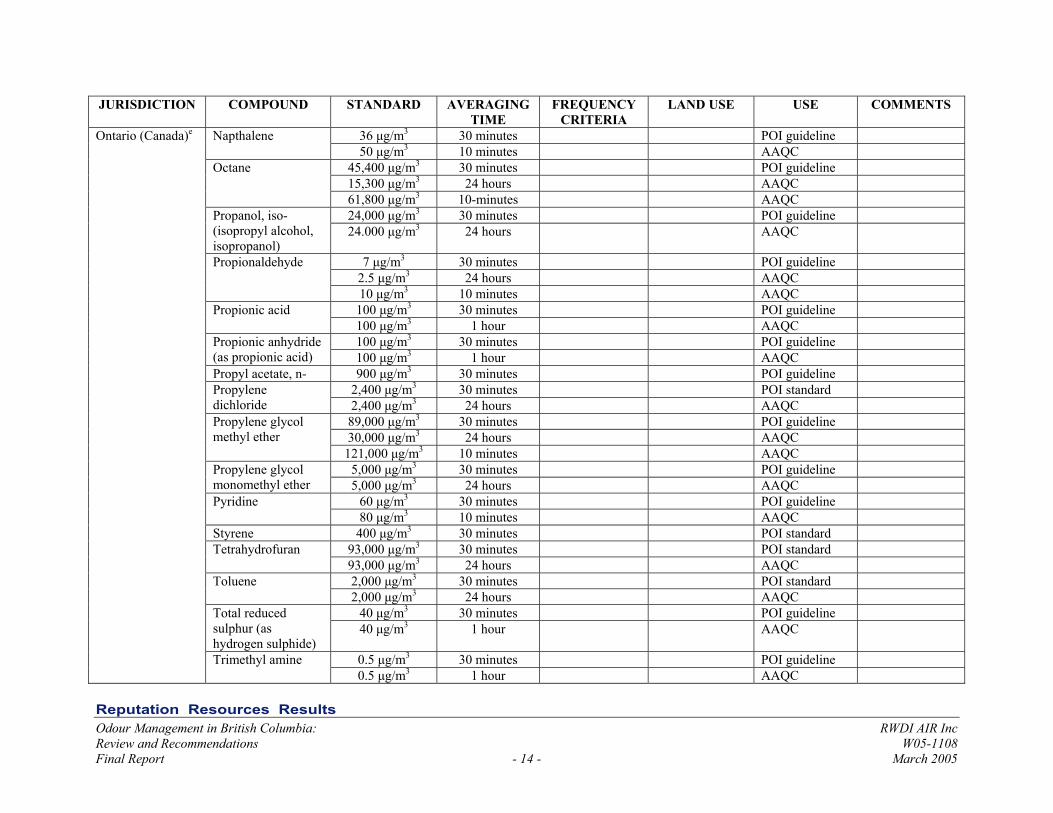
In Canada, the Alberta Environment air quality objectives for ammonia (hourly) and hydrogen sulphide (hourly and daily) are based on odour perception. Ontario has a very comprehensive list of chemicals for which there are odour-based point of impingement (POI) standards, POI guidelines, and ambient air quality criteria (AAQC). The averaging periods associated with the Ontario criteria include 10 minutes, 30 minutes, one hour and 24 hours.
In the USA, there are very few chemicals that are regulated to avoid odours. The most commonly regulated odorous substance is hydrogen sulphide. It is regulated in California, Connecticut, Idaho, Illinois, Minnesota, New Mexico, New York State, New York City, North

Reputation Resources Results Odour Management in British Columbia: RWDI AIR Inc Review and Recommendations W05-1108 Final Report - 8 - March 2005
Dakota, Pennsylvania, Texas and Washington. The numerical value of the standards varies from 1 ppb in New York City (no averaging period) to 100 ppb for a one-hour averaging period in Pennsylvania. Other odorants that are regulated in the USA include sulphur dioxide1 in the BAAQMD of California (e.g., 500 ppb for 3 minutes); methyl mercaptan in Connecticut (2.2 µg/m3); ammonia in Missouri (144 ppb); and total reduced sulphur in Nebraska (100 ppb for 30 minutes).
Elsewhere in the world, New South Wales, Australia has design criteria for new or modified facilities for a range of odorants. They use an averaging period of 3 minutes and require that predicted concentrations at or beyond the plant boundary are less than these values 100% of the time for a Level 1 Screening Assessment and less than these values 99.9% of the time for a Level 2 Refined Assessment. Tasmania has adopted a similar system but for fewer compounds. New South Wales also has criteria for hydrogen sulphide in a format that resembles the format for their odour concentration criteria (see Table 2-2): the averaging period is less than one second and the criteria are more stringent (lower concentration) for more densely populated areas.
In Japan, the national Offensive Odour Control Law provides a range of maximum permissible concentrations at ground-level on the boundary line of a place of business for 22 odorants. Local governments select standards for their jurisdiction that are within these ranges of values. In Korea, eight odorants are regulated and they differentiate between industrial and residential areas.
1 Most jurisdictions regulate sulphur dioxide (SO2) because of its effects on human health and vegetation; however, the BAAQMD Regulation 7 on Odorous Substances clearly refers to the Rule 1 of Regulation 9, regarding SO2. Sulphur dioxide is characterized as having a pungent, irritating odour familiar as the smell of a just-struck match.

Reputation Resources Results Odour Management in British Columbia: RWDI AIR Inc Review and Recommendations W05-1108 Final Report - 9 - March 2005
Table 2-1 Odour-based Concentration Criteria for Specific Compounds in Concentration Units
JURISDICTION COMPOUND STANDARD AVERAGING TIME
FREQUENCY CRITERIA
LAND USE USE COMMENTS
NORTH AMERICA Ammonia 1,400 µg/m3 1 hour
14 µg/m3 1 hour Alberta (Canada)i
Hydrogen sulphide 4 µg/m3 24 hours
Air quality objective
Based on odour perception
60 ppb 3 minutes Hydrogen sulphide 30 ppb 60 minutes
Regulation 9, Rule 2
Based on emissions during 24 hour period
500 ppb 3 minute 250 ppb 60 minutes
Bay Area Air Quality Management District (California, USA)
Sulphur dioxide
50 ppb 24 hours
Beyond property line if property is physically secured against public access
Regulation 9, Rule 1
Ships are exempt
30 ppb 1 hour State Standard Based on nuisance
California (USA)h,j,k
Hydrogen sulphide
8 ppb Reference Inhalation Standard Health-based
California Office of Environmental Health Hazard
Hydrogen sulphide 6.3 µg/m3 Connecticut (USA)h,j Methyl mercaptan 2.2 µg/m3
30 ppb 30 minutes Idaho (USA)j Hydrogen sulphide 10 ppb 24 hours
Illinois (USA)k Hydrogen sulphide 10 ppb 8 hours Health-based standard
50 ppb 30 minutes Not to be exceeded more than two times per year
Property line Minnesota (USA)j,k
Hydrogen sulphide
30 ppb 30 minutes Not to be exceeded more than two times in a five-day period
MPCA Standard for animal feeding operations over 1000 animal units – nuisance based

Reputation Resources Results Odour Management in British Columbia: RWDI AIR Inc Review and Recommendations W05-1108 Final Report - 10 - March 2005
JURISDICTION COMPOUND STANDARD AVERAGING TIME
FREQUENCY CRITERIA
LAND USE USE COMMENTS
60 ppb 1 hour Acute Minnesota (USA)j,k
Hydrogen sulphide
7 ppb 3 month
Evaluated at the receptor
MDH Inhalation Health Risk Value Sub-chronic
Missouri (USA)k Ammonia 144 ppb One producer Ambient acceptable level
Nebraska (USA)j,k Total reduced sulphur
100 ppb 30 minutes Health-based standard that applies to CAFOs
Nebraska Department of Environmental Quality
30 – 100 ppb 30 minutes New Mexico (USA)j
Hydrogen sulphide 10 ppb 1 hour 10 ppb 1 hour Standard Determined by
the Cadmium Hydroxide-Methylene Blue method corrected to 25 deg C and 760 mm Hg
New York State (USA)a, j,k
Hydrogen sulphide
0.7 ppb 1 year New York City (New York State, USA)h, j
Hydrogen sulphide 1 ppb Off-site at sensitive receptors (e.g., schools or homes)
Guideline For wastewater treatment plants
North Dakota (USA)h, j
Hydrogen sulphide 50 ppb instantaneous Odour inspectors apply the standard only in response to complaints, not as a design standard
Two samples taken at least 15 minutes apart within a 60-minute period
2,500 µg/m3 30 minutes POI* standard Acetic acid 2,500 µg/m3 24 hours AAQC**
48,000 µg/m3 30 minutes POI standard
Ontario (Canada)e
Acetone 48,000 µg/m3 24 hours AAQC
Reputation Resources Results Odour Management in British Columbia: RWDI AIR Inc Review and Recommendations W05-1108 Final Report - 11 - March 2005
JURISDICTION COMPOUND STANDARD AVERAGING TIME
FREQUENCY CRITERIA
LAND USE USE COMMENTS
625 µg/m3 30 minutes POI guideline 1,167 µg/m3 1 hour AAQC
Acetophenone
850 µg/m3 10 minutes AAQC 56,000 µg/m3 30 minutes POI standard Acetylene 56,000 µg/m3 24 hours AAQC
Ammonia 3,600 µg/m3 24 hours POI interim standard
Amyl acetate, iso- 53,200 µg/m3 24 hours AAQC Amyl acetate, n- 53,200 µg/m3 24 hours AAQC
60 µg/m3 30 minutes POI guideline Biphenyl 60 µg/m3 1 hour AAQC
1,940 µg/m3 30 minutes POI guideline 655 µg/m3 24 hours AAQC
Butanol, iso-
2,640 µg/m3 10 minutes AAQC 2,278 µg/m3 30 minutes POI guideline 770 µg/m3 24 hours AAQC
Butanol, n-
3,100 µg/m3 10 minutes AAQC 735 µg/m3 30 minutes POI guideline 248 µg/m3 24 hours AAQC
Butyl acetate, n-
1,000 µg/m3 10 minutes AAQC 330 µg/m3 30 minutes POI standard Carbon disulphide 330 µg/m3 24 hours AAQC 300 µg/m3 30 minutes Interim standard Chlorine 230 µg/m3 10 minutes AAQC
Decane, n 60,000 µg/m3 1 hour AAQC 990 µg/m3 30 minutes POI guideline 330 µg/m3 24 hours AAQC
Diacetone alcohol
1,350 µg/m3 10 minutes AAQC 800 µg/m3 30 minutes POI guideline 273 µg/m3 24 hours AAQC
Diethylene glycol monoethyl ether
1,100 µg/m3 10 minutes AAQC 800 µg/m3 30 minutes POI guideline Diethylene glycol
monomethyl ether 1,200 µg/m3 24 hours AAQC 470 µg/m3 30 minutes POI guideline
Ontario (Canada)e
Diisobutyl ketone 649 µg/m3 10 minutes AAQC
Reputation Resources Results Odour Management in British Columbia: RWDI AIR Inc Review and Recommendations W05-1108 Final Report - 12 - March 2005
JURISDICTION COMPOUND STANDARD AVERAGING TIME
FREQUENCY CRITERIA
LAND USE USE COMMENTS
Dimethyl amine 1,840 µg/m3 1 hour AAQC 40 µg/m3 30 minutes POI standard Dimethyl disulphide 40 µg/m3 1 hour AAQC
2,100 µg/m3 30 minutes POI guideline Dimethyl ether 2,100 µg/m3 24 hours AAQC
30 µg/m3 30 minutes POI standard Dimethyl sulphide 30 µg/m3 1 hour AAQC
19,000 µg/m3 30 minutes POI guideline Ethanol (ethyl alcohol) 19,000 µg/m3 1 hour AAQC
19,000 µg/m3 30 minutes POI standard Ethyl acetate 19,000 µg/m3 1 hour AAQC
4.5 µg/m3 30 minutes POI standard Ethyl acrylate 4.5 µg/m3 1 hour AAQC
Ethyl benzene 1,900 µg/m3 10 minutes AAQC 7,000 µg/m3 30 minutes Interim standard Ethyl ether 950 µg/m3 10 minutes AAQC 600 µg/m3 30 minutes POI guideline Ethyl hexanol, 2- 600 µg/m3 1 hour AAQC 147 µg/m3 30 minutes POI guideline 50 µg/m3 24 hours AAQC
Ethyl-3-ethoxy propionate
200 µg/m3 10 minutes AAQC 350 µg/m3 30 minutes POI guideline Ethylene glycol
butyl ether (butyl cellosolve)
500 µg/m3 10 minutes AAQC
500 µg/m3 30 minutes POI guideline Ethylene glycol butyl ether acetate (butyl cellosolve acetate)
700 µg/m3 10 minutes AAQC
800 µg/m3 30 minutes POI guideline Ethylene glycol ethyl ether (cellosolve)
1,100 µg/m3 10 minutes AAQC
220 µg/m3 30 minutes POI guideline Ehtylene glycol ethyl ether acetate (cellosolve acetate)
300 µg/m3 10 minutes AAQC
Ontario (Canada)e
Formaldehyde 65 µg/m3 30 minutes POI standard

Reputation Resources Results Odour Management in British Columbia: RWDI AIR Inc Review and Recommendations W05-1108 Final Report - 13 - March 2005
JURISDICTION COMPOUND STANDARD AVERAGING TIME
FREQUENCY CRITERIA
LAND USE USE COMMENTS
1,000 µg/m3 30 minutes POI standard Furfural 1,000 µg/m3 1 hour AAQC
30 µg/m3 30 minutes POI, standard Hydrogen sulphide 30 µg/m3 1 hour (A) AAQC
1,220 µg/m3 30 minutes POI guideline 412 µg/m3 24 hours AAQC
Isobutyl acetate
1,660 µg/m3 10 minutes AAQC Isopropyl ether 220 µg/m3 30 minutes POI guideline
1,470 µg/m3 30 minutes POI guideline 500 µg/m3 24 hours AAQC
Isopropyl acetate
2,000 µg/m3 10-minutes AAQC Isopropyl benzene 100 µg/m3 30 minutes POI standard
20 µg/m3 30 minutes POI standard Mercaptans (as Methyl mercaptan) –total
20 µg/m3 1 hour (A) AAQC
2,000 µg/m3 30 minutes POI guideline Methacrylic acid 2,000 µg/m3 24 hours AAQC
4 µg/m3 30 minutes POI standard Methyl acrylate 4 µg/m3 1 hour AAQC
1,200 µg/m3 30 minutes POI standard Methyl isobutyl ketone 1,200 µg/m3 24 hours AAQC Methyl mercapto aniline
UD
860 µg/m3 30 minutes POI standard Methyl methacrylate 860 µg/m3 24 hours AAQC
Methyl tert-butyl ether
2,200 µg/m3 30 minutes POI guideline
460 µg/m3 30 minutes POI 160 µg/m3 24 hours AAQC
Methyl-2-hexanone, 5-
630 µg/m3 1 hour AAQC Milk Powder 20 µg/m3 24 hours AAQC
3,500 µg/m3 1 hour AAQC Monochlorobenzene 4,500 µg/m3 10 minutes AAQC
25 µg/m3 30 minutes POI standard
Ontario (Canada)e
Monomethyl amine 25 µg/m3 24 hours AAQC
Reputation Resources Results Odour Management in British Columbia: RWDI AIR Inc Review and Recommendations W05-1108 Final Report - 14 - March 2005
JURISDICTION COMPOUND STANDARD AVERAGING TIME
FREQUENCY CRITERIA
LAND USE USE COMMENTS
36 µg/m3 30 minutes POI guideline Napthalene 50 µg/m3 10 minutes AAQC
45,400 µg/m3 30 minutes POI guideline 15,300 µg/m3 24 hours AAQC
Octane
61,800 µg/m3 10-minutes AAQC 24,000 µg/m3 30 minutes POI guideline Propanol, iso-
(isopropyl alcohol, isopropanol)
24.000 µg/m3 24 hours AAQC
7 µg/m3 30 minutes POI guideline 2.5 µg/m3 24 hours AAQC
Propionaldehyde
10 µg/m3 10 minutes AAQC 100 µg/m3 30 minutes POI guideline Propionic acid 100 µg/m3 1 hour AAQC 100 µg/m3 30 minutes POI guideline Propionic anhydride
(as propionic acid) 100 µg/m3 1 hour AAQC Propyl acetate, n- 900 µg/m3 30 minutes POI guideline
2,400 µg/m3 30 minutes POI standard Propylene dichloride 2,400 µg/m3 24 hours AAQC
89,000 µg/m3 30 minutes POI guideline 30,000 µg/m3 24 hours AAQC
Propylene glycol methyl ether
121,000 µg/m3 10 minutes AAQC 5,000 µg/m3 30 minutes POI guideline Propylene glycol
monomethyl ether 5,000 µg/m3 24 hours AAQC 60 µg/m3 30 minutes POI guideline Pyridine 80 µg/m3 10 minutes AAQC
Styrene 400 µg/m3 30 minutes POI standard 93,000 µg/m3 30 minutes POI standard Tetrahydrofuran 93,000 µg/m3 24 hours AAQC 2,000 µg/m3 30 minutes POI standard Toluene 2,000 µg/m3 24 hours AAQC
40 µg/m3 30 minutes POI guideline Total reduced sulphur (as hydrogen sulphide)
40 µg/m3 1 hour AAQC
0.5 µg/m3 30 minutes POI guideline
Ontario (Canada)e
Trimethyl amine 0.5 µg/m3 1 hour AAQC

Reputation Resources Results Odour Management in British Columbia: RWDI AIR Inc Review and Recommendations W05-1108 Final Report - 15 - March 2005
JURISDICTION COMPOUND STANDARD AVERAGING TIME
FREQUENCY CRITERIA
LAND USE USE COMMENTS
500 µg/m3 30 minutes POI guideline Trimethylbenzene, 1,2,4- 1,000 µg/m3 24 hours AAQC
2,300 µg/m3 30 minutes POI standard
Ontario (Canada)e
Xylenes 2,300 µg/m3 24 hours AAQC
100 ppb 1 hour Pennsylvania (USA)j, k
Hydrogen sulphide 5 ppb 24 hours
120 ppb 30 minutes Industrial, vacant or range lands
Texas (USA)j Hydrogen sulphide
80 ppb 30 minutes Residential / commercial
Washington (USA)h
Hydrogen sulphide 3 - 7 ppb Chambers Creek Wastewater Facility
“practical threshold odour-detection level”
AUSTRALASIA Acetaldehyde 0.042 ppm 3 minutes Acetic acid 0.20 ppm 3 minutes Acetone 20 ppm 3 minutes Acrylic acid 0.094 ppm 3 minutes Benzyl chloride 0.0094 ppm 3 minutes 1,3-Butadiene 0.45 ppm 3 minutes n-Butanol 0.3 ppm 3 minutes Butyl mercaptan 0.004 ppm 3 minutes Carbon disulphide 0.042 ppm 3 minutes Chlorobenzene 0.042 ppm 3 minutes Cumene 0.008 ppm 3 minutes Cyclohexanone 0.12 ppm 3 minutes Diacetone alcohol 0.28 ppm 3 minutes Diethylamine 0.02 ppm 3 minutes Dimethylamine 0.0094 ppm 3 minutes Diphenyl ether 0.02 ppm 3 minutes Ethanol 2.0 ppm 3 minutes Ethyl acetate 6.3 ppm 3 minutes
New South Wales (Australia)b
Ethyl acrylate 0. 0002 ppm 3 minutes
For Level 2 (Screening) Assessment – 100th percentile; For Level 3 (Refined) Assessment – 99.9th percentile
Criteria shall be applied at and beyond the boundary of the facility.
These are design criteria for new or modified facilities. They are not used in permits.
For point sources, the results of dispersion modelling shall be used as the basis for developing site-specific emission limits for individual odorous air pollutants.

Reputation Resources Results Odour Management in British Columbia: RWDI AIR Inc Review and Recommendations W05-1108 Final Report - 16 - March 2005
JURISDICTION COMPOUND STANDARD AVERAGING TIME
FREQUENCY CRITERIA
LAND USE USE COMMENTS
Methanol 4.26 ppm 3 minutes Methylamine 0.0042 ppm 3 minutes Methyl ethyl ketone 2.0 ppm 3 minutes Methyl mercaptan 0.00042 ppm 3 minutes Methyl methacrylate 0.05 ppm 3 minutes α-Methyl styrene 0.052 ppm 3 minutes Methyl isobutyl ketone
0.1 ppm 3 minutes
Nitrobenzene 0.00094 ppm 3 minutes Perchloroethylene 0.94 ppm 3 minutes Phenol 0.0094 ppm 3 minutes Phosphine 0.0042 ppm 3 minutes n-Propanol 0.03 ppm 3 minutes Pyridine 0.0042 ppm 3 minutes Styrene (monomer) 0.05 ppm 3 minutes Toluene 0.17 ppm 3 minutes Triethylamine 0.09 ppm 3 minutes Xylene 0.08 ppm 3 minutes
For Level 2 (Screening) Assessment – 100th percentile; For Level 3 (Refined) Assessment – 99.9th percentile
Criteria shall be applied at and beyond the boundary of the facility.
For point sources, the results of dispersion modelling shall be used as the basis for developing site-specific emission limits for individual odorous air pollutants.
1.38 µg/m3 0.1-1 second 99th percentile Urban area (≥2,000 people)
2.07 µg/m3 0.1-1 second 99th percentile 500 to 2,000 people
2.76 µg/m3 0.1-1 second 99th percentile 125 to 500 people
3.45 µg/m3 0.1-1 second 99th percentile 30 to 125 people 4.14 µg/m3 0.1-1 second 99th percentile 10 to 30 people
New South Wales (Australia)b
Hydrogen sulphide
4.83 µg/m3 0.1-1 second 99th percentile Single residence (≤2people)
These are design criteria for new or modified facilities. They are not used in permits.
Nitrobenzene 0.00094 ppm 3 minutes Perchloroethylene 0.94 ppm 3 minutes Phenol 0.0094 ppm 3 minutes Phosphine 0.0042 ppm 3 minutes n-Propanol 0.03 ppm 3 minutes Pyridine 0.0042 ppm 3 minutes
Tasmania (Australia)c
Styrene (monomer) 0.05 ppm 3 minutes
100th percentile for screening assessment and 99.9th percentile for refined assessment

Reputation Resources Results Odour Management in British Columbia: RWDI AIR Inc Review and Recommendations W05-1108 Final Report - 17 - March 2005
JURISDICTION COMPOUND STANDARD AVERAGING TIME
FREQUENCY CRITERIA
LAND USE USE COMMENTS
Toluene 0.17 ppm 3 minutes Triethylamine 0.09 ppm 3 minutes
Tasmania (Australia)c
Xylene 0.08 ppm 3 minutes
100th percentile for screening assessment and 99.9th percentile for refined assessment
ASIA Acetaldehyde 0.05 - 0.5 ppm Ammonia 1 - 5 ppm Butyraldehyde 0.009 - 0.08 ppm Butyric acid 0.001 - 0.006
ppm
Dimethyl disulphide 0.009 - 0.1 ppm Dimethyl sulphide 0.01 - 0.2 ppm Ethyl acetate 3 - 20 ppm Hydrogen sulphide 0.02 - 0.2 ppm Isobutyraldehyde 0.02 - 0.2 ppm Isobutyl alcohol 0.9 - 20 ppm Isovaleraldehyde 0.003 - 0.01 ppm Isovaleric acid 0.001 - 0.01 ppm Methyl isobutyl ketone
1 - 6 ppm
Methyl mercaptan 0.002 - 0.01 ppm Propionaldehyde 0.05 - 0.5 ppm Propionic acid 0.03 - 0.2 ppm Styrene 0.4 - 2 ppm Toluene 10 - 60 ppm Trimethylamine 0.005 - 0.07 ppm Valericaldehyde 0.009 - 0.05 ppm Valeric acid 0.0009 - 0.004
ppm
Japand
Xylene 1 - 5 ppm
Measured at the plant or business boundary
Range of maximum permissible concentrations at ground level on the boundary line of a place of business
2 ppm Industrial area Koreaf,g Ammonia 1 ppm Residential area
Measure using UV-spectroscopy

Reputation Resources Results Odour Management in British Columbia: RWDI AIR Inc Review and Recommendations W05-1108 Final Report - 18 - March 2005
JURISDICTION COMPOUND STANDARD AVERAGING TIME
FREQUENCY CRITERIA
LAND USE USE COMMENTS
0.004 ppm Industrial area Methyl mercaptan 0.002 ppm Residential area 0.06 ppm Industrial area Hydrogen sulphide 0.02 ppm Residential area 0.05 ppm Industrial area Dimethyl sulphide 0.01 ppm Residential area 0.03 ppm Industrial area Dimethyl disulphide 0.009 ppm Residential area
Measure using GC-FPD (Gas Chromatograph – Flame Photometric Detector)
0.02 ppm Industrial area Trimethyl amine 0.005 ppm Residential area 0.1 ppm Industrial area Acetaldehyde
0.05 ppm Residential area 0.8 ppm Industrial area
Koreaf,g
Styrene 0.4 ppm Residential area
Measure using GC-FID (Gas chromatograph – Flame Ionization Detector)
* (POI) Point of Impingement Limit ** (AAQC) Ambient Air Quality Criteria # Status of the Standard/Guideline is interim (A) AAQC Chemicals listed in Regulation 337 (formerly Regulation 296) under the Environmental Protection Act. UD Under Development a NYSDEC Regulations Subpart 257-10 [1/1] b NSW EPA (2001a) c Tasmania Department of Primary Industries, Water and Environment (2001) d Japanese MOE (2005) e Ontario MOE (2001) f Sung Bong Yang (2003) g Park (2003) h Mahin et al. (2000) i Alberta Environment (2004) j Mahin (2001) k Osterberg and Melvin (2002)

Reputation Resources Results Odour Management in British Columbia: RWDI AIR Inc Review and Recommendations W05-1108 Final Report - 19 - March 2005
2.3 AMBIENT CONCENTRATION CRITERIA FOR ODOUR
Odour is commonly measured using an odour panel, which consists of a number of specially trained personnel. The European, Australian and American standards are the most commonly used for measuring odour using an odour panel. These standards are compared in Section 2.3.1. The general concept behind these methods is to dilute air samples with known amounts of odour-free air using an olfactometer or scentometer. The most dilute samples are presented to the odour panel first. Less dilute samples are gradually presented to the panel until 50% of the panel can detect an odour. This is defined as the odour detection threshold. By definition, the odour concentration at the detection threshold is one (1) odour unit per cubic metre of gas at standard conditions (OU/m3). Higher odour concentrations are expressed in terms of multiples of the detection threshold. For example, if an odour sample must be diluted with 10 equivalent volumes of odour-free air then the odour concentration is 10 OU/m3.
In some jurisdictions the volume units are ignored and just OU is used. Some European countries, such as the Netherlands, use units of OUE/m3 to differentiate between odour concentrations determined using the European standard and concentrations determined using a previous national standard. In the USA the unit dilutions to threshold (D/T) is used. Korea uses units of odour concentration (OC), which appear to be equivalent to odour units (OU/m3) because they are a multiple of dilution, where the gas has been diluted until an offensive odour is no longer detectable to the human sense of smell. All of these units are conceptually equivalent (i.e., 1 OU = 1 OU/m3 = 1 OUE/m3 = 1OC = 1 D/T); however differences in the standard methodologies can lead to differences in the measured odour concentration.
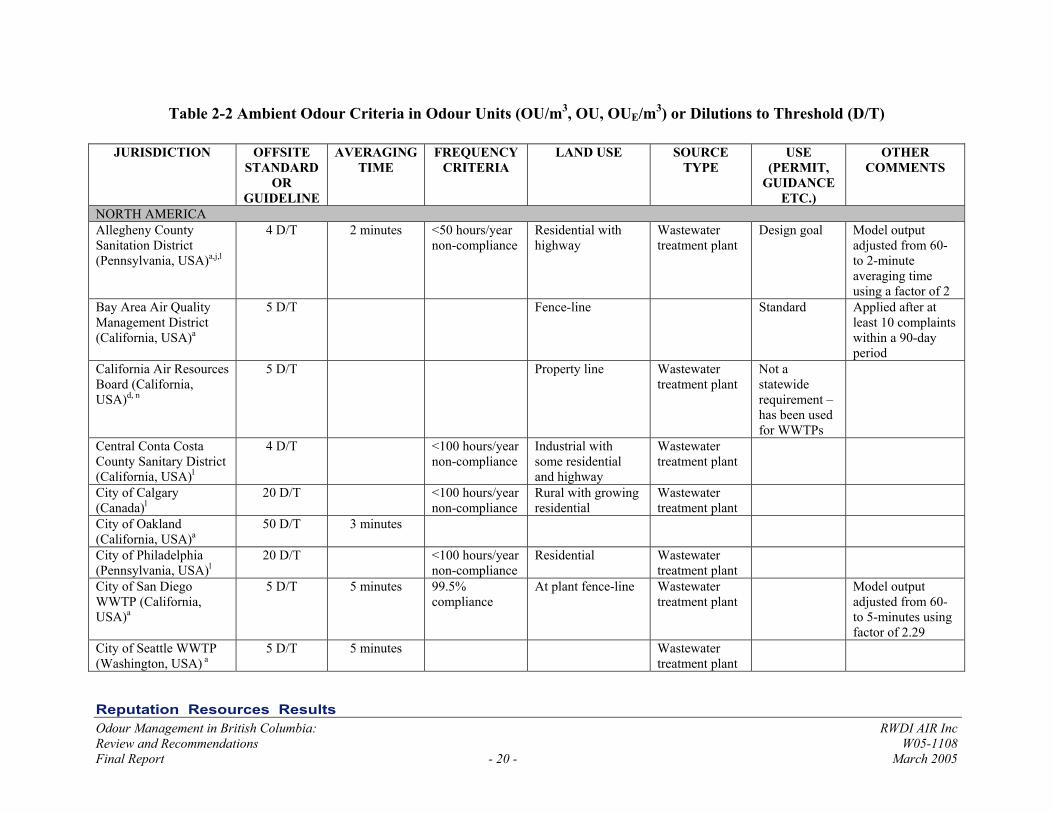
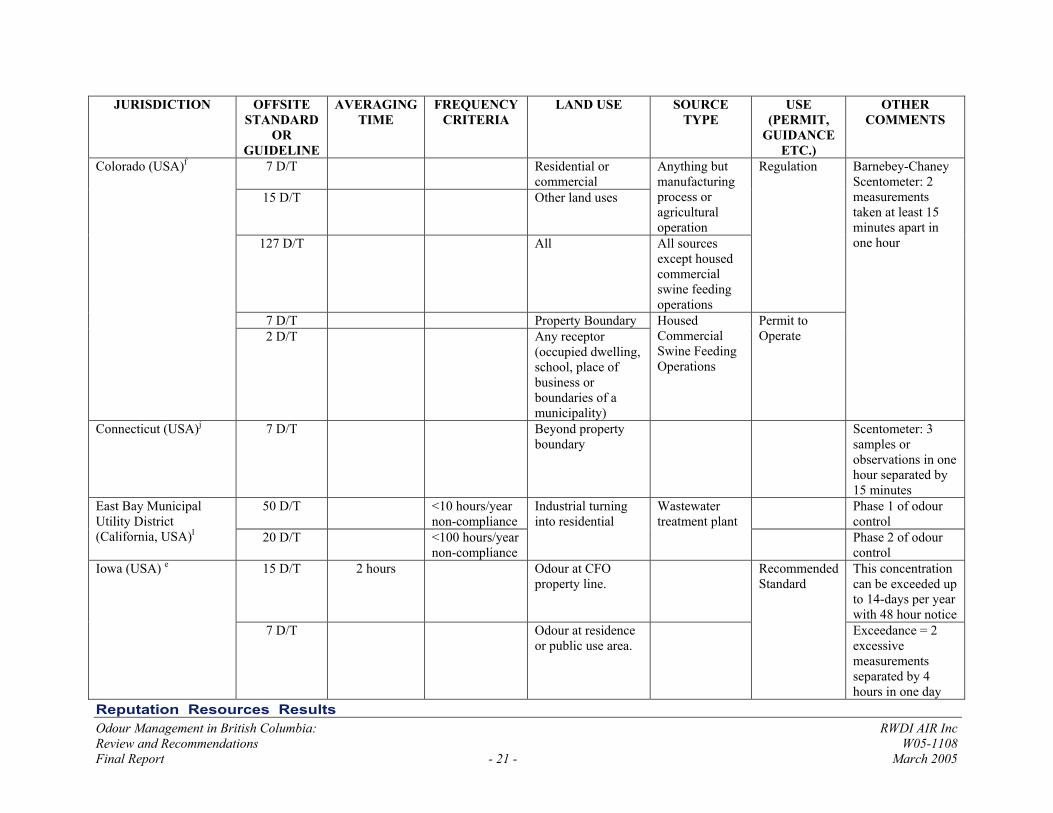
Ambient odour concentration criteria are used to manage odour in numerous jurisdictions in North America, Australasia, Europe, and Asia. Table 2-2 summarizes all the ambient odour criteria that were found for different jurisdictions around the world. Some of the sources of information were review papers not the original source documents and as a result it was not always clear whether the criteria were standards or simply guidelines. In many cases, especially in the USA, the criteria were used specifically for wastewater treatment plants (WWTP) or composting facilities and do not appear to be overall standards for all source types.
Reputation Resources Results Odour Management in British Columbia: RWDI AIR Inc Review and Recommendations W05-1108 Final Report - 20 - March 2005
Table 2-2 Ambient Odour Criteria in Odour Units (OU/m3, OU, OUE/m3) or Dilutions to Threshold (D/T)
JURISDICTION OFFSITE STANDARD
OR GUIDELINE
AVERAGING TIME
FREQUENCY CRITERIA
LAND USE SOURCE TYPE
USE (PERMIT,
GUIDANCE ETC.)
OTHER COMMENTS
NORTH AMERICA Allegheny County Sanitation District (Pennsylvania, USA)a,j,l
4 D/T 2 minutes <50 hours/year non-compliance
Residential with highway
Wastewater treatment plant
Design goal Model output adjusted from 60- to 2-minute averaging time using a factor of 2
Bay Area Air Quality Management District (California, USA)a
5 D/T Fence-line Standard Applied after at least 10 complaints within a 90-day period
California Air Resources Board (California, USA)d, n
5 D/T Property line Wastewater treatment plant
Not a statewide requirement – has been used for WWTPs
Central Conta Costa County Sanitary District (California, USA)l
4 D/T <100 hours/year non-compliance
Industrial with some residential and highway
Wastewater treatment plant
City of Calgary (Canada)l
20 D/T <100 hours/year non-compliance
Rural with growing residential
Wastewater treatment plant
City of Oakland (California, USA)a
50 D/T 3 minutes
City of Philadelphia (Pennsylvania, USA)l
20 D/T <100 hours/year non-compliance
Residential Wastewater treatment plant
City of San Diego WWTP (California, USA)a
5 D/T 5 minutes 99.5% compliance
At plant fence-line Wastewater treatment plant
Model output adjusted from 60- to 5-minutes using factor of 2.29
City of Seattle WWTP (Washington, USA) a
5 D/T 5 minutes Wastewater treatment plant
Reputation Resources Results Odour Management in British Columbia: RWDI AIR Inc Review and Recommendations W05-1108 Final Report - 21 - March 2005
JURISDICTION OFFSITE STANDARD
OR GUIDELINE
AVERAGING TIME
FREQUENCY CRITERIA
LAND USE SOURCE TYPE
USE (PERMIT,
GUIDANCE ETC.)
OTHER COMMENTS
7 D/T Residential or commercial
15 D/T Other land uses
Anything but manufacturing process or agricultural operation
127 D/T All All sources except housed commercial swine feeding operations
Regulation
7 D/T Property Boundary
Colorado (USA)f
2 D/T Any receptor (occupied dwelling, school, place of business or boundaries of a municipality)
Housed Commercial Swine Feeding Operations
Permit to Operate
Barnebey-Chaney Scentometer: 2 measurements taken at least 15 minutes apart in one hour
Connecticut (USA)j 7 D/T Beyond property boundary
Scentometer: 3 samples or observations in one hour separated by 15 minutes
50 D/T <10 hours/year non-compliance
Phase 1 of odour control
East Bay Municipal Utility District (California, USA)l 20 D/T <100 hours/year
non-compliance
Industrial turning into residential
Wastewater treatment plant
Phase 2 of odour control
15 D/T 2 hours Odour at CFO property line.
This concentration can be exceeded up to 14-days per year with 48 hour notice
Iowa (USA) e
7 D/T Odour at residence or public use area.
Recommended Standard
Exceedance = 2 excessive measurements separated by 4 hours in one day

Reputation Resources Results Odour Management in British Columbia: RWDI AIR Inc Review and Recommendations W05-1108 Final Report - 22 - March 2005
JURISDICTION OFFSITE STANDARD
OR GUIDELINE
AVERAGING TIME
FREQUENCY CRITERIA
LAND USE SOURCE TYPE
USE (PERMIT,
GUIDANCE ETC.)
OTHER COMMENTS
Kankakee Wastewater Utility (Illinois, USA)j
4 D/T 2 minutes WWTP ISC model output was adjusted from 60- to 2-minute impact time using a factor of 2
Kentucky (USA) 7 D/T Scentometer 0 – 3 D/T <50 hours/year
exceeding threshold
Recommended policy for new WWTPs
King County (Washington, USA)l
0 – 5 D/T <100 hours/year exceeding threshold
Recommended policy for existing WWTP retrofits
0-3 routine operating range, 3-5 non-routine operating range
2 OU Residential Zone Guideline – maximum acceptable level
7 OU Industrial Zone Guideline – maximum acceptable level
Manitoba (Canada)p
<1 OU
2 tests not less than 15
minutes apart nor more than
60 minutes apart
Guideline – maximum desirable level
Less than the odour threshold
Massachusetts (USA)a,j 5 D/T 1 hour Offsite Composting Draft guidance Converted to lower averaging times by power law equation, case-by-case. Draft policy. Regional agencies can set more stringent limits based on site-specific conditions

Reputation Resources Results Odour Management in British Columbia: RWDI AIR Inc Review and Recommendations W05-1108 Final Report - 23 - March 2005
JURISDICTION OFFSITE STANDARD
OR GUIDELINE
AVERAGING TIME
FREQUENCY CRITERIA
LAND USE SOURCE TYPE
USE (PERMIT,
GUIDANCE ETC.)
OTHER COMMENTS
Missouri (USA)e 5.4 D/T At the property line Department of Natural Resources
New Jersey (USA)a,j 5 D/T 5 minutes or less
At sensitive receptor with the highest impact as predicted by dispersion modelling
For biosolids/ sludge handling and treatment facilities
Alternative for existing facilities is to remove 95% of target odour-causing compounds such as H2S or NH3 and achieve an outlet concentration below the individual compound thresholds
North Carolina (USA)j 4 D/T 30 seconds Composting facility
“conservative nuisance threshold”
ISCST model output adjusted to 30-second averaging time using a factor of 1.97
North Dakota (USA)a 2 D/T Fence-line Scentometer Ontario (Canada)a 1 OU/m3 10 minutes At the most
impacted Sensitive Receptor
Proposed standard
Orange County Sanitation District (California, USA)l
20 D/T <100 hours/year non-compliance
Residential with highway
Wastewater treatment plant
Palm Beach County Solid Waste Authority (Florida, USA)j
7 D/T Property line Composting facility
No statewide requirement

Reputation Resources Results Odour Management in British Columbia: RWDI AIR Inc Review and Recommendations W05-1108 Final Report - 24 - March 2005
JURISDICTION OFFSITE STANDARD
OR GUIDELINE
AVERAGING TIME
FREQUENCY CRITERIA
LAND USE SOURCE TYPE
USE (PERMIT,
GUIDANCE ETC.)
OTHER COMMENTS
Portland (Oregon, USA)a,j
1 to 2 D/T 15 minutes Considered a nuisance
Measured with scentometer. Odour with duration < 15 minutes is exempt.
Sacramento County Regional Sanitation District (California, USA)l
20 D/T <100 hours/year non-compliance
Rural with growing residential
Wastewater treatment plant
Wyoming (USA)d 7 D/T Yountville (California, USA)l
4 D/T <100 hours/year non-compliance
Golf course Wastewater treatment plant
AUSTRALASIA 1 OU/m3 1 hour 99.5%
compliance Worst-case impacts
during unstable to semi-unstable conditions
2 OU/m3 1 hour 99.9 % and 99.5%
-high-density residential - light commercial / retail / business / education / institutional - open space / recreational - tourist / conservation / cultural / marae
Worst-case impacts during neutral to stable conditions
5 OU/m3 1 hour 99.9 % and 99.5%
- rural residential (low density) - light industrial
All conditions
New Zealandq
5 OU/m3 1 hour 99.5% - rural land - heavy industrial
Interim odour-modelling guideline
All conditions

Reputation Resources Results Odour Management in British Columbia: RWDI AIR Inc Review and Recommendations W05-1108 Final Report - 25 - March 2005
JURISDICTION OFFSITE STANDARD
OR GUIDELINE
AVERAGING TIME
FREQUENCY CRITERIA
LAND USE SOURCE TYPE
USE (PERMIT,
GUIDANCE ETC.)
OTHER COMMENTS
2 OU/m3 0.1-1 second 99th percentile Urban area (≥2,000 people)
3 OU/m3 0.1-1 second 99th percentile 500 to 2,000 people 4 OU/m3 0.1-1 second 99th percentile 125 to 500 people 5 OU/m3 0.1-1 second 99th percentile 30 to 125 people 6 OU/m3 0.1-1 second 99th percentile 10 to 30 people
New South Wales (Australia)d
7 OU/m3 0.1-1 second 99th percentile Single residence (≤2people)
Criteria are not used in permits. They are used for new facility design.
Odour performance criteria shall be applied at the nearest existing or likely future off-site sensitive receptor based on population density (see Eqn. 3.2 of NSW, 2001). NSW also has criteria for individual pollutants.
2.5 OU 1 hour 99.5% compliance
Developments with ground level sources or short stacks
5 OU 1 hour 99.5% compliance
Developments with tall stacks
Queensland (Australia)a,r
10 OU 1 hour 99.5% compliance
2 OU 3 minutes 99.9% compliance
2,000 or more people
4 OU 3 minutes 99.9% compliance
350 or more people
6 OU 3 minutes 99.9% compliance
60 or more people
8 OU 3 minutes 99.9% compliance
12 or more people
South Australia (Australia)c
10 OU 3 minutes 99.9% compliance
Single residence (<12 people)
These are guidelines used for determining setback distances. They are not enforceable per se.

Reputation Resources Results Odour Management in British Columbia: RWDI AIR Inc Review and Recommendations W05-1108 Final Report - 26 - March 2005
JURISDICTION OFFSITE STANDARD
OR GUIDELINE
AVERAGING TIME
FREQUENCY CRITERIA
LAND USE SOURCE TYPE
USE (PERMIT,
GUIDANCE ETC.)
OTHER COMMENTS
Tasmania (Australia)a 1 OU/m3 3 minutes 99.9% compliance
Tasmania also has criteria for individual pollutants
Victoria (Australia) d 1 OU/m3 3 minutes 99.9% compliance
2 OU/m3 3 minutes 99.5th percentile 4 OU/m3 3 minutes 99.9th percentile
Other than poultry farms
2 and 4 OU/m3 are screening criteria – if both of these are met, no further assessment of odour is needed. If the screening criteria are not met, the proponent has to undertake an odour intensity study to determine whether the “distinct” odour criterion is met (see Table 2-13).
Western Australia (Australia)m
7 OU/m3 3 minutes 99.5th percentile
Sensitive land uses, e.g. residences, hospitals, schools, play grounds, aged care facilities etc.
Poultry farms
Used to determine setback distances for new proposals or expansion only
In the particular case of poultry, 7 OU is assumed to correspond to a “distinct” odour intensity rating.
EUROPE 1 OU/m3 92%
compliance Austriab
3 OU/m3 97% compliance

Reputation Resources Results Odour Management in British Columbia: RWDI AIR Inc Review and Recommendations W05-1108 Final Report - 27 - March 2005
JURISDICTION OFFSITE STANDARD
OR GUIDELINE
AVERAGING TIME
FREQUENCY CRITERIA
LAND USE SOURCE TYPE
USE (PERMIT,
GUIDANCE ETC.)
OTHER COMMENTS
Denmarka,j 5 - 10 OU/m3 1 minute 99% compliance
Residential areas outside the plant site (limit in industrial and rural areas may in some cases be increased by a factor of 2-3)
Equivalent 60-min. average standard is 0.6 - 1.2 OU/m3. Calculated as the average of anticipated peak values in neutral to moderately unstable conditions with a wind speed of 4.5 m/s.
1.5 ouE/m3 1 hour 98% all All pig production units
Licensing Target Value - draft
3.0 ouE/m3 1 hour 98% rural New pig production unit
Licensing Limit Value - draft
Irelandi
6.0 ouE/m3 1 hour 98% rural Existing pig production unit
Licensing Limit Value - draft
Newbiggin-by-the-Sea & Debby WWTPs (UK)a
5 OU/m3 98% compliance
Wastewater treatment plant
>>5 ouE/m3 1 hour 98% Bakeries No limit value 2.5 ouE/m3 1 hour 98% Limit value 0.95 ouE/m3 1 hour 98%
Built-up areas or other objects sensitive to odours
Meat Processing Target value
2.5 ouE/m3 1 hour 98% Built-up areas etc. Grass dryers Limit value 5 ouE/m3 1 hour 98% Built-up areas etc. Bakeries, pastry Target value
3.5 ouE/m3 1 hour 98% Coffee roasters Limit value for existing facilities (limits lower for new facilities)
3.5 ouE/m3 1 hour 98% Limit value
The Netherlandsgo
2.0 ouE/m3 1 hour 98% Built-up areas etc. Flavours &
fragrances
Used in permitting process to compare with results of dispersion models or nomograms used to calculate dispersion of emissions calculated using emission factors.
Target value

Reputation Resources Results Odour Management in British Columbia: RWDI AIR Inc Review and Recommendations W05-1108 Final Report - 28 - March 2005
JURISDICTION OFFSITE STANDARD
OR GUIDELINE
AVERAGING TIME
FREQUENCY CRITERIA
LAND USE SOURCE TYPE
USE (PERMIT,
GUIDANCE ETC.)
OTHER COMMENTS
0.5 ouE/m3 1 hour 98% Densely populated residential areas
WWTP, greenfield site
Limit value
1.0 ouE/m3 1 hour 98% Rural area or industrial estate
WWTP, greenfield site
Limit value
1.5 ouE/m3 1 hour 98% Densely populated residential areas
WWTP, existing site
Limit value
3.5 ouE/m3 1 hour 98% Rural area or industrial estate
WWTP, existing site
Limit value
1 ouE/m3 1 hour 98% Densely populated residential areas
Livestock feed production
Limit value
1.5 ouE/m3 1 hour 98% Limit value 0.5 ouE/m3 1 hour 98%
Composting, organic fraction of domestic waste, greenfield site
Target value
3.0 ouE/m3 1 hour 98% Limit value 1.5 ouE/m3 1 hour 98%
Residential area or other sensitive receptors
Composting, organic fraction of domestic waste, existing facility
Target value
1.5 ouE/m3 1 hour 98% Built up areas Limit value 0.55 ouE/m3 1 hour 98% Built up areas
Slaughterhouses Target value
The Netherlandsgo
1.5 ouE/m3 1 hour 98% Sensitive receptors Large breweries Limit value Walesk 5 to 10
ouE/m3 Property boundary Sewage
treatment plants
ASIA Hong Kong (Siu Ho Wan WWTP)a
5 OU 5 seconds Wastewater treatment plant
20 OC Plant boundary Companies in industrial areas
Koreah
15 OC Plant boundary Companies in other areas
Measure using “Air Dilution Sensory Test” described in Park (2003)
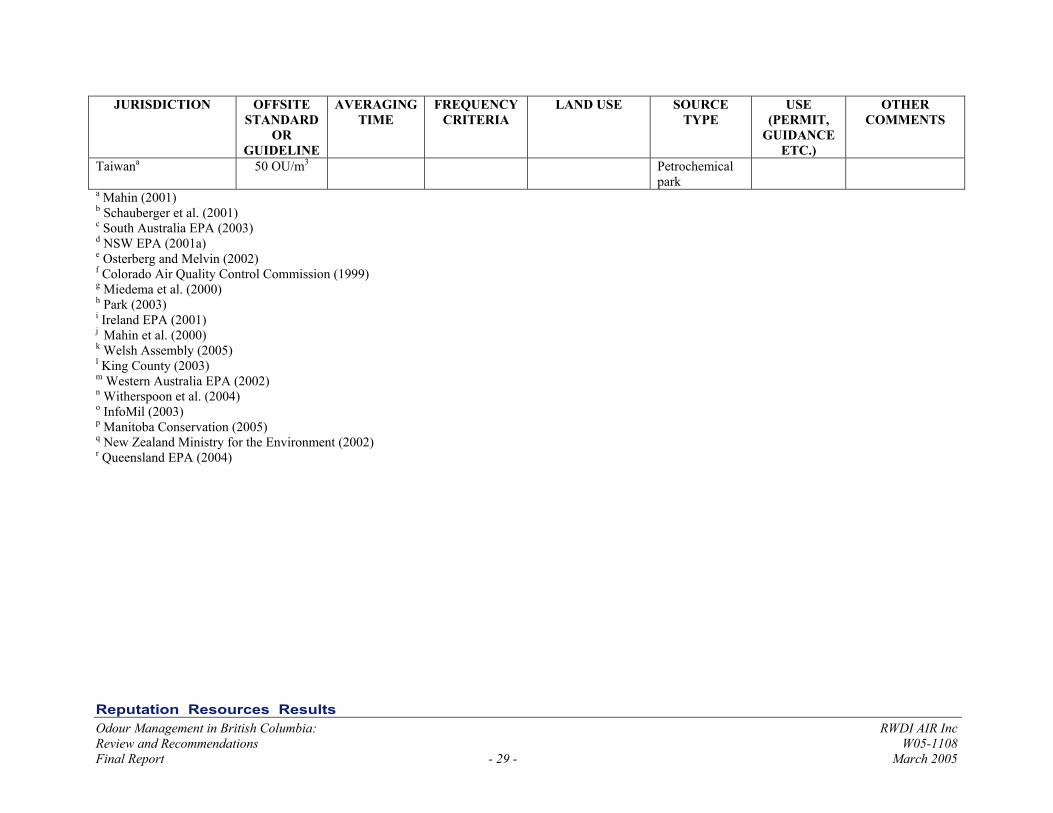
Reputation Resources Results Odour Management in British Columbia: RWDI AIR Inc Review and Recommendations W05-1108 Final Report - 29 - March 2005
JURISDICTION OFFSITE STANDARD
OR GUIDELINE
AVERAGING TIME
FREQUENCY CRITERIA
LAND USE SOURCE TYPE
USE (PERMIT,
GUIDANCE ETC.)
OTHER COMMENTS
Taiwana 50 OU/m3 Petrochemical park
a Mahin (2001) b Schauberger et al. (2001) c South Australia EPA (2003) d NSW EPA (2001a) e Osterberg and Melvin (2002) f Colorado Air Quality Control Commission (1999) g Miedema et al. (2000) h Park (2003) i Ireland EPA (2001) j Mahin et al. (2000) k Welsh Assembly (2005) l King County (2003) m Western Australia EPA (2002) n Witherspoon et al. (2004) o InfoMil (2003) p Manitoba Conservation (2005) q New Zealand Ministry for the Environment (2002) r Queensland EPA (2004)

Reputation Resources Results Odour Management in British Columbia: RWDI AIR Inc Review and Recommendations W05-1108 Final Report - 30 - March 2005
In Canada, the only jurisdictions with odour concentration guidelines appear to be Ontario and Manitoba. In Ontario there is a proposed guideline whereby existing or proposed facilities will be required to demonstrate that the 10-minute average concentration of odour at the most impacted sensitive receptor resulting from the operation of the facility does not exceed 1 OU (Ontario MOE, 2004). In Manitoba the maximum desirable odour level is less than 1 OU. The maximum acceptable guideline is 2 OU in a residential zone and 7 OU in an industrial zone (Manitoba Conservation, 2005). A document produced by the King County Department of Natural Resources and Parks (2003) indicates that the City of Calgary has used a threshold of 20 D/T with less than 100 hours per year non-compliance for wastewater treatment plants; however this has not been confirmed.
In the USA, the BAAQMD of California and the Colorado Air Quality Control Commission are the only jurisdictions that clearly have odour concentration standards in their legislation. In the BAAQMD the standard is 5 D/T at or beyond the facility property line applied after at least 10 complaints within a 90-day period (Regulation 7-302). In Colorado, Rule No. 2 Part A indicates that for all sources except manufacturing processes or agricultural operations, the maximum allowable odour concentration beyond the property line is 7 D/T for areas used predominantly for residential or commercial purposes and 15 D/T for all other land uses. For all sources, the maximum odour concentration is 127 D/T. Furthermore, there are special regulations in Colorado for Housed Commercial Swine Feeding Operations whereby the maximum acceptable odour concentration at the property boundary is 7 D/T and at any receptor (occupied dwelling, school, place of business or boundary of a municipality) it is 2 D/T. The Colorado regulation stipulates that odour measurements are to be made with the Barnebey-Chaney Scentometer and that two odour measurements shall be made within a period of one hour, these measurements being separated by at least 15 minutes. Other criteria listed in Table 2-2 for American jurisdictions appear to be design criteria. For instance, the criteria listed for King County in Washington State are recommended policies for new or existing WWTPs.
In Australasia, odour concentration criteria tend not to be used in permits but rather they are design criteria used to evaluate dispersion model output and to determine adequate setback distances. They are therefore not enforceable. The values shown for New Zealand are interim odour modelling guidelines. A unique feature of the New Zealand guidelines is that for high sensitivity receptors (e.g., high-density residential, light commercial, recreational) different values are assigned depending on the meteorological conditions associated with the predicted concentrations. The guideline value is more stringent for unstable meteorological conditions. An interesting feature of the guidelines for New South Wales is that more stringent criteria are

Reputation Resources Results Odour Management in British Columbia: RWDI AIR Inc Review and Recommendations W05-1108 Final Report - 31 - March 2005
applied for areas with higher population density because of the increased likelihood that a very odour-sensitive individual will be found in a larger population. Furthermore the New South Wales guidelines are based on a very short averaging period (less than one second) to reflect the very short time required for the nose to respond to an odour. Other jurisdictions, such as South Australia, Tasmania, Victoria and Western Australia have selected a three-minute averaging period because it is the shortest period that can realistically be evaluated using standard dispersion models. The range of odour concentration values used in Australasia is 1 to 10 OU/m3. All odour criteria in Australasia have associated frequency of compliance criteria, which range from 99 to 99.9%.
Compliance requirements in Europe tend to be less stringent, varying from 92 to 98%. In addition, the averaging period is longer (one hour). However, the range of the odour concentration values is very similar (1 to 10 OU/m3). The Dutch criteria are standards used in the permitting process to compare with results of dispersion models or nomograms used to calculate dispersion of emissions. The Dutch criteria are source-specific with more stringent criteria applied to sources that would have more offensive odours. For example, the target value for a bakery is 5 OUE/m3 whereas the target value for a slaughterhouse is 0.55 OUE/m3. Thus, the Dutch criteria have effectively accounted for the hedonic tone of odour. The draft Irish criteria are also source-specific and apply to pig production units only. They are based on studies conducted in the Netherlands that account for the percentage of the population that will be annoyed. The Irish limit values aim to limit the percentage of those experiencing some form of odour-induced annoyance to 10% or less of the general public, which assumes some degree of acceptance of the rural nature of their living environment. A more stringent limit value is assigned to new units (3.0 OUE/m3) compared to existing (6.0 OUE/m3) pig production units. The target value is even more stringent (1.5 OUE/m3) and is to be used as an environmental quality target for all situations (i.e., not just rural locations).
Few jurisdictions in Asia appear to use odour concentration criteria. The criteria that were uncovered are very simplistic in nature: they do not tend to be associated with averaging periods or frequency criteria. The Korean standards do differentiate between surrounding land use: the limit at the plant boundary is 20 OC for companies in industrial areas and 15 OC for companies located in other areas.

Reputation Resources Results Odour Management in British Columbia: RWDI AIR Inc Review and Recommendations W05-1108 Final Report - 32 - March 2005
2.3.1 Olfactometry Standards
As air quality regulation has evolved, several countries have adopted standards for the measurement of odours. Examples of these standards include: USA - ASTM E679-04 (ASTM, 2004), Germany - VDI 3881 (VDI, 1986), France - AFNOR X-43-101 (Bureau de Normalisation, 1986), Netherlands - NVN2820 (Netherlands Normalization Institute, 1995), and Japan – Triangular Odour Bag Method. (Japan MOE, 2003)
In 1990, the European Union (EU) moved to unify the olfactometry standards of 18 countries (Austria, Belgium, Denmark, Finland, France, Greece, Germany, Iceland, Ireland, Italy, Luxembourg, Netherlands, Norway, Portugal, Spain, Sweden, Switzerland, and the United Kingdom) through the European Committee for Standardization (CEN) air quality committee (TC 264) (McGinley and Mann, 1998). The draft version of this standard, “Air Quality – Determination of Odour Concentration by Dynamic Olfactometry” (EN 13725), was released in September 1999 and finalized in 2003. The standard follows International Organization for Standardization (ISO) protocols and has been adopted by EU member countries. Australia and New Zealand have developed their own standard modelled on the EN 13725 standard.
The EE-6 “Odor” committee of the Air & Waste Management Association (AWMA) have developed a guideline document (AWMA, 2002) that has been submitted to ASTM to revise or supplement ASTM E679-04 (“Standard Practice for Determination of Odor and Taste Thresholds by a Forced-Choice Ascending Concentration Series Method of Limits”).
The EU and the USA are the primary jurisdictions for the development of internationally-recognised olfactometry standards. Other regions, including Australia and Canada among others, tend to adopt these standards. However, some countries, such as Japan, have developed their own standards in isolation and continue to use them.
The CEN air quality committee and the AWMA EE-6 committee agree that odour samples should be presented to panellists using dynamic dilution olfactometry in a “forced-choice” ascending concentration series method. This approach presents the panellists with a diluted sample of the odorous air and one or two blank samples of free air. “Forced-choice” means the panellist must choose the sample containing the odour, even if it is a guess. With the ascending concentration series method the panellists are presented with successive dilute samples that progressively increase in concentration (e.g. two times higher).

Reputation Resources Results Odour Management in British Columbia: RWDI AIR Inc Review and Recommendations W05-1108 Final Report - 33 - March 2005
Table 2-3 compares and contrasts the approaches of the EU standard and the EE-6 recommendations.
Table 2-3 Comparison of Olfactometry Presentation Statistics
Parameter European Standard EN 13725 AWMA EE-6 Guideline Recommendation
Presentation Method (all methods by dynamic dilution olfactometry)
1. Forced Choice Ascending Concentration Series
2. Yes/No Presentation Method 3. Forced Choice Probability
Method
1. Forced Choice Ascending Concentration Series
Sample Presentation Triangular or Binary Triangular only Dilution Step Levels Factor between 1.4 and 2.4 Factor of 2 only Olfactometer Construction Glass, stainless steel or polytetrafluoroethylene Dilution Air “Odour free” dry air “Odour free” air Dilution Range 214 to 27 10,000 (~213) to 10 (~23) Presentation Flow Rate 20 litres per min. or higher 8 litres per min. or higher Presentation Face Velocity 0.2 to 0.5 m/s
(3-5 cm mask at 20 lpm) 0.02 to 0.05 m/s (6-10 cm mask at 8 lpm)
The EE-6 guidelines discuss performance criteria and instrument calibration in general terms. The EU standard goes further by including discussion on laboratory accuracy and repeatability criteria following ISO measurement standards. It requires the olfactometer to be calibrated periodically with a suitable tracer gas at each dilution level, achieving an accuracy within 20%. The EU standard also outlines procedures for testing and defining laboratory accuracy.
The EE-6 guidelines indicate that panellists representing “normal” sensitivity should be selected, but do not define what “normal” means. However, the EU standard gives very strict criteria for panellist selection, requiring that panellists demonstrate consistent (repeatable) sensitivity to a reference odorant (n-butanol). The panellists must achieve a minimum sensitivity (20-80 ppb) in a consistent range (standard deviation limits). The EU approach implies that the panellists will have similar response to odour samples that vary from the reference odorant. Further it does not outline how the selected panellists relate to the general population (e.g., average, more sensitive, etc.).
In summary, the main differences between the American and EU olfactometry standard are: (i) The presentation flow rate and face velocity; and, (ii) The panellist selection criteria.

Reputation Resources Results Odour Management in British Columbia: RWDI AIR Inc Review and Recommendations W05-1108 Final Report - 34 - March 2005
The wide variation in suggested optimum presentation flow rates in the literature suggest that this parameter will continue to be a difficulty until more definitive testing can be produced.
With panellist selection, both approaches include inherent assumptions that may affect the function of an odour panel. More definitive testing is necessary to assess the validity of these assumptions.
Initially, many North American laboratories approached the EU standard with some scepticism due to the variations in methodology (e.g., flow rate, etc.) relative to the ASTM method. However, ongoing performance testing has demonstrated that the EU standard parameters are readily achievable. Further, many laboratories favour its detailed QA/QC quality elements and prescriptive methodology (McGinley and McGinley, 2001). Many institutions also recognize the advantages of moving to a single unifying standard. Hence, the EU standard appears to be quickly becoming the olfactometry standard of choice.
2.4 EPISODE DURATION-FREQUENCY
Germany has a unique system for assessing whether an odour nuisance is significant that considers not only the intensity of an odour but also its duration and frequency (i.e., four of the five FIDOL factors). They assess the existing odour impact in the field, using a systematic process that is described below, and add to it the predicted odour impact of a new or modified facility. The total odour impact is compared with immission2 limit values, which are relative frequencies of odour-hours. The immission limit values Ilimit for different land uses are provided in Table 2-4. It is permissible for odours to occur more frequently in industrial or commercial areas.
Table 2-4 Immission Limit Values Ilimit for Different Land Uses
Residential and Mixed Areas Industrial and Commercial Areas
0.10 (10%) 0.15 (15%)
2 The word “immission” is used in the sense of influence of air pollutants, in this case odour, on humans. This establishes an active view of air pollutants influencing receptors, in contrast to the passive view of receptors being exposed to air pollutants. If this semantic difference is ignored, “immission” can be interpreted as exposure (Germany, 2003).

Reputation Resources Results Odour Management in British Columbia: RWDI AIR Inc Review and Recommendations W05-1108 Final Report - 35 - March 2005
As a general rule, odour from livestock farms is managed using minimum setback distances; however, if a farm does not meet the relevant setback or if the minimum setback distances for two or more farms overlap, then the odour impact is determined using dispersion models and compared to the immission limit values shown in Table 2-5.
Table 2-5 Immission Limit Values for Livestock Farming
Residential and Mixed Areas Villages with Livestock Farming Outskirts and Rural Areas
0.10 (10%) 0.15 (15%) 0.15 – 0.20 (15 - 20%)
There is a standard method for assessing the existing or initial immission value (Iinitial), which is set out in the 1993 VDI guideline 3940, “Determination of Odorants in Ambient Air by Field Inspection”. The assessment area is a circle with radius of 30 times the stack height or 600 m, whichever is larger. This area is divided into a grid of squares with 250 m spacing, or less depending on the circumstances. The measurement period should be representative of a whole year. As a rule it lasts six months but in special cases may be shortened to three months. The measurements are to be distributed evenly over the 24 hours of the day or they may be adapted to the operating hours of a facility. The panel members for each individual field measurement are selected from a fixed pool of 10 to 15 trained people.
During the measurement period, each corner of each assessment square is visited by members of the panel 13 or 26 times depending on the required statistical certainty. The results obtained on all four corners of an assessment square are added to the number nv of odour hours for this assessment square. Only odours that are recognized as being related to the facility of concern are recorded – these odours have to be distinguishable from odours caused by road traffic, domestic heating, vegetation, manure spreading etc. A panel member stays at each measurement point for 10 minutes and samples the air every 10 seconds for a total of 60 samples. The measurement is counted as one “odour hour” if a recognizable odour was perceived during 10% of the measurement period (i.e., if 6 samples were recognizable odours). This definition recognizes that short but recurring odour peaks can be more annoying than longer odour events, which may allow for adaptation (Both et al., 2004). The frequency calculated for each assessment square is the number of measured odour hours divided by the total number of measurements made at that square (typically 104).

Reputation Resources Results Odour Management in British Columbia: RWDI AIR Inc Review and Recommendations W05-1108 Final Report - 36 - March 2005
The additional impact, Iadd, of a new or modified facility is calculated using a dispersion model as the frequency of exceedance of 1 OU/m3. The total odour impact, Itot, is the sum of the initial and additional impact:
I total = I initial + I add
This total is compared to the immission limits in Table 2-4. One interesting feature of this odour impact assessment system is that if the additional impact Iadd of a facility does not exceed the irrelevance limit of 0.02 on any assessment square, the facility cannot be denied a license even though Itotal may be greater than Ilimit. In fact, if Iadd for every assessment square is less than the irrelevance limit, the initial odour impact Iinitial does not need to be determined.
This is an intriguing, systematic approach that takes into account four of the FIDOL factors (frequency, intensity, duration and location) but the measurement period is typically six months and it is very labour-intensive and as a result expensive.
2.5 MINIMUM SEPARATION DISTANCES
Many jurisdictions manage nuisance, including odours, using minimum separation distances or buffer zones, especially for the agricultural sector. In fact, in a number of jurisdictions, odour issues related to agriculture are handled by a different department or ministry than odour issues related to industrial sources. For example, in Ontario, odour from industrial sources is regulated by the Ministry of the Environment whereas minimum distance separation between farms and non-farm uses in rural areas are regulated by the Ministry of Agriculture, Food and Rural Affairs.
Minimum separation distances tend to be either fixed or variable, depending on a number of factors. Table 2-6 lists fixed separation distances used by some jurisdictions and indicates some of the jurisdictions that have variable separation distances. By and large, minimum separation distances are applied to agricultural sources, sewage treatment plants and composting.

Reputation Resources Results Odour Management in British Columbia: RWDI AIR Inc Review and Recommendations W05-1108 Final Report - 37 - March 2005
Table 2-6 Minimum Separation Distances
JURISDICTION SEPARATION DISTANCE (m)
LAND USE SOURCE TYPE USE (PERMIT, GUIDANCE ETC.)
OTHER COMMENTS
NORTH AMERICA Alberta (Canada) Variable Confined feeding operations New permits See description in text Colorado (USA)a 1 mile Occupied dwelling;
public or private school; incorporated municipality
Land waste application site or waste impoundment used in connection with a housed commercial swine feeding operation
Permit Applies to new land waste application sites and new waste impoundment since June 1, 1998
100 (recommended)
Sewage treatment plant with capacity equal to or less than 500 m3/d
A separation distance of less than 100 m may be permitted
100 (minimum); 150
(recommended)
Sewage treatment plant with capacity greater than 500 m3/d but less than 25,000 m3/d
>150
Sensitive land uses, such as residential neighbourhoods
Sewage treatment plant with capacity greater than 25,000 m3/d
Certificate of Approval for new and expanding sewage treatment facilities
These plants will be dealt with on an individual basis; a separation distance of greater than 150 m may be required
Variable Livestock facilities Requirements Equations and look-up tables
Ontario (Canada)b
Variable Non-farm uses in agricultural areas Used for the review of planning and development applications
Equations and look-up tables
Iowa (USA) Variable Confined feeding operations Master Matrix Minnesota (USA) Variable Feedlots Planning tool See equation in text Quebec (Canada)c Variable Manure storage sites See description in text AUSTRALASIA
50 Residential building on same site
45 Milking shed and yard
New Zealandf
50 Slaughterhouse
Pig production unit of any size Code of Practice

Reputation Resources Results Odour Management in British Columbia: RWDI AIR Inc Review and Recommendations W05-1108 Final Report - 38 - March 2005
JURISDICTION SEPARATION DISTANCE (m)
LAND USE SOURCE TYPE USE (PERMIT, GUIDANCE ETC.)
OTHER COMMENTS
800 Reservoir for domestic water supply
30 Well for domestic water supply
20 Water course 50 Public highway 20 Property boundary
Pig production unit of any size
500 Rural dwelling
1,500 Place of public assembly
2,000 Residential area, urban
Pig production unit with up to 2,000 pigs
New Zealandf
variable Rural dwelling, place of public assembly, urban residential area
Pig production unit with 2,000 or more pigs
Code of Practice
Adjustable setback distances depend on the size of operation and a set of correction factors for operational characteristics
200 Public road – except those described below
50 Public road – unsealed, with less than 50 vehicles/day
200 Major watercourse 100 Other watercourse 800 Major water reservoir 100 Dairy 100 Slaughterhouse
New South Wales (Australia)
200 Neighbouring rural residential
Broiler chicken farm, intensive piggery, cattle feedlot
Level 1 Assessment. These should not be interpreted as buffer zones.
This is a minimum fixed separation distance. The variable separation distance must also be calculated and the greater of the two should be used as the separation distance.

Reputation Resources Results Odour Management in British Columbia: RWDI AIR Inc Review and Recommendations W05-1108 Final Report - 39 - March 2005
JURISDICTION SEPARATION DISTANCE (m)
LAND USE SOURCE TYPE USE (PERMIT, GUIDANCE ETC.)
OTHER COMMENTS
20 Property boundary New South Wales (Australia) Variable
Broiler chicken farm, intensive piggery, cattle feedlot
Level 1 Assessment. These should not be interpreted as buffer zones.
See equations in text
2,000 Large town (>2,000 persons)
1,500 Town (>100 persons) 1,000 Small town
(>20 persons)
750 Rural residential development
300 Rural farm residence 200 Public area 100 Public road –
>50 vehicles/day
50 Public road – <50 vehicles/day
800 Major water supply storage
100 Watercourse 100 Groundwater bores 20 Property boundary
Land disposal: discharge height >2 m
Guideline
1,500 Large town
(>2,000 persons)
1,000 Town (>100 persons) 750 Small town
(>20 persons)
500 Rural residential development
200 Rural farm residence 100 Public area 50 Public road –
>50 vehicles/day
Queensland (Australia)d, i
25 Public road – <50 vehicles/day
Land disposal: mechanical spreader discharge height <2 m
Guideline

Reputation Resources Results Odour Management in British Columbia: RWDI AIR Inc Review and Recommendations W05-1108 Final Report - 40 - March 2005
JURISDICTION SEPARATION DISTANCE (m)
LAND USE SOURCE TYPE USE (PERMIT, GUIDANCE ETC.)
OTHER COMMENTS
800 Major water supply storage
100 Watercourse 100 Groundwater bores 20 Property boundary
Land disposal: mechanical spreader discharge height <2 m
Guideline
500 Large town
(>2,000 persons)
250 Town (>100 persons) 200 Small town
(>20 persons)
150 Rural residential development
100 Rural farm residence 50 Public area 0 Public road –
>50 vehicles/day
0 Public road – <50 vehicles/day
800 Major water supply storage
25 Watercourse 25 Groundwater bores 0 Property boundary
Land disposal: discharge by injection
Guideline
500 Intermittent agricultural activities
(e.g. fertiliser spreading, effluent disposal or chemical spraying)
Planning guideline A buffer should be implemented if odour from intermittent agricultural activities exceed nuisance levels for >1% of the time (or 88 h/yr).
200 Public road – >50 vehicles/day
100 Public road – <50 vehicles/day
Queensland (Australia)d, i
800 Major water supply storage
Piggery Complex Permit

Reputation Resources Results Odour Management in British Columbia: RWDI AIR Inc Review and Recommendations W05-1108 Final Report - 41 - March 2005
JURISDICTION SEPARATION DISTANCE (m)
LAND USE SOURCE TYPE USE (PERMIT, GUIDANCE ETC.)
OTHER COMMENTS
100 Watercourse 100 Groundwater bores
1,000* Large town (>2,000 persons)
750* Town (>100 persons) 500* Town (>20 persons) 400* Rural residential
development 250* Rural farm residence 20 Property boundary
2,000 Neighbouring piggery
Piggery Complex Permit *These are minimum fixed distances. The variable separation distance must also be calculated and the greater distance of the two applied.
Queensland (Australia)d, i
Variable Piggeries See equations in Section 2.5.2.6
250 Minor landfill depot 500
Urban residential development Major landfill depot
Objective is protection of residential and visual amenity, e.g. minimize odour, dust, noise, seepage, gas migration problems
200 Minor landfill depot 500
Highways and arterial road networks Major landfill depot
Protection of safety & visual amenity, e.g. ensure safe motoring, minimize dust and litter migration
250 Minor landfill depot 500
Rural township Major landfill depot
Protection of residential and visual amenity, e.g. minimise odour, dust, noise, seepage, gas migration problems
** Minor landfill depot
South Australia (Australia)e
** Environmentally sensitive uses Major landfill depot
Guidelines that apply to new industries and redevelopment of existing industries for which development authorisation is required under the Development Act, not applies retrospectively to existing industries
Environmental values of the area not compromised by the landfill

Reputation Resources Results Odour Management in British Columbia: RWDI AIR Inc Review and Recommendations W05-1108 Final Report - 42 - March 2005
JURISDICTION SEPARATION DISTANCE (m)
LAND USE SOURCE TYPE USE (PERMIT, GUIDANCE ETC.)
OTHER COMMENTS
1,000 Chemical fertilisers 1,000 Coke production 1,000 Polyester resins production 1,000 Synthetic resin/rubber production 1,000 Explosives 300 Formaldehyde production
1,000 Paint/ink manufacture
300 200
Paint/mix blending: a) solvent based b) water based
1,000 Pharmaceutical/veterinary products 1,000 Biocides 300 Soap/detergents production 100 Cosmetics production 200 Inks
2,000 Petroleum refinery 500 Other petroleum/coal products
300 100
Petroleum/crude oil storage >2,000 t: a) fixed roofs b) floating roofs
1,000 Bulk volatile organic compounds storage >1000 t
1,000 Organic industrial chemicals 1,000 Inorganic industrial chemicals 300 Other chemical products – non-
industrial
500 Refractories 500 Artificial textiles and synthetic
fibres
South Australia (Australia)e
100
500
Sensitive receptors, such as: - caravan parks - community centres - consulting rooms - detached dwellings - educational
establishments - childcare centres - hospitals - hotels - motels - multiple dwellings - nursing homes - offices - residential flat
buildings - row dwellings - parkland,
recreation areas or reserves
- semi-detached dwellings
- incompatible industries
Wood preservation plants - not including the use of
creosote-based preservative - including the use of creosote-
based preservative
Guidelines that apply to new industries and redevelopment of existing industries for which development authorisation is required under the Development Act, not applies retrospectively to existing industries

Reputation Resources Results Odour Management in British Columbia: RWDI AIR Inc Review and Recommendations W05-1108 Final Report - 43 - March 2005
JURISDICTION SEPARATION DISTANCE (m)
LAND USE SOURCE TYPE USE (PERMIT, GUIDANCE ETC.)
OTHER COMMENTS
1,000 Industrial gas production 100 Plaster products
1,000 Iron ore smelting 100 Concrete batch plants 500 Bitumen batch plants 100 Concrete/stone products
1,000 500 300
Cement manufacture - >150 kt/yr - >5 kt/yr < 150 kt/yr - <5 kt/yr
500 Ferrous foundries large (>500 t/yr) 500 Ferrous foundries medium (<100 to
500 t/yr)
200 Ferrous foundries small (<100 t/yr)
500 500
Non-ferrous foundries large (>500 t/yr) - use of resin sand moulding - die-casting
300 200
Non-ferrous foundries medium (100 to 500 t/yr) - use of resin sand moulding - die-casting
200 100
Non-ferrous foundries small (<100 t/yr) - use of resin sand moulding - die-casting
2,000 Aluminium by electrolysis 300 Rubber production/ mixing using
either organic solvents of carbon black
500 Sawmills 300 Wood fibre/chip production
South Australia (Australia)e
50
Sensitive receptors, such as: - caravan parks - community centres - consulting rooms - detached dwellings - educational
establishments - childcare centres - hospitals - hotels - motels - multiple dwellings - nursing homes - offices - residential flat
buildings - row dwellings - parkland,
recreation areas or reserves
- semi-detached dwellings
- incompatible industries
Joineries, wood working
Guidelines that apply to new industries and redevelopment of existing industries for which development authorisation is required under the Development Act, not applies retrospectively to existing industries

Reputation Resources Results Odour Management in British Columbia: RWDI AIR Inc Review and Recommendations W05-1108 Final Report - 44 - March 2005
JURISDICTION SEPARATION DISTANCE (m)
LAND USE SOURCE TYPE USE (PERMIT, GUIDANCE ETC.)
OTHER COMMENTS
5,000
200
100
#
Pulp or paper works - paper products or pulp involving
combustion of sulphur containing materials
- paper products or pulp from prepared cellulose and rag
- paper products or pulp from semi-processed materials
- paper products or pulp from other methods
300 Hot mix asphalt
500 100
50
Abrasive cleaning in the open: - dry abrasive cleaning - wet abrasive cleaning using a
blast cleaning cabinet or a totally enclosed automatic blast cleaning unit:
- all abrasive cleaning
50 Surface coating, including spay painting
100 Electroplating Scrap metal recovery
500 Glass/glass production/wool (glass fibre)
500 Rock wool manufacture 2,000 Structural/ sheet producer large 1,000 Structural/ sheet producer medium 100 Printing and coating works with
curing ovens
## Sewage works with capacity of <50,000 equivalent population
South Australia (Australia)e
200 to 3,000
Sensitive receptors, such as: - caravan parks - community centres - consulting rooms - detached dwellings - educational
establishments - childcare centres - hospitals - hotels - motels - multiple dwellings - nursing homes - offices - residential flat
buildings - row dwellings - parkland,
recreation areas or reserves
- semi-detached dwellings
- incompatible industries
Landfill
Guidelines that apply to new industries and redevelopment of existing industries for which development authorisation is required under the Development Act, not applies retrospectively to existing industries

Reputation Resources Results Odour Management in British Columbia: RWDI AIR Inc Review and Recommendations W05-1108 Final Report - 45 - March 2005
JURISDICTION SEPARATION DISTANCE (m)
LAND USE SOURCE TYPE USE (PERMIT, GUIDANCE ETC.)
OTHER COMMENTS
300 150
Refuse transfer station a) general refuse b) green waste compaction and
removal for composting off site within one week
300 Temporary storage industrial waste 300 Treated aqueous waste not sewage 500 Treated organic waste not sewage 500 Incineration for plastic/rubber
waste
500 Incineration for chemical/ bio-medical/organic waste
150 Crematorium 300 Recycle centre 100 Refuse collection vehicle depot 300 Incineration for wood waste 100 Industrial drycleaners 300 Ostrich and emu farming 500 Stockyards, saleyards 100 Smokehouses – curing and drying
works
500 Abattoirs, including bird processing (killing of animals for human consumption)
1,000 Processing and rendering works 100 Small goods production 100 Milk products # Mushroom production
300 Wool scouring – degreasing and primary treatment of wool
1,000 Rendering/casing works
South Australia (Australia)e
300
Sensitive receptors, such as: - caravan parks - community centres - consulting rooms - detached dwellings - educational
establishments - childcare centres - hospitals - hotels - motels - multiple dwellings - nursing homes - offices - residential flat
buildings - row dwellings - parkland,
recreation areas or reserves
- semi-detached dwellings
- incompatible industries
Tanning/leather dressing
Guidelines that apply to new industries and redevelopment of existing industries for which development authorisation is required under the Development Act, not applies retrospectively to existing industries

Reputation Resources Results Odour Management in British Columbia: RWDI AIR Inc Review and Recommendations W05-1108 Final Report - 46 - March 2005
JURISDICTION SEPARATION DISTANCE (m)
LAND USE SOURCE TYPE USE (PERMIT, GUIDANCE ETC.)
OTHER COMMENTS
1,000 500 100 250 20
Poultry production a) surrounding poultry sheds
- urban residential zone - dwelling on another property - dwelling on same property - public road - side or rear boundary
500 100
50 50 20 50
b) surrounding waste disposal areas - urban residential zone - rural farm residence not
owned by poultry sheds - public area - public road – significant use - public road – minor use - any watercourse as defined by
a blue line in the current 1:50,000 SA government topographical map
# Other livestock
500 #
Compost a) containing ‘green’ organic waste b) containing organic waste
300 Vegetable oil/fats processing using solvents
1,000
300
Wineries or distilleries - untreated winery waste water in
an open lagoon - winery operations (based on
noise attenuation principles)
300 Flour mills 300 Grain elevators 300 Briquettes production 500 Quarry/processing/blasting 200 Maltworks 100 Boilers 500 kg/hr fuel
South Australia (Australia)e
300
Sensitive receptors, such as: - caravan parks - community centres - consulting rooms - detached dwellings - educational
establishments - childcare centres - hospitals - hotels - motels - multiple dwellings - nursing homes - offices - residential flat
buildings - row dwellings - parkland,
recreation areas or reserves
- semi-detached dwellings
- incompatible industries
Carpet backing with latex
Guidelines that apply to new industries and redevelopment of existing industries for which development authorisation is required under the Development Act, not applies retrospectively to existing industries

Reputation Resources Results Odour Management in British Columbia: RWDI AIR Inc Review and Recommendations W05-1108 Final Report - 47 - March 2005
JURISDICTION SEPARATION DISTANCE (m)
LAND USE SOURCE TYPE USE (PERMIT, GUIDANCE ETC.)
OTHER COMMENTS
100 Bakeries 100 Dyeing/finishing 500
1,000 Charcoal: a) by the retort process b) other that retort process
100 Rope, cord and twine 200 Fibreglass-reinforced materials
manufacture
300 Gas distribution works 1,000 Gas odorising with mercaptan 100 Transport depot including bus
depots
2,000 Anti-frost fans – buffer distance based on noise attenuation principles
300 Unprocessed hides 100 Mechanical/biological wastewater
plants including aerated lagoons (equivalent population <1,000)
200 Mechanical/biological wastewater plants including aerated lagoons (equivalent population <5,000)
300 Mechanical/biological wastewater plants including aerated lagoons (equivalent population <20,000)
400 Mechanical/biological wastewater plants including aerated lagoons (equivalent population <50,000)
150 Facultative lagoons (equivalent population <1,000)
350 Facultative lagoons (equivalent population <5,000)
700 Facultative lagoons (equivalent population <20,000
South Australia (Australia)e
1,000
Sensitive receptors, such as: - caravan parks - community centres - consulting rooms - detached dwellings - educational
establishments - childcare centres - hospitals - hotels - motels - multiple dwellings - nursing homes - offices - residential flat
buildings - row dwellings - parkland,
recreation areas or reserves
- semi-detached dwellings
- incompatible industries
Facultative lagoons (equivalent population <50,000)
Guidelines that apply to new industries and redevelopment of existing industries for which development authorisation is required under the Development Act, not applies retrospectively to existing industries

Reputation Resources Results Odour Management in British Columbia: RWDI AIR Inc Review and Recommendations W05-1108 Final Report - 48 - March 2005
JURISDICTION SEPARATION DISTANCE (m)
LAND USE SOURCE TYPE USE (PERMIT, GUIDANCE ETC.)
OTHER COMMENTS
South Australia (Australia)e
Variable Intensive piggeries See equations in text
EUROPE Austria Variable Livestock husbandry Guideline See equations in text
below 150 Plants sensitive to
nitrogen (tree nurseries, cultivated plants) and ecosystems
Farming or breeding livestock Regulation
350 Residential area Slaughterhouses 500 Residential area Manure-drying facility, facility for
drying green fodder
300 Residential area -Closed organic waste composting facility with throughput >3,000 Mg/yr -Closed bio-waste fermenter with throughput >10 Mg/day -Facility for drying waste products -Facility for storage of liquid manure
500 Residential area -Open organic waste composting facility with throughput >3,000 Mg/yr -Open bio-waste fermenter with throughput >10 Mg/day
Germanyf,h
variable Livestock operations Setback distances graph for different numbers of “livestock units” with correction based on points for operational practice and design of the facility
300 Residential area Composting plants, wastewater treatment plants
Nordrhine-Westfalia (Germany)
500 Residential area Livestock facilities greater than a certain size, slaughterhouses, landfills, drive-in cinemas
Used for area development plans – not a regulation for emitting facilities

Reputation Resources Results Odour Management in British Columbia: RWDI AIR Inc Review and Recommendations W05-1108 Final Report - 49 - March 2005
JURISDICTION SEPARATION DISTANCE (m)
LAND USE SOURCE TYPE USE (PERMIT, GUIDANCE ETC.)
OTHER COMMENTS
700 Residential area Facilities for production of sauerkraut, facilities for production of sugar, car industries
1,000 Residential area Facilities for the removal of animal cadavers, wharfs, furnaces for steel production
Nordrhine-Westfalia (Germany)
1,500 Residential area Chemical industries with more than 10 production units, furnaces for pig-iron production, power plants >900 MW
Used for area development plans – not a regulation for emitting facilities
100 - 200 Production 0-5,000 t/yr 200 - 400 Production 5,001–
10,000 t/yr 400 – 600 Production 10,001–
15,000 t/yr 600 – 750 Production 15,001–
20,000 t/yr > 750
Composting installation for vegetable waste with frequent turning using special machines
Production >20,000 t/yr 225 – 300 Production 0-5,000 t/yr 300 – 450 Production 5,001–
10,000 t/yr 450 – 600 Production 10,001–
15,000 t/yr 600 – 750 Production 15,001–
20,000 t/yr >750
Composting installation for vegetable waste – conventional method of turning using a grab or loader
Production >20,000 t/yr 100 Production <20,000 t/yr 200
Composting installation for vegetable waste – forced aeration
Standards used in permits
Production >20,000 t/yr
The Netherlands f,g
variable Pig production Graph relating the required setback distance to the number of animals
a Colorado Air Quality Control Commission (1999) b Ontario MOE Guideline D-2 (1996) c Canadian Legal Information Institute (2004) d Queensland Department of Natural Resources and Mines (2001) e South Australia EPA (2003)

Reputation Resources Results Odour Management in British Columbia: RWDI AIR Inc Review and Recommendations W05-1108 Final Report - 50 - March 2005
f Ireland EPA (2001) g InfoMil (2003) h Germany (2001) i Queensland DPI (2001) ** Performance criteria, rather than separation distances, are proposed to groundwater recharge zones, as it is often difficult to define the actual water levels, particularly in areas which are subject to tidal or seasonal variations. Similarly, separation distances have not been proposed for environmentally sensitive uses, since they will need to be based on specific requirements for those areas. # Separation distances for any existing or proposed establishment in this category will be determined by the EPA on a site specific basis ## The separation distances for sewage treatment or effluent disposal works must be determined in consultation with the EPA

Reputation Resources Results Odour Management in British Columbia: RWDI AIR Inc Review and Recommendations W05-1108 Final Report - 51 - March 2005
2.5.1 Fixed Separation Distances
Northrhine-Westfalia in Germany has a Minimum Distance Regulation that establishes minimum distances between a large range of industrial or commercial areas and residential areas. These distances were established with the aim of avoiding “serious annoyance” due to air pollution or noise (Frechen, 1997). They are used to create area development plans and are not used to regulate industrial facilities. The distances range from 300 m for a composting plant to 1,500 m for a chemical industry with more than 10 production units (see Table 2-6).
The Netherlands has a range of fixed separation distances for different types of composting installations that vary depending upon the production of the facility. For example, the separation distance required for a composting installation for vegetable waste with frequent turning using special machines is 100 to 200 m for production of less than 5,000 t/yr or 600 to 750 m for production of 15,001 to 20,000 t/yr.
New Zealand has some fixed separation distances for pig production units. For example, all pig production units, no matter what size they are, have to be located at least 800 m from a reservoir for domestic water supply and 50 m from a public highway. Pig production units with up to 2,000 pigs have to be located at least 500 m from a local dwelling and 1,500 m from a place of public assembly.
South Australia has the most extensive set of fixed separation distances for a range of industrial sectors including: petroleum and chemical; manufacturing and mineral processing; waste treatment and disposal; food production, animal and plant processing; materials handling and transportation; sewage treatment works; liquid waste disposal; and solid waste landfill depots. The use of separation distances, either fixed or variable, is integral to the South Australian odour management program.
2.5.2 Variable Minimum Separation Distances
Variable minimum separation distances are much more commonly used in the agricultural sector. Typically, they will be calculated using an equation with a number of factors that depend on the type of animal, the size of the operation, characteristics of the operation (e.g., type of manure) and possibly topography, landscape or meteorology. Some jurisdictions make use of more sophisticated tools such as the Minnesota Odour from Feedlots Setback Estimation Tool

Reputation Resources Results Odour Management in British Columbia: RWDI AIR Inc Review and Recommendations W05-1108 Final Report - 52 - March 2005
(OFFSET), the Iowa Master Matrix, or the Purdue Model, which is web-based. New South Wales has one of the most sophisticated odour impact assessment methodologies for agricultural operations that consists of three levels: rule-of-thumb, screening modelling and refined dispersion modelling.
2.5.2.1 Alberta
An example of a relatively simple equation-based system is the Alberta minimum distance separation (MDS), which is set out in the Agricultural Operation Practices Act Standards and Administration Regulation (Alberta, 2002). The equation for a new operation is:
MDS (m) = (Odour Production)K x Odour Objective x Dispersion Factor
Where: Odour Production: is the compilation of factors which take into account the nuisance value of
species, technology of production system and the number of animals. It is described as a Livestock Siting Unit (LSU), which is the product of specific LSU factors for different types of animals and the number of animals at the facility.
Odour Objective: describes the sensitivity of neighbouring land uses for four categories. Category 1: land zoned for agricultural purposes (e.g., farmstead, acreage residences) Category 2: land zoned for non-agricultural purposes (e.g., country residential, rural commercial businesses) Category 3: land zoned as large-scale country residential, high-use recreational or commercial purposes, as well as from the urban fringe boundary of land zoned as rural hamlet, village or town which has an urban fringe. Category 4: land zoned as rural hamlet, village or town without an urban fringe.
Dispersion factor: allows for a variance to the MDS due to the unique climatic and topographic influences at the site. There are three subfactors for topography, screening and micro-climate. Unless information is provided to prove otherwise, the dispersion factor shall equal 1.0. In practice, a value of 1.0 has been used although the Natural Resource Conservation Board is considering establishing topography factors other than 1.0.

Reputation Resources Results Odour Management in British Columbia: RWDI AIR Inc Review and Recommendations W05-1108 Final Report - 53 - March 2005
Exponent K: is equal to 0.365 for all species.
LSU factors are provided for beef, dairy, swine, poultry, horses, goats, sheep, cervid (elk and deer), bison, alpaca/llama, fur farms (mink and fox), rabbits and ratites (emu and ostrich). Tables of pre-calculated MDS are provided for common livestock types. As an example, the MDS for a typical 600 sow farrow-to-finish operation with liquid manure range from 698 m for Category 1 to 1,860 m for Category 4.
2.5.2.2 Ontario
In Ontario, a similar system of equations and tables is used and calculation forms are provided to assist the user. One major difference with the Alberta system is the element of reciprocity: not only do new agricultural facilities need to ensure that they are not built too close to residences but new developments cannot encroach on existing farms. The MDS I equations provide the distance separation requirements between existing farms and new non-farm uses and are used for the review of planning and development applications (Ontario MAFRA, 1995a). The MDS II equations provide minimum distance separation requirements for livestock facilities within agricultural areas (Ontario MAFRA, 1995b).
2.5.2.3 Quebec
In Quebec, it is clearly stated that the minimum distance guidelines pertain only to inconveniences due to odours and no aspect of pollution control. Their purpose is to foster harmonious coexistence in rural areas. The minimum distances for livestock facilities are computed using equations combining seven parameters specific to the category of neighbouring unit in question. The parameters are:
• Parameter A: number of animal units (based on a live weight of 500 kg per animal unit) • Parameter B: base distance (a function of parameter A – provided in a table) • Parameter C: odour load as a function of animal type (provided in a table) • Parameter D: type of manure (solid or liquid) • Parameter E: project type (For expansions less than 300 animal units a factor less than 1
is applied. An increase involving 300 units or more is equated with a new project.) • Parameter F: attenuation factor (reflects the attenuating effect of innovative technologies
or management practices)
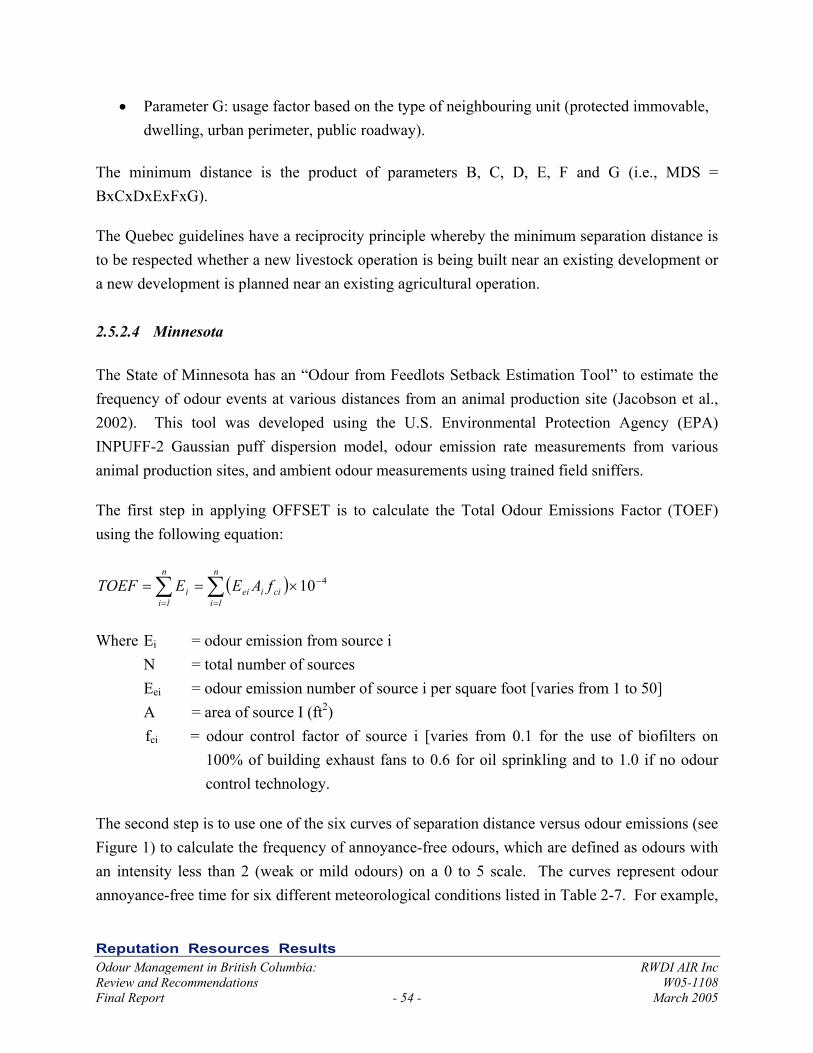
Reputation Resources Results Odour Management in British Columbia: RWDI AIR Inc Review and Recommendations W05-1108 Final Report - 54 - March 2005
• Parameter G: usage factor based on the type of neighbouring unit (protected immovable, dwelling, urban perimeter, public roadway).
The minimum distance is the product of parameters B, C, D, E, F and G (i.e., MDS = BxCxDxExFxG).
The Quebec guidelines have a reciprocity principle whereby the minimum separation distance is to be respected whether a new livestock operation is being built near an existing development or a new development is planned near an existing agricultural operation.
2.5.2.4 Minnesota
The State of Minnesota has an “Odour from Feedlots Setback Estimation Tool” to estimate the frequency of odour events at various distances from an animal production site (Jacobson et al., 2002). This tool was developed using the U.S. Environmental Protection Agency (EPA) INPUFF-2 Gaussian puff dispersion model, odour emission rate measurements from various animal production sites, and ambient odour measurements using trained field sniffers.
The first step in applying OFFSET is to calculate the Total Odour Emissions Factor (TOEF) using the following equation:
( )∑∑=
−
=
×==n
liciiei
n
lii fAEETOEF 410
Where Ei = odour emission from source i
N = total number of sources Eei = odour emission number of source i per square foot [varies from 1 to 50] A = area of source I (ft2)
fci = odour control factor of source i [varies from 0.1 for the use of biofilters on 100% of building exhaust fans to 0.6 for oil sprinkling and to 1.0 if no odour control technology.
The second step is to use one of the six curves of separation distance versus odour emissions (see Figure 1) to calculate the frequency of annoyance-free odours, which are defined as odours with an intensity less than 2 (weak or mild odours) on a 0 to 5 scale. The curves represent odour annoyance-free time for six different meteorological conditions listed in Table 2-7. For example,

Reputation Resources Results Odour Management in British Columbia: RWDI AIR Inc Review and Recommendations W05-1108 Final Report - 55 - March 2005
to ensure that 99% of the time a receptor will not be annoyed by odours, the minimum separation distance is calculated using the top curve in Figure 1.
Table 2-7 Meteorological Conditions Used to Calculate the Six Frequency Curves of Odour Annoyance Free Time used in OFFSET
Frequency of Odour Annoyance-Free Time
(%)
Associated Meteorological Conditions
99 Stability class F, wind speed 3mph 98 Stability class F, wind speed 7mph 97 Stability class E, wind speed 7mph 96 Stability class E, wind speed 12mph 94 Stability class D, wind speed 12mph 91 Stability class D, wind speed 18mph
Figure 1 Estimated setback distances (in feet) from farms at different odor annoyance-free frequency requirements, leeward of the prevailing wind from animal operations.
(Note: 1 mile = 5,280 feet) (Jacobson et al., 2002)

Reputation Resources Results Odour Management in British Columbia: RWDI AIR Inc Review and Recommendations W05-1108 Final Report - 56 - March 2005
2.5.2.5 Purdue Odour Setback Guideline
A site-specific setback guideline for USA swine production systems has been developed by researchers at Purdue University that is available on the internet3. It is based on a more complex Austrian guideline. The Purdue guideline considers facility size, orientation and shape, wind frequency, land use, topography, building design and management, manure handling characteristics, and odour abatement effectiveness (Heber et al., 2000).
The setback distance (Dmin) in metres is calculated by:
Dmin = 0.61 F L T V (AE E+ASS)0.5
Where: F = wind frequency factor [0.75 to 1.00] L = land use factor [0.5 to 1.00] T = Topography Factor [0.8 to 1.00] V = orientation and shape factor [1.00 to 1.15] AE = odour abatement factor for buildings [0.30 to 1.00] E = building odour emission (OU/s) = N x P x B N = number of pigs P = odour emission factor (OU/s –pig) [1 to 15] B = building design and management factor = M – D M = manure removal frequency [0.50 to 1.00] D = manure dilution factor [0.00 to 0.20] AS = odour abatement factor for outside liquid manure storage [0.30 to 1.00] S = odour emission from outdoor storage (OU/s) = C x G C = odour emission factor for outside liquid manure storage, 50 OU/s-AU G = animal unit, AU = 1,000lb of pig weight
More detailed information on the other factors in the Purdue model can be found in Heber et al. (2000).
3 http://pasture.ecn.purdue.edu/~odor/setbackprogram.html

Reputation Resources Results Odour Management in British Columbia: RWDI AIR Inc Review and Recommendations W05-1108 Final Report - 57 - March 2005
2.5.2.6 Queensland, Australia
Queensland, Australia has developed Separation Guidelines for Queensland Piggeries (Queensland DPI, 2001) to provide a method whereby piggeries can be consistently assessed in terms of their potential community amenity impact. This method is based on a combination of scientific research and practical experience. Separation distances specified in these guidelines are divided into two types: fixed and variable. Fixed separation distances are listed in Table 2-6. Variable separation distances are calculated using the following equation:
Separation Distance (D) = N0.65 x S1 x S2 x S3 x S4
Where: N = Number of standard pig units S1 = Effluent removal factor S2 = Receptor type factor S3 = Terrain factor S4 = Surface roughness factor
The equivalent number of standard pig units is calculated using standard multipliers for each class of pig, presented in Table 2-8. Effluent removal factors, S1, are listed in Table 2-9, values of receptor type, S2, are listed in Table 2-10, values of terrain factor, S3, are listed in Table 2-11, and values of the surface roughness factor are provided in Table 2-12. The recommended values for the surface roughness factor were generated by running the AUSPLUME model, the Australian regulatory dispersion model which is similar to the US EPA ISC3 model, using different surface roughness heights, which are also listed in Table 2-12. The AUSPLUME modelling was based on a standard symmetrical configuration of piggery. The Separation Guideline for Queensland Piggeries states that the use of the standard S factor formula for siting a piggery may not be appropriate for piggeries that vary significantly from the standard symmetrical layout.

Reputation Resources Results Odour Management in British Columbia: RWDI AIR Inc Review and Recommendations W05-1108 Final Report - 58 - March 2005
Table 2-8 Calculation of N = Standard Pig Units, used in the Separation Guidelines for Queensland Piggeries
Class of Pig Mass (kg) Age / Period (weeks) Multiplier Gilts 100 – 160 24 – 30 1.8 Boars 100 – 300 24 – 126 1.6
Gestating Sows 160 – 215 16.3 1.6 Lactating Sows 215 – 160 4 2.5
Sucker 1.4 – 8 0 – 4 0.1 Weaner 8 – 25 4 – 10 0.5 Grower 25 – 55 10 – 16 1.0 Finisher 55 – 100 16 – 24 1.6
Table 2-9 Values of Effluent Removal Factor, S1, used in the Separation Guidelines for Queensland Piggeries
Effluent Removal System Value of S1 Held for greater than 24 hours within building (e.g., static pit or pull plug) 1.00 Held for less than 24 hours within building (e.g., flushing system) 0.95 Held for less than 12 hours (e.g., flushed twice daily) 0.90 Deep litter system (no effluent treatment ponds) 0.50
Table 2-10 Values of Receptor Type Factor, S2, used in the Separation Guidelines for Queensland Piggeries
Receptor type Value of S2 Large town > 2,000 persons 17.3 Town > 100 persons 9.8 Small town > 20 persons 7.1 Rural residential development – intensive 7.1 Rural residential development – extensive 5.7 Rural farm residence 4.7 Rural school 4.7 Rural church/community centre 3.0 Public area 1.5

Reputation Resources Results Odour Management in British Columbia: RWDI AIR Inc Review and Recommendations W05-1108 Final Report - 59 - March 2005
Table 2-11 Values of the Terrain Factor, S3, used in the Separation Guidelines for Queensland Piggeries
Description Value of S3 Low relief at >2% from site4 1.2 Valley drainage zone5 1.2 to 2.0 Flat6 1.0
Table 2-12 Values of Surface Roughness Factor, S4, used in the Separation Guidelines for Queensland Piggeries
Surface Roughness Feature7 Value of S4 Surface Roughness Height (m) used in Dispersion Modelling to Generate S48
Crops only, no tree cover 1.15 0.05 Few trees, long grass 1.00 0.10 Undulating hills 0.90 0.20 Level wooded country 0.75 0.40 Heavy timber 0.65 0.80 Heavy forest (both upper and lower storey) 0.60 1.00 Significant hills and valleys 0.50 2.00
4 Low relief applies where a receptor is generally below the 2% (1.15o) falling grade line from the piggery, but not in topography that would tend to confine odours.
5 Valley drainage zones apply when the receptor is situated in a valley, below the 2% (1.15o) falling grade line from the piggery. The valley must have significant confining side walls that tend to prevent the dispersion of any odours generated by the piggery. Values ranging from 1.2 to 2.0 may be selected depending on the degree of confinement. Factors such as the steepness of the valley and confining walls, the width of the valley and the continuity of the confining features should be considered in selecting an appropriate value.
6 Flat topographic conditions apply for all cases other than low relief and valley drainage as described in (a) and (b).
7 Definitions for these categories are provided in McGahan et al., 2001b
8 Surface roughness heights are from McGahan et al., 2000

Reputation Resources Results Odour Management in British Columbia: RWDI AIR Inc Review and Recommendations W05-1108 Final Report - 60 - March 2005
2.5.2.7 South Australia
South Australia also has fixed and variable minimum separation distances or “buffer distances” for piggeries, which are documented in the Guidelines for Establishment of Intensive Piggeries in South Australia (South Australia EPA, 1998). The fixed separation distances are provided in Table 2-6. The South Australian guidelines differ from those in other jurisdictions as they were designed to provide a system of classification that will allow pig numbers to be varied according to the management standards proposed. Thus, planning authorities can provide tangible benefits to operators with proven satisfactory performance, and conversely can downgrade the classification of the piggery and reduce the number of pigs if standard operations decline. Either the number of standard pig units (N) or the size of the buffer distance (D) can be calculated using one of the following two equations:
( )( )250/ SDN =
Or
SND 50=
Where: N = number of standard pig units (e.g., grower pig weighing 26 to 60 kg live weight) D = separation distance in metres between the closest points of the piggery (including
manure stockpile areas) and the most sensitive receptor or impact location S = composite site factor = S1 x S2 x S3 x S4 x S5 S1 = Odour Potential Factor – based on the type of building, ventilation of the building,
effluent collection frequency, effluent treatment system, and feeding. S2 = Receptor Type Factor – based on the size of town or the land use S3 = Terrain Factor – for flat, undulating, high relief, and low relief. S4 = Vegetation Factor – no, light or heavy tree cover. S5 = Wind Factor – high frequency towards receptor, normal, low frequency towards
receptor.
Although the values of these factors differ from those used in Queensland, the concept is the same: there is a look-up table for each factor. An indication of the table categories is provided above in the description of each factor. The tables of factors can be found in South Australia (1998).

Reputation Resources Results Odour Management in British Columbia: RWDI AIR Inc Review and Recommendations W05-1108 Final Report - 61 - March 2005
2.5.2.8 New South Wales, Australia
In New South Wales (NSW), there are fixed and variable separation distances for broiler chicken farms, intensive piggeries, and cattle feedlots that are used for a Level 1 assessment of this type of facility (see Section 3.4 for more information on levels of assessment). The fixed separation distances are the same for all three types of facility and are provided in Table 2-6. The variable separation distances are all based on an equation with a similar format but with different coefficients and exponents. The equation for piggeries is the same as that used in South Australia. As in South Australia, either the minimum separation distance for a given number of animals (chicken sheds) or the number of animals for a given separation distance can be calculated. For simplicity, only the separation distance equations are provided below.
For broiler chickens: SND 17.0=
For Piggeries: SND 50=
For Cattle feedlots: SND =
Where:
D = separation distance in metres between the closest points of the most sensitive receptor and the broiler chicken shed/ piggery complex/ cattle pens and stockpiles.
N = number of broiler chicken sheds or number of standard pig units or number of cattle S = composite site factor = S1 x S2 x S3 x S4 x S5 S1 = is related to broiler chicken shed design, pig shed design and maintenance schedule, or
stocking density and feedlot class. S2 = receptor factor, which has the same categories for the three types of facility (large,
medium and small towns, rural residence and public area) but different values for each category.
S3 = terrain factors – valley drainage zone, low relief, flat, undulating country, high relief. S4 = vegetation factor- crops only & no tree cover, few trees & long grass, wooded country,
heavy timber, and heavy forest S5 = wind frequency factor – high frequency towards receptor, normal, low frequency
towards receptor.
Look-up tables for each factor are provided in the Technical Notes to the Draft Policy: Assessment and Management of Odour from Stationary Sources in NSW (NSW EPA, 2001a).
Reputation Resources Results Odour Management in British Columbia: RWDI AIR Inc Review and Recommendations W05-1108 Final Report - 62 - March 2005
2.6 ODOUR INTENSITY SCALES
A number of jurisdictions have developed semi-quantitative odour intensity scales to assist field personnel when they are investigating an odour complaint. This allows field staff to make a determination regarding the intensity of an odour without having to have special training (such as Nasal Ranger training) or send an odour sample to a laboratory to undergo olfactometric testing. The main advantage of this approach is its simplicity. Various odour intensity scales and any related criteria are provided in Table 2-13. Most scales range from 0 to 5 although the scale used by the Puget Sound Clean Air Agency varies from only 0 to 4 and the German and Western Australian scales vary from 0 to 6.
The Swiss odour annoyance thermometer differs from the other scales. An odour impact is considered to be “too high” and therefore not allowed if a relevant portion of the population is significantly annoyed (Frechen, 1997). The level of annoyance of the population is determined using questionnaires. People are shown a thermometer bulb with levels from 0 to 10 and asked to use it to describe their level of annoyance with an odour. Long-term measures to improve odour emissions are required if the level of odour annoyance is medium and immediate measures are required if the level of annoyance is strong. A similar system is used in Germany to assess odour annoyance.
In Texas, a system of five categories, shown in Table 2-14, is used to classify odours by investigators in the field (SRF Consulting, 2004). This system makes the best use of the FIDOL factors of all the odour scales that were found during the literature search. Note that it appears that this table has been replaced with an even better system for investigating odour complaints that is summarized in Section 2.8.
McGinley et al. (2000) suggest some other categories that could be used to semi-quantitatively characterize odour. It was not clear from their paper whether these categories are currently being used by specific jurisdictions; however, we reproduce them here to illustrate some alternative ways to characterize odour in the field.
Annoyance Categories: 1. Not Annoying 2. A Little Annoying 3. Annoying 4. Very Annoying 5. Extremely Annoying

Reputation Resources Results Odour Management in British Columbia: RWDI AIR Inc Review and Recommendations W05-1108 Final Report - 63 - March 2005
Nuisance Categories: 1. An odour that would ordinarily not be noticed by the average person but could be detected
by the experienced inspector or by a hypersensitive individual. 2. An odour, so weak, that the average person might detect it if attention was called to it but
would not otherwise attract attention. 3. An odour of moderate intensity that would be readily detected and would be regarded with
disfavour. 4. An odour that would force itself on the attention of the average person and that would make
the air very unpleasant. 5. An odour of such intensity that the air would be absolutely unfit to breathe.
Objectionable Categories: 1. Odour not detectable. 2. Odorant present in the air, which activates the sense of smell, but the characteristics may not
be distinguishable. 3. Odorant present in the air, which activates the sense of smell and is distinguishable and
definite but not necessarily objectionable in short durations but may be objectionable in longer durations.
4. Odorant present in the air, which easily activates the sense of smell, is very distinct and clearly distinguishable and may tend to be objectionable and/or irritating.
5. Odorant present in the air, which would be objectionable and cause a person to attempt to avoid it completely, could indicate a tendency to possibly produce physiological effects during prolonged exposure.
6. Odorant present, which is so strong, it is overpowering and intolerable for any length of time and could tend to easily produce some physiological effects.

Reputation Resources Results Odour Management in British Columbia: RWDI AIR Inc Review and Recommendations W05-1108 Final Report - 64 - March 2005
Table 2-13 Odour Intensity Scales
JURISDICTION RELATED CRITERIA
SCALE DESCRIPTION LAND USE COMMENT
NORTH AMERICA 0 Odour not detectable 1 Very light odour (an odour is sensed or smelled, but its
characteristics may not be distinguishable)
2 Light (an odour is sensed or smelled, is distinguishable but not necessarily objectionable for short durations, yet may be objectionable during longer periods)
3 Moderate (an odour is easily sensed or smelled, is clearly distinguishable, and may be objectionable or irritating)
4 Strong (an odour is present that would cause a person to avoid it completely and could produce adverse physiological effects during prolonged exposure)
New Jersey (USA)b
5 Very strong (an odour is so strong and overpowering, it is intolerable for any length of time and easily could have adverse physiological effects)
Used by inspectors in the field. In addition to this scale, inspectors consider such factors as odour frequency and duration to determine whether a nuisance exists.
0 No odour detected 1 Odour barely detected 2 Odour is distinct and definite, any unpleasant characteristics
recognizable
3 Odour is objectionable enough or strong enough to cause attempts at avoidance
Puget Sound Clear Air Agency (Washington, USA)e
PSCAA may take enforcement action if Control Officer detects an odour at a level 2 or greater
4 Odour is so strong that a person does not want to remain present
AUSTRALASIA 0 Not detectable 1 Very weak 2 Weak 3 Distinct 4 Strong 5 Very strong
Queensland (Australia)
The annoyance threshold is set at weak rather than distinct or strong as an approach most likely to protect amenity. 6 Extremely strong
Intensity calculated using Weber-Fechner Law and measured or modelled concentration

Reputation Resources Results Odour Management in British Columbia: RWDI AIR Inc Review and Recommendations W05-1108 Final Report - 65 - March 2005
JURISDICTION RELATED CRITERIA
SCALE DESCRIPTION LAND USE COMMENT
0 Not perceptible 1 Very weak 2 Weak 3 Distinct 4 Strong 5 Very strong
Western Australia (Australia)c
Odour concentration should be less than or equivalent to an intensity level of 3
6 Extremely strong 0 Not detectable (no odour) 1 Very light (detected but not recognizable) 2 Light (detected and discernible) 3 Moderate (clear & distinctly distinguishable) 4 Strong (you want to try to avoid the smell)
Wellington (New Zealand)
5 Very strong ( overpowering and intolerable)
Used as basic guidance for Council officers in the field
EUROPE 0 Not perceptible 1 Very weak 2 Weak 3 Distinct 4 Strong 5 Very strong
Germanyd
6 Extremely strong 1 - 2 Reasonable annoyance <10% of population
strongly annoyed 3 - 5 Medium annoyance 10 to 25% of population
strongly annoyed
Switzerlandd Long term measures taken when 3 – 5, immediate measures taken when >5
6 - 10 Strong annoyance >25% of population strongly annoyed
ASIA 0 No odour 1 Barely perceivable (detection threshold) 2 Faint but identifiable (recognition threshold) 3 Easily perceivable 4 Strong
Japanb Odour is acceptable if it is less than 2.5 to 3.5
5 Repulsive

Reputation Resources Results Odour Management in British Columbia: RWDI AIR Inc Review and Recommendations W05-1108 Final Report - 66 - March 2005
JURISDICTION RELATED CRITERIA
SCALE DESCRIPTION LAND USE COMMENT
0 None 1 Threshold 2 Moderate 3 Strong 4 Very Strong
Koreaa Ambient odour should be less than degree 2
5 Excessively Strong
Facility boundary
Measured using “Direct Sensory Method”
a Park (2003) b Mahin et al. (2000) c Western Australia DEP (2002) d Frechen (1997) e Puget Sound Clean Air Agency Regulation I, Section 9.11 (1999)
Table 2-14 Texas Commission on Environmental Quality Odour Classification Table
Category 1 Category 2 Category 3 Category 4 Category 5 -No odour detected.
-Odours barely detected. -Odours very faint. -Odours very intermittent and faint. -Odours not strong enough or of sufficient duration to identify or characterize the odours.
-Odours light, not objectionable. -Odours noticeable but not unpleasant.
-Odours light to moderate, but not unpleasant. -Odours somewhat objectionable but not sufficient to interfere with the normal use and enjoyment of property. -Odours strong but not at all unpleasant and would not create adverse reactions or interfere with the normal use and enjoyment of property.
General -Odours capable of causing nausea. -Odours capable of causing headaches. -Odours overpowering and highly objectionable. Residential Areas. -Odours offensive enough to prevent working or playing in the yard. -Odours tend to stay in the residence and make it difficult to sleep, eat, etc. -Odours tend to interfere with entertaining guests. Commercial Areas. -Odours tend to interfere with normal activities of office workers. -Odours tend to stay in the building and make it difficult to read, type, concentrate, etc. -Odours tend to interfere with normal warehouse work activities. Odours tend to interfere with normal outdoor work activities.

Reputation Resources Results Odour Management in British Columbia: RWDI AIR Inc Review and Recommendations W05-1108 Final Report - 67 - March 2005
2.7 ODOUR INDEX
The “Odour Index” is used in Japan to quantify the intensity of odours. The odour index is equal to ten times the log of the odour concentration (i.e., Odour Index = 10 x log(Odour Concentration)). The odour concentration is measured using the Triangular Odour Bag Method, which is described in greater detail in Section 3.9. Local governments determine the maximum permissible odour index standard, which according to federal law must be in the range of 10 to 21. This range has been determined to be equivalent to odour intensities between 2.5 and 3.5, the levels at which the majority of residents do not feel uncomfortable, through surveys of the relationship between odour intensity and odour index for almost all types of industry. The relationship between odour intensity and odour index is summarized in Table 2-15.
Table 2-15 Relationship between Odour Intensity and Odour Index
Odour Intensity Range of Odour Index 2.5 10 to 15 3.0 12 to 18 3.5 14 to 21
Advantages of the odour index compared to previous standards in Japan, which were based on odour concentration for 22 substances (see Table 2-1), are:
• it is applicable to a much larger range of odorants (more than 400,000), • it can be used for complex mixtures of odours rather than individual odorants, and • it is related to odour intensity, as perceived by the human sense of smell, rather than a
chemical concentration measured by an instrument.
2.8 COMPLAINT CRITERIA
Most jurisdictions have a system in place for responding to odour complaints. In many cases, there is a policy to respond to all complaints. For example, in Idaho the requirement to respond to complaints is written in their Statutes. Title 25, Chapter 38 states that, “The department shall respond to all odour complaints lodged against agriculture operations.” Every complaint is also investigated in New South Wales and field inspectors decide whether each complaint is legitimate. Other jurisdictions have a system of recording all complaints but they do not necessarily act on all of them. For example, in New Zealand, the Resource Management Act
Reputation Resources Results Odour Management in British Columbia: RWDI AIR Inc Review and Recommendations W05-1108 Final Report - 68 - March 2005
requires all complaints to be logged, but does not require them to be acted upon (Markland, 2005).
In some jurisdictions, such as Wellington, New Zealand, the BAAQMD and Minnesota, there are complaint criteria in terms of a minimum threshold of complaints required before an investigation is launched or an odour is considered a nuisance. In Wellington, a policy of response thresholds was introduced, whereby officers would only respond following 10 or more complaints for key sites with chronic odour problems where the agency was actively working on an improvement program. For other sites, fewer complaints are needed to trigger a response.
Although the BAAQMD has a 24-hour toll-free complaint hotline and investigates every complaint individually, the limitations of Regulation 7 of the BAAQMD are not applicable until the Air Pollution Control Officer (APCO) receives odour complaints from ten or more complainants within a 90-day period. However, when the limits of the regulation become effective as a result of citizen complaints, they remain effective until no citizen complaints have been received by the APCO for one year. The limits of the regulation become applicable again when the APCO receives odour complaints from five or more complainants within a 90-day period. Another complaint criterion is that less than five complaints in one day is considered a private nuisance where as more than five complaints a day is considered a public nuisance (Hess, 2005). One exception of the latter rule is that less than five complaints in one day combined with documented health impacts is considered to be a public nuisance.
Other jurisdictions also have complaint hotlines that are staffed by the regulatory agency or an answering service that is trained in asking the complainants certain questions used in complaint documentation and reporting. In New South Wales, the Environmental Protection Agency encourages operators to maintain their own telephone complaint line and complaint management system. In some cases, such a system may be a condition of an operator’s license. The public is encouraged to use this number before calling the EPA.
Some jurisdictions have regulations or guidelines for how the regulator will respond to complaints. For example, Idaho statutes indicate the Department of Agriculture will respond to all odour complaints lodged against agricultural operations. Idaho’s Department of Environmental Quality (DEQ) has a formal Policy for Responding to Odour Complaints (Idaho DEQ, 2005). This policy specifies the process DEQ will follow to resolve odour complaints received by DEQ and to ensure compliance with existing regulations. The procedures set out in the policy address odour complaints with increasing DEQ intervention up to and including the
Reputation Resources Results Odour Management in British Columbia: RWDI AIR Inc Review and Recommendations W05-1108 Final Report - 69 - March 2005
filing of a civil action in appropriate circumstances. In Germany, citizens have the legal right to have their complaints investigated. After making a complaint they receive an official report stating whether or not the odour complaint was found to be justified. If they do not agree with the decision they can appeal in the courts (Both, 2005).
In North Carolina, when a citizen complains to the state, they are asked to log complaints and weather conditions for 30 days on a form provided by the North Carolina Air Quality Division (NCDAQ). Once the logbook is returned to the state, the following formal investigation takes place (Osterberg and Melvin, 2002). a) An inspection is scheduled during weather conditions and time of day similar to when
typical objectionable odour was reported. b) Evaluation is made at the location of the residence of the complainants. c) An ‘odour snapshot’ is made by regional office investigator (one of 5 rankings) d) The snapshot evaluation is reported to a regional supervisor. e) The regional office submits a recommendation to Division Director. f) The Division of Air Quality Director makes a final decision whether an objectionable odour
exists. g) If a determination of Objectionable Odour is made, the NCDAQ will require a Best
Management Plan for the facility, which must be submitted within 90 days.
Other jurisdictions also clearly set out how they will determine whether a complaint is justified or verified. Idaho DEQ uses the term “valid complaint” and defines it as “…any odor complaint received by DEQ and determined by DEQ pursuant to the Odor Determination Process outlined in these Procedures, to meet or exceed the level at which DEQ regulations applicable to the odor source provide DEQ with authority to regulate the odors. DEQ will consider odor complaints arising from a single, short term odor-causing incident to be a single complaint. DEQ will consider odor complaints arising from distinct, independent odor causing incidents as separate complaints. DEQ staff shall have discretion to consider ongoing odor complaints arising from normal source operations as a single event, or as separate complaints, based on timing of the complaints, responsiveness of the source, stage of implementation of an odor management plan, and on other relevant factors.”
The State of Texas’ Commission on Environmental Quality (TCEQ) has an odour abatement complaint hotline with trained staff receiving calls and directing them to the relevant departments of the TCEQ. They have also recently developed (January, 2005) detailed odour complaint investigation procedures that make use of a very interesting FIDO chart. This

Reputation Resources Results Odour Management in British Columbia: RWDI AIR Inc Review and Recommendations W05-1108 Final Report - 70 - March 2005
document and the worked examples are of such potential value that it has been attached in Appendix C. The first step in the process occurs when an odour is detected by a citizen and reported as a citizen complaint or if it is detected by a TCEQ investigator (note that in BAAQMD, the latter does not occur). The second step is a determination as to whether an investigation is appropriate. If adverse health effects are alleged by the complainant or suspected by the investigator, the complaint is prioritized for immediate response. Otherwise, the complaint is investigated according to incident prioritization procedures established by the TCEQ. The third step is for the investigator to collect information such as the complainant name and address, location of odour, date, time, frequency, duration of odour, description of alleged effects, description of odour observations by investigator using the FIDO chart, etc. The fourth step is to review the information collected and determine whether a nuisance condition is confirmed and whether it is injurious to or adversely affects human health, welfare, animal life, vegetation or property. The degree of enforcement is dependent on this determination.
Another part of the complaint response process is the requirement for the creation of an odour management plan. For example, in Idaho the DEQ will request that a facility voluntarily develop and implement an odour management plan. If the facility already has a plan and is in compliance with it, they will be asked to voluntarily modify their plan. If the facility has an odour management plan but is not in compliance with it, they may be sent an enforcement notice. After a second complaint, development or modification of an odour management plan becomes a requirement. Agricultural operations in Idaho are also required to develop and submit for approval an odour management plan after a first time violation of the Idaho statutes. In Northern Ireland, an odour management plan is the minimum requirement for Integrated Pollution Prevention and Control farms within 400 m of a dwelling or other sensitive receptor such as a school, or where there is an odour complaint history (Northern Ireland DEP, 2003). A procedure for responding to complaints is a required element of such plans.
Odour management plans are also used in a more proactive fashion in some states. In Colorado, applications for a permit to operate a housed commercial swine feeding operation must be accompanied by a complete and accurate odour management plan (Colorado Air Quality Control Commission, 1999). An odour management plan is required for each new or existing source. In South Carolina, applications for new animal facilities must include an odor abatement plan for facility, lagoon, waste storage pond, and waste utilization areas (National Association of State Departments of Agriculture, 2005). Similarly, in Oklahoma, an odor control plan for swine and poultry facilities is required for a permit. In Missouri, all confined animal feeding operations with more than 7,000 animal units were required to have an odour control plan describing

Reputation Resources Results Odour Management in British Columbia: RWDI AIR Inc Review and Recommendations W05-1108 Final Report - 71 - March 2005
measures to be used to control odour emissions in place by January 1, 2002 (Osterberg and Melvin, 2002). Warrington Borough Council in the UK also includes as part of their Odour Management Strategy the development of individual Odour Management Plans for premises identified as having potential to cause odour complaint (Warrington Borough Council, 2004).
2.9 QUANTITATIVE EMISSION CRITERIA
Seven jurisdictions were found to have quantitative emission criteria for either odour or for specific chemicals. These criteria are listed in Table 2-16. Unlike ambient criteria, which were in two distinct formats, the format of the emission criteria appears to be different for each jurisdiction.
The BAAQMD has emission limits for odour and for six chemicals or groups of chemicals. The odour emission limits, which range from 1,000 to 50,000 D/T, are a function of emission release height, with lower emission limits assigned to lower stack heights. These are enforceable limits found in the BAAQMD Regulation 7, which includes standards for collection and analysis of odour samples (Section 7-400). Regulation 7 also includes limits for dimethyl sulphide, ammonia, mercaptans, phenolic compounds, and triethylamine. These chemical-specific limits are in units of concentration (ppm). There is a pair of limits for each chemical group for Type A and Type B emission points. Type A emission points are effectively stacks and Type B emission points are any other type of source, such as a roof vent. Emission limits for sulphur dioxide are provided in Regulation 9, Rule 1. They vary by source type and have units of concentration (ppm), mass flow rate (kg/hr) or mass (kg).
Denmark’s Industrial Odour Control policy states that odour emission should primarily be reduced by cleaning measures or by changing design and production measures. After that odour nuisance can be reduced by dispersion. Before dispersion, i.e., at the emission source, the odorant emission concentration must not exceed 100 LE/m3, which is equivalent to 100 OU/m3 (Danish Environmental Protection Agency, 2002). This limit is an order of magnitude less than the most stringent BAAQMD odour limit.
The Netherlands has emission limits in terms of concentrations (mg/m3) of specific chemicals for a few types of facility. Ammonia emissions are regulated for manure processing plants, production of nitrogen-based fertilizer and ammonia plants. Chlorine emissions from chlorine plants are regulated. There is also a limit for hydrogen sulphide emissions from Claus plants.

Reputation Resources Results Odour Management in British Columbia: RWDI AIR Inc Review and Recommendations W05-1108 Final Report - 72 - March 2005
Switzerland has emission standards for hundreds of chemicals. Their regulations are not available in English and so a version in French was reviewed. Frechen (1997) states that Switzerland has standards for about 150 substances which may have odour; however, we were not able to confirm this number. In Table 2-16 Swiss standards are provided for chemicals that are known to cause odours by cross-referencing with the Ontario concentration standards in Table 2-1. The Swiss have general regulations for all types of facilities in addition to source-specific regulations. The format of the general Swiss regulations is interesting: they classify each chemical into a limited number of categories (typically 3 or 4) and then all chemicals in that category have the same concentration limit, which is valid only if the mass emission rate is greater than a specified threshold. For example, ammonia is a class 3 gaseous, inorganic chemical and therefore if the mass emission rate is greater than 300 g/h then the ammonia concentration must be less than 30 mg/m3. As another example, ethyl acetate, butyl acetate and acetone are all in the same class (3) of organic, gaseous chemicals and therefore all three have the same concentration limit (150 mg/m3) and associated mass emission rate threshold (≥ 3.0 kg/h). The source-specific emission concentration criteria do not always have a stated mass emission rate threshold (e.g., for chlorine production facilities the stated emission limit is 3 mg/m3), which suggests that the limit applies for all such facilities.
Japan’s system is interesting because it has odour limits for both liquid effluent and air emissions. Both sets of limits are a function of the concentration limit ranges set out in Table 2-1. For liquid effluent, the concentration limit, Clm is equal to the product of the concentration limit times a constant k, which is a function of volumetric flow rate (see Table 2-17). For air emissions, the standard is in terms of volumetric flow rate of specific chemicals, which is the product of the square of the effective stack height times the concentration limit and a factor of 0.108. The effective stack height calculation is reproduced in Appendix B.
In Korea, the emission limits are in terms of OC, which is conceptually similar to OU/m3 but the measurement standard (air dilution sensory test) differs from American and European standards. The limit is 1,000 OC for facilities located in industrial areas and 500 OC for facilities located in other areas.
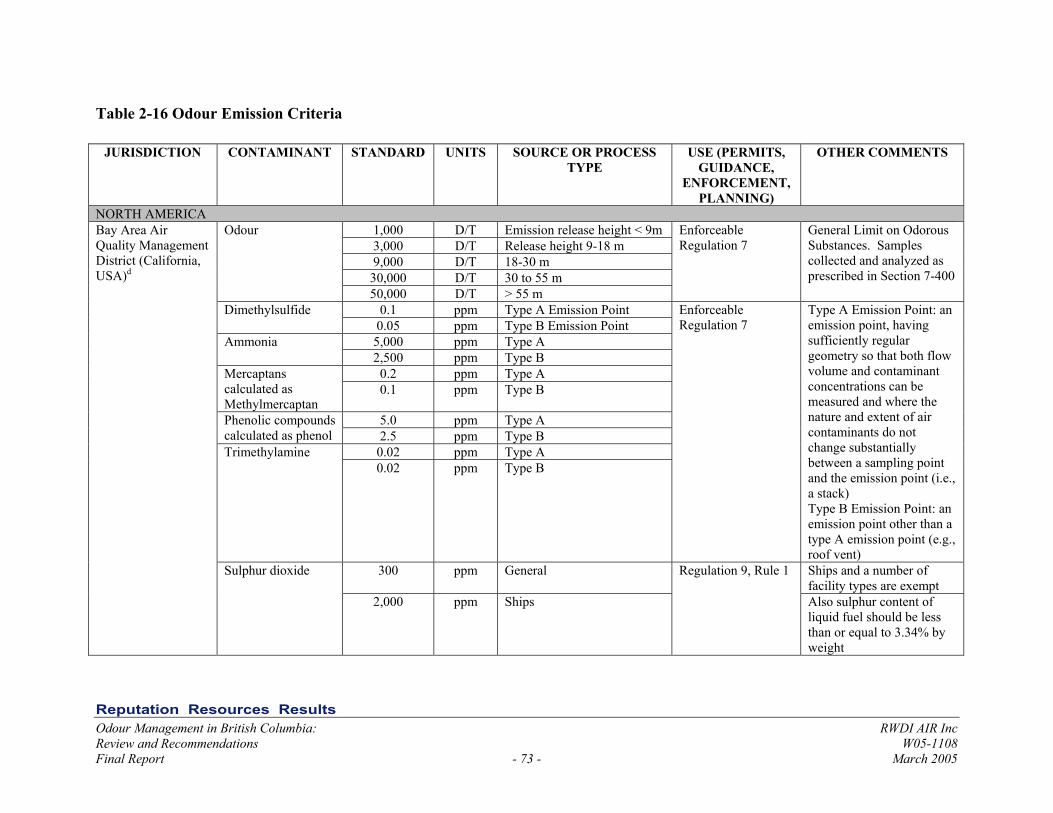
Reputation Resources Results Odour Management in British Columbia: RWDI AIR Inc Review and Recommendations W05-1108 Final Report - 73 - March 2005
Table 2-16 Odour Emission Criteria
JURISDICTION CONTAMINANT STANDARD UNITS SOURCE OR PROCESS TYPE
USE (PERMITS, GUIDANCE,
ENFORCEMENT, PLANNING)
OTHER COMMENTS
NORTH AMERICA 1,000 D/T Emission release height < 9m 3,000 D/T Release height 9-18 m 9,000 D/T 18-30 m 30,000 D/T 30 to 55 m
Odour
50,000 D/T > 55 m
Enforceable Regulation 7
General Limit on Odorous Substances. Samples collected and analyzed as prescribed in Section 7-400
0.1 ppm Type A Emission Point Dimethylsulfide 0.05 ppm Type B Emission Point
5,000 ppm Type A Ammonia 2,500 ppm Type B
0.2 ppm Type A Mercaptans calculated as Methylmercaptan
0.1 ppm Type B
5.0 ppm Type A Phenolic compounds calculated as phenol 2.5 ppm Type B
0.02 ppm Type A Trimethylamine 0.02 ppm Type B
Enforceable Regulation 7
Type A Emission Point: an emission point, having sufficiently regular geometry so that both flow volume and contaminant concentrations can be measured and where the nature and extent of air contaminants do not change substantially between a sampling point and the emission point (i.e., a stack) Type B Emission Point: an emission point other than a type A emission point (e.g., roof vent)
300 ppm General Ships and a number of facility types are exempt
Bay Area Air Quality Management District (California, USA)d
Sulphur dioxide
2,000 ppm Ships
Regulation 9, Rule 1
Also sulphur content of liquid fuel should be less than or equal to 3.34% by weight

Reputation Resources Results Odour Management in British Columbia: RWDI AIR Inc Review and Recommendations W05-1108 Final Report - 74 - March 2005
JURISDICTION CONTAMINANT STANDARD UNITS SOURCE OR PROCESS TYPE
USE (PERMITS, GUIDANCE,
ENFORCEMENT, PLANNING)
OTHER COMMENTS
250 ppm Sulphur recovery plant Plants that emit less than 45 kg/day of SO2 are exempt
300 ppm Sulphuric acid plant 1000 ppm Fluid catalytic cracking unit
or fluid coker
400 ppm Coke calcining kiln Or 113 kg/h, whichever is more restrictive
22 kg/hr Catalyst manufacturing plants 9.0 kg Apricot sulphuring operation Per 9.0 tonne fresh apricots
10.9 kg Peach sulphuring operation Per 9.0 tonne fresh peaches
Bay Area Air Quality Management District (California, USA)d
Sulphur dioxide
13.6 kg Pear sulphuring operation Per 9.0 tonne fresh pears EUROPE Denmarke Odour 100 OU/m3 Industrial Odour
Control policy Measured at the source
Germanyg Odour 500 OU/m3 -Facility for the production of compost from organic waste with annual throughput >10,000 Mg -Bio-waste fermenter with throughput >30 Mg/day -Facility for drying waste products -Facility for drying sludge -Purification plants for the mechanical treatment of mixed domestic refuse
Regulation
Ammonia 5 mg/m3 Manure processing plant Chlorine 6 mg/m3 Production of chlorine Hydrogen sulphide 10 mg/m3 Claus plants
Standard used in permits
30 mg/m3 Permit for new
facility Does not apply to waste gases from urea granulation
The Netherlandsc
Ammonia
30 to 200 mg/m3
Production of nitrogen-based fertilizer
Regulation for existing facility
The status quo must be maintained

Reputation Resources Results Odour Management in British Columbia: RWDI AIR Inc Review and Recommendations W05-1108 Final Report - 75 - March 2005
JURISDICTION CONTAMINANT STANDARD UNITS SOURCE OR PROCESS TYPE
USE (PERMITS, GUIDANCE,
ENFORCEMENT, PLANNING)
OTHER COMMENTS
The Netherlandsc Ammonia 30 mg/m3 Ammonia plant Standard used in permit
Ammonia 30 mg/m3 General If mass emission rate ≥300 g/h
Chlorine 5 mg/m3 General If mass emission rate ≥50 g/h
Hydrogen sulphide 5 mg/m3 General If mass emission rate ≥50 g/h
Ethyl acetate 150 mg/m3 General If mass emission rate ≥3.0 kg/h
Butyl acetate 150 mg/m3 General If mass emission rate ≥3.0 kg/h
Acetone 150 mg/m3 General If mass emission rate ≥3.0 kg/h
Acetic acid 100 mg/m3 General If mass emission rate ≥2.0 kg/h
Propionic acid 100 mg/m3 General If mass emission rate ≥2.0 kg/h
Ethyl acrylate 20 mg/m3 General If mass emission rate ≥0.1 kg/h
Alcanes (not methane)
150 mg/m3 General If mass emission rate ≥3.0 kg/h
Propionic aldehyde 100 mg/m3 General If mass emission rate ≥2.0 kg/h
Alkyl alcohols 150 mg/m3 General If mass emission rate ≥3.0 kg/h
Aniline 20 mg/m3 General If mass emission rate ≥0.1 kg/h
Biphenyl 20 mg/m3 General If mass emission rate ≥0.1 kg/h
Chlorobenzene 100 mg/m3 General If mass emission rate ≥2.0 kg/h
Switzerlandb (Emission standards are set for about 150 substances which can cause odour, this is a sample)
Dimethyl amine 20 mg/m3 General
Federal law
If mass emission rate ≥0.1 kg/h
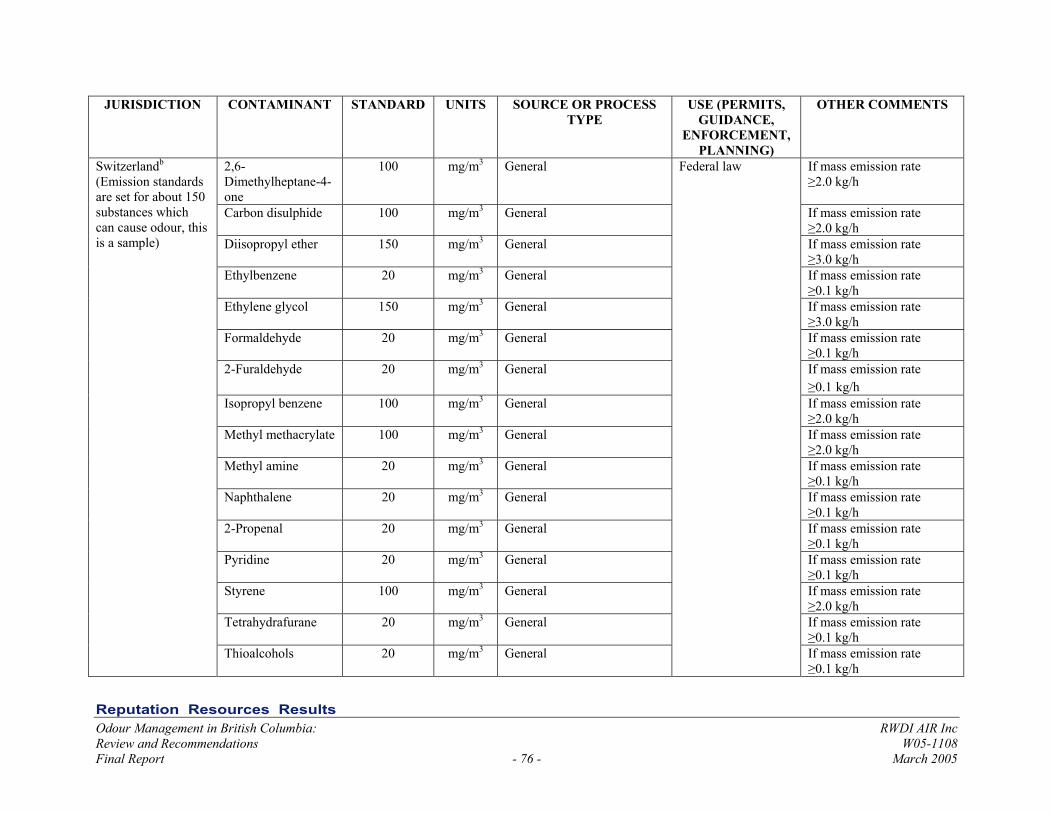
Reputation Resources Results Odour Management in British Columbia: RWDI AIR Inc Review and Recommendations W05-1108 Final Report - 76 - March 2005
JURISDICTION CONTAMINANT STANDARD UNITS SOURCE OR PROCESS TYPE
USE (PERMITS, GUIDANCE,
ENFORCEMENT, PLANNING)
OTHER COMMENTS
2,6-Dimethylheptane-4-one
100 mg/m3 General If mass emission rate ≥2.0 kg/h
Carbon disulphide 100 mg/m3 General If mass emission rate ≥2.0 kg/h
Diisopropyl ether 150 mg/m3 General If mass emission rate ≥3.0 kg/h
Ethylbenzene 20 mg/m3 General If mass emission rate ≥0.1 kg/h
Ethylene glycol 150 mg/m3 General If mass emission rate ≥3.0 kg/h
Formaldehyde 20 mg/m3 General If mass emission rate ≥0.1 kg/h
2-Furaldehyde 20 mg/m3 General If mass emission rate ≥0.1 kg/h
Isopropyl benzene 100 mg/m3 General If mass emission rate ≥2.0 kg/h
Methyl methacrylate 100 mg/m3 General If mass emission rate ≥2.0 kg/h
Methyl amine 20 mg/m3 General If mass emission rate ≥0.1 kg/h
Naphthalene 20 mg/m3 General If mass emission rate ≥0.1 kg/h
2-Propenal 20 mg/m3 General If mass emission rate ≥0.1 kg/h
Pyridine 20 mg/m3 General If mass emission rate ≥0.1 kg/h
Styrene 100 mg/m3 General If mass emission rate ≥2.0 kg/h
Tetrahydrafurane 20 mg/m3 General If mass emission rate ≥0.1 kg/h
Switzerlandb (Emission standards are set for about 150 substances which can cause odour, this is a sample)
Thioalcohols 20 mg/m3 General
Federal law
If mass emission rate ≥0.1 kg/h

Reputation Resources Results Odour Management in British Columbia: RWDI AIR Inc Review and Recommendations W05-1108 Final Report - 77 - March 2005
JURISDICTION CONTAMINANT STANDARD UNITS SOURCE OR PROCESS TYPE
USE (PERMITS, GUIDANCE,
ENFORCEMENT, PLANNING)
OTHER COMMENTS
Toluene 100 mg/m3 General If mass emission rate ≥2.0 kg/h
Xylenes 100 mg/m3 General If mass emission rate ≥2.0 kg/h
3 mg/m3 Chlorine Production Facilities
Chlorine
6 mg/m3 Chlorine production facilities with complete liquefaction
Ammonia 5 mg/m3 Foundries 50 mg/m3 Smoke-house (warm process) If mass emission rate
≥50 g/h 120 mg/m3 If mass emission rate
>50 g/h but <300 g/h
VOCs (as total carbon)
50 mg/m3
Smoke-house (cold process)
If mass emission rate >300 g/h
150 mg/m3 Capacity ≤750 kg/h VOCs (as total carbon) 50 mg/m3
Coffee roaster Capacity >750 kg/h
Switzerlandb (Emission standards are set for about 150 substances which can cause odour, this is a sample)
Ammonia 5 mg/m3 Incinerator (municipal or special waste)
Federal law
ASIA Hydrogen sulphide mg/L Methyl mercaptan mg/L Dimethyl sulphide mg/L
Japana
Dimethyl disulphide
Clm = k Cm
mg/L
Liquid effluent standard in terms of concentration of chemical in effluent
Regulatory standard used in permits and enforced by local government
k is a constant that depends on the volumetric flow rate of liquid effluent (see Table 2-17) and Cm is the maximum permissible concentration standard selected by the local authority based on the ranges provided in Table 2-1

Reputation Resources Results Odour Management in British Columbia: RWDI AIR Inc Review and Recommendations W05-1108 Final Report - 78 - March 2005
JURISDICTION CONTAMINANT STANDARD UNITS SOURCE OR PROCESS TYPE
USE (PERMITS, GUIDANCE,
ENFORCEMENT, PLANNING)
OTHER COMMENTS
Ammonia m3/h Hydrogen sulphide m3/h Trimethyl amine m3/h Propionaldehyde m3/h n-Butyl aldehyde m3/h i-Butyl aldehyde m3/h n-Valeraldehyde m3/h i-Valeraldehyde m3/h i-Butanol m3/h Ethyl acetate m3/h MIBK m3/h Toluene m3/h
Japana
Xylene
0.108 He2 Cm
m3/h
Stack emission standard in terms of volumetric flow rate of individual chemical
Regulatory standard used in permits and enforced by local government
He is the effective stack height calculated using specified equations and Cm is the maximum permissible concentration standard selected by the local authority based on the ranges provided in Table 2-1
Odour 1,000 OC Rubber and plastic product manufacturing plants, leather product manufacturing plants, industrial waste incinerators, painting mills, and petrochemical refinery plants
Measured using air dilution sensory test
Koreaf
Odour 500 OC Facilities in residential areas (e.g., agricultural product wholesale markets, joint markets, butchery treatment areas, excretion treatment facilities, livestock farming waste treatment facilities, and cleaning facilities)
Measured using air dilution sensory test
a Japanese MOE (2005) b Switzerland (2004) c InfoMil (2003) d Bay Area Air Quality Management District, Regulation 7 (2001) e Danish Environmental Protection Agency (2002) f Park (2003) g Germany (2001)

Reputation Resources Results Odour Management in British Columbia: RWDI AIR Inc Review and Recommendations W05-1108 Final Report - 79 - March 2005
Table 2-17 Values of Constant k as a Function of Volumetric Flowrate Q (m3/s) Used in Calculation of Maximum Permissible Concentration of Odour Substances in Liquid
Effluent
Volumetric Flow Rate Q (m3/s)
Q ≤ 10-3 10-3< Q ≤ 10-1 10-1 < Q
Hydrogen sulphide 5.6 1.2 0.26 Methyl mercaptan 16 34 0.71 Dimethyl sulphide 32 6.9 1.4
Dimethyl disulphide 63 14 2.9 www.env.go.jp/en/lar/regulation/odor.html

Reputation Resources Results Odour Management in British Columbia: RWDI AIR Inc Review and Recommendations W05-1108 Final Report - 80 - March 2005
2.10 TECHNOLOGY CRITERIA
Many jurisdictions have requirements for implementation of state-of-the-science control technology or similar approaches that specify required levels of odour treatment controls or best management practices for new or existing facilities. These requirements are mostly qualitative in nature. For example, in South Australia their odour criteria are based on a principle of compliance with the general environmental duty to avoid environmental nuisance using ‘best available technology economically achievable’ (BATEA). Similarly, in Western Australia “best practice” emission control is expected for new or expanding operations and there is a corporate responsibility to reduce odour impacts to as low as reasonably practicable. King County, Washington has a policy that existing wastewater treatment facilities shall be retrofit in a phased manner up to the odour prevention level that reflects “Best in the Country” for existing facilities.
The Wellington, New Zealand Regional Air Quality Management Plan states that a resource consent may require the use of the best practicable option (BPO) to prevent or minimize the effects of odorous discharges. Odour control technologies that could be a part of a BPO approach include: vent gas collection and treatment, vent gas condensation, chemical treatment, biological treatment, adsorption, incineration and dispersion (the last step in an odour control process).
German Guideline on Odour in Ambient Air (GOAA) states that, “On principle, prior to any odour impact assessment, it must be ascertained that all means of state-of-the-art odour abatement have been exhausted … Installations which require licensing and also those which do not require licensing are required to comply with the state-of-the-art [odour control technology]. In order to provide room for future developments and to consider precautionary measures against environmental impact, the requirements set may possibly go beyond the present state-of-the-art.”
Although most jurisdictions do not stipulate which technologies or management practices must be used, some jurisdictions, such as the Netherlands, Colorado and the European Union do specify specific control technologies or management practices for different types of facility.
The Netherlands Emission Guidelines for Air (NeR) are focused on the application of emission-abating measures in accordance with Best Available Control Technology for reducing air emissions. Furthermore, the Dutch Environmental Protection Act stipulates that the As Low As Reasonably Achievable (ALARA) principle must be applied in the issuing of permits. An
Reputation Resources Results Odour Management in British Columbia: RWDI AIR Inc Review and Recommendations W05-1108 Final Report - 81 - March 2005
interesting feature of the NeR is that it provides information on odour control measures for specific processes to be implemented if odour criteria are not met.
Colorado requires that the “best practical” treatment, maintenance, and control currently available is used to maintain the lowest possible emission of odorous gases. They also have very specific technology requirements for various processes associated with housed commercial swine feeding operations. There are a number of mandatory specific odour control requirements for housed commercial swine feeding operations related to: swine confinement structures, adequate ventilation, dust management, manure management, solid waste and process wastewater collection, storage, and treatment systems, manure composting storage sites, land application, carcass disposal. There are also recommended odour control requirements. The regulation states that, “Housed commercial swine feeding operations shall employ technology to minimize to the greatest extent practicable off-site odour emissions from all aspects of its operations.”
Odour is one of the environmental criteria to be considered the Integrated Pollution Prevention and Control directive, which aims to introduce a uniform approach to impact assessment for licensing purposes throughout the European Union (EU) by 2007. Central to this approach is the general principle that operators should take all appropriate preventative measures against pollution, in particular through the application of Best Available Techniques enabling them to improve their environmental performance. Best Available Techniques are defined as the most effective and advanced stage in the development of activities and their methods of operation which indicate the practical suitability of particular techniques for providing in principle the basis for emission limit values designed to prevent and, where that is not practicable, generally to reduce emissions and the impact on the environment as a whole:
• ‘techniques’ include both technology used and the way in which the installation is designed, built, maintained, operated and decommissioned.
• ‘available’ techniques are those developed on a scale which allows implementation in the relevant industrial sector, under economically and technically viable conditions, taking into consideration the costs and advantages, whether or not the techniques are used or produced inside the Member State in question, as long as they are reasonably accessible to the operator.
• ‘best’ means most effective in achieving a high general level of protection of the environment as a whole (Van Harreveld, 2004).
The EU has established an infrastructure aimed at facilitating information exchange on industry-specific Best Available Techniques. There are a number of reference documents, known as

Reputation Resources Results Odour Management in British Columbia: RWDI AIR Inc Review and Recommendations W05-1108 Final Report - 82 - March 2005
BREFs, that specifically address the control and prevention of odour impacts for: oil and gas refineries, intensive rearing of poultry and pigs, tanning of hides and skins, waste water and waste gas management systems in the chemical sector, large volume organic chemical industry, slaughterhouses and animal by-products, waste treatment, smitheries and foundries.
3.0 REVIEW OF VARIOUS ODOUR MANAGEMENT PROGRAMS
The odour management programs of the jurisdictions interviewed are summarized in this section. Full transcripts of the interviews are provided in Appendix C. Table 3-1 summarizes which of the ten approaches discussed in Section 2 are used by the various jurisdictions. The most commonly used approaches are avoidance of nuisance laws, ambient odour concentration criteria, and minimum separation distances. Also indicated in Table 2-1 are those jurisdictions that consider their odour programs to be successful. All but two of the jurisdictions believe that their programs are successful. The Wellington Regional Council (New Zealand) is the only jurisdiction that clearly stated that their program was not successful. Ontario does not have an odour management program per se and so was not able to respond to the question.
In most jurisdictions, the rationale for establishing an odour management program was to avoid nuisance odours. The Bay Area Air Quality Management District and Japan are the only jurisdictions of those interviewed that included avoidance of potential human health impacts as part of their rationale. In Ontario, the rationale for addressing odour issues is avoidance of adverse effects caused by contaminants, including odour.

Reputation Resources Results Odour Management in British Columbia: RWDI AIR Inc Review and Recommendations W05-1108 Final Report - 83 - March 2005
Table 3-1 Summary of Odour Management Approaches Used by Jurisdictions that were Interviewed
AV
OID
AN
CE
OF
NU
ISA
NC
E L
AW
S
AM
BIE
NT
C
ON
CE
NT
RA
TIO
N
CR
ITE
RIA
FO
R
IND
IVID
UA
L
CH
EM
ICA
LS
AM
BIE
NT
C
ON
CE
NT
RA
TIO
N
CR
ITE
RIA
FO
R
OD
OU
R
EPI
SOD
E D
UR
AT
ION
-FR
EQ
UE
NC
Y
MIN
IMU
M
SEPA
RA
TIO
N
DIS
TA
NC
ES
OD
OU
R IN
TE
NSI
TY
SC
AL
ES
OD
OU
R IN
DE
X
CO
MPL
AIN
T
CR
ITE
RIA
QU
AN
TIT
AT
IVE
E
MIS
SIO
N C
RIT
ER
IA
TE
CH
NO
LO
GY
C
RIT
ER
IA
SUC
CE
SSFU
L
PRO
GR
AM
Ontario BAAQMD
King County NSW South
Australia
Wellington
Do not have standards but could include limit in permit
Germany Netherlands
Japan

Reputation Resources Results Odour Management in British Columbia: RWDI AIR Inc Review and Recommendations W05-1108 Final Report - 84 - March 2005
3.1 ONTARIO
Ontario does not have an odour management program per se but it does make use of a number of the approaches outlined in Section 2 to manage odour. It has a nuisance law that prohibits the discharge of a contaminant that may cause an adverse effect and odour is included in the definition of a contaminant. Ontario also has a number of POI standards and guidelines and AAQC that are odour-based. In addition, there is a proposed ambient odour limit of 1 OU/m3 that has been used to-date on a case-by-case basis. Finally, Ontario makes use of minimum distance separation guidelines for agricultural operations and sewage treatment plants.
3.1.1 Regulatory Context
Ontario has been dealing with odour issues for as long as they have had “adverse effect” written in legislation, i.e., since 1972. Section 14 of the Ontario Environmental Protection Act (1990) defines the prohibition on discharging contamination causing adverse effect: “…no person shall discharge a contaminant or cause or permit the discharge of a contaminant into the natural environment that causes or is likely to cause an adverse effect.” Odour is included in the definition of contaminant. Adverse effect is defined as one or more of: (a) impairment of the quality of the natural environment for any use that can be made of it, (b) injury or damage to property or to plant or animal life, (c) harm or material discomfort to any person, (d) an adverse effect on the health of any person, (e) impairment of the safety of any person, (f) rendering any property or plant or animal life unfit for human use, (g) loss of enjoyment of normal use of property, and (h) interference with the normal conduct of business.
Several of the outcomes listed in the definition of adverse effect could be associated with odour, in particular c, d, g or h..
In addition, Section 9 of the Ontario Environmental Protection Act gives the Director of the Ministry of the Environment the power to refuse to issue a certificate of approval to prevent or alleviate adverse effect.

Reputation Resources Results Odour Management in British Columbia: RWDI AIR Inc Review and Recommendations W05-1108 Final Report - 85 - March 2005
3.1.2 Odour Criteria
Ontario has odour-based point of impingement standards, point of impingement guidelines and ambient air quality criteria for a large number of chemicals (see Table 2-1). In addition, an ambient odour criterion of 1 OU/m3 at a sensitive receptor for a 10 minute averaging period based on dispersion modelling has been applied on a case-by-case basis and is included in the proposed Air Dispersion Modelling Guideline for Ontario (Ontario MOE, 2004).
The Ministry of Environment (MOE) has in some cases included in certificates of approval how facilities are expected to perform relative to objective criteria. Monitoring and testing are used to enforce such facility-specific limits. This policy is not applied to every facility but only in situations where there is legitimate concern of an adverse effect. The types of facilities regulated in this manner include rendering, compost and asphalt plants.
Ontario also has fixed minimum separation distances for sewage treatment plants (see Table 2-6) and variable minimum separation distances for agricultural facilities (see Section 2.5.2.2).
3.1.2.1 Measurement and Emission Estimation Standards
The MOE does not specify measurement methods for odour. Odour emissions are measured using a grab sample that is tested by an odour panel. Although the MOE does not dictate the use of either European Union or ASME odour measurement protocols, they do require that the panel identify its source testing protocol.
There are no approved standard methods for estimating emissions. The MOE reviews emission estimates on a case-by-case basis. Applicants will often make use of measurements from a similar facility if available
3.1.3 Rationale for Establishing the Odour Criteria
In general, the rationale for the Ontario MOE to manage odours is their regulatory obligation to prevent adverse effects, including odour. They often become aware of the occurrence of adverse effects through complaints, in which case they are responsible for responding to and alleviating the effects.
The ambient concentration criteria listed in Table 2-1 were established some time ago based on research conducted in Ontario. The ambient odour guideline of 1 OU/m3 is based on a 10 minute

Reputation Resources Results Odour Management in British Columbia: RWDI AIR Inc Review and Recommendations W05-1108 Final Report - 86 - March 2005
averaging period due to model limitations. Also, this guideline is used to evaluate odours at the most impacted sensitive receptor (e.g., residences, schools, churches, community centres, playgrounds, office buildings) not at the plant fence line. The Ontario MOE is considering updating the ambient concentration standards and they are considering developing an odour policy.
3.1.4 Responses to Specific Interview Questions
3.1.4.1 Is Your Program Successful?
The MOE employee that was interviewed for this study stated that Ontario does not have an odour management program yet and therefore was not able to respond to this question. He also stated that Ontario does not have enough of a track record to be able to judge whether it was successfully managing odours. However, he did state that the use of objective tools, such as orders, prosecutions, requirements for changes to approvals, accelerates improving existing problems.
The current practice of requiring dispersion modelling of odours for certain facilities has increased the workload of the approvals department (requirements for reviewing modelling etc.); however it is hoped that the workload of the enforcement department has decreased by preventing odour problems.
3.1.4.2 When Does Odour Become a Problem?
The MOE often become aware of “adverse effects” through complaints. All complaints are logged; however it is unclear whether the complaint database is searchable for odour. There is no specific trigger in terms of complaints. The MOE are obliged by regulatory duties to respond to and to prevent/alleviate adverse effects. Complaints are assessed to determine whether there is a legitimate concern of adverse effect. The MOE response to a complaint escalates depending on the number of incidences.
3.1.4.3 Stakeholder Consultation
The proposed dispersion model guideline was released for consultation. In addition, stakeholder consultation occurs on a case-by-case basis with respect to issuing orders, some of which may be
Reputation Resources Results Odour Management in British Columbia: RWDI AIR Inc Review and Recommendations W05-1108 Final Report - 87 - March 2005
posted for public comment, or around litigation or appeal of an approval decision. Also, the public can have a role in litigation, but there is no general education program.
It is not clear whether odour is a sufficiently high-profile issue for senior politicians to be engaged. Nonetheless, numerous comments were received regarding odour in response to the proposed dispersion model guideline and these comments will be considered very seriously by Ministry.
3.1.4.4 Odour Avoidance or Land Use Planning Tools
In the last decade the MOE have started using modelled odour results to specify requirements in site-specific certificates of approval. Ten-minute average concentrations are calculated by modelling one-hour average concentrations using five years of meteorological data and AERMOD-Prime (or other approved model) and converting to a 10-minute average using the power law with an exponent of 0.28.
Municipalities are responsible for land use planning not the provincial government. As such, approval of industrial facilities is not directly linked to land use planning. The minimum separation distances set out in MDS I and MDS II are land use planning guidelines for industry, agricultural operations and developers.
3.2 BAY AREA AIR QUALITY MANAGEMENT DISTRICT, CALIFORNIA, USA
The BAAQMD is the agency primarily responsible for assuring that national and State ambient air quality standards are attained and maintained in the San Francisco Bay Area. Its jurisdiction includes all of Alameda, Contra Costa, Marin, Napa, San Francisco, San Mateo and Santa Clara Counties and parts of Sonoma and Solano Counties in California.
The BAAQMD consider their odour management program to be successful. Their odour management framework consists of a nuisance law, quantitative ambient concentration limits for individual chemicals and odour, complaint criteria, and quantitative emission criteria. The BAAQMD has considerable resources with a staff of 350 with over 100 inspectors and field personnel as well as a team of lawyers who prosecute court cases. As a result, the most effective element of their odour management framework has been the general odour nuisance law and associated good case law.

Reputation Resources Results Odour Management in British Columbia: RWDI AIR Inc Review and Recommendations W05-1108 Final Report - 88 - March 2005
3.2.1 Regulatory Context
The BAAQMD odour nuisance law is Regulation 1-301, which states that:
No person shall discharge from any source whatsoever such quantities of air contaminants or other material which cause injury, detriment, nuisance or annoyance to any considerable number of persons or the public; or which endangers the comfort, repose, health or safety of any such persons or the public, or which causes, or has a natural tendency to cause, injury or damage to business or property. For purposes of this section, three or more violation notices validly issued in a 30 day period to a facility for public nuisance shall give rise to a rebuttable presumption that the violations resulted from negligent conduct.
The definition of air contaminant (Regulation 1-201) includes odours. Also, Regulation 7 Odorous Substances, which dates back to 1976, places general limits on odorous substances and specific emission limits on certain odorous compounds. Rule 1, Sulphur Dioxide, and Rule 2, Hydrogen Sulphide, of Regulation 9, Inorganic Gaseous Pollutants contain additional limits on SO2 and H2S. These rules were adopted in 1978. Regulation 7 also includes citizen complaint criteria.
3.2.2 Odour Criteria
The BAAQMD has ambient standards at or beyond the property line for odour (5 D/T) as well as for SO2 and H2S (see Table 2-1). Regulation 7 also lists general emission limits on odorous substances that range from 1,000 to 50,000 D/T depending on the elevation of the emission point above grade (see Table 2-16). There are also quantitative emission limits for dimethylsulfide, ammonia, mercaptans, phenolic compounds and trimethylamine that depend on whether the emission point is a stack (Type A) or not (Type B) (see Table 2-16). These limits vary from 0.02 ppm for trimethylamine and both types of emission point to 5,000 ppm for ammonia for Type A emission point.
Regulation 7 also contains complaint criteria whereby the limits in the regulation are only applicable when odour complaints have been received from 10 or more complainants within a 90-day period. When the limits of Regulation 7 do become effective they remain effective until one year after no citizen complaints have been received. The limits become applicable again when odour complaints are received from five or more complainants within a 90-day period.

Reputation Resources Results Odour Management in British Columbia: RWDI AIR Inc Review and Recommendations W05-1108 Final Report - 89 - March 2005
The emission limits of Regulations 7 and 9 can be included in permits. Both the emission and ambient standards are used for monitoring and enforcement in response to odour complaints. The BAAQMD believes that the best tool to prevent odours is good land use planning. Therefore buffer zones are also used for a new facility where there are existing homes. The nuisance law or the ambient standard of 5 D/T is used to determine whether a buffer zone is large enough to prevent odours occurring at residences (Hess, 2005).
3.2.2.1 Measurement Standards
There are approved methods for collecting and measuring samples in the Manual of Procedures. The relevant sections of the manual are cited in Regulation 7-600. Similarly, monitoring requirements for ground-level concentrations of hydrogen sulphide and sulphur dioxide are provided in Regulations 9-2-600 and 9-1-600, respectively.
Odour samples are collected using a Tedlar bag with a small pump attached. The sample is tested by one of the BAAQMD’s odour panels, which consist of three employees tested to ensure that they have an “average” nose as defined in the methodology. A dynamic olfactometer is used to dilute the air sample with odour-free air and send it to inhalation masks fitted to the three panellists. They are given 10 presentations of the diluted odorous sample and 10 presentations of odour-free air, presented in random order. Each panellist presses a signal button if any odour is detected. If at least two panellists give positive responses to 8 or more of the odour sample presentations, and negative responses to 8 or more of the odour-free presentations, then the sample is deemed odorous.
3.2.2.2 Emission Estimation
The BAAQMD maintains an emission inventory of all permitted facilities that includes all the stack parameters required to run a dispersion model. This inventory is used as a source of emission information for new facilities.
3.2.3 Rationale for Establishing the Odour Criteria
The rationale for establishing the BAAQMD standards was avoidance of nuisance and potential health impacts. Doctors have testified in court that repetitive assault by odours can result in a health impact (Hess, 2005). The quantitative standards in Regulation 7 are based on research on

Reputation Resources Results Odour Management in British Columbia: RWDI AIR Inc Review and Recommendations W05-1108 Final Report - 90 - March 2005
odours and human reactions to them, conducted by a toxologist in charge of the BAAQMD odour program when the regulations were created.
3.2.4 Responses to Specific Interview Questions
3.2.4.1 Is Your Program Successful?
The BAAQMD odour management program is successful. The number of odour complaints has decreased over time. In fact, odour is no longer the highest priority issue in the district. The workload of staff has decreased and they have been able to divert staff to controlling criteria pollutant emissions.
3.2.4.2 When Does Odour Become a Problem?
Ten complaints in a 90-day period are required before the Regulation 7 limits apply. However, the nuisance law (Regulation 1-301) refers to nuisance or annoyance to any “considerable number of persons”. The BAAQMD has determined that this requirement is normally satisfied when five different individuals have made separate complaints on a single day, each of which is confirmed by an inspector, with one household representing one complaint. Less than five individual complaints in one day is considered a private nuisance whereas five or more complaints is considered a public nuisance (Hess, 2005). One exception is that less than five complaints and documented health impacts are also considered a public nuisance.
3.2.4.3 Complaint Procedure
The BAAQMD receives about 3,000 air pollution complaints against stationary sources every year and about half of these complaints are related to odour. Responding to complaints from the public takes precedence over all other duties assigned to inspectors except responding to a violation in progress.
The BAAQMD has a 24-hour toll-free complaint hotline: 1-800-334-ODOR.
When a complaint occurs the following steps are taken: 1. BAAQMD responds by sending an inspector no later than 30 minutes after receipt during
regular business hours;

Reputation Resources Results Odour Management in British Columbia: RWDI AIR Inc Review and Recommendations W05-1108 Final Report - 91 - March 2005
2. The inspector attempts to ascertain the specific origin of the emissions and whether or not a violation of regulations has occurred;
3. Wherever possible, the inspector will confirm the complaint in the presence of the complainant;
4. The inspector completes a report on the outcome, regardless of whether or not the complaint is confirmed;
5. The inspector keeps the complainant informed of the process; 6. If the complaint is confirmed, the inspector talks to the operator to encourage them to
implement voluntary measures; 7. If the problem persists, the inspector can issue a notice of violation, which includes a
penalty and a fine (the fines escalate depending on the number of people affected); 8. If the problem persists then a court order can be issued to force the operator to comply
(civil system); and 9. If the problem persists the BAAQMD can prosecute in the criminal courts.
3.2.4.4 Stakeholder Consultation
Stakeholder consultation was conducted during development of the current regulations (ca.1975-76). Ongoing public education is delivered by the BAAQMD staff who give lectures to children, community groups, develop brochures etc.
The BAAQMD odour management program has engaged the public and senior politicians.
3.2.4.5 Odour Avoidance or Land Use Planning Tools
The BAAQMD works closely with municipal and regional land use planners. Although not usually the lead agency for development proposals, such as commercial or residential projects, the BAAQMD is involved in the California Environmental Quality Act process for such projects and have developed guidelines for the evaluation of air quality impacts of such projects and plans (BAAQMD, 1999). Evaluation and mitigation of odour impacts are specifically included in these guidelines. Furthermore, developers now discuss plans with the BAAQMD because they require pre-construction authorization (Regulation 2, Rule 1).
Other tools used by the BAAQMD include buffer zones, dispersion modelling, and the complaint hotline.

Reputation Resources Results Odour Management in British Columbia: RWDI AIR Inc Review and Recommendations W05-1108 Final Report - 92 - March 2005
3.2.4.6 Illustrative Examples of Chronic Odour Problems
Common sources of odours in the BAAQMD include wastewater treatment plants, landfills, composting facilities, refineries, rendering plants and chemical plants. Rendering plants were a considerable problem in the past but changes made to require closed air systems with the vents going to chemical scrubbers have resulted in a large reduction in odour complaints. The application of good abatement technology at refineries and wastewater treatment plants has reduced odour complaint frequency for these sources as well.
The main problem today is solvent substitution. In an effort to limit photochemical smog production, regulations that require reductions of VOCs in solvents have been put into force. VOCs have been substituted with more reactive, but also more aromatic, chemicals with the unintended consequence of causing odour issues. The BAAQMD is also starting to have an increase in odour issues with sewage treatment plants with old equipment that is no longer working well.
3.3 KING COUNTY, WASHINGTON, USA
The King County Department of Natural Resources and Parks Wastewater Treatment Division (WTD) has an Odour Prevention Policy that defines odour prevention levels and includes recommendations for retrofitting existing facilities and for designing new facilities. The focus is on odour prevention not just odour control. One of the most interesting features of this policy is that it includes a number of methods of measuring the success of the program. To date, this program has been successful.
There are six recommended policies: 1. Retrofit existing facilities in a phased manner. 2. Phase-in odour prevention by implementing the tasks that generate the greatest
improvements first (cost/benefit). 3. New facilities should have odour control systems that are best in the country for facilities
of their size. 4. Design standards will be developed. 5. A comprehensive monitoring program will be developed that includes neighbour surveys
and tracking of odour complaints and responses. 6. New odour prevention and measurement technologies will be assessed and tested (i.e.,
continuous improvement).

Reputation Resources Results Odour Management in British Columbia: RWDI AIR Inc Review and Recommendations W05-1108 Final Report - 93 - March 2005
3.3.1 Regulatory Context
The Department of Natural Resources and Parks (DNRP) is a wholesaler of waste water treatment services to 26 facilities. The department is both the operator and regulator of the utility.
This policy was required under the Regional Wastewater Services Plan and a 2003 Ordinance of King County council requiring:
• Establishment of odour control goals at all treatment plants; • Design and operation of odour control facilities to meet goals; • Investigation of potential technologies and costs; • Recommendation of a policy to the King County Council for inclusion in the Regional
Wastewater Services Plan; and • Significant reduction of south treatment plant odours below 1993 air model levels.
This policy was published in March 2003. However, a less formal program related to odour complaint response and odour control systems has been in place for the last 15 years. The rationale for developing the policy was to avoid nuisance.
3.3.2 Odour Criteria
The Odour Prevention Policy defines odour prevention level characteristics that include ambient odour concentration criteria (see Table 3-2). These criteria are used for design purposes for new facilities or retrofits of existing facilities. They are used to assess the maximum ground-level concentration predicted within the study area, which is usually limited to about 1 mile from the plant, using a dispersion model. The odour criteria are not used in the field as it is believed that odour is difficult to measure.

Reputation Resources Results Odour Management in British Columbia: RWDI AIR Inc Review and Recommendations W05-1108 Final Report - 94 - March 2005
Table 3-2 Odour Prevention Level Characteristics
Odour Prevention Level Defining Characteristic High/New Plant a High/Existing Plant
Retrofit b Medium Low
Gases Captured from Odorous Processes Capable of Causing Nuisance Impacts
All All Most Some
Best Management Practices Identified and Followed
Yes Yes Partial No
Odour Dilutions Threshold c,d 0-3 e 0-3 e 3-5 f 5-20 e 20 – 50 e Frequency of Impact (Hours per Year)
<50 <100 <100 <100 <100
a) Best in the country for new facilities b) Best in the country for existing facilities c) Odour intensity above background sources due to wastewater facility emissions d) Maximum allowable operating range e) Routine operating range f) Non-routine operating range
In addition, the DNRP has agreements with City of Seattle requiring that a specific facility does not cause an odour greater than 3 D/T at the property boundary. Interestingly, measurement and enforcement is based on H2S.
King County is also regulated by the Puget Sound Clean Air Agency and they use an odour intensity scale, which is reproduced in Table 2-13.
3.3.2.1 Measurement and Emission Estimation
The WTD has an approved sampling method for H2S but not odour. Olfactometry is used to determine odour emission intensity and character of samples collected and sent to the Saint Croix lab. Sampling is conducted every five to ten years based on necessity.
No standard is in place for estimating emissions. However, a large study of a plant was conducted to improve their emission estimation methods. Samples were taken from aeration basins and stacks and gas chromatography and mass spectrometry were used to determine what chemicals are emitted and their emission rates. The results of this study are applied to other facilities. Both average and peak emission rates were measured because facilities are not designed to be protective of peak emissions 100% of the time.

Reputation Resources Results Odour Management in British Columbia: RWDI AIR Inc Review and Recommendations W05-1108 Final Report - 95 - March 2005
3.3.3 Rationale for Establishing the Odour Criteria
The primary driver for establishing odour prevention level characteristics was nuisance avoidance. The odour dilution thresholds listed in Table 3-2 are based on a survey of odour standards used at peer utility treatment plants such as East Bay Municipal Utility District in Oakland California; Central Contra Costa County Sanitary District, California; Sacramento County Regional Sanitation District, California; Orange County Sanitation District, California; Allegheny County Sanitation District, Pennsylvania; City of Philadelphia, Pennsylvania; and City of Calgary, Alberta. The standards used by these jurisdictions are listed in Table 2-2.
3.3.4 Responses to Specific Interview Questions
3.3.4.1 Is Your Program Successful?
The King County DNRP WTD odour management program is considered successful. There are not many odour complaints per year but this is not the best measure for success. Many more people detect and are annoyed by odours than make the effort to file a complaint. The measurement of odour prevention success must, therefore, use not only odour complaint data but also other measurements to assess adherence to, and the effectiveness of, the program. The odour policy sets out a number of measures of success related to the following topics:
1. Peer Utility Benchmarking: Benchmarks with utilities situated in similar coastal regions that share similar meteorology and topography that influence the dispersion and impact of odours will be established.
2. Wastewater Facility Design: Measurement of compliance with the design standard for odour control systems will be tracked and evaluated.
3. Operation & Maintenance Practices: Standard operation procedures will be reviewed and assessed periodically to determine how well they address odour prevention and how well they are implemented.
4. Odour Complaint Response & Investigation: Prompt response (within 2 hours) and resolution of odour complaints that are the result of the WTD’s activities are tracked and will be evaluated. The quality of the response rather than the number of complaints is important.

Reputation Resources Results Odour Management in British Columbia: RWDI AIR Inc Review and Recommendations W05-1108 Final Report - 96 - March 2005
5. Community Relations: surveys will continue to be used to assess the effectiveness of Community Relations Unit and to determine whether additional work is required. For example, how many plant tours were conducted? Should there be more?
6. Technology Assessment: data on emerging technologies and the results of technology testing will be tracked and maintained.
3.3.4.2 When Does Odour Become a Problem?
King County considers an odour complaint a serious event and has listed odour complaint telephone hotline numbers in area phonebooks. Personnel are available to respond to odour issues 24 hours a day. The odour hotlines connect directly to treatment plant main control offices where complaints are logged and the event is documented. Personnel are dispatched to the location identified by the complainant to investigate within two hours of receiving the complaint. The goals of the investigation are to identify the odour source, repair odour control equipment if necessary, and maintain a neighbourly relationship with the community. If the originator of the complaint desires, they are notified of the investigation findings.
Nonetheless, DNRP receives only 60 to 65 complaints per year.
3.3.4.3 Stakeholder Consultation
The WTD actively informs and educates the public about the services it provides. Planning is currently underway for an odour prevention webpage. Water Quality and Near-Facility-Neighbour Surveys are conducted annually by the DNRP’s Community Relations Unit to assess public sentiments about King County’s wastewater treatment facilities and nuisance odour impacts. (The surveys include questions that are not related to odour.) These surveys will continue to be used to assess the effectiveness of Community Relations Unit, to determine whether additional work is required, and as an odour prevention program measurement of success.
The near-neighbour surveys have been conducted for the last four years. For the South Treatment Plant, which is surrounded by office parks and residential neighbourhoods, different neighbourhoods have been surveyed from year to year. For the West Point Plant, only one neighbourhood has been questioned because it is the only one close enough to be affected by the plant. There has been no clear indication that odours from either plant have increased or decreased over those years based on the results of the surveys.

Reputation Resources Results Odour Management in British Columbia: RWDI AIR Inc Review and Recommendations W05-1108 Final Report - 97 - March 2005
The public appears to be engaged and more aware of the issues. Facility tours have been offered and are well attended. Local politicians are also engaged as they receive complaints directly. They also voted in the ordinance requiring the odour policy.
3.3.4.4 Odour Avoidance or Land Use Planning Tools
Dispersion modelling is conducted using ISC – Prime to assess potential odour impacts of facilities. There is no discussion with land use planners specifically aimed at resolving odour issues. The population density in King County is such that odour control is a necessary consideration. New, large treatment plants have to almost guarantee no odour anytime as public tolerance to a new odour source would be low. By the time the plume leaves the property boundary it should be odourless. This objective is very tough to meet.
3.4 NEW SOUTH WALES, AUSTRALIA
New South Wales, Australia has a very comprehensive policy for assessing and managing odour from stationary sources. It includes:
• an over-arching nuisance law; • odour performance criteria; • a three-level system of odour impact assessment; • avoidance and mitigation strategies; • negotiation between stakeholders; • performance monitoring and complaint management, and; • regulation and enforcement options.
Although this policy is still in draft form, it has been implemented since it was released in 2001. The odour management program set out in the policy is considered to be a big improvement on the previous ad-hoc system and is believed to be successful.
3.4.1 Regulatory Context
The two most important pieces of legislation for preventing and controlling odour in NSW are the Protection of the Environment Operations Act 1997 (POEO Act) and the Environmental Planning and Assessment Act 1979. The POEO Act requires that the operator of any facility must not cause air pollution, including odour and it also introduces the concept of ‘offensive odour’ in relation to licensed facilities. The POEO Act prohibits the emission of an offensive

Reputation Resources Results Odour Management in British Columbia: RWDI AIR Inc Review and Recommendations W05-1108 Final Report - 98 - March 2005
odour from scheduled premises but it also provides for negotiation of acceptable limits through the licensing process.
Offensive odour is defined as (NSW EPA, 2001b) “an odour: (a) that, by reason of its strength, nature, duration, character or quality, or the time at which it is emitted, or any other circumstances:
(i) is harmful to (or is likely to be harmful to) a person who is outside the premises from which it is emitted, or (ii) interferes unreasonably with (or is likely to interfere unreasonably with) the comfort or repose of a person who is outside the premises from which it is emitted, or
(b) that is of a strength, nature, duration, character or quality prescribed by the regulations or that is emitted at a time, or in other circumstances, prescribed by the regulations.”
Avoidance of nuisance was the main rationale for the legislation. Before the POEO Act was introduced, the legislation stipulated that there could be “no odour beyond the boundary of the premises”. This was not practical because a great deal of land acquisition was required to meet it. As a result this regulation was not enforced. The legislation was therefore changed to include the concept of no offensive odour. Furthermore, a technical framework was developed to help manage existing facilities and also to assist with assessing new proposals and setting conditions of approvals.
3.4.2 Odour Criteria
NSW has ground-level concentration criteria for 36 individual identifiable compounds that are used to assess odour impacts from stacks (see Table 2-1). These criteria are given in ppm for three-minute averaging periods, applied at and beyond the boundary of the facility. For a screening-level (Level 2) assessment the maximum predicted concentration is compared to these values. For Refined (Level 3) assessments the 99.9th percentile predicted concentration is compared to these values. These are design criteria for new or modified facilities and are not used in permits.
NSW also has odour performance criteria for complex mixtures of odorants to assess impacts from stacks and diffuse area sources (e.g., a lagoon). The generic criteria for any industry are listed in Table 2-2. They vary from 2 to 7 OU/m3 depending on the population density to reflect the fact that the larger the population in an affected area, the more likely it is that there will be someone with a sensitive sense of smell. Therefore the odour performance criteria are more

Reputation Resources Results Odour Management in British Columbia: RWDI AIR Inc Review and Recommendations W05-1108 Final Report - 99 - March 2005
stringent for larger populations. These are also design criteria and are not used in permits. They are applied at the nearest existing or likely future off-site sensitive receptor. These criteria are not specific to any particular industry, as the NSW Environmental Protection Agency (EPA) does not have resources to create industry-specific curves. However, the EPA encourages and helps industry sectors to develop specific criteria, and has published a Technical Note (NSW EPA, 2001a) outlining an acceptable procedure for developing specific criteria. The EPA is currently working with the cattle feedlot industry.
The relevant ambient criteria should be used routinely by proponents of new or expanding facilities to guide decisions on siting and proposed odour management strategies. They can also be used to develop site-specific stack emission concentration limits (ppm or OU/m3) for point sources, which can be included in an environmental protection licence. They may also be used for existing facilities on a case-by-case basis to guide the development of odour mitigation strategies in response to odour impact problems.
NSW also has fixed and variable separation distances for broiler chicken farms, intensive piggeries and cattle feedlots. The fixed separation distances are listed in Table 2-6. The equations to calculate the variable separation distances as part of a Level 1 Assessment are provided in Section 2.5.2. These should not be interpreted as buffer zones.
3.4.2.1 Measurement and Emission Inventory Standards
Approved methods for the sampling and analysis of air pollutants in NSW are documented (NSW EPA, 2001d). This document refers to Australian, European and US standards. The Australian Standard for dynamic olfactometry is based on European standards. The actual Australian Standard has to be purchased.
There are also approved methods and guidance for estimating emission rates and accounting for variability in emission rates (NSW EPA, 2001c).
3.4.3 Rationale for Establishing the Odour Criteria
As discussed above, avoidance of nuisance was the main rationale for establishing the odour management program in NSW. If an odourous pollutant had other health effects it would be dealt with in another way, such as setting a health-based emission limit in a licence.

Reputation Resources Results Odour Management in British Columbia: RWDI AIR Inc Review and Recommendations W05-1108 Final Report - 100 - March 2005
The ambient criteria were developed by reviewing available approaches (national and international) and then correlating them with available dynamic olfactometry results to establish what ambient level might lead to “offensiveness”. The affected population was also incorporated to take account of the likelihood of sensitive individuals being present.
Both the facility-specific emission limits and the ambient criteria are essential to the odour management program. The ambient criteria are used as benchmarks. They are not used for regulation, compliance or enforcement. However, the criteria can be used to assist with assessing performance when odour complaints or problems arise.
3.4.4 Responses to Specific Interview Questions
3.4.4.1 Is Your Program Successful?
Yes, the policy is successful because it is being taken seriously and it is being implemented. Even though it is still a draft policy it is being used by industry. The current odour management policy is a big improvement on the previous ad hoc system, as it provides a framework for odour management. A good example is the operator complaint system – operators are now trying to be good neighbours. The odour policy raised the profile of odour as a planning, regulatory and environmental issue. Industry and government are now more aware of odour as an issue. The EPA is working with industry to develop industry-specific criteria.
Initially, the workload of EPA staff did not decrease as a result of implementation of the policy, as the program was being established and introduced. Eventually, the workload is expected to decrease as the system starts working. Even if workload does not decrease, issues have been resolved and so level of frustration (with the old, ad hoc system) has decreased.
Although the NSW EPA does not have any formal measures of success, they have an intuitive feeling that at least some future odour issues are being avoided and longer term benefits will be realized.
3.4.4.2 When Does Odour Become a Problem?
The EPA has a central pollution line for all complaints, not just odour. Complaints are allocated to the appropriate regional office or local council for follow-up. Inspectors monitor the number

Reputation Resources Results Odour Management in British Columbia: RWDI AIR Inc Review and Recommendations W05-1108 Final Report - 101 - March 2005
of complaints for individual facilities. Each complaint is assessed and appropriate action is taken which may range from a phone call to a site inspection.
Confirmed complaints are a trigger of a problem, although this concept does not have a formal definition, and there is no set number of complaints as the trigger. When a complaint is considered legitimate by the inspector, the investigation consists of confirming the odourous source (facility-level); inspecting the facility and its processes; interviewing the facility operator(s); and reviewing meteorological data at the time of the incident.
The EPA encourages or may require, as a licence condition, operators to have a telephone complaint line. The public is encouraged to use this number before calling the EPA. This system was implemented in 1999. It is unclear whether the number of complaints to the EPA has been reduced as a result. This system has required operators to talk to the public and has reduced the number of complaints for certain facilities. This system is one way the EPA encourages good relationships between operators and neighbours.
3.4.4.3 Stakeholder Consultation
The draft policy on assessment and management of odour for stationary sources in NSW had a public consultation period and was used as a consultation document with industry, state and local government and community groups. Many stakeholders were involved in developing the policy including industry and the departments of agriculture and planning.
The NSW odour policy has not increased public awareness of odour issues but it has helped people impacted by odour to understand the issues.
There is no formal education program. However, training is being proposed for local councils.
The approach to regulating individual facilities and encouraging interaction with the public will ensure ongoing stakeholder consultation during implementation.
Senior politicians are not engaged but senior bureaucrats are. The change in legislation was driven by the EPA (i.e., bureaucrats). Government takes the odour policy seriously. Politicians may get involved if there is sufficient community outrage or if a big enough project is derailed and industry lobbies them.

Reputation Resources Results Odour Management in British Columbia: RWDI AIR Inc Review and Recommendations W05-1108 Final Report - 102 - March 2005
3.4.4.4 Odour Avoidance or Land Use Planning Tools
The NSW odour impact assessment consists of three levels to reflect the varying degree of investigation required for proposed developments.
• Level 1 is a ‘rule of thumb’ assessment based on generic parameters for the type of proposed facility and site. It requires minimal data and uses simple equations to conservatively predict the extent of an odour impact. Equations have been developed for broiler chicken farms, intensive piggeries, and cattle feedlots.
• Level 2 is a ‘screening’ dispersion model assessment using worst case input data. This assessment is more realistic than a Level 1 assessment.
• Level 3 is a ‘refined’ dispersion model assessment using site-specific input. This is the most comprehensive and most realistic assessment available.
The operator-run complaint management system is another useful tool used to reduce odour nuisance and improve relations between operators and the public.
The whole issue of managing encroachment and involving land use planners is difficult. The EPA tries to raise awareness and encourage involvement of local planning authority. They want them to be aware of the odour footprint of facilities to avoid future conflicts.
3.4.4.5 Illustrative Examples of Chronic Odour Problems
Odour issues have been resolved through implementation of the odour management framework. As a result, at a mushroom composting facility the number of complaints has decreased significantly; odour impacts were reduced at a paper manufacturing facility; a biofilter was installed at a cigarette manufacturing facility and there is no longer an issue; and odour issues have also been resolved using this framework at a sewage treatment facility.
The big issue that is still outstanding regards encroachment and who (i.e., the developer or industry) should pay for odour control or moving the facility.
3.5 SOUTH AUSTRALIA
The primary tool that South Australia uses to manage odour is minimum separation distance, both fixed and variable. Of the jurisdictions that were interviewed, South Australia has the most comprehensive set of fixed minimum separation distances. A more detailed odour impact assessment using dispersion models may be required for development applications depending on

Reputation Resources Results Odour Management in British Columbia: RWDI AIR Inc Review and Recommendations W05-1108 Final Report - 103 - March 2005
the size or nature of the industry, the sensitivity of the location or the sensitivity of neighbouring receptors. South Australia also has a nuisance law, ambient odour criteria, and technology criteria. The odour management program of this jurisdiction is considered to be successful.
3.5.1 Regulatory Context
The principal legislation addressing odour in South Australia is the Environment Protection Act 1993 (the Act). In particular, Section 25 imposes the general environmental duty on all persons undertaking an activity that emits odour, or might emit odour, to take all reasonable and practicable measures to prevent or minimise any resulting environmental harm. In addition, the causing of odour may constitute environmental nuisance, an offence under Section 82 of the Act. Thus, avoiding environmental nuisance is written into the South Australia Environmental Protection Act and it is an overarching policy of their odour management program.
South Australia’s odour management program is set out in two guideline documents: “Odour Assessment Using Odour Source Modelling” (South Australia, 2003) and “Guidelines for Separation Distances” (South Australia, 2000). These guidelines are not legally enforceable but separation distances and odour criteria are included in approvals, which are enforced. The regulators also have a general enforcement duty.
The rationale for developing the South Australian odour management program was avoidance of nuisance. The overall objectives of this program are to (South Australia, 2003):
• Minimise odour emissions and their impacts; • Ensure that the proposed industry or facility does not expose neighbouring land users to
an unacceptable level of odorous emission; • Ensure that the industry continues to operate in such a manner that the odour emissions
are managed within the accepted criteria; and • Apply principles of ongoing risk evaluation and management, given the evolving
understanding of odours and their potential health effects.
South Australia has had general odour criteria for over 10 years. They have always used some separation distances but they were not necessarily documented in policy. The current odour criteria were first published 5 to 6 years ago.

Reputation Resources Results Odour Management in British Columbia: RWDI AIR Inc Review and Recommendations W05-1108 Final Report - 104 - March 2005
3.5.2 Odour Criteria
South Australia uses three types of criteria: minimum separation distances, odour concentration criteria, and technology criteria. They also have standards for measuring odours.
3.5.2.1 Minimum Separation Distances
South Australia Environmental Protection Authority (EPA) has published recommended fixed separation distances for dozens of types of industries covering the following sectors: petroleum and chemical; manufacturing and mineral processing; waste treatment and disposal; food production, animal and plant processing; materials handling and transportation; sewage treatment works; liquid waste disposal and solid waste landfill depots. These distances are presented in Table 2-6. There are also industry-specific guidelines for piggeries and cattle feedlots. These are variable separation distances calculated using a combination of equations and look-up tables. The calculation system for piggeries is discussed in Section 2.5.2.7.
The principle of reciprocity is followed in South Australia. The recommended separation distances are used in the assessment of development proposals to ensure that incompatible land uses are located in a way that minimizes odour impacts. They are also used to ensure that industrial activities in appropriate zones are protected from encroachment by residential and other sensitive land uses that would adversely affect industry viability (South Australia, 2000).
Experience in South Australia shows that when an industry complies with the recommended separation distances, there are generally few complaints under normal operating conditions. Nonetheless, the application of separation distances is not seen as a substitute for source control and best management practices.
The Guidelines for Separation Distances are still in draft form and will be rewritten soon. The new document will be a major rewrite although the principle will be the same. The industries that are included will change as will some of the distances but the approach will remain the same.
3.5.2.2 Odour Concentration Criteria
Depending on the size or nature of the industry, the sensitivity of the location or the sensitivity of neighbouring receptors, the EPA will require that some development applications include a more refined assessment of potential odour impacts using dispersion modelling. This approach is

Reputation Resources Results Odour Management in British Columbia: RWDI AIR Inc Review and Recommendations W05-1108 Final Report - 105 - March 2005
usually used for new or modified facilities but existing facilities with an odour problem may also be required to conduct dispersion modelling. Model results are compared to concentration odour criteria.
The odour concentration criteria used in South Australia are similar to those used in New South Wales in the sense that they are population dependent – as the number of people potentially affected increases, there is an increased possibility of sensitive individuals, which raises the potential for odour complaints, and therefore more stringent criteria are necessary. However, the numerical value of the odour criteria, the averaging period used, the population groupings, and the frequency criteria all differ from those used in NSW (see Table 2-2).
These criteria are used to evaluate dispersion model results. The predicted three-minute average odour concentrations must not exceed the various levels 99.9% of the time at surrounding sensitive receptors, not including houses on the property of the development. An example of how the criteria are used is that if an odour source is in an area with a rural residence to the north and a town of 500 people to the south, then the appropriate criterion is 10 OU for the single residence and 4 OU for the town.
How model results are evaluated relative to the odour criteria is very interesting. If the model results are half the criteria then the project would most likely be acceptable. However, if the model results are between half and double the criteria then the proposed odour control systems and the dispersion modelling would be re-examined. Finally, if the model results are double the criteria the whole concept of the development would be re-examined.
3.5.2.3 Best Available Technology Economically Achievable
Both the minimum separation distances and the odour concentration criteria used in South Australia are based on the principle of compliance with the general environmental duty to avoid environmental nuisance using BATEA. The general environmental duty referred to in the Environment Protection Act means that developers should consider alternative sites, use best practicable engineering design, and operate using best practice management systems to reduce or eliminate odour impacts on sensitive land uses.
Good design is considered the first step to avoid odour nuisance. Buffer zones based on minimum separation distances or dispersion modelling are secondary measures.

Reputation Resources Results Odour Management in British Columbia: RWDI AIR Inc Review and Recommendations W05-1108 Final Report - 106 - March 2005
3.5.2.4 Measurement and Emission Inventory Standards
Olfactometry is used for measuring odour emissions at the source. The Australian Standard “Stationary Source Emission Determination of Odour Concentration by Dynamic Olfactometry, AS4323.3:2001” is used for odour panels. It is based on the European standard CEN 13725 (Harris, 2005). There is no standard for sampling but there is a real need to establish one, especially for area sources.
There are no emission estimation standards. Measurements from existing processes (their own or similar) are used. Some industries are developing central databases for these measurements, for example the pork industry. If emission measurements from a different facility are used in an application, there may be a requirement for a compliance test, once the facility is up to full production, to measure odour emissions and potentially remodel.
3.5.3 Rationale for Establishing the Odour Criteria
As discussed above, the rationale for establishing South Australian odour management program was avoidance of nuisance and both the minimum separation distances and the odour concentration criteria are based on the principle of compliance with the general environmental duty to avoid environmental nuisance using BATEA. The Guidelines for Separation Distances are based on those used in Victoria, Australia but adapted using local knowledge and experience. The odour assessment document, including concentration criteria, is based mainly on experience gained in South Australia.
3.5.4 Responses to Specific Interview Questions
3.5.4.1 Is Your Program Successful?
The South Australia odour management program is considered to be successful. They have found that by good design, good management and separation, odour problems can be minimized. In cases where there is an existing problem, time and money can usually reduce odours.
They have found that the principle of separation guideline is excellent. It provides a good rule-of-thumb for operators, which does not require modelling. Odour assessment for more complex facilities is not always necessary; it is only used if the EPA expects a potential problem. Odour criteria and separation distances are fundamental to the South Australia odour program.
Reputation Resources Results Odour Management in British Columbia: RWDI AIR Inc Review and Recommendations W05-1108 Final Report - 107 - March 2005
South Australia does not have key performance indicators. The program has not decreased the workload of staff but the guidelines have made the regulatory process easier and more transparent for developers and operators.
3.5.4.2 When Does Odour Become a Problem?
The EPA is not highly resourced and so their odour management program is complaint driven. If a facility is not causing problems with public then the EPA does not act. However, they do try to avoid problems in first place by requiring BATEA for new facilities.
South Australia has a method for formally recording all complaints. They have not seen a major change in the number of complaints since implementation of the program. Odour is still a major source of complaints. It continues to be an ongoing, localised problem.
3.5.4.3 Use of Stakeholder Consultation
The EPA expects the proponent of a new facility, as part of an environmental management plan, to recognise and address the public’s perceptions and concerns about the emitted odours. The EPA states that community consultation in the decision-making process is important in the management of odour (South Australia, 2000). The amount of public consultation that is required depends on the circumstances.
In addition, the EPA consulted with various stakeholders when developing the Odour Assessment Guideline. The Guidelines for Separation Distances are currently in the form of a consultation draft and when it is rewritten there will be more public consultation.
The South Australia odour management program does include some public education when there is a specific problem with a facility. The emphasis is on encouraging industry to educate local public. Also, the guidelines have made requirements more transparent to both developers and neighbours.
The public and other stakeholders, particularly certain industry sectors (pork and cattle feedlots) are engaged. Public awareness of odour issues has increased due to major problems they have had. For example, in the case of a foundry the public was very well organized. They went to parliament with their concerns and therefore got a great deal of publicity. Overall public awareness of environmental issues, including odour, has increased.

Reputation Resources Results Odour Management in British Columbia: RWDI AIR Inc Review and Recommendations W05-1108 Final Report - 108 - March 2005
Senior politicians are engaged. The EPA reports to a Minister of Parliament. The management of EPA are aware of the issues, and keep the Minister informed of major problems.
3.5.4.4 Use of Odour Avoidance or Land Use Planning Tools
Tools used to assess odour impacts of a development include: • Dispersion modelling, • Complaint history, • Previous practical experience with the activity, • Consultation outcomes, • Community odour diaries and surveys, and • Assessment of emission control proposals.
With respect to land use planning, any development with a potential minor environmental impact is sent to EPA for comment and recommended approval conditions. The planning authority must take due regard of EPA comments and recommendations but can decide not to implement them. However, if there is potential for a major environmental impact, the EPA has more authority with regard to decision (power of direction). It has major input and the tools described above are used at this stage.
3.5.4.5 Illustrative Examples of Chronic Odour Problems
Foundries have been a major problem in last few years where they are located close to residences. The industries have expanded and increased production, which has resulted in increased odour emissions. To help resolve the problem, foundries have used odour assessments and modelled all sources to determine the most cost-effective methods to reduce odours.
Other industries with chronic odour problems include: • VOC emissions from car manufacturers, • Intensive animal keeping – piggeries, chicken sheds, and • Printing processes with solvents.
3.6 WELLINGTON, NEW ZEALAND
The Wellington Regional Council developed an Air Quality Management Plan (AQMP) for the Wellington Region that includes odour (Wellington Regional Council, 2000). They make use of

Reputation Resources Results Odour Management in British Columbia: RWDI AIR Inc Review and Recommendations W05-1108 Final Report - 109 - March 2005
technology criteria in the form of the “Best Practicable Option” to prevent or minimise adverse effects. They do not have ambient or emission criteria but they could include an emission limit in a permit. They also have an odour intensity scale that is used by inspectors in the field. They also have a minimum threshold of 10 complaints before responding for facilities with chronic odour problems.
This odour management program is not considered to be successful.
3.6.1 Regulatory Context
In its rules for resource consents, the AQMP addresses Resource Management Act 1991 subsections 15(1)(c) and 15(2) as they relate to discharges to air. There is some overlap between territorial authorities and the Wellington Council in dealing with odour issues and land use planning. Territorial authorities also have a role under the Health Act 1956, which addresses statutory nuisance, including nuisance odour, but does not deal well with industrial site odours. The Wellington Council has enforcement responsibilities for dealing with odour discharges from trade and industrial premises.
The rationale for establishing the Resource Management Act was to introduce an effects-based regulatory environment, which applies to air pollution. This introduces an overlap with nuisance issues under the Health Act, but the latter Act is generally applied only to food premises (as it is enforced by Environmental Health Officers who regulate this industry) or air pollution issues of low importance (such as smells affecting an individual rather than a community).
One of the two objectives of the AQMP that is relevant to odour is to (Wellington Regional Council, 2000): “Manage discharges to air in the Region in a way or at a rate that enables people and communities to provide for their social, economic, cultural well-being and for their health and safety while ensuring that adverse effects on …human health…amenity values…are avoided, remedied or mitigated.”
The AQMP contains a specific policy related to odour:
“To avoid, remedy or mitigate any adverse effects, (including on human health or amenity values) which arise as a result of the frequency, intensity, duration, offensiveness, time and location of the discharge to air of odorous contaminants.”

Reputation Resources Results Odour Management in British Columbia: RWDI AIR Inc Review and Recommendations W05-1108 Final Report - 110 - March 2005
In the explanation of this policy it is stated that the Wellington Council will require, through rules in the AQMP, through conditions on resource consents, and through its enforcement responsibilities under the Act, that the effects of odorous activities be avoided, remedied or mitigates. It is also specifically stated that the effects of odour include nuisance effects and human health effects such as stress, headaches and nausea.
Furthermore, the Courts have determined that whether something is “offensive or objectionable” depends upon the perception of “reasonably ordinary persons”. The latter term has not been defined but is determined by the Courts. Usually a Council officer would be acknowledged to be a reasonably ordinary person.
The AQMP became operative in May 2000 and therefore the odour management program has been implemented for five years.
3.6.2 Odour Criteria
There are no ambient or emission criteria. Odour issues are dealt with on a case-by-case basis. Emission limits for odour may be applied as conditions on resource consents, which may also have a more generic requirement that no noxious, dangerous, offensive or objectionable odour can be detected beyond the boundary of the site. Or resource consents may require the use of BPO to prevent or minimize the effects of odorous discharges.
A six-level odour intensity index (not detectable to very strong) is used by officers in the field when they are investigating an odour complaint. The index is provided in Table 2-13.
There are some moves toward the establishment of odour panels in the event of major problems, albeit on a case-by-case basis. It is likely that the Australian standard for olfactometry would be adopted.
There is no standard approach for estimating emission rates required for modelling. The Council has a non-prescriptive approach. It lets proponents make assumptions. If their argument is sufficiently compelling the council may accept it; however the operator assumes the risk. If the modelling proves incorrect (i.e., in reality there is an odour problem) they will have to implement mitigation measures.

Reputation Resources Results Odour Management in British Columbia: RWDI AIR Inc Review and Recommendations W05-1108 Final Report - 111 - March 2005
3.6.2.1 Best Practicable Option
The best practicable option is defined in the AQMP as: “in relation to a discharge of a contaminant or an emission of noise, means the best method for preventing or minimising the adverse effects on the environment having regard, among other things, to – (a) The nature of the discharge or emission and the sensitivity of the receiving environment to
adverse effects; and (b) the financial implications, and the effects on the environment, of that option when compared
with other options; and (c) the current state of technical knowledge and the likelihood that the option can be successfully
applied.”
The AQMP provides the following list of control technologies that could be part of a BPO approach for point sources:
• Vent gas collection (all gases are collected and passed through a control device); • Vent gas condensation (condensing the gas stream reduces its volume and may also
reduce the odour content); • Chemical treatment, such as oxidation reaction with hypochlorite; • Biological treatment, such as passage through a biofilter; • Adsorption on media such as activated carbon; • Incineration at temperatures high enough to destroy odorous contaminants; and • Atmospheric dispersion (the last step in an odour control process).
For area sources, it is suggested that good management practices may be the best means of controlling odour.
3.6.3 Rationale for Establishing the Odour Criteria
As discussed in the previous section, Wellington does not have odour criteria. The rationale for establishing the Resource Management Act and for developing the AQMP is discussed in Section 3.6.1.

Reputation Resources Results Odour Management in British Columbia: RWDI AIR Inc Review and Recommendations W05-1108 Final Report - 112 - March 2005
3.6.4 Responses to Specific Interview Questions
3.6.4.1 Is Your Program Successful?
Wellington’s odour management plan is not successful. There are repeated odour complaints from industrial sources. The regulator has great difficulty requiring the adoption of established technologies such as biofilters and afterburners (typically on the basis of economic hardship). Furthermore, restrictions on new odorous sites are not particularly strict – often recommendations from investigating officers are overturned or weakened by political appointees (councillors) at the consent hearing. Measures of success would be no new significant odour sources, and progressive improvement of existing ones.
Because the regulatory framework is not conducive to resolving issues, the regulators have adopted a proactive, informal program that consists of encouraging operators to consult with the public and use BPO.
There has been a dramatic workload reduction for the regulator since the initiation of an odour complaint criterion in 2002 (details are provided in the next section). Furthermore, this has released resources to focus upon pro-active initiatives such as site visits and statistical analysis.
3.6.4.2 When Does Odour Become a Problem?
Odour becomes a problem when it has been confirmed as offensive, objectionable, noxious or dangerous (in the assessment of the regulatory officer) at or beyond the source site boundary.
The Resource Management Act requires that all complaints are logged, but does not require them to be acted on. Odour complaints have been tracked since 1991. This revealed a growing number of odour complaints each year up to 2002, with odour complaints growing as a proportion of all complaints (up to 69% in 2002). During this time, each odour complaint was responded to with a phone call and site visit to assess validity. The vast majority of complaints were attributed to three sources (an asphalt plant, a meat works and a sewage sludge dewatering plant/composting plant/landfill complex) – all of which were situated close to residential areas, and subject to ongoing residential encroachment.
In 2002, staff resources could no longer support this response strategy (which proved ineffective as odour duration was typically very short), and so a policy of response thresholds was introduced, whereby officers would only respond following 10 or more complaints for the key

Reputation Resources Results Odour Management in British Columbia: RWDI AIR Inc Review and Recommendations W05-1108 Final Report - 113 - March 2005
sites. Following 2002, there was a decline in the number of complaints, attributed to closure of the asphalt plant, complainant fatigue and improved provisions at the remaining source sites. This decline has continued, and odour complaints are currently running at around 50% of the 2002 high.
The 10 complaint trigger is used mostly for facilities with chronic odour problems and/or many complaints, where the regulator is actively working with the operator to effect an improvement, in conjunction with a pro-active monitoring programme designed to establish the relationship between odour release at the site and its impact in the surrounding area. For facilities that have never been the source of a complaint before, the Council would likely respond to just one complaint.
The first step in a complaint investigation consists of a council officer determining whether the odour is “offensive or objectionable” using relevant case law principles, the odour intensity index and taking into account the FIDOL factors as well as time. If the odour is assessed as being offensive or objectionable, the discharger may be asked to take whatever action is necessary to avoid, remedy or mitigate the effects of the discharge. Where circumstances warrant, enforcement action may be taken in the form of an abatement notice, infringement notice, enforcement order application or prosecution, pursuant to the Act.
A major requirement for odour investigations that has been imposed by case law is the need for regulatory officers to conduct a 360 degree sweep of a suspected odour source, to confirm it is the source. However, in practice there are usually numerous constraints, such as buildings, fences, thick vegetation, roads, water or steep topography, that make it impossible to perform a 360 degree sweep. This requirement thus undermined the formal, regulatory approach. As a result, the regulator tends to focus on non-regulatory approaches. The most common is to enter into dialogue with operators to get them to acknowledge that there is a problem, and to deal with it at the source rather than focusing on the compliance test at the facility boundary.
3.6.4.3 Use of Stakeholder Consultation
Where appropriate, the Council may promote consultation between the affected community and the discharger. For example, when there is a proposal to install a new industrial process or site that may have offensive odours, it is likely to be a notified resource consent process. This means that interested or affected parties will be notified of the application, and have the opportunity to

Reputation Resources Results Odour Management in British Columbia: RWDI AIR Inc Review and Recommendations W05-1108 Final Report - 114 - March 2005
comment on the application. This may result in conditions being imposed on the consent (hours of operation, air pollution control technology type, etc.) or the consent being declined.
The Council has also conducted odour workshops involving community groups and used letter drops to complainants and neighbours of odorous sites. When it has been made clear that they are dealing to individual complaints, this has resulted in an elevated number of complaints. Local councillor involvement (around election time) also tends to stir things up
Senior politicians are not engaged. They have chosen to not deal with this matter. Local Councillors have some involvement around election time, promising to deal to the odour issue in an area. This heightens interest for a period of a couple of months, and then tends to disappear. Regional Councillors are involved in the setting of resource consent conditions, although as described above, this has actually led to the relaxed conditions which in some instances has led to officer’s concerns of potential odour impacts to become reality.
3.6.4.4 Use of Odour Avoidance or Land Use Planning Tools
Dispersion modelling may be used during the resource consent application process to evaluate the likely impact for significant sources (e.g., mushroom farms), but it is not commonly used. Shelter-belts and exclusion zones are used by some regional councils, but not currently by Greater Wellington.
Odour diaries are a very useful tool to assess the performance of a site and correlating it with weather conditions. The Council is careful whom they select to maintain diaries as they want an objective assessment so they will not provide them to vexatious complainers.
3.6.4.5 Illustrative Examples of Chronic Odour Problems
The asphalt plant referred to previously used to receive 500 complaints per year. The consents management team negotiated an activated carbon filter on the stack that had some improvement. This site closed in 2002.
The meat works referred to previously used to receive 200 complaints per year from rendering process (despite afterburner), stockyards and fugitive emissions. They were eventually required to install a biofilter, which has almost eliminated rendering odours. Complaints are now around 50 per year.

Reputation Resources Results Odour Management in British Columbia: RWDI AIR Inc Review and Recommendations W05-1108 Final Report - 115 - March 2005
The sewage sludge dewatering plant/composting plant/landfill complex received 200 complaints per year. There has been ongoing liaison with sites to improve practices (waste cover, storage indoors, keeping doors closed, use of deodorizers etc). As a result, complaints are now around 100 per year.
Both the meat works and the sewage sludge dewatering plant/composting plant/landfill complex are subject to residential encroachment, and people complaining because their property values stand to appreciate significantly if these industrial sites are closed. There is also a misconception amongst the public that there should be no smell whatsoever from these sites beyond the boundary, which is not a realistic expectation.
Downtown, wet fish are processed in closed facilities. Occasionally there are problems on hot days due to poor housekeeping. An additional problem is the encroachment of residential neighbourhoods in industrial areas, which results in more complaints.
There can also be issues outside of populated areas if there is mixed land use: commercial offices and industrial sites. To alleviate this problem, the Council is considering implementing the use of buffers around odorous activities.
3.7 GERMANY
Germany has a unique approach to managing odours that incorporates all of the FIDOL factors. The frequency, duration and intensity are measured using odour-hours. The immission limit values used to evaluate the measured odour-hours differ depending on the land use (residential vs. industrial and commercial). Recently, a system was developed to assess the hedonic tone or offensiveness of the odour as well. Pleasant odours are treated differently from neutral or unpleasant odours because they are thought to be less annoying.
Several other approaches are also used to manage odours in Germany including an odour nuisance law, minimum separation distances (used primarily for agricultural and waste sources), an odour intensity scale, and quantitative emission criteria. However, the main approach is the odour-hour/hedonic tone assessment.
The German odour management program is considered to be successful.
Reputation Resources Results Odour Management in British Columbia: RWDI AIR Inc Review and Recommendations W05-1108 Final Report - 116 - March 2005
3.7.1 Regulatory Context
The German odour management program is outlined in the GOAA. The legal basis for any requirement with respect to ambient air quality is the German Federal Immission Control Act (BImSchG) (1974/1990) and the 2002 Technical Instruction on Air Quality Control (TA Luft). According to Section 3 (1) of the BImSchG, harmful environmental impact is caused by “pollutants which due to their type, level and duration are likely to cause hazards, severe detriments or significant nuisance in the population at large or the neighbourhood” (Germany, 2003). According to Section 3 of the BImSchG, odours caused by installations are treated as a nuisance, but it has to be determined if the nuisance is significant. This question has to be answered in every licensing or surveillance procedure for industries that emit odours. Urban developments also have to evaluate existing odour impacts. The GOAA outlines a complete system of measurement or calculation methods for existing impact (by field measurements or dispersion modelling), calculation of the incremental and cumulative odour impacts, and limit values used to evaluate the odour impacts.
The first odour regulation in Germany dates back to 1978. It did not relate to odour annoyance of residents because this research had not yet been conducted. Dose-response relationships between odour frequency and odour annoyance were first included in the German odour management program in 1993 when GOAA was first released. GOAA has been used extensively in the field and in the courts.
Local authorities are responsible for licensing and complaints. The state environment agencies act as resources to the local authorities and are asked for advice on very difficult problems.
3.7.2 Odour Criteria
The primary approach used to assess odour impacts in Germany is the odour-hour approach, which now includes a method to assess hedonic tone. Fixed and variable minimum separation distances are also used, primarily for the agricultural sector. In addition, an odour emission limit of 500 OU/m3 is applied to a few types of facilities (see Table 2-16). Germany also has an odour intensity scale (see Table 2-13) and a scale for hedonic tone that ranges from -4 (unpleasant) to 0 (neutral) to +4 (pleasant) (Both, 2005) but the roles of these scales in their odour management program is unclear.

Reputation Resources Results Odour Management in British Columbia: RWDI AIR Inc Review and Recommendations W05-1108 Final Report - 117 - March 2005
3.7.2.1 Odour-hours
The odour-hour approach, measurement method and associated immission limits are discussed in Section 2.4.
The two methods of assessing odour impacts outlined in the GOAA – field measurements or dispersion modelling – have been shown to yield comparable results as long as the modelling is based on exceedances of 1 OU/m3 (Germany, 2003). Recently, the GOAA was modified to include a measure of hedonic tone based on the results of additional research.
A consultant’s report on dispersion modelling is attached to permits issued. Often, there is a requirement to conduct olfactometric measurements after commissioning. Odour-hour frequency is included in permits. The permitted limit could be the standard values of 0.10 or 0.15 but could also be site-specific, i.e., for an area with a cumulative odour problem, a facility could be limited to 0.05 odour hours. Conversely, in rural areas a higher value like 0.20 could be assigned. Needless to say, the permits are quite large – up to 60 pages long.
3.7.2.2 Hedonic Tone Methodology
In a 2003 research project on the hedonic tone of odours, the GOAA was found to be suitable for predicting odour annoyance caused by neutral or unpleasant odours. Pleasant odours, however, have a significantly lower annoyance potential than neutral and unpleasant odours. As a consequence, GOAA now makes an allowance for reduced annoyance in cases where the odour of concern is found to be “unambiguously pleasant” using the hedonic tone methodology described below. In these cases, the odour frequency of the pleasant odour is multiplied by a factor of 0.5, prior to being compared to the immission limits. In the event that both pleasant and unpleasant odours are present, the frequency of pleasant odours is multiplied by 0.5 before being added to the odour frequency of unpleasant odour, in order to determine the overall characteristic value of odour impact for comparison with the immission limit values.
The hedonic tone of an odour is assessed in the field by an odour panel. A method based on “polarity profiles” is used (also known as the semantic differential technique). A polarity profile consists of 29 word pairings of opposite-meaning adjectives generally used to describe odours, such as strong/weak, heavy/light, cold/warm, passive/active, fresh/stale, etc. For each word pairing, a scale of -3 to +3 is applied, where the magnitude of the value indicates the level of agreement of the observed odour with the associated adjective, e.g. a value of -3 in the first word

Reputation Resources Results Odour Management in British Columbia: RWDI AIR Inc Review and Recommendations W05-1108 Final Report - 118 - March 2005
pairing indicates a “very strong” odour and a value of 0 indicates neither a “strong” nor a “weak” odour.
As the first step in the field assessment of hedonic tone, benchmark polarity profiles are established by the individual odour panel members, who are asked to select appropriate values in each word pairing for a typical “pleasant odour” and a typical “unpleasant odour”. Individual odour panel members can be eliminated from the panel as a result of their benchmark assessment, if they do not make certain associations between a “pleasant odour” and an “unpleasant odour” and given words in the pairings, e.g. “fresh” and “uplifting” in the case of a “pleasant odour”, and “mouldy” and “nasty” in the case of an “unpleasant odour”. The numerical values in each individual word pairing are arithmetically averaged over all remaining members of the odour panel, thereby creating one average benchmark profile for a typical “pleasant odour” and another for a typical “unpleasant odour”.
In the second step of the field assessment, the odour panel members are asked to assess the polarity profile of the odour of concern. Numerous assessments are performed on at least four non-consecutive days by a minimum of ten odour panel members. The numerical value of the individual word pairings for each individual odour panel member is subsequently weighted (multiplied) by predetermined hedonic factor scores. The weighted values for each word pairing are then arithmetically averaged over all odour panel members. The resulting odour polarity profile is compared to the representative “pleasant odour” and “unpleasant odour” benchmark profiles by means of linear regression. To be classified as an “unambiguously pleasant odour”, the correlation between the polarity profile determined for the odour of concern and the representative “pleasant odour” profile must be greater than 0.5, and the correlation with the representative “unpleasant odour” profile must be less than -0.5.
3.7.2.3 Procedure in the Agricultural Sector
As a first step, minimum separation distances are calculated in accordance with the TA Luft document and guidelines VDI 3471 and VDI 3472. There are fixed minimum distances for manure-drying facilities, facilities for drying green fodder, facilities for drying waste products, and facilities for storing liquid manure. For farming or breeding livestock there are variable minimum distances that are calculated using minimum distance curves and factors for converting numbers of animals to livestock units.
Reputation Resources Results Odour Management in British Columbia: RWDI AIR Inc Review and Recommendations W05-1108 Final Report - 119 - March 2005
If the distance between a facility and the nearest residence is less than the fixed or calculated minimum distances than an assessment based on the GOAA (i.e., field study or dispersion modelling assessment) is required. In addition, if the minimum distances of two or more facilities overlap, then a cumulative assessment based on the GOAA is required.
3.7.2.4 Measurement and Emission Inventory Standards
There are many German VDI guidelines for emission measurement, calculation of setbacks etc. All of these guidelines have to be purchased and therefore were not reviewed. The European standard for olfactometry (EN 13725) is used in Germany.
There are no standard methods for estimating emissions. For existing facilities odour emission rates have to be measured. For new facilities, emission rates measured for the most similar facility are used and there would likely be a requirement for conducting emission measurements after commissioning.
3.7.3 Rationale for Establishing the Odour Criteria
The rationale for establishing the odour management program in Germany is nuisance reduction, as it is believed that odour nuisance cannot be completely avoided. Odour is not considered a health issue in Germany.
The immission limit values used to assess measured or modelled odour-hours are based on field investigations in which significant relationships between odour impact and odour annoyance were found. These limit values were developed on the basis of investigations in which the initial odour impact measured as odour frequency (Guideline VDI 3940, 1993) and the degree of odour annoyance of residents assessed by questionnaires according to Guideline VDI 3883 Part 1 (1997) were correlated. As a result, odour frequencies between 10% and 20% were found to be the critical range where a nuisance would be considered significant.
The hedonic tone methodology was also developed based on field research conducted in Germany.

Reputation Resources Results Odour Management in British Columbia: RWDI AIR Inc Review and Recommendations W05-1108 Final Report - 120 - March 2005
3.7.4 Responses to Specific Interview Questions
3.7.4.1 Is Your Program Successful?
The German odour management program is considered successful because only a few cases are taken to court. As a rule, the people and also the justice system accept the results based on the GOAA and their scientific background and foundation. It is also successful because the GOAA can be adapted to the special requirements of individual cases. This leads in some cases to further developments in emission abatement. In other cases, the complainant is told that their complaint is not justifiable. But in every case our system of odour regulations leads to a decision of the authority responsible. Both plant owner and complainant can go to court against the decision.
3.7.4.2 When Does Odour Become a Problem?
If a plant is likely to emit odours then it must assess them according to the GOAA. There is no list of facilities that emit odours but they do have a list of facilities that require a permit to operate, which depends on the size of the facility or their throughput. Some facilities are included in the TA Luft. There are other types of facilities that are required to assess the potential for odours based on the experience of regulators that they have the potential to emit odours.
In surveillance, odours have to be dealt with if there are complaints (independent of the number) or if the local authority responsible reasons that the plant does not meet the state-of-the-art.
Complaints are tracked but they are not used as a measure of success because of the in/out migration fluctuation in residential areas. The same applies to the annoyance degree in a residential area. People who moved in and did not know the odour situation before may be annoyed by the perceived odours although the plant has reduced their emissions.
In Germany, complainants have the right to have their complaints investigated. After making a complaint they receive an official report stating whether or not the odour complaint was found to be justified. If they do not agree with the decision they can appeal in the courts.

Reputation Resources Results Odour Management in British Columbia: RWDI AIR Inc Review and Recommendations W05-1108 Final Report - 121 - March 2005
3.7.4.3 Use of Stakeholder Consultation
Requirements for stakeholder consultation are outlined in the BImSchG. Public education on odour issues is not a component of their odour program.
3.7.4.4 Use of Odour Avoidance or Land Use Planning Tools
The main tool is the GOAA, which includes field measurements and dispersion modelling.
The Austal2000g dispersion model is used for odour impact assessments. It is a Lagrangian particle model that calculates concentrations based on a one-hour averaging period. (Initially, they had hoped to develop a model based on shorter averaging periods but the required run-time was too long and so this plan was abandoned.) For dispersion modelling, concentration is fixed at 1 OU/m3 as the recognition threshold, then the frequency of exceedances of this concentration at the receptor is determined. It is important to note that the methodology is based on the recognition threshold not the detection threshold, as is the case in most jurisdictions. The underlying theory is that people are annoyed only if they recognize the smell.
3.7.4.5 Illustrative Examples of Chronic Odour Problems
The following types of facility cause odour problems in Germany:
• Livestock farming; • Composting plants including fermentation processing; • Wastewater treatment plants including sludge composting; • Waste management – waste sites, waste treatment, waste utilization, mechanical-
biological treatment of waste, soil regeneration, waste incineration; • Food production, feeding stuff production, grease recovery, tannery; • Paint finishing plants; • Chemical industry including bitumen production; • Metal processing; • Foundries; • Textile finishing; • Chipboard industry; • Brickwork.

Reputation Resources Results Odour Management in British Columbia: RWDI AIR Inc Review and Recommendations W05-1108 Final Report - 122 - March 2005
As an example, the following case study was described: An aluminium pop can manufacturing facility. There were two sources of odour at this facility: the process where oil was washed off the cans, and the paint shops. In response to odour complaints, the local authority required the facility to conduct field measurements over a 6-month period. The odour frequency in residential areas was found to be 0.20, which is over the limit. So the local authority required the company to install controls on the paint facility (after burners). Results of a second field study indicated they still had an odour frequency of 0.20 odour hours, but this time it was due to the can washing process, the odour of which had previously been masked. The company was required to install additional control measures, in this case, drying the air. A third 6-month field study was conducted, and showed the odour frequency was less than 0.10. The whole process took five years. The public was kept informed about progress for the duration.
3.8 THE NETHERLANDS
The Netherlands has a relatively prescriptive, source-specific approach to managing odours. Some of the most interesting features of their approach are:
• The ambient odour criteria reflect the degree of offensiveness of the odour: criteria are more stringent for industries that emit odours that are more unpleasant;
• For many industries, emission factors have been developed for use in assessing the odour impact of a facility;
• Source-specific odour abatement measures are provided; • The licensing authority can revise existing permits as a result of new insights, facts or
circumstances; and • Biannual national surveys are conducted to gauge the level of annoyance due to odours.
The odour management program in the Netherlands is considered successful.
3.8.1 Regulatory Context
The Netherlands does not have a nuisance law and odour is not mentioned in their legislation. However, the environmental management law gives provisions to the local authorities to manage the local environmental quality. In addition, there is a national odour policy, which was first developed in the Netherlands in 1978. It related mainly to livestock farming and slaughterhouses and was based on research conducted in Germany. Exposure criteria were drafted in 1984 and used in practice but not formalized into law. The current odour policy is laid out in a 1995 letter by the Minister of Housing, Spatial Planning and the Environment. The basic principle of this

Reputation Resources Results Odour Management in British Columbia: RWDI AIR Inc Review and Recommendations W05-1108 Final Report - 123 - March 2005
policy is the prevention of new or reduction of existing odour nuisance. The following policy is derived from this principle (InfoMil, 2003):
• “if there is no nuisance, no measures will be required; • if there is nuisance, [abatement] measures will be taken on the basis of the ALARA
principle; • the degree of nuisance may be determined by means of a subjective assessment study,
nuisance questionnaire, complaint registration, etc. … • the degree of nuisance that is still acceptable is determined by the competent
authorities.”
This policy is fleshed out in the NeR, which were first published in 1992 and updated in 1995. The NeR system is based on general standards for emission concentrations that are in accordance with Best Available Control Technology for reducing emissions. The purpose of the NeR is to harmonise environmental permits regulating the emissions to the air in the Netherlands. It was also developed to facilitate the process of environmental licensing and to help prevent litigation by clearly establishing expectations for obtaining a permit. The NeR does not have any legal status; however, any departure from it must be adequately explained.
The stated policy objective of the regulator in the Netherlands is to limit the fraction of households annoyed by odours to 12% by 2000 and to have no severe nuisance at all by 2010.
Depending on the situation and a number of other factors such as the local authority, the type of facility, the size of facility, the land use, etc., the competent authority may specify numerical limits in the permit or numerical limits can be basis of other conditions in permit. There are four types of conditions typically included in permits:
• Minimum separation distance; • Emission rate limit (e.g. 1,000,000 OU/hr) and requirement for periodic testing; • Ambient standard in vicinity of facility (e.g., at 200 m the odour has to be < 5 OU/m3);
or • Exact prescription of odour abatement technology.
The NeR guidance is not restricted to applications for new facilities or modifications to existing facilities. The licensing authority has the power to decide whether specifications in existing permits should be revised as a result of new insights, facts or circumstances.

Reputation Resources Results Odour Management in British Columbia: RWDI AIR Inc Review and Recommendations W05-1108 Final Report - 124 - March 2005
3.8.2 Odour Criteria
The NeR provides industry-specific emission and immission (i.e. ambient) criteria. The ambient targets are defined as one-hour average odour concentrations that should not be surpassed more than 2% of all hours in an average meteorological year. The target values, provided in Table 2-2, range from C98,1-hour ≤ 0.5 ouE/m3 for rendering plants to C98,1-hour ≤ 3.5 ouE/m3 for coffee roasters. There are emission limits (see Table 2-16) for only five types of facility and they are in the form of mass concentration (mg/m3).
There are also minimum separation distance standards used for waste handling (see Table 2-6) and for agricultural activities such as livestock farming. The minimum separation distances for agricultural activities are not available in English; however they are based on the German system.
3.8.2.1 Measurement and Emission Estimation Standards
Odours are measured using the European standard for odour measurement CEN 13725 (see Section 2.3.1). There is also a guideline for taking odour samples; however it is not available in English.
There is not a specific approved method to estimate emissions. However, the NeR provides emission factors, based on research conducted in the Netherlands, and calculation methods for specific industries. These are used to estimate odour emissions for a facility and then nomograms (also provided in the NeR) or dispersion models are used to assess the potential odour impact of a facility.
3.8.3 Rationale for Establishing the Odour Criteria
As discussed above, the rationale for the Netherlands odour policy is the prevention of new or reduction of existing odour nuisance. The odour management system, including odour standards, is outlined in the NeR, the purpose of which was to harmonise environmental permits, facilitate the process of environmental licensing, and help prevent litigation by clearly establishing expectations for obtaining a permit.
The standards and separation distances were based on (not in order of importance): experience, scientific knowledge and research, social surveys, available technological measures, and economic viability. The standards were established by working groups that consisted of

Reputation Resources Results Odour Management in British Columbia: RWDI AIR Inc Review and Recommendations W05-1108 Final Report - 125 - March 2005
representatives from the government, industry, consultants and universities (Peeters Weem, 2005).
These standards are a vital part of the program, without them there would be no program (Peeters Weem, 2005). They are used for planning, permitting, monitoring and enforcement.
3.8.4 Responses to Specific Interview Questions
3.8.4.1 Is Your Program Successful?
The odour program in the Netherlands is successful. Every second year the national statistics office performs a survey of the way households experience the local environmental quality. This survey is based on personal interviews. This had been done since the 1980s. The odour nuisance from all sources (industry, agriculture, traffic, neighbours) has decreased from about 27% to 21% over a period of 15 years. Odour nuisance because of industrial activities had dropped from 15% in the 1980s to 9% in 2003.
The survey is based on psychological research. It contains many questions about housing and there are hidden questions about local environment. There are 25 questions and only 2 about odour. These two questions are used to assess the way people react to local environment quality with regards to odour.
The survey can also be used for site-specific monitoring of an odour problem. At least 1,000 households are included in the survey and there have to be at least 500 responses for the survey to be considered valid.
3.8.4.2 Do You Track Complaints?
There is no national complaint database. However, there are several local systems to track odour complaints. The largest and most elaborate system is used in the Rotterdam harbour area. The Rijnmond environmental agency has a special desk for environmental complaints. Each year more than 10,000 complaints are received about environmental nuisance in the Rotterdam harbour area, about dust, noise and odour. In general odour complaints make up 30 to 50% of the total number of complaints in Rotterdam each year.
Reputation Resources Results Odour Management in British Columbia: RWDI AIR Inc Review and Recommendations W05-1108 Final Report - 126 - March 2005
There has been a small decrease in the number of complaints in places where a tracking system was in operation for a long time. But in many places tracking systems have been in operation since 1995 or later and this too short a period to see significant effects.
What is clear, however, is that a large reduction of odour emissions, e.g. 90%, will lead to only a small reduction in complaints and that it takes many years before levels of complaints go down. For example, in the Rotterdam area, where there are 4 refineries and about 20 large chemical plants, odour has been a problem since the 1960s. A lot of odour abatement measures have been adopted and odour emissions have been reduced significantly. As a result the number of complaints has decreased but not as much as expected. There is still the occasional process upset or spill that causes odours and as a result complaints. Also, people have memory of odour nuisance: a survey found that people were still annoyed by facilities that were closed two years ago. This suggests that it takes a few years for people to recognize a reduction in odour.
3.8.4.3 When Does Odour Become a Problem?
There are no triggers, such as a number of complaints, specified in the Netherlands odour program. The local competent authority has to decide if odour nuisance in a given situation is a problem or not. In general, the competent authorities use the information in the NeR to make an assessment of the situation. However, this is not mandatory.
If the competent authority, i.e. the municipality or the province, has decided that there is a situation of odour nuisance they have to use the environmental license, sometimes in combination with spatial planning, to reduce the nuisance to an acceptable level.
3.8.4.4 Stakeholder Consultation
There are mandatory procedures for public and stakeholder consultation that the competent authority is required to follow according to the environmental management law and the law on spatial planning. Unfortunately, these procedures are not available in English.
There is no formal component relating to educating the public and stakeholders on odour nuisance and odour management. However, there is a strong informal component that is based on building a network of people who exchange information and knowledge. This network of industry, consultants and government was established when a great deal of research on odour

Reputation Resources Results Odour Management in British Columbia: RWDI AIR Inc Review and Recommendations W05-1108 Final Report - 127 - March 2005
was conducted in the 1990s. It is maintained through regular meetings two to three times a year, periodic workshops and a national conference once every two years.
3.8.4.5 Odour Avoidance or Land Use Planning Tools
Dispersion modelling is used as a tool for some industries. For others, nomograms have been developed to assess odour concentration as a function of downwind distance.
3.8.4.6 Has Your Program Engaged the Public or Other Stakeholders?
Industry, local politicians and, to a certain extent, the public are engaged. Many industries have their own working groups on odour. The public gets involved through neighbourhood action groups, environmental groups or the universities. Politicians discussed odour policy at the national level in 1995 but national politicians no longer interested in the issue. However, local politicians can be quite involved.
3.8.4.7 Illustrative Examples of Chronic Odour Problems
A program is in place to reduce VOCs in print shops to address both odour and ground-level ozone issues. VOCs were substituted with water in paint and printing ink. In addition, machinery was fully enclosed. This led to less dust and odour and thereby improved occupational health as well.
Another program required rendering plants to use a closed, cooling system to trap blood. This reduced odour emissions and improved occupational health. It was also a win-win for industry because the cooled blood was no longer a waste stream but a by-product that could be used in pet food.
In the 1990s, the Netherlands started to collect green waste from houses separately from other household waste. The regulators recognized that composting this waste could potentially be a significant source of odours. So when the first facility that was built they made measurements and developed emission factors. They also required that all processes occur in a closed installation and that emissions had to be cleaned using biofilters or bioscrubbers. All of the knowledge gained during research and installation of first plant was put into the permits for 20 new facilities. As a result of these preventative measures, there are no real problems or complaints associated with this industry.

Reputation Resources Results Odour Management in British Columbia: RWDI AIR Inc Review and Recommendations W05-1108 Final Report - 128 - March 2005
3.9 JAPAN
The odour management program is Japan is quite different from that of any other jurisdiction that was interviewed. The program itself is embodied in a national law. There are a number of ambient and emission standards that are enforceable by law and significant penalties for disobeying the law. There are also detailed measurement methodologies.
The odour management program is considered to be successful at addressing issues related to large industry, but not those related to household activities or smaller businesses.
3.9.1 Regulatory Context
The odour management program in Japan dates back to 1972 when the national Offensive Odour Control Law was enacted. The aim of the Offensive Odour Control Law is the preservation of the living environment and human health by reducing offensive odours to a degree that most people do not feel uncomfortable in their daily lives (Japan MOE, 2005). To achieve this aim, the Offensive Odour Control Law makes use of regulatory standards and promotes the implementation of preventative measures. In 1972 the regulatory standards consisted of concentration criteria for 22 substances. For a period of about 20 years, the implementation of the Offensive Odour Control Law resulted in a steady decrease in the number of complaints. However, around 1992, the number of complaints started to increase due to odours caused by unregulated substances or complex mixtures of odorants. To address this problem, the Offensive Odour Control Law was amended in 1995 to include an alternative regulatory system based on the Odour Index, which is described in Section 2.7.
Only designated regulation areas are subject to the regulatory standards. Such areas are designated by local governments based on geographical and demographical conditions. They typically consist of densely populated areas and suburbs with schools and hospitals. As of 2001, 55% of all local governments in Japan had designated regulation areas. Within regulated areas, all factories and workshops have to meet the standards regardless of type, scale or management organization of the business.
Local governments can choose to use either the concentration criteria regulatory system or the odour index regulatory system. They also have some flexibility as to the exact standard to be applied for either specific contaminants or the odour index, as long as the standard lies within the range of values provided in the Offensive Odour Control Law.
Reputation Resources Results Odour Management in British Columbia: RWDI AIR Inc Review and Recommendations W05-1108 Final Report - 129 - March 2005
Local governments are entitled to demand a report and to conduct an on-site inspection of operating conditions and preventive measures at odour emitting facilities. When offensive odour from a factory within a regulated area exceeds the regulatory standards and simultaneously impairs the living environment of residents, local government first makes recommendations for improvement to the facility of concern. These recommendations could include improvements in operating conditions, preventative measures or emission controls. If the facility does not voluntarily follow these recommendations, the local government can order them to implement the recommendations within a certain time frame. If the facility disobeys they can be penalized. Penalties include imprisonment for up to one year or fines of up to one million yen.
3.9.2 Odour Criteria
Odours from factories and workshops are regulated at three locations: the site boundary, at air emission sources (e.g., stack top or vent), and at liquid effluent outlets. The range of concentration standards at the site boundary that local governments can choose from are provided in Table 2-1 and the range of odour index standards is 10 to 21. As indicated in Table 2-16, the air emission standard is a flow rate, which is a function of the effective stack height and the concentration standard selected from the range given in Table 2-1. The calculation of effective stack height is specified in the Offensive Odour Control Law and reproduced in Appendix A. As indicated in Table 2-16, odour emission standards for liquid effluent outlets are the product of a constant k, which is a function of the volumetric flow rate, and the concentration standard selected from the range given in Table 2-1.
The ambient standards (both for specific odour substances and the odour index) were established to correspond to the acceptable odour intensity range of 2.5 to 3.5. The descriptive odour intensity scale used in Japan is provided in Table 2-13. Based on this scale, an acceptable odour intensity lies somewhere between an odour that is recognizable to one that is strong.
3.9.2.1 Measurement Standards
The Offensive Odour Control Law refers to detailed methods for measuring both the concentration of the 22 regulated odorants and the odour index. There are 8 methods provided for the 22 substances grouped as follows (see http://www.env.go.jp/en/lar/olaw/mm.html):
• Ammonia; • Sulphur compounds (methyl mercaptan, hydrogen sulphide, methyl sulphide and methyl
disulphide);

Reputation Resources Results Odour Management in British Columbia: RWDI AIR Inc Review and Recommendations W05-1108 Final Report - 130 - March 2005
• Tri-methyl amine; • Aldehydes; • Isobutyl alcohol; • Ethyl acetate and methyl isobutyl ketone; • Toluene, styrene and xylene; and • Propionic acid, butyric acid, valeric acid and isovaleric acid.
Most of the methods make use of gas chromatography and hydrogen flame ionization detection apart from ammonia, where an optical intensity meter is used.
Odour concentration is measured using the Triangular Odour Bag Method (see http://www.env.go.jp/en/lar/regulation/odor.html). In this method, a panel of six or more people are given a set of three bags, one with a sample in it and two with odour-free air. Panel members are asked to choose the odorous bag. The odour is gradually diluted and tested until it becomes impossible to identify the bag with odour. The odour index is calculated based on the dilution rate at which the panel can no longer correctly identify the odorous bag. In the case of liquid samples, flasks are used instead of bags. The method also identifies how members of the panel should be selected, how samples should be gathered, and how test results should be calculated.
The Japanese olfactometric method is developed independently and therefore is quite different from the European and American methods, which are fairly similar. Dilution accuracy, panel selection and odour measurements of the Japanese and European olfactometry standards were compared by Ueno et al. (2003). They found that when three standard odours and six odour mixtures were tested by the same panel using the two different methodologies, the results of both methods corresponded well.
3.9.3 Preventive Measures
The Offensive Odour Control Law also stipulates the role of citizens, governments and business owners in the prevention of odours.
Citizens are responsible for: • Making efforts to prevent the generation of offensive odours in daily life in densely
populated areas; and • For not incinerating large amounts of material outdoors.
The national government is responsible for:

Reputation Resources Results Odour Management in British Columbia: RWDI AIR Inc Review and Recommendations W05-1108 Final Report - 131 - March 2005
• Promoting education and disseminating information on offensive odours; • Advising local governments; • Mediating funds and technical assistance for business owners; and • Promoting research on the prevention of offensive odour.
Local governments are responsible for: • Providing support and information for local residents; and • Planning and implementing measures to preserve the local living environment.
Business owners are obliged to: • Comply with applicable regulation standards; and • In the case of accidents, adopt appropriate measures against the emission of offensive
odours and report the situation to local government.
3.9.4 Rationale for Establishing the Odour Criteria
As discussed above, the rationale for establishing the Offensive Odour Control Law, which sets out the ambient and emission standards, was the preservation of the living environment and human health by reducing offensive odours to a degree that most people do not feel uncomfortable in their daily lives.
Regulatory odour standards are fundamental to the way Japan manages odour issues. They are used to determine whether odour emissions from a facility are acceptable. If the odour standards are exceeded, local governments can order facilities to make improvements. Failing to obey such orders can result in significant penalties (fines or imprisonment).
3.9.5 Responses to Specific Interview Questions
3.9.5.1 Is Your Program Successful
They consider their odour management program to be successful in one aspect, since the number of complaints derived from business activities, which the Offensive Odor Control Law in Japan regulates, is decreasing. But in other aspect unsuccessful, since the number of complaints due to non-business activities, such as private households and outdoor incineration, is increasing.

Reputation Resources Results Odour Management in British Columbia: RWDI AIR Inc Review and Recommendations W05-1108 Final Report - 132 - March 2005
3.9.5.2 When does Odour become a Problem?
Odour becomes a problem in Japan when emissions from a factory or a workshop within a regulated area result in an exceedance of a regulatory standard and simultaneously impair the living environment of residents.
3.9.5.3 Use of Stakeholder Consultation
Although not mandatory, it is recommended that local governments consult with the public and other stakeholders when designating regulation areas and establishing regulatory standards.
3.9.5.4 Use of Odour Avoidance or Land Use Planning Tools
In Japan, they do not make use of other tools such as dispersion models.
3.9.5.5 Has Your Program Engaged the Public and Other Stakeholders
The Offensive Odour Control Law not only regulates businesses but it also holds the public responsible for not generating offensive odours in their daily activities and also not causing odours in heavily populated areas by incinerating large quantities of rubber, hides, synthetic resins, waste oil, or other things as will generate offensive odours during combustion.
Reputation Resources Results Odour Management in British Columbia: RWDI AIR Inc Review and Recommendations W05-1108 Final Report - 133 - March 2005
4.0 ODOUR ISSUES IN BRITISH COLUMBIA
There are currently a number of regulatory agencies in BC that are involved in managing odour issues in the province. Under the authority of the provincial Environmental Management Act and GVRD Bylaw No. 937, WLAP and the GVRD are responsible for managing air quality, which can include odour issues. Pursuant to the Farm Practices Protection (Right to Farm) Act, the Ministry of Agriculture, Food and Fisheries (MAFF) is assigned the responsibility to resolve nuisance concerns, including odour concerns, relating to farm operations. Individual municipalities may also manage odour issues within their boundaries, typically relating to commercial or residential sources.
4.1 WHEN DOES ODOUR BECOME A PROBLEM IN BC?
Air quality complaints to BC regulatory agencies are frequently related to odour concerns. Sources of concern in British Columbia include pulp and paper mills, fibre-reinforced plastic manufacture, auto body shops, rendering plants, poultry farms, feed manufacture, composting operations, and landfills. Odour complaint frequency can be a good indicator of the impact of an odorous discharge, particularly where there is a relatively dense population. However, complaint records may not necessarily reflect the full degree of impact because many people will not complain even if they are very annoyed, and others will give up making complaints if they feel they are not making a difference. On the other hand, complaint frequency data may be skewed by people who are sensitised or have vested interests and indicate a higher degree of problems. Certain industry sectors are more prone to receiving odour complaints, due to heightened public awareness.
4.1.1 Odour Issues in the GVRD
The GVRD is delegated the authority under the Environmental Management Act to provide the services of Air Quality Management and Air Pollution Control within its boundaries. The Air Pollution Control aspect includes an air quality regulatory function, a component of which is the resolution of public complaints relating to air pollution.
The GVRD operates a 24-hour complaint line so that the public can register air quality complaints at any time. In fact, this is the way in which odour problems are most frequently identified. The GVRD receives about 1,500 complaints each year, roughly 75% of which are

Reputation Resources Results Odour Management in British Columbia: RWDI AIR Inc Review and Recommendations W05-1108 Final Report - 134 - March 2005
related to odours from commercial, industrial, agricultural and/or residential sources (Arnold, 2005). In the GVRD, odour complaints result from such common sources such as:
• meat, fish and poultry processing (including storage and handling, rendering, etc.), • composting, land-filling and other waste disposal, • petroleum refining, • wastewater treatment, • small commercial and industrial operations.
When a complaint is received by the GVRD, as much information as possible pertaining to the nature of the incident is obtained from the caller and recorded in a complaints database, and investigations are subsequently launched. Reported odours may impact a community in terms of public nuisance, but they do not always meet the definition of “pollution” within the GVRD Bylaw and provincial legislation. The GVRD’s regulatory actions with respect to odours have therefore been limited. As a result, a great deal of time and resources are expended in addressing odour-related complaints, which in many cases are not effectively resolved.
The odour complaints recorded by the GVRD usually pertain to only a small number of perceived offending facilities. A case in point is the Money’s Mushroom facility, which resulted in a large number of odour complaints to the GVRD in the 1990s (see the Case Study in Section 4.3).
The GVRD is not the only agency to deal with odour problems within the GVRD. Municipalities within the GVRD may also receive public complaints regarding odour, typically from commercial operations such as restaurants and auto body shops. A recent example that was featured in the media is West Vancouver, where residents have complained about strong smells coming from a neighbouring restaurant. As a result, West Vancouver has recently adopted amendments to its nuisance bylaw that will allow the district to fine odour-generating businesses up to $10,000 for failing to eliminate offending odours. According to the amended bylaw, district staff will take action against an offending business if at least two people who live within 100 m of the business file written complaints, and if two bylaw enforcement officers agree that the odour is causing a disturbance. There is a provision in the bylaw that allows the district to establish an odour panel to determine whether an odour may be considered a disturbance.

Reputation Resources Results Odour Management in British Columbia: RWDI AIR Inc Review and Recommendations W05-1108 Final Report - 135 - March 2005
4.1.2 Odour Issues Elsewhere in BC
In the rest of the province, odours from many of the same types of facilities as in the GVRD may cause similar problems, particularly in urban areas. One notable difference is the existence of pulp and paper mills in several areas of BC, which are significant generators of odour.
In all areas of BC except for the GVRD, WLAP has the authority to implement the Environmental Management Act. Public air quality complaints are filed with each of the regional offices of WLAP. There is no centralized complaints database for the province as a whole.
As an example, the Lower Mainland region of WLAP maintains its own complaints archive. It receives between 10 and 60 odour complaints per year (Vanderhoek, 2005). The number fluctuates from year to year with no apparent trend. Reported odour concerns are usually related to only a few facilities, and require extensive effort to achieve resolution.
In the Interior of BC, a rendering facility used to generate a significant volume of odour complaints from local residents until it ceased its rendering activities in 2002. In 2001, charges were laid against the owner of the facility under the Waste Management Act (now the Environmental Management Act), but were later dropped.
Agricultural activities and facilities are also a source of odours in BC. Odour issues relating to farm operations9 are handled separately from other sources of odour. Pursuant to the Farm Practices Protection (Right to Farm) Act, MAFF is assigned the responsibility to receive and attempt to resolve nuisance concerns (e.g., dust, odour, noise or other disturbances) relating to farm practices. In the last quarter century, agriculture in BC has grown to meet the demands of a growing population (MAFF, 2005). Residential areas are encroaching on traditional farm areas, resulting in greater potential for nuisance concerns by the non-farm residents. The changing
9 A farm operation can include the following activities: growing or raising plants (including in greenhouses) and animals (including certain types of exotics); clearing, draining, irrigating or cultivating land; using farm machinery, equipment, devices, materials and structures; applying fertilizers, manure, pesticides and biological control agents (including ground and air spraying); cultivating specialty wood or fibre crops; conducting turf production; carrying on an aquaculture operation; raising or keeping game; raising or keeping fur bearing animals; and processing or direct farm marketing (MAFF, 2005).

Reputation Resources Results Odour Management in British Columbia: RWDI AIR Inc Review and Recommendations W05-1108 Final Report - 136 - March 2005
nature of farming, with increased size of farms and new types of farming (e.g., large-scale greenhouses and fish farms), may contribute to increased nuisance concerns by local residents.
Since 2000, MAFF has recorded 5 to10 new complaints per year relating to odour nuisance in the province (Falsetta, 2005). All odour concerns are not necessarily captured, however, as complaints are registered only in cases where the concerned party is willing to identify himself as well as the farm operation that is causing the concern (Robbins, 2005). If an odour complaint is not satisfactorily resolved by MAFF, the complainant may file an official complaint with the Farm Industry Review Board (FIRB) (see Section 4.2.2). Forty-two formal complaints have been received in the FIRB’s first nine years of operation (FIRB, 2005).
4.2 EXISTING OR PROPOSED PROGRAMS IN BC
Neither the province of BC nor the GVRD currently have quantitative odour standards in place, and odour complaints are dealt with on a case-by-case basis. The following sections outline the existing and proposed regulations and programs serving to address odour issues in BC.
4.2.1 Environmental Management Act
The Environmental Management Act defines an “air contaminant” as “a substance that is introduced into the air and that: (a) injures or is capable of injuring the health or safety of a person, (b) injures or is capable of injuring property or any life form, (c) interferes with or is capable of interfering with visibility, (d) interferes with or is capable of interfering with the normal conduct of business, (e) causes or is capable of causing material physical discomfort to a person, or (f) damages or is capable of damaging the environment.”
In order for an odour to qualify as an air contaminant, mere unpleasantness does not suffice. In a landmark court case (see Section 4.3), the judge determined that odours generated by a mushroom composting facility qualified as an air contaminant, due to the “material physical discomfort” they caused local residents in the form of odour-induced physiological symptoms (e.g., nausea, gagging). Releases of odours that fall into one or more of the categories of the air contaminant definition are prohibited by the Environmental Management Act. Nuisance odours, on the other hand, are not prohibited by the Act.
Reputation Resources Results Odour Management in British Columbia: RWDI AIR Inc Review and Recommendations W05-1108 Final Report - 137 - March 2005
4.2.2 Farm Practices Protection (Right to Farm) Act
In 1996, the Farm Practices Protection (Right to Farm) Act came into effect, assigning MAFF with the responsibility to receive and attempt to resolve farm practices concerns related to nuisance (dust, odour, noise or other disturbances). The Act is founded on the principle that farmers have a right to farm in the Agricultural Land Reserve, in licensed aquaculture areas and other areas designated for farming by local governments. The right to farm, however, is contingent upon the use of “normal farm practices” (as defined in the Act) and compliance with other legislation (e.g. the Environmental Management Act, the Health Act, the Pesticide Control Act, and land use regulations). When a farm operation follows these requirements, the Act protects the farmer against nuisance actions, court injunctions, or specific nuisance bylaws related to the operation of the farm.
A person with a nuisance concern or complaint about a farm operation has a choice of engaging an informal or formal process to address the issue. The informal avenue for nuisance complaints is carried out by local governments and MAFF regional staff. Local governments respond to agricultural nuisance complaints by providing information and advice based on the Farm Practices Reference Guide (MAFF, 2003). MAFF staff throughout the province also work with persons concerned about a farm practice in an attempt to resolve the concern before the complaint requires a formal process.
If the nuisance complaint is not satisfactorily resolved by the informal process, a person may direct his/her complaint to the FIRB. The FIRB acts as a quasi-judicial, impartial body empowered by the Farm Practices Protection Act to hear complaints from persons that feel aggrieved by odour, noise, dust or other disturbances from a farm (FIRB, 2005). Where possible, the FIRB uses various forms of alternative dispute resolution processes to resolve issues by agreement without the need for formal panel hearings. If these processes are not used or are unsuccessful, a hearing is convened and it is determined whether the disturbance in question results from normal farm practices. As a result of the hearing, the FIRB either (1) dismisses the complaint if the farm operation is determined to be following normal farm practices; or (2) orders the farm to cease or modify its practices.
4.2.3 Compost Guideline / Organic Matter Recycling Regulation
Section 23(2)(b) of the Organic Matter Recycling Regulation (pursuant to the Environmental Management Act and the Health Act) stipulates, in part, that new compost facilities or those in

Reputation Resources Results Odour Management in British Columbia: RWDI AIR Inc Review and Recommendations W05-1108 Final Report - 138 - March 2005
excess of 20,000 tonnes/year capacity must be equipped with an odour collection and treatment system. This Act also requires in Sec.24(2)(d) that plans and specifications for a new composting facility must include “an odour management plan which stipulates how air contaminants from the composting facility will be discharged in a manner that does not cause pollution.”
A companion document to this regulation, entitled “Compost Facility Requirements Guideline: How to Comply with Part 5 of the Organic Matter Recycling Regulation,” was completed in March, 2004. As this latter document points out, odours that are not properly controlled can result in neighbour conflicts. The least cost odour control option is to initially design the facility to reduce odours to the lowest possible level. It also points out that “it is much better to prevent odours proactively than having to play catch up after an odour problem has already occurred.”
Specifically for odour emissions, the guideline is quite comprehensive in terms of location and operational parameters that should minimize the generation and impact of odours from composting facilities. While the regulation specifically exempts certain composting practices, such as composting of manure from agricultural operations, the guideline principles could be followed for the majority of composting operations that have the potential to produce strong odours regardless of industry sector. Considering the guidance provided in the compost facility guidance document, it may be reasonable for the Ministry to develop similar implementation guidelines for other potential odour sources when new regulations are developed.
Composting facilities represent a type of source whose operations often create unpleasant odours. It is also somewhat unique in that the operational variables of the composting process have much to do with the level of odour generated. While it’s acknowledged that composting of some waste materials does not generate much odour (e.g. yard waste), by far the majority of cases do not fall into that category, particularly in the agriculture sector. In such cases, regulators may want to consider the use of the most up-to-date, state-of-the-art process techniques and control methods.
4.2.4 Draft GVRD Odour Management Strategy
In November, 2004, the GVRD issued a draft Odour Management Strategy that specifies how odour issues will be resolved in that jurisdiction. The draft strategy consists of:
• GVRD’s approach to monitoring and assessing odour problems in a community,

Reputation Resources Results Odour Management in British Columbia: RWDI AIR Inc Review and Recommendations W05-1108 Final Report - 139 - March 2005
• GVRD’s approach to working with an affected community to obtain meaningful observations,
• GVRD’s approach to encouraging odour generating facilities to find workable solutions, and
• GVRD procedures to provide fair and consistent enforcement under applicable legislative authority.
Following the receipt of odour complaints, a GVRD officer will visit the affected area and, if a potential source is identified, a site visit to the source will be conducted. If complaints continue to be received, the investigation will be intensified through more frequent tours of the affected area and inspections of the source(s). At some point, affected residents may be asked to keep odour diaries with pertinent information to help GVRD officers assess the extent of the problem. In the course of the investigation, information will be gathered relating to the number and frequency of complaints, remedial actions taken by the source, other potential contributing sources, local meteorology and topography assessment, and compliance with permit, licence or bylaw requirements. Communication with affected residents through distribution of fact sheets, community updates and public information meetings may also be carried out.
The GVRD draft strategy uses the number of complaints and information gathered via inspection to determine the appropriate level of enforcement action. These actions are categorized in levels of one to six depending on the nature, severity, frequency and duration of specific odour problems. While these levels are structured in a progressive escalation regime starting at Level 1, enforcement action can begin at any level. The GVRD publishes a semi-annual noncompliance list of companies that exceed allowable emissions or are otherwise out of compliance with regulatory requirements. Sources may be added to the list if enforcement activity reaches Level 4 or higher.
Enforcement levels include: • Level 1 – written advisory • Level 2 – written warning • Level 3 – written directive • Level 4 – written requirement to take corrective action and/or commit to a compliance
program • Level 5 – Issuance of a Pollution Prevention Order or a Pollution Abatement Order • Level 6 – Prosecution

Reputation Resources Results Odour Management in British Columbia: RWDI AIR Inc Review and Recommendations W05-1108 Final Report - 140 - March 2005
Level 1 is triggered by the receipt of 10 complaints in a 30-day period and may result in the issuance of a letter advising the source that complaints have been received. It also requests voluntary remedial action to be taken and reported to the GVRD.
Level 2 results in a warning letter after the receipt of 20 complaints in a 30-day period or, in the case of a continuing problem, 20 complaints in a 60-day period. The warning letter advises the company to take immediate corrective action and to report to the GVRD. It also warns that failure to resolve the issue could result in a requirement to resolve the issue, to commit to a formal compliance program and/or be included on the noncompliance list.
Level 3 occurs if 30 complaints are received in a 30-day period or for ongoing problems, 30 complaints in a 60 or 90 day period. The written directive advises the company of the reported incidents, previous letters, and that immediate corrective action is needed. A report to the GVRD is required providing information on operations that are causing the odours. A similar warning as in Level 2 is also included. In addition, at this stage, local residents may be asked to keep odour diaries in the event that higher level actions are launched.
Level 4 action indicates that a serious odour problem exists and may be significant enough to issue an Order or to commence legal action. It is an optional measure for discretionary use depending on the circumstances and is triggered by 40 complaints in a 30-day period or in a 60, 90, or 120 day period for ongoing issues. It requires immediate corrective action and/or for the company to commit to a formal compliance program for resolution of the problem. Progress reporting to the GVRD and the community may also be required, and the company will be added to the noncompliance list. Noncompliance with this level of enforcement may result in permit/licence suspension.
Level 5 action is initiated when “pollution” as defined in the GVRD Bylaw is determined to be occurring. At this level, the GVRD’s District Director may issue a Pollution Prevention or Pollution Abatement Order under the Bylaw. The Pollution Prevention Order is for situations where “pollution” is likely to be caused if preventive action is not taken. A Pollution Abatement Order is issued for incidents that are causing or have caused “pollution.” In both cases, noncompliance can result in permit suspension by the GVRD Board of Directors, prosecution, or both.
Level 6, prosecution, is intended to resolve the odour problem in the courts. It is the highest level of formal enforcement action that the GVRD can take.

Reputation Resources Results Odour Management in British Columbia: RWDI AIR Inc Review and Recommendations W05-1108 Final Report - 141 - March 2005
The GVRD draft Odour Management Strategy provides a structured procedure that clearly indicates to odour sources and the public how the GVRD intends to resolve odour problems as they occur. It acknowledges that time is required to gather the necessary information to support initiation of the various enforcement levels and that communication with all affected parties is crucial. Such a strategy is necessary to ensure that problems are resolved in a timely manner and that air quality is protected.
Experience indicates that the public can become frustrated by what it perceives as slow progress by a regulatory agency to resolve an odour problem. While some time is needed to gather the facts of an odour incident, it is incumbent on agencies to make supportable enforcement decisions as early as possible. The GVRD six-level process is logical and comprehensive. By involving the affected public through verbal and written communication, a sense should be created that progress is being made and that the issue is being taken seriously.
Conversely, if regulatory decisions are not made expeditiously, public support can turn to public anger. Regulatory staff must make decisions based on an assessment of all the facts. The public affected by odours is often less tolerant of these same facts and situations can lead to frustration with the regulator. Therefore quick progress and decisive action is needed.
With this in mind, some modifications to the draft GVRD Odour Management Strategy could be considered for use in other areas of the province. For example, staff in more rural areas may find it difficult to interact with the affected public to the same degree as those in urban areas. While some of the same types of activities would be effective, there may well be a need to combine actions or to implement them at an earlier stage.
Specifically, the issuance of a Pollution Prevention Order may be needed prior to escalation to Level 5 of the GVRD strategy, as it is, by its nature, a preventative action. It would send a strong message to the source and to the affected public that the issue is being taken seriously. In part, this Order could include a requirement to submit a Plan for resolving the particular issue, including specific milestones for its implementation.
For larger sources, such as pulp mills, where an odour problem cannot be solved quickly, the formation of an advisory committee comprised of company officials, provincial ministry staff with an interest in the issue, the affected public and the local health authority may be needed to define the issue and find solutions. Normally, such a committee would be organized, run and funded by the odour-generating company. Its function would be for the company to provide

Reputation Resources Results Odour Management in British Columbia: RWDI AIR Inc Review and Recommendations W05-1108 Final Report - 142 - March 2005
regular progress reports on activities to resolve odour problems and for stakeholders and the public to provide feedback.
4.3 CASE STUDY: MONEY’S MUSHROOMS
The following section is meant to illustrate the efficacy of using existing legislation in the Province of BC to deal with odorous emissions. The case cited below involves the generation of strong odours from composting of materials for the production of mushroom growing media. The prosecution took place in 1997 in the BC Provincial Court, following charges laid by the GVRD.
This situation involved a large composting facility that had been in existence since the early 1970s. There were neighbours located virtually at the property line, as well as many that were up to a few kilometres away. The GVRD received a large number of complaints, becoming particularly frequent in 1994.
The legislation under which the action was taken is GVRD Air Quality Management Bylaw No. 725. Considering that the GVRD has similar regulatory authority to WLAP for emission sources within its jurisdiction, the bylaw language is similar, although not identical, to that found in the Waste Management Act (now the Environmental Management Act). Specifically, Bylaw 725 contained the following definitions:
“air pollution” means the presence in the Air of an Air Contaminant or substance that substantially alters or impairs the usefulness of the Air.
“air contaminant” means any substance, including an odorous substance [emphasis added] whether gaseous, liquid or solid or any combination that is emitted into the Air and that…
(e) causes or is capable of causing material discomfort to a person…
This bylaw was replaced with Bylaw 937 in 1999, at which time the definition of an air contaminant was modified to be exactly in line with the Waste Management Act in force at the time.
The judge in this case stated that “material discomfort” meant more than merely unpleasantness. Further, with respect to a challenge that odour is not a “substance,” the court ruled that “The presence of a substance in the environment can be established by odour.” Therefore, odour can be considered a substance with the same standing as any other emission.

Reputation Resources Results Odour Management in British Columbia: RWDI AIR Inc Review and Recommendations W05-1108 Final Report - 143 - March 2005
Adding to that ruling, the Court also concluded that “…the presence of air contaminants could be established subjectively using the olfactory senses.” In other words, the human nose is an acceptable detector of odour and can be used to establish the presence of odour. The job of the Court was then to decide “whether the substance caused or was capable of causing a material physiological consequence or substantially altered or impaired the usefulness of the air…” According to the Court, the latter determination must consider the number of persons affected, the neighbourhood, the degree of physiological effect, length of time that the odour was present, consistency of the characteristics of the odour, the methodology for collection of odour incident records, and any bias in the collection of data.
Considering the elusive nature of the odours from this composting source and the limited GVRD resources to actually experience the odour in order to gather evidence, the GVRD decided to make use of the resources of the numerous complainants. Residents were asked to record their observations and the effect that odours had on them. They were also advised of the potential for these records to be used as evidence in court.
During the trial, about 20 nearby residents were called to testify relative to the impact the odour had on them. Symptoms described included nausea, gagging, coughing, eyes watering, headaches, aggravation of existing asthma, etc. All nearby residents linked these impacts to times when the odours were present. This evidence was enough for the Court to determine that the odours were causing material discomfort to the neighbours, thereby rendering the odour an “air contaminant” that was causing “air pollution.”
Judged to be unnecessary were suggestions by the defence that a more scientific approach, such as the use of odour panels and olfactometers, was needed to determine the facts of the case. The Court found that people in the community were equally able to provide evidence of the personal impacts of odours and that there was no need for science-based evidence in this case.
A defence of due diligence by the company was not accepted by the Court, resulting in a conviction. According to the terms of a subsequent settlement agreement between the GVRD and the company, which was used in sentencing, no appeal of this decision was launched.
This was a precedent-setting case that in large measure provided good grounds for the non-scientific resolution of other odour problems. While the above GVRD Bylaw No. 725 language was superceded by identical language in the Waste Management Act (Environmental Management Act), the current language of the Act may very well be useful in prosecuting ongoing odour generating sources. By considering odour as a substance with the same status as

Reputation Resources Results Odour Management in British Columbia: RWDI AIR Inc Review and Recommendations W05-1108 Final Report - 144 - March 2005
other parameters that can cause “pollution” the Ministry may be positioned to use prosecution in the courts as a regulatory tool to resolve odour problems. With that understanding, the opportunity to exert greater pressure on sources to comply will be improved. For greater certainty, legislative changes to reflect specific mention of “odour” may enhance this opportunity. Another option would be to adopt additional legislation with a focus on “Nuisance Odours.”

Reputation Resources Results Odour Management in British Columbia: RWDI AIR Inc Review and Recommendations W05-1108 Final Report - 145 - March 2005
5.0 RECOMMENDATIONS FOR AN ODOUR MANAGEMENT
PROGRAM IN BRITISH COLUMBIA
Most of the jurisdictions that were interviewed have one odour management program to address odours from all sources: industrial, commercial, residential and agricultural. Elements of the various programs, such as emission standards or minimum separation distances, might be source-specific but the overall approach typically is not. The one exception is that a few jurisdictions, such as Germany and Ontario, have completely different programs maintained by different departments for managing odours from agricultural sources. The following recommendations are applicable to all source types except where indicated.
The research conducted in the course of completing this project indicates that there a variety of approaches to managing odour sources. All of the jurisdictions that were interviewed use a combination of at least two of these approaches. The most successful programs, BAAQMD, Germany, the Netherlands, and NSW, use a combination of three to five of the approaches. The most commonly used approaches are a nuisance law, ambient concentration criteria for odour, and minimum separation distances.
It was also evident that a combination of types of approaches, prescriptive (regulated) and non-prescriptive (voluntary, guidance documents), are used by other worldwide jurisdictions. The recommendations below are based primarily on the techniques used by many of these authorities, as well as local experience in British Columbia. The intention in this section is to describe techniques that have been used successfully elsewhere, but the usage focus for some of them is neither prescriptive nor non-prescriptive in terms of application.
Currently in British Columbia, including the GVRD, the main approach is similar to the avoidance of nuisance law approach. The GVRD Draft Odour Management Strategy also outlines a complaint management and response strategy. In addition, the GVRD has used an odour intensity scale in the past but on an ad hoc basis. These are generally reactive approaches and do not help prevent odour from new sources. The BAAQMD have found that the combination of a nuisance law and complaint management system is sufficient for their needs; however, their resources are significantly greater than those of regulators in BC. Based on the information gathered on successful management programs and the limited resources available in BC, a multi-pronged approached that includes proactive measures, such as design or technology criteria, would likely strengthen the odour management system in BC.

Reputation Resources Results Odour Management in British Columbia: RWDI AIR Inc Review and Recommendations W05-1108 Final Report - 146 - March 2005
Recommendation 1: Air quality regulators in BC could develop an odour management program that incorporates a combination of several approaches, both reactive and proactive, that have proven to be successful in other jurisdictions, such as a nuisance law, ambient odour concentration criteria for design purposes, complaint criteria and technology criteria.
As discussed in Section 2.1, odour regulations in 42 of the 50 states in the USA are in the form of a nuisance law. Of the nine jurisdictions that were interviewed, five had a nuisance law that specifically mentions odour and most felt it was critical to their odour management approach. In New South Wales the term “offensive odour” is included in their legislation and is specifically defined (see Section 3.4.1). This definition and the associated management framework have proven much more useful than a previously vague statement requiring no odour beyond the boundary of the premises.
In British Columbia, the Environmental Management Act includes definitions for “pollution” and “air contaminant” which may be useful in a similar context. These definitions include:
“pollution” means the presence in the environment of substances or contaminants that substantially alter or impair the usefulness of the environment.
“air contaminant” means a substance that is introduced into the air and that…
(e) causes or is capable of causing material physical discomfort to a person…
These definitions may not have been originally intended to consider the regulation of odours, but, as was seen in the example above, the GVRD was successful in prosecuting a composting facility on the basis of similar language. To better focus on the Environmental Management Act as a tool for legal resolution of troublesome odour sources, it may be appropriate to amend the definition of “air contaminant” to specifically identify “offensive odour” as a substance that will be controlled and define that term.
Recommendation 2: The Environmental Management Act definitions could be amended to refer to offensive odour as a substance that is controllable.
All of the jurisdictions that were interviewed log odour complaints. Most of these jurisdictions investigate every complaint, or have complaint criteria whereby when a threshold number of complaints is reached they investigate the complaint. Many of the jurisdictions have 24-hour

Reputation Resources Results Odour Management in British Columbia: RWDI AIR Inc Review and Recommendations W05-1108 Final Report - 147 - March 2005
complaint hotlines. Some jurisdictions, most notably BAAQMD, have a detailed complaint response procedure that is communicated to the public. Most of the jurisdictions track the number of complaints they receive from year-to-year but only a handful use this information as a measure of success.
In British Columbia, the GVRD has a complaints hotline and a complaint database that is searchable for odour complaints. However, the provincial government does not have an official complaint logging process. Complaints related to known facilities are usually logged but general complaints about odour in an area without an identified source are not recorded. Recording complaints is usually the first step in a complaint response procedure it is also the primary way that regulators in most jurisdictions become aware that there is a problem odour.
Recommendation 3: The Ministry of Water, Land and Air Protection could develop an odour complaint logging process that may include an odour hotline as well as a complaint database.
Many jurisdictions have ambient criteria for individual chemicals. Most of these jurisdictions have criteria for only one or two chemicals, the most common being ammonia and hydrogen sulphide. Ontario, New South Wales, Tasmania, Japan and Korea have ambient criteria for a dozen or more chemicals. In some cases these criteria are used as standards that are monitored and enforced at the property boundary. In other cases, they are used as design criteria.
Even more jurisdictions have ambient criteria for odour. Many of these jurisdictions, especially those in the USA have only one criterion. In other jurisdictions there are a range of values that vary depending on the land use, the population density or the source type. Because odour is very subjective in nature and therefore difficult to measure, these criteria are often used for design rather than compliance purposes.
When used for design purposes, these ambient criteria play an important role in the prevention of odour from new sources and for the reduction of odour from existing sources. Industry has been involved in the development of source-specific ambient odour criteria in both the Netherlands and New South Wales. In fact, in New South Wales, they are encouraged to develop industry-specific odour criteria at their own cost but in consultation with the regulator. In both of these jurisdictions, detailed guidelines are provided for the assessment of odour impacts and this has helped all stakeholders understand permitting requirements.

Reputation Resources Results Odour Management in British Columbia: RWDI AIR Inc Review and Recommendations W05-1108 Final Report - 148 - March 2005
To prevent new sources of odour, the permitting requirements for large facilities under the Environmental Management Act or GVRD Bylaw could focus more on odour than they have in the past. In some cases in BC, odours have been addressed generally by specifying that it must not be present in amounts to cause “pollution” but the enforcement mechanism has been unclear due to the subjective nature of determining that odours can, indeed, cause pollution. By placing greater emphasis on odour assessment and considering odour as an emission parameter equivalent to other regulated parameters, better management should be possible.
Both British Columbia and the GVRD might benefit from the adoption of ambient odour criteria, for design purposes, and odour impact assessment guidelines.
Recommendation 4: As a proactive measure to prevent new odour problems, air quality regulators in BC could adopt ambient odour criteria for design purposes and provide guidelines for odour impact assessments.
Equipment has been available for a considerable period to measure, with some degree of objectivity, the strength of odours. Known as olfactometers, the procedure for their use involves the exposure of individual panellists trained in the use of such equipment to detect an odour at specific dilutions. Such tests are usually conducted in a laboratory setting, with samples collected in the field using tedlar bags or other suitable collection devices. Portable olfactometers, also known as scentometers, are available for use in the field by trained personnel.
The practicality of such testing to assess ambient odour is often called into question. Also, collecting site-specific samples in an urban area can often prove difficult due to interference of other odour sources, particularly if samples are to be transported to the lab. Definitive recognition of odours in samples may also be difficult because they are fairly diluted at the fence line of a property (where samples are normally taken) after being emitted. Meteorology is also an important factor. However, the use of such equipment is valuable in assessing the qualitative nature of ambient odours under specific conditions.
Nonetheless, olfactometry is a powerful tool for measuring emissions of odour at the source. Of the issues listed above, the only one that is a concern for source measurements is the potential effects due to time delay required to transport samples to the lab. All of the jurisdictions that were interviewed except Wellington, NZ make use of olfactometry to establish odour emission rates.
Reputation Resources Results Odour Management in British Columbia: RWDI AIR Inc Review and Recommendations W05-1108 Final Report - 149 - March 2005
Recommendation 5: Air quality regulators in BC could use olfactometers to characterize odour source emission rates but further investigation of its use for ambient measurements and as a regulatory tool is needed.
To minimize odorous emissions, regulators could consider a requirement for the installation of specific controls (process or add-on) when new, potentially odorous sources are planned or when existing sources are causing odour problems. The mechanism could include the use of Best Available Control Technology, BATEA or some other strategy that reflects the use of state-of-the-art methods. This could result in allowable emission levels that are derived from the equipment installed.
In addition to the modification of processes or installation of control equipment, it is often necessary to address non-specific odour sources (fugitive sources) such as leaking valves, spills, etc. For example, in a composting or rendering plant, very strong odours can result if housekeeping procedures are not practiced diligently.
To help prevent odours and resolve existing odour problems, it may be advantageous to a regulator to require that the best equipment possible be installed to control emissions and that best management practices be implemented to minimize odours.
For smaller area sources that do not require permits, such as auto body shops, surface coating facilities, coffee roasters, etc., applicable regulations under the Environmental Management Act or GVRD Bylaw could require that state-of-the-art equipment be installed to control emissions, including a focus on odorous emissions. These regulations could also include requirements for use of good operating and housekeeping procedures, applied in the same manner as for Permitted sources.
Recommendation 6: Regulators could require, as a minimum, that state-of-the-art emission control equipment be installed at new facilities to control odours; that similar equipment be installed on existing odour-causing facilities; that best management practices (e.g., maintenance, good housekeeping) be implemented; and that pollution prevention (reduction of process emissions) be practiced.
Most complaint management systems require that an inspector go to the site of the complaint and verify it. In most cases, this does not involve using a scentometer or taking a sample of the air to be analysed by olfactometry at a lab because this provides only one dimension of the odour, its intensity. The other dimensions of odour, which are commonly referred to as the FIDOL factors,

Reputation Resources Results Odour Management in British Columbia: RWDI AIR Inc Review and Recommendations W05-1108 Final Report - 150 - March 2005
are frequency, intensity, duration, offensiveness and location. All of these factors, apart from location, are fairly subjective in nature, particularly the degree of offensiveness. A number of jurisdictions use indices, or odour intensity scales (see Section 2.6), to assess the character of an odour in the field. Most of these scales relate to the intensity and offensiveness (or degree of annoyance) only. The Texas scale is the most comprehensive and also addresses location.
The GVRD has used the following scale in the past to assess intensity:
0 No odour A concentration of an odorant which produces no sensation 1 Slight A concentration of an odorant which is just detectable (detection threshold) 2 Moderate A distinct and definite odour whose unpleasant characteristics are revealed
or foreshadowed (recognition threshold) 3 Strong An odour strong enough to cause a person to attempt to avoid it completely 4 Extreme An odour so strong as to be overpowering and intolerable for any length of
time
It may be possible to develop an odour character scale, similar to that used in Texas, which incorporates all of the FIDOL factors. One caution in using such a system is the subjectivity of the observer. Individuals have different perceptions of odours based on personal experience and sensitivities, and this may introduce considerable bias into the assessment of the FIDOL components. It would therefore be necessary to train inspectors to ensure consistent interpretation of the index.
Systematic and consistent use of an odour character scale by all inspectors, and also by members of the public, would remove some of the subjectivity of odour complaint reporting and verification.
Recommendation 7: Regulators could develop an odour character index based on the FIDOL factors for use as an odour reporting and complaint verification tool.
For new facilities that have a reasonable potential to create odour problems for nearby receptors, regulators could require that Odour Management Plans be developed as part of the approval process. The Organic Matter Recycling Regulation in British Columbia requires that a comprehensive Odour Management Plan be submitted for new or expanded composting facilities. As noted above this type of procedure could be expanded to include other odour-generating sources. Other jurisdictions around the world require submission of an odour

Reputation Resources Results Odour Management in British Columbia: RWDI AIR Inc Review and Recommendations W05-1108 Final Report - 151 - March 2005
management plan with an application for a new facility or as a measure to help resolve an existing odour problem.
Historically, in most jurisdictions, large new facilities such as pulp and paper mills, oil refineries, chemical plants, rendering plants, etc. have been required to submit extensive applications for authorization of emissions. The focus is normally on the common air contaminants (Nitrogen Oxides, Sulphur Oxides, Carbon Monoxide, Particulate Matter, and Volatile Organic Compounds) and any unique emission parameters that are characteristic of the specific facility. In most cases, the expectation is that if control of these identifiable air contaminants is adequate, then secondary concerns about odour should also be adequately addressed (i.e., odour is not normally addressed specifically). However, concerns about odours are becoming more commonplace, thereby necessitating a much closer assessment of odour impacts as a primary rather than secondary issue. Without such considerations, a facility could begin operation and be in compliance with a permit or other authorization, but odour problems may very well result. This is a much more difficult stage at which to address such problems. Rather, an Odour Management Plan should be an integral part of a complete application package, and odour should be treated by regulators as an emission parameter with equal status to the common air contaminants.
For existing facilities that become the subject of complaints, regulators could require the submission of similar Odour Management Plans. These are probably best for odour situations that have not progressed to a critical stage of sensitivity, and should include logical short- and long-term programs to reduce odours.
Recommendation 8: Regulators could require the submission of Odour Management Plans with applications for new facilities or for existing facilities that become the subject of odour complaints.
Many of the jurisdictions that were interviewed use fixed or variable separation distances to manage odours from agricultural sources. The use of variable separation distances is more common. In fact, in New South Wales where both fixed and variable separation distances are used, they are planning on moving away from fixed separation distances.
A number of different methodologies for calculating variable separation distances were reviewed. Some methodologies, such as in Alberta, Ontario, and Quebec, consist of a set of equations and look-up tables that are based on experience. Other methodologies, such as that in
Reputation Resources Results Odour Management in British Columbia: RWDI AIR Inc Review and Recommendations W05-1108 Final Report - 152 - March 2005
Queensland, Australia are also based on a system of equations and tables but the values in the tables were derived using dispersion models and are not just based on experience. The Purdue Model and the Iowa Master Matrix are web-based tools that do not require hand calculations and therefore are easier to use. In Germany, the system of simple equations and tables is used as a screening tool; if there is the potential for cumulative effects from more than one farm or if the screening separation distance is not met than a more refined dispersion modelling assessment is required. The same is true in New South Wales.
In South Australia and New South Wales a system that provides greater flexibility to the regulator has been developed: either the number of animals or the size of the buffer distance can be calculated. In this way, facilities that invest in greater odour controls can benefit by being allowed to expand their operations and, conversely, facilities that do not maintain equipment or comply with best management practices can be required to reduce the number of animals at their facilities.
Some jurisdictions, such as Alberta, are having difficulties defending the use of their separation distances because they are not scientifically-based. They are now working on developing additional factors that do have a scientific basis. If minimum distance separation guidelines are developed for agricultural sources in British Columbia it is recommended that they be developed independently using dispersion models, measured emission rates and other scientifically-based inputs. Furthermore, for increased flexibility, the system could allow regulators to vary the maximum allowable number of animals in a facility to reward operators that reduce their odour impact and to penalize those that allow their standard of operations to decline.
Recommendation 9 Regulators in BC could develop scientifically-based, variable minimum distance separation guidelines for agricultural sources.
The management and control of odour generating sources is a joint responsibility of various provincial ministries, local government, affected residents, and the facility source. The provincial Ministry of Water, Land and Air Protection is the most prominent Ministry as it is under the Environmental Management Act that most provincial actions in terms of odour control are taken, except in the GVRD where a provincial-level of authority is exercised. However, other ministries can also become involved. For example, if the source is agricultural in nature, then the Ministry of Agriculture, Food and Fisheries would have an interest to ensure that farming practices are not compromised.

Reputation Resources Results Odour Management in British Columbia: RWDI AIR Inc Review and Recommendations W05-1108 Final Report - 153 - March 2005
For odour-generating facilities that are located in regional districts or incorporated municipalities in the province, actual siting of a facility could be a decision of local government. Approved locations would have to be consistent with zoning requirements as well as any other local bylaws and policies.
In many cases, collaboration between provincial and local governments relative to the siting of odour sources is not always conducive to the most optimum site being selected. In part, this can result from the fact that local zoning bylaws will allow certain facilities only in areas that are consistent with zoning bylaws or official community plans. Quite often, the emissions from a facility are not adequately considered in these siting decisions, leaving it to provincial air quality regulators to ensure that odour problems will not be created.
The Ministry’s current initiative for regional (airshed) air quality management planning could provide an opportunity to fill this gap. Air Quality Management Plans are normally developed by a committee or task force that consists of stakeholders representing a variety of interests and perspectives in the airshed. Local government is one such stakeholder that would bring community concerns to the table. The issue described above relative to the potential incompatibility of provincial policies and procedures with prescriptive zoning bylaws is one that could be resolved through this process. For example, rather than Ministry staff asking for formal comments on a particular proposal from local government, a recommendation in the Plan could provide for the formation of an Air Quality Committee to assess the impacts of all activities that would have the potential to affect air quality. The committee concept could provide a coordinated procedure to get comments from all stakeholders in a less cumbersome way than currently exists in the Environmental Management Act.
The lack of coordination between local and provincial governments can lead to poor siting of odour-generating facilities that will ultimately lead to complaints from nearby receptors when the facility actually begins operation. Ideally, provincial and local authorities could develop consistent policies and legislation that would prevent such situations from occurring.
Recommendation 10: The Ministry of Water, Land and Air Protection (and the GVRD) could work with other ministries and local government to develop consistent and complementary requirements for locating facilities that have significant odour generation potential.

Reputation Resources Results Odour Management in British Columbia: RWDI AIR Inc Review and Recommendations W05-1108 Final Report - 154 - March 2005
Probably the first indication that a facility is causing unacceptable odour problems is the receipt of complaints by air quality authorities from local residents or other businesses. While for new facilities there are opportunities for public and stakeholder input during provincial authorization and local government zoning processes, the odour-producing potential of a facility may be overlooked unless there is a known history of such problems with similar facilities. In any event, early involvement of stakeholders is a necessary part of the approval process.
In some cases, the formal, legal approval processes are the only opportunities for public input into the evaluation of new or modified facilities. Should there be substantial opposition to the proposal, but it is subsequently approved, the public may perceive the decision to be made without due consideration to their concerns. And should odour problems develop following start up of operations, aggravation of these perceptions could ensue.
In the case of existing facilities that are causing odour problems, expedient action by the responsible authority is often demanded by complainants. Available short-term options may not be available, unless the problem is the result of an easily-remedied process upset. The normal process would be for the agency to work with the source to develop a strategy to resolve the problem, which may take a substantial period to complete. Often the public is not aware of the details of the proposed resolution, but continue to experience the odour impacts.
For both types of situations, it would be helpful to engage the public and other stakeholders more directly. Formation of an advisory or liaison committee to inform them of actions being taken and soliciting their comments will help in the understanding of the progress being made. Unless they understand these facts, they may very well conclude that remedial action is minimal and decide to escalate their opposition activities. Should this occur, actions then tend to focus on public relations activities rather than on resolution actions. Proper involvement of stakeholders is a prime component of any approval or remedial process.
Agency participation in community advisory committees is very resource intensive. To reduce the administrative burden of agencies, companies could be made responsible for establishing and maintaining such committees.
Recommendation 11: Regulatory agencies could involve the public and stakeholders in the resolution of odour problems directly by facilitating the formation of advisory committees.
Of the jurisdictions that were interviewed, many did not have measures for success. Therefore, their response as to whether or not their odour management program was successful was based

Reputation Resources Results Odour Management in British Columbia: RWDI AIR Inc Review and Recommendations W05-1108 Final Report - 155 - March 2005
on intuition or gut-feel. Of the few jurisdictions that did have a measure for success, it was often the number of complaints. However, one has to be careful when interpreting the number of complaints for a number of reasons. For instance, greater public awareness of the odour issue could result in more complaints. As well, one large incident could result in numerous complaints. In addition, increases in population and the number of facilities could result in an increase in the number of complaints. Finally, experience in the Netherlands shows that people have odour memory and it can take several years after a plant is shut-down or drastically reduces its odour emissions before people are no longer annoyed. Rather than measuring success using the number of complaints, the Netherlands conducts biannual national odour surveys to assess the level of annoyance of the population. Of all the jurisdictions, the only one that had set out several clear measures of success for their program was King County.
Development and implementation of an odour management strategy for British Columbia will require considerable time and resources. It will also likely undergo considerable public scrutiny. Given the resources that will be committed to such an approach, it would be worthwhile to determine in advance some key measures of success so that after a few years of implementation the program can be evaluated. These measures could involve the public (e.g., through surveys) and they could be used as a public consultation tool to demonstrate that odour issues are being addressed.
Other examples of possible success measures include: • whether the odour management strategy is taken seriously by politicians and other
stakeholders; • whether it is being implemented by industry; • whether odour issues are being resolved; • whether odour complaints are responded to in a timely fashion (set a goal for number of
hours); and • the quality of responses to complaints rather than number of complaints.
Recommendation 12: As part of an odour management program for the province and the GVRD, key measures of success could be developed for future evaluation of the program.

Reputation Resources Results Odour Management in British Columbia: RWDI AIR Inc Review and Recommendations W05-1108 Final Report - 156 - March 2005
6.0 BIBLIOGRAPHY
Alberta, Province of. 2002. Agricultural Operation Practices Act. Revised Statues of Alberta 2000 Chapter A-7.
ASTM (American Society for Testing and Materials). 2004. E679-04 Standard Practice for Determination of Odor and Taste Thresholds by a Forced Choice Ascending Concentration Series Method of Limits. Annual Book of Standards Volume 15.08.
AWMA (Air & Waste Management Association). 2002. Guidelines for Odor Sampling and Measurement by Dynamic Dilution Olfactometry. Submitted by the AWMA EE-6 Subcommittee on the Standardization of Odor Measurement to the ASTM E18 Sensory Committee.
Bates, D.V., and Caton, R.B. 2002. A Citizen’s Guide to Air Pollution. Second Edition.
Both, R., Sucker, K., Winneke, G., and E. Koch. 2004. Odour Intensity and Hedonic Tone – Important Parameters to Describe Odour Annoyance of Residents? Water Science & Technology 50: 83-92.
Both, R., Koch, E. North-Rhine-Westphalia State Environmental Agency. Odour Regulation in Germany – an improved system including odour intensity, hedonic tone and odour annoyance.
Both, R. Water Science & Technology Vol 44 No. 9 pp 119-126. 2001. Directive on odour in ambient air: an established system of odour measurement and odour regulation in Germany.
Bureau de Normalisation. 1986. AFNOR X-43-101 Method of the Measurement of the Odor of a Gaseous Effluent.
CEN (Comité Européen de Normalisation). 2003. EN 13725:2003 Air Quality – Determination of Odour Concentration by Dynamic Olfactometry.
Frechen, F.-B. 1997. Odour Measurement and Odour Policy in Germany. Department of Sanitary and Environmental Engineering, University of Kassel, Germany. Reprinted Kassel 2000. Presented in Sydney, Australia.

Reputation Resources Results Odour Management in British Columbia: RWDI AIR Inc Review and Recommendations W05-1108 Final Report - 157 - March 2005
Halton, Regional Municipality of. Ontario, Canada. 2004. Draft Guidelines for Implementing Official Plan. Policies of THE REGIONAL PLAN (year) – Livestock Facility Guidelines (Odour).
Heber, A., Lim, T., Ni, J., Grant, R., Sutton, A. Purdue University. 2000. Development of a Site-Specific Odour Impact Distance Guideline for Swine Production Systems.
Ireland EPA (Environmental Protection Agency). 2001. Environmental Research – R&D Report Series No.14. Odour Impacts and Odour Emission Control Measures for Intensive Agriculture, Final Report.
Mahin, T. Massachusetts Department of Environmental Protection. 2001. Comparison of Different Approaches Used to Regulate Odours Around the World. Presented at 1st IWA International Conference on Odour and VOCs. March 2001. Sydney, Australia.
McGinley, M.A., and J. Mann. 1998. European versus United States Odour / Odor Standards of Evaluation. Presented at the Water Environment Federation 71st Annual Conference.
McGinley, M.A. and C.M. McGinley. 2001. The New European Olfactometry Standard: Implementation, Experience, and Perspectives. Presented at the Air and Waste Management Association 2001 Annual Conference, Technical Program. June 2001. Orlando, Florida.
Miedema, H., Walpot, J., Vos, H., and C. Steunenberg. 2000. Exposure-annoyance relationships for odour from industrial sources. Atmospheric Environment 34: 2927-2936.
Netherlands Normalization Institute. 1995. NVN 2820 Air Quality, Sensory Odour Measurement using an Olfactometer.
NSW EPA (New South Wales Environmental Protection Authority, Australia). 2001a. Technical Notes – Draft Policy: Assessment and Management of Odour from Stationary Sources in NSW. January 2001.
NSW EPA (New South Wales Environmental Protection Authority, Australia). 2001b. Draft Policy: Assessment and Management of Odour from Stationary Sources in NSW. January 2001.
NSW EPA (New South Wales Environmental Protection Authority, Australia). 2001c. Approved Methods and Guidance – For the Modelling of Air Pollutants in New South Wales. August 2001.

Reputation Resources Results Odour Management in British Columbia: RWDI AIR Inc Review and Recommendations W05-1108 Final Report - 158 - March 2005
NSW EPA (New South Wales Environmental Protection Authority, Australia). 2001d. Approved Methods for the Sampling and Analysis of Air Pollutants in New South Wales. July 2001.
Ontario MAFRA (Ministry of Agriculture, Food and Rural Affairs), Canada. 1995a. Minimum Distance Separation I (MDS I)
Ontario MAFRA (Ministry of Agriculture, Food and Rural Affairs), Canada. 1995b. Minimum Distance Separation II (MDS II)
Ontario Ministry of Environment and Energy. 1996. Technical Bulletin – Odour Impacts – An Overview. STB Technical Bulletin No. EES-1.
Ontario MOE (Ministry of the Environment). 2004. Air Dispersion Modelling Guideline for Ontario – A Proposal for Consultation.
Queensland Department of Natural Resources and Mines, Australia. 2001. NRM Facts Land Series – Buffer Areas: Minimising Conflict between Agricultural and Residential Areas
Schauberger, G., Piringer, M., Petz, E. 2001. Separation Distance to Avoid Odour Nuisance due to Livestock Calculated by the Austrian Odour Dispersion Model (AODM). Agriculture, Ecosystems and Environment 87: 13-28
South Australia, Government of - Environment Protection Authority, Australia. 2000. Guidelines for Separation Distances – Consultation Draft.
Switzerland. 2004. Ordonnance sur la Protection de l’Air. Le Conseil federal Suisse.
Tasmania Department of Primary Industries, Water and Environment, Australia. 2001. Draft Environment Protection Policy (Air Quality) and Regulatory Impact Statement.
Utilities Kingston, Ontario, Canada. 2004. Ravensview WPCP Secondary Treatment and Capacity Upgrades Class EA Update – Technical Memo No. 7 Odour Management Strategy.
VDI (Verein Deutsche Ingenieure). 1986. VDI 3881 Olfactometry - Odour Threshold Determination. VDI-Handbuch Reinhaltung der Luft, Vol. 1.
VDI (Verein Deutsche Ingenieure). 1992. VDI 3882 Part 1. Olfactometry – Determination of Odour Intensity. VDI-Handbuch Reinhaltung der Luft, Vol. 1.

Reputation Resources Results Odour Management in British Columbia: RWDI AIR Inc Review and Recommendations W05-1108 Final Report - 159 - March 2005
VDI (Verein Deutsche Ingenieure). 1994. VDI 3882 Part 2. Olfactometry – Determination of Hedonic Odour Tone. VDI-Handbuch Reinhaltung der Luft, Vol. 1.
Warrington Borough Council, UK. 2004. Odour Management Strategy – Consultation. Spring 2004.
Wellington Regional Council, New Zealand. 2000. Regional Air Quality Management Plan for the Wellington Region.
Western Australia DEP (Department of Environmental Protection), Australia. 2002. Odour Methodology Guideline.
Western Australia EPA (Environmental Protection Authority), Australia. 2002. Guidance for the Assessment of Environmental Factors – Assessment of Odour Impacts from New Proposals, Final Guidance #47.
6.1 INTERNET
Alberta Environment, Canada. 2004 Facts at Your Fingertips – Alberta Ambient Air Quality Objectives. http://www3.gov.ab.ca/env/protenf/approvals/factsheets/ABAmbientAirQuality.pdf. Accessed January 2005.
BAAQMD (Bay Area Air Quality Management District), California, USA. 1999. BAAQMD CEQA Guidelines – Assessing the Air Quality Impacts of Projects and Plans. http://www.baaqmd.gov/pln/ceqa/ceqa_guide.pdf. Accessed January 2005.
BAAQMD (Bay Area Air Quality Management District), California, USA. 2001. Rules and Regulations. http://www.baaqmd.gov/dst/regulations/index.asp. Accessed January 2005.
Canadian Legal Information Institute (based on the texts made available on the Publications du Québec web site at http://www.publicationsduquebec.gouv.qc.ca/accueil.en.html). 2004. Guidelines for determining minimum distances to ensure odour management in rural areas. http://www.canlii.org/qc/laws/regu/p-41.1r.1.1/20050211/whole.html. Accessed January 2005.
CARB (California Air Resources Board), USA. Health and Safety Code – Division 26 Air Resources. Statute 41700. Prohibitive Discharges. http://www.arb.ca.gov/bluebook/bb04/ hea41700/hea_41700.htm. Accessed March 2005.

Reputation Resources Results Odour Management in British Columbia: RWDI AIR Inc Review and Recommendations W05-1108 Final Report - 160 - March 2005
Colorado Air Quality Control Commission, USA. 1999. Regulation No.2 Odor Emission. http://www.cdphe.state.co.us/op/regs/airregs/100104aqccodoremission.pdf. Access March 2005. Danish Environmental Protection Agency. 2002. Industrial Odour Control. http://www.mst.dk/ udgiv/publications/2002/87-7972-297-0/html/default_eng.htm. Accessed March 2005.
Northern Ireland DEP (Department of the Environment). 2003. Pollution Prevention and Control – Northern Ireland. Guidance for Operators on Odour Management at Intensive Livestock IPPC Installations. Version 1. http://www.ehsni.gov.uk/pubs/publications/ OdourGuide.pdf. Accessed January 2005.
Epstein, E., Freeman, B. 2004. Legal and Regulatory Aspects Related to Odors. WEF (Water Environment Association) Odors and Air Emissions 2004. http://www.wef.org/ applications/periodicals/. Accessed January 2005.
FIRB (Farm Industry Review Board). 2005. http://www.firb.gov.bc.ca/index.htm #Farm%20Industry%20Review%20Board. Accessed March 2005.
Germany. 2001. Technical Instruction on Air Quality Control – TA Luft http://www.havakalitesi.cevreorman.gov.tr/english/legislation/german.htm Accessed March 2005
Germany. 2003. Determination and Assessment of Odour in Ambient Air (Guideline on Odour in Ambient Air/GOAA). May 1998. Translation March 2003. http://www.lua.nrw.de/luft/ gerueche/GOAA_200303.pdf. Accessed January 2005.
Idaho. 2005. Idaho Statutes – Title 25, Animals, Chapter 38, Agriculture Odor Management Act. http://www3.state.id.us/idstat/TOC/25038KTOC.html. Accessed March 2005.
Idaho DEQ (Department of Environmental Quality). Air Quality: Odor Management. http://www.deq.state.id.us/air/prog_issues/pollutants/odors.cfm#Links. Accessed March 2005.
Idaho DEQ (Department of Environmental Quality). 2005. PM00-6: Policy for Responding to Odor Complaints. http://www.deq.state.id.us/rules/policies/pm00_6.cfm. Accessed March 2005.
InfoMil. Netherlands. 2003. Netherlands Emission Guidelines for Air. http://www.infomil.nl/aspx/get.aspx?xdl=/views/infomil/xdl/page&PosIdt=29288&ItmIdt=28598&SitIdt=111&VarIdt=46 Accessed March 2005.

Reputation Resources Results Odour Management in British Columbia: RWDI AIR Inc Review and Recommendations W05-1108 Final Report - 161 - March 2005
Iowa Department of Natural Resources, USA. 2005. Iowa DNR Master Matrix. http://www.iowaonline.state.ia.us/dnr/hogconfinement/. Accessed March 2005.
Jacobson, L., Schmidt, D., Wood, S. 2002. University of Minnesota, USA. OFFSET - Odor from Feedlots Setback Estimation Tool. http://www.extension.umn.edu/distribution/ livestocksystems/DI7680.html. Accessed March 2005.
Japan MOE (Ministry of Environment) 2003. Odor Index Regulation and Triangular Odor Bag Method. http://www.env.go.jp/en/lar/oder_index/all.pdf Accessed March 2005.
Japan MOE (Ministry of the Environment) 2005. Laws and Regulations - Control of Offensive Odor. http://www.env.go.jp/en/lar/regulation/odor.html. Accessed January 2005.
Kamigawara, K. 2005. Ministry of the Environment, Japan. Odor Regulation and Odor Measurement in Japan. http://www.env.go.jp/en/lar/odor_measure/02_1_2.pdf. Accessed January 2005.
King County Department of Natural Resources and Parks, Washington, USA. 2002. Waste Treatment Division. Odor and Corrosion Control Design Standards. fftp://dnr.metrokc.gov/WTD/odorcontrol/OdorStandards.pdf. Accessed February 2005.
King County Department of Natural Resources and Parks, Washington, USA. 2003. Odor Prevention Policy Recommendations – Regional Wastewater Services Plan Odor Control Strategy. http://dnr.metrokc.gov/wtd/odorcontrol/docs/OdorPrevention.pdf. Accessed March 2005.
MAFF (Ministry of Agriculture, Food and Fisheries), British Columbia, Canada. 2003. Farm Practices in BC Reference Guide. http://www.agf.gov.bc.ca/resmgmt/fppa/Refguide/intro.htm. Accessed March 2005.
MAFF (Ministry of Agriculture, Food and Fisheries), British Columbia, Canada. 2005. Strengthening Farming: Farm Practices Protection / Planning for Agriculture. http://www.agf.gov.bc.ca/resmgmt/sf/about.htm. Accessed March 2005.
Mahin, T. Massachusetts Department of Environmental Protection. Measurement and Regulation of Odors in the USA. http://www.env.go.jp/en/lar/odor_measure/02_1_4.pdf. Accessed January 2005.

Reputation Resources Results Odour Management in British Columbia: RWDI AIR Inc Review and Recommendations W05-1108 Final Report - 162 - March 2005
Mahin, T., Pope, R., McGinley, C. Water Environment Federation. 2000. When is a smell a nuisance? http://www.wef.org/applications/periodicals/. Accessed December 2004.
Manitoba Conservation, Canada. 2005. Ambient Air Quality Criteria Table. http://www.gov.mb.ca/conservation/airquality/aq-criteria/ambientair-table.html. Accessed March 2005.
McGinley, C., Mahin, T., Pope, R. St. Croix Sensory Inc./McGinley Associates. 2000. Elements of Successful Odor/Odour Laws. http://www.bae.ncsu.edu/programs/extension/ manure/ulo/odorlaws.pdf. Accessed March 2005.
McGinley, C. St. Croix Sensory Inc. 2000. Enforceable Permit Odor Limits. http://www.fivesenses.com/Documents/Library/34%20%20Enforceable%20Permit%20Odor%20Limits.pdf. Accessed March 2005.
National Association of State Departments of Agriculture. 2005. State Environmental Laws Affecting South Carolina Agriculture. http://www.nasda.org/nasda/nasda/Foundation/state/ SouthCarolina.pdf. Accessed March 2005.
New Zealand Ministry of the Environment. 2002. Review of Odour Management in New Zealand – Air Quality Technical Report No.24. http://www.mfe.govt.nz/publications/air/odour-tr-aug02.pdf. Accessed March 2005.
NYSDEC (New York State Department of Environmental Conservation). Rules and Regulations – Subpart 257-10 Ambient Air Quality Standard-Hydrogen Sulfide (H2S). http://www.dec.state.ny.us/website/regs/subpart257_10.html. Accessed February 2005.
Nova Scotia Agriculture and Fisheries, Nova Scotia, Canada. 1994. Odour Control Guidelines for Livestock Operators. http://www.gov.ns.ca/nsaf/rs/greenplan/waste/ odourfly/004.htm. Accessed January 2005.
Ontario Ministry of the Environment, Canada. 2001. Summary of Point of Impingement Guidelines, and Ambient Air Quality Criteria (AAQCs). http://www.ene.gov.on.ca/envision/gp/2424e.pdf. Accessed January 2005.
Ontario Ministry of the Environment, Canada. 1996. Guideline D-2 – Compatibility between Sewage Treatment and Sensitive Land Use. http://www.ene.gov.on.ca/envision/ gp/2294.htm. Accessed January 2005.

Reputation Resources Results Odour Management in British Columbia: RWDI AIR Inc Review and Recommendations W05-1108 Final Report - 163 - March 2005
Ontario Ministry of Agriculture and Food, Canada. 2003. Fact Sheet – Odour Control on Livestock and Poultry Farms. http://www.gov.on.ca/OMAFRA/english/ engineer/facts/03-111.htm. Accessed January 2005.
Ontario. 1990. Environmental Protection Act – R.S.O. 1990, Chapter E.19. http://www.e-laws.gov.on.ca/DBLaws/Statutes/English/90e19_e.htm. Accessed March 2005.
Osterberg, D., Melvin. S. Iowa State University and the University of Iowa Study Group. 2002. Iowa Concentrated Animal Feeding Operations Air Quality Study – Final Report. http://www.public-health.uiowa.edu/ehsrc/CAFOstudy/CAFO_1.pdf. Accessed March 2005.
Park, Sang Jin. Woosong University, Korea. 2003. The Regulation and Measurement of Odor in Korea. http://www.env.go.jp/en/lar/odor_measure/02_2.pdf. Accessed January 2005.
PSCAA (Puget Sound Clean Air Agency), Washington, USA. Regulation I. http://www.pscleanair.org/businfo/regulations.shtml#reg1. Accessed March 2005.
Queensland EPA (Environmental Protection Agency) Parks and Wildlife Service. 2004. Ecoaccess – Guideline – Odour Impact Assessment from Developments. http://www.epa.qld.gov.au/publications/p01344aa.pdf/Odour_impact_assessment_from_developments.pdf. Accessed March 2005.
Queensland DPI (Department of Primary Industries). 2001. Seperation Guidelines for Queensland Piggeries. http://www.dpi.qld.gov.au/environment/1093.html. Accessed December 2004.
US EPA (U.S. Environmental Protection Agency). 2004. Hudson River PCBs Superfund Site Quality of Life Performance Standards. http://www.epa.gov/hudson/quality_of_life_06_04/. Accessed March 2005.
Republic of South Africa. National Environmental Management: Air Quality Bill.
Sneath, R., Silsoe Research Institute. 2003. Quality Control of Olfactometry at SRI ad in Europe. http://www.env.go.jp/en/lar/odor_measure/02_2.pdf. Accessed January 2005.
South Australia EPA (Environmental Protection Agency). 1998. Guidelines for Establishment of Intensive Piggeries in South Australia. http://www.epa.sa.gov.au/pdfs/pigguide.pdf Accessed March 2005.
Reputation Resources Results Odour Management in British Columbia: RWDI AIR Inc Review and Recommendations W05-1108 Final Report - 164 - March 2005
South Australia EPA (Environmental Protection Agency). 2003. EPA Guidelines – Odour Assessment Using Odour Source Modelling. http://www.environment.sa.gov.au/epa/pdfs/guide_odour.pdf. Accessed January 2005.
South Coast Air Quality Management District, California, USA. 2004. Rule Book – Rule 102 – Definition of Terms. http://www.aqmd.gov/rules/download.html. Accessed January 2005.
SRF Counsulting Group Inc. 2004. A Review of National and International Odor Policy, Odor Measurement Technology and Public Administration. http://www.pca.state.mn.us/ publications/p-gen2-02.pdf. Accessed March 2005.
Sung Bong Yang, University of Ulsan, Korea. 2003. A Comparative Study on Odor Regulation in Japan and Korea. http://www.env.go.jp/en/lar/odor_measure/02_2.pdf. Accessed March 2005.
Texas Commission on Environmental Quality. 2005. Odor Complaint Investigation Procedures. http://www.tceq.state.tx.us/compliance/complaints/protocols/odor_ES7_OdourControl_04.pdf Accessed March 2005.
Ueno, H., Higuchi, M., Tatsuichi, S., Iwasaki, Y. 2003. A Comparative Study of Japanese and European Olfactometry Standards. http://www.env.go.jp/en/lar/odor_measure/02_2.pdf Accessed March 2005.
Van Harreveld, A. 2004. OdourNet. Odor Impact Assessment within the European IPPC Framework. WEF (Water Environment Association) Odors and Air Emissions 2004. http://www.wef.org/applications/periodicals/. Accessed January 2005.
Van Harreveld, A. OdourNet. Odor Regulation and the History of Odor Measurement in Europe. http://www.env.go.jp/en/lar/odor_measure/02_1_3.pdf. Accessed January 2005.
Welsh Assembly - Environment. Wales. Consultation on Proposals for the Statutory Control of Odour and Other Nuisance from Sewage Treatment Works. http://www.wales.gov.uk/ subienvironment/content/consultations/sewage/sour-imp-e.htm. Accessed March 2005.
Witherspoon, J., et al. 2004. Balancing Community Odor Control Demands with Innovation Odor Assessment and Control Strategies and Approaches. WEF/A&WMA Odors and Emissions 2004. http://www.wef.org/applications/periodicals/. Accessed January 2005.

Reputation Resources Results Odour Management in British Columbia: RWDI AIR Inc Review and Recommendations W05-1108 Final Report - 165 - March 2005
WRAP. 2002. Appendix One: Measurement of Odour at German Compost Plants. www.wrap.org.uk/document.rm?id=345. Accessed January 2005.
6.2 PERSONAL COMMUNICATIONS
Arnold, G. 2005. GVRD (Greater Vancouver Regional District). British Columbia, Canada. . Interviewed: February 14 and March 15, 2005.
Apgar, D. 2004. Air Quality Officer, King County Department of Natural Resources, Washingon, USA. Interviewed: February 17, 2005.
Both, R. 2005. Odour Specialist, LUA NRW (Landesumweltamt Nordrhein-Westfalen), Essen, Germany. Interviewed: March 8, 2005.
Falsetta, P. 2005. MAFF (Ministry of Agriculture, Food and Fisheries) British Columbia, Canada. Interviewed: March 14, 2005.
Fujita, H. 2005. Office of Odor, Noise and Vibration, Ministry of the Environment, Japan. Interviewed: February 25, 2005.
Harris, C. 2005. Air Quality Officer, South Australia Environment Protection Authority, Australia. Interviewed: February 22, 2005.
Hess, P. 2005. Deputy Air Pollution Control Officer, BAAQMD (Bay Area Air Quality Management District), California, USA. Interviewed: February 28, 2005.
Lawson, P. (Senior Air Policy Officer, Air Policy Section), Mattes, A. (Manager Air Technical Advisory Services Unit), Kanhoush, N. (Principal Policy and Programs Officer). 2005. Dept. of Environment and Conservation NSW, New South Wales, Australia. Interviewed: February 15, 2005.
Markland, H. 2005. Pollution Control Co-ordinator, Greater Wellington Regional Council, New Zealand. Interviewed: February 24, 2005.
Parrish, N. 2005. Supervisor Air & Noise, Ontario Ministry of Environment, Canada. Interviewed: February 21, 2005.
Peeters Weem, A. 2005. Information Officer, Infomil (Information Centre for the Environment), The Netherlands. Interviewed: March, 2005.

Reputation Resources Results Odour Management in British Columbia: RWDI AIR Inc Review and Recommendations W05-1108 Final Report - 166 - March 2005
Robbins, M. 2005. MAFF (Ministry of Agriculture, Food and Fisheries) British Columbia, Canada. Interviewed: March 14, 2005.
Vanderhoek, L. 2005. MWLAP. (Ministry of Water, Land and Air Protection), British Columbia, Canada. Interviewed: March 15, 2005.

Appendix A
Terms of Reference

Reputation Resources Results Odour Management in British Columbia: RWDI AIR Inc Review and Recommendations W05-1108 Final Report A - 1 March 2005
Background/Introduction:
The objectives of the work undertaken under this contract are to: • research and review odour management programs in other jurisdictions that have
established and successfully used ambient and/or emission odour criteria; and • recommend odour management approaches for the GVRD and the Ministry that would
be effective in British Columbia
The Contractor shall:
1. Conduct an initial conference call with Ministry, Greater Vancouver Regional District (GVRD) and Environment Canada staff to review terms of reference, schedule, and key milestones under this contract.
2. Conduct a jurisdictional/agency review of ambient standards/guidelines/objectives that include the following tasks: a) review odour management programs in other jurisdictions that have odour standards
(ambient and/or source) as part of their program; b) identify the ambient odour standard/guideline/objective used by each agency; c) identify whether the ambient odour standard is specific to operations such as but not
limited to agriculture, livestock, composting, animal processing, petroleum/chemical refining and handling, feed manufacturing, waste water treatment, coating/painting ...etc and setting (urban, rural, mixed);
d) summarize the information in tabular format (odour criteria matrix) that includes the jurisdiction, ambient criteria, averaging time, land use, source type and other related categories/comments;
e) identify how the ambient standard is used (planning, response, enforcement, warnings, guidance);
f) describe any approved sampling/analytical methods that are used to assess compliance with the standard;
g) describe odour management programs that do not rely on a specific standard (such as Ontario and Alberta);
h) in consultation with the Ministry, • select six jurisdictions that have ambient standards as part of their management
program for further focussed interviews (those that have such standards in permits would be of particular interest); and
• develop an standard set of interview questions, in order to determine the degree of success (i.e. reduced number of complaints, lower staff time on odour issues, greater

Reputation Resources Results Odour Management in British Columbia: RWDI AIR Inc Review and Recommendations W05-1108 Final Report A - 2 March 2005
engagement of other agencies, programs initiated and self managed by sector stakeholders, standards in permits enforced, etc.) of their odour management program.
3. Conduct a jurisdictional/agency review of emission standards / guidelines / objectives that include the following tasks: a) review odour management programs in other jurisdictions as per Task 2 a), identify the
odour emission standard/guideline/objective used by the agency; b) identify whether the odour emission standard is process or sector specific (such as but
not limited to agriculture, livestock, composting, animal processing, petroleum/chemical refining and handling, feed manufacturing, waste water treatment, coating/painting. etc.) and whether it is tied to a specific odour control technology—Best Available Control Technology;
c) summarize the information in a tabular matrix format; d) determine how these emission standards are used (in permits, as guidance, if Best
Available Control Technology is specified, for enforcement only, for planning); e) describe the estimation methods used to determine odour emission source strengths; f) describe any approved sampling/analytical methods that are used to assess compliance
with the standard; g) describe the odour planning/avoidance components to these programs and how the
odour emission standard is used for planning/avoidance; h) following on Task 2 g), in consultation with the Ministry:
• select six jurisdictions (that may or may not be the same jurisdictions selected under Task 2g) that have source standards as part of their management program for further focussed interviews (those that have such standards in permits would be of particular interest); and
• develop an standard set of interview questions, in order to determine the degree of success (i.e. reduced number of complaints, lower staff time on odour issues, greater engagement of other agencies, programs initiated and self managed by sector stakeholders, standards in permits enforced, etc.) of their odour management program.
4. Provide recommendations for regulatory agencies that would have be effective within the British Columbia regulatory framework by conducting the following tasks: a) for background review the following British Columbian documents,
• draft document produced by the GVRD on Odour Management Strategy; and • the Ministry of Water, Land and Air Protection compost facility requirements
guideline.

Reputation Resources Results Odour Management in British Columbia: RWDI AIR Inc Review and Recommendations W05-1108 Final Report A - 3 March 2005
b) based on this review and the research conducted of other jurisdictions under Tasks 2 and 3 where ambient and/or emissions standards/guidelines have been successfully applied, recommend approaches for British Columbia regulatory agencies that would offer a good chance of success given the regulatory agency context, history on odour management in the province, the limited staff resources to deal with odour issues, and the feasibility to implement such measures;
c) tailor the recommendations as they apply to certain categories of odour sources (for example, differences in odour problem resolution between pulp mill and auto body shop);
d) determine whether it is possible to have no odour standards and still have an effective odour management program.
5. Based on the information gathered under Tasks 2 and 3, provide a more detailed description of the various components of odour management programs that have been successfully applied to the agricultural and industrial sectors. These would include successful programs that either do or do not have any sector specific odour (ambient or emission) standards.
6. Based on the survey information gathered under Tasks 2 and 3, provide brief description of odour management programs where ambient and/or emission standards have been successfully applied and explain the rationale that other jurisdictions have used to establish them (i.e. standards based on nuisance/health, etc.).
7. Conduct a review to determine when an odour becomes a problem through the following tasks: a) determine when an odour becomes a problem based on telephone interviews with
selected jurisdictions and reviews of their related rules/regulation to provide insight into the “triggers” for the initiation of actions to resolve complaints;
b) perform literature search to determine the existence of studies that consider the issue of odour problem definition;
c) contact select Ministry staff to obtain information relative to odour complaints and for anecdotal experience with odour assessment and abatement;
d) review the GVRD air quality complaint database and interview GVRD officials regarding their experience with odour problems.
8. Provide information on how an odour and/or emission standard is established by conducting the following tasks:

Reputation Resources Results Odour Management in British Columbia: RWDI AIR Inc Review and Recommendations W05-1108 Final Report A - 4 March 2005
a) based on the survey information gathered under Tasks 2 and 3, summarize the procedures for each jurisdiction surveyed and provide a comparison matrix for ready reference;
b) include public and stakeholder consultation procedures (if they exist), as well as mechanisms for formal authoritative establishment of such standards; and
c) where possible obtain specific case information in which odour standards have actually been adopted.
9. Based on the reviews conducted under Tasks 2 and 3, report on the experience and procedures used in other jurisdictions regarding the efficacy of odour avoidance/planning technical tools and other approaches (for example, dispersion models, education, industry preventative steps, municipal planner involvement, stakeholder involvement).

Appendix B
Supplemental Information for Japan
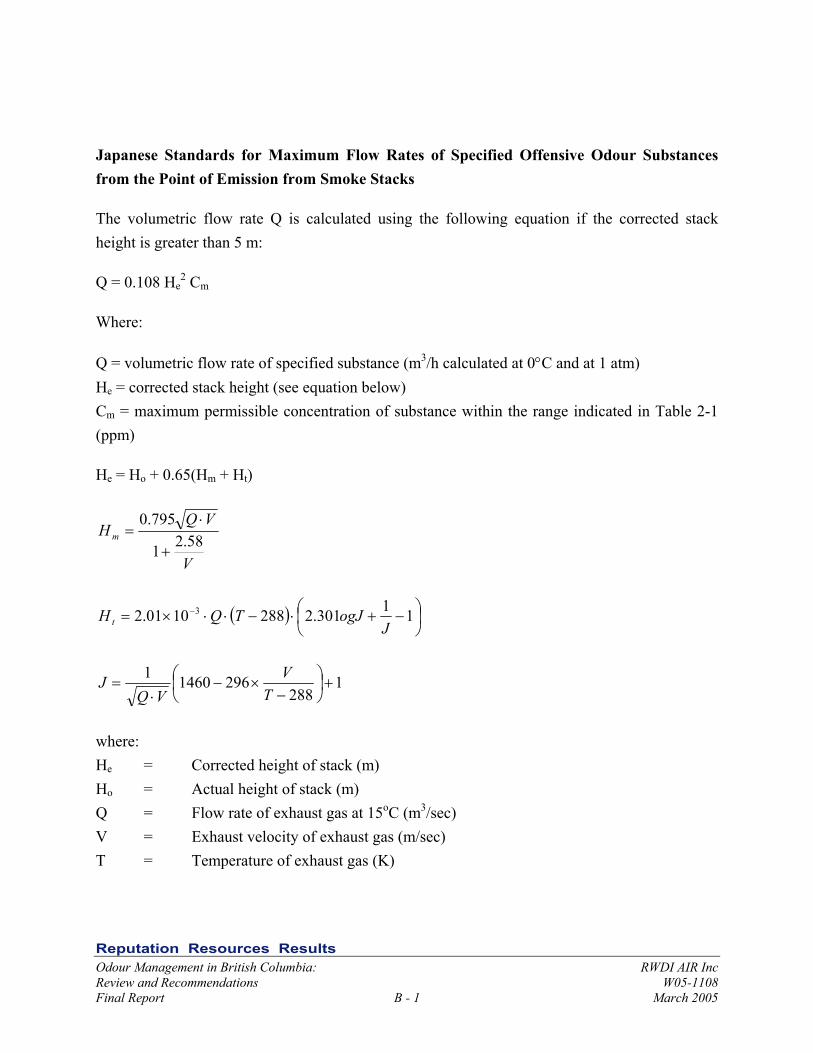
Reputation Resources Results Odour Management in British Columbia: RWDI AIR Inc Review and Recommendations W05-1108 Final Report B - 1 March 2005
Japanese Standards for Maximum Flow Rates of Specified Offensive Odour Substances from the Point of Emission from Smoke Stacks
The volumetric flow rate Q is calculated using the following equation if the corrected stack height is greater than 5 m:
Q = 0.108 He2 Cm
Where:
Q = volumetric flow rate of specified substance (m3/h calculated at 0°C and at 1 atm) He = corrected stack height (see equation below) Cm = maximum permissible concentration of substance within the range indicated in Table 2-1 (ppm)
He = Ho + 0.65(Hm + Ht)
V
VQH m 58.21
795.0
+
⋅=
( )
−+⋅−⋅⋅×= − 11301.22881001.2 3
JogJTQH t
1288
29614601+
−×−
⋅=
TV
VQJ
where: He = Corrected height of stack (m) Ho = Actual height of stack (m) Q = Flow rate of exhaust gas at 15oC (m3/sec) V = Exhaust velocity of exhaust gas (m/sec) T = Temperature of exhaust gas (K)

Appendix C
Texas Commission on Environmental Quality Odour Complaint Investigation Procedures

January 3, 2005
Texas Commission on Environmental QualityODOR COMPLAINT INVESTIGATION PROCEDURES
The following updates and supersedes the previous version of this document dated November13, 2002, as well as all other guidance related to odor complaint investigation.
This narrative accompanies the attached flow chart which describes the prescribed process.
DETECTION OF ODOR AND INITIAL RESPONSE
Detection
An odor may be detected by a citizen and reported to a Texas Commission on EnvironmentalQuality (TCEQ) regional office as a citizen complaint, or detected by an investigator without acitizen complaint as the initiating factor. In either case, the regional office should promptlymake a determination regarding the appropriate action based on the guidelines below. If aninvestigation is appropriate, the investigation should be conducted according to the proceduresspecified in this document and the attached flow chart.
Initial Response
If an odor is detected, and adverse health effects are alleged by a complainant, or suspected bythe investigator, it should be prioritized for immediate response, and an investigation should beconducted as soon as possible, regardless of the manner of detection. The definition of "alleged"or "suspected" health effects should remain very broad in this situation, to ensure thatappropriate actions are taken any time there is a potential imminent threat to public health andsafety.
If an odor is detected by either a complainant or an investigator, and adverse health effects arenot alleged or suspected, an investigation should be conducted to determine the cause of the odor(or alleged odor) according to the incident prioritization procedures established by the FieldOperations Division.
INVESTIGATION/DATA GATHERING
Following is a brief discussion of the information which should be collected and evaluated bythe regional staff in a potential nuisance odor situation. This discussion is not intended to restrictthe collection of any information which the investigator considers appropriate or necessary toevaluate the citizen concerns.
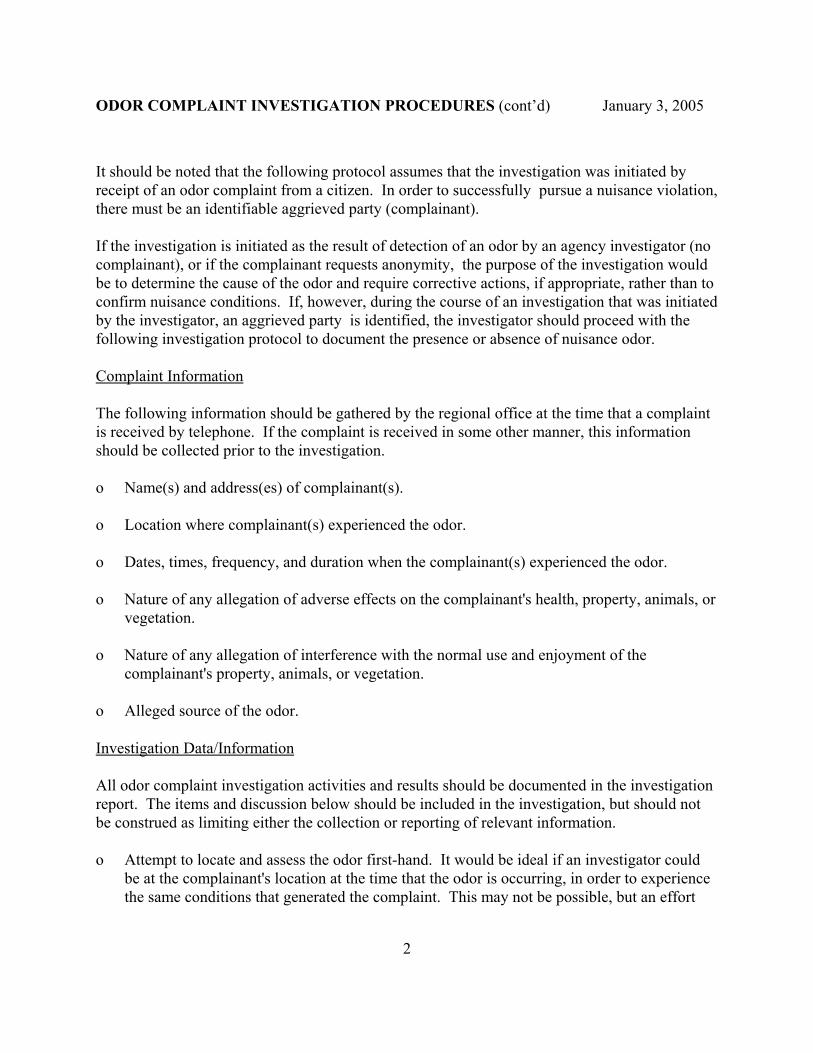
ODOR COMPLAINT INVESTIGATION PROCEDURES (cont’d) January 3, 2005
2
It should be noted that the following protocol assumes that the investigation was initiated byreceipt of an odor complaint from a citizen. In order to successfully pursue a nuisance violation,there must be an identifiable aggrieved party (complainant). If the investigation is initiated as the result of detection of an odor by an agency investigator (nocomplainant), or if the complainant requests anonymity, the purpose of the investigation wouldbe to determine the cause of the odor and require corrective actions, if appropriate, rather than toconfirm nuisance conditions. If, however, during the course of an investigation that was initiatedby the investigator, an aggrieved party is identified, the investigator should proceed with thefollowing investigation protocol to document the presence or absence of nuisance odor.
Complaint Information
The following information should be gathered by the regional office at the time that a complaintis received by telephone. If the complaint is received in some other manner, this informationshould be collected prior to the investigation.
o Name(s) and address(es) of complainant(s).
o Location where complainant(s) experienced the odor.
o Dates, times, frequency, and duration when the complainant(s) experienced the odor.
o Nature of any allegation of adverse effects on the complainant's health, property, animals, orvegetation.
o Nature of any allegation of interference with the normal use and enjoyment of thecomplainant's property, animals, or vegetation.
o Alleged source of the odor.
Investigation Data/Information
All odor complaint investigation activities and results should be documented in the investigationreport. The items and discussion below should be included in the investigation, but should notbe construed as limiting either the collection or reporting of relevant information.
o Attempt to locate and assess the odor first-hand. It would be ideal if an investigator couldbe at the complainant's location at the time that the odor is occurring, in order to experiencethe same conditions that generated the complaint. This may not be possible, but an effort
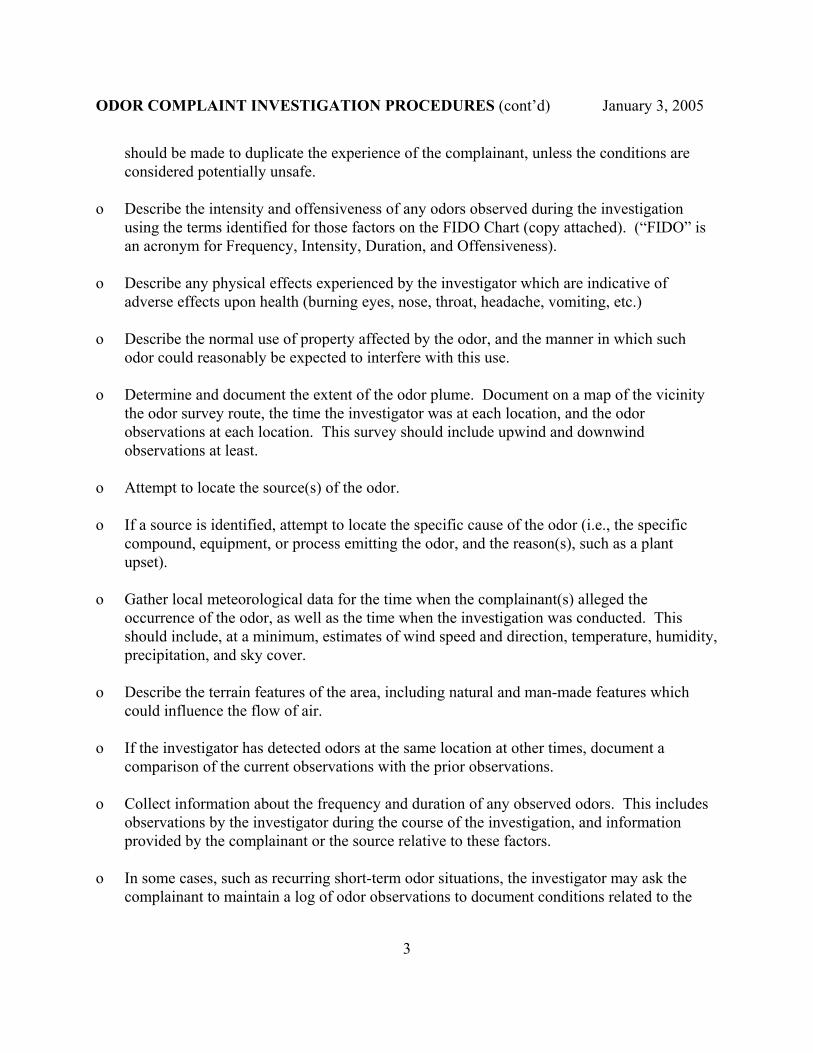
ODOR COMPLAINT INVESTIGATION PROCEDURES (cont’d) January 3, 2005
3
should be made to duplicate the experience of the complainant, unless the conditions areconsidered potentially unsafe.
o Describe the intensity and offensiveness of any odors observed during the investigationusing the terms identified for those factors on the FIDO Chart (copy attached). (“FIDO” isan acronym for Frequency, Intensity, Duration, and Offensiveness).
o Describe any physical effects experienced by the investigator which are indicative ofadverse effects upon health (burning eyes, nose, throat, headache, vomiting, etc.)
o Describe the normal use of property affected by the odor, and the manner in which suchodor could reasonably be expected to interfere with this use.
o Determine and document the extent of the odor plume. Document on a map of the vicinitythe odor survey route, the time the investigator was at each location, and the odorobservations at each location. This survey should include upwind and downwindobservations at least.
o Attempt to locate the source(s) of the odor.
o If a source is identified, attempt to locate the specific cause of the odor (i.e., the specificcompound, equipment, or process emitting the odor, and the reason(s), such as a plantupset).
o Gather local meteorological data for the time when the complainant(s) alleged theoccurrence of the odor, as well as the time when the investigation was conducted. Thisshould include, at a minimum, estimates of wind speed and direction, temperature, humidity,precipitation, and sky cover.
o Describe the terrain features of the area, including natural and man-made features whichcould influence the flow of air.
o If the investigator has detected odors at the same location at other times, document acomparison of the current observations with the prior observations.
o Collect information about the frequency and duration of any observed odors. This includesobservations by the investigator during the course of the investigation, and informationprovided by the complainant or the source relative to these factors.
o In some cases, such as recurring short-term odor situations, the investigator may ask thecomplainant to maintain a log of odor observations to document conditions related to the

ODOR COMPLAINT INVESTIGATION PROCEDURES (cont’d) January 3, 2005
4
odors experienced. The complainant should be asked to utilize the same terminology asused on the FIDO Chart.
This log can be used to validate or invalidate complaints in conjunction with the otherevidence of the case. It would not be used as the sole basis for issuance of a notice ofviolation. The attached "Odor Log" format should be used in all such situations.
o The investigator may conduct interviews of other citizens in the area surrounding thecomplainant's location with the intention of gathering information or evidence to assist in adetermination of the validity of the complaint. Caution should be taken, however, to ensurethat this information-gathering procedure not be construed as "soliciting" additionalcomplaints.
INVESTIGATION FOLLOWUP
Upon completion of the investigation, the information collected should be reviewed to determinewhether a nuisance condition is confirmed. Based on statutory and regulatory language, anuisance odor exists if an odor has been emitted in such concentration and duration as to a) beinjurious to or adversely affect human health, welfare, animal life, vegetation, or property, or b)interfere with normal use and enjoyment of animal life, vegetation, or property. In the first case,if any adverse effect or injury is documented, the source should be required to take measures tomitigate the odor, and the regional office should initiate appropriate enforcement action againstthe responsible party. If such adverse effects or injury are not confirmed, the FIDO Chart wouldbe used to evaluate the frequency, intensity, duration, and offensiveness of the odor, and todetermine whether the evidence in the case constitutes a nuisance violation.
Adverse Impacts
If the preponderance of the evidence collected during the course of the investigation (includingdiscussions with the complainant and observations by the investigator) confirms the presence ofodors in such concentration and duration as to be injurious to or adversely affect human health,welfare, animal life, vegetation, or property, remedial action should be immediately required tomitigate the odors, and appropriate enforcement action should be initiated according to agencyenforcement procedures. In this situation, these actions should be taken regardless of whetherthe incident was complaint-generated or detected by the investigator.
Interference with Normal Use and Enjoyment of Animal Life, Vegetation, or Property
If the preponderance of the evidence does not confirm the presence of odors in suchconcentration and duration as to be injurious to or adversely affect human health, welfare, animal

ODOR COMPLAINT INVESTIGATION PROCEDURES (cont’d) January 3, 2005
5
life, vegetation, or property, the investigator should evaluate all the evidence collected during thecourse of the investigation using the FIDO Chart. This chart is used to determine whether anuisance odor violation should be issued based on whether the frequency, intensity, duration, andoffensiveness of observed and documented odors combine to cause interference with the normaluse and enjoyment of animal life, vegetation, or property.
Each of the four tables on the FIDO Chart represents a level of offensiveness (Highly Offensive,Offensive, Unpleasant, and Not Unpleasant). The intensity of the observed odor is documentedusing the legend on the right side of the chart, with “VS” representing Very Strong odors, “S”for Strong, “M” for Moderate, “L” for Light, and “VL” for Very Light. The frequency andduration are then plotted on the horizontal and vertical axes of the appropriate table. If the odorsituation is at least as intense as the colored block in which it is plotted, it is considered anuisance odor. If the plot falls outside the colored area of the table (NA), the odor does notrepresent a nuisance. Intensity and offensiveness are two distinct factors which should be evaluated separately. Offensiveness is the enate character of the odor which can be distinguished even in very lightconcentrations. Intensity is the relative measure of the perceived concentration. Investigatorslearn to determine relative intensity through experience and/or training. The FIDO Chartincorporates these two distinct factors along with frequency and duration into one integratedtool.
If application of the FIDO Chart confirms a nuisance odor (confirms odors in such concentrationand duration as to interfere with the normal use and enjoyment of animal life, vegetation, orproperty), the regional office should require the responsible party to correct the problem, issue anuisance odor violation, and initiate appropriate enforcement action based on agencyenforcement procedures.
EXAMPLE APPLICATION OF THE FIDO CHART DURING ODOR COMPLAINTINVESTIGATIONS
Following are brief discussions of example nuisance odor complaint investigations, and use ofthe FIDO Chart to evaluate whether or not nuisance conditions should be cited.
Example 1–Rendering Plant Odor
Scenario 1A citizen complaint is received alleging “horrible odors” from a nearby rendering plant thatoccur almost every morning about 10:00 a.m., and last for about an hour. The investigatordiscusses this with the complainant and arranges to conduct an investigation at 10:00 a.m thefollowing morning. Upon arrival at the complainant’s residence, the investigator notices the

ODOR COMPLAINT INVESTIGATION PROCEDURES (cont’d) January 3, 2005
6
Figure 1
odor which is consistent with improperly treated wastewater from a rendering plant. Furtherinvestigation confirms that the rendering plant less than 1/4 mile away is the source of the odor. By 11:00 a.m., the odor has almost completely gone away.
Using the FIDO chart, the investigator characterizes the odor as Highly Offensive, as indicatedin the “Odor Characterization Examples” on the back of the chart, and determines that theintensity is Strong. Based on testimony from the complainant, and on-site observation, theinvestigator determines that the odor only lasts for about an hour. The FIDO chart indicates thata Highly Offensive odor lasting for about an hour in a single occurrence must be at least VeryStrong to be considered a nuisance (see Figure 1). No violation is confirmed at this time.
However, based on testimony from the complainant that this strong odor occurs almost everyday, usually about the same time, the investigator goes to the rendering plant and discusses thissituation with the operations manager. It is determined that a process which is conducted atabout this time every day is responsible for the odor.
Given all the evidence gathered in this investigation, it is determined that a Strong, HighlyOffensive odor is likely to affect the complainant on almost a daily basis under the plant’scurrent operating conditions. Review of the FIDO Chart shows that a Strong, Highly Offensiveodor which lasts for about an hour only has to occur as often as quarterly to be considered anuisance and justify a Notice of Violation. The Chart also shows that a Highly Offensive odoronly has to have a Very Light intensity to be considered a nuisance if it occurs for an hour on adaily basis (see Figure 2).

ODOR COMPLAINT INVESTIGATION PROCEDURES (cont’d) January 3, 2005
7
Figure 2
The investigator therefore concludes that this citizen has been subjected to a nuisance odor, anddetermines that a Notice of Violation is appropriate.
Scenario 2If, during the course of the investigation, it is determined that the Strong, Highly Offensive odoroccurs every two or three weeks, sometimes for only 10 or 15 minutes, sometimes for up to anhour, the investigator would need to “read between the lines” on the chart to estimate where thefrequency and duration of this odor should be placed. In this case, the chart indicates that aStrong, Highly Offensive odor occurring for 10 minutes on a monthly basis would constitute anuisance, or that it would only have to occur for one minute at a time on a weekly basis to beconsidered a nuisance. Since this odor has been documented to occur for between 10 minutesand an hour, and occurs more often than monthly, but less often than weekly, it would bereasonable to conclude that the odor is a nuisance.
Example 2 – Auto Body Shop Paint Odor
Scenario 1A complainant alleges “paint odors” from a nearby auto body shop are so strong and unpleasantthat he can’t go in the back yard to play with his kids. He says that normally the odors from thebody shop are not a problem, but that since about 8:00 a.m. on this day, they are terrible. Aninvestigator arrives to conduct an odor complaint investigation at 11:00 a.m.
The investigator determines that organic solvent odors from the painting operation, categorizedas Offensive according to the “Odor Characterization Examples” on the back of the FIDO Chart,are impacting the complainant’s property with a Strong intensity. The odors continue for one

ODOR COMPLAINT INVESTIGATION PROCEDURES (cont’d) January 3, 2005
8
Figure 3
more hour, until 12:00 p.m.
During the investigation at the facility, it is determined that a fork lift operator had accidentallyknocked off the paint spray booth stack the night before and when painting began that morningthe solvents were being emitted at ground level without the dilution afforded by the tall stack. At 12:00 p.m., the plant manager agrees to discontinue the painting process until the stack isrepaired.
Application of the FIDO Chart for this one-time odor event (Frequency = Single Occurrence)indicates that an odor characterized as Offensive, with intensity characterized as Strong, with aduration of four hours, does not represent a nuisance. The FIDO Chart indicates that a singleoccurrence of an Offensive odor for four hours must be at least Very Strong to constitute anuisance violation (see Figure 3 on next page).
Scenario 2The complainant states that the odors from the nearby auto body shop are not real strong, but thatthey happen just about every day, and usually last for about an hour. The odor is annoyingbecause it is so frequent. When the investigator arrives, there are no odors present.
Investigation at the facility reveals that most of the work at the shop does not involve painting,and that they “batch” each day’s painting, resulting in perhaps an hour or so of painting eachday. Several investigations are conducted over the next few weeks. During two of theseinvestigations painting operations are being conducted, and Light to Moderate odors areconfirmed at the complainant’s property for an hour or a little more.
Application of the FIDO Chart indicates that odors characterized as Offensive, with Lightintensity, which impact the complainant for approximately one hour (duration) on a daily basis(frequency), do represent a nuisance violation (see Figure 4).

ODOR COMPLAINT INVESTIGATION PROCEDURES (cont’d) January 3, 2005
9
Figure 4
Scenario 3The complainant states that strong paint odors from the auto body shop aere experiencedoccasionally throughout the day about one day a week. They usually only last about 10 or 15
minutes at a time, but that on the days when they do occur, they become very annoying. Whenthe investigator arrives to conduct an investigation, there are no odors observed, but thecomplainant indicates that the wind has shifted and the odors have disappeared. An odor surveyconfirms Strong, Offensive odors from the spray painting operation at a point downwind of thefacility at the same distance as the complainant’s house.
Investigation of meteorological conditions indicates that the complainant’s residence is notdownwind of the body shop according to prevailing wind direction, but that when the complaintwas made, the residence was downwind of the facility. It also confirms that, typically, thecomplainant’s house is downwind of the facility about one day each week.
Investigation at the facility reveals that painting occurs off and on during every work day andthat there is only a short paint spray booth stack, thus limiting dispersion. The investigatorconcludes that Strong, Offensive odors are likely to impact the complainant any time paintingoperations are underway and the residence is downwind of the facility.
Review of the information collected during this investigation, and application of the FIDO Chart,indicates that the offensive painting odors are impacting the complainant’s residence for 10 to 15minute periods throughout any day when the orientation of the wind puts the residencedownwind of the body shop. The frequency of this occurrence would be plotted as Weekly,since the wind direction causes the odors to impact the complainant’s residence approximatelyweekly. The duration is at least 10 minutes (likely more) on these days. The FIDO Chart (SeeFigure 5) indicates that an Offensive odor with a Strong intensity on a weekly basis for 10

ODOR COMPLAINT INVESTIGATION PROCEDURES (cont’d) January 3, 2005
10
Figure 5
minutes or more is considered a nuisance. A notice of violation is therefore issued.
Example 3 – Landfill Odor
Scenario 1A complainant alleges “sickeningly sweet” garbage odors from a nearby landfill that aresometimes so bad he cannot spend any time in his yard. He adds that sometimes it is so bad hecannot open the windows of his house since the smell would come inside. The odors tend to beworse when the weather is quite cool and calm, especially in the late evening and early morninghours.
Using this information, the investigator determines that an investigation should be conductedafter-hours. The investigator arrives in the complainant’s neighborhood at 6:00 a.m. on a cooland calm morning, when the odors should be at their worst. No odors are noted at thecomplainant’s address but during a drive through the neighborhood, the investigator notesgarbage odors of Moderate intensity in various parts of the neighborhood until about 7:00 a.m. The odors diminish rapidly after the sun has risen and the winds have picked up.
Using the FIDO Chart, the investigator characterized the odor as Offensive, as indicated in the“Odor Characterization Examples” on the back of the chart. Plotting it as a Single Occurrencefor one hour, no nuisance is confirmed (See Figure 6). The chart indicates that for a SingleOccurrence, an odor must be at least Very Strong for four hours to be considered a nuisance, sono violation is documented. However, the chart also indicates that a Moderate odor occurringfor one hour on a weekly basis would be considered a nuisance. The investigator would need toconduct additional investigations and collect additional information regarding the frequency andduration of these odors to make a final determination.

ODOR COMPLAINT INVESTIGATION PROCEDURES (cont’d) January 3, 2005
11
Figure 6
Scenario 2During the course of the investigation, the investigator determines the intensity of the odor isLight and that it lasts approximately 10 minutes. Three followup investigations during the nextthree weeks result in:
1. No odors detected.2. An odor of light intensity that lasts for less than 10 minutes. 3. An odor of very light intensity that lasts for about two hours.
The conclusion is that the odors occur for between 10 minutes and 2 hours at a Light to VeryLight intensity on a weekly basis (approximately).
Evaluation of the FIDO Chart indicates that an offensive odor occurring weekly for one hourwould have to be at least a Moderate intensity to be considered a nuisance (See Figure 7). For anoffensive odor at a Light intensity, the odor must have a duration of at least four hours on aweekly basis, or one hour on a daily basis to be considered a nuisance. In this case, althoughsome odor is frequently observed, the intensity and duration are not great enough to confirm thata nuisance condition exists.

ODOR COMPLAINT INVESTIGATION PROCEDURES (cont’d) January 3, 2005
12
Figure 7
Scenario 3A complaint is received alleging that landfill odor is occurring in the neighborhood again, as itdoes on a regular basis. Review of the file indicates that such complaints have been received andinvestigated 16 times in the previous 12 month period, at least once per month. Further reviewindicates that investigators have confirmed Moderate to Strong odors occurring forapproximately one hour on four different occasions. Review of complaint records, includingodor logs kept by complainants, provides documentation that Moderate to Strong landfill odorsare occurring in this neighborhood on about a monthly basis for 30 minutes to an hour at a time.
Using the FIDO Chart for Offensive odors, it is determined that an odor occurring on a monthlybasis for one hour at a time must have at least a Strong intensity to be considered a nuisance. The same odor with a Moderate intensity would have to occur on a weekly basis to beconsidered a nuisance (See Figure 8). Since the documented odors are only Moderate to Strong(not consistently Strong), and their duration is usually less than one hour, a nuisance violation isnot confirmed.

ODOR COMPLAINT INVESTIGATION PROCEDURES (cont’d) January 3, 2005
13
Figure 8

ODOR COMPLAINT INVESTIGATION PROCEDURESFIDO CHART
ODORS CHARACTERIZED AS HIGHLY OFFENSIVE
F R E Q U E N C YSingle
Occurrence Quarterly Monthly Weekly Daily INTENSITYLEGEND
DURAT ION
1 minute NA NA VS S M
10 minutes NA VS S M L VS1 hour VS S M L VL Very
Strong4 hours S M L VL VL
12 hours+ M L VL VL VL S
ODORS CHARACTERIZED AS OFFENSIVEStrong
F R E Q U E N C Y
Single MOccurrence Quarterly Monthly Weekly Daily
ModerateDURAT ION
1 minute NA NA NA VS S
10 minutes NA NA VS S M L
1 hour NA VS S M L Light4 hours VS S M L VL
12 hours+ S M L VL VL VL
ODORS CHARACTERIZED AS UNPLEASANT Very Light
F R E Q U E N C Y
SingleOccurrence Quarterly Monthly Weekly Daily
DURAT ION
1 minute NA NA NA NA VS
10 minutes NA NA NA VS S
1 hour NA NA VS S M
4 hours NA VS S M L
12 hours+ VS S M L VL
ODORS CHARACTERIZED AS NOT UNPLEASANT
F R E Q U E N C Y
SingleOccurrence Quarterly Monthly Weekly Daily
DURAT ION
1 minute NA NA NA NA NA
10 minutes NA NA NA NA NA
1 hour NA NA NA NA VS
4 hours NA NA NA VS S12 hours+ NA NA VS S M

ODOR COMPLAINT INVESTIGATION PROCEDURES (cont’d) January 3, 2005ODOR CHARACTERIZATION EXAMPLES
Highly Offensive
Blood Drying OperationsUndigested or Untreated
Sewage Treatment PrimarySludge
Rendering Plant Processesand Wastewater
Decaying Animal/fishHide ProcessingRancid GreaseAcroleinLandfill Gas and LeachateH2S
Offensive
Paper Mill Black LiquorLandfill Garbage/wasteAFO Lagoon Maintenance,
Waste and WastewaterHandling
Decaying Silage/CompostingTypical Grease Trap OdorRubber/Plastic/Tire BurningOrganic AcidsAldehydesAcrylatesSeptic SystemsOrganic Solvents (Oil-based)
Painting
Unpleasant
Well Digested or Chemically-Treated Sludge
AFO Operation under Best Mgmt. Practices
Waste-activated SludgeProcesses
Water-based Painting StyreneGasoline, Diesel FuelDiesel ExhaustAsphalt OdorsDomestic Waste BurningBurned Coffee/foodAmmoniaChlorineBrush/wood Burning
Not Unpleasant
Ketones, Esters, AlcoholsFresh-cut Grass or HayNormal Coffee RoastingNormal Food PreparationBakeryPerfumeSpice PackagingWinery
DETERMINING FREQUENCY/DURATION
Plant ProcessesConstant, seasonal, intermittent (e.g. reactor top opened), upsetcondition, etc.Process and environmental controlsBest Management PracticesSampling/CEM data
WeatherWind rose from source to receptorTemperature variation affecting intensity vs climate dataWind speed day, night, summer, winterCAMS Station/NWS data
TerrainLow areas/channels/valleys where odors can funnelChanges that could affect local wind patterns
Complainant InformationStatements as to frequency, duration, intensity and characterStatements as to effects - how have odors interfered with normaluse and enjoyment of propertyLogs - time, effects, source operations, weather conditionsKnowledge of source operations - times, processesNeighbor corroborationGuest corroboration
HOW TO USE THE FIDO CHART
Each of the four tables on this FIDO Chart represents a level of offensiveness (Highly Offensive, Offensive, Unpleasant, and NotUnpleasant). The intensity of the observed odor is documented using the legend on the right side of the chart, with “VS” representingVery Strong odors, “S” for Strong, “M” for Moderate, “L” for Light, and “VL” for Very Light. The frequency and duration are thenplotted on the horizontal and vertical axes of the appropriate table. If the odor situation is at least as intense as the colored block inwhich it is plotted for the corresponding duration and frequency, it is considered a nuisance odor. If the plot falls outside the coloredarea of the table (NA), the odor does not represent a nuisance.
Use checklist to document the following:1. Characterize the odor to determine which offensiveness table to use (Not Unpleasant to Highly Offensive)2. Assess intensity of odor (Very Light to Very Strong)3. Determine the total duration of the odor(s) (1 minute to 24 hours)4. Evaluate the frequency of odor occurrence (Single Occurrence to Daily)5. Using Steps 1-4 above including previous investigation results, identify the block that corresponds with the information
collected in order to determine if a nuisance condition exists.

ODOR LOG
DATE
STARTTIME
WIND
SPEED/DIRECTION
WEATHER CONDITIONS
CLOUD COVER, TEMP,ETC.
INTENSITY
VS - S - M - L -VL
OFFENSIVENESS
HO - O - UNP - NOT UNP
DURATION
HOURS/MINUTES
SYMPTOMS/EFFECTS
POSSIBLE SOURCE
COMMENTS:
NAME: ______________________________ ADDRESS: ______________________________
______________________________
PAGE ______ OF _______

17

ODOR COMPLAINT INVESTIGATION PROCEDURES (cont’d) January 3, 2005
18

Appendix D
Transcripts from Interviews

W05-1108 February 21, 2005 Page 1
Jurisdiction: Ontario, Canada Person Interviewed: Neil Parrish, Supervisor Air & Noise, Ontario Ministry of Environment Date: February 21, 2005
- Neil is observing our project from afar - Ontario has challenge for developing approaches to odour – similar to GVRD - When will report be available? could he see a draft? KEP to discuss with Steve Sakiyama
o Degree to which interested in sharing info to cousin regulator? 1. Our understanding of your odour management program is (based on Proposed Air
Dispersion Modelling Guideline for Ontario (2004)): - Ontario has odour limits in µg/m3 for individual pollutants - There is also an odour limit of 1 OU/m3 (10 minute averaging period) at the most impacted
Sensitive Receptor resulting from the operation of the facility that is applied on a case-by-case basis
- There are also minimum distance separation limits (reciprocal – for agriculture & industry, including sewage treatment plants) MDS I for development applications (min distance to existing farms) and MDS II for livestock operations
a) Is this correct?
• MDS limits… land use planning guidelines for industry • Province expects municipalities to take care of land use planning.
b) Is there anything that you would add?
• “adverse effect” nuisance law in legislation – Section 14 – find on e-laws (?) • Thou shalt not cause an adverse effect broadly worded legislation that includes “loss
of enjoyment” • Can order them to do something/ charge them/ take to court • When issue approvals (Neil’s job) they try to prevent or alleviate adverse effects. • Have included in certificates how facilities will perform relative to objective criteria –
case-by-case circumstances • Ministry has used in some cases an objective limit in odour units • 1 ou/m3 at a sensitive receptor based on dispersion modeling – 10 minute averaging
period • Not policy applied to every facility but only in situations where there is legitimate
concern of adverse effect. • Don’t look for odours everywhere but certain types of facilities: rendering, compost,
asphalt • Have follow-up testing to enforce • Section 9 also includes term of “adverse effect” for approvals of new facilities – not set
out in policy therefore precedent based.

W05-1108 February 21, 2005 Page 2
2. How long ago was your odour management program implemented? • Do not have an odour management program in place per se • Have been dealing with odour issues for as long as have had “adverse effect” written in
legislation since 1972 • In the last decade have started using modelled odour results in specific certificates. 3. What was the rationale or justification for establishing your program? (e.g., nuisance
avoidance, reducing complaints, concern for human health, etc.) • Often become aware of “adverse effects” through complaints • Obliged by regulatory duties to respond and to prevent/alleviate adverse effects 4. In your program, when does odour become a problem? Are there specific triggers, such as
odour standards or number of complaints? • No specific trigger in terms of complaints • Case-by-case assessment if legitimate concern of adverse effect. • Depends on nature of incident • Escalate response based on number of incidences 5. Does your program include public or stakeholder consultation? Do you have procedures for
such consultation? • Yes for the individual case-by-case circumstances with respect to issuing orders, some of
which may be posted for public comment or around litigation or appeal of approval decision
• public can have a role in litigation • No general education program 6. Does your program include ambient odour standards or odour emission standards? - ambient standards for individual pollutants (point of impingement for varying averaging
periods) and odour mixtures (1 OU/m3 – 10 minute avg?)
2,500 µg/m3 30 minutes POI*; standard Acetic acid 2,500 µg/m3 24 hours AAQC**
48,000 µg/m3 30 minutes POI; standard Acetone 48,000 µg/m3 24 hours AAQC
625 µg/m3 30 minutes POI, guideline 1,167 µg/m3 1 hour AAQC
Acetophenone
850 µg/m3 10 minutes AAQC 56,000 µg/m3 30 minutes POI, standard
Ontarioe
Acetylene 56,000 µg/m3 24 hours AAQC

W05-1108 February 21, 2005 Page 3
Ammonia 3,600 µg/m3 24 hours POI, standard# Amyl acetate, iso- 53,200 µg/m3 24 hours AAQC Amyl acetate, n- 53,200 µg/m3 24 hours AAQC
60 µg/m3 30 minutes POI, guideline Biphenyl 60 µg/m3 1 hour AAQC
1,940 µg/m3 30 minutes POI, guideline 655 µg/m3 24 hours AAQC
Butanol, iso-
2,640 µg/m3 10 minutes AAQC 2,278 µg/m3 30 minutes POI, guideline 770 µg/m3 24 hours AAQC
Butabol, n-
3,100 µg/m3 10 minutes AAQC 735 µg/m3 30 minutes POI, guideline 248 µg/m3 24 hours AAQC
Butyl acetate, n-
1,000 µg/m3 10 minutes AAQC 330 µg/m3 30 minutes POI, standard Carbon disulphide 330 µg/m3 24 hours AAQC 300 µg/m3 30 minutes Interim#,
standard# Chlorine
230 µg/m3 10 minutes AAQC Decane, n 60,000 µg/m3 1 hour AAQC
990 µg/m3 30 minutes POI, guideline 330 µg/m3 24 hours AAQC
Diacetone alcohol
1,350 µg/m3 10 minutes AAQC 800 µg/m3 30 minutes POI, guideline 273 µg/m3 24 hours AAQC
Diethylene glycol monoethyl ether
1,100 µg/m3 10 minutes AAQC 800 µg/m3 30 minutes POI, guideline Diethylene glycol monomethyl ether
1,200 µg/m3 24 hours AAQC 470 µg/m3 30 minutes POI, guideline Diisobutyl ketone 649 µg/m3 10 minutes AAQC
Dimethyl amine 1,840 µg/m3 1 hour AAQC 40 µg/m3 30 minutes POI, standard Dimethyl disulphide 40 µg/m3 1 hour AAQC
2,100 µg/m3 30 minutes POI, guideline Dimethyl ether 2,100 µg/m3 24 hours AAQC
30 µg/m3 30 minutes POI, standard Dimethyl sulphide 30 µg/m3 1 hour AAQC
19,000 µg/m3 30 minutes POI, guideline Ethanol (ethyl alcohol) 19,000 µg/m3 1 hour AAQC 19,000 µg/m3 30 minutes POI, standard Ethyl acetate 19,000 µg/m3 1 hour AAQC
4.5 µg/m3 30 minutes POI, standard Ethyl acrylate 4.5 µg/m3 1 hour AAQC
Ethyl benzene 1,900 µg/m3 10 minutes AAQC 7,000 µg/m3 30 minutes Interim#,
standard# Ethyl ether
950 µg/m3 10 minutes AAQC 600 µg/m3 30 minutes POI, guideline Ethyl hexanol, 2- 600 µg/m3 1 hour AAQC 147 µg/m3 30 minutes POI, guideline 50 µg/m3 24 hours AAQC
Ethyl-3-ethoxy propionate
200 µg/m3 10 minutes AAQC 350 µg/m3 30 minutes POI, guideline
Ethylene glycol butyl ether (Butyl cellosolve) 500 µg/m3 10 minutes AAQC

W05-1108 February 21, 2005 Page 4
500 µg/m3 30 minutes POI, guideline Ethylene glycol butyl ether acetate (But.cell.ace) 700 µg/m3 10 minutes AAQC
800 µg/m3 30 minutes POI, guideline Ethylene glycol ethyl ether (Cellosolve) 1,100 µg/m3 10 minutes AAQC
220 µg/m3 30 minutes POI, guideline Ehtylene glycol ethyl ether acetate (Cell.ace) 300 µg/m3 10 minutes AAQC Formaldehyde 65 µg/m3 30 minutes POI, standard
1,000 µg/m3 30 minutes POI, standard Furfural 1,000 µg/m3 1 hour AAQC
30 µg/m3 30 minutes POI, standard Hydrogen sulphide 30 µg/m3 1 hour (A) AAQC
1,220 µg/m3 30 minutes POI, guideline 412 µg/m3 24 hours AAQC
Isobutyl acetate
1,660 µg/m3 10 minutes AAQC Isopropyl ether 220 µg/m3 30 minutes POI, guideline
1,470 µg/m3 30 minutes POI, guideline 500 µg/m3 24 hours AAQC
Isopropyl acetate
2,000 µg/m3 10-minutes AAQC Isopropyl benzene 100 µg/m3 30 minutes POI, standard
20 µg/m3 30 minutes POI, standard Mercaptans (as Methyl mercaptan) –total 20 µg/m3 1 hour (A) AAQC
2,000 µg/m3 30 minutes POI, guideline Methacrylic acid 2,000 µg/m3 24 hours AAQC
4 µg/m3 30 minutes POI, standard Methyl acrylate 4 µg/m3 1 hour AAQC
1,200 µg/m3 30 minutes POI, standard Methyl isobutyl ketone 1,200 µg/m3 24 hours AAQC
Methyl mercapto aniline UD 860 µg/m3 30 minutes POI, standard Methyl methacrylate 860 µg/m3 24 hours AAQC
Methyl tert-butyl ether 2,200 µg/m3 30 minutes POI, guideline 460 µg/m3 30 minutes POI 160 µg/m3 24 hours AAQC
Methyl-2-hexanone, 5-
630 µg/m3 1 hour AAQC Milk Powder 20 µg/m3 24 hours AAQC
3,500 µg/m3 1 hour AAQC Monochlorobenzene 4,500 µg/m3 10 minutes AAQC
25 µg/m3 30 minutes POI, standard Monomethyl amine 25 µg/m3 24 hours AAQC 36 µg/m3 30 minutes POI, guideline Napthalene 50 µg/m3 10 minutes AAQC
45,400 µg/m3 30 minutes POI, guideline 15,300 µg/m3 24 hours AAQC
Octane
61,800 µg/m3 10-minutes AAQC 24,000 µg/m3 30 minutes POI, guideline Propanol, iso-(Isopropyl alcohol,
Isopropanol) 24.000 µg/m3 24 hours AAQC 7 µg/m3 30 minutes POI, guideline
2.5 µg/m3 24 hours AAQC Propionaldehyde
10 µg/m3 10 minutes AAQC 100 µg/m3 30 minutes POI, guideline Propionic acid 100 µg/m3 1 hour AAQC 100 µg/m3 30 minutes POI, guideline
Propionic anhydride (as Propionic acid) 100 µg/m3 1 hour AAQC

W05-1108 February 21, 2005 Page 5
Propyl acetate, n- 900 µg/m3 30 minutes POI, guideline 2,400 µg/m3 30 minutes POI, standard Propylene dichloride 2,400 µg/m3 24 hours AAQC
89,000 µg/m3 30 minutes POI, guideline 30,000 µg/m3 24 hours AAQC
Propylene glycol methyl ether
121,000 µg/m3 10 minutes AAQC 5,000 µg/m3 30 minutes POI, guideline Propylene glycol monomethyl ether 5,000 µg/m3 24 hours AAQC
60 µg/m3 30 minutes POI, guideline Pyridine 80 µg/m3 10 minutes AAQC
Styrene 400 µg/m3 30 minutes POI, standard 93,000 µg/m3 30 minutes POI, standard Tetrahydrofuran 93,000 µg/m3 24 hours AAQC 2,000 µg/m3 30 minutes POI, standard Toluene 2,000 µg/m3 24 hours AAQC
40 µg/m3 30 minutes POI, guideline Total reduced sulphur (as hydrogen sulphide) 40 µg/m3 1 hour AAQC
0.5 µg/m3 30 minutes POI, guideline Trimethyl amine 0.5 µg/m3 1 hour AAQC 500 µg/m3 30 minutes POI, guideline Trimethylbenzene, 1,2,4-
1,000 µg/m3 24 hours AAQC 2,300 µg/m3 30 minutes POI, standard
Xylenes 2,300 µg/m3 24 hours AAQC
Minimum distance separation for sewage treatment plants: JURISDICTION SEPARATION
DISTANCE (m)
LAND USE SOURCE TYPE USE (PERMIT,
GUIDANCE ETC.)
OTHER COMMENTS
100 (recommended)
Sewage treatment plant with capacity equal to or less than 500 m3/d
A separation distance of less than 100 m may be permitted
100 (minimum);
150 (recommended)
Sewage treatment plant with capacity greater than 500 m3/d but less than 25,000 m3/d
Ontariob
>150
Sensitive land uses, such as residential neighbourhoods
Sewage treatment plant with capacity greater than 25,000 m3/d
Certificate of Approval for new and expanding sewage treatment facilities
These plants will be dealt with on an individual basis; a separation distance of greater than 150 m may be required
MDS I and MDS II are calculated for individual facilities based on type of livestock, number of animals etc. using standard forms and tables 7. If they have ambient or emissions standards:
a) how were their standards established? • Have standards, guidelines and criteria

W05-1108 February 21, 2005 Page 6
• Some were established a long time ago so Neil not sure how they were established • Did some Ontario-based research some time ago • Are looking at updating standards • Are considering writing an odour policy • 1 ou/m3 is based on a10-minute average be cause of model limitation
o Not at property line but rather at receptor o 1 ou/m3 consistently used
8. Are there approved sampling or analytical methods? (If yes, ask for documentation.) • No, they don’t dictate EU or ASME protocol • They require odour panel to identify source testing protocol (Tedlar bag etc) 9. Are there standard or approved methods for estimating emissions? (If yes, ask for
documentation.) • measure emission rate:
o Take grab sample then send to odour panel to determine the odour emission rate o No standard/ approved method for estimating emissions. o Review estimates on a case-by-case basis often they will take measurements
from a similar facility. 10. Do you use any odour avoidance or land use planning tools such as dispersion modelling,
education, industry preventative steps, municipal planner involvement, stakeholder involvement?
• 10-minute average concentrations are calculated by modelling one-hour average
concentrations using 5 years of met data and AERMOD-Prime (or other approved model) and converting to a 10-minute average using the power law with an exponent of 0.28.
• Land use planning not directly linked to dispersion modeling • Approval of industrial facilities/ sources not directly linked to land use planning. 11. Would you describe your odour management program as successful? • Don’t know – don’t have a program yet. • Not enough of a track record • Use of objective tools speeds up fixing existing problems • Orders, prosecutions, requirements for changes to approvals for modifications
a) If yes: Do you have a measure for success?
• No i) If yes: (Gain as much information as possible if they do and ask for them to send you reference material.)

W05-1108 February 21, 2005 Page 7
ii) If no: How do you define successful?
b) If no: (Similar questions to “If yes” can be asked) 12. Do you track how many odour complaints you receive each year? • Not certain if specifically track odour complaints • All complaints are logged not sure if searchable for odour
a) If yes: Has the number of odour complaints decreased since you implemented or
made a change to your odour management plan? 13. Has the workload of staff who deal with odour issues and complaints been reduced since you
implemented your odour management program? • Has possibly increased workload • Approvals workload has increased (reviewing modeling etc) • Hope that workload of enforcement has decreased • Encroachment and changing public perspectives regarding what is acceptable 14. Are there any particular facilities with a chronic odour problem in your jurisdiction?
a) If yes: - Could you provide examples of such facilities? • Rendering, compost, asphalt and fibreboard plant • Don’t have a list – those a re good examples • Only pursue obvious sources - Has your odour management program resulted in a reduction in the problem or number of
complaints related to those facilities?
• Yes see page 6. • Takes a lot of work – concerted effort. • General provisions result in more work whereas specific policy might reduce workload 15. Does your odour program include a component related to educating the public and other
stakeholders regarding odour issues? • No
a) If yes: Has this resulted in an increase or a decrease in the number of odour
complaints that you receive? 16. Has your odour management program engaged the public and other stakeholders? • On a case-by-case basis for litigation • Proposed dispersion model guideline was released for consultation

W05-1108 February 21, 2005 Page 8
• Need to develop policy position on odour 17. Has it increased public awareness of odour issues? • n/a 18. Are senior politicians engaged?
• Not sure • Is it a high profile issue? • A lot of comments were received on odour in response to proposed model guidelines • Comments will be considered very seriously by Ministry.

W05-1108 February 28, 2005 Page 1
Jurisdiction: Bay Area Air Quality Management District, California, USA Person Interviewed: Peter Hess, Deputy Air Pollution Control Officer Date: February 28, 2005
1. Our understanding of your odour management program is…
- Based on the CEQA Guidelines dated December, 1999: - “The District is the agency primarily responsible for assuring that national and State
ambient air quality standards are attained and maintained in the San Francisco Bay Area.
- The District’s jurisdiction includes all of Alameda, Contra Costa, Marin, Napa, San Francisco, San Mateo and Santa Clara Counties and parts of Sonoma and Solano Counties
- Odour is treated in a similar fashion to other air pollutants in the sense that the potential impacts are assessed and must be mitigated
- Land use whereby a sensitive receptor is close to a source of odourous emissions is to be avoided
- Buffer zones are used to mitigate such problems - Any project with the potential to frequently expose members of the public to
objectionable odours would be deemed to have a significant impact. - Reciprocity: Analysis of potential odour impacts should be conducted for both of the
following situations: 1) sources of odourous emissions locating near existing receptors, and 2) receptors locating near existing odour sources.
- There are project screening trigger levels for a range of potential odour sources – most are 1 mile but for petroleum refineries it is 2 miles
- For a project locating near an existing source of odours, the project should be identified as having a significant odour impact if it is proposed for a site that is closer to an existing odour source than any location where there has been:
o more than one confirmed complaint per year averaged over a three year period, or
o three unconfirmed complaints per year averaged over a three year period. - For projects locating near a source of odours where there is currently no nearby
development and for odour sources locating near existing recptors, the determination of significance should be based on the distance and frequency at which odour complaints from the public have occurred in the vicinity of a similar facility.”
a) Is this correct?
• The CEQA guidelines are very important because they deal with encroachment of
homes on the industrial beltway. But these guidelines are just one element of our odour program.
b) Is odour mentioned in state legislation? Is it in the form of a nuisance law?
• Yes. Regulation 1-301 states that:

W05-1108 February 28, 2005 Page 2
• “No person shall discharge from any source whatsoever such quantities of air contaminants or other material which cause injury, detriment, nuisance or annoyance to any considerable number of persons or the public; or which endangers the comfort, repose, health or safety of any such persons or the public, or which causes, or has a natural tendency to cause, injury or damage to business or property. For purposes of this section, three or more violation notices validly issued in a 30 day period to a facility for public nuisance shall give rise to a rebuttable presumption that the violations resulted from negligent conduct.”
• The definition of air contaminant includes odors. • Also, Regulation 7 Odorous Substances places general limitations on odorous
substances and specific emission limitations on certain odorous compounds. Rule 1, Sulphur Dioxide, and Rule 2, Hydrogen Sulfide, of Regulation 9, Inorganic Gaseous Pollutants contain additional limits on H2S and SO2.
c) Is there anything that you would add?
• Buffer zones are also used for a new facility where there are existing homes. The
nuisance standard is applied or 5 D/T to determine whether buffer zone is large enough to prevent odours occurring at residences.
• The nuisance law (Regulation 1-301) is used the most. It has been litigated very nicely. The complaint has to be confirmed by an inspector. The complainant identifies the odour in the presence of an inspector. Alternatively, hospital reports can be used to validate the complaint.
• When a complaint occurs the following steps are taken: 1) BAAQMD responds by sending an inspector 2) the inspector validates the complaint 3) they talk to the complainant 4) they talk to the operator to encourage them to implement voluntary
measures 5) if that doesn’t work they can issue a violation notice, which includes a
penalty and a fine. The fines escalate depending on the number of people affected
6) if that doesn’t work then a court order can be issued to force the operator to comply (civil system)
7) if that doesn’t work the BAAQMD can prosecute in the criminal courts (there are lawyers on staff)
• The best tool to prevent odours is good land use planning.
2. How long ago was your odour management program implemented?
• H2S and SO2 regulations were adopted in 1978. • Regulation 7 dates back to 1976
3. What was the rationale or justification for establishing your program? (e.g., nuisance
avoidance, reducing complaints, concern for human health, etc.)

W05-1108 February 28, 2005 Page 3
• avoidance of nuisance and potential health impacts. Doctors have testified in court
that repetitive assault by odours can result in a health impact. 4. In your program, when does odour become a problem? Are there specific triggers, such as
odour standards or number of complaints? 10 complaints?
• No. 5 complaints. • Less than 5 complaints in one day = private nuisance • 5 or more complaints in one day = public nuisance • Less than 5 complaints but documented health impacts = public nuisance. • Limitations of Regulation 7 are applicable when the Air Pollution Control Officer
(APCO) receives odour complaints from 10 or more complainants within a 90-day period. The limits of Regulation remain effective until no citizen complaints have been received by the APCO for 1 year. The limits become applicable again when APCO receives odor complaints from 5 or more complainants within a 90-day period.
5. Does your program include public or stakeholder consultation? Do you have procedures for
such consultation? (If yes, ask for documentation.)
• Stakeholder consultation was conducted a long time ago before creating the current regulations.
6. Does your program include ambient odour standards or odour emission standards?
• There are General Emission Limits in terms of Dilution Rate (is this equivalent to dilutions to threshold D/T?) as a function of emission release height (Table I of Regulation 7) Yes.
• There are maximum allowable emission concentrations in ppm for dimethylsulphide, ammonia, mercaptans, phenolic compounds and trimethyl amine, as a function of source type (Type A = point source and Type B = area of volume source, such as roof vent) – see Table II of Regulation 7
• There are odour-based ground-level concentration limits for H2S (Regulation 9, Rule 2)
• There are odour-based ground-level concentration limits and emission limits for SO2 (Regulation 9, Rule 1)
• There is an ambient odour limit of 5 D/T at the fenceline, applied after at least 10 complaints within a 90-day period
7. If they have ambient or emissions standards:
a) how were their standards established?
• - the person in charge of the BAAQMD odour program when the regulations were created was a toxicologist. His research on odours and reactions to odours is the basis of the regulations.

W05-1108 February 28, 2005 Page 4
b) how important are the standards to the program? (i.e., would the program be
successful without them)
• general odour nuisance law and associated good case law have been more effective than the individual standards for different chemicals
c) How are these standards used? (e.g., planning, response, enforcement, warnings,
guidance, BACT, etc.)
• emission limits may get written into a permit to operate • BAAQMD has a staff of 350 people. There are over 100 inspectors and field
personnel during the week and there are always staff on-call on weekends and evenings.
• there is a toll-free complaint hotline (1-800-334-ODOR) • BAAQMD has authority over a 7,000 square mile area • they respond to every complaint. The more complaints there are the faster someone
will be dispatched • they have the authority to require monitoring
8. Are there approved sampling or analytical methods? (If yes, ask for documentation.)
• Yes. See Regulation 7-600 and the Manual of Procedures on the website 9. Are there standard or approved methods for estimating emissions? (If yes, ask for
documentation.)
• BAAQMD maintains an emission inventory of all permitted facilities that includes all the stack parameters required to run a dispersion model
• this inventory is used as a source of emission information for new facilities 10. Do you use any odour avoidance or land use planning tools such as dispersion modelling,
education, industry preventative steps, municipal planner involvement, stakeholder involvement?
• dispersion modelling • buffer zones • work closely with municipal and regional land planners – are involved in CEQA
process • developers know to come speak to BAAQMD because they require pre-construction
authorization (Regulation 2, Rule 1) 11. Would you describe your odour management program as successful?
• Yes.

W05-1108 February 28, 2005 Page 5
a) If yes: Do you have a measure for success?
• The number of odour complaints. 12. Do you track how many odour complaints you receive each year?
• Yes.
a) If yes: Has the number of odour complaints decreased since you implemented or made a change to your odour management plan?
• Yes. The number of complaints is much less than before. In fact, odour is no longer
the highest priority issue in the district. 13. Has the workload of staff who deal with odour issues and complaints been reduced since you
implemented your odour management program?
• Yes. In fact, they have been able to divert staff to controlling criteria pollutant emissions.
14. Are there any particular facilities with a chronic odour problem in your jurisdiction?
a) If yes: - Could you provide examples of such facilities?
• “Common sources of odours include wastewater treatment plants, landfills, composting facilities, refineries and chemical plants.”
• Also rendering plants • The main problem today is solvent substitution. In an effort to limit photochemical
smog production, regulations have been put into force that require reductions in VOCs in solvents. VOCs have been substituted with more reactive but also more aromatic chemicals with the unintended consequence of causing odour issues.
• Also starting to have an increase in odour issues with sewage treatment plants with old equipment that is no longer working well.
- Has your odour management program resulted in a reduction in the problem or number
of complaints related to those facilities?
• Rendering plants were a terrible problem in the past but changes have been made so that they now have closed air systems with the vents going to chemical scrubbers so they no longer receive many odour complaints.
• With the application of good abatement technology, refineries and wastewater treatment plants are now the source of far fewer odour complaints.
15. Does your odour program include a component related to educating the public and other
stakeholders regarding odour issues?

W05-1108 February 28, 2005 Page 6
• Yes. Have staff who give lectures to children, community groups, develop brochures etc.
a) If yes: Has this resulted in an increase or a decrease in the number of odour
complaints that you receive?
• Yes it has decreased the number of odour complaints 16. Has your odour management program engaged the public and other stakeholders?
• Yes. 17. Has it increased public awareness of odour issues?
• Yes. 18. Are senior politicians engaged?
• Absolutely. Constituents call them to complain and they in turn call BAAQMD.
However, such calls are few and far between these days.

W05-1108 February 17, 2005 Page 1
Jurisdiction: King County, Washingon, USA Person Interviewed: Dirk Apgar, King County Department of Natural Resources and Parks, Wastewater Treatment Division Date: February 17, 2005
1. Our understanding of your odour management program is that it is specific to
wastewater treatment facilities in King County. The focus is on odour prevention not just odour control. There are 6 recommended policies: - retrofit existing facilities in a phased manner - phase of odour prevention by implementing the tasks that generate the greatest
improvements first – cost/benefit - new facilities should have odour control systems that are best in the country for
facilities of their size - design standards will be developed - a comprehensive monitoring program will be developed that includes neighbour
surveys and tracking of odour complaints & responses - new odour prevention & measurement technologies will be assessed and tested
(i.e., continuous improvement) a) Is this correct?
• Correct – specific to Wastewater Treatment Plants (WWTP). Focus on odour
prevention, not just odour control. • Also solid waste transfer facilities that have odour issues but are not aware of
odour policy.
b) Is there anything that you would add? • Department of Natural Resources - Wholesaler of Waste Water Treatment
services to 26 facilities they are the operator and regulator of utility. o Held to this by ordinance of King County council in 2003 o Dept. Natural Resources – under PSCAA (regulates all air pollution
sources within four counties) – under Dept. of Ecology then EPA
2. How long ago was your odour management program implemented? (Recommendations document is dated March 2003)
• Less formal program in place for last 15yrs. • New policy (March 2003) formalized what they were already doing – portions of
it have been ongoing for at least 15yrs odour complaint response – odour control systems.
3. What was the rationale or justification for establishing your program? (e.g.,
nuisance avoidance, reducing complaints, concern for human health, etc.) • Real driver is to avoid being a nuisance. • Only 60 – 65 complaints a year.

W05-1108 February 17, 2005 Page 2
4. In your program, when does odour become a problem? Are there specific triggers, such as odour standards or number of complaints?
• King County considers an odour complaint a serious event and has listed odour
complaint telephone hotline numbers in area phonebooks under King County Department of Natural Resources and Parks – WTD.
• Personnel are available to respond to odour issues 24 hours a day. The odour hotlines connect directly to treatment plant main control offices where complaints are logged and the even is documented.
• Personnel are dispatched to the location identified by the complainant to investigate within two hours of receiving the complaint. The goals of the investigation are to identify the odour source, repair odour control equipment if necessary and maintain a neighbourly relationship with the community. If the originator of the complaint desires, they are notified of the investigation findings.
• Treat complaints very seriously • Complaint – based issue • Get very few complaints • Investigate within two hours if odour complaint occurs immediately but not if “3
days ago I perceived an odour” 5. Does your program include public or stakeholder consultation? Do you have
procedures for such consultation? (If yes, ask for documentation.) • The WTD is actively informing and educating the public about the services it
provides while protecting public health and the environment. • Planning is currently underway for King County WTD’s odour prevention-
specific webpage. • The annual Department of Natural Resources and Parks Water Quality and Near-
Facility-Neighbour Surveys are conducted to assess public sentiments about King County’s wastewater treatment facilities and nuisance odour impacts.
• These surveys will continue to be used to assess the effectiveness of Community Relations Unit, to determine whether additional work is required, and as an odour prevention program measurement of success.
• Community relations group that does near neighbour surveys – that include questions that are not odour related.

W05-1108 February 17, 2005 Page 3
6. Does your program include ambient odour standards or odour emission standards? Odour Prevention Level Characteristics
Odour Prevention Level Defining Characteristic High/New Plant a High/Existing Plant
Retrofit b Medium Low
Gases Captured from Odourous Processes Capable of Causing Nuisance Impacts
All All Most Some
Best Management Practices Identified and Followed
Yes Yes Partial No
Odour Dilutions Threshold c,d
0-3 e 0-3 e 3-5 f 5-20 e 20 – 50 e
Frequency of Impact (Hours per Year)
<50 <100 <100 <100 <100
a) Best in the country for new facilities b) Best in the country for existing facilities c) Odour intensity above background sources due to wastewater facility emissions d) Maximum allowable operating range e) Routine operating range f) Non-routine operating range
• Odour D/T criteria are used for design purposes and are assessed as the maximum
ground-level concentration within the study area, which is usually limited to about 1 mile from the plant
• D/T useless in the field is difficult to measure • Have agreements with City of Seattle that does hold them to 3 D/T for a specific
facility as ambient impact level at property boundary measurements/enforcement is based on H2S: they accept equivalent H2S concentration
• PSCAA has ambient odour criteria o Subjective o Dirk will send web link
7. If they have ambient or emissions standards:
a) how were their standards established? • Ambient – based on standards at other facilities in the county see table 2.
b) how important are the standards to the program? (i.e., would the program be successful without them)
• Very important whenever designing a system new or retrofit what they are
striving towards.
W05-1108 February 17, 2005 Page 4
c) How are these standards used? (e.g., planning, response, enforcement,
warnings, guidance, BACT, etc.) • Design purposes 8. Are there approved sampling or analytical methods? (If yes, ask for documentation.) • have approved sampling method for H2S but not odour • Use olfactometry to determine odour intensity and character • Send samples to lab – Saint Croix • Sampling on 5 – 10 year frequency based on necessity. 9. Are there standard or approved methods for estimating emissions? (If yes, ask for
documentation.) • Did a large study of a plant to improve it • Took samples from aeration basins and stacks to get a handle on emission rates
and gc/ms to get an idea of chemicals. • apply those measured emissions to other facilities – average and peak emission
rates • ties in with frequency of impact (see Table 1) – don’t design to be protective of
peak emissions 100% of the time. 10. Do you use any odour avoidance or land use planning tools such as dispersion
modelling, education, industry preventative steps, municipal planner involvement, stakeholder involvement?
- based on recommendations document it sounds like odour impact assessments using dispersion modelling are required • Dispersion modelling using ISC – Prime to assess odour impact of facility • Public education – community relations group, plant tours. • No real discussion with land use planners • Population density is such that there are no alternatives to odour control • New, large treatment plants have to almost guarantee no odour anytime.
o Assume that a resident could be really close by. o By the time the plume leaves the property boundary it would be odourless. o Very tough to meet o Would not recommend making those promises
11. Would you describe your odour management program as successful? • Yes
a) If yes: Do you have a measure for success?
W05-1108 February 17, 2005 Page 5
i) If yes: (Gain as much information as possible if they do and ask for them to send you reference material.)
• Not many odour complaints per year not best measure for success • Many more people detect and are annoyed by odours than make the effort to file a
complaint. The measurement of odour prevention success must, therefore, use not only odour complaint data but also other measurements to assess adherence to, and the effectiveness of, the program.
• Benchmarking against peer utilities o Join with peer utilities and establish benchmarks for odour prevention. o It would be prudent to establish benchmarks with utilities situated in
similar coastal regions that share similar meteorology and topography that influence the dispersion and impact of odours. (GVRD?)
• Odour complaint response and investigation, and community relations. o Each month the Odour Control Taskforce reviews all odour complaints
received to determine whether the actions taken in response were appropriate and to initiate further action if required. Prompt disposition and resolution of odour complaints that are the result of the WTD’s activities are tracked and will be evaluated as a measure of success of the odour prevention program.
• Other measures of success include: o How much public outreach/education/plant tours o Did we implement odour control design on new projects/retrofits? o Follow-up on odour complaints did we respond within 2hrs? not
number of complaints, rather quality of the response ii) If no: How do you define successful?
b) If no: (Similar questions to “If yes” can be asked) 12. Do you track how many odour complaints you receive each year?
a) If yes: Has the number of odour complaints decreased since you implemented or made a change to your odour management plan? (Gain as much information as you can here regarding improvements after various milestones. Ask for back-up documentation/reports if available.)
• Yes – only 45 last year but hard to judge whether that equates to an improvement
based on single year. • Would need to look at weather conditions etc. 13. Has the workload of staff who deal with odour issues and complaints been reduced
since you implemented your odour management program? • No – not at all the opposite has occurred • No good measurement of workload

W05-1108 February 17, 2005 Page 6
• Facing problems with staffing and funding for staff. • Fewer people to do more things 14. Are there any particular facilities with a chronic odour problem in your jurisdiction?
- Wastewater treatment facilities - Others?
• Solid waste treatment - People confuse these with WWTP or pumps • Rendering facility • Seaweed on beaches – rots and releases H2S
a) If yes: - Could you provide examples of such facilities? - Has your odour management program resulted in a reduction in the
problem or number of complaints related to those facilities? • - n/a
2. Does your odour program include a component related to educating the public and other stakeholders regarding odour issues? Yes
a) If yes: Has this resulted in an increase or a decrease in the number of
odour complaints that you receive? • Not really sure whether tours etc make them (public) more accepting. • Neighbour surveys – last few years • The near-neighbor surveys that I told you about have been conducted for the last
four years. For our South Treatment Plant, which is surrounded by office parks and residential neighborhoods, different neighborhoods have been surveyed from year to year. For the West Point Plant only one neighborhood has be questioned because it is the only one close enough to be affected by the plant. There has been no clear indication that odors from either plant have increased or decreased over those years based on the results of the surveys.
2. Has your odour management program engaged the public and other stakeholders? • Yes • Involved more people • Tours are well attended 3. Has it increased public awareness of odour issues? • Yes
W05-1108 February 17, 2005 Page 7
4. Are senior politicians engaged? • County executive who promoted ordinances became engaged • County council also engaged when voting on it • Also get complaints directly • WEF Manual Practice 25 • Tom Mahin
o Massachusetts Dept. of Environmental Protection o Chairman of committee two chairpersons ago

W05-1108 February 15, 2005 Page 1
Jurisdiction: New South Wales, Australia People Interviewed: Peter Lawson (Senior Air Policy Officer, Air Policy Section)
Andrew Mattes (Manager Air Technical Advisory Services Unit) Nadia Kanhoush (Principal Policy and Programs Officer)
Date: February 15, 2005
1. Our understanding of your odour management program is that… - The main driver is POEO Act, which introduced the concept of ‘offensive odour’ and it is an
offence for scheduled facilities to emit offensive odour. The draft policy entitled ‘Odour Assessment and Management of Odour from Stationary Sources in NSW’ spells out how offensive odours can be avoided. There are two types of design criteria for new facilities that are also applicable to existing facilities when they are designing odour control equipment.
- There are quantitative ground-level concentration criteria for specific chemicals (units of ppm)
Acetaldehyde 0.042 ppm Acetic acid 0.20 ppm Acetone 20 ppm Acrylic acid 0.094 ppm Benzyl chloride 0.0094 ppm 1,3-Butadiene 0.45 ppm n-Butanol 0.3 ppm Butyl mercaptan 0.004 ppm Carbon disulphide 0.042 ppm Chlorobenzene 0.042 ppm Cumene 0.008 ppm Cyclohexanone 0.12 ppm Diacetone alcohol 0.28 ppm Diethylamine 0.02 ppm Dimethylamine 0.0094 ppm Diphenyl ether 0.02 ppm Ethanol 2.0 ppm Ethyl acetate 6.3 ppm Ethyl acrylate 0. 0002 ppm Methanol 4.26 ppm Methylamine 0.0042 ppm Methyl ethyl ketone
2.0 ppm
Methyl mercaptan 0.00042 ppm Methyl methacrylate
0.05 ppm
α-Methyl styrene 0.052 ppm Methyl isobutyl ketone
0.1 ppm
Nitrobenzene 0.00094 ppm Perchloroethylene 0.94 ppm Phenol 0.0094 ppm Phosphine 0.0042 ppm n-Propanol 0.03 ppm
New South Wales (Australia)b
Pyridine 0.0042 ppm
3 minutes
For Level 1 (Screening) Assessment – 100th percentile; For Level 2 (Refined) Assessment – 99.9th percentile
Criteria shall be applied at and beyond the boundary of the facility. For point sources, the results of dispersion modelling shall be used as the basis for developing site-specific emission limits for individual odorous air pollutants.

W05-1108 February 15, 2005 Page 2
Styrene (monomer)
0.05 ppm
Toluene 0.17 ppm Triethylamine 0.09 ppm Xylene 0.08 ppm
1.38 µg/m3 0.1-1 s 99th percentile
Urban area (≥2000 people)
2.07 µg/m3 0.1-1 s 99th percentile
500 to 2000 people
2.76 µg/m3 0.1-1 s 99th percentile
125 to 500 people
3.45 µg/m3 0.1-1 s 99th percentile
30 to 125 people
4.14 µg/m3 0.1-1 s 99th percentile
10 to 30 people
Hydrogen sulphide
4.83 µg/m3 0.1-1 s 99th percentile
Single residence (≤2people)
- There are quantitative ambient concentration odour performance criteria for mixtures (units
of OU/m3). They don’t really vary with land-use but rather there is a recognition that when the population is larger there is a greater likelihood that someone will find an odour offensive at a lower concentration. Therefore the odour criteria are more stringent for larger populations.
2 0.1-1 second 99th percentile Urban area (≥2000
people) 3 0.1-1 second 99th percentile 500 to 2000 people 4 0.1-1 second 99th percentile 125 to 500 people 5 0.1-1 second 99th percentile 30 to 125 people 6 0.1-1 second 99th percentile 10 to 30 people
New South Wales (Australia) d
7 0.1-1 second 99th percentile Single residence (≤2people)
Odour performance criteria shall be applied at the nearest existing or likely future off-site sensitive receptor based on population density (see Eqn. 3.2 of NSW, 2001)
- These are not limits that would be included in a license. They are design criteria. - There are also fixed and variable separation distances that are calculated as part of a Level
1 assessment for small facilities. These should not be interpreted as buffer zones. The EPA is planning on moving away from fixed distances to variable distances. Equations have been derived for poultry, livestock and pig facilities.
- Most of the information we have on their program is derived from the “Draft Policy:
Assessment and Management of Odour from Stationary Sources in NSW” Jan 2001 – I understand from your e-mail that this is still a draft but that it has been implemented in practice for the last few years?
• Yes. Content is pretty much locked in. Have been implementing the policy.
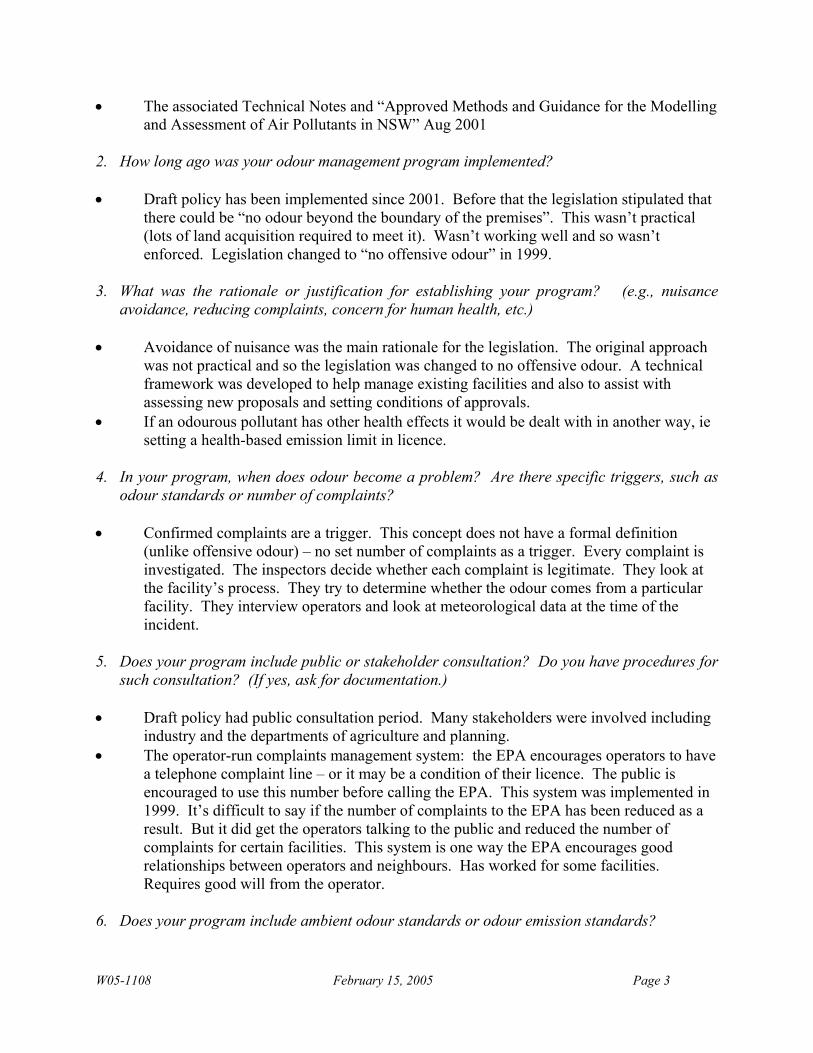
W05-1108 February 15, 2005 Page 3
• The associated Technical Notes and “Approved Methods and Guidance for the Modelling and Assessment of Air Pollutants in NSW” Aug 2001
2. How long ago was your odour management program implemented? • Draft policy has been implemented since 2001. Before that the legislation stipulated that
there could be “no odour beyond the boundary of the premises”. This wasn’t practical (lots of land acquisition required to meet it). Wasn’t working well and so wasn’t enforced. Legislation changed to “no offensive odour” in 1999.
3. What was the rationale or justification for establishing your program? (e.g., nuisance
avoidance, reducing complaints, concern for human health, etc.) • Avoidance of nuisance was the main rationale for the legislation. The original approach
was not practical and so the legislation was changed to no offensive odour. A technical framework was developed to help manage existing facilities and also to assist with assessing new proposals and setting conditions of approvals.
• If an odourous pollutant has other health effects it would be dealt with in another way, ie setting a health-based emission limit in licence.
4. In your program, when does odour become a problem? Are there specific triggers, such as
odour standards or number of complaints? • Confirmed complaints are a trigger. This concept does not have a formal definition
(unlike offensive odour) – no set number of complaints as a trigger. Every complaint is investigated. The inspectors decide whether each complaint is legitimate. They look at the facility’s process. They try to determine whether the odour comes from a particular facility. They interview operators and look at meteorological data at the time of the incident.
5. Does your program include public or stakeholder consultation? Do you have procedures for
such consultation? (If yes, ask for documentation.) • Draft policy had public consultation period. Many stakeholders were involved including
industry and the departments of agriculture and planning. • The operator-run complaints management system: the EPA encourages operators to have
a telephone complaint line – or it may be a condition of their licence. The public is encouraged to use this number before calling the EPA. This system was implemented in 1999. It’s difficult to say if the number of complaints to the EPA has been reduced as a result. But it did get the operators talking to the public and reduced the number of complaints for certain facilities. This system is one way the EPA encourages good relationships between operators and neighbours. Has worked for some facilities. Requires good will from the operator.
6. Does your program include ambient odour standards or odour emission standards?

W05-1108 February 15, 2005 Page 4
• Yes to ambient. • “For point sources, a specific stack emission concentration limit may be back-calculated
using dispersion models so that the glc or odour performance criteria are met. Such stack emission concentration limits may be used as license conditions where appropriate.” This is done for both odour mixtures and individual compounds. They are facility-specific emission limits for point sources only (one exception is for biofilters, which are area sources but emission limits for these sources have been included in licenses). The emission limits are in terms of concentration (ppm or OU/m3)
• The EPA has encouraged industry to develop industry-specific criteria. They are currently working with the cattle feedlot industry. The 2 to 7 OU/m3 are “best guess” generic criteria. EPA does not have resources to create lots of industry-specific curves but industry can develop them.
7. If they have ambient or emissions standards:
a) how were their standards established? • They were developed by reviewing available approaches (national and international) and
then correlating them with available dynamic olfactometry results to attempt to establish what ambient level might lead to “offensiveness”. The affected population was also incorporated to take account of the likelihood of sensitive individuals being present (simply that with higher affected population there is more chance that one or more individuals will be highly sensitive to a given odour).
b) how important are the standards to the program? (i.e., would the program be
successful without them) • Both the facility-specific emission limits and the ambient criteria have been
critical/essential to the odour management program. The ambient criteria are used as benchmarks.
c) How are these standards used? (e.g., planning, response, enforcement, warnings,
guidance, BACT, etc.)
• glc & odour performance criteria are not used as license conditions because compliance is difficult to measure. They are used for design purposes.
• Draft Policy states that “It is not intended that existing facilities will routinely have their operations reviewed to address the odour criteria. The criteria can be used to assist with assessing performance when odour complaints or problems arise.”
• Facility-specific emission limits are used in facility licenses. 8. Are there approved sampling or analytical methods? (If yes, ask for documentation.) • Yes. “Approved Methods for the Sampling and Analysis of Air Pollutants in NSW” • Refers to Australian, European and US standards. The Australian Standard for dynamic
olfactometry is based on European standards. The actual Australian Standard has to be purchased.

W05-1108 February 15, 2005 Page 5
9. Are there standard or approved methods for estimating emissions? (If yes, ask for
documentation.) • Yes, according to Approved Methods & Guidance for modelling – includes accounting
for variability in emissions 10. Do you use any odour avoidance or land use planning tools such as dispersion modelling,
education, industry preventative steps, municipal planner involvement, stakeholder involvement?
• Three-level system of odour impact assessment for point and diffuse odour sources • Operator-run complaint management system • Separation distance equations for poultry, livestock & pig facilities (Level 1 assessment) • Involving land use planners is difficult. The whole issue of managing encroachement is a
touch nut to crack. The EPA tries to raise awareness and encourage involvement of local planning authority. They want them to be aware of the odour footprint of facilities to avoid future conflicts.
11. Would you describe your odour management program as successful? • Yes. It is a big improvement on previous ad hoc system. It provided a framework. For
example, the operator complaint system – operators are now trying to be good neighbours. It raised the profile of odour as a planning and regulatory/environmental issue. Industry and government are now more aware of odour as an issue. Working with industry to develop industry-specific criteria. It’s still a draft policy but it is being used by industry.
a) If yes: Do you have a measure for success?
• They have no quantitative measure of success only qualitative measures
i) If yes: (Gain as much information as possible if they do and ask for them to send you reference material.)
ii) If no: How do you define successful? - is the policy taken seriously? (yes) - is it being implemented? (yes)
• There is an intuitive feeling that at least some future odour issues are being avoided and longer term benefits will be realized.
12. Do you track how many odour complaints you receive each year? “Odours are the largest source of air pollution complaints to the NSW EPA.”
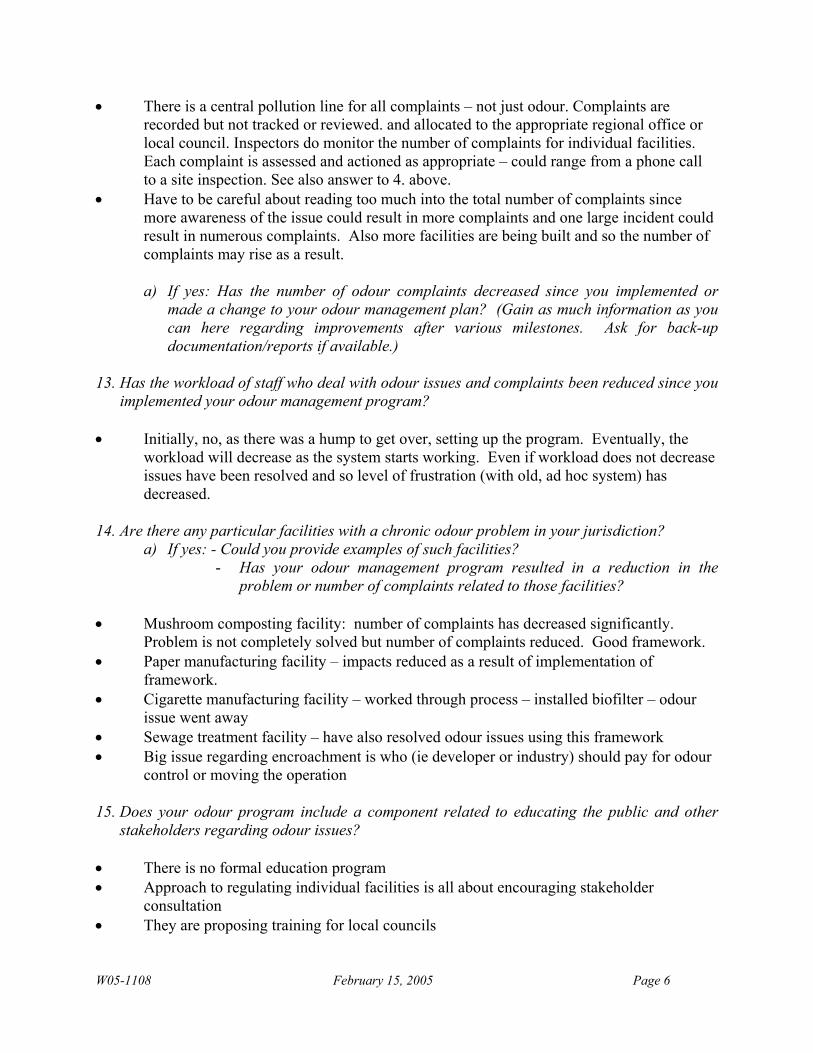
W05-1108 February 15, 2005 Page 6
• There is a central pollution line for all complaints – not just odour. Complaints are recorded but not tracked or reviewed. and allocated to the appropriate regional office or local council. Inspectors do monitor the number of complaints for individual facilities. Each complaint is assessed and actioned as appropriate – could range from a phone call to a site inspection. See also answer to 4. above.
• Have to be careful about reading too much into the total number of complaints since more awareness of the issue could result in more complaints and one large incident could result in numerous complaints. Also more facilities are being built and so the number of complaints may rise as a result.
a) If yes: Has the number of odour complaints decreased since you implemented or
made a change to your odour management plan? (Gain as much information as you can here regarding improvements after various milestones. Ask for back-up documentation/reports if available.)
13. Has the workload of staff who deal with odour issues and complaints been reduced since you
implemented your odour management program? • Initially, no, as there was a hump to get over, setting up the program. Eventually, the
workload will decrease as the system starts working. Even if workload does not decrease issues have been resolved and so level of frustration (with old, ad hoc system) has decreased.
14. Are there any particular facilities with a chronic odour problem in your jurisdiction?
a) If yes: - Could you provide examples of such facilities? - Has your odour management program resulted in a reduction in the
problem or number of complaints related to those facilities?
• Mushroom composting facility: number of complaints has decreased significantly. Problem is not completely solved but number of complaints reduced. Good framework.
• Paper manufacturing facility – impacts reduced as a result of implementation of framework.
• Cigarette manufacturing facility – worked through process – installed biofilter – odour issue went away
• Sewage treatment facility – have also resolved odour issues using this framework • Big issue regarding encroachment is who (ie developer or industry) should pay for odour
control or moving the operation 15. Does your odour program include a component related to educating the public and other
stakeholders regarding odour issues? • There is no formal education program • Approach to regulating individual facilities is all about encouraging stakeholder
consultation • They are proposing training for local councils
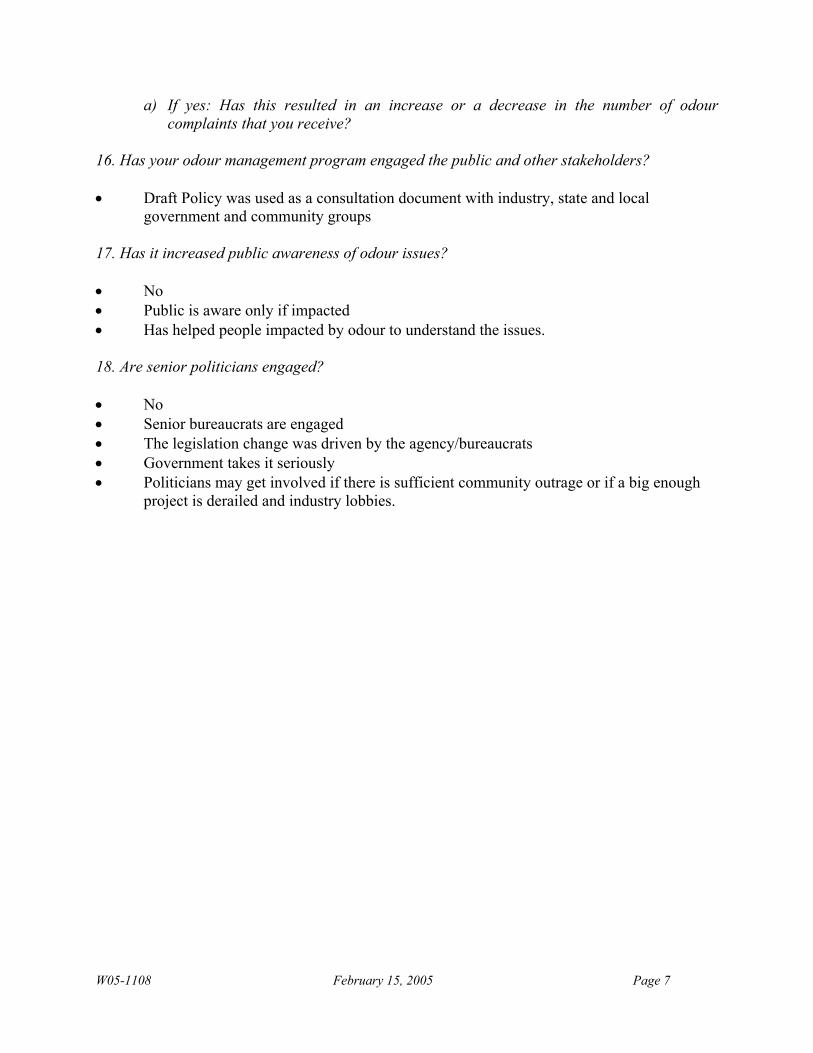
W05-1108 February 15, 2005 Page 7
a) If yes: Has this resulted in an increase or a decrease in the number of odour complaints that you receive?
16. Has your odour management program engaged the public and other stakeholders? • Draft Policy was used as a consultation document with industry, state and local
government and community groups 17. Has it increased public awareness of odour issues? • No • Public is aware only if impacted • Has helped people impacted by odour to understand the issues. 18. Are senior politicians engaged? • No • Senior bureaucrats are engaged • The legislation change was driven by the agency/bureaucrats • Government takes it seriously • Politicians may get involved if there is sufficient community outrage or if a big enough
project is derailed and industry lobbies.

W05-1108 February 22, 2005 Page 1
Jurisdiction: South Australia Person Interviewed: Chris Harris, Environment Protection Authority Date: February 22, 2005
1. Our understanding of your odour management program is:
- Odour criteria are based on principle of compliance with general environmental duty to avoid environmental nuisance using ‘best available technology economically achievable’ (BATEA).
- odour criteria are in OU for 3-min averages 99.9th percentile - also separation distance guidelines for a range of industries – reciprocity: - The recommended separation distances are to be applied in the assessment of
development proposals to ensure that incompatible land uses are located in a way which minimizes impacts caused by noise, odour or polluting air emissions.
- They may also be used to ensure that industrial activities in appropriate zones are protected from encroachment by residential and other sensitive land uses that would adversely affect industry viability.
- The use of separation distances is not an alternative to compliance by industry with its statutory obligations, but rather as an aid in locating industry and sensitive land uses to minimize the impacts of noise, odour or polluting air emissions which may result from accident, power failure, equipment failure, unusual meteorological conditions or human error.
- Buffers or separation distances are not an alternative to source control and cleaner production methods.
- The application of separation distances is not seen as a substitute for BATEA
a) Is this correct?
• The principal legislation addressing odour in South Australia is the Environment
Protection Act 1993 (the Act). In particular, section 25 imposes the general environmental duty on all persons undertaking an activity that emits odour, or might emit odour, to take all reasonable and practicable measures to prevent or minimise any resulting environmental harm. In addition, the causing of odour may constitute environmental nuisance, an offence under section 82 of the Act.
• Avoiding environmental nuisance is written into the South Australia Environmental Protection Act 1993
• It is an overarching policy • Non-compliance is not an offence. Have to be given notice then can become an
offense • There are two sets of Guidelines that are used as part of the odour program: “Odour
Assessment Using Odour Source Modelling” and “Consultation Draft: Guidelines for Separation Distances” they are both guidelines not legally enforceable but do put odour criteria and separation distances into approvals so therefore they are indirectly enforced.
• The Draft Separation Guidelines will be rewritten soon

W05-1108 February 22, 2005 Page 2
• General enforcement duty plus 2 guidelines (Separation and Odour Assessments) make up the odour program
• But the first step is good design to avoid odour nuisance. Separation is a second step. • Buffers are meant to protect against normal odours as well as outages.
b) Is there anything that you would add?
• Australian Pork Industry is very proactive on odour issues • A lot of research is funded by them. • Have published a few papers – on their website, • Also guideline for piggeries – with a section on odour assessments. • AQ impact assessment guideline using glcs – some materials are odourous – another
tool. • Separation Distances – there are industry specific guidelines eg.
o Pig industry – separation distances based on number of pigs etc. o Cattle feed lot industry – different separation distance calculation
• Research papers have been done by consultants – Australian Pork Limited 2. How long ago was your odour management program implemented?
• General odour criteria for over 10 years. • Always used some separation distances but not necessarily documented in policy. • Odour criteria first published in last 5-6 years.
3. What was the rationale or justification for establishing your program? (e.g., nuisance
avoidance, reducing complaints, concern for human health, etc.)
• Odour nuisance – try to avoid that have to based on Environmental Protection Act • Odour source modeling approach usually used for new or modified facilities but
existing problem facilities may get asked to do it too if there is an odour problem that needs to be resolved.
4. In your program, when does odour become a problem? Are there specific triggers, such as
odour standards or number of complaints?
• Complaint driven (EPA not highly resourced) • If a facility is not causing problems with public then don’t do anything. • With new facilities try to avoid problem in first place with BATEA
5. Does your program include public or stakeholder consultation? Do you have procedures for
such consultation? (If yes, ask for documentation.) • Appears to be the case – August 2000 Consultation Draft Guidelines for Separation
Distances
• Yes – accepted comments from the public for Guidelines for Separation Distances.

W05-1108 February 22, 2005 Page 3
• When rewritten there will be more public consultation. • Amount of public consultation depends on circumstances
6. Does your program include ambient odour standards or odour emission standards?
• Odour criteria are population dependent – as the population density increases, the increased possibility of sensitive individuals raises the potential for odour complaints, and more stringent criteria are necessary (similar to NSW)
• This assessment will include the measurement or estimation of the odour emissions at the source and the prediction of the odour levels and frequency of odours at neighbouring sensitive receptors.
• The prediction will be undertaken by the use of a mathematical model and representative input data.
JURISDICTION OFFSITE
STANDARD OR
GUIDELINE (OU m-3)
AVERAGING TIME
FREQUENCY CRITERIA
LAND USE USE (PERMIT,
GUIDANCE ETC.)
2 3 minutes 99.9% compliance 2000 or more people 4 3 minutes 99.9% compliance 350 or more people 6 3 minutes 99.9% compliance 60 or more people 8 3 minutes 99.9% compliance 12 or more people
South Australia c
10 3 minutes 99.9% compliance Single residence (<12 people)
Determining setback distances
- these are from a 2003 document – the 2000 Consultation Draft: Guidelines for Separation Distances has different odour criteria (1, 2, 3, 4 & 5 OU) – which is correct?
• 2,4,6,8,10 • As shown in the current Odour Modelling Guideline, the current odour criteria are 3
minute averages at 99.9 percentile. Based on the odour work done for Australian Pork Limited (APL) and from European experience a criteria using 1 hour average and say 99 or 98 percentile and corresponding lower odour criteria but better represent the long term chronic impact. The SA EPA may be considering adopting this later!
• Also numerous fixed separation distances for a range of industries provided in Table 1, Section 5 of Draft Guidelines for Separation Distances
- are these to be protective of criteria contaminants, odour or both? How can you tell if
they are to be protective of odour?
• Emphasis of document was odour. • Odour is considered an air emission. • new document will be a major rewrite although principle will be the same • Industries will change – some numbers will differ – but same style of approach.
7. If they have ambient or emissions standards:

W05-1108 February 22, 2005 Page 4
a) how were their standards established?
• Separation Guidelines mainly from Victoria – adapted with local knowledge and experience.
• Share information between States. • Odour assessment document – looked interstate but based on experience in South
Australia.
b) how important are the standards to the program? (i.e., would the program be successful without them)
• Principle of separation guideline is excellent • Good first look for operators (no modeling required) • Odour assessment for more complex facilities – not always necessary – only if see
potential problem. • Odour criteria and separation distances are fundamental to the odour program • But good design and good management are also key and a first priority • Separation (based on either separation guideline, or modelling) is a secondary tool
c) How are these standards used? (e.g., planning, response, enforcement, warnings, guidance, BACT, etc.)
• They are guidelines therefore not enforceable per se. • Any development with potential minor environmental impact is sent to EPA for
comment/ recommended approval conditions. Planning authority must take due regard of EPA comments and recommendations but can decide not to implement them.
• If major potential environmental impact EPA has more authority with regard to decision (power of direction) has major input – tools are used at this stage.
8. Are there approved sampling or analytical methods? (If yes, ask for documentation.)
• Odour Panel Standard: o Australian Standard “Stationary Source Emission Determination of Odour
Concentration by Dynamic Olfactometry, AS4323.3:2001” based on European Standard
• Still no standard for sampling • Very important for an area source to establish a sampling standard
9. Are there standard or approved methods for estimating emissions? (If yes, ask for documentation.)
• Not really • Use real measurements from existing processes (their own or similar)

W05-1108 February 22, 2005 Page 5
• No central database for these measurements although some industries are doing this Pork industry.
10. Do you use any odour avoidance or land use planning tools such as dispersion modelling,
education, industry preventative steps, municipal planner involvement, stakeholder involvement?
• Methods to assess potential odour impacts of a development include computer
modelling, complaint history, previous practical experience with the activity, consultation outcomes, community odour diaries and surveys, and assessment of emission control proposals
• Community consultation can be very important 11. Would you describe your odour management program as successful?
• Yes – by good design, good management and separation can minimize problems. If do have a problem – time and money can usually reduce odours.
a) If yes: Do you have a measure for success?
• Not really – no key performance indicators
i) If yes: (Gain as much information as possible if they do and ask for them to send you reference material.) ii) If no: How do you define successful?
b) If no: (Similar questions to “If yes” can be asked)
• May have compliance test – once up to full production, measure odour emissions and remodel.
12. Do you track how many odour complaints you receive each year?
• Yes – have method for formally recording all complaints.
a) If yes: Has the number of odour complaints decreased since you implemented or made a change to your odour management plan? (Gain as much information as you can here regarding improvements after various milestones. Ask for back-up documentation/reports if available.)
• No major change • Odour is still a major source of complaints. • Still an ongoing problem, localised.

W05-1108 February 22, 2005 Page 6
13. Has the workload of staff who deal with odour issues and complaints been reduced since you implemented your odour management program?
• Not as such – odour is only part of their work • It has been a gradual process. • Guidelines have made it easier/ more transparent for developers/ operators
14. Are there any particular facilities with a chronic odour problem in your jurisdiction?
• Yes
a) If yes: - Could you provide examples of such facilities?
• Car manufacturer – VOC emissions – EPA more proactive in this case since they
knew the facility was going to expand. – but not a major odour problem. • Foundries major problem in last few years residents are too close – industries have
expanded/ production increased. • Intensive animal keeping – piggeries, chicken sheds • Printing processes with solvents.
- Has your odour management program resulted in a reduction in the problem or number
of complaints related to those facilities?
• Foundries have used odour assessments – determining all sources and where you can get most odour reduction for the cost.
15. Does your odour program include a component related to educating the public and other
stakeholders regarding odour issues?
• Yes – When there is a specific problem with a facility.
a) If yes: Has this resulted in an increase or a decrease in the number of odour complaints that you receive?
• Guidelines have made requirements more transparent to developers/neighbours • Emphasis is on encouraging industry to educate local public industry understates
usefulness of public consultation 16. Has your odour management program engaged the public and other stakeholders?
• Yes 17. Has it increased public awareness of odour issues?
• Yes – due to major problems they have had. eg. foundry – public was very well organized – went to parliament therefore got lots of publicity.

W05-1108 February 22, 2005 Page 7
• Overall public awareness of environmental issues has increased – includes odour. 18. Are senior politicians engaged?
• Yes • EPA reports to minister of parliament • Management of EPA aware of issues • Minister is kept informed of major problems • EPA does have independent powers • High awareness of major issues
• Would like a copy of our report.
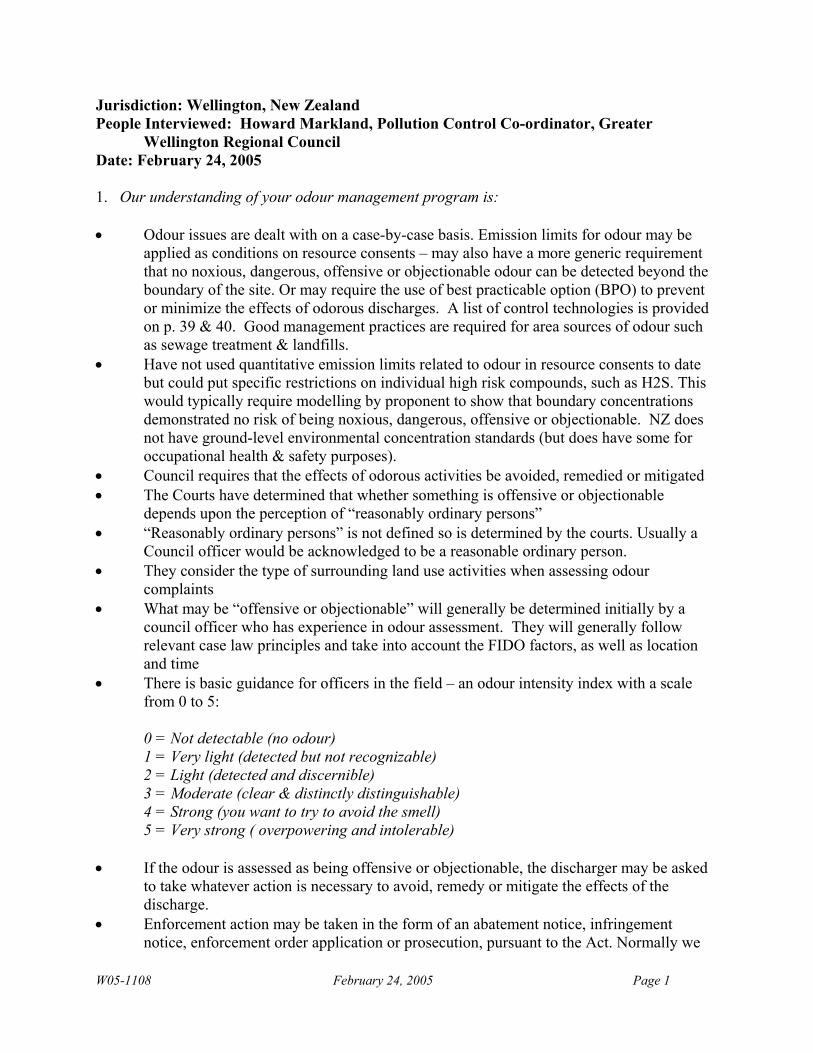
W05-1108 February 24, 2005 Page 1
Jurisdiction: Wellington, New Zealand People Interviewed: Howard Markland, Pollution Control Co-ordinator, Greater
Wellington Regional Council Date: February 24, 2005
1. Our understanding of your odour management program is: • Odour issues are dealt with on a case-by-case basis. Emission limits for odour may be
applied as conditions on resource consents – may also have a more generic requirement that no noxious, dangerous, offensive or objectionable odour can be detected beyond the boundary of the site. Or may require the use of best practicable option (BPO) to prevent or minimize the effects of odorous discharges. A list of control technologies is provided on p. 39 & 40. Good management practices are required for area sources of odour such as sewage treatment & landfills.
• Have not used quantitative emission limits related to odour in resource consents to date but could put specific restrictions on individual high risk compounds, such as H2S. This would typically require modelling by proponent to show that boundary concentrations demonstrated no risk of being noxious, dangerous, offensive or objectionable. NZ does not have ground-level environmental concentration standards (but does have some for occupational health & safety purposes).
• Council requires that the effects of odorous activities be avoided, remedied or mitigated • The Courts have determined that whether something is offensive or objectionable
depends upon the perception of “reasonably ordinary persons” • “Reasonably ordinary persons” is not defined so is determined by the courts. Usually a
Council officer would be acknowledged to be a reasonable ordinary person. • They consider the type of surrounding land use activities when assessing odour
complaints • What may be “offensive or objectionable” will generally be determined initially by a
council officer who has experience in odour assessment. They will generally follow relevant case law principles and take into account the FIDO factors, as well as location and time
• There is basic guidance for officers in the field – an odour intensity index with a scale from 0 to 5:
0 = Not detectable (no odour) 1 = Very light (detected but not recognizable) 2 = Light (detected and discernible) 3 = Moderate (clear & distinctly distinguishable) 4 = Strong (you want to try to avoid the smell) 5 = Very strong ( overpowering and intolerable)
• If the odour is assessed as being offensive or objectionable, the discharger may be asked
to take whatever action is necessary to avoid, remedy or mitigate the effects of the discharge.
• Enforcement action may be taken in the form of an abatement notice, infringement notice, enforcement order application or prosecution, pursuant to the Act. Normally we

W05-1108 February 24, 2005 Page 2
would attempt to achieve compliance by non-regulatory means, in accordance with our firm but fair regulatory policy. Alternatively we would use a warning or cost recovery in minor instances.
• A major requirement for odour investigations that has been imposed by case law is the need for regulatory officers to conduct a 360 degree sweep of a suspected odour source, to confirm it is the source. However, there are usually numerous constraints in practice, such as buildings/fences, thick vegetation, roads, water or steep topography that make it impossible to perform a 360 degree sweep. Since this undermines a formal, regulatory approach, we tend to focus on non-regulatory approaches. The most common is to enter into dialogue with operators to get them to acknowledge that there is a problem, and to deal with it at source rather than focusing on the compliance test at the boundary.
• 2. How long ago was your odour management program implemented? • 5 years - our Air Quality Management Plan became operative on 8 May 2000 3. What was the rationale or justification for establishing your program? (e.g., nuisance
avoidance, reducing complaints, concern for human health, etc.) • The Health Act 1956 addresses statutory nuisance, including nuisance odour, but did not
deal well with industrial site odours (enforced by local councils). The Resource Management Act 1991 (enforced by regional councils) restricts contaminant release to air from industrial sources, which was subsequently incorporated into our rules under the Regional Air Quality Management Plan. Although the Resource Management Act requirement effectively duplicates the coverage of nuisance issues, it has effectively developed a jurisdiction over more serious odour problems arising from industrial sites. As regional councils are perceived to be a more authoritative body, this effectively strengthens the control of serious industrial odours than the pre-1991 situation.
- So was rationale avoidance of nuisance, complaints or both? • Rationale of the Resource Management Act was to introduce an effects-based regulatory
environment, which applies to air pollution. Although this introduces an overlap with nuisance issues under the Health Act, nuisance is generally applied to food premises (as it is enforced by Environmental Health Officers who regulate this industry) or air pollution issues of low importance (such as smells affecting an individual rather than a community). The Resource management Act requires all complaints to be logged, but does not require them to be acted on.
4. In your program, when does odour become a problem? Are there specific triggers, such as
odour standards or number of complaints? • Typically odour is a problem that we would act on when it has been confirmed as
offensive, objectionable, noxious or dangerous (in the assessment of the regulatory officer) at or beyond the source site boundary.

W05-1108 February 24, 2005 Page 3
- But you now act on it only after receiving 10 complaints at some sites – correct? • Yes. This was initially introduced for two specific sites with many complaints. For
facilities that have never been the source of a complaint before the council would likely respond to just one complaint. The 10 complaint trigger is used mostly for facilities with chronic odour problems and/or many complaints, where we are actively working with these industries to effect an improvement, in conjunction with a pro-active monitoring programme designed to establish the relationship between odour release at the site and its impact in the surrounding catchment..
5. Does your program include public or stakeholder consultation? Do you have procedures for
such consultation? (If yes, ask for documentation.) • Where there is a proposal to install a new industrial process or site that may have
offensive odours, it is likely to be a notified resource consent process. This means that interested/affected parties will be notified of the application, and have the opportunity to comment on the application. This may result in conditions being imposed on the consent (hours of operation, air pollution control technology type etc) or the consent being declined.
6. Does your program include ambient odour standards or odour emission standards? • There are no odour standards or emission standards applicable to New Zealand. However,
FIDOL factors are widely used in New Zealand for the assessment of odours - How? Olfactometry for intensity? What about other elements? Is there a scale for
offensiveness? • Odour intensity scale. (see Q1 above). 7. If they have ambient or emissions standards:
a) how were their standards established? b) how important are the standards to the program? (i.e., would the program be
successful without them) c) How are these standards used? (e.g., planning, response, enforcement, warnings,
guidance, BACT, etc.) • No quantitative criteria – only qualitative criteria. 8. Are there approved sampling or analytical methods? (If yes, ask for documentation.) • There are some moves toward the establishment of odour panels in the event of major
problems, albeit on a case by case basis. - Will you adopt Australian/European standard?
W05-1108 February 24, 2005 Page 4
• Very likely if we introduce formal odour panels 9. Are there standard or approved methods for estimating emissions? (If yes, ask for
documentation.) • Not for odour. - How are odour emissions determined for modelling? • Council has a non-prescriptive approach. Let proponents make assumptions. If their
argument is sufficiently compelling the council may accept it. However the operator assumes the risk. If the modelling proves incorrect (i.e., in reality there is an odour problem) they will have to mitigate it.
10. Do you use any odour avoidance or land use planning tools such as dispersion modelling,
education, industry preventative steps, municipal planner involvement, stakeholder involvement?
• Dispersion modeling may be used during the resource consent application process to
evaluate likely impact for significant sources (e.g. mushroom farms etc), but not commonly used. Shelter-belts and exclusion zones are used by some regional councils, but not currently by Greater Wellington. Stakeholder involvement has been described in my response to question number 5 above.
• The plan states that the Wellington Regional Council will promote the use of odour diaries, where appropriate, to record complaints about potentially odorous activities (p. 90) – is this used very often?
• Odour diaries are not a good planning tool but they are a very useful tool to assess the performance of a site and correlating it with weather conditions. They are careful whom they select to maintain diaries as they want an objective assessment so they will not provide them to vexatious complainers.
11. Would you describe your odour management program as successful?
a) If yes: Do you have a measure for success? i) If yes: (Gain as much information as possible if they do and ask for them to send you reference material.) ii) If no: How do you define successful?
b) If no: (Similar questions to “If yes” can be asked)
• No. We have repeated odour complaints from industrial sources, and great difficulty requiring the adoption of established technologies such as biofilters and afterburners (typically on the basis of economic hardship). Furthermore, restrictions on new odourous sites are not particularly strict – often recommendations from investigating officers are overturned or weakened by political appointees (councillors) at the consent hearing. Success would be no new significant odour sources, and progressive improvement of existing ones.

W05-1108 February 24, 2005 Page 5
- but it sounds like you have had some success on a case-by-case basis – such as the rendering facility – any comment?
• Regulatory framework isn’t conducive to resolving issues so have adopted a proactive,
informal program. - any thoughts on how to improve program to achieve this? • The pro-active monitoring approach has been successful, with real improvements being
achieved at these sites. We will continue to use this approach (see Q4) 12. Do you track how many odour complaints you receive each year?
a) If yes: Has the number of odour complaints decreased since you implemented or made a change to your odour management plan? (Gain as much information as you can here regarding improvements after various milestones. Ask for back-up documentation/reports if available.)
• Odour complaints/incidents have been tracked since 1991. This revealed a growing
number of odour complaints each year up to 2002, with odour complaints growing as a proportion of all complaints (up to 69% in 2002). During this time, each odour complaint was responded to with a phone call and site visit to assess validity. The vast majority of complaints were attributed to 3 sources (an asphalt plant, a meat works and a sewage sludge dewatering plant/ composting plant/landfill complex) – all of which were situated close to residential areas, and subject to ongoing residential encroachment.
• In 2002, staff resources could no longer support this response strategy (which proved ineffective as odour duration was typically very short), and so a policy of response thresholds was introduced, whereby officers would only respond following 10 or more complaints for the key sites. Following 2002, there was a decline in the number of complaints, attributed to closure of the Asphalt plant, complainant fatigue and improved provisions at the remaining source sites. This decline has continued, and odour complaints are currently running at around 50% of the 2002 high.
• AQMP states that, “Over 90% of air pollution complaints received by the Council relate to odour.”
- was this for a previous year? • The Council was data poor in 2000. Therefore this statistic is suspect. 13. Has the workload of staff who deal with odour issues and complaints been reduced since you
implemented your odour management program? • Dramatic workload reduction since the policy change in 2002. Furthermore, this has
released resources to focus upon pro-active initiatives such as site visits and statistical analysis etc., as well as releasing resources to more ‘important’ environmental issues dealt with by these officers.

W05-1108 February 24, 2005 Page 6
14. Are there any particular facilities with a chronic odour problem in your jurisdiction? a) If yes: - Could you provide examples of such facilities? Has your odour management program resulted in a reduction in the problem or number of complaints related to those facilities?
• Asphalt plant – 500 complaints per year. Our consents management team negotiated an
activated carbon filter on the stack that had some improvement. This site closed in 2002. • Meat works – 200 complaints per year from rendering process (despite afterburner),
stockyards and fugitive emissions. We eventually required them to install a biofilter, which has almost eliminated rendering odours. Complaints are now around 50/year.
• Sewage sludge dewatering plant/ composting plant/landfill complex – 200 complaints per year. Ongoing liaison with sites to improve practices (waste cover, storage indoors, keeping doors closed, use of deodorizers etc). Complaints are now around 100/year.
• Both the meatworks and the sewage sludge dewatering plant/ composting plant/landfill complex are subject to residential encroachment, and people complaining because their property values stand to appreciate significantly if these industrial sites are closed. There is also a mis-conception amongst the public that there should be no smell whatsoever from these sites beyond the boundary, which is not the case.
- fish processing? (mentioned in AQMP) • Yes, there have been several issues. • Downtown wet fish are processed in closed facilities. Occasionally there are problems on
hot days due to poor housekeeping. An additional problem is the encroachment of residential neighbourhoods in industrial areas. This results in more complaints.
• There can also be issues outside of populated areas if there is mixed land use: commercial offices and industrial sites. They are considering implementing the use of buffers around odourous activities.
15. Does your odour program include a component related to educating the public and other
stakeholders regarding odour issues? a) If yes: Has this resulted in an increase or a decrease in the number of odour
complaints that you receive? • We have had odour workshops involving community groups, and letter drops to
complainants and neighbours of odorous sites. Where we have made it clear that we are dealing to individual complaints, this has resulted in an elevated number of complaints. Local councilor involvement (around election time) also tends to stir things up.
16. Has your odour management program engaged the public and other stakeholders? • Yes, as described above 17. Has it increased public awareness of odour issues?

W05-1108 February 24, 2005 Page 7
• Slightly, but not as much as adverse publicity in the local media, with locals alleging the council is an ineffective regulatory body
18. Are senior politicians engaged? • Not senior politicians. Local councilors have some involvement around election time,
promising to deal to the odour issue in an area. This heightens interest for a period of a couple of months, and then tends to disappear.
• Regional Councillors are involved in the setting of resource consent conditions, although as described above, this has actually led to the relaxed conditions which in some instances has led to officer’s concerns to become reality.
• Central government politicians have not chosen to deal with this matter.

W05-1108 March 2005 Page 1
Jurisdiction: North Rhine-Westphalia, Germany Person Interviewed: Ralf Both, North Rhine-Westphalia State Environment Agency Date: March, 2005 1. Our understanding is that your odour management program is outlined in the
Guideline on Odour in Ambient Air (GOAA) and that the main parameter is the odour frequency expressed as odour hours per year. The legal basis for any requirement with respect to ambient air quality is the German Federal Protection Act for Ambient Air (1974/1990) and the Technical Instruction on Air Quality Control (2002). According to Section 3 of the FPAA odours caused by installations are treated as a nuisance. But it has to be determined if the nuisance is significant. This question has to be answered in every licensing or surveillance procedure for industries that emit odours. Urban developments also have to evaluate existing odour impacts. The GOAA outlines a complete system of measurement or calculation methods for existing impact (by field measurements or dispersion modeling), calculation of the incremental and cumulative odour impacts, and limit values used to evaluate the odour impacts.
a) Is this correct?
• Yes - There have since been studies to try and standardize measures for odour intensity and
hedonic tone, as reported in Both et al., 2004. • I don’t know exactly what “standardize measures” means. We try to find out if the
dose response relationships between odour frequency and odour annoyance is modulated by odour intensity and hedonic tone.
• We have a scale for odour intensity that ranges from 0 to 6 with descriptions for each level in the scale
• Also we have a scale for hedonic tone that ranges from -4 (unpleasant) to 0 (neutral) to +4 (pleasant). Each level is not described – it is entirely subjective
• These levels are provided in VDI 3882 (have to purchase): sheet 1 deals with intensity and sheet 2 deals with hedonic tone. These standards are for olfactometers but they have been adapted to ambient air. The standardized field method is outlined in the GOAA.
b) Has this system been implemented?
• Yes. We found out that our system of the GOAA was sufficient for neutral and
unpleasant odours. But residents were less annoyed by pleasant odours. Therefore we include a new method to evaluate pleasant odours. The odour frequencies of pleasant odours are multiplied by 0.5 before they are compared with the limit values. We also found that odour intensity is not relevant for the degree of odour annoyance. If residents recognize an odour they are annoyed or not.

W05-1108 March 2005 Page 2
- How do you determine whether an odour is pleasant? • It is entirely subjective – don’t try to get all field panelists to agree. They do use
pairs of words to help differentiate between pleasant and unpleasant odours (e.g., hot vs. cold).
• Field panelists do get tested (VDI 13725 – guideline for selecting odour panelists) and if they have an odd reaction to an odour (e.g., one person thought the odour from a rendering plant was pleasant because it reminded him of dog food and he likes dogs) then they would be considered an outlier and not included in the study.
• They use 10 to 15 people in the field – same panel as odour panel - An undated paper that you sent (Both and Koch) states that a new version of GOAA
was passed on the 21st of September – was this 2004? • Yes - Could you provide me with the updates related to hedonic tone? • The undated paper was held at an odour conference in Cologne. The title of the
conference book is: VDI-Berichte 1850. Environmental Odour Management - Is the new version of the GOAA publicly available in English? • No. It’s only available in German but it is free and available on their website.
c) Is there anything that you would add?
2. How long ago was your odour management program implemented? - Act since 1974, GOAA since 1974? • The first odour regulation was from 1978. But at this time they don’t know
anything about odour annoyance of residents. GOAA which was for the first time based on dose response relationships between odour frequency and odour annoyance was from 1993. Since that time we have experiences with this guideline in practice and at court.
3. What was the rationale or justification for establishing your program? (e.g.,
nuisance avoidance, reducing complaints, concern for human health, etc.) • It is nuisance reduction. You cannot avoid it totally. 4. In your program, when does odour become a problem? Are there specific triggers,
such as odour standards or number of complaints? • In a licensing procedure you have to deal with odours if your plant emits odours.

W05-1108 March 2005 Page 3
- Is there a list of types of facility you expect to emit odours? Or is it a case-by-case
judgement? • There is no list of facilities that emit odours but they do have a list of facilities
that require a permit to operate, which depends on the size of the facility or their throughput. Some facilities are included in the Technical Instruction on Air Quality Control. Others, the regulators know based on experience that they have the potential to emit odours.
• In surveillance you have to deal with odours if there are complaints (independent of the number) or if the local authority responsible reasons that plant e. g. doesn’t fulfill the state of the art.
5. Does your program include public or stakeholder consultation? Do you have
procedures for such consultation? (If yes, could you please provide documentation.) • Yes. It is lined out in our Federal Protection Act. - Probe 6. Does your program include ambient odour standards or odour emission standards? • What are ambient odour standards? Odour emissions standards are given in our
Technical Instruction on Air Quality Control - Can I get a copy? • Ministry of Environment of the Federal Republic of Germany website. It’s a
2002 document so it may be available in English for free. Contains odour emission standards in OU/m3.
- There are Immission limit values Ilimit for different land uses:
o For industrial sources in residential or mixed areas the limit is 0.10 or 10% and for industrial and commercial areas it is 0.15 or 15%.
o For livestock farming the limit values are: o 0.10 or 10% for residential/mixed areas; 0.15 or 15% for villages with
livestock farming; and 0.15 to 0.20 (15 to 20%) for outskirts and rural areas.
- Are there other standards? • No. An exception are set back distances (see below). But they have nothing to do
with odour nuisance – they weren’t developed based on studies on odour annoyance. The distances are used for farms as a rule of thumb. Therefore in critical cases the final assessment has to be done by the GOAA. For example, if

W05-1108 March 2005 Page 4
the setback distances for 2 or more farms overlap then they have to conduct a more refined cumulative assessment based on GOAA.
- Please expand. • There are also emission standards (OU/m3) in the Technical Instruction on Air
Quality Control. 7. If they have ambient or emissions standards:
a) how were their standards established? • As a rule it is not sufficient only to look at emission standards. You always have
to carry out the odour impact on site by dispersion modeling. - Guideline limit values are based on field investigations in which significant
relationships between odour impact and odour annoyance was found. These limit values were developed on the basis of investigations in which the initial odour impact measured as odour frequency (Guideline VDI 3940, 1993) and the degree of odour annoyance of residents assessed by questionnaires according to Guideline VDI 3883 Part 1 (1997) were correlated. As a result odour frequencies between 10% and 20% were found to be the critical range where a nuisance would be considered significant. Hedonic tone was not taken into account.
b) how important are the standards to the program? (i.e., would the program
be successful without them) • We don’t need emissions standards for our program. Normally you have to
determine the odour stream (odour concentration multiplied by the volume stream) of every source. Using dispersion modeling you get the odour impact (odour frequency) which is much more relevant for odour nuisance.
- So if modelling suggests that a facility will not meet immission limit values at
sensitive receptors, do they then have to implement emissions control or other mitigation prior to approval?
• Yes. - Is the setback distance then written into their permit? • No. • Permits: - consultant’s report on dispersion modelling is attached to the permit.
Often, there is a requirement to conduct olfactometric measurements after commissioning. They do include the odour-hour frequency in permits. Could be 0.10 or 0.15 but could also be site-specific, i.e., for an area with a cumulative odour problem a facility could be limited to 0.05 odour hours. Conversely, in

W05-1108 March 2005 Page 5
rural areas a higher value like 0.20 could be assigned. Needless to say, the permits are quite large – up to 60 pages long.
• Local authorities are responsible for licensing and complaints. The state environment agencies act as resources to the local authorities and are asked for advice on very difficult problems.
c) How are these standards used? (e.g., planning, response, enforcement,
warnings, guidance, BACT, etc.) • They are only used in plant planning and licensing. 8. Are there approved sampling or analytical methods? - The GOAA outlines the method used to determine odour frequencies. Are there any
other standard methods for measuring odour using olfactometry etc.? (If yes, please provide documentation.)
• The GOAA also refers to VDI-guidelines for olfactometry. The new version of
the Guideline (2004) refers to the European guideline for olfactometry (EN 13725). This guideline was established in Germany in September 2003. Since that time all measuring institutes have to work in accordance to this guideline.
9. Are there standard or approved methods for estimating emissions? (If yes, please
provide documentation.) • Yes. There are a lot of different VDI and ISO Guidelines for emission
measurements which have to be used. - What about emission estimation? • No standard methods. For existing facilities odour emission rates have to be
measured. For new facilities, they use emissions measured for the most similar facility and there would likely be a requirement for them to conduct emission measurements after commissioning.
10. Do you use any odour avoidance or land use planning tools such as dispersion
modelling, education, industry preventative steps, municipal planner involvement, stakeholder involvement?
• Independent of odours we have a special procedure for land use planning. Odour
nuisance is only one part. But the tool for odour they use is the GOAA. See also my answer to question 5.
• For dispersion modelling, they fix the concentration at 1 OU/m3 then look at the frequency of exceedances of this concentration at the receptor. In the Netherlands they take the opposite approach (fix the frequency then look at the concentration

W05-1108 March 2005 Page 6
at the receptor). In the new GOAA they now use the recognition threshold rather than the detection threshold because in the field, they have a positive odour reading only if they recognize the odour. The underlying theory is that people are annoyed only if they recognize the smell.
- Odour frequency in ambient air is determined using field measurements with panels
and dispersion modelling. - Both (2001) mentions that a special dispersion model for odours that uses short
averaging periods is being developed (AUSTAL2000-Odour?). Has this model been implemented?
• Yes - Is it publicly available? • Yes. www.austal2000g.de • The ‘g’ stands for odour. Austal2000 (without the ‘g’) is used for modelling
gases. It is not based on short averaging periods – they gave up on that idea because the model runs were too long – too computer intensive. The current model is a Lagrangian particle model with a one-hour averaging period. It was adapted for odour recognition and validated against field measurements.
- I note that in the GOAA it is stated that in the case of livestock farming minimum
setback distances can be used instead of the requirements of GOAA. Are the minimum setback distances documented somewhere?
• Yes. Guidelines VDI 3471, VDI 3472. for licensing the distances are given in the
German Technical Instruction on Air Quality Control. 11. Would you describe your odour management program as successful? • Yes 12. Do you have a measure for success?
i) If yes, could you please explain it? ii) If no: How do you define successful?
• This question is a bit difficult to answer because we don’t have an objective measure. We don’t count complaints. Because of the fluctuation in residential areas the number of complaints is not an appropriate parameter for the success. The same applies to the annoyance degree in a residential area. People who moved in and didn’t know the odour situation before will be annoyed by the perceived odours although the plant has reduced their emissions.

W05-1108 March 2005 Page 7
• So we say it is successful because you have the possibility to adapt the GOAA to the special requirements of single cases. This leads in some cases to further developments in emission abatement. In other cases the complainant were told that their complaints are not justifiable. But in every case our system of odour regulations leads to a decision of the authority responsible. Both plant owner and complainant can go to court against the decision.
• Have this in mind I would say our system is successful because only a few cases are taken to court. As a rule the people and also the justice accept the results based on the GOAA and their scientific background and foundation.
13. Do you track how many odour complaints you receive each year? • Yes. But they aren’t used as a measure of success.
a) If yes: Has the number of odour complaints decreased since you implemented or made a change to your odour management plan?
• See also answer to question 12. If you tell the complainants the result of your
(objective) investigation with only a few exceptions they will accept the decision. 14. Has the workload of staff who deal with odour issues and complaints been reduced
since you implemented your odour management program? • I don’t know. But they know now what they have to do, which tool they have to
use and they all do (nearly) in the same way all over Germany. 15. Are there any particular facilities with a chronic odour problem in your jurisdiction?
a) If yes: - Could you provide examples of such facilities?
- According to Both (2001): - Livestock farming - Composting plants including fermentation processing - Wastewater treatment plants including sludge composting - Waste management – waste sites, waste treatment, waste utilization,
mechanical-biological treatment of waste, soil regeneration, waste incineration - Food production, feeding stuff production, grease recovery, tannery - Paint finishing plants - Chemical industry including bitumen production - Metal processing - Foundries - Textile finishing - Chipboard industry - Brickwork

W05-1108 March 2005 Page 8
• Case study 1: An aluminum can (pop can) manufacturing facility. There were 2 sources of odour: the process where oil was washed off the cans, and the paint shops. There were odour complaints so the local authority forced the facility to conduct field measurements over a 6-month period. The odour frequency in residential areas was found to be 0.20, which is over the limit. So the local authority forced them to put controls on the paint facility (after burners). They did a second field study but they still had an odour frequency of 0.20 odour hours. But this time it was due to the can washing process, the odour of which had previously been masked. So they again had to install control measures, in this case, drying the air. A third field study (again 6 months) was conducted and the odour frequency was less than 0.10. The whole process took 5 years. The public was kept informed the whole time about progress.
• In Germany, complainants have the right to have their complaints investigated. After making a complaint they receive an official report stating whether or not the odour complaint was found to be justified. If they don’t agree with the decision they can appeal in the courts.
• Case Study 2: Düsseldorf Harbour – Neuf - across the river
o oil mill o food production o complaints about odours o want to build new residential areas o local authority wanted to know existing conditions o over 100 sources – over 10 plants o ran dispersion modeling o more than 47% odour hours o calculations for each facility alone as well each facility less than 0.1 on
their own so difficult to force them to change. o Had to look at state of the art control technology or increase stack height o Detailed proposals for each facility o All old facilities
- Has your odour management program resulted in a reduction in the problem… • Yes, the problems in each case under investigation could be solved. I don’t know
a case in which the problem could not be solved. - …or number of complaints related to those facilities? • See 13. 16. Does your odour program include a component related to educating the public and
other stakeholders regarding odour issues?
W05-1108 March 2005 Page 9
• No.
a) If yes: Has this resulted in an increase or a decrease in the number of odour complaints that you receive?
17. Has your odour management program engaged the public and other stakeholders? • No. 18. Has it increased public awareness of odour issues? • No. Because it is only applied if odour is already a subject. • But public awareness is increased in general due to public health and
environmental aspects. 19. Are senior politicians engaged? • No. Never. We always try to keep politicians out of decisions because they
normally want only one special decision. Our authorities are bound to neutrality because of our Basic Constitutional Law of the Federal Republic of Germany. Therefore as a rule people accept the decisions taken by the local authority responsible.
• Odour not a health issue – just a nuisance • Only health issue in very rare cases • Odour intensity usually about 3 - not higher • Only rarely find unpleasant odours usually have biofilters that prevent odour
occurring in the first place.

W05-1108 March 2005 Page 1
Jurisdiction: Infomil, The Netherlands Person Interviewed: André Peeters Weem Date: March, 2005
1. Our understanding of your odour management program is that it is set out in the
Netherlands Emission Guidelines for Air (NeR) and that there are specific emission and imission (i.e. ambient) limits set for various industries. The NeR does not have any legal status; however, any departure from it must be adequately explained. The specific targets for various industries are defined as 1-hour average odour concentrations that should not be surpassed more than 2% of all hours in an average meteorological year. The target values range from C98,1-hour ≤ 0.5 ouE/m3 for rendering plants to C98,1-hour ≤ 3.5 ouE/m3 for coffee roasters. The stated policy objective of the regulator in the Netherlands is to limit the fraction of people annoyed by odours to 12%. You also make use of minimum setback distances or buffers for agricultural facilities.
a) Is this correct?
• Yes, in general this is a correct representation, although there are some details and
specific topics. The 12% number refers to the number of households that are annoyed by odour.
b) Do you have any formal regulations in your legislation that pertain to
odour, such as a nuisance law?
• No, there is an environmental management law that gives provisions to the local competent authorities to manage the local environmental quality. In 1995 the odour policy was laid down in a letter from the minister of environment and in several guidelines.
- Is that letter available in English?
• Yes – Annex 4.4
c) Is there anything that you would add?
2. How long ago was your odour management program implemented? - My understanding is that exposure criteria were originally set in 1984, amended in
1995 then formalized in the NeR in 2000 – is this correct? • This is almost correct. The exposure criteria were drafted in 1984, [and used in
practice but not formalized into law] then amended and finally laid down in a letter from the Minister of Environment in 1995. The NeR is a guideline, and in 1995 this was adapted to the odour policy as it was established in that year.
W05-1108 March 2005 Page 2
• 1978 – odour policy initially developed. • Livestock farming and slaughter houses. • Took info from Germany. - Just to clarify, the NeR dates back to 1995 not 2000? • 1992 3. What was the rationale or justification for establishing your program? (e.g.,
nuisance avoidance, reducing complaints, concern for human health, etc.) • The rationale for the programme was in all of these aspects. Other important
aspects were facilitating the process of environmental licensing, prevention of legal procedures and harmonisation of local environmental policies between different parts of the country.
• To prevent court cases (settle out of court) – there were a lot of difficult ones. • Licensing done by local authority – court could use NeR as well • Worked well for some branches of industry but not others. 4. In your program, when does odour become a problem? Are there specific triggers,
such as odour standards or number of complaints? • There are no triggers specified in the programme. The local competent authority
has to decide if odour nuisance in a given situation is a problem or not. In general the competent authorities use the information in the NeR to make an assessment of the situation. This is however not mandatory.
• If the competent authority, i.e. the municipality or the province, has decided that there is a situation of odour nuisance they have to use the environmental license, sometimes in combination with spatial planning, to reduce the nuisance to an acceptable level.
- What requirements are written into an environmental license – a minimum setback
distance? i.e., the results of nomograms or dispersion modelling? Or the measures that must be used to achieve the target odour limits?
• Depends on situation, local authority , type of facility, size of facility, land use –
numerical limits can be in permit or can be basis of other conditions in permit • e.g.:
o 1. Minimum distance written into license; or o 2. If distance too small – make other conditions such as emission rate
eg. 1,000,000 ou/hr – have to do periodic testing; or o 3. Ambient standard in vicinity of facility e.g. 200m has to be
< x ou/m3 greater flexibility; or o 4. Exact prescription of odour abatement technology.

W05-1108 March 2005 Page 3
5. Does your program include public or stakeholder consultation? Do you have procedures for such consultation? (If yes, could you provide them?)
• There are mandatory procedures for public and stakeholder consultation. These
are the standard procedures that the environmental management law and the law on spatial planning demand from the competent authority.
• I do not have information on these procedures in English. 6. We understand that your program includes the following ambient standards as well
as minimum separation distances for agriculture – is that correct? • Yes. For several branches of industry the NeR gives environmental quality
standards for odour nuisance. For some industrial activities the NeR also gives separation distances, mainly for waste handling. For agricultural activities, ie livestock farming, we use separation distances.
- Where can I find more information on the separation distances for farming? • No English information – but based on some distances that Germans used
although more detailed.

W05-1108 March 2005 Page 4
JURISDICTION OFFSITE
STANDARD OR
GUIDELINE (OU m-3)
AVERAGING TIME
FREQUENCY CRITERIA
LAND USE SOURCE TYPE
USE (PERMIT,
GUIDANCE ETC.)
OTHER COMMENTS
>>5 ouE/m3 1 hour 98% Bakeries No limit value 1.5 ouE/m3 1 hour 98% Limit value 0.8 ouE/m3 1 hour 98%
Meat Processing Target value
2.5 ouE/m3 1 hour 98% Grass dryers Limit value 5 ouE/m3 1 hour 98% Bakeries, pastry Limit value
3.5 ouE/m3 1 hour 98% Coffee roasters Limit value 3.5 ouE/m3 1 hour 98% Limit value 2.0 ouE/m3 1 hour 98%
Flavours & fragrances Target value
0.5 ouE/m3 1 hour 98% Residential dwellings
WWTP, Greenfield site
Limit value
1.0 ouE/m3 1 hour 98% Rural area or industrial estate
WWTP, Greenfield site
Limit value
1.5 ouE/m3 1 hour 98% Residential dwellings
WWTP, existing site
Limit value
3.5 ouE/m3 1 hour 98% Rural area or industrial estate
WWTP, existing site
Limit value
1 ouE/m3 1 hour 98% Livestock feed production
Limit value
1.5 ouE/m3 1 hour 98% Limit value 0.5 ouE/m3 1 hour 98%
Composting, organic fraction of domestic waste, Greenfield site
Target value
3.0 ouE/m3 1 hour 98% Limit value 1.5 ouE/m3 1 hour 98%
Composting, organic fraction of domestic waste, existing facility
Target value
1.5 ouE/m3 1 hour 98% Limit value
The Netherlandsg
0.55 ouE/m3 1 hour 98% Slaughterhouses
Permit
Target value

W05-1108 March 2005 Page 5
7. Regarding your ambient and minimum distance separation standards:
a) how were their standards established? • The standards and separation distances were based on (not in order of
importance): experience, scientific knowledge and research, social surveys, available technological measures, and economic viability. The standards were established by working groups that consisted of representatives from the government, industry, consultants and universities.
b) how important are the standards to the program? (i.e., would the program
be successful without them) • These standards are a vital part of the programme. No standards, no programme.
c) How are these standards used? (e.g., planning, response, enforcement,
warnings, guidance, BACT, etc.)
• These standards are used for all these purposes. 8. Are there approved sampling or analytical methods? (If yes, could you please
provide documentation.) • In the Netherlands we use the European standard for odour measurement CEN
13725, and we have a guideline for taking odour samples. This guideline is however not available in English.
9. Are there standard or approved methods for estimating emissions? (If yes, could you
please provide documentation.) • There is not a specific approved method to estimate emissions. For specific
activities however the NeR gives emission factors and calculation methods (as in table in this questionnaire). On the basis of this information an estimate of odour emissions and of the expected environmental quality can be made.
• Apart from these specified methods there is a common understanding of the best practice to make estimates of situations of possible odour nuisance.
10. Do you use any odour avoidance or land use planning tools such as dispersion
modelling, education, industry preventative steps, municipal planner involvement, stakeholder involvement?
• Yes, we use all of these. • Program to reduce VOCs in print shops – to address odour and ozone - substitute
VOCs with water in paint and printing ink.

W05-1108 March 2005 Page 6
• Use more closed installations less dust and odour and improved occupational health.
• Rendering plants – force them to use closed system to trap blood and cooling system – improves occupational health and odour – blood was no longer a waste stream but a by-product used in pet food.
11. Would you describe your odour management program as successful? • Yes 12. Do you have a measure for success?
i) If yes, could you please explain it?
• Yes. • Every second year the national statistics office performs a survey of the way
households experience the local environmental quality. This survey is based on personal interviews.
• This had been done since the 80’s. The odour nuisance from all sources (industry, agriculture, traffic, neighbours) has reduced from about 27 % to 21 % over a period of 15 years. Odour nuisance because of industrial activities had dropped from 15% in the eighties to 9 % in 2003.
- Are the survey results available in English? If not, what sort of questions do they
ask? • Dutch Statistical Website www.cbs.nl will send link. • Survey based on psychological research – contains lots of questions about
housing – hidden questions about local environment • Created a long time ago. • Also do surveys for one-off monitoring of an odour problem. • Need at least a1,000 households and have to have at least 500 responses. • 25 questions and only 2 about odour, which are used to assess way people react to
local environment quality with regards to odour.
ii) If no: How do you define successful?
13. Do you track how many odour complaints you receive each year? • There is no national database. There are however several local systems to track
odour complaints. The largest and most elaborate system is used in the Rotterdam harbour area. The Rijnmond environmental agency has a special desk for environmental complaints. Each year they get more than 10.000 complaints about environmental nuisance in the Rotterdam harbour area, about dust, noise and odour. In general odour complaints make up 30 to 50 % of the total number of complaints in Rotterdam each year.

W05-1108 March 2005 Page 7
a) If yes: Has the number of odour complaints decreased since you implemented
or made a change to your odour management plan? • That is hard to say. In places where a tracking system was in operation for a long
time a small decrease can be seen. In many places tracking systems are in operation since 1995 or later and this is in general too short to see significant effects.
• What is clear however is the fact that a large reduction of odour emissions, e.g. 90%, in general only will lead to a small reduction in complaints and that it takes many years before levels of complaints go down.
- Interesting comment. What is this finding based on? • Based on André’s experience • In Rotterdam area (4 refineries, ~20 large chemical industry) – people live and
work – odour problem since the ‘60’s – a lot of technical measurements taken – odours reduced significantly and the number of complaints go down but not as much as you might think – facility upsets cause complaints but there are not as many day-to-day odour issues/complaints as there used to be.
• Also people have memory of odour nuisance – still annoyed by facilities that were closed two years ago.
• Takes a few years for people to recognize a change/reduction in odour. 14. Has the workload of staff that deal with odour issues and complaints been reduced
since you implemented your odour management program? • No. We reached more and better results with the same amount of staffing. - Clarify. • Workload hasn’t decreased but doing more • Number of people working on odour control hasn’t changed much in the last 20
years but better results. 15. Are there any particular facilities with a chronic odour problem in your jurisdiction? • Yes.
a) If yes: - Could you provide examples of such facilities? • Yes: examples are: rendering plants, plants drying grass to produce fodder, sugar
beet pulp drying plants, cocoa roasting plants, sea going vessels in the Rotterdam harbour area, ….
- Ask for one particular example
W05-1108 March 2005 Page 8
• Started to collect green waste from houses separately from other household waste
in 1990’s – potentially a significant source of odours. • First facility that was built – government made measurements, developed
emission factors. • Everything had to be done in a closed installation and emissions had to be cleaned
using biofilters or bioscrubber • All this information gained during research and installation of first plant was put
into permits of 20 new facilities • As a result of these preventative measures no real problems/ complaints
associated with this industry. • Same story with WWTPs • Slaughter houses in 1995 similar program
- Made measurements etc. and now under control. - Retrofitted/ redesigned all existing facilities. Closed some down and
retrofitted the better ones. - Has your odour management program resulted in a reduction in the problem or
number of complaints related to those facilities? • There were only small improvements to control odour emissions from these
activities, these were not enough to solve the problem. 16. Does your odour program include a component related to educating the public and
other stakeholders regarding odour issues? • There is no formal component relating to educating the public and stakeholders on
odour nuisance and odour management. There is however a strong informal component, that is based on buildling a network of people who exchange information and knowledge.
- Find out more. • Network is the result of work done in 1990s • Research done in 1994/95 and discussions resulted in 1995 letter from Minister • Maintained this network of industry/consultants /government • Have periodic workshops – another group meets 2-3 times per year – national
conference once every 2 years.
a) If yes: Has this resulted in an increase or a decrease in the number of odour complaints that you receive?
• This has not resulted in an increase. I think that the increased awareness in
government and industry of odour nuisance and ways to control it will lead to a decrease in complaints.

W05-1108 March 2005 Page 9
17. Has your odour management program engaged the public and other stakeholders? • Yes - How do you know? • Network of stakeholders is still active • Also direct contact with branches of industry • Many industries have their own working groups on odour. • Public involved in low-key way. • No program aimed at public but co-operate with universities and environmental
groups – neighborhood action groups. 18. Has it increased public awareness of odour issues? • Yes, mainly in an indirect way through awareness of the technical solutions to
odour nuisance. People learn from the good examples that odour nuisance can be prevented.
19. Are senior politicians engaged? • Since 1995 not anymore. - Clarify – not since 1995?
• Politicians discussed odour policy at national level in 1995 • National politicians no longer interested in the issue. • They moved away from the issue as fast as they could. • Local politicians can be quite involved as they receive complaints etc.

W05-1108 February 2005 Page 1
Jurisdiction: Japan Hiroshi Fujita Office of Odor, Noise and Vibration Ministry of the Environment Date: February 25, 2005
1. Our understanding of your odour management program is: - Offensive Odor Control Law was enacted in 1972 –concentration criteria for 22
substances are designated under this law and there is an instrumental odor measurement method for each substance, mainly using gas chromatography
- 1995 Amendment to the Law introduced olfactory measurement using “triangular odor bag method”. Prefectural Governor can choose a regulation using either the instrumental measurement method of the concentration of individual chemicals or the olfactory measurement method, called the “odor index regulation”
- The Law stipulates that: o 1) Prefectural governors designate regulation areas and establish
regulatory odour standards based on national guidelines o 2) Industry within regulation areas shall comply with regulatory
standards o 3) Mayors may make recommendations or orders to industry to take
measures to reduce odour emissions when they do not comply with standards
o 4) facilities that do not comply with these orders may be penalized - Only regulation areas are subject to the regulation – typical areas are built-up areas
and suburban areas with schools and hospitals - Local governments choose one of the two systems of regulation (concentration of
offensive odour substances or odour index) and establish 3 applicable standards corresponding to 3 types of odour emissions from factories and workshops:
o Standard for gas from vent or exhaust pipe (stack) o Standard for effluent from outlet (pipe for liquids) o Standard for site boundary
a) Is this correct?
• Correct.
b) Is there anything that you would add? No.
2. How long ago was your odour management program implemented? - 1972? • Yes, 1972.

W05-1108 February 2005 Page 2
3. What was the rationale or justification for establishing your program? (e.g., nuisance avoidance, reducing complaints, concern for human health, etc.)
• Preservation of the living environment and people’s health by reducing offensive
odors to a degree that most people do not feel uncomfortable in their daily lives. 4. In your program, when does odour become a problem? Are there specific triggers,
such as odour standards or number of complaints? • Odor problem occurs in our program when odor from a factory within a regulated
area exceeds the regulation standard and simultaneously impairs the living environment of residents.
5. Does your program include public or stakeholder consultation? Do you have
procedures for such consultation? (If yes, please provide documentation.) • Yes and no. Local governments are recommended to consult public or
stakeholders when designating regulation areas and establishing regulatory standards, which is not mandatory.
6. Based on our research we found that you have the following ambient odour standards
and odour emission standards. Are these correct? Are there other standards? • The table concerning ambient standards is correct. However, the table about odor
emission standards is incorrect, since one of the parameters for calculation of odor emission standards is the ambient standard, which is established by each local government. The table about odor index is also incorrect. As for odor index, ambient standard is determined by each local government within the range of 10-21 and odor emission standard is determined using the ambient standard and other parameters. See http://www.env.go.jp/en/lar/olaw/opm.html Described scale in the table is not odor index but odor intensity.
Ambient standards JURISDICTION COMPOUND STANDARD COMMENTS
Acetaldehyde 0.05 - 0.5 ppm Ammonia 1 - 5 ppm Butyraldehyde 0.009 - 0.08 ppm Butyric acid 0.001 - 0.006 ppm Dimethyl disulphide
0.009 - 0.1 ppm
Dimethyl sulphide 0.01 - 0.2 ppm Ethyl acetate 3 - 20 ppm Hydrogen sulphide 0.02 - 0.2 ppm Isobutyraldehyde 0.02 - 0.2 ppm Isobutyl alcohol 0.9 - 20 ppm Isovaleraldehyde 0.003 - 0.01 ppm Isovaleric acid 0.001 - 0.01 ppm
Japand
Methyl isobutyl 1 - 6 ppm
Range of maximum permissible concentrations at ground level on the boundary line of a place of business. Local governments determine what the standards will be for their region based on these ranges of values.

W05-1108 February 2005 Page 3
ketone Methyl mercaptan 0.002 - 0.01 ppm Propionaldehyde 0.05 - 0.5 ppm Propionic acid 0.03 - 0.2 ppm Styrene 0.4 - 2 ppm Toluene 10 - 60 ppm Trimethylamine 0.005 - 0.07 ppm Valericaldehyde 0.009 - 0.05 ppm Valeric acid 0.0009 - 0.004 ppm
Xylene 1 - 5 ppm
Odour Index JURISDICTION RELATED
CRITERIA SCALE DESCRIPTION
0 No odour 1 Barely perceivable (detection threshold) 2 Faint but identifiable (recognition threshold) 3 Easily perceivable 4 Strong
Japanb Odour is acceptable if it is less than 2.5 to 3.5
5 Repulsive

W05-1108 February 2005 Page 4
Odour Emission Standards JURISDICTION CONTAMINANT STANDARD UNITS SOURCE OR
PROCESS TYPE
OTHER COMMENTS
Hydrogen sulphide 0.005 to 1 mg/L Methyl mercaptan 0.001 to 0.2 mg/L Dimethyl sulphide 0.01 to 6 mg/L
Dimethyl disulphide 0.03 to 6 mg/L
Liquid effluent standard in terms of concentration of chemical in effluent
The standard that is applied depends on the volumetric flow rate (Q) of the effluent. See equations & table below
Ammonia 0.108 He2 m3/h
Hydrogen sulphide 0.0022 He2 m3/h
Trimethyl amine 0.0054 He2 m3/h
Propionaldehyde 0.0054 He2 m3/h
n-Butyl aldehyde 0.00097 He2 m3/h
i-Butyl aldehyde 0.0022 He2 m3/h
n-Valeraldehyde 0.00097 He2 m3/h
i-Valeraldehyde 0.00032 He2 m3/h
i-Butanol 0.097 He2 m3/h
Ethyl Acetate 0.32 He2 m3/h
MIBK 0.108 He2 m3/h
Toluene 1.08 He2 m3/h
Japana
Xylene 0.108 He2 m3/h
Stack emission standard in terms of volumetric flow rate of individual chemical
He is the effective stack height – see equations below
7. More questions on your odour standards:
a) how were they established?
• As for ambient standards (both specific odor substances and odor index), they were established to correspond to 2.5-3.5 in odor intensity.
b) how important are they to your odour program? (i.e., would the program
be successful without them)
• They are necessary when local governments recommend or order the business proprietor of the factory to improve operating conditions and preventive measures of odor emitting facilities.
c) How are these standards used? (e.g., planning, response, enforcement,
warnings, guidance, BACT, etc.)
• The answer is the same as above. 8. Are there approved sampling or analytical methods? - gas chromatography for concentration of individual substances? • Yes. Very detailed. See http://www.env.go.jp/en/lar/olaw/mm.html

W05-1108 February 2005 Page 5
• See http://www.env.go.jp/en/lar/regulation/odor.html - “Triangular Odor Bag Method” for odour index? • See http://www.env.go.jp/en/lar/oder_index/index.html 9. Are there standard or approved methods for estimating emissions? (If yes, could you
please provide documentation.) • See http://www.env.go.jp/en/lar/regulation/odor.html 10. Do you use any odour avoidance or land use planning tools such as dispersion
modelling, education, industry preventative steps, municipal planner involvement, stakeholder involvement?
• No. 11. Would you describe your odour management program as successful? • We consider odour management program in Japan is successful in one aspect,
since the number of complaints derived from business activities, which the offensive odor control law in Japan regulates, is decreasing. But in other aspect unsuccessful, since the number of complaints derived from other than business activities, such as private households and outdoor incineration, is increasing.
a) If yes: How do you define success?Do you have a measure for success?
• We do not have any measure for success.
12. Do you track how many odour complaints you receive each year? • Yes. See http://www.env.go.jp/en/lar/offensive_odor/index.html
a) If yes: Has the number of odour complaints decreased since you implemented or made a change to your odour management plan?
• Complaints decreased after the implementation of the law. However, since 1990,
they have been increasing due to the increase in complaints related to complex odors and outdoor incineration.
13. Has the workload of staff who deal with odour issues and complaints been reduced since you implemented your odour management program?
• There is no specific data. 14. Are there any particular facilities with a chronic odour problem in your jurisdiction?

W05-1108 February 2005 Page 6
• Yes.
a) If yes: - Could you provide examples of such facilities?
• Complaints related to complex odors and outdoor incineration has been increasing these days.
- Has your odour management program resulted in a reduction in the problem or number of complaints related to those facilities?
• No. 15. Does your odour program include a component related to educating the public and
other stakeholders regarding odour issues? • There are responsibilities of public in the law. See
http://www.env.go.jp/en/lar/olaw/ch3.html
a) If yes: Has this resulted in an increase or a decrease in the number of odour complaints that you receive?
• No. 16. Has your odour management program engaged the public and other stakeholders? • Yes, see http://www.env.go.jp/en/lar/olaw/ch3.html 17. Has it increased public awareness of odour issues? • There is no specific data. 18. Are senior politicians engaged? • No.