FINAL REPORT - JICAopen_jicareport.jica.go.jp/pdf/11668118_01.pdf · - i - the study on sanitation...
282
Japan International Cooperation Agency (JICA) Haiphong People's Committee Socialist Republic of Vietnam The Study on Sanitation Improvement Plan for Haiphong City in The Socialist Republic of Vietnam FINAL REPORT July 2001 Nippon Koei Co., Ltd. EX Corporation S S S 01 95 J R MAIN REPORT VOLUME 2: FEASIBILITY STUDIES FOR THE PRIORITY PROJECTS
Transcript of FINAL REPORT - JICAopen_jicareport.jica.go.jp/pdf/11668118_01.pdf · - i - the study on sanitation...
Japan International Cooperation Agency (JICA)
Haiphong People's CommitteeSocialist Republic of Vietnam
The Studyon
Sanitation Improvement Plan for Haiphong Cityin
The Socialist Republic of Vietnam
FINAL REPORT
July 2001
Nippon Koei Co., Ltd.
EX Corporation
S S S
0 1 95J R
MAIN REPORTVOLUME 2: FEASIBILITY STUDIES FOR THE PRIORITY PROJECTS

LIST OF REPORTS
SUMMARY
MAIN REPORT
Volume 1 Sanitation Master Plan
Volume 2 Feasibility Studies for the Priority Projects
SUPPORTING REPORT
DATA BOOK
Note: All the figures shown in the tables of the reports were set or estimated by the JICA
Study Team in case data sources are not written.
EXCHANGE RATE FOR COST ESTIMATION
Estimate of Base Cost : As of June 2000 Price Level
Currency Exchange Rate : USD1.0 = VND14,072

- i -
THE STUDY ON SANITATION IMPROVEMENT PLAN FOR HAIPHONG CITY
IN THE SOCIALIST REPUBLIC OF VIETNAM
FINAL REPORT
MAIN REPORT
VOLUME 2: FEASIBILITY STUDIES FOR THE PRIORITY PROJECTS
Table of Contents
PART 1 OUTLINES OF THE SELECTED PRIORITY PROJECT
CHAPTER 1 OUTLINE OF THE PRIORITY PROJECTS 1.1 Selected Priority Projects ....................................................................... 1-1 1.2 Drainage Priority Project ........................................................................ 1-1 1.3 Sewerage Priority Project....................................................................... 1-2 1.4 Solid Waste Management Priority Project ............................................... 1-2
CHAPTER 2 IMPLEMENTATION SCHEDULE AND COST REQUIREMENT
2.1 Construction Plan of Selected Priority Project ........................................ 1-5 2.2 Basic Conditions of Cost Estimate for the Selected Priority Projects....... 1-16 2.3 Implementation Schedule and Cost Estimate for Priority Projects ........... 1-18
CHAPTER 3 METHODOLOGY FOR EVALUATING PRIORITY PROJECT FEASIBILITY ............................................................ 1-20
PART 2 FEASIBILITY STUDY OF DRAINAGE PRIORITY PROJECT
CHAPTER 1 BACKGROUND 1.1 Drainage Improvement Master Plan........................................................ 2-1 1.2 Selection of Drainage Priority Project..................................................... 2-6
CHAPTER 2 RECOMMENDED DRAINAGE PRIORITY PROJECT 2.1 System Concept of Priority Project......................................................... 2-8 2.2 Compatibility with Other Projects........................................................... 2-10
- ii -
2.3 Main Project Components ...................................................................... 2-13 2.4 Planning and Design Methodology ......................................................... 2-13 2.5 Methodology for Assessing Flood Reductions ...................................... 2-15
CHAPTER 3 REHABILITATION OF AN KIM HAI CHANNEL 3.1 Planning Issues and Design Criteria ........................................................ 2-24 3.2 Alternative Study ................................................................................... 2-25 3.3 Technical Design.................................................................................... 2-28
CHAPTER 4 CONSTRUCTION OF PHUONG LUU LAKE 4.1 Planning Issues and Design Criteria ........................................................ 2-37 4.2 Alternative Study ................................................................................... 2-38 4.3 Technical Design.................................................................................... 2-40
CHAPTER 5 SUPPLEMENTARY COMPONENTS 5.1 New Combined Sewers .......................................................................... 2-44 5.2 Channel Road Bridges............................................................................ 2-45 5.3 Ancillary Works...................................................................................... 2-45
CHAPTER 6 COSTS ESTIMATES 6.1 Investment Costs.................................................................................... 2-46 6.2 O&M Costs ........................................................................................... 2-46
CHAPTER 7 PROJECT IMPLEMENTATION PLAN 7.1 Implementation Schedule ....................................................................... 2-48 7.2 Operational and Organization Plan ......................................................... 2-48
CHAPTER 8 PROJECT EVALUATION 8.1 Objective Achievement ........................................................................... 2-53 8.2. Economic Evaluation ............................................................................. 2-56 8.3 Financial Evaluation and Affordability..................................................... 2-62 8.4 Technical Evaluation .............................................................................. 2-66 8.5 Environmental Impact Assessment.......................................................... 2-67 8.6 Organizational Setup and Capability of the Implementing and
Managing Bodies ................................................................................... 2-72 8.7 Overall Project Evaluation...................................................................... 2-74
PART 3 FEASIBILITY STUDY OF SEWERAGE PRIORITY PROJECT
CHAPTER 1 BACKGROUND 1.1 Sewerage Improvement Master Plan ...................................................... 3-1 1.2 Selection of Sewerage Priority Project.................................................... 3-6
CHAPTER 2 SEWERAGE PRIORITY PROJECT 2.1 System Concept of Priority Project......................................................... 3-7 2.2 Compatibility with Other Projects........................................................... 3-7

- iii -
2.3 Project Components............................................................................... 3-8 2.4 Planning and Design Methodology ......................................................... 3-8
CHAPTER 3 COMBINED SEWER OVERFLOWS (CSO) 3.1 Planning Issues and Design Criteria ........................................................ 3-11 3.2 Alternative Study ................................................................................... 3-11 3.3 Technical Design.................................................................................... 3-14
CHAPTER 4 SEWER PIPELINES 4.1 Planning Issues and Design Criteria ........................................................ 3-16 4.2 Alternative Study ................................................................................... 3-17 4.3 Technical Design.................................................................................... 3-19
CHAPTER 5 PUMPING STATION 5.1 Planning Issues and Design Criteria ........................................................ 3-23 5.2 Alternative Study ................................................................................... 3-23 5.3 Technical Design.................................................................................... 3-24
CHAPTER 6 WASTEWATER TREATMENT PLANT (WWTP) 6.1 Planning Issues and Design Criteria ........................................................ 3-27 6.2 Alternative Study ................................................................................... 3-27 6.3 Technical Design.................................................................................... 3-28
CHAPTER 7 SUPPLEMENTARY COMPONENT 7.1 Manhole Pump ....................................................................................... 3-36 7.2 Interceptor Pipe ..................................................................................... 3-36
CHAPTER 8 COST ESTIMATES 8.1 Investment Cost ..................................................................................... 3-37 8.2 O&M Cost ............................................................................................. 3-38
CHAPTER 9 PROJECT IMPLEMENTATION PLAN 9.1 Implementation Schedule ....................................................................... 3-39 9.2 Operational and Organization Plan ......................................................... 3-39
CHAPTER 10 PROJECT EVALUATION 10.1 Objective Achievement ........................................................................... 3-45 10.2 Economic Evaluation ............................................................................. 3-46 10.3 Financial Evaluation and Affordability..................................................... 3-49 10.4 Technical Evaluation .............................................................................. 3-52 10.5 Environmental Impact Assessment.......................................................... 3-53 10.6 Organizational Setup and Capability of the Implementing and
Managing Bodies ................................................................................... 3-57 10.7 Overall Project Evaluation...................................................................... 3-59

- iv -
PART 4 FEASIBILITY STUDY ON THE SOLID WASTE MANAGEMENT PRIORITY PROJECT
CHAPTER 1 ASSESSMENT OF THE EXISTING SITUTATION 1.1 Introduction........................................................................................... 4-1 1.2 Waste Collection and Transport .............................................................. 4-2 1.3 Waste Disposal....................................................................................... 4-3 1.4 Hospital Waste Management .................................................................. 4-6
CHAPTER 2 WASTE QUANTITY AND QUALITY 2.1 Municipal Waste Quantity....................................................................... 4-8 2.2 Solid Waste Quality................................................................................ 4-9
CHAPTER 3 WASTE COLLECTION AND TRANSPORT PLAN 3.1 Solid Waste Management Policy............................................................. 4-13 3.2 Target Waste Collection Services............................................................ 4-13 3.3 Proposed Waste Collection System......................................................... 4-14 3.4 Equipment Procurement Plan ................................................................. 4-21 3.5 Operation and Maintenance Plan ............................................................ 4-26 3.6 Cost Estimation...................................................................................... 4-27
CHAPTER 4 TRANG CAT PHASE 3 LANDFILL PLAN 4.1 Planning Policy and Design Conditions................................................... 4-30 4.2. Facility Plan and Design ......................................................................... 4-34 4.3 Landfill Operation and Management ....................................................... 4-46 4.4 Cost Estimation...................................................................................... 4-53
CHAPTER 5 HOSPITAL WASTE MANAGEMENT PLAN 5.1 Planning Objective, Policy and Design Conditions .................................. 4-55 5.2 Proposed System of Hospital Waste Management................................... 4-58 5.3 Facility Specification .............................................................................. 4-62 5.4 Operation and Maintenance Plan for Hospital Incinerator ....................... 4-65 5.5 Cost Estimation...................................................................................... 4-67 5.6 Fee Collection........................................................................................ 4-68
CHAPTER 6 COST ESTIMATION 6.1 Construction and Procurement ............................................................... 4-69 6.2 Operation and Maintenance Costs .......................................................... 4-70
CHAPTER 7 PROJECT IMPLEMENTATION PLAN 7.1 Implementation Schedule ....................................................................... 4-71 7.2 Organization Plan for Project Implementation and Management ............. 4-72
CHAPTER 8 PROJECT EVALUATION 8.1 Objective Achievement ........................................................................... 4-76 8.2 Economic Evaluation ............................................................................. 4-80 8.3 Financial Evaluation and Affordability..................................................... 4-83 8.4 Technical Evaluation .............................................................................. 4-87

- v -
8.5 Environmental Impact Assessment.......................................................... 4-89 8.6 Organizational Capability of the Project Implementation and
Administration Bodies............................................................................ 4-94 8.7 Overall Project Evaluation...................................................................... 4-95
PART 5 OVERALL FEASIBILITY OF THE PRIORITY PROJECTS
CHAPTER 1 ECONOMIC AND FINANCIAL FEASIBILITY OF THE COMBINED PROJECT OF DRAINAGE AND SEWERAGE
1.1 Economic Feasibility .............................................................................. 5-1 1.2 Financial Evaluation and Affordability..................................................... 5-2 1.3 Funding Requirements and Financing Plan.............................................. 5-3
CHAPTER 2 ECONOMIC AND FINANCIAL FEASIBILITY OF THE THREE PROJECTS AS PACKAGE
2.1 Aggregate Project Cost .......................................................................... 5-4 2.2 Financial Affordability ............................................................................ 5-4 2.3 Funding Requirements and Financing Plan.............................................. 5-6

- vi -
Tables Part 1 Table 2.3.1 Construction Cost for Drainage Priority Project..................................1-23 Table 2.3.2 Construction Cost for Sewerage Priority Project ................................1-24 Table 2.3.3 Solid Waste Management Priority Project ...........................................1-26 Table 2.3.4 Disbursement Schedule of Overall Project Cost of the Priority
Projects..............................................................................................1-27 Table 2.3.5 Disbursement Schedule of Project Cost for Drainage Priority
Project .............................................................................................1-28 Table 2.3.6 Disbursement Schedule of Project Cost for Sewerage Priority
Project ...............................................................................................1-29 Table 2.3.7 Disbursement Schedule of Project Cost for Solid Waste
Management Priority Project ..............................................................1-30 Part 2 Table 2.2.1 Land Area (km2) and Developed Area Projections for An Kim
Hai Channel Drainage Basin ...............................................................2-75 Table 2.2.2 Results from Computer Simulations (Flood Volume) and
Calculated Flood Areas (ha) ...............................................................2-76 Table 2.3.1 Land Area (km2) and Developed Area Projections for Northeast
and Southwest Drainage Basins ..........................................................2-77 Table 2.8.1 Property Values: Drainage Project ......................................................2-78 Table 2.8.2 Urban Productivity: Drainage Project ..............................................2-79 Table 2.8.3 Key Economic Indicators and Population, Study Area and
Haiphong ...........................................................................................2-80 Table 2.8.4 Drainage Program Costs in Relation to Key Indicators:
Sensitivity to Key Assumptions...........................................................2-81 Table 2.8.5 Drainage Priority Project: Loan Repayment Schedule and Costs
as Percentage of HPPC's Expenditure.................................................2-82 Table 2.8.6 Summary of the Major Impacts and Mitigation Measures for
Drainage Project.................................................................................2-83 Part 3 Table 3.1.1 Class A Area Sewerage Facilities List..................................................3-60 Table 3.1.2 Comparison of Treatment Process ......................................................3-61 Table 3.3.1 Population Estimation for CSO Command Area..................................3-62 Table 3.3.2 Area of Lake in the West Treatment Area............................................3-63 Table 3.3.3 Land, Lake and River Area by District ................................................3-64 Table 3.3.4 Unit Sewage by Phase and District .....................................................3-65 Table 3.3.5 Type of the CSO Control Structure ....................................................3-66 Table 3.3.6 CSO Control Structure List ................................................................3-67
- vii -
Table 3.3.7 Bill of Quantity of Gate Type..............................................................3-68 Table 3.3.8 Bill of Quantity of Orifice Type...........................................................3-69 Table 3.4.1 Minimum Slopes for Gravity-flow Combined Sewer ...........................3-70 Table 3.4.2 Computation Table for Design of the Trunk Sewer .............................3-71 Table 3.4.3 Longitudinal Section of Trunk Sewer..................................................3-75 Table 3.4.4 The Bill of Quantity of Trunk Sewer (By earth covering)....................3-76 Table 3.4.5 The Unit Bill of Quantity of Trunk Sewer ...........................................3-77 Table 3.4.6 The Unit Bill of Quantity of Manhole .................................................3-78 Table 3.5.1 Manhole Pump List ............................................................................3-79 Table 3.5.2 The Bill of Quantity of Manhole Pump ...............................................3-80 Table 3.5.3 Design of An Da Pumping Station ......................................................3-81 Table 3.5.4 The Bill of Quantity of An Da Pumping Station ..................................3-82 Table 3.6.1 Estimated Generation of Sewage (West Treatment Area) ....................3-83 Table 3.6.2 Design of Pumping Station (Combined Sewer System) .......................3-84 Table 3.6.3 Design of Pumping Station (Separate sewer system) ...........................3-85 Table 3.6.4 Stormwater Sedimentation Pond.........................................................3-86 Table 3.6.5 Aerated Lagoon Treatment Process (AL) ...........................................3-87 Table 3.6.6 Settling Pond......................................................................................3-88 Table 3.6.7 Chlorination Tank...............................................................................3-89 Table 3.6.8 Sludge Drying Bed .............................................................................3-90 Table 3.6.9 Pipe Line............................................................................................3-91 Table 3.6.10 Building Space for O&M of WWTP...................................................3-92 Table 3.6.11 Room Space of Control Building ........................................................3-93 Table 3.6.12 The Bill of Quantity of West Wastewater Treatment Plant ...................3-94 Table 3.6.13 The Bill of Quantity of West Wastewater Treatment Plant (E/M).........3-97 Table 3.8.1 Estimated Incremental Staff Number for Drainage and Sewerage
PP by Phase........................................................................................3-98 Table 3.8.2 Estimated Incremental Staff Cost for Sewerage PP by Phase...............3-99 Table 3.8.3 Electricity Charges .............................................................................3-100 Table 3.8.4 Calculation of Chemicals and Cleaning Materials Consumption
Hypo chlorite (NaOCL) for Disinfection.............................................3-101 Table 3.8.5 Sludge Disposal Cost .........................................................................3-102 Table 3.8.6 Wastewater Examination Cost ............................................................3-103 Table 3.10.1 Property Values: Sewerage Project .....................................................3-104 Table 3.10.2 Urban Productivity: Sewerage Project ................................................3-105 Table 3.10.3 Sewerage Program Costs in Relation to Key Indicators:
Sensitivity to Key Assumptions...........................................................3-106 Table 3.10.4 Sewage Priority Project: Loan Repayment Schedule and Costs
as Percentage of HPPC’s Expenditure ................................................3-107 Table 3.10.5 Summary of Major Impacts and Mitigation Measures for
Sewerage Priority Project ...................................................................3-108

- viii -
Part 4 Table 4.2.1 Estimated Waste Collection and Generation in 2000 by Type of
Waste (ton/day) ..................................................................................4-96 Table 4.2.2 Projected Waste Generation and Target Collection Amount by
Company (ton/day).............................................................................4-97 Table 4.3.1 URENCO Waste Collection Vehicle Procurement Plan .......................4-98 Table 4.3.2 URENCO Target Waste Collection Quantity by Collection
Method ..............................................................................................4-99 Table 4.3.3 Kien An Company Waste Collection Vehicle Procurement Plan ...........4-100 Table 4.3.4 Kien An Company Target Waste Collection Quantity by
Collection Method..............................................................................4-101 Table 4.3.5 Do Son Company Waste Collection Vehicle Procurement Plan............4-102 Table 4.3.6 Do Son Company Target Waste Collection Quantity by
Collection Method..............................................................................4-103 Table 4.3.7 Aggregate Waste Collection Vehicles Procurement Plan for the 3
Companies .........................................................................................4-104 Table 4.3.8 The 3 Companies Aggregate Target Waste Collection Quantity
by Collection Method.........................................................................4-105 Table 4.4.1 Investment Cost for Trang Cat Phase 3 Landfill Site
[Non-Hazardous Landfill Field and Leachate Treatment] ....................4-106 Table 4.4.2 Annual Costs of Operation & Maintenance of Trang Cat Phase 3
Landfill Site [Non-hazardous Waste Landfill Filed] .............................4-108 Table 4.4.3 Investment Costs of Trang Cat Phase 3 Landfill Site [Hospital
Waste Incineration Residue Landfill Site]............................................4-109 Table 4.4.4 Annual Costs of Operation & Maintenance of Trang Cat Phase 3
Landfill Site [Incineration Residue Landfill Field] ...............................4-111 Table 4.4.5 Cost Summary of Trang Cat Phase 3 Landfill Site...............................4-112 Table 4.4.6 Summary of Soil Characters in 4 Strata in Trang Cat Site ...................4-113 Table 4.4.7 Consolidation of Stratum 1 by Surcharge Soil of 4m (and 3m)
Height ................................................................................................4-114 Table 4.6.1 Solid Waste Management Priority Project Cost (1) URENCO.............4-115 Table 4.6.2 Solid Waste Management Priority Project Cost (2) Kien An
Company............................................................................................4-116 Table 4.6.3 Solid Waste Management Priority Project Cost (3) Do Son
Company............................................................................................4-117 Table 4.6.4 Solid Waste Management Priority Project Cost (4) The 3
Companies Total.................................................................................4-118 Table 4.8.1 Solid Waste Program Costs in Relation to Key Indicators:
Sensitivity to Key Assumptions...........................................................4-119 Table 4.8.2 Solid Waste Management Priority Project: Loan Repayment
Schedule and Costs as Percentage of HPPC's Expenditure..................4-120 Table 4.8.3 Summary of the Major Impacts and Mitigation Measures of
Solid Waste Management Project........................................................4-121
- ix -
Part 5 Table 5.1.1 Drainage and Sewerage Program Costs in Relation to Key
Indicators: Sensitivity to Key Assumptions .........................................5-7 Table 5.2.1 Haiphong sanitation Priority Project Costs..........................................5-8 Table 5.2.2 Drainage Sewerage and Solid Waste Program Costs in Relation
to Key Indicators: Sensitivity to Key Assumptions ..............................5-9 Table 5.2.3 Priority projects: Loan Repayment Schedule and Costs as
Percentage of HHPC’s Expendigure ...................................................5-10

- x -
Figures Part 1 Figure 2.3.1 Overall Implementation Schedule for Selected Priority Project............1-31 Figure 2.3.2 Implementation Schedule for Drainage Priority Project .......................1-32 Figure 2.3.3 Implementation Schedule for Sewerage Priority Project......................1-33 Figure 2.3.4 Implementation Schedule for Solid Waste Management Priority
Project ...............................................................................................1-34 Part 2 Figure 2.1.1 Modified Target Planning Areas in Class A Areas and Planning
Criteria for Drainage Improvement Plan .............................................2-84 Figure 2.2.1 Given Conditions and Main Project Components of Drainage
Priority Project ...................................................................................2-85 Figure 2.2.2 Drainage Zone Areas of Drainage Priority Project...............................2-86 Figure 2.2.3 Flowchart of Computer Model Development, Simulation and
System Analysis..................................................................................2-87 Figure 2.2.4 Computer Model Layout with Background Map.................................2-88 Figure 2.2.5 Computer Model Layout with Node Labels ........................................2-89 Figure 2.2.6 Rainfall Intensity, Duration and Frequency data Used for Design
of Drainage Priority Projects ..............................................................2-90 Figure 2.2.7 Tide Level Data with Frequency of 10 Year ARI and High Tide
Conditions..........................................................................................2-91 Figure 2.2.8 Design Storm Hyetograph with Frequency of 5 Year ARI during
High Tide Conditions..........................................................................2-92 Figure 2.2.9 Design Storm Hyetograph with Frequency of 10 Year ARI
during Rising Tide Conditions.............................................................2-93 Figure 2.2.10 Design Storm Hyetograph with Frequency of 10 Year ARI
during Falling Tide Conditions............................................................2-94 Figure 2.2.11 Flowchart of Methodology for Assessing Flood Reductions................2-95 Figure 2.2.12 Assessed Flood Reductions in Class A Areas After World Bank
Project ...............................................................................................2-96 Figure 2.2.13 Assessed Flood Reductions of World Bank and FINNIDA
Projects..............................................................................................2-97 Figure 2.3.1 Alternative Channel Layouts (Top Widths and side-Slopes) ................2-98 Figure 2.3.2 Alternative Channel Cross-Section Benchmark Designs ......................2-99 Figure 2.3.3 Simulated Water Levels in An Kim Hai Channel: 5 Year ARI
Storm, High Tide................................................................................2-100 Figure 2.3.4 Simulated Water Levels in An Kim Hai Channel: 10 Year ARI
Storm, Rising Tide..............................................................................2-101 Figure 2.3.5 Simulated Water Levels in An Kim Hai Channel: 10 Year ARI
Storm, Falling Tide.............................................................................2-102

- xi -
Figure 2.3.6 Outline of Selected Design Layout for Rehabilitation Design of An Kim Hai Channel...........................................................................2-103
Figure 2.3.7 An Kim Hai channel Section...............................................................2-104 Figure 2.3.8 Tidal Gate Plan and Section................................................................2-105 Figure 2.4.1 Phuong Luu Lake Layout Alternative PL-1.........................................2-106 Figure 2.4.2 Phuong Luu Lake Layout Alternative PL-2.........................................2-107 Figure 2.4.3 Phuong Luu Lake Layout Alternative PL-3.........................................2-108 Figure 2.4.4 Phuong Luu Lake Layout Alternative PL-4.........................................2-109 Figure 2.4.5 Results from Computer Simulations: Water Levels in Phuong
Luu Lake............................................................................................2-110 Figure 2.4.6 Results from Computer Simulations: Water Levels in An Bien
Lake...................................................................................................2-111 Figure 2.4.7 Results from Computer Simulations: Water Levels in Du Hang
Lake...................................................................................................2-112 Figure 2.4.8 Results from Computer Simulations: Water Levels in Sen Lake...........2-113 Figure 2.4.9 Preliminary Layout Design of Phuon Luu Lake and Connections ........2-114 Figure 2.4.10 Lake Bank Protection and Road Plan and Section...............................2-115 Figure 2.4.11 Box Culvert (B 3.0m x H 2.0m x 3) Section .......................................2-116 Figure 2.8.1 Incremental Flood Reductions in Central Area After
Implementation of Phase I Projects.....................................................2-117 Part 3 Figure 3.1.1 Sewerage Facilities Map.....................................................................3-109 Figure 3.2.1 Combined Sewer system Mechanism ..................................................3-110 Figure 3.2.2 Combined Sewer system Mechanism ..................................................3-111 Figure 3.2.3 Modification of the Coverage Area .....................................................3-112 Figure 3.3.1 Location of Existing Sewer ................................................................3-113 Figure 3.3.2 Weir Type CSO Control Structure ......................................................3-114 Figure 3.3.3 Orifice Type CSO Control Structure...................................................3-115 Figure 3.3.4 Gate Type CSO Control Structure ......................................................3-116 Figure 3.4.1 Selection Procedure for CSO and Trunk .............................................3-117 Figure 3.4.2 Alternate Trunk Route........................................................................3-118 Figure 3.4.3 Trunk Network ..................................................................................3-119 Figure 3.4.4 Sewerage Network.............................................................................3-120 Figure 3.4.5 Schematic Layout of Sewer Network .................................................3-121 Figure 3.4.6 Manhole Plan and Section ..................................................................3-122 Figure 3.4.7 Sewer Pipe Bedding Section...............................................................3-123 Figure 3.5.1 An Da Pumping Station Plan ..............................................................3-124 Figure 3.5.2 Manhole Type Pumping Station Plan and Section................................3-125 Figure 3.5.3 An Da Pumping Station Plan ..............................................................3-126 Figure 3.5.4 An Da Pumping Station Section .........................................................3-127 Figure 3.6.1 Waste Water Treatment Plant ..............................................................3-128 Figure 3.6.2 Sewerage Priority Project ...................................................................3-129

- xii -
Figure 3.6.3 Flow Diagram of Treatment Plant .......................................................3-130 Figure 3.6.4 Pump Station Plan and Section...........................................................3-131 Figure 3.6.5 Stormwater Sedimentation Pond Plan and Section..............................3-132 Figure 3.6.6 Splitter Chamber Plan and Section......................................................3-133 Figure 3.6.7 Aerated Lagoon Plan and Section.......................................................3-134 Figure 3.6.8 Settling Pond Plan and Section...........................................................3-135 Figure 3.6.9 Sludge Drying Bed Plan and Section...................................................3-136 Figure 3.6.10 Control Building Plan and Section......................................................3-137 Figure 3.6.11 O&M Machine Building .....................................................................3-138 Figure 3.6.12 West Wastewater Treatment Plant Plan ...............................................3-139 Figure 3.6.13 West WWTP Plan...............................................................................3-140 Figure 3.6.14 Hydraulic Longitudinal Profile ............................................................3-141 Figure 3.6.15 Internal Pipeline Layout Plan for the Treatment Plan...........................3-142 Part 4 Figure 4.4.1 Location of Waste Landfill Sites in Haiphong City ..............................4-122 Figure 4.4.2 Trang Cat Site Layout Plan.................................................................4-123 Figure 4.4.3 Layout Plan of Trang Cat Phase 3 Landfill site....................................4-124 Figure 4.4.4 Cross-section of Landfill site at Final Stage.........................................4-125

- xiii -
Abbreviations
Government of Vietnam/Public Institutions
DI : Department of Industry
DARD : Department of Agriculture and Rural Development DOC : Department of Construction
DOF : Department of Finance
DOH : Department of Health
DOSTE : Department of Science, Technology and Environment
EMD : Environmental Management Division
GOV : Government of Vietnam
HP : Haiphong
HPPC : Haiphong People’s Committee
MOC : Ministry of Construction
MOF : Ministry of Finance
MOI : Ministry of Industry
MOSTE : Ministry of Science, Technology and Environment
MPI : Ministry of Planning and Investment
NEA : National Environmental Agency
NIED : National Institute for Educational Development NIURP : National Institute for Urban and Rural Planning
PMU : Project Management Unit
SADCO : Sewerage And Drainage Company
SC : Steering Committee
SCPE : Scientific Center for Population and Environment
TEDI : Transportation Engineering Design Institute
TUPWS : Transport and Urban Public Works Service
URENCO : Urban Environment Company
VIWASE : Vietnam Institute for Water and Sanitation Engineering
WSCO : Water Supply Company
International / Foreign Organizations
ADB : Asian Development Bank AIT : Asian Institute of Technology
ASEAN : Association of Southeast Asian Nations AusAID : Australian Agency for International Development CIDA : Canadian International Development Agency
DIDC : Department for International Development Cooperation of the Ministry for Foreign Affairs of Finland
EU : European Union
FINNIDA : Finnish International Development Agency IBRD (WB) : International Bank for Reconstruction and Development
(World Bank)
- xiv -
IFC : International Finance Agency
JBIC : Japan Bank for International Cooperation
JICA : Japan International Cooperation Agency
NGO : Non-Government Organization
OECD : Organization for Economic Cooperation and Development
SIDA : Swedish International Development Agency
UNDP : United Nations Development Program
UNICEF : United Nations Children’s Fund
UNIDO : United Nations Industrial Development Organization
WB : World Bank
WHO : World Health Organization
Peculiar Abbreviations for this Study
City MP : Haiphong City Master Plan
DVEZ : Dinh Vu Economic zone
NDA : New Development Area
NUA : New Urban Area
OCC : Old City Center
SA : Study Area
SMP : Sanitation Master Plan
The Study : The Study on Sanitation Improvement Plan for Haiphong City
The JICA Study Team
: The JICA Team for the Study on Sanitation Improvement Plan for Haiphong City
Others
ADWF : Average Dry Weather Flow AIDS : Acquired Immuno- Deficiency Syndrome
AJ : Aerated Jokaso
AL : Aerated Lagoon
AnA : Anaerobic Aerobic Process
ARI : Average Recurrence Interval
AS : Activated Sludge
ASP : Activated Sludge Process
BOD : Biochemical Oxygen Demand
BOT : Built, Operate, Transfer
C : Carbon
CAS : Conventional Activated Sludge
CCTV : Closed Circuit Television
CECS : Center for Environmental Chemistry Studies
CEST : Center for Environmental Science and Technology
CH4 : Methane
Cl : Chlorine CNMS : Customer Network Management System

- xv -
CO2 : Carbon dioxide
COD : Chemical Oxygen Demand
CPP : Contact Purification Process
CRES : Center for Regional and Environmental Studies
CSO : Combined Sewer Overflow
CW : Constructed Wetlands
DID : Densely Inhabited District
DO : Dissolved Oxygen
EAR : Environmental Awareness-Raising
EARET : Environmental Awareness-Raising, Education and Training
EE : Environmental Education
EIA : Environmental Impact Assessment
EMP : Environmental Master Plan
ES : Executive Seminars
F/S : Feasibility Study FC : Fecal Coliform
GDP : Gross Domestic Product
GRP : Gross Regional Product
H : Hydrogen
HCMC : Ho Chi Minh City
HDPE : High Density Poly-Ethylene
HIV : Human Immunodeficiency Virus
HPWSSP : Haiphong Water Supply & Sanitation Program
IDF : Intensity-Duration-Frequency
IEE : Initial Environmental Examinations
IUPM : Industrial and Urban Pollution Management
LEP : Law on Environmental Protection
LM : Laboratory and Monitoring
M/P : Master Plan
MEIP : Metropolitan Environmental Improvement Program MT : Membrane Technology
MWSP : Modified Waste Stabilization Pond
N : Nitrogen
NE : North East
NH4 : Ammonium
NRW : Non-Revenue Water
O : Oxygen
O&M : Operation & Maintenance
OD : Oxidation Ditch
ODA : Official Development Assistance
P : Phosphorous
PDWF : Peak Dry Weather Flow
PP : Poly Propylene

- xvi -
PS : Pumping Station
PVC : Poly Vinyl Chloride
RBC : Rotating Biological Contactor
SEDS : National Socio-Economic Development Strategy
SOE : State Owned Enterprises
SOP : Standard Operation Procedure
SP : Stabilization Pond
SPP Sewerage Priority Project
SS : Suspended Solids
STW : Sewage Treatment Works
SW : South West
SWM : Solid Waste Management
SWS : Solid Waste Services
SWTC : Solid Waste Treatment Complex
TC : Total Coliform TCVN : Vietnam Standard
TEQ : Toxic Equivalents
TMS : Time and Motion Survey
T-N : Total Nitrogen
T-P : Total Phosphorous
TSP : Total Suspended Particulate
TWAP : Treated water from Aeration Pond
TWPP : Treated water from Precipitation Pond
UASB : Up-flow Anaerobic Sludge Bed (Reactor)
UFW : Unaccounted For Water
VAT : Vietnam-Australia Training Project
VCEP : Vietnam Canada Environment Project
VIP : Ventilated Improved Pit (Latrine)
WSP : Waste Stabilization Pond
WTP : Water Treatment Plant WWTP : Waste Water Treatment Plant
1A : Vietnam Three Cities Sanitation Program: Haiphong Component
(Water Supply Phase 1)
2A : Vietnam Three Cities Sanitation Program: Haiphong Component
(Water Supply Phase 2)
1B : Vietnam Three Cities Sanitation Program: Haiphong Component
(Drainage & Sewerage)
- xvii -
Units of Measurement
T/Y : tonnes per year
°C : degrees Celsius
g/d : grams per day Gm : Gram
ha : Hectare
kg : kilo gram
km : kilo meter
km2 : Square kilo meter
lpcd : liter per capita per day
m : Meter
m2 : square meter
m3 : cubic meter
m3/d : cubic meter per day
mg/l : milligram per liter
Nm3 : Normal cubic meter
pg : Picogram
t/m3 : tonnes per cubic meter
US$ : United States Dollar
VND : Vietnamese Dong wt% : weight percent

The Study on Sanitation Improvement Plan for Haiphong City, Vietnam
Final Report, Main Report, Volume 2, Part 1
1 - 1
PART 1 OUTLINES OF THE SELECTED PRIORITY PROJECT
CHAPTER 1 OUTLINE OF THE PRIORITY PROJECTS
1.1 Selected Priority Projects
From the Sanitation Master Plan, three priority projects are selected to be implemented by 2010. These are:
• Drainage Priority Project • Sewerage Priority Project • Solid Waste Management Priority Project
The solid waste management priority project consists of three components, namely,
• Waste collection and transport • Trang Cat Phase 3 landfill • Hospital waste management
A brief outline is given in the following and the details are given in subsequent parts. The total capital cost in this section includes the following components: (i) construction/procurement cost, (ii) land acquisition cost, (iii) engineering service cost, (iv) administrative cost, and (v) physical contingency.
1.2 Drainage Priority Project
There are three separate drainage catchments in the priority project area, namely, Southwest, Northeast, and An Kim Hai. The drainage priority project recommends integrating these three to increase the overall drainage performance. To augment the storage capacity, it is recommended to rehabilitate the An Kim Hai Channel and to construct the new Phoung Luu Regulating Lake.
The salient features of the drainage priority project is given below:
• Location Central area of Class A area • Area 1103 ha • Population 240,000 (in 2010) • Rehabilitation An Kim Hai Channel, 10 km • Maintenance road along channel Both sides of An Kim Hai, 5 m wide • Demolition of tidal gate One at Cam River • Construction of tidal gate Two, at Cam River and Lac Tray River • Discharge gate One at Du Hang • Phoung Luu site development 28 ha • Phoung Luu Lake construction 24 ha • Maintenance road along lake 12 m wide • Connecting channel 500 m, 15 m wide
The Study on Sanitation Improvement Plan for Haiphong City, Vietnam
Final Report, Main Report, Volume 2, Part 1
1 - 2
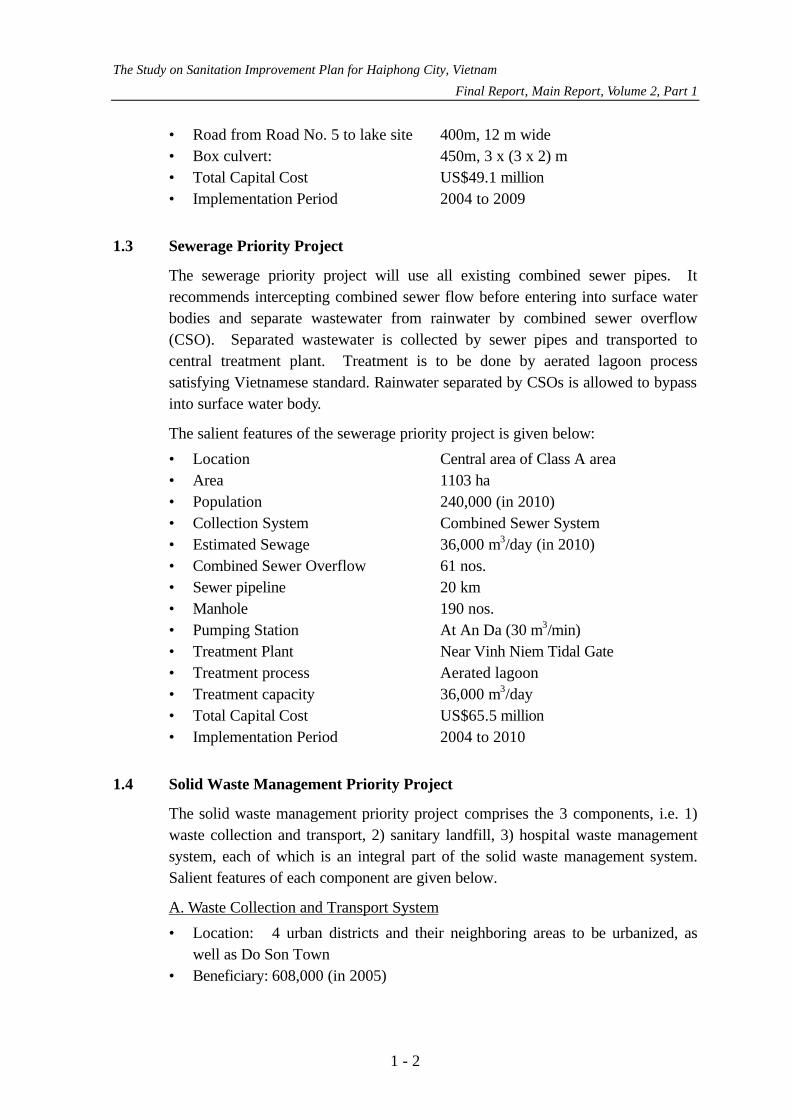
• Road from Road No. 5 to lake site 400m, 12 m wide • Box culvert: 450m, 3 x (3 x 2) m • Total Capital Cost US$49.1 million • Implementation Period 2004 to 2009
1.3 Sewerage Priority Project
The sewerage priority project will use all existing combined sewer pipes. It recommends intercepting combined sewer flow before entering into surface water bodies and separate wastewater from rainwater by combined sewer overflow (CSO). Separated wastewater is collected by sewer pipes and transported to central treatment plant. Treatment is to be done by aerated lagoon process satisfying Vietnamese standard. Rainwater separated by CSOs is allowed to bypass into surface water body.
The salient features of the sewerage priority project is given below:
• Location Central area of Class A area • Area 1103 ha • Population 240,000 (in 2010) • Collection System Combined Sewer System • Estimated Sewage 36,000 m3/day (in 2010) • Combined Sewer Overflow 61 nos. • Sewer pipeline 20 km • Manhole 190 nos. • Pumping Station At An Da (30 m3/min) • Treatment Plant Near Vinh Niem Tidal Gate • Treatment process Aerated lagoon • Treatment capacity 36,000 m3/day • Total Capital Cost US$65.5 million • Implementation Period 2004 to 2010
1.4 Solid Waste Management Priority Project
The solid waste management priority project comprises the 3 components, i.e. 1) waste collection and transport, 2) sanitary landfill, 3) hospital waste management system, each of which is an integral part of the solid waste management system. Salient features of each component are given below.
A. Waste Collection and Transport System
• Location: 4 urban districts and their neighboring areas to be urbanized, as well as Do Son Town
• Beneficiary: 608,000 (in 2005)

The Study on Sanitation Improvement Plan for Haiphong City, Vietnam
Final Report, Main Report, Volume 2, Part 1
1 - 3
• Operators 3 waste management companies, i.e. URENCO, Kien An Urban Works Company, and Do Son Public Works Company
• Collection System With the implementation of the Priority Project, shift from the existing handcart collection system to the direct collection system with mechanical waste loading into vehicles using bins is planned.
• Waste Collection Capacity 761 ton/day on average (in 2005) • Equipment to be Procured • Waste collection vehicles (43 units)
• Bins and handcarts (1,234 units) • Workshop equipment (3 sets)
• Total Capital Cost US$4.6 million • Procurement Year 2004 • Useful period of equipment 10 years from 2005 to 2014
B. Trang Cat Phase 3 Landfill Site
• Location A part of Trang Cat Site (60 ha in total) in Trang Cat Commune
• Area 32.7 ha • Beneficiaries 528,000 (in 2005) • Disposal System Sanitary Landfill of Semi-aerobic type • Total Waste Receiving Capacity 2.6 million ton • Types of waste to be received • Solid waste excluding industrial waste,
• Incineration residue of medical waste and leachate treatment sludge
• Main Facilities • Dyke (waste retaining structure) • Leachate collection & treatment system • Gas ventilation system • On-site road • Heavy equipment • Cover soil
• Total Capital Cost US$10.6 million • Construction Period 2 years from 2004 to 2005 • Operation Period 10 years from 2005 - 2014
C. Hospital Waste Management System
• System Components • In-hospital storage room for infectious waste
• Waste collection vehicles (1.5 ton/unit x 2 units)
The Study on Sanitation Improvement Plan for Haiphong City, Vietnam
Final Report, Main Report, Volume 2, Part 1
1 - 4
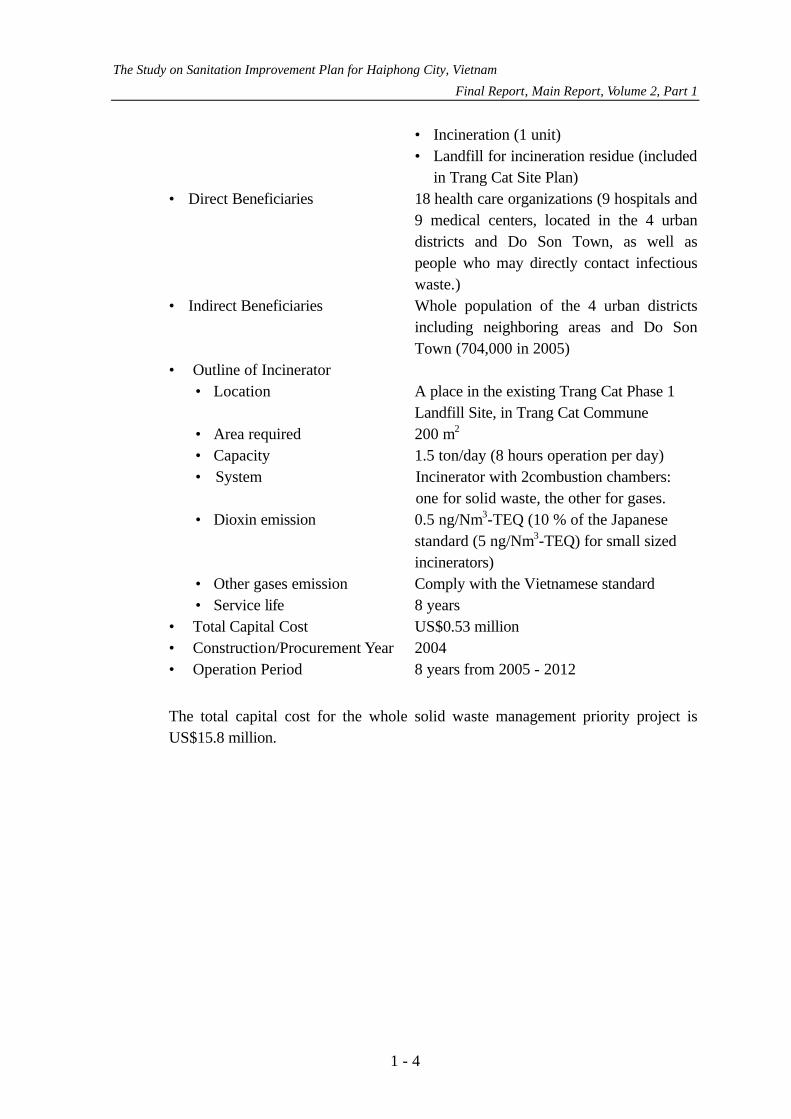
• Incineration (1 unit) • Landfill for incineration residue (included
in Trang Cat Site Plan) • Direct Beneficiaries 18 health care organizations (9 hospitals and
9 medical centers, located in the 4 urban districts and Do Son Town, as well as people who may directly contact infectious waste.)
• Indirect Beneficiaries Whole population of the 4 urban districts including neighboring areas and Do Son Town (704,000 in 2005)
• Outline of Incinerator • Location A place in the existing Trang Cat Phase 1
Landfill Site, in Trang Cat Commune • Area required 200 m2 • Capacity 1.5 ton/day (8 hours operation per day) • System Incinerator with 2combustion chambers:
one for solid waste, the other for gases. • Dioxin emission 0.5 ng/Nm3-TEQ (10 % of the Japanese
standard (5 ng/Nm3-TEQ) for small sized incinerators)
• Other gases emission Comply with the Vietnamese standard • Service life 8 years
• Total Capital Cost US$0.53 million • Construction/Procurement Year 2004 • Operation Period 8 years from 2005 - 2012
The total capital cost for the whole solid waste management priority project is US$15.8 million.
The Study on Sanitation Improvement Plan for Haiphong City, Vietnam
Final Report, Main Report, Volume 2, Part 1
1 - 5
CHAPTER 2 IMPLEMENTATION SCHEDULE AND COST REQUIREMENT
2.1 Construction Plan of Selected Priority Project
2.1.1 Basic Conditions and Assumption for Establishing Construction Plan
The construction plans of selected priority projects are prepared on the basis of following conditions:
(1) Workable Day
Workable days for earth works such as embankment, excavation and hauling, and concrete works are considered to be dominated by the weather conditions, especially rainfall. Therefore, the rainy days in the study area are examined by using the rainfall record at Phu Lien Observation from 1971 to 1997, located on a hilltop at Kien An at an elevation of 113 m. The annual workable days are estimated assuming that the works are to be suspended on Sunday, national holidays and rainy days.
• Rainy season : From May to October • Dry season : From November to April • Non- workable day
Sunday : 52 days National holiday : 8 days Suspended day due to rainfall, 3.1-5 mm
Earthworks : 6.7 days Other works : 0
Suspended day due to rainfall, 5.1-10 mm Earthworks : 12.6 days Other works : 0
Suspended day due to rainfall, 10.1-20 mm Earthworks : 16 days Other works : 16 days
Suspended day due to rainfall, 20.1-50 mm Earthworks : 26.7 days
Other works : 26.7 days Suspended day due to rainfall, over 50 mm
Earthworks : 20.2 days Other works : 20.2 days
• Average annual workable days Earthworks = 365-52-8-82.2=223 days Other works =365-52-8-62.9=242 days

The Study on Sanitation Improvement Plan for Haiphong City, Vietnam
Final Report, Main Report, Volume 2, Part 1
1 - 6
(2) Working Hours
Daily working hours are assumed to be 8 hours. 1 shift work will be adopted for all works in principle. However the pipe jacking works are applied by 2 shifts due to underground works.
(3) Construction Method and Equipment
To achieve an efficient and qualified construction works, the mechanized system of construction works, which is currently utilized for construction works of the similar projects in Vietnam, is considered for these priority projects. The conventional method and type of equipment will be applied, giving consideration to the local conditions. All the construction equipment to be utilized for the civil works will be provided by the contractor.
2.1.2 Construction Method
(1) Preparatory Works
Some preparatory works and construction facilities are required in the beginning of the implementation. These are access road, temporary buildings, power supply system, water supply system, telecommunication system, assembling and concrete mixing plant, etc.
The construction sites are located in the densely populated and/or outskirts of Haiphong city. Therefore, the planning of preparatory works and construction facilities are made considering the site location, the restriction of rainy season, the magnitude of the construction, and the daily production rate.
The traffic control and temporary road closing are necessitated during these construction works upon the consent of Haiphong Traffic Police Office.
(2) Drainage Priority Project
1) Excavation, Side-slope Lining and Maintenance Road
Total length of the rehabilitation of An Kim Hai channel is about 10 km. The construction of An Kim Hai channel will be made during the dry season from November to April.
The existing channel is situated in the town area and the resident houses are located along both channels. The excavation works will be started after the planned channel land acquisition, and house compensation are settled and the temporary access roads are provided for the service road route.
In case of shallow water depth, the bamboo coffer dikes will be constructed upstream and downstream of the channel manually and then the stagnant

The Study on Sanitation Improvement Plan for Haiphong City, Vietnam
Final Report, Main Report, Volume 2, Part 1
1 - 7
water will be dewatered by a 100 mm diameter submersible pump. Meanwhile, the steel sheet piles of type III will be driven by using 30 kW vibration hammer in case of deep water, and then dried by submersible pumps.
The channel excavation works will be carried out by using manpower and a 0.35 m3 backhoe in the dry area enclosed by bamboo dikes and steel sheet piles. Especially, the muddy sediment material will be handled and loaded into a bucket by manpower. The excavated material will be loaded into 4 ton dump trucks for hauling to the spoil bank in Trang Cat area. At the spoil bank, the material will be dumped and spread by a 10 ton swamp type bulldozer.
The channel section is to be mainly a trapezoidal section with a side-slope lining (wet rubble masonry). The wet rubble masonry works will be carried out in parallel with the excavation in the dry area.
After channel excavation is made, the side-slope of the channel is thoroughly trimmed by manpower. The foundation works of riverbed will first be constructed, then the wet rubble masonry works on the side-slope will be carried out by manpower and equipment.
5 m wide service road will be provided along both sides of the channel. The excavation will be carried out using a 0.35 m3 backhoe and loaded into a 4 ton dump truck to the spoil bank. The materials for road embankment and shoulder will be obtained from a mountainous site. The road pavement is to be subbase, base and asphalt surface course. The road construction will be performed using a conventional construction method.
2) Tidal Gates and Discharge Gate
Tidal gates are planned at the Lach Tray river and Cam river. The tidal gate located in the confluence of An Kim Hai channel and Lach Tray River is newly constructed adjacent to the existing siphon. The existing tidal gate is located in the confluence of An Kim Hai channel and Cam River with non-operational conditions and has inadequate hydraulic capacity. Thus, the existing tidal gate is necessitated to reconstruct. The discharge gate to Du Hang lake is newly constructed.
The gate civil works will be carried out during dry season. The coffer with double steel sheet piles of type IV with adequate bracing will be provided in the Lach Tray River.

The Study on Sanitation Improvement Plan for Haiphong City, Vietnam
Final Report, Main Report, Volume 2, Part 1
1 - 8
To protect the collapse of existing ground during excavation, the temporary steel sheet pile shoring of type IV with adequate bracing will be provided surrounding the foundation area.
350 × 350 mm precast concrete piles will be driven in designated positions by 2.5 ton diesel pile driver with a 30 ton crawler crane rig and pile follower. The concrete piles will be procured from the pile manufacturer and supplier.
The foundation excavation will be carried out using 0.2 m3 backhoe, 0.6 m3 clamshell and 4 ton dump truck, and the excavated material will be hauled to the stockpile area.
After the completion of the foundation excavation, the steel sheet pile type II will be driven by a 30 KW vibration hammer at the gate foundation for the purpose of cut off. Then the treatment of pile cap and capping concrete are carried out. Next, the assembling of form and reinforcement are performed.
The concrete will be hauled by a 3 m3 agitator truck from the concrete mixing plant provided in the contractor camp area. The concrete will be mainly placed using a 45 m3/h concrete pump car and vibrator.
The backfill material will be obtained from the stockpile. The backfill will be made by manpower, a 3 ton bulldozer and a 1 ton vibration roller.
3) Puong Luu Regulating Lake
Puong Luu regulating lake is designed to store and control the flood water. Net area of water surface is 24 ha.
The excavation works of lake site will be carried out during dry seasons in principle. The submersible pumps will be provided during the excavation works to secure the excavation site in dry condition.
The excavated material is planned to be utilized as the material of embankment, filling and backfill for other sites. Hence the excavated material is stocked beside the lake site. However, surplus material will be hauled to the spoil bank.
The lake excavation works will be made using a 1.0 m3 backhoe and the hauling works will be carried out by 10 ton dump trucks.
4) Connecting Channels and Maintenance Roads on Both Sides
A channel with the 15 m width and 500 m length is planned between Puong
Luu regulating lake and existing channel.
The Study on Sanitation Improvement Plan for Haiphong City, Vietnam
Final Report, Main Report, Volume 2, Part 1
1 - 9
The excavation works of connecting channel will be performed during dry seasons in principle. The excavation works of connecting channel will be carried out by a combination of a 1.0 m3 backhoe and 10 ton dump trucks.
A 7 m wide service road will be provided along both sides of the connecting channel. The excavation will be carried out using a 0.35 m3 backhoe and loaded into a 4 ton dump truck to the spoil bank. The materials for road embankment and shoulder will be obtained from a mountainous site. The road pavement is to be subbase, base and asphalt surface course. The road construction will be performed using a conventional construction method.
5) Box culvert, 3 × ( 3.0 m × 2.0 m )
3 lanes-3,000mm × 2,000mm with a 450m in total length box culverts are planned in channel between Phuong Luu lake and An Kim Hai channel. The construction of box culvert will require traffic diversion and detour, demolishing existing structures and pavement. To secure the box culvert construction within the scheduled period, several units will be used simultaneously.
Before starting excavation, the steel sheet piles of type III will be driven using a 30-40 KW vibration hammer in both sides of the box culvert as a temporary ground support. Then the coffer dikes and dewatering will be made.
The excavation and hauling will be made by a fleet of 0.6 m3 backhoe and 10 ton dump trucks. Precast concrete piles with a size of 350 × 350 mm will be driven in designated positions by a 2.5 ton diesel pile driver with a 30 ton crawler crane rig. The concrete piles will be procured from the pile manufacturer and supplier.
After the assembly of form and reinforcement steel bar works, concrete works will be carried out by using conventional equipment such as a 3.0 m3 agitator truck, 45 m3/h concrete pump car and vibrators.
6) Bridges
Fifteen (15) bridges are planned to be constructed in An Kim Hai channel and connection channel.
The bridge girders are planned to be a precast type girder with pre-stressed strand and reinforced concrete girder. The post tension type precast girders will be produced at each bridge site due to road and traffic conditions.
The Study on Sanitation Improvement Plan for Haiphong City, Vietnam
Final Report, Main Report, Volume 2, Part 1
1 - 10
Before starting the bridge construction, temporary staging is provided along the planned bridges. After providing temporary staging, steel sheet pile coffers are provided for surrounding piers and abutments.
Precast reinforced concrete piles are driven using a 2.5 ton diesel pile driver. After piling works, the foundation excavation will be made by a 0.35 m3 backhoe and 4 ton dump trucks. Then, the assembling of form and reinforcement are performed.
The concrete is hauled by a 3 m3 agitator truck from the concrete mixing plant provided in the contractor camp area. The concrete is mainly placed using a 45 m3/h concrete pump car and vibrator.
(3) Sewerage Priority Project
1) Trunk Sewer, 100 – 1,200 mm dia., Open Trench Method
The construction of trunk sewer with less than 4 m in depth from the road surface will be carried out by the open trench construction method. In case the banks of the trench are not stable, temporary shoring are required. Total length of the trunk sewer by open trench is 12,260 m.
The construction works will be made by applying conventional method i. e. cutting pavement using a concrete cutter, breaking using a pneumatic hammer, excavation and loading using a 0.35 m3 backhoe and manpower, and hauling using 4 ton dump truck. After the foundation of the trunk sewer made by bamboo piles, wooden materials and concrete bed is constructed, precast concrete sewer pipes will be transported by a 4 ton flat bed truck equipped with a crane, and laid by using its crane or the 4.5 ton truck crane. After backfill on the sewer pipes, the removal of temporary shoring and re-pavement will be performed.
2) Trunk Sewer, 800 –1,800 mm dia., Pipe Jacking Method
A trunk sewer with more than 4 m in depth from the road surface will be constructed by the pipe jacking method. Total length of this trunk sewer is assumed to be 7,660 m.
Vertical shafts will be firstly constructed every about 40 m intervals for 800 mm dia., 100 m intervals for 900 –1,000 mm dia.,150 m intervals for 1,100 – 1,200 mm dia. and 200 m intervals for 1,650 – 1,800 mm dia. along the trunk sewer line. Those vertical shafts are utilized as the removal of excavated material, operation of jack and supply of precast reinforced concrete jacking pipes.
The Study on Sanitation Improvement Plan for Haiphong City, Vietnam
Final Report, Main Report, Volume 2, Part 1
1 - 11
The excavation of the vertical shafts will be carried out by a 4.5t class truck crane with 0.6 m3 bucket. For the ground support, the steel sheet pile, type III and its bracing are necessitated.
The precast concrete pipes for jacking must be strong enough to withstand the loads exerted by the jacking procedure. The leading pipe is to equip the leading edge with a cutter or shoe to protect the pipe. Next, lengths of pipes are added between the leading pipe and the jacks. After the pipe jacking, soil is excavated by hand and removed through the pipe. The excavation does not precede the jacking operation. When jacking, it is desirable to coat the outside of the pipe with a lubricant, to reduce the frictional loss. Soil friction may increase with time; it is desirable to continue jacking operations without interruption until completed.
After the completion of works, the vertical shafts will be converted into manholes.
3) Combined Sewer Overflow Control Structure
Two types of overflow control structures are conceived in this area i. e. gate type and orifice type. Required quantity is 20 nos for orifice type and 41 nos for gate type. The gate type consists of 5 types.
When outfall sewer and head structures are partly submerged it is necessary to provide some form of cofferdam during construction. In shallow water, an earth dike or bamboo made dike may be sufficient to maintain a dry pit. In deep water, steel sheet piling cofferdams are desirable. A single wall cofferdam with adequate bracing is sufficient.
The excavation of these structures will be done by a 0.6 m3 backhoe. After excavation works, the foundation works are performed. Then, form and reinforcement steel bar works are assembled, succeeding concrete works will be carried out by using conventional equipment such as 3.0 m3 agitator truck, 45 m3/h concrete pump car and vibrators.
4) Manhole
Six type of manholes are planned along trunk sewer line. Required quantity is 190 nos.
The excavation of these structures will be done by 0.6 m3 backhoe. After excavation works, the foundation works are performed. Then, assembling of form and reinforcement steel bar works are assembled, succeeding concrete works will be carried out by using conventional equipment such as 3.0 m3 agitator truck, 45 m3/h concrete pump car and vibrators.

The Study on Sanitation Improvement Plan for Haiphong City, Vietnam
Final Report, Main Report, Volume 2, Part 1
1 - 12
5) Manhole Type Relay Pumping Station
The submersible pump is installed in the conventional manhole. The pump can be removed from the wet well for servicing without disturbing the discharge piping. The pump can be slid onto the fixed guide rails. In the lowered position, the pump discharge engages the discharge pipe. Four types of manhole type relay pumping station are considered in this area. Required quantity is 5 nos.
The excavation of these structures will be done by a 0.6 m3 backhoe. After excavation works, the foundation works are performed. Then, form and reinforcement steel bar works are assembled, succeeding concrete works will be carried out by using conventional equipment such as 3.0 m3 agitator truck, 45 m3/h concrete pump car and vibrators.
6) Relay Pumping Station
The relay pumping station with a total capacity of 0.535 m3/s is planned in An Da area. 4 units (1 standby pump) of sewage pumps having a 0.178 m3/s and 300 mm dia. are selected. The force main (pipe coming out of the pump) is 700 mm.
Pumping station substructures are made by reinforced concrete. The exterior walls below grade and wet-well walls below the maximum high wet-well level will be coated with tar to prevent leakage. Superstructures are made of fireproof construction. The ground floor of the station must be set above the flood to eliminate the possibility of flooding the station. In the pumping station, monorails are provided for equipment handling.
The steel sheet piles type IV and adequate bracing will be provided surrounding the foundation area.
The foundation works of the pumping station comprise the precast concrete piles driving, foundation excavation and capping concrete. The precast concrete piles with 300 x 300 mm will be driven in designated position by a 2.5 ton diesel pile driver with a 30 ton crawler crane rig and pile follower. The concrete piles will be procured from the pile manufacturer and supplier. Next, the foundation excavation is performed by a 0.6 m3 backhoe, then the treatment of pile cap and capping concrete are carried out.
Reinforced concrete for substructure and superstructure will be placed by using a truck crane and/or concrete pump car. After completion of concrete works, the pump equipment and electrical control equipment will be installed.
The Study on Sanitation Improvement Plan for Haiphong City, Vietnam
Final Report, Main Report, Volume 2, Part 1
1 - 13
7) West Wastewater Treatment Plant
Estimated generation of sewage for Phase I (combined sewer area ) until Year 2010 is about 36,000 m3/day. The capacity of West wastewater treatment plant is to cover this requirement.
The main structure consists of a pumping station, aerated lagoon, settling pond, chlorination tank and sludge drying bed.
The pumping station with a total capacity of 1.059 m3/s is planned in Thon Niem near Lach Tray river. 3 units (1 standby pump) of sewage pumps having 0.706 m3/s and 590 mm dia. and 0.353 m3/s and 420 mm dia. are selected.
Pumping station substructures are made by reinforced concrete. The exterior walls below grade and wet-well walls below the maximum high wet-well level will be coated with tar to prevent leakage. Superstructures blend in with the surroundings and are made of fireproof construction. The ground floor of the station must be set above the flood to eliminate the possibility of flooding the station. In the pumping station, overhead cranes are provided for equipment handling.
The steel sheet piles type IV and adequate bracing will be provided surrounding the foundation area. The foundation works of the pumping station comprise the precast concrete piles driving, foundation excavation and capping concrete. The precast concrete piles 300 x 300 mm in size, will be driven in designated positions by a 2.5 ton diesel pile driver with a 30 ton crawler crane rig and pile follower. The concrete piles will be procured from the pile manufacturer and supplier. Next, the foundation excavation is performed by a 0.6 m3 backhoe, then the treatment of pile cap and capping concrete are carried out.
Reinforced concrete for substructure and superstructure will be placed by using a truck crane and/or concrete pump car. The construction of outlet structure including excavation, concrete placing, backfill and gate installation will be carried out by applying the conventional construction method. After completion of concrete works, the pump equipment and electrical control equipment will be installed.
4 nos. of 0.9 ha aerated lagoon, 4 nos. of 0.6 ha settling pond, 0.04 ha chlorination tank, 0.5 ha sedimentation pond and 4.55 ha sludge drying bed are made by earth works. Partition and surrounding walls made of earth material are provided in each structure. Those works are carried out during dry season. The sewage flow from the aerated lagoon to the chlorination tank through settling pond is a gravity flow.

The Study on Sanitation Improvement Plan for Haiphong City, Vietnam
Final Report, Main Report, Volume 2, Part 1
1 - 14
The excavation of these structures will be done by a fleet of 1.0 m3 backhoes and 15 ton bulldozers, and excavated materials are hauled to the earth embankment sites by 10 ton dump trucks, then the unloaded materials are spread and compacted with a thickness of 0.2 m by 11 ton bulldozers. In case the excavated material is anticipated with high moisture content, the excavated material is hauled to stockpiles for moisture control. After moisture control, these materials can be used as the embankment materials.
In total 32 nos of 55 kW surface mechanical aerators with a vertical axis are planned to be provided in the aerated lagoon. The aerators are designed to induce either updraft or downdraft flows through a pumping action. They consist of submerged impellers attached to motors mounted on floats. The works of aerators comprise the procurement and installation.
(4) Solid Waste Management Priority Project
Solid Waste Management Priority Project has 3 components.
1) Waste Collection and Transport System (component 1)
Component 1 procures waste collection and transport equipment: waste collection vehicles, bins, and hand-carts as well as maintenance facilities.
Quantities and specifications of the equipment are as follows:
• 43 units of waste collection vehicles of different loading capacity ranging from 4 – 16 m3
• 1,010 units of waste bins of 2 different capacities (240 liter and 660 liter)
• 224 units of hand-carts with 500 liter capacity • 3 sets of maintenance equipment to be used for repair and maintenance
of waste collection vehicles by the 3 companies (URENCO, Kien An Public Works Company and Do Son Public Works Company)
2) Trang Cat New Landfill Site (component 2)
The works of component 2 are the construction of Trang Cat new landfill site with a 32.7 ha of area required and the procurement of heavy equipment.
The works of Trang Cat new landfill site include the collection of surcharge soil, transportation to landfill site, placement of surcharge soil, keep that soil to allow compaction of existing soil, remove the surcharge soil, construction of dykes, the construction of leachate collection and treatment comprising the PVC pipe laying, two pumping stations and regulating pond, the construction of road, the construction of vertical gas

The Study on Sanitation Improvement Plan for Haiphong City, Vietnam
Final Report, Main Report, Volume 2, Part 1
1 - 15
vents, the construction of fencing, etc. Those works will be carried out by conventional method.
The height of surcharge layer will be 4 m. The total landfill area will be divided into 4 cells. Surcharge soil will be placed in one cell with a trapezoidal shape having a side slope of 1:2.5. This configuration is very stable. The soil will be kept for 10 months. After that the soil ill be moved to next cell. This process will continue till all the landfill area is compacted. Side embankment will be required so that mudflow does not occur to the surrounding area. Surcharge soil will be brought from near by Phu Luu Mountain and a total of around 240,000 m3 of soil will be required. In case, adverse impact is found due to such soil displacement in course of further study, other alternatives are soil from An Kim Hai Channel rehabilitation and Phound Luu Lake construction.
Synthetic liner is available in sheet roll, each sheet is 5 m wide and 20 m long. A crane will be used for installation. Every sheet’s edge will be overlapped by adjacent sheets by 30 cm. Edge will then be sealed by special heating machine.
The specifications of heavy equipment are 3 units of 15 ton bulldozers, 2 units of 10 ton dump trucks, 1 unit of pick-up truck, etc.
3) Medical Waste Incineration (component 3)
The works of component 3 are the construction of an incineration facilities with its building and the procurement of collection vehicles for medical waste.
The works of incineration facilities include the construction of foundation, the procurement and installation of 1.5 ton/day incineration facilities with a control of flue gas including dioxins and the construction of a 144 m2 building for incinerator. The incineration facilities are planned to be installed in Trang Cat site. The required area is about 200 m2. Those building works will be carried out by conventional method.
The specifications of collecting vehicles for medical waste are 2 units of required quantity and 1.5 ton of loading capacity, and made of hard top with a lockable door.
The Study on Sanitation Improvement Plan for Haiphong City, Vietnam
Final Report, Main Report, Volume 2, Part 1
1 - 16
2.2 Basic Conditions of Cost Estimate for the Selected Priority Projects
The basic conditions and assumptions applied for the cost estimate are presented below.
(1) Project Execution Method
All the project works will be executed on a contract basis. The permanent facilities and the temporary construction facilities such as construction equipment, materials, and labors required for the works will be provided by the contractors to be selected through international or local competitive bidding.
The procurement works of waste collection vehicles, bins, hand carts, maintenance facilities, heavy equipment, collection vehicles for medical waste and incineration facilities including installation will also be made by international or local competitive bidding.
(2) Project Cost
The project cost comprises the main construction cost, procurement cost, land acquisition and compensation cost, engineering service cost, administration cost, physical contingency and price contingency. The main construction cost is estimated on the basis of unit price in principle.
(3) Unit Prices
The unit prices for the major work items are prepared by referring to the collected cost data from the on-going projects in Haiphong and Hanoi cities. The unit prices consists of labor cost, material cost, equipment cost and contractor’s overhead expenses and profit. All unit prices are given in foreign and local currency portions and expressed in US$. The local currency portion covers the cost of locally available materials including cement, reinforcing bars, fuel and local labors. The costs of pumping equipment, electrical equipment, tidal gate, equipment of solid waste management and depreciation and spare parts cost of construction equipment are allocated into the foreign currency portion. The value added tax is included in the respective unit prices.
(4) Price Level
The construction cost is estimated based on the price level of June 2000.
(5) Exchange Rate
The foreign exchange rate of currencies are US$1.00=VND14,072 in an average of June 2000.

The Study on Sanitation Improvement Plan for Haiphong City, Vietnam
Final Report, Main Report, Volume 2, Part 1
1 - 17
(6) Land Acquisition and Compensation Cost
The land needed for channel improvement, regulating lake, pumping stations, wastewater treatment site, Trang Cat new landfill site, etc. will be acquired by the Government office. Houses located in the land acquired will be compensated.
The summary of land acquisition and compensation cost for each sector is shown below:
• Drainage project (1,300 households and 5 m + 5 m maintenance road ): US$3,700,000
• Sewerage project (23 households and 38 ha, pumping station 0.38 ha and relocation of dike): US$2,165,000
• Trang Cat (Land acquisition 32.7 ha and land use right for fishing company): US$602,000
• Total US$6,467,000
(7) Engineering Service Cost
The engineering service cost for detailed design and construction supervision is assumed to be 10 % of total construction cost and land acquisition cost. The engineering service cost for the solid waste management is estimated to be 5 % of total construction and procurement cost.
(8) Administration Cost
The cost for the project administration by the Government office is assumed to be 3 % of the total construction and procurement cost, land acquisition and compensation cost and engineering service cost.
(9) Physical Contingency
The physical contingency is provided to cope with the unforeseen physical conditions. The physical contingency is assumed to be 10 % for the sum of construction and procurement cost, land acquisition and compensation cost, engineering service cost and administration cost.
(10) Price Contingency
The price escalation is given with the rate of 2.0 % per annum for both the foreign and local currency portions considering the consumer price index in industrial countries with the rate of 1.9 % per annum in an average of past 5 years and consumer price index in Vietnam with the rate of 7.8 % per annum in an average of past 8 year
The Study on Sanitation Improvement Plan for Haiphong City, Vietnam
Final Report, Main Report, Volume 2, Part 1
1 - 18
2.3 Implementation Schedule and Cost Estimate for Priority Projects
(1) Implementation Schedule
Pre-construction activities namely the detailed design including preparation of tender documents, the financial arrangement and the land acquisition are necessitated before the commencement of construction works, and it is assumed that 2.0 years for the financial arrangement, 1.0 year for the detailed design for all sectors and 2 years for the land acquisition will be required.
The construction period for selected priority projects are presumed as follows:
• Drainage Priority Project; 5 years • Sewerage Priority Project; 6 years • SWM Priority Project (Waste collection and transport, component 1); 1 year • SWM Priority Project (Trang Cat new landfill site, component 2); 2 years • SWM Priority Project (Medical waste incineration, component 3); 1 year
All of the construction works will be performed by the contractor to be selected by tendering process and their commencement years are scheduled at the beginning of 2004 for the waste collection and transport system (component 1), Trang Cat landfill site (component 2) and medical waste incineration (component 3) and thereafter, in mid- 2004 for Drainage and Sewerage Priority Projects.
The proposed implementation schedules for selected priority projects are shown in Figures 2.3.1. to 2.3.4.
(2) Construction Cost
Cost estimation has been made based on the final facility plans for the selected priority projects. The breakdown of construction cost for the selected priority projects are shown in Tables 2.3.1 to 2.3.3.
(3) Project Cost
The project cost of the selected priority projects consists of the construction and procurement cost, land acquisition and compensation cost, engineering service cost, administration cost, physical contingency and price contingency.
The estimated total project cost is US$147.3 million comprising foreign currency portion of US$84.9 million and the local currency portion of US$62.4 million. Breakdown of the overall project cost are shown as follows:

The Study on Sanitation Improvement Plan for Haiphong City, Vietnam
Final Report, Main Report, Volume 2, Part 1
1 - 19
Overall Project Cost (unit: 1,000US$)
Description F.C (US$) L.C (US$) Total (US$) (1)Drainage Priority Project Construction and Procurement Cost 18,168.7 17,498.0 35,666.7 Land Acquisition and Compensation 0.0 3,700.0 3,700.0 Engineering Service Cost 1816.9 2,119.8 3,936.7 Administration Cost 0.0 1,299.1 1,299.1 Physical Contingency 1,998.5 2,461.6 4,460.1 Price Contingency 3,167.0 3,508.1 6,675.1 Sub-Total without Price Contingency 21,984.1 27,078.6 49,062.7 Sub-Total 25,151.1 30,586.8 55,737.9 (2) Sewerage Priority Project, Construction and Procurement Cost 35,026.4 15,327.3 50,355.1 Land Acquisition and Compensation 0.0 2,165.0 2,165.0 Engineering Service Cost 3,502.6 1,749.2 5,252.0 Administration Cost 0.0 1,733.1 1,733.1 Physical Contingency 3,852.9 2,097.5 5,950.4 Price Contingency 5,918.3 3,106.4 9,024.7 Sub-Total without Price Contingency 42,382.0 23,072.1 65,455.6 Sub-Total 48,300.2 26,178.6 74,478.8 (3) Solid waste management PP Construction and Procurement Cost 8,956.8 3,386.0 12,342.8 Land Acquisition and Compensation 0.0 602.0 602.0 Engineering Service Cost 629.4 338.6 968.0 Administration Cost 0.0 417.5 417.5 Physical Contingency 958.6 474.4 1,433.0 Price Contingency 898.5 452.0 1,350.5 Sub-Total without Price Contingency 10,545.2 5,218.4 15,763.6 Sub-Total 11,443.7 5,670.4 17,114.1 Total without Price Contingency 74,911.2 55,369.0 130,282.1 Total 84,895.0 62,435.7 147,332.4
(4) Disbursement Schedule
The annual disbursement schedule of the selected priority project is shown in Tables 2.3.4 to 2.3.7 and summarized below.
Disbursement Schedule of Overall Project Cost (unit: 1,000 US$)
Year F.C (US$) L.C (US$) Total (US$) 2003 1,316.1 5,167.5 6,483.6 2004 15,527.3 10,650.9 26,178.2 2005 15,762.8 10,835.3 26,598.1 2006 14,251.5 9306.0 23,557.5 2007 12,373.9 9,120.8 21,494.7 2008 12,086.4 8,941.2 21,027.6 2009 10,282.3 6,626.3 16,908.6 2010 3,294.2 1,788.2 5,082.4 Total 84,895.0 62,435.7 147,332.4
The Study on Sanitation Improvement Plan for Haiphong City, Vietnam
Final Report, Main Report, Volume 2, Part 1
1 - 20
CHAPTER 3 METHODOLOGY FOR EVALUATING PRIORITY PROJECT FEASIBILITY
The priority projects which are selected should meet the following three basic conditions:
• The project should be essential for solving the currently prevailing problem and should be implemented in the short-term
• The priority project should be in compliance with the long-term sanitation master plan recommended in this JICA Study
• There has been no detailed study nor F/S for the project and therefore F/S should be carried out in this JICA Study (the Study)
Accordingly 3 priority projects are selected, one each for the sectors of drainage improvement, sewerage development and solid waste management. Project evaluation is carried out for these selected priority projects to check the feasibility and viability for implementation.
Firstly, the viability of the priority projects are examined from the following aspects:
• To adequately satisfy the primary objectives of the improvement of the sanitation condition and environment of the Study Area and Haiphong city
• To be economically justifiable through the contribution to economic growth of the Study Area and the city
Secondly, implementabililty and affordability as well as social and environmental acceptance are checked.
If considered to be viable and implementable, the project is evaluated as feasible and recommended for early realization. Evaluation items are explained hereunder.
(1) Objective Achievement (Satisfaction of the sanitation/environment objectives)
Sanitation improvement of the Haiphong City has 2 principle objectives to be satisfied through the implementation of the projects and measures, i.e., a) improvement of sanitary condition of citizens, and b) improvement of ambient environment including surface water quality, cleanliness of the city, etc.
Compliance and degree of satisfaction of Objective Achievement is examined with appropriate indices including area served, number of direct and indirect beneficiaries, reduction of pollution loads into the environment and volume of loads collected and treated or controlled.

The Study on Sanitation Improvement Plan for Haiphong City, Vietnam
Final Report, Main Report, Volume 2, Part 1
1 - 21
(2) Economic Viability
Economic viability of the projects is examined to evaluate the levels of the switching values of the property value and productivity/GRP of the Study Area which offset the project cost. If switching value lies within the reasonable range, the project is considered economically viable. Switching value of the property value is obtained by calculating the percentage of the priority project cost in the property value. Namely, the percentage of increase of the property value which can justify the project implementation, is checked. GRP switching value is checked similarly.
(3) Financial Affordability
Financial requirement of the investment cost and operation and maintenance cost (O&M cost) should be within the affordable range of the Government and people. The annual overall project cost is calculated which comprises the amortized capital cost with 5 % interest rate and 25 year repayment period and O&M cost. Percentage of annual overall project cost in the values of the key indicators are calculated, which include Study Area GRP, HPPC expenditure and disposable income of the residents. If the ratios lie within reasonable range, the project is considered as financially affordable.
Depending on the sector, drainage sector in Haiphong city for example, other urgent projects will also be carried out in parallel with the proposed drainage priority project. Priority project together with these projects will improve the drainage condition in Haiphong city. To keep this improved drainage condition toward the future in sustainable manner, drainage improvement efforts should be continued.
Considering these, master plan cost of each sector is used to check the financial affordability of each priority project instead of the priority project cost. If the financial affordability is proved by this approach, affordability of the priority project is automatically proved.
(4) Technical Feasibility
The technology to be used in the priority project should be a proven and sure one which has already been applied elsewhere in the world or preferably in developing countries in the Southeast Asia. Risk of failure of the project should be low for manufacturing, construction and O&M. Additional skills required for the personnel of the managing organization for O&M should be obtainable with adequate training.

The Study on Sanitation Improvement Plan for Haiphong City, Vietnam
Final Report, Main Report, Volume 2, Part 1
1 - 22
(5) Environmental Acceptability
The adverse social and environmental impacts which will be generated associated with the project implementation, should be in the range acceptable to the affected citizens after taking appropriate counter-measures.
(6) Organizational Capability
The projects should be able to be managed and operated by the responsible organizations after adequate reinforcement of organization, staff and manpower training.

No Description F.C. Portion(US$) L.C. Portion(US$) Total(US$)Amount Amount
I Main Component0.00 Preparatory Works 1,040,864 1,223,504 2,264,368
1.00 An Kim Hai Channel1.10 Channel excavation 1,891,476 852,362 2,743,8381.20 Revetment works 1,679,246 4,782,896 6,462,1411.30 Maintenance road 281,888 747,539 1,029,4271.40 Construction of tidal gate, Lach Tray River 599,670 201,023 800,6941.50 Construction of tidal gate, Cam River 599,670 201,023 800,6941.60 Construction of discharge gate to Du Hang Lake 599,670 201,023 800,6941.70 Demolishing existing outlet gate 906 1,132 2,038
Total 5,652,527 6,986,999 12,639,525
2.00 Phuong Luu Regulating Lake2.10 Phuong luu regulating lake 3,465,416 2,849,731 6,315,1472.20 Box culvert, 3x(3.0mx2.0m),L=450m 1,290,696 2,398,315 3,689,011
Total 4,756,112 5,248,046 10,004,157 Total of I 11,449,502 13,458,549 24,908,051
II Supplementary Component0.00 Preparatory Works 610,833 367,226 978,0591.00 Supplementary Component, New Sewers 2,275,000 2,275,000 4,550,0002.00 Supplementary Component, Bridges 1,044,582 1,161,006 2,205,5883.00 Supplementary Component, Road Ancillary Works 2,788,750 236,250 3,025,000
Total of II 6,719,165 4,039,482 10,758,647
Grand Total 18,168,668 17,498,030 35,666,698Note: Constant price of June 2000
Construction and land acquisition costs
Table 2.3.1 Construction Cost for Drainage Priority Project
1 - 23

No Description Total(US$)Amount Amount
0.00 Preparatory Works 3,184,219 1,393,393 4,577,733
1.00 Trunk Sewer, Open Excavation1.10 Steel pipe, 100mm dia.,1-2m covering,L=230m 10,414 22,190 33,8061.20 Steel pipe, 125mm dia.,1-2m covering,L=260m 18,105 25,686 43,7911.30 R.C. pipe, 300mm dia.,1-2m covering,L=300m 13,043 30,589 43,6321.40 R.C. pipe, 300mm dia.,2-3m covering,L=620m 40,479 91,414 131,8931.50 R.C. pipe, 400mm dia.,1-2m covering,L=620m 29,163 76,563 105,7261.60 R.C. pipe, 400mm dia.,2-3m covering,L=560m 39,217 94,544 133,7611.70 R.C. pipe, 400mm dia.,3-4m covering,L=420m 102,654 99,678 202,3321.80 R.C. pipe, 500mm dia.,2-3m covering,L=1180m 87,808 220,946 308,7541.90 R.C. pipe, 500mm dia.,3-4m covering,L=600m 162,256 156,592 318,8481.10 R.C. pipe, 600mm dia.,3-4m covering,L=380m 110,985 104,459 215,4441.11 R.C. pipe, 700mm dia.,2-3m covering,L=940m 95,559 256,343 351,9021.12 R.C. pipe, 800mm dia.,2-3m covering,L=550m 58,659 156,515 215,1741.13 R.C. pipe, 900mm dia.,2-3m covering,L=200m 24,190 60,023 84,2131.14 R.C. pipe, 900mm dia.,3-4m covering,L=1320m 572,692 544,074 1,116,7661.15 R.C. pipe, 1000mm dia.,2-3m covering,L=700m 188,333 239,974 428,3071.16 R.C. pipe, 1000mm dia.,3-4m covering,L=1000m 463,307 434,301 897,6081.17 R.C. pipe, 1100mm dia.,2-3m covering,L=600m 176,888 223,306 400,1941.18 R.C. pipe, 1100mm dia.,3-4m covering,L=900m 444,924 419,748 864,6731.19 R.C. pipe, 1200mm dia.,3-4m covering,L=880m 462,307 432,175 894,482
Total 3,100,984 3,689,120 6,791,306
2.00 Trunk Sewer, Pipe Jacking Method2.10 R.C. pipe for jacking,800mm dia.,L=1300m 1,508,289 346,752 1,855,0412.20 R.C. pipe for jacking,900mm dia.,L=440m 598,389 172,647 771,0362.30 R.C. pipe for jacking,1000mm dia.,L=1240m 1,742,282 498,703 2,240,9852.40 R.C. pipe for jacking,1100mm dia.,L=330m 576,284 240,706 816,9902.50 R.C. pipe for jacking,1200mm dia.,L=2720m 4,857,545 1,902,156 6,759,7012.60 R.C. pipe for jacking,1650mm dia.,L=640m 1,537,022 452,291 1,989,3132.70 R.C. pipe for jacking,1800mm dia.,L=950m 2,492,337 649,796 3,142,133
Total 13,312,149 4,263,050 17,575,199
3.00 Combined Sewer Overflow Control Structure3.10 Orifice type, gate type I, 22nos 456,822 80,898 537,7213.20 Gate type, type I, 22nos 669,788 105,340 775,1293.30 Gate type, type II, 12nos 441,482 62,199 503,6813.40 Gate type, type III, 3 nos 162,102 20,706 182,8093.50 Gate type, type IV, 2 nos 114,734 14,467 129,2023.60 Gate type, type V, 2 nos 121,942 15,066 137,007
Total 1,966,870 298,678 2,265,548
4.00 Manhole4.10 Manhole, type 1, 300mm-600mm, 2.5m, 68nos 60,535 39,261 99,7964.20 Manhole, type 2, 700mm-900mm, 3.0m, 30nos 27,451 25,531 52,9824.30 Manhole, type 3, 1000mm-1200mm, 3.5m, 33nos 31,044 34,926 65,9714.40 Manhole, type 3, 800mm-1200mm, 5.0m, 50nos 48,228 66,931 115,1584.50 Manhole, type 5, 1800mm, 5.0m, 8nos 8,065 12,300 20,365 Total 175,323 178,948 354,271
5.00 Manhole Type Pump5.10 Manhole pump 1 14,573 9,393 23,9665.20 Manhole pump 2 10,795 5,533 16,3285.30 Manhole pump 3 10,795 5,533 16,3285.40 Manhole pump 4 3,919 4,205 8,1245.50 Manhole pump 5 3,989 4,262 8,2525.60 Manhole pump 1, mechanical & electrical 47,622 1,474 49,0965.70 Manhole pump 2, mechanical & electrical 29,985 929 30,9145.80 Manhole pump 3, mechanical & electrical 29,985 929 30,9145.90 Manhole pump 4, mechanical & electrical 33,072 1,025 34,0975.10 Manhole pump 5, mechanical & electrical 39,686 1,230 40,9165.11 Installation and others 133,669 26,028 159,697
Total 358,089 60,541 418,631
Table 2.3.2 Construction Cost for Sewerage Priority Project (1/2)
F.C. Portion(US$) L.C. Portion(US$)
1 - 24

No Description Total(US$)Amount Amount
6.00 An Da Relay Pumping Station6.10 Pumping house structure 77,246 122,751 199,9976.20 Pumping house building and others 4,820 14,459 19,2786.30 Pumping house yard 14,106 24,556 38,6626.40 Mechanical equipment 307,420 9,494 316,9146.50 Electrical equipment 117,283 3,629 120,9126.60 Installation and others 170,583 59,564 230,147
Total 691,458 234,452 925,910
7.00 West Wastewater Treatment Plant7.10 Pumping station 138,457 187,246 325,7037.20 Aerated lagoon treatment process (AL) 238,788 176,670 415,4587.30 Settling pond 325,105 161,174 486,2797.40 Chlorination tank 45,364 217,721 263,0867.50 Stormwater sedimentation pond 36,803 33,679 70,4817.60 Sludge drying bed 164,667 497,814 662,4817.70 Building works 71,623 214,869 286,4937.80 Splitter chamber 1,039 4,306 5,3457.90 Gate of outfall 31,273 5,569 36,8427.10 Wastewater treatment yard 51,367 280,096 331,4627.11 Operation and maintenance equipment 449,014 13,716 462,7307.12 Equipment for screenings 1,172,823 36,186 1,209,0097.13 Equipment for grit chamber 807,396 24,884 832,2807.14 Equipment for aerated lagoon 3,255,739 100,699 3,356,4387.15 Equipment for settling pond 63,826 1,974 65,8007.16 Equipment for chlorination tank 43,210 1,337 44,5477.17 Piping 493,819 15,273 509,0917.18 Electrical equipment 651,221 20,148 671,3697.19 Installation and others 1,960,000 980,000 2,940,000
Total 10,001,533 2,973,360 12,974,893
8.00 Supplementary works 2,235,785 2,235,785 4,471,570
Grand Total 35,026,409 15,327,328 50,355,060Note: Constant price of June 2000
Construction and land acquisition costs
Table 2.3.2 Construction Cost for Sewerage Priority Project (2/2)
F.C. Portion(US$) L.C. Portion(US$)
1 - 25

No Description Total(US$)Amount Amount
1.00 Waste Collection and Transport System 3907000 0 39070002.00 Trang Cat New Landfill Site 4710000 3299000 80090003.00 Hospital Waste Treatment 339000 87000 426000
Total 8956000 3386000 12342000Note: Constant price of June 2000
Construction and land acquisition costs
F.C. Portion(US$) L.C. Portion(US$)
Table 2.3.3 Solid Waste Management Priority Project
1 - 26
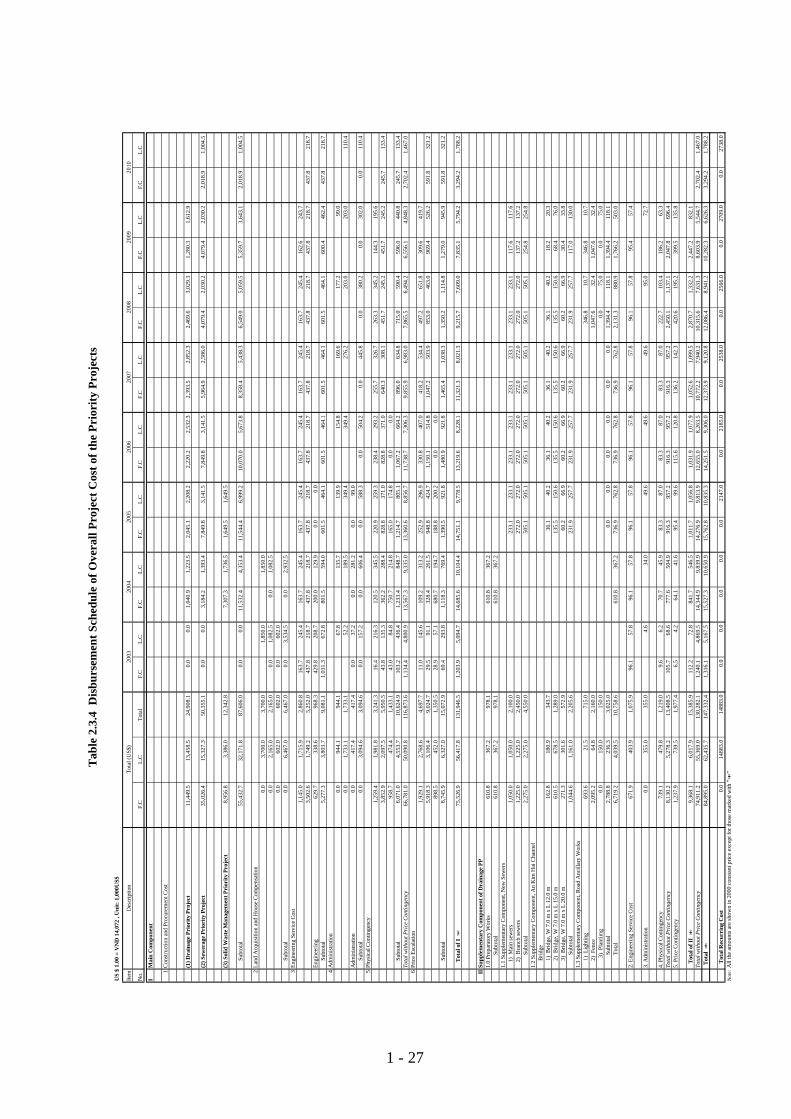
Tab
le 2
.3.4
Dis
burs
emen
t Sch
edul
e of
Ove
rall
Proj
ect C
ost o
f the
Pri
ority
Pro
ject
s
US
$ 1.
00 =
VN
D 1
4,07
2 , U
nit:
1,0
00U
S$
Item
Des
crip
tion
No.
F.C
L.C
Tota
l F.
CL.
CF.
CL.
CF.
CL.
CF.
CL.
CF.
CL.
CF.
CL.
CF.
CL.
CF.
CL.
C
IM
ain
Com
pone
nt
1C
onst
ruct
ion
and
Proc
urem
ent C
ost
(1) D
rain
age
Prio
rity
Pro
ject
11,4
49.5
13,4
58.5
24,9
08.1
0.0
0.0
1,04
0.9
1,22
3.5
2,04
5.1
2,20
8.2
2,22
0.2
2,53
2.3
2,39
3.5
2,85
2.3
2,46
9.6
3,02
9.3
1,28
0.3
1,61
2.9
(2) S
ewer
age
Prio
rity
Pro
ject
35,0
26.4
15,3
27.3
50,3
55.1
0.0
0.0
3,18
4.2
1,39
3.4
7,84
9.8
3,14
1.5
7,84
9.8
3,14
1.5
5,96
4.9
2,58
6.0
4,07
9.4
2,03
0.2
4,07
9.4
2,03
0.2
2,01
8.9
1,00
4.5
(3) S
olid
Was
te M
anag
emen
t Pri
ority
Pro
ject
8,95
6.8
3,38
6.0
12,3
42.8
7,30
7.3
1,73
6.5
1,64
9.5
1,64
9.5
S
ubto
tal
55,4
32.7
32,1
71.8
87,6
06.0
0.0
0.0
11,5
32.4
4,35
3.4
11,5
44.4
6,99
9.2
10,0
70.0
5,67
3.8
8,35
8.4
5,43
8.3
6,54
9.0
5,05
9.5
5,35
9.7
3,64
3.1
2,01
8.9
1,00
4.5
2La
nd A
cqui
sitio
n an
d H
ouse
Com
pens
atio
n0.
03,
700.
03,
700.
01,
850.
01,
850.
00.
02,
165.
02,
165.
00.
01,
082.
50.
01,
082.
50.
060
2.0
602.
00.
060
2.0
S
ubto
tal
0.0
6,46
7.0
6,46
7.0
0.0
3,53
4.5
0.0
2,93
2.5
3En
gine
erin
g Se
rvic
e C
ost
1,14
5.0
1,71
5.9
2,86
0.8
163.
724
5.4
163.
724
5.4
163.
724
5.4
163.
724
5.4
163.
724
5.4
163.
724
5.4
162.
624
3.7
3,50
2.6
1,74
9.2
5,25
2.0
437.
821
8.7
437.
821
8.7
437.
821
8.7
437.
821
8.7
437.
821
8.7
437.
821
8.7
437.
821
8.7
437.
821
8.7
Engi
neer
ing
629.
733
8.6
968.
342
9.8
208.
720
0.0
129.
90.
00.
0
Sub
tota
l5,
277.
33,
803.
79,
081.
11,
031.
367
2.8
801.
559
4.0
601.
546
4.1
601.
546
4.1
601.
546
4.1
601.
546
4.1
600.
446
2.4
437.
821
8.7
4A
dmin
istra
tion
0.0
944.
194
4.1
67.8
135.
713
9.9
154.
816
9.6
177.
299
.00.
01,
733.
11,
733.
152
.218
9.5
349.
434
9.4
276.
220
3.0
203.
011
0.4
Adm
inis
tratio
n0.
041
7.4
417.
40.
037
.20.
028
1.2
0.0
99.0
S
ubto
tal
0.0
3,09
4.6
3,09
4.6
0.0
157.
20.
060
6.4
0.0
588.
30.
050
4.2
0.0
445.
80.
038
0.2
0.0
302.
00.
011
0.4
5Ph
ysic
al C
ontin
genc
y1,
259.
41,
981.
83,
241.
316
.421
6.3
120.
534
5.5
220.
925
9.3
238.
429
3.2
255.
732
6.7
263.
334
5.2
144.
319
5.6
3,85
2.9
2,09
7.5
5,95
0.5
43.8
135.
336
2.2
288.
482
8.8
371.
082
8.8
371.
064
0.3
308.
145
1.7
245.
245
1.7
245.
224
5.7
133.
495
8.7
474.
41,
433.
143
.084
.875
0.7
214.
816
5.0
174.
80.
00.
0
Sub
tota
l6,
071.
04,
553.
710
,624
.910
3.2
436.
41,
233.
484
8.7
1,21
4.7
805.
11,
067.
266
4.2
896.
063
4.8
715.
059
0.4
596.
044
0.8
245.
713
3.4
Tota
l with
out P
rice
Con
tinge
ncy
66,7
81.0
50,0
90.8
116,
873.
61,
134.
44,
800.
913
,567
.39,
335.
013
,360
.68,
856.
711
,738
.77,
306.
39,
855.
96,
983.
07,
865.
56,
494.
26,
556.
14,
848.
32,
702.
41,
467.
06
Pric
e Es
cala
tion
1,92
9.1
2,76
8.6
4,69
7.7
11.0
145.
610
9.2
313.
225
2.9
296.
933
0.8
407.
041
8.2
534.
449
7.2
651.
830
9.6
419.
75,
918.
33,
106.
49,
024.
729
.591
.132
8.4
261.
594
8.8
424.
71,
150.
151
4.8
1,04
7.2
503.
985
3.0
463.
096
9.4
526.
259
1.8
321.
289
8.5
452.
01,
350.
528
.957
.168
0.7
194.
718
8.8
200.
20.
00.
0
Sub
tota
l8,
745.
96,
327.
015
,072
.969
.429
3.8
1,11
8.3
769.
41,
390.
592
1.8
1,48
0.9
921.
81,
465.
41,
038.
31,
350.
21,
114.
81,
279.
094
5.9
591.
832
1.2
T
otal
of I
*75
,526
.956
,417
.813
1,94
6.5
1,20
3.9
5,09
4.7
14,6
85.6
10,1
04.4
14,7
51.1
9,77
8.5
13,2
19.6
8,22
8.1
11,3
21.3
8,02
1.3
9,21
5.7
7,60
9.0
7,83
5.1
5,79
4.2
3,29
4.2
1,78
8.2
IISu
pple
men
tary
Com
pone
nt o
f Dra
inag
e PP
1.0
Prep
arat
ory
Wor
ks61
0.8
367.
297
8.1
610.
836
7.2
Su
btot
al61
0.8
367.
297
8.1
610.
836
7.2
1.1
Supp
lem
enta
ry C
ompo
nent
, New
Sew
ers
1
) M
ain
sew
ers
1,05
0.0
1,05
0.0
2,10
0.0
233.
123
3.1
233.
123
3.1
233.
123
3.1
233.
123
3.1
117.
611
7.6
2
) B
ranc
h se
wer
s1,
225.
01,
225.
02,
450.
027
2.0
272.
027
2.0
272.
027
2.0
272.
027
2.0
272.
013
7.2
137.
2
Subt
otal
2,27
5.0
2,27
5.0
4,55
0.0
505.
150
5.1
505.
150
5.1
505.
150
5.1
505.
150
5.1
254.
825
4.8
1.2
Supp
lem
enta
ry C
ompo
nent
, An
Kim
Hai
Cha
nnel
B
ridge
1
) B
ridge
, W 7
.0 m
x L
12.
0 m
162.
818
0.9
343.
736
.140
.236
.140
.236
.140
.236
.140
.218
.220
.3
2)
Brid
ge, W
7.0
m x
L 1
5.0
m61
0.5
678.
51,
289.
013
5.5
150.
613
5.5
150.
613
5.5
150.
613
5.5
150.
668
.476
.0
3)
Brid
ge, W
7.0
m x
L 2
0.0
m27
1.3
301.
657
2.9
60.2
66.9
60.2
66.9
60.2
66.9
60.2
66.9
30.4
33.8
Su
btot
al1,
044.
61,
161.
02,
205.
623
1.9
257.
723
1.9
257.
723
1.9
257.
723
1.9
257.
711
7.0
130.
01.
3 Su
pple
men
tary
Com
pone
nt, R
oad
Anc
illar
y W
orks
1
) Li
ghtin
g69
3.6
21.5
715.
034
6.8
10.7
346.
810
.7
2)
Fenc
e2,
095.
264
.82,
160.
01,
047.
632
.41,
047.
632
.4
3
) Pl
antim
g0.
015
0.0
150.
00.
075
.00.
075
.0
Subt
otal
2,78
8.8
236.
33,
025.
00.
00.
00.
00.
00.
00.
01,
394.
411
8.1
1,39
4.4
118.
1
Tota
l6,
719.
24,
039.
510
,758
.661
0.8
367.
273
6.9
762.
873
6.9
762.
873
6.9
762.
82,
131.
388
0.9
1,76
6.2
503.
0
2. E
ngin
eerin
g Se
rvic
e C
ost
671.
940
3.9
1,07
5.9
96.1
57.8
96.1
57.8
96.1
57.8
96.1
57.8
96.1
57.8
96.1
57.8
95.4
57.4
3. A
dmin
istra
tion
0.0
355.
035
5.0
4.6
34.0
49.6
49.6
49.6
95.0
72.7
4. P
hysi
cal C
ontin
genc
y73
9.1
479.
81,
219.
09.
66.
270
.745
.983
.387
.083
.387
.083
.387
.022
2.7
103.
418
6.2
63.3
Tota
l with
out P
rice
Con
tinge
ncy
8,13
0.2
5,27
8.2
13,4
08.5
105.
768
.677
7.6
504.
991
6.3
957.
291
6.3
957.
291
6.3
957.
22,
450.
11,
137.
12,
047.
869
6.4
5. P
rice
Con
tinge
ncy
1,23
7.9
739.
51,
977.
46.
54.
264
.141
.695
.499
.611
5.6
120.
813
6.2
142.
342
0.6
195.
239
9.5
135.
8
To
tal o
f II
*9,
368.
16,
017.
915
,385
.911
2.2
72.8
841.
754
6.5
1,01
1.7
1,05
6.8
1,03
1.9
1,07
7.9
1,05
2.6
1,09
9.5
2,87
0.7
1,33
2.2
2,44
7.2
832.
1To
tal w
ithou
t Pri
ce C
ontin
genc
y74
,911
.255
,369
.013
0,28
2.1
1,24
0.1
4,86
9.5
14,3
44.9
9,83
9.9
14,2
76.9
9,81
3.9
12,6
55.0
8,26
3.5
10,7
72.2
7,94
0.2
10,3
15.6
7,63
1.3
8,60
3.9
5,54
4.7
2,70
2.4
1,46
7.0
Tot
al *
84,8
95.0
62,4
35.7
147,
332.
41,
316.
15,
167.
515
,527
.310
,650
.915
,762
.810
,835
.314
,251
.59,
306.
012
,373
.99,
120.
812
,086
.48,
941.
210
,282
.36,
626.
33,
294.
21,
788.
2
T
otal
Rec
urri
ng C
ost
0.0
1488
3.0
1488
3.0
0.0
0.0
0.0
0.0
0.0
2147
.00.
021
85.0
0.0
2538
.00.
025
66.0
0.0
2709
.00.
027
38.0
Not
e:A
ll th
e am
ount
s ar
e sh
own
in 2
000
cons
tant
pric
e ex
cept
for t
hose
mar
ked
with
”*
”
2010
2006
2007
2008
2009
Tota
l (U
S$)
2003
2004
2005
1 - 27
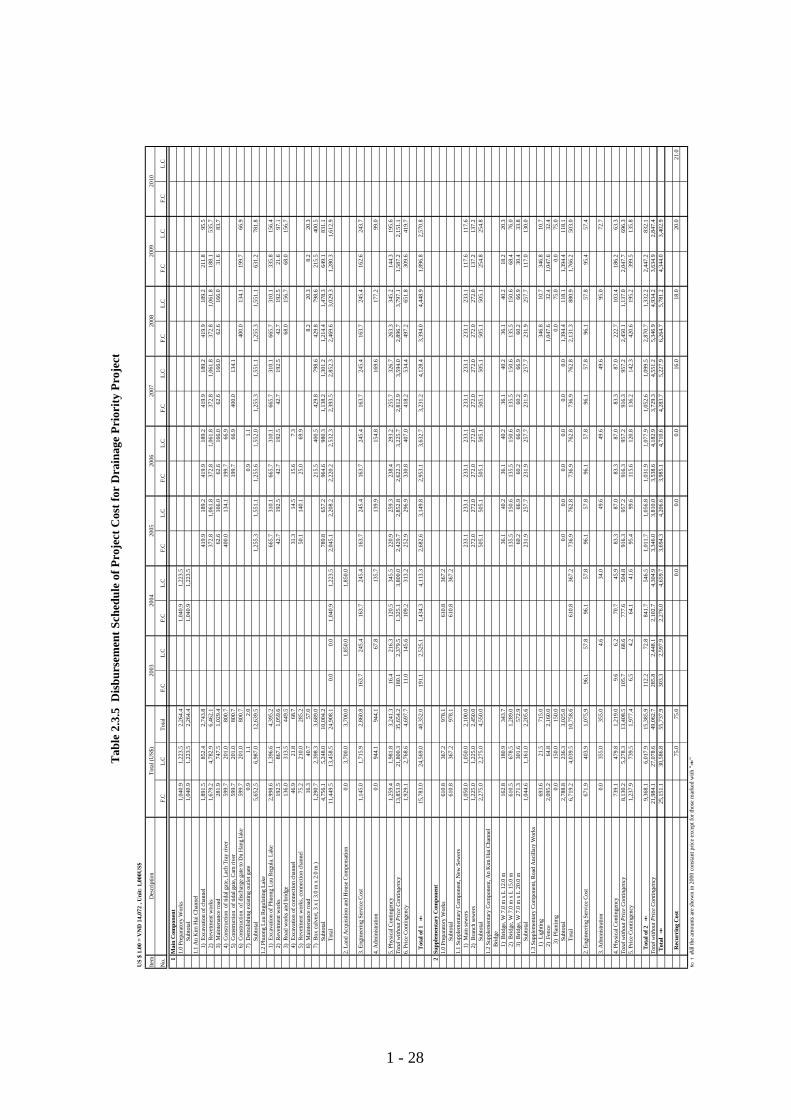
Tab
le 2
.3.5
Dis
burs
emen
t Sch
edul
e of
Pro
ject
Cos
t for
Dra
inag
e Pr
iori
ty P
roje
ct
Item
Des
crip
tion
No.
F.C
L.C
Tota
l F.
CL.
CF.
CL.
CF.
CL.
CF.
CL.
CF.
CL.
CF.
CL.
CF.
CL.
CF.
CL.
C
1M
ain
Com
pone
nt1.
0 Pr
epar
ator
y W
orks
1,04
0.9
1,22
3.5
2,26
4.4
1,04
0.9
1,22
3.5
Su
btot
al1,
040.
91,
223.
52,
264.
41,
040.
91,
223.
51.
1 A
n K
im H
ai C
hann
el
1)
Exca
vatio
n of
cha
nnel
1,89
1.5
852.
42,
743.
841
9.9
189.
241
9.9
189.
241
9.9
189.
241
9.9
189.
221
1.8
95.5
2
) R
evet
men
t wor
ks1,
679.
24,
782.
96,
462.
137
2.8
1,06
1.8
372.
81,
061.
837
2.8
1,06
1.8
372.
81,
061.
818
8.1
535.
7
3)
Mai
nten
ance
road
281.
974
7.5
1,02
9.4
62.6
166.
062
.616
6.0
62.6
166.
062
.616
6.0
31.6
83.7
4
) C
onst
ruct
ion
of t
idal
gat
e, L
ach
Tray
rive
r59
9.7
201.
080
0.7
400.
013
4.1
199.
766
.9
5)
Con
stru
ctio
n o
f tid
al g
ate,
Cam
rive
r59
9.7
201.
080
0.7
199.
766
.940
0.0
134.
1
6)
Con
stru
ctio
n o
f dis
char
ge g
ate
to D
u H
ang
lake
599.
720
1.0
800.
740
0.0
134.
119
9.7
66.9
7
) D
emol
ishi
ng e
xist
ing
outle
t gat
e0.
91.
12.
00.
91.
1
Subt
otal
5,65
2.5
6,98
7.0
12,6
39.5
1,25
5.3
1,55
1.1
1,25
5.6
1,55
2.0
1,25
5.3
1,55
1.1
1,25
5.3
1,55
1.1
631.
278
1.8
1.2
Phuo
ng L
uu R
egul
atin
g La
ke
1)
Exca
vatio
n of
Phu
ong
Luu
Reg
ula.
Lak
e2,
998.
61,
396.
64,
395.
266
5.7
310.
166
5.7
310.
166
5.7
310.
166
5.7
310.
133
5.8
156.
4
2)
Rev
etm
ent w
orks
192.
586
7.1
1,05
9.6
42.7
192.
542
.719
2.5
42.7
192.
542
.719
2.5
21.6
97.1
3
) R
oad
wor
ks a
nd b
ridge
136.
031
3.5
449.
568
.015
6.7
68.0
156.
7
4)
Exca
vatio
n of
con
nect
ion
chan
nel
46.9
21.8
68.7
31.3
14.5
15.6
7.3
5
) R
evet
men
t wor
ks, c
onne
ctio
n ch
anne
l75
.221
0.0
285.
250
.114
0.1
25.0
69.9
6
) M
aint
enan
ce ro
ad
16.3
40.7
57.0
8.2
20.3
8.2
20.3
7
) B
ox c
ulve
rt, 3
x (
3.0
m x
2.0
m )
1,29
0.7
2,39
8.3
3,68
9.0
215.
540
0.5
429.
879
8.6
429.
879
8.6
215.
540
0.5
Su
btot
al4,
756.
15,
248.
010
,004
.278
9.8
657.
296
4.6
980.
31,
138.
21,
301.
21,
214.
41,
478.
364
9.1
831.
1
Tota
l11
,449
.513
,458
.524
,908
.10.
00.
01,
040.
91,
223.
52,
045.
12,
208.
22,
220.
22,
532.
32,
393.
52,
852.
32,
469.
63,
029.
31,
280.
31,
612.
9
2. L
and
Acq
uisi
tion
and
Hou
se C
ompe
nsat
ion
0.0
3,70
0.0
3,70
0.0
1,85
0.0
1,85
0.0
3. E
ngin
eerin
g Se
rvic
e C
ost
1,14
5.0
1,71
5.9
2,86
0.8
163.
724
5.4
163.
724
5.4
163.
724
5.4
163.
724
5.4
163.
724
5.4
163.
724
5.4
162.
624
3.7
4. A
dmin
istra
tion
0.0
944.
194
4.1
67.8
135.
713
9.9
154.
816
9.6
177.
299
.0
5. P
hysi
cal C
ontin
genc
y1,
259.
41,
981.
83,
241.
316
.421
6.3
120.
534
5.5
220.
925
9.3
238.
429
3.2
255.
732
6.7
263.
334
5.2
144.
319
5.6
Tota
l with
out P
rice
Con
tinge
ncy
13,8
53.9
21,8
00.3
35,6
54.2
180.
12,
379.
51,
325.
13,
800.
02,
429.
72,
852.
82,
622.
33,
225.
72,
812.
93,
594.
02,
896.
73,
797.
11,
587.
22,
151.
16.
Pric
e C
ontin
genc
y1,
929.
12,
768.
64,
697.
711
.014
5.6
109.
231
3.2
252.
929
6.9
330.
840
7.0
418.
253
4.4
497.
265
1.8
309.
641
9.7
T
otal
of 1
*
15,7
83.0
24,5
69.0
40,3
52.0
191.
12,
525.
11,
434.
34,
113.
32,
682.
63,
149.
82,
953.
13,
632.
73,
231.
24,
128.
43,
394.
04,
448.
91,
896.
82,
570.
8
2Su
pple
men
tary
Com
pone
nt1.
0 Pr
epar
ator
y W
orks
610.
836
7.2
978.
161
0.8
367.
2
Subt
otal
610.
836
7.2
978.
161
0.8
367.
21.
1 Su
pple
men
tary
Com
pone
nt, N
ew S
ewer
s
1)
Mai
n se
wer
s1,
050.
01,
050.
02,
100.
023
3.1
233.
123
3.1
233.
123
3.1
233.
123
3.1
233.
111
7.6
117.
6
2)
Bra
nch
sew
ers
1,22
5.0
1,22
5.0
2,45
0.0
272.
027
2.0
272.
027
2.0
272.
027
2.0
272.
027
2.0
137.
213
7.2
Su
btot
al2,
275.
02,
275.
04,
550.
050
5.1
505.
150
5.1
505.
150
5.1
505.
150
5.1
505.
125
4.8
254.
81.
2 Su
pple
men
tary
Com
pone
nt, A
n K
im H
ai C
hann
el
Brid
ge
1)
Brid
ge, W
7.0
m x
L 1
2.0
m16
2.8
180.
934
3.7
36.1
40.2
36.1
40.2
36.1
40.2
36.1
40.2
18.2
20.3
2
) B
ridge
, W 7
.0 m
x L
15.
0 m
610.
567
8.5
1,28
9.0
135.
515
0.6
135.
515
0.6
135.
515
0.6
135.
515
0.6
68.4
76.0
3
) B
ridge
, W 7
.0 m
x L
20.
0 m
271.
330
1.6
572.
960
.266
.960
.266
.960
.266
.960
.266
.930
.433
.8
Subt
otal
1,04
4.6
1,16
1.0
2,20
5.6
231.
925
7.7
231.
925
7.7
231.
925
7.7
231.
925
7.7
117.
013
0.0
1.3
Supp
lem
enta
ry C
ompo
nent
, Roa
d A
ncill
ary
Wor
ks
1)
Ligh
ting
693.
621
.571
5.0
346.
810
.734
6.8
10.7
2
) Fe
nce
2,09
5.2
64.8
2,16
0.0
1,04
7.6
32.4
1,04
7.6
32.4
3)
Plan
timg
0.0
150.
015
0.0
0.0
75.0
0.0
75.0
Su
btot
al2,
788.
823
6.3
3,02
5.0
0.0
0.0
0.0
0.0
0.0
0.0
1,39
4.4
118.
11,
394.
411
8.1
To
tal
6,71
9.2
4,03
9.5
10,7
58.6
610.
836
7.2
736.
976
2.8
736.
976
2.8
736.
976
2.8
2,13
1.3
880.
91,
766.
250
3.0
2. E
ngin
eerin
g Se
rvic
e C
ost
671.
940
3.9
1,07
5.9
96.1
57.8
96.1
57.8
96.1
57.8
96.1
57.8
96.1
57.8
96.1
57.8
95.4
57.4
3. A
dmin
istra
tion
0.0
355.
035
5.0
4.6
34.0
49.6
49.6
49.6
95.0
72.7
4. P
hysi
cal C
ontin
genc
y73
9.1
479.
81,
219.
09.
66.
270
.745
.983
.387
.083
.387
.083
.387
.022
2.7
103.
418
6.2
63.3
Tota
l with
out P
rice
Con
tinge
ncy
8,13
0.2
5,27
8.3
13,4
08.5
105.
768
.677
7.6
504.
891
6.3
957.
291
6.3
957.
291
6.3
957.
22,
450.
11,
137.
02,
047.
769
6.3
5. P
rice
Con
tinge
ncy
1,23
7.9
739.
51,
977.
46.
54.
264
.141
.695
.499
.611
5.6
120.
813
6.2
142.
342
0.6
195.
239
9.5
135.
8
T
otal
of 2
*
9,36
8.1
6,01
7.9
15,3
85.9
112.
272
.884
1.7
546.
51,
011.
71,
056.
81,
031.
91,
077.
91,
052.
61,
099.
52,
870.
71,
332.
22,
447.
283
2.1
Tota
l with
out P
rice
Con
tinge
ncy
21,9
84.1
27,0
78.6
49,0
62.7
285.
82,
448.
12,
102.
74,
304.
93,
346.
03,
810.
03,
538.
64,
182.
93,
729.
34,
551.
25,
346.
94,
934.
23,
634.
92,
847.
4 T
otal
*
25,1
51.1
30,5
86.8
55,7
37.9
303.
32,
597.
92,
276.
04,
659.
73,
694.
34,
206.
63,
985.
14,
710.
64,
283.
75,
227.
96,
264.
75,
781.
24,
344.
03,
402.
9
R
ecur
ring
Cos
t75
.075
.00.
00.
00.
016
.018
.020
.021
.0
Not
e:A
ll th
e am
ount
s ar
e sh
own
in 2
000
cons
tant
pric
e ex
cept
for t
hose
mar
ked
with
”*
”
2005
2010
2006
2007
2008
2009
US
$ 1.
00 =
VN
D 1
4,07
2 , U
nit:
1,0
00U
S$
Tota
l (U
S$)
2003
2004
1 - 28

Item
Des
crip
tion
No.
F.C
L.C
Tot
al
F.C
L.C
F.C
L.C
F.C
L.C
F.C
L.C
F.C
L.C
F.C
L.C
F.C
L.C
F.C
L.C
1C
onst
ruct
ion
and
Proc
urem
ent C
ost
1.0
Prep
arat
ory
Wor
ks3,
184.
21,
393.
44,
577.
73,
184.
21,
393.
41.
1 T
runk
Sew
er, O
pen
Exc
avat
ion
3,10
1.0
3,68
9.1
6,79
1.3
564.
467
1.4
564.
467
1.4
564.
467
1.4
564.
467
1.4
564.
467
1.4
279.
133
2.0
1.2
Tru
nk S
ewer
, Pip
e Ja
ckin
g13
,312
.14,
263.
117
,575
.22,
422.
877
5.9
2,42
2.8
775.
92,
422.
877
5.9
2,42
2.8
775.
92,
422.
877
5.9
1,19
8.1
383.
71.
3 C
ombi
ned
Sew
er O
verf
low
Con
trol
1,96
6.9
298.
72,
265.
535
8.0
54.4
358.
054
.435
8.0
54.4
358.
054
.435
8.0
54.4
177.
026
.91.
4 M
anho
le17
5.3
178.
935
4.3
31.9
32.6
31.9
32.6
31.9
32.6
31.9
32.6
31.9
32.6
15.8
16.1
1.5
Man
hole
type
pum
p35
8.1
60.5
418.
665
.211
.065
.211
.065
.211
.065
.211
.065
.211
.032
.25.
41.
6 A
n D
a R
elay
Pum
ping
Sta
tion
691.
523
4.5
925.
911
5.5
39.2
230.
378
.123
0.3
78.1
115.
539
.21.
7 W
est W
aste
wat
er T
reat
men
t Pla
nt10
,001
.52,
973.
412
,974
.94,
000.
61,
189.
34,
000.
61,
189.
32,
000.
359
4.7
1.8
Supp
lem
enta
ry W
orks
2,23
5.8
2,23
5.8
4,47
1.6
406.
940
6.9
406.
940
6.9
406.
940
6.9
406.
940
6.9
406.
940
6.9
201.
220
1.2
Subt
otal
35,0
26.4
15,3
27.3
50,3
55.1
0.0
0.0
3,18
4.2
1,39
3.4
7,84
9.8
3,14
1.5
7,84
9.8
3,14
1.5
5,96
4.9
2,58
6.0
4,07
9.4
2,03
0.2
4,07
9.4
2,03
0.2
2,01
8.9
1,00
4.5
2L
and
Acq
uisi
tion
and
Com
pens
atio
n0.
02,
165.
02,
165.
00.
01,
082.
50.
01,
082.
5
3E
ngin
eeri
ng S
ervi
ce C
ost
3,50
2.6
1,74
9.2
5,25
2.0
437.
821
8.7
437.
821
8.7
437.
821
8.7
437.
821
8.7
437.
821
8.7
437.
821
8.7
437.
821
8.7
437.
821
8.7
4A
dmin
istr
atio
n0.
01,
733.
11,
733.
152
.218
9.5
349.
434
9.4
276.
220
3.0
203.
011
0.4
5Ph
ysic
al C
ontin
genc
y3,
852.
92,
097.
55,
950.
443
.813
5.3
362.
228
8.4
828.
837
1.0
828.
837
1.0
640.
330
8.1
451.
724
5.2
451.
724
5.2
245.
713
3.4
Tota
l with
out P
rice
Con
tinge
ncy
42,3
82.0
23,0
72.1
65,4
55.6
481.
61,
488.
73,
984.
33,
172.
49,
116.
44,
080.
59,
116.
44,
080.
57,
043.
03,
388.
94,
969.
02,
697.
14,
969.
02,
697.
12,
702.
41,
466.
96
Pric
e C
ontin
genc
y5,
918.
33,
106.
49,
024.
729
.591
.132
8.4
261.
594
8.8
424.
71,
150.
151
4.8
1,04
7.2
503.
985
3.0
463.
096
9.4
526.
259
1.8
321.
2
Tot
al
*48
,300
.226
,178
.674
,478
.851
1.1
1,57
9.8
4,31
2.7
3,43
4.0
10,0
65.2
4,50
5.2
10,2
66.5
4,59
5.4
8,09
0.2
3,89
2.8
5,82
1.9
3,16
0.0
5,93
8.4
3,22
3.2
3,29
4.2
1,78
8.2
Rec
urri
ng C
ost
1,47
0.0
1,47
0.0
309.
030
9.0
426.
042
6.0
Not
e:A
ll th
e am
ount
s ar
e sh
own
in 2
000
cons
tant
pri
ce e
xcep
t for
thos
e m
arke
d w
ith ”
*”
2008
2009
Tab
le 2
.3.6
D
isbu
rsem
ent S
ched
ule
of P
roje
ct C
ost f
or S
ewer
age
Prio
rity
Pro
ject
US
$ 1.
00 =
VN
D 1
4,07
2 , U
nit:
1,0
00U
S$
Tot
al (U
S$)
2003
2004
2005
2010
2006
2007
1 - 29
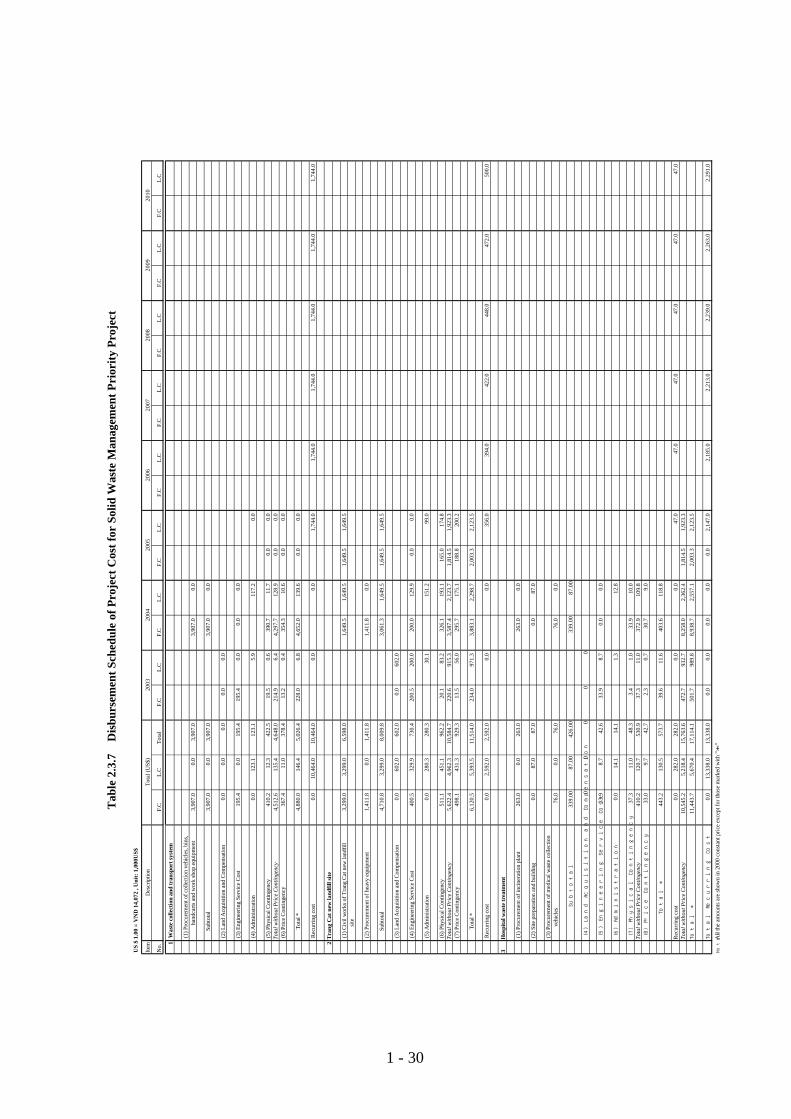
Item
Des
crip
tion
No.
F.C
L.C
Tota
l F.
CL.
CF.
CL.
CF.
CL.
CF.
CL.
CF.
CL.
CF.
CL.
CF.
CL.
CF.
CL.
C
1 W
aste
col
lect
ion
and
tran
spor
t sys
tem
(1) P
rocu
rem
ent o
f col
lect
ion
vehi
cles
, bin
s,
han
dcar
ts a
nd w
ork
shop
equ
ipm
ent
3,90
7.0
0.0
3,90
7.0
3,90
7.0
0.0
Subt
otal
3,90
7.0
0.0
3,90
7.0
3,90
7.0
0.0
(2) L
and
Acq
uisi
tion
and
Com
pens
atio
n0.
00.
00.
00.
00.
0
(3) E
ngin
eerin
g Se
rvic
e C
ost
195.
40.
019
5.4
195.
40.
00.
00.
0
(4) A
dmin
istra
tion
0.0
123.
112
3.1
5.9
117.
20.
0
(5) P
hysi
cal C
ontin
genc
y41
0.2
12.3
422.
519
.50.
639
0.7
11.7
0.0
0.0
Tota
l with
out P
rice
Con
tinge
ncy
4,51
2.6
135.
44,
648.
021
4.9
6.4
4,29
7.7
128.
90.
00.
0 (6
) Pric
e C
ontin
genc
y36
7.4
11.0
378.
413
.20.
435
4.3
10.6
0.0
0.0
Tot
al *
4,88
0.0
146.
45,
026.
422
8.0
6.8
4,65
2.0
139.
60.
00.
0
Rec
urrin
g co
st0.
010
,464
.010
,464
.00.
00.
01,
744.
01,
744.
01,
744.
01,
744.
01,
744.
01,
744.
0
2T
rang
Cat
new
land
fill s
ite
(1
) Civ
il w
orks
of T
rang
Cat
new
land
fill
3,
299.
03,
299.
06,
598.
01,
649.
51,
649.
51,
649.
51,
649.
5
site
(2) P
rocu
rem
ent o
f hea
vy e
quip
men
t1,
411.
80.
01,
411.
81,
411.
80.
0
Subt
otal
4,71
0.8
3,29
9.0
8,00
9.8
3,06
1.3
1,64
9.5
1,64
9.5
1,64
9.5
(3) L
and
Acq
uisi
tion
and
Com
pens
atio
n0.
060
2.0
602.
00.
060
2.0
(4) E
ngin
eerin
g Se
rvic
e C
ost
400.
532
9.9
730.
420
0.5
200.
020
0.0
129.
90.
00.
0
(5) A
dmin
istra
tion
0.0
280.
328
0.3
30.1
151.
299
.0
(6) P
hysi
cal C
ontin
genc
y51
1.1
451.
196
2.2
20.1
83.2
326.
119
3.1
165.
017
4.8
Tota
l with
out P
rice
Con
tinge
ncy
5,62
2.4
4,96
2.3
10,5
84.7
220.
691
5.3
3,58
7.4
2,12
3.7
1,81
4.5
1,92
3.3
(7) P
rice
Con
tinge
ncy
498.
143
1.3
929.
313
.556
.029
5.7
175.
118
8.8
200.
2
Tot
al *
6,12
0.5
5,39
3.5
11,5
14.0
234.
097
1.3
3,88
3.1
2,29
8.7
2,00
3.3
2,12
3.5
Rec
urrin
g co
st0.
02,
592.
02,
592.
00.
00.
035
6.0
394.
042
2.0
448.
047
2.0
500.
0
3H
ospi
tal w
aste
trea
tmen
t
(1) P
rocu
rem
ent o
f inc
iner
atio
n pl
ant
263.
00.
026
3.0
263.
00.
0
(2) S
ite p
repa
ratio
n an
d bu
ildin
g0.
087
.087
.00.
087
.0
(3) P
rocu
rem
ent o
f med
ical
was
te c
olle
ctio
n
vehi
cles
76.0
0.0
76.0
76.0
0.0
S
ubto
tal
339.
0087
.00
426.
0033
9.00
87.0
0
(4)
Lan
d A
cqui
sition
and
Com
pens
atio
n0
00
00
(5)
Eng
inee
ring
Ser
vice
Cos
t33
.98.
742
.633
.98.
70.
00.
0
(6)
Adm
inis
trat
ion
0.0
14.1
14.1
1.3
12.8
(7)
Phy
sica
l Con
ting
ency
37.3
11.0
48.3
3.4
1.0
33.9
10.0
Tota
l with
out P
rice
Con
tinge
ncy
410.
212
0.7
530.
937
.311
.037
2.9
109.
8 (8)
Price
Con
ting
ency
33.0
9.7
42.7
2.3
0.7
30.7
9.0
T
otal
*44
3.2
130.
557
3.7
39.6
11.6
403.
611
8.8
Rec
urrin
g co
st0.
028
2.0
282.
00.
00.
047
.047
.047
.047
.047
.047
.0To
tal w
ithou
t Pri
ce C
ontin
genc
y10
,545
.25,
218.
415
,763
.647
2.7
932.
78,
258.
02,
362.
41,
814.
51,
923.
3T
otal
*11
,443
.75,
670.
417
,114
.150
1.7
989.
88,
938.
72,
557.
12,
003.
32,
123.
5
Tot
al R
ecur
ring
Cos
t0.
013
,338
.013
,338
.00.
00.
00.
00.
00.
02,
147.
02,
185.
02,
213.
02,
239.
02,
263.
02,
291.
0
Not
e:A
ll th
e am
ount
s ar
e sh
own
in 2
000
cons
tant
pric
e ex
cept
for t
hose
mar
ked
with
”*
”
US
$ 1.
00 =
VN
D 1
4,07
2 , U
nit:
1,0
00U
S$
Tota
l (U
S$)
2003
2004
Tab
le 2
.3.7
D
isbu
rsem
ent S
ched
ule
of P
roje
ct C
ost f
or S
olid
Was
te M
anag
emen
t Pri
ority
Pro
ject
2005
2010
2006
2007
2008
2009
1 - 30

1 F
easi
bilit
y St
udy
by J
ICA
2 F
inan
cial
Arr
ange
men
t
3 A
ppro
val o
f Pro
ject
and
Arr
ange
men
t by
GO
V
4 P
rocu
rem
ent o
f Con
sulta
nt
5 E
ngin
eeri
ng S
ervi
ce (
Det
aile
d D
esig
n an
d Su
perv
isio
n W
orks
)
6 L
and
Acq
uisi
tion
and
Res
ettle
men
t
7 W
aste
Col
lect
ion
and
Tra
nspo
rt
8 T
rang
Cat
Lan
dfill
9 M
edic
al W
aste
Inci
nera
tion
10 D
rain
age
Prio
rity
Pro
ject
11 S
ewer
age
Prio
rity
Pro
ject
2000
2001
2002
2003
2004
2005
Des
crip
tion
Figu
re 2
.3.1
Ove
rall
Impl
emen
tatio
n Sc
hedu
le fo
r Se
lect
ed P
rior
ity P
roje
ct
2010
Yea
r20
0620
0720
0820
09
1 - 31

Des
crip
tion
Qua
ntity
An
Kim
Hai
Cha
nnel
and
Phu
ong
Luu
Reg
ulat
ing
Lake
0 P
repa
rato
ry W
orks
L.S
1 A
n K
im H
ai C
hann
el
1)
Exca
vatio
n of
cha
nnel
164,
500
m3
2
) R
evet
men
t wor
ks53
,200
m3
3
) M
aint
enan
ce ro
ad20
,000
m2
4
) C
onst
ruct
ion
of t
idal
gat
e, L
ach
Tray
rive
rL.
S
5)
Con
stru
ctio
n o
f tid
al g
ate,
Cam
rive
rL.
S
6)
Con
stru
ctio
n o
f dis
char
ge g
ate
to D
u H
ang
lake
L.S
7
) D
emol
ishi
ng e
xist
ing
outle
t gat
eL.
S
2 P
huon
g Lu
u R
egul
atin
g La
ke
1)
Exca
vatio
n of
Phu
ong
Luu
Reg
ulat
ing
Lake
672,
000
m3
2
) R
evet
men
t wor
ks8,
200
m3
3
) R
oad
wor
ks a
nd b
ridge
1,40
0 m
2
4)
Exca
vatio
n of
con
nect
ion
chan
nel
10,9
00 m
3
5)
Rev
etm
ent w
orks
, con
nect
ion
chan
nel
2,66
0 m
3
6)
Mai
nten
ance
road
1,
000
m2
7
) B
ox c
ulve
rt, 3
x (
3.0
m x
2.0
m )
450
m
3 C
onst
ruct
ion
of N
ew S
ewer
s
1)
Trun
k se
wer
s3,
000
m
2)
Lat
eral
sew
ers
7,00
0 m
4 S
uppl
emen
tary
Com
pone
nt, A
n K
im H
ai C
hann
el B
ridge
1
) B
ridge
, W 7
.0 m
x L
12.
0 m
3 no
s
2)
Brid
ge, W
7.0
m x
L 1
5.0
m9
nos
3
) B
ridge
, W 7
.0 m
x L
20.
0 m
3 no
s
5 R
oad
Anc
illar
y W
orks
1
) Li
ghtin
g65
0nos
2
) Fe
nce
2400
0m
3)
Plan
ting
L.S
2002
2003
2004
Figu
re 2
.3.2
Im
plem
enta
tion
Sche
dule
for
Dra
inag
e Pr
iori
ty P
roje
ct
2005
2010
2006
2007
2008
2009
Yea
r20
0020
01
1 - 32

Des
crip
tion
Qua
ntity
Wes
t Was
tew
ater
Tre
atm
ent P
lant
, Pha
se I,
Com
bine
d Se
wer
Are
a0
Pre
para
tory
Wor
ksL.
S
1 T
runk
Sew
er, O
pen
Exca
vatio
n, 1
00-1
200
mm
dia
.12
,260
m
2 T
runk
Sew
er, P
ipe
Jack
ing,
800
-180
0 m
m d
ia.
7,66
0 m
3 C
ombi
ned
Sew
er O
verf
low
Con
trol S
truct
ure
63 n
os
4 M
anho
les
189
nos
5 M
anho
le T
ype
Pum
p
1)
Civ
il W
orks
5 no
s
2)
Pum
ping
faci
litie
s5
nos
6 A
n D
a R
elay
Pum
ping
Sta
tion
6.1
Pum
ping
Hou
se S
truct
ure
1)
Exca
vatio
n of
com
mon
soi
l3,
110
m3
2)
Emba
nkm
ent
5,27
0 m
3
3
) C
oncr
ete
pile
336
m
4
) So
il im
prov
emen
t92
4 m
3
5
) C
oncr
ete
wor
ks44
7 m
36.
2 P
umpi
ng F
acili
ties
1)
Pum
p, 3
00 m
m d
ia.,
11 m
3/m
in, 1
8.5
kw4
sets
2)
Elec
trica
l equ
ipm
ent
L.S
7 W
est W
aste
wat
er T
reat
men
t Pla
nt7.
1 P
umpi
ng H
ouse
Stru
ctur
e
1
) Ex
cava
tion
of c
omm
on s
oil
5,15
0 m
3
2
) B
ackf
illin
g5,
200
m3
3)
Con
cret
e pi
le, 3
00m
mx3
00m
m54
0 m
4)
Soil
impr
ovem
ent
1,52
0 m
3
5
) C
oncr
ete
wor
ks59
4 m
37.
2 A
erat
ed L
agoo
n Tr
eatm
ent P
roce
ss
1
) Ex
cava
tion
of c
omm
on s
oil
12,8
00 m
3
2
) So
il st
abili
zatio
n12
,800
m3
3)
Aer
ator
s, 5
5 kw
32 s
ets
7.3
Set
tling
Pon
d
1
) Ex
cava
tion
of c
omm
on s
oil
49,0
00 m
3
2
) So
il st
abili
zatio
n8,
200
m3
7.4
Chl
orin
atio
n Ta
nk
1
) Ex
cava
tion
of c
omm
on s
oil
500
m3
2)
Con
cret
e62
0 m
37.
5 S
torm
wat
er s
edim
enta
tion
pond
1)
Exca
vatio
n of
com
mon
soi
l4,
700
m3
2)
Soil
stab
iliza
tion
1,40
0 m
37.
6 S
ludg
e D
ryin
g B
ed
1)
Exca
vatio
n of
com
mon
soi
l1,
600
m3
2)
Soil
stab
iliza
tion
6,80
0 m
3
3
) C
oncr
ete
1,53
0 m
37.
7 B
uild
ing
Wor
ks
1)
Ope
ratio
n bu
ildin
g64
0 m
2
2
) O
ther
bui
ldin
g43
0 m
27.
8 P
umpi
ng F
acili
ties
1)
Rac
k ra
ke4
sets
2)
Pum
p, 4
00 m
m d
ia.,
22.5
m3/
min
, 55
kw2
sets
3)
Pum
p, 6
00 m
m d
ia.,
45.1
m3/
min
, 110
kw
1
set
4)
Dre
dge
pum
p, 1
.3 m
3/m
in, 7
.5 k
w1
set
5)
Elec
trica
l equ
ipm
ent
L.S
8.0
Sup
plem
enta
ry w
orks
1)
Con
stru
ctio
n of
pre
cast
R.C
. pip
e, 3
00 m
m10
,000
m
2
) C
onst
ruct
ion
of p
reca
st R
.C. p
ipe,
400
mm
5,00
0 m
3)
Con
stru
ctio
n of
pre
cast
R.C
. pip
e, 5
00 m
m3,
000
m
4
) C
onst
ruct
ion
of p
reca
st R
.C. p
ipe,
700
mm
2,00
0 m
5)
Man
hole
270
nos
6)
Man
hole
type
pum
p5
nos
2000
2001
2002
2003
2004
2005
Figu
re2.
3.3
Impl
emen
tatio
n Sc
hedu
le fo
r Se
wer
age
Prio
rity
Pro
ject 20
0820
0920
10Y
ear
2006
2007
1 - 33
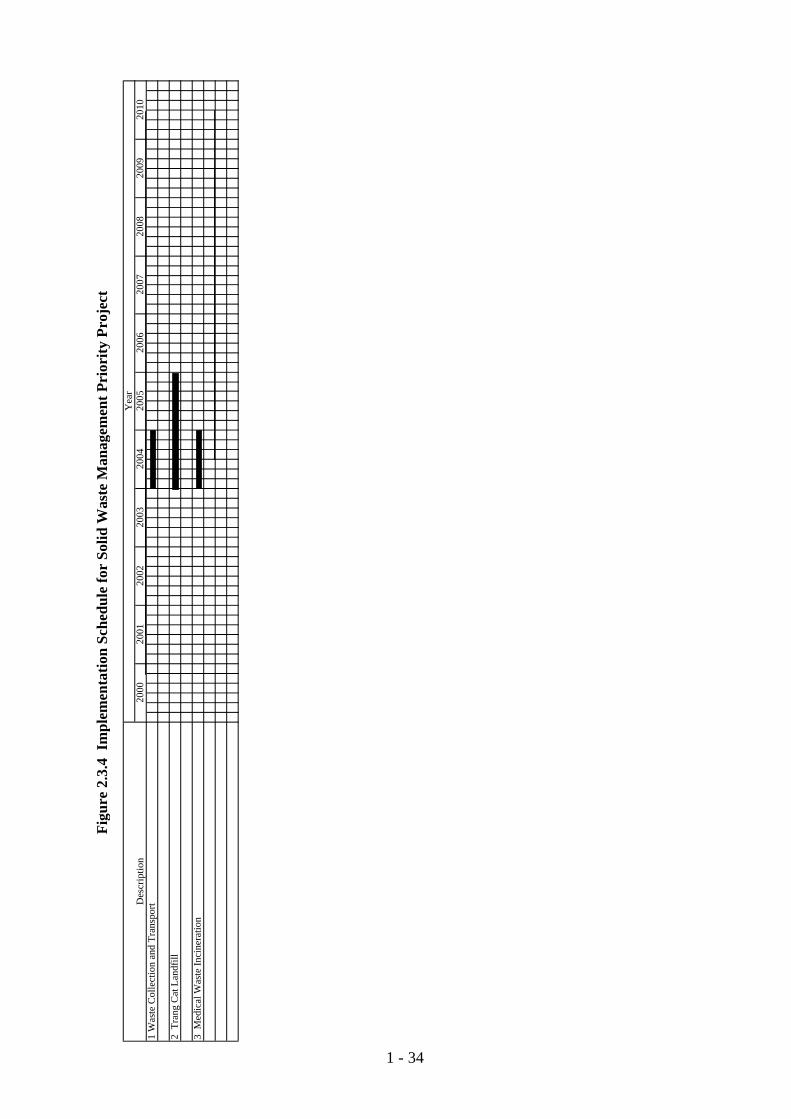
1 W
aste
Col
lect
ion
and
Tra
nspo
rt
2 T
rang
Cat
Lan
dfill
3 M
edic
al W
aste
Inci
nera
tion
2004
2005
Figu
re 2
.3.4
Im
plem
enta
tion
Sche
dule
for
Solid
Was
te M
anag
emen
t Pri
ority
Pro
ject
Des
crip
tion
2010
Yea
r20
0620
0720
0820
0920
0020
0120
0220
03
1 - 34
The Study on Sanitation Improvement Plan for Haiphong City, Vietnam
Final Report, Main Report, Volume 2, Part 2
2 - 1
PART 2 FEASIBILITY STUDY OF DRAINAGE PRIORITY PROJECT
CHAPTER 1 BACKGROUND
1.1 Drainage Improvement Master Plan
1.1.1 Class A Areas
(1) Need for Storm Water Drainage Improvements
Class A Areas comprise existing urbanized areas in the Haiphong City area with high population densities. Because of the high degree of land development, a properly developed storm water drainage system is needed in Class A Areas.
Flooding occurs regularly in the three urban districts of Class A Areas. Because of urbanized conditions the amount of storm water runoff is high and accumulates in low areas, causing flooding of significant magnitude and duration.
(2) Target Planning Areas
Three target planning areas were defined in the Drainage Improvement Master Plan for Class A Areas. Definition of the target planning areas was based on the following considerations:
• Current and future planned population densities
• Natural conditions related to drainage, including land levels, number of outlets connected with tidal rivers, channels, and lakes
• Whether combined sewers presently exist or not
The target planning areas are located in Le Chan District, Ngo Quyen District, Old City Center within the Hong Bang District, 2 communes located outside and south of Le Chan District, and 4 communes located outside and east of Ngo Quyen District. The total coverage area is 5,240 ha.
After selection of the Drainage Priority Project and during preliminary design, the target planning areas were slightly modified. Land area of 172 ha was removed from the Central Area and included in the New Urban Area. Purpose of the modification was to have consistency with the target planning areas of the selected Sewerage Priority Project. It was assessed that the modification did not affect the preliminary designs of Phase I and Phase II Projects.
The locations of the modified target planning areas are presented in Figure 2.1.1. Characteristics of each planning area is presented in the following table.
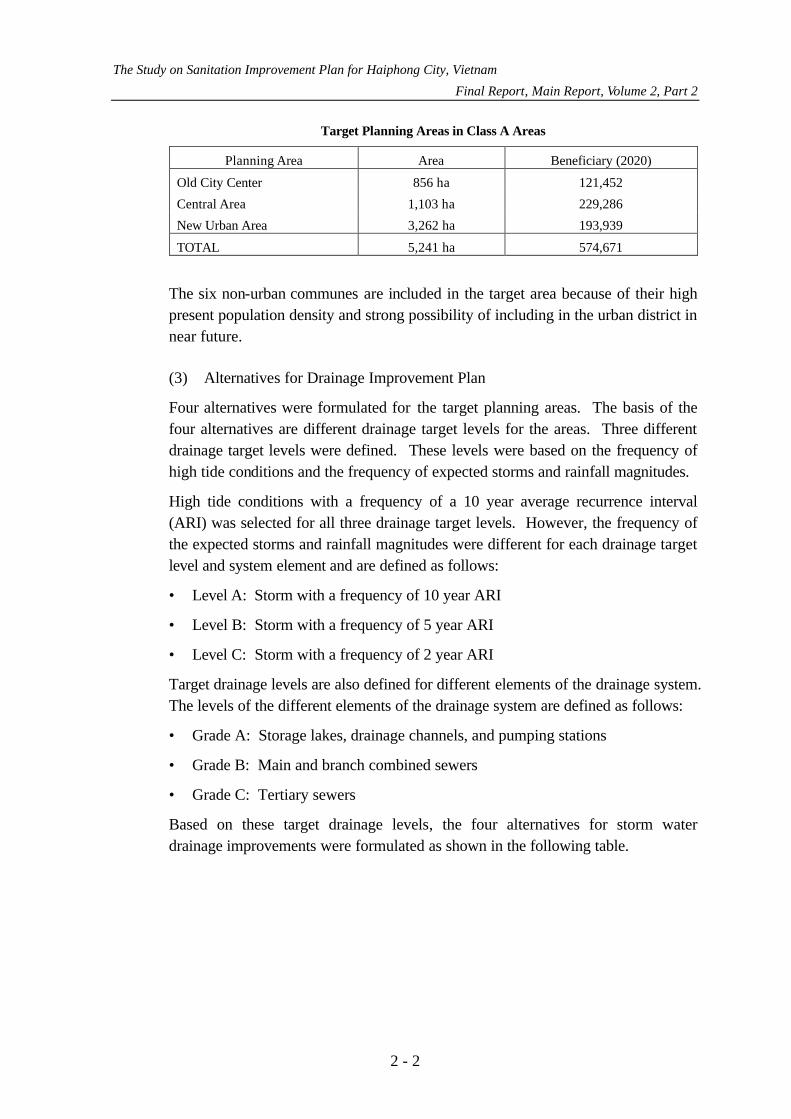
The Study on Sanitation Improvement Plan for Haiphong City, Vietnam
Final Report, Main Report, Volume 2, Part 2
2 - 2
Target Planning Areas in Class A Areas
Planning Area Area Beneficiary (2020)
Old City Center 856 ha 121,452
Central Area 1,103 ha 229,286
New Urban Area 3,262 ha 193,939
TOTAL 5,241 ha 574,671
The six non-urban communes are included in the target area because of their high present population density and strong possibility of including in the urban district in near future.
(3) Alternatives for Drainage Improvement Plan
Four alternatives were formulated for the target planning areas. The basis of the four alternatives are different drainage target levels for the areas. Three different drainage target levels were defined. These levels were based on the frequency of high tide conditions and the frequency of expected storms and rainfall magnitudes.
High tide conditions with a frequency of a 10 year average recurrence interval (ARI) was selected for all three drainage target levels. However, the frequency of the expected storms and rainfall magnitudes were different for each drainage target level and system element and are defined as follows:
• Level A: Storm with a frequency of 10 year ARI
• Level B: Storm with a frequency of 5 year ARI
• Level C: Storm with a frequency of 2 year ARI
Target drainage levels are also defined for different elements of the drainage system. The levels of the different elements of the drainage system are defined as follows:
• Grade A: Storage lakes, drainage channels, and pumping stations
• Grade B: Main and branch combined sewers
• Grade C: Tertiary sewers
Based on these target drainage levels, the four alternatives for storm water drainage improvements were formulated as shown in the following table.

The Study on Sanitation Improvement Plan for Haiphong City, Vietnam
Final Report, Main Report, Volume 2, Part 2
2 - 3
Planning Alternatives for Drainage Improvement Master Plan in Class A Areas
Target Drainage Level Target Area Lakes and Channels Sewers
Alternative D1 Central Area New Urban Area Old City Center
5 Year ARI Storm 5 Year ARI Storm No Action
2 Year ARI Storm 2 Year ARI Storm No Action
Alternative D2 Central Area New Urban Area Old City Center
5 Year ARI Storm 5 Year ARI Storm 2 Year ARI Storm
2 Year ARI Storm 2 Year ARI Storm 2 Year ARI Storm
Alternative D3 Central Area New Urban Area Old City Center
10 Year ARI Storm 10 Year ARI Storm 2 Year ARI Storm
5 Year ARI Storm 5 Year ARI Storm 2 Year ARI Storm
Alternative D4 Central Area New Urban Area Old City Center
10 Year ARI Storm 10 Year ARI Storm 2 Year ARI Storm
5 Year ARI Storm 5 Year ARI Storm 5 Year ARI Storm
For the alternative formulation, the Old City Center is considered as relatively low priority when considering the present high degree of drainage development. In Alternative D1, this area is not included. However, in the other three alternatives this area is included, because of the high population density and economic importance of the area.
Furthermore, all alternatives were divided into two implementation phases. The Central Area was selected to be covered in Phase I. As the Old City Center is considered to have relatively low priority from further development needs, this area is included in Phase II, except for Alternative D1, where this area is not included in either phase. New Urban Area is not yet developed, so this area is included in Phase II for all four alternatives.
(4) Selection of Alternative for Drainage Improvement Plan
The formulated alternatives were compared from the following major points:
• Inclusion or exclusion of the Old City Center
• Selection of the most appropriate target drainage level for each area based on average recurrence interval of expected tide conditions and storms
• Phasing of implementation of the drainage improvements for each area
Alternative D2 was selected as the optimum measure for Class A Areas. The basis for this selection included the following:
• Complete coverage of the target planning area
• Target drainage levels are adequate when considering high tide conditions
• Most cost effective for largest coverage of target planning area

The Study on Sanitation Improvement Plan for Haiphong City, Vietnam
Final Report, Main Report, Volume 2, Part 2
2 - 4
As a summary the drainage improvement plan for Class A Areas have target drainage levels for the different grade facilities and a phased implementation schedule as presented in the following table.
Planning Criteria for Drainage Improvement Plan for Class A Areas
Target Drainage Level Target Area Grade A Grade B High Tide
Implementation
Central Area 5 year ARI Storm 2 year ARI Storm 10 year ARI Phase I
Old City Center 2 year ARI Storm 2 year ARI Storm 10 year ARI Phase II
New Urban Area 5 year ARI Storm 2 year ARI Storm 10 year ARI Phase II
1.1.2 Class B Areas
(1) Need for Storm Water Drainage Improvements in Class B Areas
Class B Areas include Kien An District, Do Son Town, and Quan Toan Area. These areas are characterized as areas under urbanization with medium population density and tourism areas.
For Class B Areas, the degree of developed land is great enough that it requires a properly developed and functioning storm water drainage system. At present there are 12 km of existing combined sewers, 10 km of drainage channels, and 8 tidal gates in Kien An.
For the other sub-areas the degree of developed land is not great, and natural drainage is sufficient. Investments in storm water drainage improvements are then needed only for Kien An in Class B Areas.
(2) Drainage Improvement Plan for Class B Areas
The components of the proposed drainage improvement plan for Kien An are presented in the following table.
Proposed Drainage Improvement Plan for Kien Anh
Item Unit Amount
Rehabilitation of existing sewer km 10.0
Construction of new sewer km 17.2
Construction of main drainage channel km 5.0
Rehabilitation of tidal gate nos. 7
Planning criteria is as follows:
• Grade A facilities: 5 year ARI storm, 10 year ARI tide conditions
• Grade B facilities: 2 year ARI storm, 10 year ARI tide conditions

The Study on Sanitation Improvement Plan for Haiphong City, Vietnam
Final Report, Main Report, Volume 2, Part 2
2 - 5
1.1.3 Class C Areas
Class C Areas include Minh Duc, New Development Area, and Dinh Vu. These areas are characterized as rural or undeveloped areas with low population density where agricultural land use is dominating.
For all areas in Class C Areas the degree of developed land is not great, and natural drainage is sufficient. Investments in storm water drainage improvements are therefore not needed in Class C Areas.
1.1.4 Related On-Going Projects
At present there are two related on-going projects in Class A Areas: World Bank Sanitation Project and FINNIDA Project. These projects are included in the Drainage Improvement Master Plan.
Both projects include measures for drainage improvements in both the Old City Center and the Central Area. However, both projects do not achieve the target drainage levels of 10 year ARI high tide conditions formulated in the Drainage Improvement Master Plan for these areas.
General aspects of these two projects are summarized in the following sections.
(1) World Bank Sanitation Project
In the Old City Center and Central Area, the existing combined sewers are to be cleaned and inspected. Sewers needing rehabilitation will then be identified, and these sewers will either be repaired or replaced. In addition about 7 km of new combined sewers are to be constructed to reduce flooding in prioritized flood areas.
In the Central Area, the Northeast and Southwest Channels are to be rehabilitated by dredging the channels and constructing embankment works and maintenance roads. May Den and Vinh Niem Tidal Gates at the outlets of these channels are also to be rehabilitated.
In the Central Area, Tien Nga, Sen, Lam Tuong and Du Hang Lakes are to be rehabilitated by dredging the lakes and constructing embankment works and maintenance roads.
For the Old City Center and Central Area, vehicles and equipment are procured for cleaning, inspecting and maintaining the combined sewer network.
Also, treatment facilities at Trang Cat Landfill are provided for treating and disposing the sludge which is dredged from the channels.

The Study on Sanitation Improvement Plan for Haiphong City, Vietnam
Final Report, Main Report, Volume 2, Part 2
2 - 6
(2) FINNIDA Projects
In the Central Area, two storm water pumping stations are to be constructed. The pumping stations are located at May Den and Vinh Niem Tidal Gates. Total capacity of each pumping station is 9 m3/s.
1.1.5 Implementation and Costs Estimates
Implementation of Phase I for Class A Areas is targeted for completion by the Year 2010 and Phase II by the Year 2020. Time frame for the implementation of the proposed project in Kien Anh is proposed for Phase II.
The total direct costs of the Drainage Improvement Master Plan is estimated at about US$179 million.
1.2 Selection of Drainage Priority Project
Phase I of the proposed Drainage Improvement Master Plan in Class A Areas is selected as the Drainage Priority Project. The project consists of two main components as follows:
• Rehabilitation of An Kim Hai Channel
• Construction of Phuong Luu Lake
The selection was based on the following justifications.
(1) Need for New Detailed Study
Although the World Bank and FINNIDA Projects include project components both for the Central Area and the Old City Center, they are limited in degree. For the Central Area, the anticipated drainage improvements are not considered as sufficiently comprehensive and do not achieve the target drainage levels.
(2) Urgency
The Central Area to be covered by the Drainage Priority Project is seriously affected by flooding. The area experiences different degrees of flooding almost every year, and sometimes several times in a year.
(3) Satisfaction of the Project Objectives
Sanitation conditions will be improved by avoiding frequent flooding. Furthermore, pollution in An Kim Hai Channel would be reduced. The rehabilitated channel could also be used for flushing the existing lakes in the Central Area with cleaner water. The improved sanitation conditions from the reduced pollution in the water bodies would provide a more healthy living environment.
The Study on Sanitation Improvement Plan for Haiphong City, Vietnam
Final Report, Main Report, Volume 2, Part 2
2 - 7
(4) Economic Viability
The Central Area is the most densely populated area in Haiphong City with the expected population density of 235 persons per ha in the year 2020. The number of beneficiaries will total about 240,000 persons in 2010 and 260,000 persons in 2020. Drainage conditions will be improved for about 1,100 ha.
Investment cost per beneficiary is the smallest among all the drainage alternatives formulated in the JICA Study for the Central Area.
(5) Financial Affordability
Investment cost is the lowest among the alternatives which completely cover the target planning areas in the Class A Areas.
(6) Technical Feasibility
Proposed plan will mainly consist of ordinary civil works and no special technology will be needed both for construction and operation and maintenance.
(7) Meeting Time Requirement
Physical works will not require a long time for completion. However, careful consideration will be needed for the time needed for possible relocation of the inhabitants associated with rehabilitation of An Kim Hai Channel.
(8) Coordination and Being Complementary with Other Plans
The World Bank and FINNIDA Projects cover the Central Area, except for the drainage zones of An Kim Hai Channel. However, the improvements are directed to drainage zones which are not integrated. The Drainage Priority Project would include the An Kim Hai Channel Drainage Zone and integrate the three drainage zones. The Priority Project would then increase the effectiveness of these projects, as well as providing additional needed improvements.
(9) Complement of with the Long-Term Sanitation Master Plan
The Drainage Priority Project forms an integral part of the long-term Sanitation Improvement Master Plan to be implemented in Phase I.
(10) Small Negative Impacts
Since it will include the rehabilitation of the An Kim Hai channel of 10 km length, relocation of inhabitants along the channel will be unavoidable. Careful consideration is taken to minimize the relocation.

The Study on Sanitation Improvement Plan for Haiphong City, Vietnam
Final Report, Main Report, Volume 2, Part 2
2 - 8
CHAPTER 2 RECOMMENDED DRAINAGE PRIORITY PROJECT
2.1 System Concept of Priority Project
2.1.1 Background
The Priority Project consists of rehabilitating of an existing channel and construction of a new lake. The Priority Project is based on the Haiphong Sewerage and Drainage Master Plan prepared by Haiphong City and is consistent with development plans for the city.
The main components of the Drainage Priority Project consist of the following:
• Rehabilitation of An Kim Hai Channel
• Construction of Phuong Luu Lake
The main project components and given conditions are presented in Figure 2.2.1.
The existing length of An Kim Hai Channel in the Priority Project area is 10 km. An existing tidal gate (Nam Dong Tidal Gate) is located at the discharge point of the channel to Cam River. A siphon structure is located at the west end of the channel and crosses under the Lach Tray River to connect with the upstream part of the channel outside the Priority Project area. A flow gate is connected to the siphon structure on the west side of the Lach Tray River.
There are seven main lakes used for drainage and storm water storage in the Priority Project area. The Priority Project proposes to construct a new lake (Phuong Luu Lake). Phuong Luu Lake would be connected to the Northeast Channel and An Kim Hai Channel.
2.1.2 Development Approach
The drainage system for the area of the Drainage Priority Project is based on a trunk system consisting of drainage channels, storage lakes, and tidal gates.
The channels are needed because of the low land levels and the long distances to the receiving rivers. Combined sewers discharge storm water to the channels, from where the storm water is then discharged to rivers and lakes.
The storage lakes are needed because the land levels are lower than the highest tide levels. Storm water must then be discharged and stored in the lakes during high tide conditions.
Tidal gates are used at the discharge points of the channels to the rivers. During high tide the tidal gates are closed and storm water is stored in the lakes. The storm water is stored in the lakes until the tide decreases to a level where the tidal gates can be opened and the stored water can be discharged through the channels
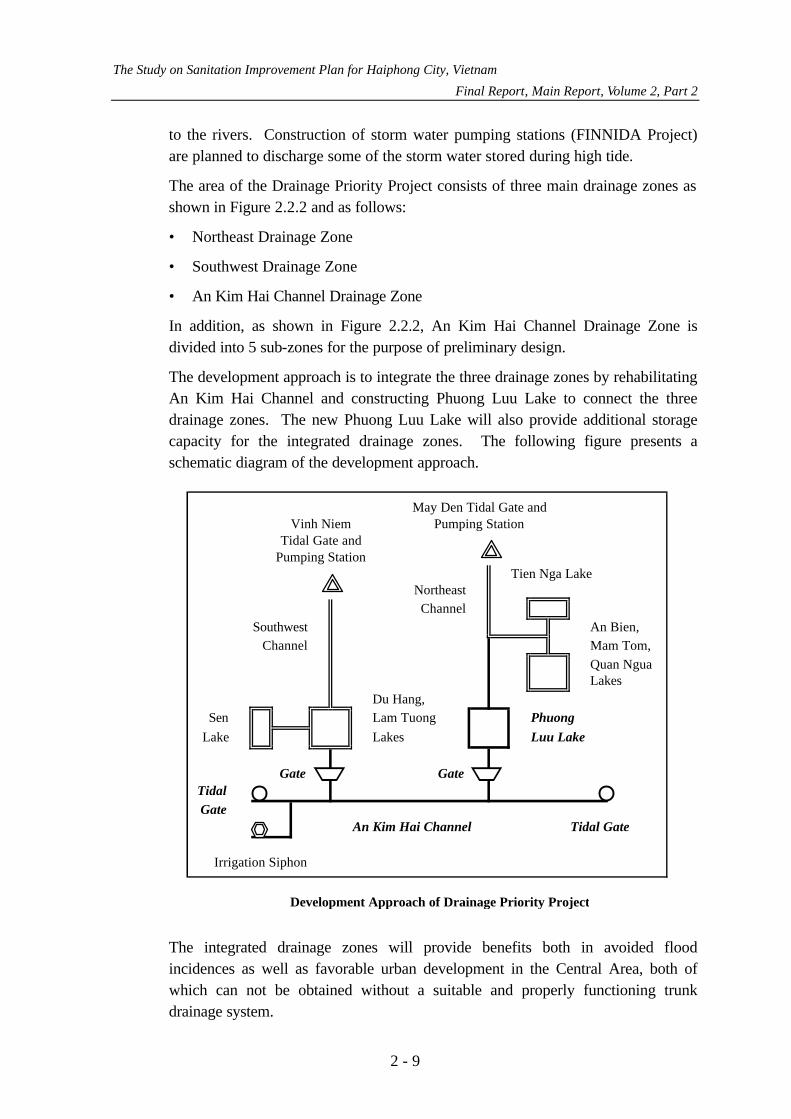
The Study on Sanitation Improvement Plan for Haiphong City, Vietnam
Final Report, Main Report, Volume 2, Part 2
2 - 9
to the rivers. Construction of storm water pumping stations (FINNIDA Project) are planned to discharge some of the storm water stored during high tide.
The area of the Drainage Priority Project consists of three main drainage zones as shown in Figure 2.2.2 and as follows:
• Northeast Drainage Zone
• Southwest Drainage Zone
• An Kim Hai Channel Drainage Zone
In addition, as shown in Figure 2.2.2, An Kim Hai Channel Drainage Zone is divided into 5 sub-zones for the purpose of preliminary design.
The development approach is to integrate the three drainage zones by rehabilitating An Kim Hai Channel and constructing Phuong Luu Lake to connect the three drainage zones. The new Phuong Luu Lake will also provide additional storage capacity for the integrated drainage zones. The following figure presents a schematic diagram of the development approach.
The integrated drainage zones will provide benefits both in avoided flood incidences as well as favorable urban development in the Central Area, both of which can not be obtained without a suitable and properly functioning trunk drainage system.
May Den Tidal Gate andVinh Niem Pumping Station
Tidal Gate andPumping Station
Tien Nga LakeNortheast
ChannelSouthwest An Bien,
Channel Mam Tom,Quan NguaLakes
Du Hang,Sen Lam Tuong Phuong
Lake Lakes Luu Lake
Gate GateTidalGate
An Kim Hai Channel Tidal Gate
Irrigation Siphon
Development Approach of Drainage Priority Project

The Study on Sanitation Improvement Plan for Haiphong City, Vietnam
Final Report, Main Report, Volume 2, Part 2
2 - 10
2.1.3 Planning Criteria
Development of the drainage system in the Central Area is based on the planning criteria in the Drainage Improvement Master Plan. The target drainage level is a storm with a frequency of 5 year ARI for Grade A facilities (channels and lakes) and 2 year ARI for Grade B facilities (main and branch sewers), and high tide conditions at the river discharge outlets with a frequency of 10 year ARI.
2.1.4 Inclusion of Areas in New Urban Area in Priority Project
As shown in Figure 2.1.1 and Figure 2.2.2, there are parts of the areas of the An Kim Hai Channel Draiage Zone which are located in the New Urban Area. These areas are outside the Central Area, which is the target planning area for Phase I implementation of the Drainage Improvement Master Plan.
It is necessary to include these areas of the New Urban Area for planning and design of the main components of the Priority Project. These areas will contribute rainfall runoff into the drainage system to be developed. The runoff will discharge into the system through connecting ditches and channels in these areas.
However, for the Year 2010 the projected degree of land and economic development for these areas in the New Urban Area is not great enough to justify inclusion of these areas into the target planning area.
Though drainage improvements will occur in these areas of the New Urban Area after implementation of Phase I, the positive impacts will be an indirect benefit which will not be fully realized until implementation of Phase II.
2.2 Compatibility with Other Projects
Given conditions are adopted for development of the Priority Project. These given conditions consist of the existing drainage system in the Priority Project area and implementation of the World Bank and FINNIDA Projects.
2.2.1 Compatibility with World Bank Sanitation Project
(1) Rehabilitation of Combined Sewers
A major component of the World Bank Project is comprehensive rehabilitation of the existing combined sewer network, comprising cleaning, inspection and possible repair or replacement of existing sewers. The project allows the possibility of rehabilitating about 50 % of the existing sewer lengths. This amount anticipates the rehabilitation needs of the combined sewer network and is based on estimates of the present structural conditions of the sewers.

The Study on Sanitation Improvement Plan for Haiphong City, Vietnam
Final Report, Main Report, Volume 2, Part 2
2 - 11
Rehabilitation of the combined sewer network includes provision for possible replacement of combined sewers by either (1) sewers of the same size for sewers in very poor structural condition, or (2) sewers of a larger size, where repair of the sewer is not considered cost effective because the hydraulic capacity of the existing sewer can be increased to provide more effective performance.
Estimates for the rehabilitation needs of the World Bank Project is considered as appropriate. Consequently, the Priority Project does not include provision for additional repair or replacement of sewers which are to be cleaned and inspected within the World Bank Project.
However, the World Bank Project does not include cleaning and inspecting of sewers for some areas of the Priority Project area as follows:
• Tertiary sewers are not included in the project for Lam Son, An Duong and Niem Nghia Phuongs in Le Chan District and May Chai Phuong in Ngo Quyen District
• Neither main, lateral nor tertiary sewers are included in the project for Dong Khe and Dang Giang Phuongs in Ngo Quyen District and Du Hang Kenh Commune in An Hai District
Nonetheless, the World Bank Project provides procurement of sewer cleaning and inspection equipment to SADCO. In this case SADCO will have the capability, especially with the experience gained from the World Bank Project, to clean and inspect the main, branch and tertiary sewers not included in the World Bank Project. Therefore, this task is not included in the Priority Project.
The amount of sewers which SADCO would need to clean and inspect in these areas is small, estimated as about 12 km. Consequently, based on the estimations from the World Bank Project, the amount of sewers needing possible repairs would be small. Any repairs can then be financed through the present budget of SADCO.
However, for sewers needing possible replacement because of poor condition or inadequate hydraulic capacity, the Priority Project includes the construction of new sewers to replace these sewers as a supplementary component.
(2) Construction of New Combined Sewers
The World Bank Sanitation Project includes construction of new combined sewers in both the Old City Center and the Central Area. The construction of the new sewers is needed to replace existing sewers which have inadequate hydraulic capacity and which are needed to reduce flooding in prioritized flooding areas.
Also, construction of new sewers is included in the sewer rehabilitation component, when after inspection, it is determined that repair of the sewer is not cost effective,
The Study on Sanitation Improvement Plan for Haiphong City, Vietnam
Final Report, Main Report, Volume 2, Part 2
2 - 12
because the hydraulic capacity of the existing sewer can be increased to provide more effective performance.
For the Old City Center, the design criteria is a storm with a 2 year ARI for a maximum tide level of +2.5 m (the north Vietnam Datum). Because the Priority Project is focused on the Central Area, the two projects are compatible.
For the Central Area the design criteria is a storm with a 2 year ARI for a maximum water level of +2.2 m in the lake and channel systems. This approach is consistent with the Priority Project, and the two projects are compatible.
At present the amount of existing combined sewers is considered to be too small in some of the areas in the Priority Project area. These areas comprise the following:
• Dong Khe Phuong in Ngo Quyen District
• Du Hang Kenh Commune in An Hai District
Based on urban development plans of Haiphong City, new roads are planned for construction in these areas: Sen Road in Du Hang Kenh Commune and Cat Bi Road in Dong Khe Phuong. Locating new main combined sewers at these new roads would provide much more cost effective drainage than attempting to plan and construct new sewers based on the existing conditions.
It is expected that the budget of the roads project would include construction of new main sewers for the roads. Therefore, the Priority Project does not include provision of new main sewers for these roads
However, the Priority Project includes provision for branch sewers as a supplementary component. These branch sewers would then connect to the new main sewers of the new roads construction project. This approach avoids potential problems with coordination between these two very different projects.
(3) Rehabilitation of Channels and Lakes
The World Bank Sanitation Project includes rehabilitation of the Northeast and Southwest Channels and four lakes in the Central Area. The rehabilitation is needed to increase the hydraulic and storage capacities of these drainage systems.
The channels and lakes were designed for storms with a frequency of 10 year ARI for rising and falling tide conditions without the use of pumping stations.
For the Priority Project these channels and lakes are integrated, and the integrated system is designed to achieve the drainage target levels. In addition, the design of the integrated system is also checked to ensure that the design criteria of the World Bank Project is also satisfied. Consequently, the two projects are compatible.

The Study on Sanitation Improvement Plan for Haiphong City, Vietnam
Final Report, Main Report, Volume 2, Part 2
2 - 13
2.2.2 Compatibility with FINNIDA Projects
The FINNIDA Haiphong Stormwater Pumping Stations Project consists of constructing pumping stations at May Den and Vinh Niem Tidal Gates. Total capacity of each pumping station is 9 m3/s.
Though the design capacities of the pumping stations were selected without considering any addition storm water discharges which may occur from the An Kim Hai Channel Drainage Zone into the existing storage lakes, this additional storm water load would be compensated by the additional storage capacity provided by Phuong Luu Lake.
For the Priority Project, the integrated system is designed to achieve the drainage target levels. In addition, the design of the integrated system is also checked to ensure that the design criteria of both the World Bank Project and FINNIDA Project are also satisfied. Consequently, all three projects are compatible.
2.3 Main Project Components
Rehabilitation of An Kim Hai Channel consists of the following:
• Excavation and embankment works of existing channel
• Construction of maintenance roads along both sides of the channel
• Demolition of one existing tidal gate at river outlet
• Construction of two tidal gates at river outlets
• Construction of discharge gate at lake outlet
Construction of Phuong Luu Lake consists of the following:
• Excavation and embankment works of new lake
• Construction of roads and margins along the sides of the lakes
• Construction of connecting channel to Northeast Channel
• Construction of road connecting the lake site area to Highway No. 5
• Construction of closed conduit to An Kim Hai Channel and discharge gates
2.4 Planning and Design Methodology
2.4.1 Computer Modeling of Drainage System
Planning and design of the Drainage Priority Project is based on computer modeling of the drainage system by using the computer program MOUSE 2000 developed by the Danish Hydraulic Institute. Development of the computer model is presented in the flowchart in Figure 2.2.3. The layout of the computer model

The Study on Sanitation Improvement Plan for Haiphong City, Vietnam
Final Report, Main Report, Volume 2, Part 2
2 - 14
with a background map of the Priority Project area is presented in Figure 2.2.4. The layout of the computer model with node labels for An Kim Hai Channel are presented in Figure 2.2.5.
(1) Hydrological Modeling
Hydrological modeling was achieved by using a time/area method. Routing of the rain water in the runoff model, reduced by a constant hydrological amount, is determined by the catchment shape and by time of concentration. Rectangular catchment areas were selected for developing the model.
(2) Hydrodynamic Modeling
Hydrodynamic modeling was based on computations using the complete St. Venant (dynamic flow) equations. The method allows for time variable hydrodynamic modeling which includes backwater effects, flow reversal, surcharging in manholes, free-surface and pressure flow, tidal outfalls, storage basins, open channels, and pumping stations.
2.4.2 Computer Simulation and Performance Analysis
(1) Hydrological Design Conditions
Hydrological design conditions are based on rainfall intensity, duration and frequency data obtained from the Phu Lien Meteorological Station near Haiphong.
The applied hydrological data is presented in Figure 2.2.6. The figure also includes numerical data for rainfall intensities and durations for storms with average recurrence intervals (ARI) of 5 years and 10 years.
Design storm hyetographs are developed using rainfall data for storms with 5 year ARI and 10 year ARI and a total rainfall duration of 12 hours.
The hyetographs are developed using a "Balanced Storm Approach". In this method the storm depth at any duration of the storm is equal to the depth from the Intensity-Duration-Frequency (IDF) curves.
(2) Hydrographic Design Conditions
Hydrographic design conditions are based on tide level data measured at the Cam River near Haiphong.
Representative data of tide levels is presented in Figure 2.2.7. The figure includes numerical data for high tide levels and tide durations with a 10 year ARI.
Design tide levels are developed using data for tide levels with a 10 year ARI. Based on this data the maximum water level is +4.1 m and the minimum water

The Study on Sanitation Improvement Plan for Haiphong City, Vietnam
Final Report, Main Report, Volume 2, Part 2
2 - 15
level is +1.0 m. The complete tide cycle is 24 hours. The duration of water levels above +2.5 m is approximately 12 hours.
(3) System Performance Analysis
Computer simulations of the drainage system are done to check the following design conditions:
• 5 year ARI storm during 10 year ARI high tide conditions
In addition, computer simulations of the drainage system are done to assess the following conditions to ensure compatibility with the World Bank Project:
• 10 year ARI storm during 10 year ARI rising tide conditions
• 10 year ARI storm during 10 year ARI falling tide conditions
The three design conditions are presented in Figures 2.2.8, 2.2.9 and 2.2.10. For the storm with 5 year ARI, the moment of greatest rainfall was set to occur when the tide level is +4.1 m. For the storms with 10 year ARI, the moment of greatest rainfall was set to occur when the tide level was +2.2 m.
In the simulations the pumps at the May Den and Vinh Niem Pumping Stations are operated when the water levels at the stations exceed +1.8 m and stopped when the water levels fall below +1.5 m. From +1.8 m to +2.0 m, only one pump (3 m3/s) is used. From +2.0 m and higher, all three pumps (9 m3/s) are used.
2.5 Methodology for Assessing Flood Reductions
2.5.1 Basic Approach
The methodology for assessing the flood reductions in the Priority Project Area after implementation of the Priority Project is based on the following:
• Use of existing flood data from previous studies and projects
• Computer simulation of flooding for the present conditions of An Kim Hai Channel using the developed computer model
Figure 2.2.11 presents the adopted methodology. The methodology consists of the following approach and assumptions:
• Data from the World Bank Project for the present flooding conditions is verified by reviewing the flood data from SADCO
• Quantitative data from the World Bank Project provides the basis for determining the incremental reductions in flooding for all three projects
• Quantitative data from the World Bank Project for the reductions in flooding after implementation of the project is a given condition

The Study on Sanitation Improvement Plan for Haiphong City, Vietnam
Final Report, Main Report, Volume 2, Part 2
2 - 16
• Quantitative data from the FINNIDA Project for the reductions in flooding after implementation of the project is a given condition
• Computer simulation of flooding for the present conditions of An Kim Hai Channel is used to provide quantitative data for the reductions in flooding after implementation of the Priority Project
• Quantitative data from the computer simulations are compared with the quantitative data from the World Bank and FINNIDA Projects to assess and verify the consistency of the data
• After verification of the data, delineation of the flood reductions for the Priority Project and for the other areas is achieved for each project
2.5.2 Use of Risk Factors
Quantitative data on the degree of flooding is based on the following conditions:
• Actual degree of flooding which occurs for a storm and tide conditions
• Expected annual degree of flooding
The actual degree of flooding is based on storm with a rainfall magnitude which is based on the frequency of the storm. In addition, the actual degree of flooding is based on whether the storm occurs during low or high tide conditions.
The expected annual degree of flooding represents a annual amount of flooding which is expected to occur during a significantly long period of time, for example, 20 years, and which represents a yearly average. Although this approach is not based on a physical basis, it does provide a common benchmark for assessing the degree of flood reductions for projects implemented to reduce flooding.
Risk factors are used for determining the expected annual degree of flooding. There are two types of risk factors:
• Risk factor of a storm occurring
• Risk factor of high tide occurring
The two risk factors are independent of each other and can be multiplied to provide a joint risk factor.
For the frequencies of storms and associated rainfall magnitudes, the following risk factors are used:
• 0.5 year ARI: risk factor = 100 %
• 0.25 year ARI: risk factor = 100 %
• 1 year ARI: risk factor = 100 %
• 2 year ARI: risk factor = 50 %

The Study on Sanitation Improvement Plan for Haiphong City, Vietnam
Final Report, Main Report, Volume 2, Part 2
2 - 17
• 5 year ARI: risk factor = 20 %
High tide conditions are defined as the risk of a storm with a four duration occurring when the tide level is +2.5 m or greater for the entire duration of the four hour storm. Based on information from the World Bank and FINNIDA Projects, this risk factor is 25 %.
For storms with a 1 year ARI or less, the probabilities that these storms would occur during a 1 year period is 100 %. However, for storms with a 0.25 year ARI and 0.5 ARI, the joint risk factor is multiplied by 4 and 2, respectively. The basis for this approach is that for a storm with 0.25 year ARI, there would then be storms of this magnitude four times during any one year period. Because the risk factor of high tide is 25 %, there is then a yearly 100 % probability that high tide would occur during one of the four storms.
The following example is presented to illustrate these principles. A storm occurs with a frequency of 5 year ARI during low tide conditions, and the area of flooding is 100 ha. The expected annual degree of flooding from this storm is then 20 % of this value or 20 ha. This result means that during any five year period, the area of flooding associated with this storm is a yearly average of 20 ha.
If a storm with a frequency of 5 year ARI would occur during high tide conditions, and the area of flooding is 200 ha, the expected annual degree of flooding is then 20 % times 25 %, which is 5 %, therefore 10 ha. This result means that during any twenty year period, four storms with frequencies of 5 year ARI would occur, and one of these storms would occur during high tide conditions. The area of flooding associated with these conditions during the twenty year period is a yearly average of 10 ha.
2.5.3 Present Flooding Conditions
(1) Sources of Quantitative Data
Quantitative data on the present flooding conditions in Class A Areas have been collected from the following sources:
• Summary Report of the Study of Flood Investigations, SADCO, April 2000
• Vietnam: Sanitation Project, Haiphong Component, Preliminary Design Report, May 1999
The flooding data in three sources consist of quantitative estimates for annual flood areas, flood depths, and flood durations for storms of different frequencies and rainfall area of different intensities and durations.
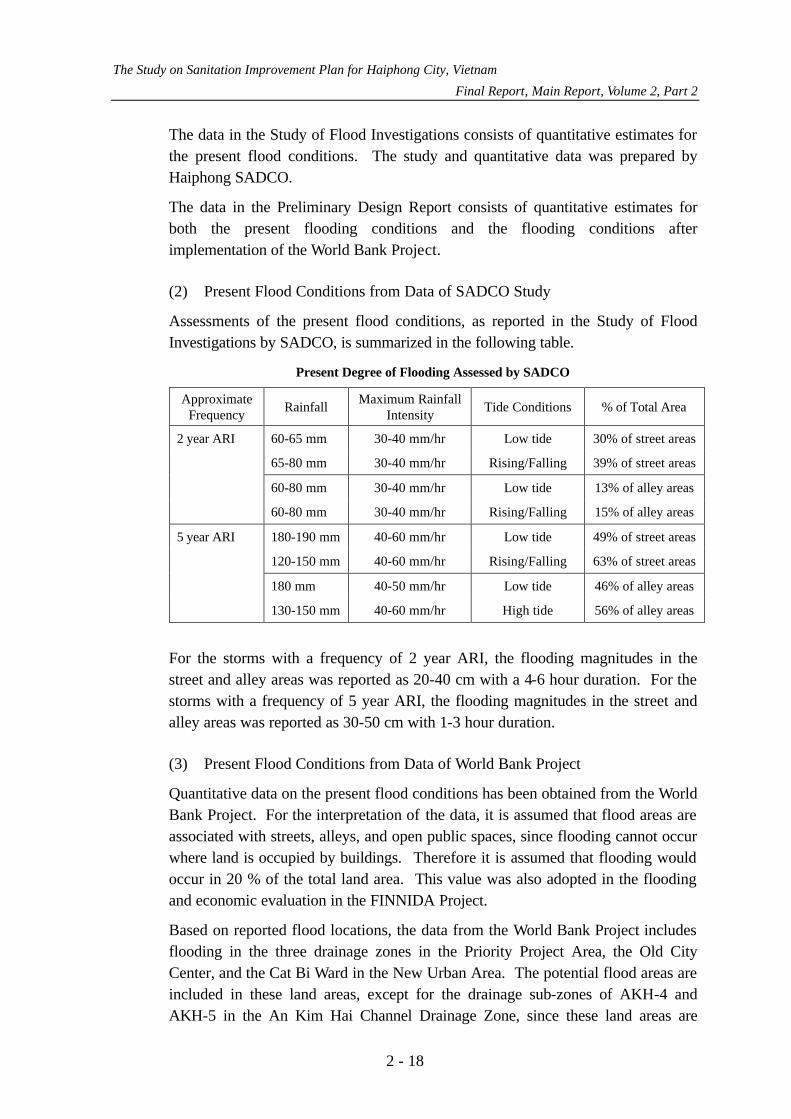
The Study on Sanitation Improvement Plan for Haiphong City, Vietnam
Final Report, Main Report, Volume 2, Part 2
2 - 18
The data in the Study of Flood Investigations consists of quantitative estimates for the present flood conditions. The study and quantitative data was prepared by Haiphong SADCO.
The data in the Preliminary Design Report consists of quantitative estimates for both the present flooding conditions and the flooding conditions after implementation of the World Bank Project.
(2) Present Flood Conditions from Data of SADCO Study
Assessments of the present flood conditions, as reported in the Study of Flood Investigations by SADCO, is summarized in the following table.
Present Degree of Flooding Assessed by SADCO
Approximate Frequency Rainfall Maximum Rainfall
Intensity Tide Conditions % of Total Area
2 year ARI 60-65 mm 30-40 mm/hr Low tide 30% of street areas
65-80 mm 30-40 mm/hr Rising/Falling 39% of street areas
60-80 mm 30-40 mm/hr Low tide 13% of alley areas
60-80 mm 30-40 mm/hr Rising/Falling 15% of alley areas
5 year ARI 180-190 mm 40-60 mm/hr Low tide 49% of street areas
120-150 mm 40-60 mm/hr Rising/Falling 63% of street areas
180 mm 40-50 mm/hr Low tide 46% of alley areas
130-150 mm 40-60 mm/hr High tide 56% of alley areas
For the storms with a frequency of 2 year ARI, the flooding magnitudes in the street and alley areas was reported as 20-40 cm with a 4-6 hour duration. For the storms with a frequency of 5 year ARI, the flooding magnitudes in the street and alley areas was reported as 30-50 cm with 1-3 hour duration.
(3) Present Flood Conditions from Data of World Bank Project
Quantitative data on the present flood conditions has been obtained from the World Bank Project. For the interpretation of the data, it is assumed that flood areas are associated with streets, alleys, and open public spaces, since flooding cannot occur where land is occupied by buildings. Therefore it is assumed that flooding would occur in 20 % of the total land area. This value was also adopted in the flooding and economic evaluation in the FINNIDA Project.
Based on reported flood locations, the data from the World Bank Project includes flooding in the three drainage zones in the Priority Project Area, the Old City Center, and the Cat Bi Ward in the New Urban Area. The potential flood areas are included in these land areas, except for the drainage sub-zones of AKH-4 and AKH-5 in the An Kim Hai Channel Drainage Zone, since these land areas are

The Study on Sanitation Improvement Plan for Haiphong City, Vietnam
Final Report, Main Report, Volume 2, Part 2
2 - 19
mostly undeveloped. The total land area is then 2,340 ha and the potential flood area is 20 % of this value, or about 470 ha.
Based on this approach, the following table assesses the interpreted data from the World Bank Project.
Present Degree of Flooding in Priority Project Area, Old City Center and Cat Bi Ward
Frequency Potential Flood Area Reported Flood Area % of Potential Area
0.25 years 470 ha 140 ha 29.7%
0.5 years 470 ha 180 ha 38.3%
1 year 470 ha 250 ha 53.2%
2 year 470 ha 280 ha 59.6%
5 year 470 ha 320 ha 68.1%
The data for the flood areas in the World Bank Project includes flood areas where the flood magnitudes are 10-30 cm. These magnitudes are less than the flood magnitudes reported by the SADCO. However, the interpreted data of the World Bank is considered as consistent with the assessments of SADCO, and is used in the flood reductions assessment.
2.5.4 Assessed Flood Reductions from World Bank Project
Quantitative data on the assessed flood reductions after implementation of the World Bank Project has been obtained from the World Bank Project. The quantitative data is interpreted and assessed using the same approach as for the quantitative data on the present flooding conditions.
Figure 2.2.12 presents the interpreted data for the reductions in flooding after implementation of the World Bank Project. For a storm with a frequency of 2 year ARI, about 98 ha of flooding would still occur. Based on a 25 % risk that this expected annual flooding would occur during high tide conditions, the actual flood areas would then be 392 ha, or 83.4 % of the potential flood areas. This figure appears reasonable when considering the following:
• Sewers in the Old City Center are designed for a storm with a 2 year ARI, but for a maximum water level of +2.5 m, where the high tide level is +4.1 m
• No storm water pumping stations exist in the Central Area
• An Kim Hai Drainage Zone does not include any storage lakes
For a storm with a frequency of 5 year ARI, when using the risk factor, the actual flood areas would be 600 ha, which is greater than 470 ha, which represents the potential flood areas. This figure suggests that flood areas in the An Kim Hai Drainage Zone are associated with overflow of the channel, where the potential

The Study on Sanitation Improvement Plan for Haiphong City, Vietnam
Final Report, Main Report, Volume 2, Part 2
2 - 20
flood area would extend over a greater land area than streets, alleys, and open public spaces.
2.5.5 Assessed Flood Reductions from FINNIDA Project
Quantitative flood data for flood reductions from implementation of the FINNIDA Project has been collected from the Haiphong Stormwater Pumping Stations Project, Feasibility Study, April 2000. The data consists of quantitative estimates for the flooding conditions during high tide after implementation of the World Bank Project and the flooding conditions during high tide after implementation of the World Bank Sanitation Project and the FINNIDA Project.
In the World Bank Project the Northeast and Southwest Channels were designed for a storm with a 10 year ARI during falling tide conditions. Consequently, the degree of flooding in the Central Area is expected to decrease significantly for storms with frequencies of 5 year ARI or less. However, the risk of flooding remains for storms which would occur during high tide conditions.
The FINNIDA Project was developed to construct pumping stations for these two channels in the Central Area. An assessment of flood reductions after project implementation, and including implementation of the World Bank Project, was provided in the project documentation. The approach for the assessment was based on quantitative data, which was verified by results of computer simulations of flooding in the Central Area.
The quantitative data consisted of flood areas during high tide conditions with and without the project for storms of different frequency. The assessed flood areas were then multiplied by the risk factor of 25 % to determine the expected flood areas which would occur for storms of different frequency.
The quantitative data on the assessed flood reductions, based on data from the FINNIDA Project, is presented in Figure 2.2.13. As shown in the figure, the actual flood areas are significant, even after project implementation, if high tide would occur during the duration of the storm. The data is also consistent with the assessments from the World Bank Project.
2.5.6 Present Flood Areas in the An Kim Hai Channel Drainage Zone
Assessment of flood reductions from implementation of the Drainage Priority Project is based on assessing and estimating the present amount of flood areas which can be attributed to the present inadequate hydraulic capacity of An Kim Hai Channel without any connections to existing storage lakes.

The Study on Sanitation Improvement Plan for Haiphong City, Vietnam
Final Report, Main Report, Volume 2, Part 2
2 - 21
The assessment of the flood areas is based on computer simulation of the hydraulic performance of An Kim Hai Channel for its present conditions, with one discharge location at the Cam River.
The basis of the computer simulations comprise the following:
• Utilization and modification of computer model developed for technical design of An Kim Hai Channel
• Use of channel survey data from Field Study No. 1 and Field Study No. 2
• Use of hydrological data based on present catchment area characteristics in An Kim Hai Channel Drainage Zone
• Use of rainfall data for storms with frequencies of 2 year ARI, 5 year ARI and 10 Year ARI and twelve hour rainfall duration
• Use of data for high tide levels with frequency of 10 year ARI for falling tide conditions
Simulation of flooding was achieved by using modeled weirs and artificial basins in the modified model. Weirs were located at each inlet node. The weir level at each inlet node was set to the same level as the ground level of the inlet node. When the hydraulic grade exceeds the level of the weir, water is then routed to an artificial basin associated with each weir. When the hydraulic grade is less than the level of the weir, water is then routed from the storage basis back to the inlet node.
For the model runoff coefficients are based on the amounts of developed and undeveloped land in the catchment areas, using the criteria presented in the following table.
Criteria for Calculating Composite Design Runoff Coefficients
Runoff Coefficient Degree of Land Development Developed Land Undeveloped Land
90% - 100% 0.60 0.30
80% - 90% 0.55 0.25
70% - 80% 0.50 0.20
50% - 70% 0.45 0.15
30% - 50% 0.40 0.10
10% - 30% 0.30 0.05
Based on this criteria, composite runoff coefficients are calculated using the following formula.
( )∑
∑−
−−=AREASUB
AREASUBAREASUBCOMPOSITE AREA
AREACC
*
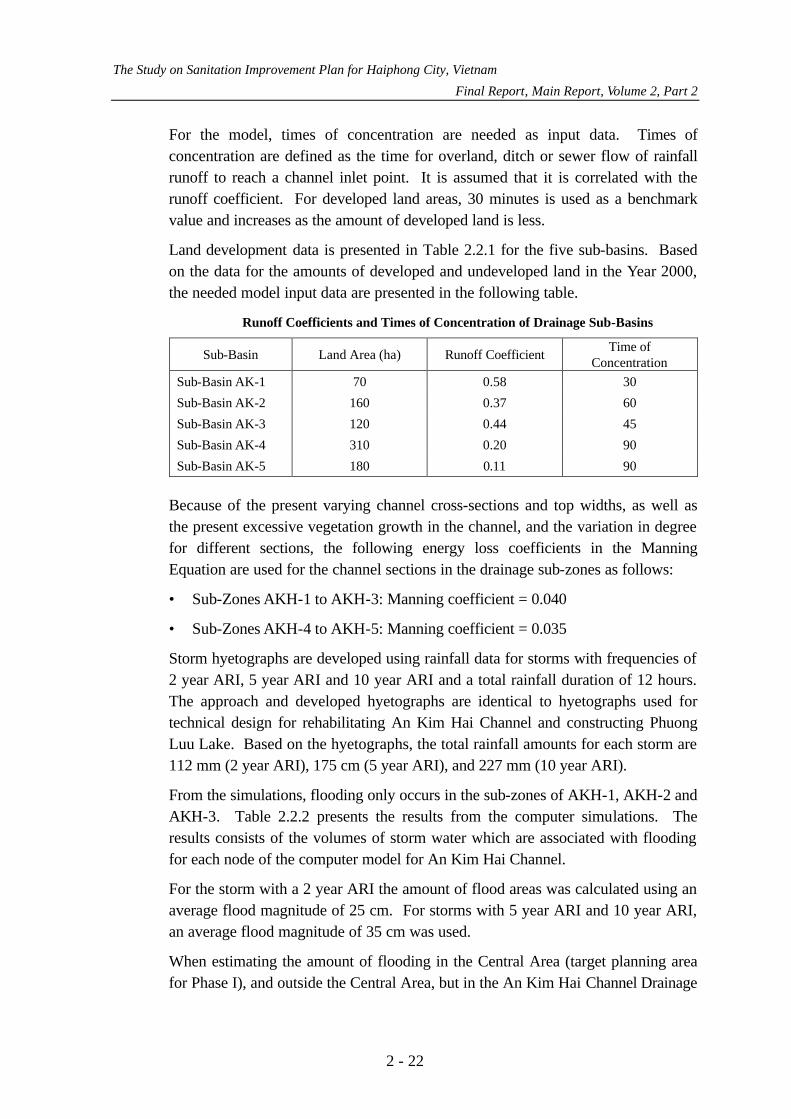
The Study on Sanitation Improvement Plan for Haiphong City, Vietnam
Final Report, Main Report, Volume 2, Part 2
2 - 22
For the model, times of concentration are needed as input data. Times of concentration are defined as the time for overland, ditch or sewer flow of rainfall runoff to reach a channel inlet point. It is assumed that it is correlated with the runoff coefficient. For developed land areas, 30 minutes is used as a benchmark value and increases as the amount of developed land is less.
Land development data is presented in Table 2.2.1 for the five sub-basins. Based on the data for the amounts of developed and undeveloped land in the Year 2000, the needed model input data are presented in the following table.
Runoff Coefficients and Times of Concentration of Drainage Sub-Basins
Sub-Basin Land Area (ha) Runoff Coefficient Time of Concentration
Sub-Basin AK-1 70 0.58 30
Sub-Basin AK-2 160 0.37 60
Sub-Basin AK-3 120 0.44 45
Sub-Basin AK-4 310 0.20 90
Sub-Basin AK-5 180 0.11 90
Because of the present varying channel cross-sections and top widths, as well as the present excessive vegetation growth in the channel, and the variation in degree for different sections, the following energy loss coefficients in the Manning Equation are used for the channel sections in the drainage sub-zones as follows:
• Sub-Zones AKH-1 to AKH-3: Manning coefficient = 0.040
• Sub-Zones AKH-4 to AKH-5: Manning coefficient = 0.035
Storm hyetographs are developed using rainfall data for storms with frequencies of 2 year ARI, 5 year ARI and 10 year ARI and a total rainfall duration of 12 hours. The approach and developed hyetographs are identical to hyetographs used for technical design for rehabilitating An Kim Hai Channel and constructing Phuong Luu Lake. Based on the hyetographs, the total rainfall amounts for each storm are 112 mm (2 year ARI), 175 cm (5 year ARI), and 227 mm (10 year ARI).
From the simulations, flooding only occurs in the sub-zones of AKH-1, AKH-2 and AKH-3. Table 2.2.2 presents the results from the computer simulations. The results consists of the volumes of storm water which are associated with flooding for each node of the computer model for An Kim Hai Channel.
For the storm with a 2 year ARI the amount of flood areas was calculated using an average flood magnitude of 25 cm. For storms with 5 year ARI and 10 year ARI, an average flood magnitude of 35 cm was used.
When estimating the amount of flooding in the Central Area (target planning area for Phase I), and outside the Central Area, but in the An Kim Hai Channel Drainage
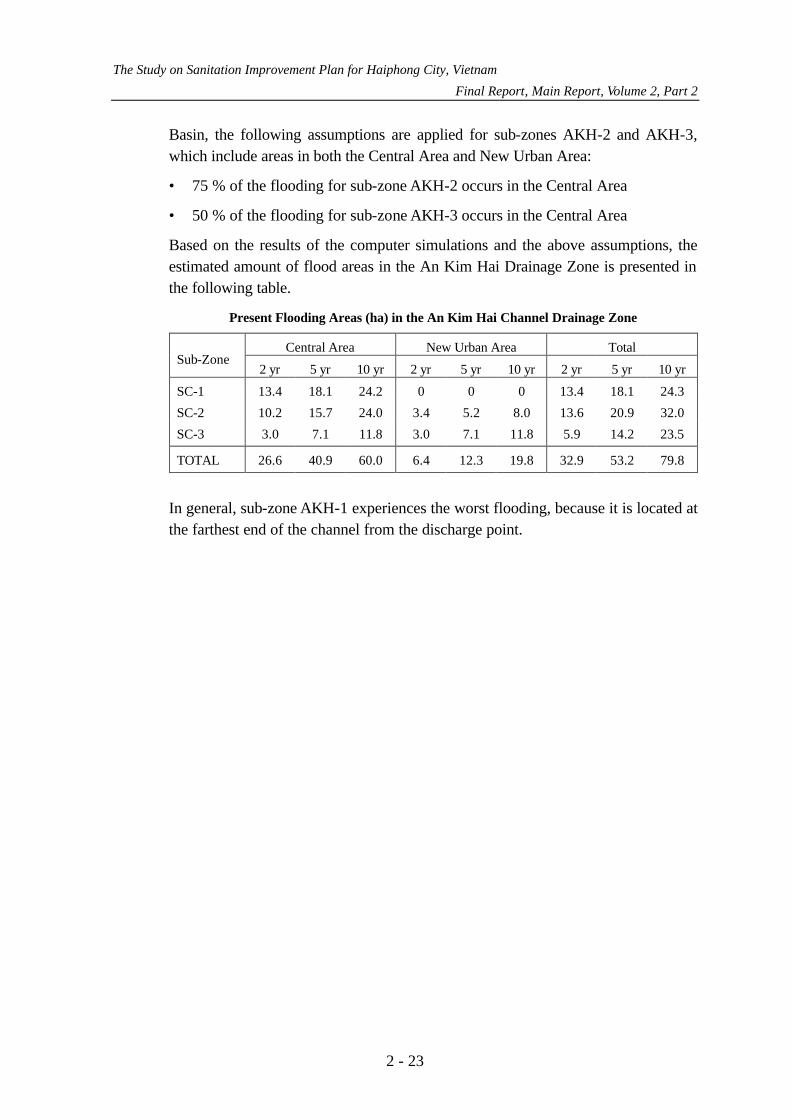
The Study on Sanitation Improvement Plan for Haiphong City, Vietnam
Final Report, Main Report, Volume 2, Part 2
2 - 23
Basin, the following assumptions are applied for sub-zones AKH-2 and AKH-3, which include areas in both the Central Area and New Urban Area:
• 75 % of the flooding for sub-zone AKH-2 occurs in the Central Area
• 50 % of the flooding for sub-zone AKH-3 occurs in the Central Area
Based on the results of the computer simulations and the above assumptions, the estimated amount of flood areas in the An Kim Hai Drainage Zone is presented in the following table.
Present Flooding Areas (ha) in the An Kim Hai Channel Drainage Zone
Central Area New Urban Area Total Sub-Zone
2 yr 5 yr 10 yr 2 yr 5 yr 10 yr 2 yr 5 yr 10 yr
SC-1 13.4 18.1 24.2 0 0 0 13.4 18.1 24.3
SC-2 10.2 15.7 24.0 3.4 5.2 8.0 13.6 20.9 32.0
SC-3 3.0 7.1 11.8 3.0 7.1 11.8 5.9 14.2 23.5
TOTAL 26.6 40.9 60.0 6.4 12.3 19.8 32.9 53.2 79.8
In general, sub-zone AKH-1 experiences the worst flooding, because it is located at the farthest end of the channel from the discharge point.

The Study on Sanitation Improvement Plan for Haiphong City, Vietnam
Final Report, Main Report, Volume 2, Part 2
2 - 24
CHAPTER 3 REHABILITATION OF AN KIM HAI CHANNEL
3.1 Planning Issues and Design Criteria
3.1.1 Planning Issues
An Kim Hai Channel was originally developed for the purpose of irrigation. However, the channel also functions for drainage. Storm water sewers for Highway No. 5 discharge into the channel as well as drainage ditches and other channels connected to the channel.
The present channel top widths and cross-sections vary considerably along the entire length of the channel. The present hydraulic layout of the channel is not defined, and system performance is very poor.
Maintenance roads do not exist along the channel banks preventing effective maintenance of the channel. Sludge has accumulated on the bottoms of the channel, requiring dredging. Encroachment of illegal housing has occurred along the channel banks preventing maintenance as well as reducing the hydraulic capacity of the channel.
The existing channel side-slopes are not protected. Vegetation growth is prevalent in the channel, increasing the flow resistance in the channel. The present hydraulic capacity is very insufficient.
Consequently, the main planning issues for rehabilitation of An Kim Hai Channel comprise the following:
• Primary and secondary functions of the channel
• Hydraulic layout of the channel
• Maintenance roads and margins
• Channel cross-sections
Alternatives for each planning issue are identified, and the optimum alternative is selected for design.
3.1.2 Design Criteria
The purpose of rehabilitating An Kim Hai Channel is to provide sufficient hydraulic capacity in the channel to achieve the following:
• Prevent flooding of sewers discharging into the channel
• Prevent flooding of the lakes discharging into the channel during low tide conditions when the tidal gates are opened

The Study on Sanitation Improvement Plan for Haiphong City, Vietnam
Final Report, Main Report, Volume 2, Part 2
2 - 25
• Prevent flooding of the channel when water is being discharged from the channel to the lakes during high tide conditions and to the rivers during low tide conditions
The hydraulic capacity of the rehabilitated channel is considered as sufficient, if the maximum water levels are lower than 0.5 m from the design levels of the channel banks for the design storms and tide conditions.
Achievement of the design criteria is determined by calculating the maximum water levels for the three design conditions. The calculations are done using the developed computer model.
3.2 Alternative Study
3.2.1 Primary and Secondary Functions of Channel
(1) Alternative Approaches
At present An Kim Hai Channel can function for both the purpose of irrigation and also for drainage. There are then four alternative approaches associated with the future function of An Kim Hai Channel:
• IR-1: Channel used only for irrigation
• IR-2: Channel used only for drainage
• IR-3: Primary function for irrigation and secondary function for drainage
• IR-4: Primary function for drainage and secondary function for irrigation
IR-1 is not a viable alternative, because the channel already is used for drainage, most notably for urban areas immediately adjacent to the channel and also for Highway No. 5 with locations parallel to the channel.
Furthermore, the channel represents an existing trunk drainage corridor in the part of the city in which it is located. This part of the city is expected to further urbanize in the immediate future. No viable drainage system can be developed for this area without a functioning drainage channel in this part of the city.
IR-2 can be considered as an appropriate alternative. However, the dual use also for irrigation would require the construction and use of gates at drainage discharge points. Investment costs for these measures are not great. Economic benefits from irrigation are expected to be greater than these investment costs. Consequently, dual use for irrigation is considered as more beneficial and viable than singular use only for drainage.
IR-3 is not a viable alternative, because the necessary hydraulic capacity for drainage is greater than the needed hydraulic capacity for irrigation.
The Study on Sanitation Improvement Plan for Haiphong City, Vietnam
Final Report, Main Report, Volume 2, Part 2
2 - 26
(2) Selected Approach
Alternative IR-4 is selected because the channel is needed for drainage in the part of the city in which it is located. However, the channel can also be used for irrigation, providing additional economic benefits. Selection of the primary function of the channel for drainage is based on the needed hydraulic capacity.
3.2.2 Hydraulic Layout of Channel
(1) Alternative Approaches
The hydraulic layout of the channel depends on the amounts and locations of storm water discharges into the channel as well as the number and locations of discharge outlets of the channel to receiving lakes and rivers.
At present there exists only one discharge outlet of the channel, which is located at the east end of the channel at the Cam River. However, possibilities exist to construct new discharge outlets at other river locations as well as at storage lakes in the drainage basin of the channel.
There then exists five alternatives for defining the hydraulic layout of the rehabilitated channel:
• HL-1: Discharge at one outlet to a river
• HL-2: Discharge at one outlet to a storage lake
• HL-3: Discharge at multiple outlets to the nearest rivers
• HL-4: Discharge at multiple outlets to the nearest storage lakes
• HL-5: Discharge at multiple outlets to the nearest rivers and storage lakes
HL-1 and HL-2 would require channels with greater hydraulic capacity than the three remaining alternatives, and would therefore require more investment costs.
HL-3 is not a viable alternative, because tidal gates at the ends of the channel would need to be closed during high tide. The channel would then not be able to discharge storm water to a receiving water body during high tide, and flooding would then occur in the drainage zone.
HL-4 can be considered as an appropriate alternative. However, a discharge outlet to the Cam River already exists. Also, a discharge outlet to the Lach Tray River can be constructed without great costs. During low tide the channel can discharge directly to the receiving water bodies at these locations, thus bypassing discharge to storage lakes in the drainage basin.

The Study on Sanitation Improvement Plan for Haiphong City, Vietnam
Final Report, Main Report, Volume 2, Part 2
2 - 27
(2) Selected Approach
Alternative HL-5 is selected because it allows the channel to be constructed at minimal costs, because the needed hydraulic capacity is less than the other four alternatives. Also, the alternative allows the channel to be used for drainage during both high tide and low tide conditions.
3.2.3 Maintenance Roads and Margins
(1) Alternative Approaches
Maintenance roads and margins are needed along the channel banks for accessing the channel for maintenance and for preventing further encroachment on the channel. However, implementing maintenance roads and margins will result in resettlement of Project affected population.
There are two alternative approaches for locating maintenance roads and margins along the channel banks:
• MR-1: Maintenance road on one side of the channel
• MR-2: Maintenance roads on both sides of the channel
Illegal encroachment on the channel has occurred and is considered as a major problem which must be controlled. Construction of maintenance roads on both sides of the channel is the most effective measure to prevent encroachment on the channel on both sides.
Rehabilitation of the channel will require site clearing on the sides of the channel. This may require demolition of houses and other structures located along the sides of the channels. Without maintenance roads some households may be able to relocate and rebuild their houses at their previous sites. However, compensation to these households would still be needed and would be comparable to the compensation if the households would be required to relocate to a new area.
(2) Selected Approach
MR-2 is the selected alternative. Maintenance roads on both sides of the channels is the most effective measure to prevent illegal encroachment on the channel.
Furthermore, households located immediately along the sides of the channel would be affected by site clearing during the rehabilitation works of the channel, whether or not maintenance roads would be constructed.

The Study on Sanitation Improvement Plan for Haiphong City, Vietnam
Final Report, Main Report, Volume 2, Part 2
2 - 28
3.2.4 Channel Cross-Sections
(1) Alternative Approaches
Rehabilitation of the channel includes embankment works and dimensioning the channel cross-sections. The following alternative approaches can be considered:
• CH-1: Reformation of the banks with grass or sod slope protection. This alternative is most applicable when the existing hydraulic capacity is sufficient for discharging the design storms
• CH-2: Trapezoidal shapes with side-slope from 1:3 to 1:2 lined with grass or sod. This alternative is most applicable for suburban areas where land acquisition is not needed
• CH-3: Trapezoidal shape with side-slopes from 1:2 to 1:1 with slope lining of stone masonry revetment. This alternative is most applicable for urbanized areas where land acquisition is needed
• CH-4: Stone masonry retaining walls. This alternative is most applicable for urbanized areas where land acquisition is restricted
CH-1 and CH-2 are not viable alternatives, because the existing channel is located predominantly in urban areas. Also, slope lining with rubble masonry is considered as a more effective measure to prevent illegal encroachment along the sides of the channel than grass or sod lining.
CH-4 can be considered as an appropriate alternative. However, it represents the most expensive alternative, requiring the most excavation or filling of the channel. Also, land acquisition is needed for constructing the maintenance roads along the sides of the channel. Adoption of this alternative would not reduce the need for resettlement of project affected population.
(2) Selected Approach
CH-3 is the preferred approach, although CH-4 can also be considered, because these represent the most cost effective measures for rehabilitating the channel, which is located predominantly in urban areas, and for also preventing illegal encroachment along the sides of the channel.
3.3 Technical Design
3.3.1 Site and Soil Conditions
Total length of An Kim Hai Channel is about 10 km. The channel starts from Thuong Ly River close to An Duong Water Treatment Plant. Between An Duong Water Treatment Plant and Tran Ngyen Han Street the width of the channel varies

The Study on Sanitation Improvement Plan for Haiphong City, Vietnam
Final Report, Main Report, Volume 2, Part 2
2 - 29
between 6 m to more than 14 m. There is a narrow lane with a width of 2 m on one side of the channel.
From Tran Nguyen Han Street forward until the southern end of Du Hang Lake the channel is in an average only 5 m to 9 m wide and full of waste. There are small houses at the both sides but not any roads along the shore.
After Du Hang Lake the channel becomes wider (10 – 20 m) and is less polluted. There are also less houses along the channel. Along Highway No. 5 the channel is about 20 m wide. The surroundings are mainly rice fields until Hang Kenh Street.
Between Hang Kenh Street and An Da Street the width varies mainly from 10 m to 15 m. There are some houses on both sides of the channel and in places a narrow land with a width of 2.0 m along the shore. The rest of the channel up to Cam River is about 20 m or more wide. The surroundings are mostly rice fields. There is also a margin of 3 – 4 m wide on both sides of the channel.
The soil conditions along An Kim Hai Channel have not been investigated in this study. Nonetheless, the soil conditions along Du Hang Lake have been estimated on the basis of old boreholes from previous projects and for the other parts according to general geological conditions of Haiphong City area.
The area is in general flat and ground surface level is in average from +3.0 to +3.5 m. The top layer on the shore is backfill soil, with a thickness of 1.0 m to 1.7 m. Backfill soil is mainly composed of sandy clay and silt. The bottom of the channel is covered by 0.1 m – 2.3 m thick sludge layer (average about 0.5 m).
Natural soil under the backfill soil is from very soft to soft sandy and clayey silt (N-values of SPT tests N= 0.5 - 2.4). Close to Du Hang Lake firm sandy silt layer has been encountered at the depth of 9 m. In places there is about 1.0 m stiffer layer just under the backfill soil (N = 2 - 4). Ground water (perched water) is about 1.0 – 1.8 m from ground surface.
3.3.2 Preliminary Hydraulic Design
(1) Methodology for Determination of Hydraulic Layout
Layout design of the channel is determined as follows:
• Discharge locations of the channel to lakes and rivers are selected
• Based on the discharge locations different alternatives for the channel top widths and cross-sections for different lengths of the channels are identified
• The different alternatives are then compared to the existing conditions to ensure that the existing hydraulic capacity of the channel is not further reduced by filling in the channel

The Study on Sanitation Improvement Plan for Haiphong City, Vietnam
Final Report, Main Report, Volume 2, Part 2
2 - 30
• Preliminary calculations are then done to assess and compare the hydraulic capacities of the alternatives
The selected hydraulic layout must also satisfy the planning requirement for dual function of the channel for drainage and irrigation.
(2) Discharge Locations of Channel
Four discharge locations of the channel were selected as follows:
• Discharge to Lach Tray River
• Discharge to Du Hang Lake
• Discharge to Phuong Luu Lake
• Discharge to Cam River
1) Discharge Location at Lach Tray River
At present the channel is connected to a siphon structure located under the Lach Tray River which connects the channel part in the Priority Project area to the part of the channel located upstream. The siphon is used for delivering water for irrigation. In the project, gates are located on the siphon on the west side of the Lach Tray River. The siphon system will remain. A new tidal gate is constructed on the east side of the Lach Tray River and on the north side of the siphon structure. The tidal gate allows discharge from the channel to Lach Tray River during low tide conditions when the siphon gate is closed.
2) Discharge Location at Du Hang Lake
One purpose of rehabilitating the channel is to integrate the Southwest and Northeast Drainage Zones. This objective is partially achieved by constructing a discharge gate to Du Hang Lake in the Southwest Drainage Zone. Location of the discharge gate is selected at mid-point along the length of the lake, because it represents the shortest distance for discharge to the Lach Tray River during low tide conditions with the lowest amount of housing density along the lake. When the channel is used for irrigation, the discharge gates are closed.
3) Discharge Location at Phuong Luu Lake
The Northeast Drainage Zone is integrated by connecting An Kim Hai Channel to the new Phuong Luu Lake. Discharge gates are included in the works for Phuong Luu Lake for connection with An Kim Hai Channel. When the channel is used for irrigation, the discharge gates are closed.
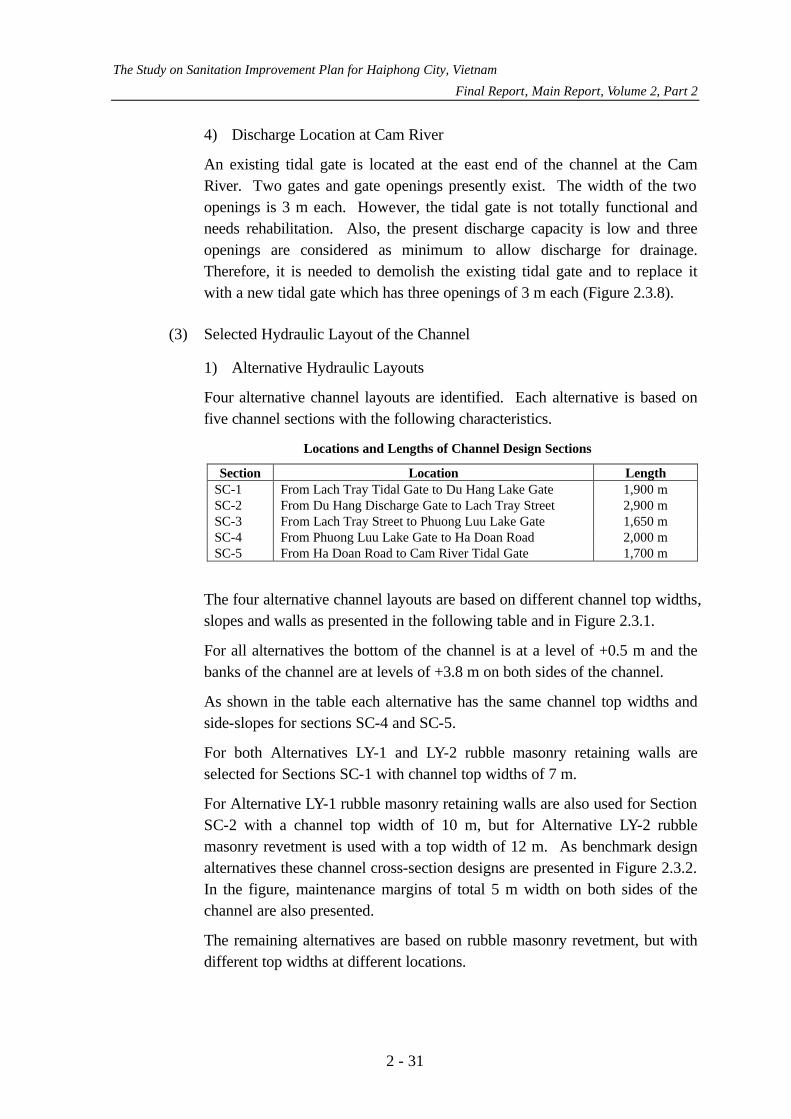
The Study on Sanitation Improvement Plan for Haiphong City, Vietnam
Final Report, Main Report, Volume 2, Part 2
2 - 31
4) Discharge Location at Cam River
An existing tidal gate is located at the east end of the channel at the Cam River. Two gates and gate openings presently exist. The width of the two openings is 3 m each. However, the tidal gate is not totally functional and needs rehabilitation. Also, the present discharge capacity is low and three openings are considered as minimum to allow discharge for drainage. Therefore, it is needed to demolish the existing tidal gate and to replace it with a new tidal gate which has three openings of 3 m each (Figure 2.3.8).
(3) Selected Hydraulic Layout of the Channel
1) Alternative Hydraulic Layouts
Four alternative channel layouts are identified. Each alternative is based on five channel sections with the following characteristics.
Locations and Lengths of Channel Design Sections
Section Location Length SC-1 From Lach Tray Tidal Gate to Du Hang Lake Gate 1,900 m SC-2 From Du Hang Discharge Gate to Lach Tray Street 2,900 m SC-3 From Lach Tray Street to Phuong Luu Lake Gate 1,650 m SC-4 From Phuong Luu Lake Gate to Ha Doan Road 2,000 m SC-5 From Ha Doan Road to Cam River Tidal Gate 1,700 m
The four alternative channel layouts are based on different channel top widths, slopes and walls as presented in the following table and in Figure 2.3.1.
For all alternatives the bottom of the channel is at a level of +0.5 m and the banks of the channel are at levels of +3.8 m on both sides of the channel.
As shown in the table each alternative has the same channel top widths and side-slopes for sections SC-4 and SC-5.
For both Alternatives LY-1 and LY-2 rubble masonry retaining walls are selected for Sections SC-1 with channel top widths of 7 m.
For Alternative LY-1 rubble masonry retaining walls are also used for Section SC-2 with a channel top width of 10 m, but for Alternative LY-2 rubble masonry revetment is used with a top width of 12 m. As benchmark design alternatives these channel cross-section designs are presented in Figure 2.3.2. In the figure, maintenance margins of total 5 m width on both sides of the channel are also presented.
The remaining alternatives are based on rubble masonry revetment, but with different top widths at different locations.
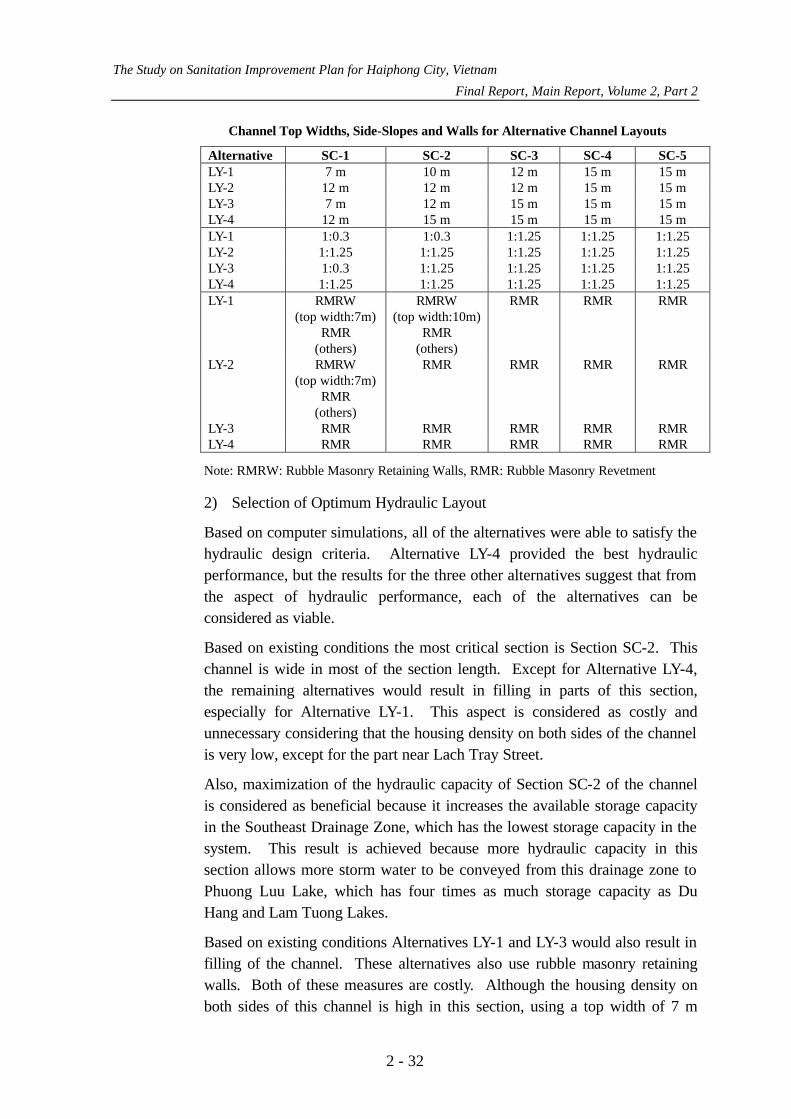
The Study on Sanitation Improvement Plan for Haiphong City, Vietnam
Final Report, Main Report, Volume 2, Part 2
2 - 32
Channel Top Widths, Side-Slopes and Walls for Alternative Channel Layouts
Alternative SC-1 SC-2 SC-3 SC-4 SC-5 LY-1 7 m 10 m 12 m 15 m 15 m LY-2 12 m 12 m 12 m 15 m 15 m LY-3 7 m 12 m 15 m 15 m 15 m LY-4 12 m 15 m 15 m 15 m 15 m LY-1 1:0.3 1:0.3 1:1.25 1:1.25 1:1.25 LY-2 1:1.25 1:1.25 1:1.25 1:1.25 1:1.25 LY-3 1:0.3 1:1.25 1:1.25 1:1.25 1:1.25 LY-4 1:1.25 1:1.25 1:1.25 1:1.25 1:1.25 LY-1 RMRW
(top width:7m) RMR
(others)
RMRW (top width:10m)
RMR (others)
RMR RMR RMR
LY-2 RMRW (top width:7m)
RMR (others)
RMR RMR RMR RMR
LY-3 RMR RMR RMR RMR RMR LY-4 RMR RMR RMR RMR RMR
Note: RMRW: Rubble Masonry Retaining Walls, RMR: Rubble Masonry Revetment
2) Selection of Optimum Hydraulic Layout
Based on computer simulations, all of the alternatives were able to satisfy the hydraulic design criteria. Alternative LY-4 provided the best hydraulic performance, but the results for the three other alternatives suggest that from the aspect of hydraulic performance, each of the alternatives can be considered as viable.
Based on existing conditions the most critical section is Section SC-2. This channel is wide in most of the section length. Except for Alternative LY-4, the remaining alternatives would result in filling in parts of this section, especially for Alternative LY-1. This aspect is considered as costly and unnecessary considering that the housing density on both sides of the channel is very low, except for the part near Lach Tray Street.
Also, maximization of the hydraulic capacity of Section SC-2 of the channel is considered as beneficial because it increases the available storage capacity in the Southeast Drainage Zone, which has the lowest storage capacity in the system. This result is achieved because more hydraulic capacity in this section allows more storm water to be conveyed from this drainage zone to Phuong Luu Lake, which has four times as much storage capacity as Du Hang and Lam Tuong Lakes.
Based on existing conditions Alternatives LY-1 and LY-3 would also result in filling of the channel. These alternatives also use rubble masonry retaining walls. Both of these measures are costly. Although the housing density on both sides of this channel is high in this section, using a top width of 7 m

The Study on Sanitation Improvement Plan for Haiphong City, Vietnam
Final Report, Main Report, Volume 2, Part 2
2 - 33
instead of 12 m would not significantly reduce the amount of households to be resettled, because of the locations of the maintenance roads on both sides of the channel.
Also, maximization of the hydraulic capacity of Section SC-1 of the channel is considered as beneficial because it allows more effective discharge of Du Hang Lake, which has low storage capacity, to the Lach Tray River during low tide conditions.
Based on these aspects Alternative LY-4 is selected because it provides the most cost effective hydraulic performance. The amount of households to be resettled for this alternative is not considered to be significantly greater than for the other four alternatives.
(4) Design Calculations
1) Design Catchment Areas
Based on existing conditions, the integrated drainage system consists of the following drainage basins and associated land surface areas:
• Northeast Drainage Basin 600 ha surface area
• Southwest Drainage Basin 400 ha surface area
• An Kim Hai Channel Drainage Basin 840 ha surface area
For the World Bank Project, the rehabilitation design of Northeast and Southwest Channels were based on inclusion of two catchment areas, each of size 50 ha, of the An Kim Hai Channel Drainage Basin in each of the two basins. However, these catchment areas are proposed to remain in the An Kim Hai Channel Basin for preliminary design of the system.
2) Design Runoff Coefficients
Design runoff coefficients are based on the amounts of developed and undeveloped land in the catchment areas, using the criteria presented in the following table.
Criteria for Calculating Composite Design Runoff Coefficients
Runoff Coefficient Degree of Land Development Developed Land Undeveloped Land 90% - 100% 0.60 0.30 80% - 90% 0.55 0.25 70% - 80% 0.50 0.20 50% - 70% 0.45 0.15 30% - 50% 0.40 0.10 10% - 30% 0.30 0.05
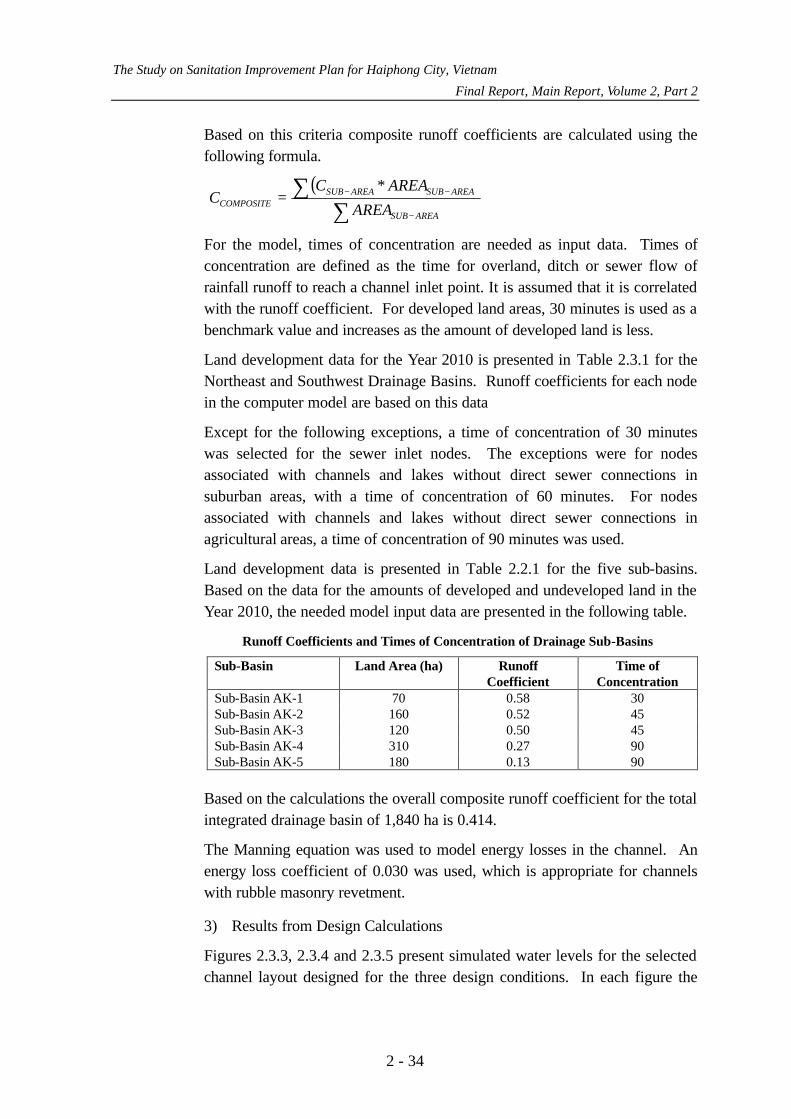
The Study on Sanitation Improvement Plan for Haiphong City, Vietnam
Final Report, Main Report, Volume 2, Part 2
2 - 34
Based on this criteria composite runoff coefficients are calculated using the following formula.
( )∑
∑−
−−=AREASUB
AREASUBAREASUBCOMPOSITE AREA
AREACC
*
For the model, times of concentration are needed as input data. Times of concentration are defined as the time for overland, ditch or sewer flow of rainfall runoff to reach a channel inlet point. It is assumed that it is correlated with the runoff coefficient. For developed land areas, 30 minutes is used as a benchmark value and increases as the amount of developed land is less.
Land development data for the Year 2010 is presented in Table 2.3.1 for the Northeast and Southwest Drainage Basins. Runoff coefficients for each node in the computer model are based on this data
Except for the following exceptions, a time of concentration of 30 minutes was selected for the sewer inlet nodes. The exceptions were for nodes associated with channels and lakes without direct sewer connections in suburban areas, with a time of concentration of 60 minutes. For nodes associated with channels and lakes without direct sewer connections in agricultural areas, a time of concentration of 90 minutes was used.
Land development data is presented in Table 2.2.1 for the five sub-basins. Based on the data for the amounts of developed and undeveloped land in the Year 2010, the needed model input data are presented in the following table.
Runoff Coefficients and Times of Concentration of Drainage Sub-Basins
Sub-Basin Land Area (ha) Runoff Coefficient
Time of Concentration
Sub-Basin AK-1 70 0.58 30 Sub-Basin AK-2 160 0.52 45 Sub-Basin AK-3 120 0.50 45 Sub-Basin AK-4 310 0.27 90 Sub-Basin AK-5 180 0.13 90
Based on the calculations the overall composite runoff coefficient for the total integrated drainage basin of 1,840 ha is 0.414.
The Manning equation was used to model energy losses in the channel. An energy loss coefficient of 0.030 was used, which is appropriate for channels with rubble masonry revetment.
3) Results from Design Calculations
Figures 2.3.3, 2.3.4 and 2.3.5 present simulated water levels for the selected channel layout designed for the three design conditions. In each figure the

The Study on Sanitation Improvement Plan for Haiphong City, Vietnam
Final Report, Main Report, Volume 2, Part 2
2 - 35
highest and lowest water levels are presented. Also, the water level during maximum discharge is presented.
As shown in the figures, the selected channel layout design satisfies the design criteria, where the maximum water levels are lower than 0.5 m from the levels of the channel banks.
Also, the maximum water levels are lower than 0.9 m from the levels of the channel banks, so that additional hydraulic capacity is also available when implementing Phase II of the Drainage Improvement Master Plan.
3.3.3 Preliminary Civil Works Design
(1) Summary of Construction Works
The preliminary layout design of An Kim Hai Channel is presented in Figure 2.3.6. Rehabilitation of An Kim Hai Channel consists of the following works:
• Dredging and excavation of the channel of total length of about 10 km • Construction of embankment works of rubble masonry revetment for the
channel with side slopes of 1:1.25 • Construction of maintenance roads and margins along the sides of the channel
each with total width of 5 m • Construction of Lach Tray Tidal Gate at Lach Tray River with three openings
of width 3 m and three gates • Demolition of existing Nam Dong Tidal Gate at Cam River and construction of
new tidal gate with three openings of width 3 m and three gates • Construction of Du Hang Flow Gate at Du Hang Lake with three openings of
width 3 m and three gates
The channel will be rehabilitated according to the following criteria:
• Top width of 12 m for a length of 1,900 m • Top width of 15 m for a length of 6,550 m • Top width of 20 m for a length of 1,700 m
The maintenance roads and margins will be located on both sides of the channel for the entire length of the channel.
(2) Channel Embankment Works
Preliminary design of the channel embankment works is based on levels of the channel banks and channel bottom which remain constant for the entire length of the channel. The following levels have been selected:
• Levels of channel banks on both sides: +3.8 m • Level of channel bottom: +0.5 m

The Study on Sanitation Improvement Plan for Haiphong City, Vietnam
Final Report, Main Report, Volume 2, Part 2
2 - 36
Channel side-slopes have been selected as 1:1.25. Selection of this value was based on previous studies. However, during detailed design geotechnical investigations are needed to confirm the geotechnical stability of this channel side-slope.
Figure 2.3.7 presents the preliminary design of the channel embankment works. The works consist of an upper layer of wet masonry with an intermediate layer of base concrete and a bottom layer of gravel bedding. A footing beam is located at the base of the revetment. Bamboo piles with a density of 25 piles per m2 are located below the beam to provide an adequate foundation.
(3) Maintenance Road Works
Preliminary design of the maintenance road works is based on a road surface width of 3.5 m and a margin of 1.0 m on the channel side and 0.5 m on the other side. The total margin width is then 5.0 m.
Figure 2.3.8 presents the preliminary design of the maintenance road works. The works consist of an upper layer of asphalt concrete with an intermediate layer of base course and a bottom layer of sub-base course. Precast concrete curbs are located on the side edges of the sub-surface works.
(4) Tidal Gate and Discharge Gate Works
Preliminary design of the tidal gates at Lach Tray River and Cam River and the discharge gate at Du Hang Lake is based on a common design for the three structures. Three conduits are used in the structure with gates on the river and lake sides of the structure. The width and height of each conduit is both 3 m. The conduits can be isolated with stop logs.
Figure 2.3.8 presents the preliminary design of the structural works. The invert level of the conduits is +0.0 m. A road is located on the top of the structure at the level of +4.5 m. The structure has a facade covering of wet masonry with an intermediate layer of coarse sand and internal fill of compacted soil. The civil works design of the road is identical to the design of the maintenance road of the channel. Precast reinforced concrete piles are located on the bottom of the structure to provide an adequate foundation.
The gates are opened and closed by using three electric motor driven spindles. The motors are rated as 5.5 kW, 380 V, and 50 Hz. The motors are located on frames constructed of reinforced concrete. Access to the motors is by a steel ladder. Steel hand rails are located on the sides of the working floor.
Gabions are located on the upstream side of the structure on the channel bottom and also on the downstream side on the river and lake bottoms for erosion control and protection.
The Study on Sanitation Improvement Plan for Haiphong City, Vietnam
Final Report, Main Report, Volume 2, Part 2
2 - 37
CHAPTER 4 CONSTRUCTION OF PHUONG LUU LAKE
4.1 Planning Issues and Design Criteria
(1) Planning Issues
The main planning objective for construction of Phuong Luu Lake is to integrate the Northeast, Southwest and An Kim Hai Drainage Zones and to provide adequate storage capacity for storing storm water during high tide conditions. The drainage zone with the greatest need for storage capacity is the An Kim Hai Channel Drainage Zone, which presently does not have any major lakes. Additional storage capacity is also needed for the Southwest Drainage Basin.
The location of the new lake is based on the Haiphong Sewerage and Drainage Master Plan. Land for the construction of Phuong Luu Lake is available at the proposed location as the area consists mostly of agricultural land.
The primary function of Phuong Luu Lake is for drainage. During high tide conditions water will be discharged from An Kim Hai Channel and Northeast Channel to the lake. During the subsequent low tide conditions the stored storm water will then be discharged through An Kim Hai Channel and Northeast Channel to the Cam River.
However, the lake will also have a secondary function for recreation. The site layout will include margins along the lake which will provide a recreational environment.
The most important planning issue for construction of Phuong Luu Lake is the surface area of the lake which defines the storage capacity of the lake. A minimum volume of water will be allowed in the lake to obtain the benefits from the secondary function for recreation.
Selection of the bottom level of the lake is based on providing a minimum depth of water, and is not directly related to providing adequate storage capacity. The storage capacity is then defined as the amount of storm water which can be stored at the design minimum and maximum water levels.
Consequently, the main planning issues for construction of Phuong Luu Lake comprise the following:
• Site layout of the lake
• Maintenance roads and margins
• Embankment works
Alternatives for each planning issue are identified, and the optimum alternative is selected for design.
The Study on Sanitation Improvement Plan for Haiphong City, Vietnam
Final Report, Main Report, Volume 2, Part 2
2 - 38
(2) Design Criteria
The design criteria for construction of Phuong Luu Lake comprise calculating the maximum water levels in all of the lakes in the integrated drainage zones during the three design conditions as described in Section 2.3.2. The calculations are done using the developed computer model. The surface area of Phuong Luu Lake is considered as sufficient, if the calculated maximum water levels in all of the lakes in the integrated drainage zone are less than the design maximum levels for each of the three design conditions.
The maximum water levels for the lakes comprise the following design criteria:
• Phuong Luu Lake: +2.7 m
• An Bien, Mam Tom, Quan Ngua and Tien Nga Lakes: +2.9 m
• Du Hang and Lam Tuong Lakes: +2.9 m
• Sen Lake: +3.2 m
The maximum water level for Phuong Luu Lake is based on the Haiphong Sewerage and Drainage Master Plan prepared by Haiphong City. The maximum water level for the existing lakes (An Bien, Mam Tom, Quan Ngua, Du Hang, Lam Tuong and Sen Lakes) are based on the rehabilitation design criteria from the World Bank Sanitation Project for these lakes.
The minimum water levels in the lakes are +1.5 m. This design criteria is based on the Haiphong Sewerage and Drainage Master Plan prepared by Haiphong City.
4.2 Alternative Study
4.2.1 Site Layout of Lake
(1) Alternative Approaches
The site layout for Phuong Luu Lake must consider the following issues associated with the proposed site for the lake:
• Location of electricity lines and towers in the site area
• Location of future Cat Bi Road
• Relocation of graveyards in the site area
• Possibilities for connections to An Kim Hai Channel
Four alternative layout designs have been identified which are based on the above issues. The four alternatives are as follows:
• PL-1: Center of site area with parallel orientation with future Cat Bi Road
• PL-2: Center of site area with parallel orientation with electricity lines

The Study on Sanitation Improvement Plan for Haiphong City, Vietnam
Final Report, Main Report, Volume 2, Part 2
2 - 39
• PL-3: Location which is west of the electricity lines
• PL-4: Location which is east of the electricity lines
Alternative PL-1 is located in the center of the site area with a parallel orientation to the future planned Cat Bi Road. The alternative is presented in Figure 2.4.1. The main disadvantage with this alternative is that the high power voltage tower and lines in the site area would need to be relocated. Also, connections to An Kim Hai Channel would require removal of buildings adjacent to Highway No. 5.
Alternative PL-2 is located in the center of the site area and consists of two separate parts, where the power towers and lines would be located in the margin between the two parts. The alternative is presented in Figure 2.4.2. The main disadvantage with this alternative is that the costs would be higher than an alternative with only one part. Also, this alternative may have less recreational value because of the presence of the electricity towers and lines in the middle of the lake area.
Alternative PL-3 is located on the west side of the electricity towers and lines. The alternative is presented in Figure 2.4.3. The main disadvantage with this alternative is that amount of relocation of graveyards would be greater than the three other alternatives. Also, this alternative may interfere with the plans and location for the future Cat Bi Road.
Alternative PL-4 is located on the east side of the electricity towers and lines. The alternative is presented in Figure 2.4.4. There are no major disadvantages to this alternative, although one of the electricity lines may need to be moved a short distance to the west of its present location.
(2) Selected Alternative
Alternative PL-4 is adopted because there would be no major interference with the electricity lines or towers in the site area nor interference with the planned future Cat Bi Road. Also, the area of graveyards to be relocated is low and there are more accessible connections to An Kim Hai Channel.
4.2.2 Connections to Channels
(1) Alternative Approaches
The new lake is to be connected to the Northeast Channel and to the rehabilitated An Kim Hai Channel. Alternative approaches for the channel connections comprise the following:
• CN-1: Direct connection
• CN-2: Open channel connection

The Study on Sanitation Improvement Plan for Haiphong City, Vietnam
Final Report, Main Report, Volume 2, Part 2
2 - 40
• CN-3: Closed conduit connection
Alternative CN-1 represents the least cost alternative. However, the site conditions of the location of the lake does not allow direct connections. The area near the Northeast Channel contains residential housing, so that the surface of the lake cannot be extended to the channel, without major resettlement of Project affected population. Highway No. 5 is located between the lake and An Kim Hai Channel, so it is not possible to construct a direct connection to An Kim Hai Channel. Consequently, Alternative CN-1 is not viable.
Alternative CN-2 represents the next least cost alternative. However, selection of this alternative depends on available land in the area.
Alternative CN-3 represents the most costly alternative. Furthermore, the hydraulic capacity of the closed conduits would be less than using an open channel of relatively similar margin dimensions.
(2) Selected Alternative
Land is available in the area near the Northeast Channel to select Alternative CN-2 for connecting Phuong Luu Lake to the Northeast Channel. Some houses are located at the connection to the channel and need to be removed requiring some resettlement of Project affected population.
Land is not available in the area near An Kim Hai Channel for constructing an open channel connection, with Highway No. 5 causing the greatest restriction. Selection of Alternative CN-3 is then required for connecting Phuong Luu Lake to An Kim Hai Channel.
4.3 Technical Design
4.3.1 Site and Soil Conditions
The area of the planned Phuong Luu Regulation Lake is mainly flat vegetable and rice fields. Ground level is in general about + 2.8 m to +3.1 m. There are some aquaculture and fishing ponds and graveyards in the area. Electricity lines and a telephone line as well as some ditches and irrigation channels cross the site in the middle. In the north the area borders the Northeast Channel and Highway No. 5 in the south. At the western and eastern sides there are residential areas.
Natural soil is from very soft to soft sandy and clayey silt (N-values of SPT tests of N = 0.5 - 2). These soft layers reach at least to the depth of 10 m. The shearing strength of the soil is low. Ground water (perched water) is about 0.5 to 1.0 m from ground surface .

The Study on Sanitation Improvement Plan for Haiphong City, Vietnam
Final Report, Main Report, Volume 2, Part 2
2 - 41
4.3.2 Preliminary Hydraulic Design
(1) Surface Area of Lake
Based on the given conditions, the lake can be developed using a total site area of 28 ha and a lake surface area of 24 ha without restrictions from existing housing in the area.
There is then 4 ha of land available around the lake for the lake road and recreational areas. The lake surface area of 24 ha is consistent with the surface area calculated in the Drainage Improvement Master Plan. The value is checked using a more detailed design methodology adopted for the Feasibility Study.
(2) Design Calculations
Design calculations were done using the same developed computer model and design data as for An Kim Hai Channel. The selected design of An Kim Hai Channel is also included in the developed computer model.
Figures 2.4.5, 2.4.6, 2.4.7 and 2.4.8 present simulated water levels for the three design conditions for Phuong Luu, An Bien, Du Hang and Sen Lakes. The water levels at the beginning of the computer simulations were +1.5 m, which represents the minimum water levels for the lakes.
As shown in the figures, the selected storage capacity of Phuong Luu Lake satisfies the design criteria, where the maximum water levels in the lakes in the integrated drainage zone are less than or approximately equal to the design maximum water levels for the lakes.
4.3.3 Preliminary Civil Works Design
(1) Summary of Construction Works
The preliminary layout design of Phuong Luu Lake is presented in Figure 2.4.9. Construction of Phuong Luu Lake consists of the following construction works:
• Excavation of the lake with surface area of 24 ha and bottom level +0.0 m
• Construction of embankment works of rubble masonry revetment along the lake edges with side-slopes of 1:1.5
• Construction of roads and margins along the sides of the lakes with a total width of 12 m and road level of +3.8 m
• Construction of recreational areas at locations along the lake with a total site area of 28 ha for the lake, roads and recreational areas

The Study on Sanitation Improvement Plan for Haiphong City, Vietnam
Final Report, Main Report, Volume 2, Part 2
2 - 42
• Construction of connecting channel to Northeast Channel with a length of 500 m, top width of 15 m, rubble masonry revetment with side-slopes 1:1.25, and maintenance roads and margins on both sides each with a total width of 7 m
• Construction of roads and margins with a total width of 12 m and length of 400 m connecting the lake site area to Highway No. 5
• Construction of concrete box culvert of 3 x (3.0 m x 2.0 m) dimensions of the length of 450 m located under road connecting site area to Highway No. 5 and discharging to An Kim Hai Channel
• Construction of three flow gates at the discharge location of the box culvert to An Kim Hai Channel each with a width of 3 m
The lake site area is also located to allow urban development to occur at the edges of the lake site area.
(2) Lake Road and Embankment Works
Preliminary design of the lake road and embankment works is based on a bottom level of +0.0 m and the design minimum water level of +1.5 m. The level of the road is selected as +3.8 m which is the same as the levels of the channel banks for rehabilitating An Kim Hai Channel.
Figure 2.4.10 presents the preliminary design of the lake embankment and road works. The embankment works consist of rubble masonry revetment. The total width of the maintenance roads plus margins on each side is selected as 12 m. The road will consist of two lanes, each with a width of 3.5 m. Sidewalk margins with a width of 2.5 m will be located on both sides of the road.
The designs of the embankment and road works are similar as the designs for An Kim Hai Channel. A side-slope of 1:1.5 is selected for the embankment works.
(3) Connecting Channel Works
Preliminary design of the connecting channel is identical to the channel designs for rehabilitating An Kim Hai Channel. However, the total width of the maintenance road margin is 7 m, with a 2 m wide margin on the channel side and a 1.5 m wide margin on the other side. This condition is applied because land is available to implement these dimensions. A bridge is constructed over the channel where it connects to the lake. The length of the bridge is 15 m with a width of 12 m.
(4) Closed Conduit Structure Works
The closed conduit connection to An Kim Hai Channel consists of a box culvert with three conduits. The width of each conduit is 3 m and the height is 2 m. The invert level of the conduits is +0.8 m.

The Study on Sanitation Improvement Plan for Haiphong City, Vietnam
Final Report, Main Report, Volume 2, Part 2
2 - 43
The road connecting the lake area to Highway No. 5 is located above the box culvert. The total width of the roads plus margins on each side is selected as 12 m. The road will consist of two lanes, each with a width of 3.5 m. Sidewalk margins of width 2.5 m will be located on both sides of the road.
Figure 2.4.11 presents the preliminary design of the culvert and road works. The culvert is constructed of reinforced concrete. Precast reinforced concrete piles are located on the bottom of the structure to provide an adequate foundation. The road works consist of a top layer of asphalt concrete and a base layer of crushed stone. Precast concrete curbs are located on the side edges of the sub-surface works of the road.
Gate structures are to be located at the connection to An Kim Hai Channel. The conceptual design of the gate works is identical to the conceptual designs of the gate works for the tidal gates for Lach Tray and Cam River and the discharge gate for Du Hang Lake.

The Study on Sanitation Improvement Plan for Haiphong City, Vietnam
Final Report, Main Report, Volume 2, Part 2
2 - 44
CHAPTER 5 SUPPLEMENTARY COMPONENTS
5.1 New Combined Sewers
(1) Construction of Replacement Sewers
Rehabilitation of the existing combined sewer network is a given condition considering that sewer rehabilitation works are included in the World Bank Sanitation Project. However, the World Bank Project does not include cleaning and inspecting of sewers for some areas of the Priority Project area as follows:
• Tertiary sewers are not included in the project for Lam Son, An Duong and Niem Nghia Phuongs in Le Chan District and May Chai Phuong in Ngo Quyen District
• Neither main, lateral nor tertiary sewers are included in the project for Dong Khe and Dang Giang Phuongs in Ngo Quyen District and Du Hang Kenh Commune in An Hai District
To ensure compatibility between the Priority Project and World Bank Project, an approach is adopted where SADCO would assume this responsibility by using the sewer cleaning and inspection equipment procured in the World Bank Project to cover this area. It is expected that the amount of sewers which would need repair is small, and that repair works can be financed by the budget of SADCO.
However, for sewers needing possible replacement because of poor condition or inadequate hydraulic capacity, provision of 3 km of new main sewers is provided in the Priority Project as a supplementary component.
(2) Construction of New Sewers
At present the amount of existing combined sewers is considered to be too small in some of the areas in the Priority Project area. These areas comprise the following:
• Dong Khe Phuong in Ngo Quyen District
• Du Hang Kenh Commune in An Hai District
Based on urban development plans of Haiphong City new roads are planned for construction in these areas: Sen Road in Du Hang Kenh Commune and Cat Bi Road in Dong Khe Phuong. Locating new main combined sewers at these new roads would provide much more cost effective drainage than attempting to plan and construct new sewers based on the existing conditions.
The adopted approach for the Priority Project is that new main combined sewers would be provided in these road construction projects separately from the Priority Project, but the Priority Project would include provision for 7 km of lateral sewers
The Study on Sanitation Improvement Plan for Haiphong City, Vietnam
Final Report, Main Report, Volume 2, Part 2
2 - 45
as a supplementary component. These branch sewers would then connect to the new main sewers of the new roads construction project.
5.2 Channel Road Bridges
At present there are 10 road bridges and 21 small wooden and bamboo bridges which cross over An Kim Hai Channel. The small foot bridges will need to be removed. However, the main road bridges do not need to be removed.
Consequently, the Drainage Priority Project includes the construction of new bridges crossing over An Kim Hai Channel as a supplementary component. The amount of new bridges would be located at the following channel sections:
• Section SC-1: Construction of 3 new bridges, length 12 m
• Section SC-2: Construction of 4 new bridges, length 15 m
• Section SC-3: Construction of 2 new bridges, length 15 m
• Section SC-4: Construction of 3 new bridges, length 15 m
• Section SC-5: Construction of 3 new bridges, length 20 m
The total amount provided as a supplementary component is 15 new bridges. The width of the new bridges is 7 m.
5.3 Ancillary Works
Ancillary works are also included in the Drainage Priority Project as a supplementary component for the maintenance roads and margins along An Kim Hai Channel and the road and margin areas around Phuong Luu Lake.
The ancillary works consist of the following:
• Lighting of the channel and lake roads and margin areas provided by light poles and lamps at intervals of 40 m
• Metal fences along the edges of the channel and lake roads along both sides of the channel and around the entire lake
• Trees and other plantings in the margin areas of the channels and lake
These works would enhance the value of the living environment of the road and margin areas along the channels and lake.
The Study on Sanitation Improvement Plan for Haiphong City, Vietnam
Final Report, Main Report, Volume 2, Part 2
2 - 46
CHAPTER 6 COSTS ESTIMATES
6.1 Investment Costs
Investment cost includes direct construction cost and land acquisition cost.
Direct construction cost is estimated based on bill of quantities given in tables for this chapter and the unit prices presented in Chapter 3, Part 1 of Volume 2. Details of the cost estimation can be found in the Supporting Report. A summary is given in the following table.
Summary of Direct Costs of Drainage Priority Project
Item Cost (US$1000) 1. Preparatory Works 2,264
2. Rehabilitation of An Kim Hai Channel 12,640
3. Construction of Phuong Luu Lake 10,004
Total 24,908
The cost of supplementary components is also estimated. Total cost is US$10.8 million (of which, costs for preparatory works is US$1.0 million, for new sewers is US$4.6 million, for bridges is US$2.2 million, and for ancillary works is US$3.0 million).
Cost of land acquisition and compensation is estimated based on actual field condition and details is given in Supporting Report. Total cost is US$3.7 million.
The total investment cost for the Drainage Priority Project is US$39.4 million.
6.2 O&M Costs
New staff is required to operate the new facilities proposed in the Priority Project. The estimation is based on the work performance of the existing staff, expected work load, available working hour, available equipment, and other factors. Total number of new staff is 6.
Unit cost for various levels of labor is given in Chapter 3 of Part 1, Volume 2.
Estimations for O&M costs is based on the following approach and assumptions:
• Annual operation costs is considered as constant and comprise vehicle and equipment costs, and office and communication costs. These costs are associated with daily monitoring of the system, and occasional operational activities during dry weather and wet weather (storm) conditions
• Annual maintenance costs is considered as variable and increase in the future, when the need for minor upkeep and repairs increase as the physical condition

The Study on Sanitation Improvement Plan for Haiphong City, Vietnam
Final Report, Main Report, Volume 2, Part 2
2 - 47
of the civil works begin to deteriorate. These comprise vehicle and equipment costs, and costs for maintenance and repair materials
It is estimated that the maintenance costs for minor upkeep and repair is US$5.1 thousand in the year 2010 and will increase to US$17 thousand by the year 2015 and US$42.5 thousand by the year 2020.
Based on this approach and assumptions, the following table presents the O&M costs for the Priority Project by the year 2020.
O&M Costs for Drainage Priority Project in Year 2020
COST ITEM Amount (nr)
Unit Cost US$/nr
Cost US$
1 Annual Staff Costs
1.1 Technicians and Operators 4 2 000 8 000
1.2 Indirect Support Staff 2 2 000 4 000
12 000
2 Annual Operation Costs
2.1 Vehicle and Equipment Costs 1 3 000 3 000
2.2 Office and Communication Costs 1 1 200 1 200
4 200
3 Year 2020 Maintenance Costs
3.1 Vehicle and Equipment Costs 1 7 000 17 500
3.2 Maintenance and Repair Materials 1 10 000 25 000
42 500
As shown in the table, total O&M costs is estimated to be US$58.7 thousand by the year 2020.
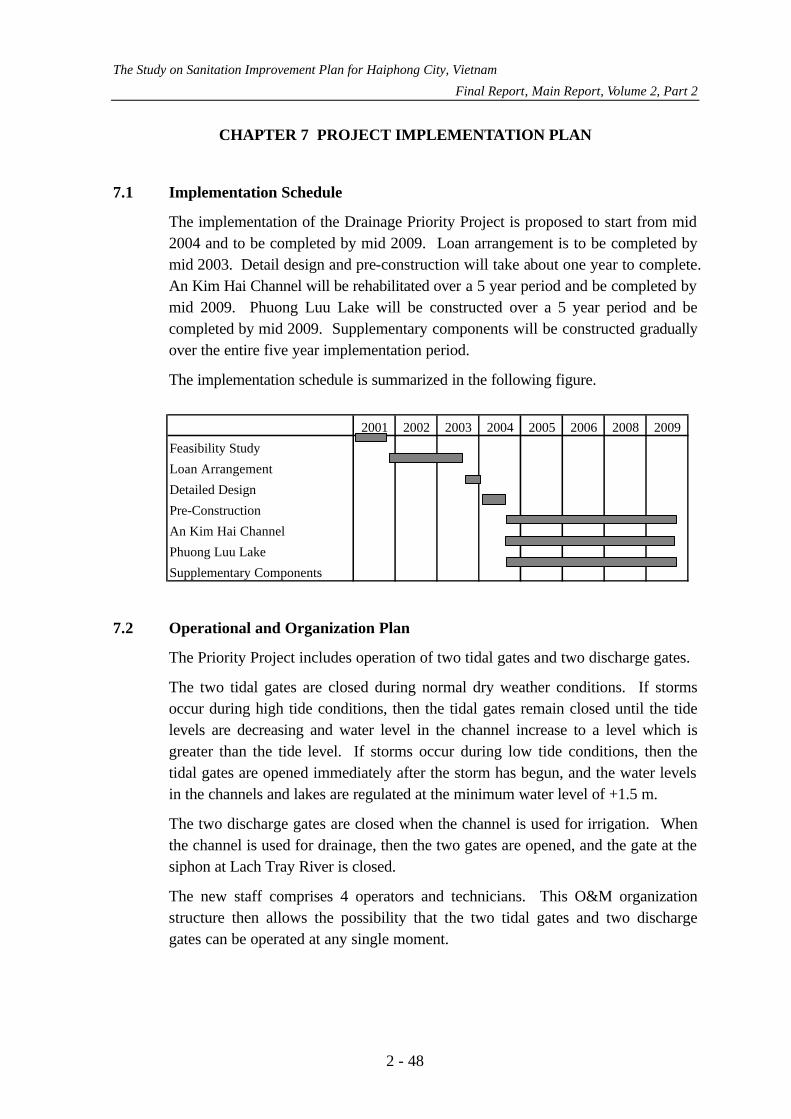
The Study on Sanitation Improvement Plan for Haiphong City, Vietnam
Final Report, Main Report, Volume 2, Part 2
2 - 48
CHAPTER 7 PROJECT IMPLEMENTATION PLAN
7.1 Implementation Schedule
The implementation of the Drainage Priority Project is proposed to start from mid 2004 and to be completed by mid 2009. Loan arrangement is to be completed by mid 2003. Detail design and pre-construction will take about one year to complete. An Kim Hai Channel will be rehabilitated over a 5 year period and be completed by mid 2009. Phuong Luu Lake will be constructed over a 5 year period and be completed by mid 2009. Supplementary components will be constructed gradually over the entire five year implementation period.
The implementation schedule is summarized in the following figure.
7.2 Operational and Organization Plan
The Priority Project includes operation of two tidal gates and two discharge gates.
The two tidal gates are closed during normal dry weather conditions. If storms occur during high tide conditions, then the tidal gates remain closed until the tide levels are decreasing and water level in the channel increase to a level which is greater than the tide level. If storms occur during low tide conditions, then the tidal gates are opened immediately after the storm has begun, and the water levels in the channels and lakes are regulated at the minimum water level of +1.5 m.
The two discharge gates are closed when the channel is used for irrigation. When the channel is used for drainage, then the two gates are opened, and the gate at the siphon at Lach Tray River is closed.
The new staff comprises 4 operators and technicians. This O&M organization structure then allows the possibility that the two tidal gates and two discharge gates can be operated at any single moment.
2001 2002 2003 2004 2005 2006 2008 2009
Feasibility Study
Loan Arrangement
Detailed Design
Pre-Construction
An Kim Hai Channel
Phuong Luu Lake
Supplementary Components

The Study on Sanitation Improvement Plan for Haiphong City, Vietnam
Final Report, Main Report, Volume 2, Part 2
2 - 49
7.2.1 Project Management in SADCO
This section focuses on the evaluation of the readiness of the key organizations to implement the priority projects. It assumed that TUPWS will assign the project construction management and supervision of the drainage project to SADCO.
Prior to the implementation of the proposed project drainage improvement, the existing PMU in SADCO will have had the experience with the World Bank 1B Project. The PMU is being strengthened along with the overall capacity building efforts of the FINNIDA funded Water Supply, Drainage, Sewerage, and Sanitation Management Program, 2001-2004 (WSDSSMP).
To date progress in developing the staff in SADCO has been slow. However, by the time the Drainage Priority Project is ready for implementation, it is expected that the capability of the PMU to effectively execute and manage the priority projects will be improved.
However, for planning purposes, it should be assumed that:
• The PMU unit will require further technical assistance to facilitate their participation in the implementation of the Priority Project
• International advisors will need to participate directly in the bidding, procurement and construction supervision
7.2.2 Prior Reorganization of SADCO
SADCO will need to be reorganized to successfully implement the Priority Project. It is proposed that the overall organizational structure will be as in the following figure.
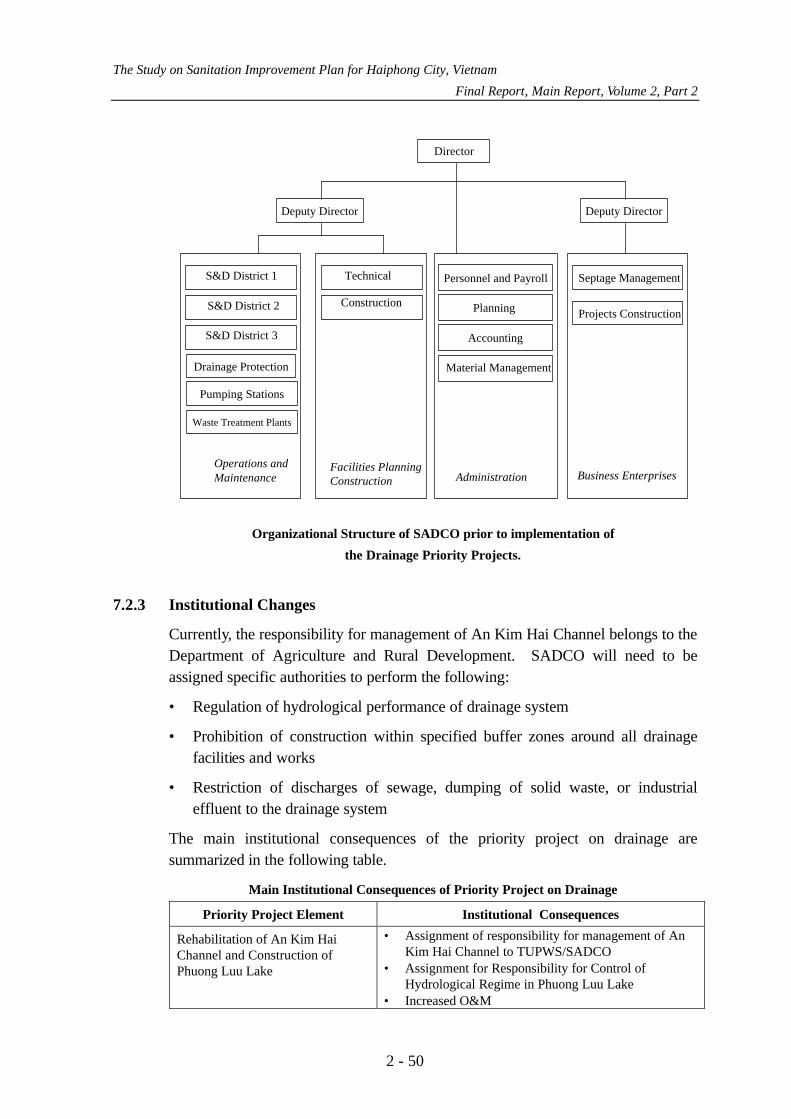
The Study on Sanitation Improvement Plan for Haiphong City, Vietnam
Final Report, Main Report, Volume 2, Part 2
2 - 50
Deputy Director
Director
Deputy Director
S&D District 1
S&D District 2
S&D District 3
Operations and Maintenance
Pumping Stations
Waste Treatment Plants
Facilities PlanningConstruction Business Enterprises
Projects Construction
Personnel and Payroll
Planning
Accounting
Administration
Material Management
Construction
Technical Septage Management
Drainage Protection
Organizational Structure of SADCO prior to implementation of the Drainage Priority Projects.
7.2.3 Institutional Changes
Currently, the responsibility for management of An Kim Hai Channel belongs to the Department of Agriculture and Rural Development. SADCO will need to be assigned specific authorities to perform the following:
• Regulation of hydrological performance of drainage system
• Prohibition of construction within specified buffer zones around all drainage facilities and works
• Restriction of discharges of sewage, dumping of solid waste, or industrial effluent to the drainage system
The main institutional consequences of the priority project on drainage are summarized in the following table.
Main Institutional Consequences of Priority Project on Drainage
Priority Project Element Institutional Consequences
Rehabilitation of An Kim Hai Channel and Construction of Phuong Luu Lake
• Assignment of responsibility for management of An Kim Hai Channel to TUPWS/SADCO
• Assignment for Responsibility for Control of Hydrological Regime in Phuong Luu Lake
• Increased O&M

The Study on Sanitation Improvement Plan for Haiphong City, Vietnam
Final Report, Main Report, Volume 2, Part 2
2 - 51
7.2.4 Manpower Training
Training and technical assistance should be undertaken to achieve the following objectives:
• Strengthen the capacity of the project management unit (PMU) to ensure that it can effectively implement the drainage project
• Increase the technical competence of the drainage team
The following set of specific courses must be developed and delivered.
Unit Specific Courses
Project Management Units • Project management systems • Bidding and Contract Management • Engineering skills • Foreign Languages
Drainage • Channel Cleaning, Rehabilitation and Maintenance • Operation of Facilities for Channels and Lakes
Specific measures for manpower training are proposed as follows:
(1) To learn from the preceding projects and experience in the cities in Vietnam
In Vietnam, large-scale drainage projects are currently underway or will be implemented soon in the cities of Hanoi and Ho Chi Minh. Their experience and knowledge can be learnt and transferred to the PMU to be established for Haiphong drainage priority project as well as to SADCO in the similar manner as mentioned above for the cooperation between WSC and SADCO. In the case of Ho Chi Minh drainage project, about 7,000 households must be resettled for which detailed plan has been worked out. This plan should carefully be referred to and studied when detailed resettlement will be formulated for Haiphong project.
(2) To study in appropriate academic organizations
In Haiphong, the Haiphong Private university has an Environment Faculty and can offer the educational opportunities for sanitation and environmental subjects. Marine university can also offer opportunities for related subjects. In Hanoi located only 2 hours distance from Haiphong, several universities are established which can offer courses related to sanitation management including the followings:
• Hanoi University of Civil Engineering (Center for Environmental Engineering for Towns and Industrial Area)
• Hanoi University of Technology (Center for Environmental Science and Technology)
• Hanoi National University

The Study on Sanitation Improvement Plan for Haiphong City, Vietnam
Final Report, Main Report, Volume 2, Part 2
2 - 52
• Hanoi Architecture University • Hanoi Politechnique University • Dong Do Private University • Asian Institute of Technology, Hanoi Branch
The offered courses by Hanoi University of Technology, which is closely related sanitation management, for example, include Environmental Chemistry, Environmental Pollution Control, Water Pollution and Treatment Technologies, Design and Management of Wastewater Treatment Plant, Collection and Treatment of Solid Waste and Sewerage Network for Urban Areas.
These courses would provide good training opportunities.
(3) Training by means of the technical assistance by overseas public sector organizations
Ministries and municipal governments of the advanced countries have long experience in the drainage management and their cooperation should be sought.
7.2.5 Cost Estimate for Training and Technical Assistance
The estimate total cost for training is US$4,000 and for technical assistance for a drainage advisor to project management unit is US$300,000. The details are given in the following table.
Estimate Cost for Training and Technical Assistance – Drainage Project
I. Training 1 2 3 4 5 6Trainee Course Days/ Trainer Cost/ Total Cost
Units Unit Days Day1. Sewerage and Drainage Units
Cleaning, Rehabilitation, and Maintenance 30 3 5 15 100 1,500$ 2. Project Management Unit
Project Management Systems 10 1 5 5 100 500$ Bidding and Contract Management 5 1 10 10 100 1,000$
3. Drainage Protection UnitNew Regulation and Inspection Procedures 15 1 10 10 100 1,000$
TOTAL TRAINING COSTS 4,000$
II. Technical Assistance - Priority Projects Man Cost/ TotalMonths Month Cost
1. Drainage Advisor - Project Management 12 25,000 300,000$
TOTAL TECHNICAL ASSISTANCE COST 300,000$
Training and technical assistance will be provided over a two-year period from 2005 to 2006. It may be mentioned here that cost for training and technical assistance is not included in the Priority Project cost estimates.
The Study on Sanitation Improvement Plan for Haiphong City, Vietnam
Final Report, Main Report, Volume 2, Part 2
2 - 53
CHAPTER 8 PROJECT EVALUATION
8.1 Objective Achievement
(1) Project Objectives
The Implementation of the Drainage Priority Project has 3 major objectives as follows:
• Improvement of public health • Improvement of the quality of ambient water bodies • Reinforcement of the economic activities and upgrade of the environment for
future economic growth
Public health improvement objective will be achieved by Drainage Priority Project implementation through the reduction of inundation area, depth and frequency as well as duration. Sanitation conditions of the project area which is located at the central part of the city will be improved and water-borne diseases of the city will be reduced.
Sweeping of the pollution load and flowing into the surface water during storm will be reduced which will contribute to the quality improvement of ambient water bodies.
With the lowered risk of flooding, land value will be enhanced and economic growth will be stimulated. These economic benefit will be discussed in the following section of this chapter.
(2) Objective Achievement Evaluation
1) Evaluation by Means of Impact Indicators
(a) Public Health Improvement
The central part of the city which is most densely populated and where flooding or inundation has been occurring most frequently, will be protected from flooding up to the storm water recurrence period of 5 years. Under bigger storms, the degree of flooding will be lessened. Duration and degree of unsanitary conditions will be shortened as well as water-borne diseases including the infectious ones. The overall public health condition will be improved which will have beneficial impacts on the whole city population which will be 1.909 million by the year 2010 and 2.121 million by the year 2020.
2) Evaluation by Means of Development Indicators
Drainage Priority Project will directly protect the central city area of about 11 km2 where 240 million residents will be living in the year 2010 and 286
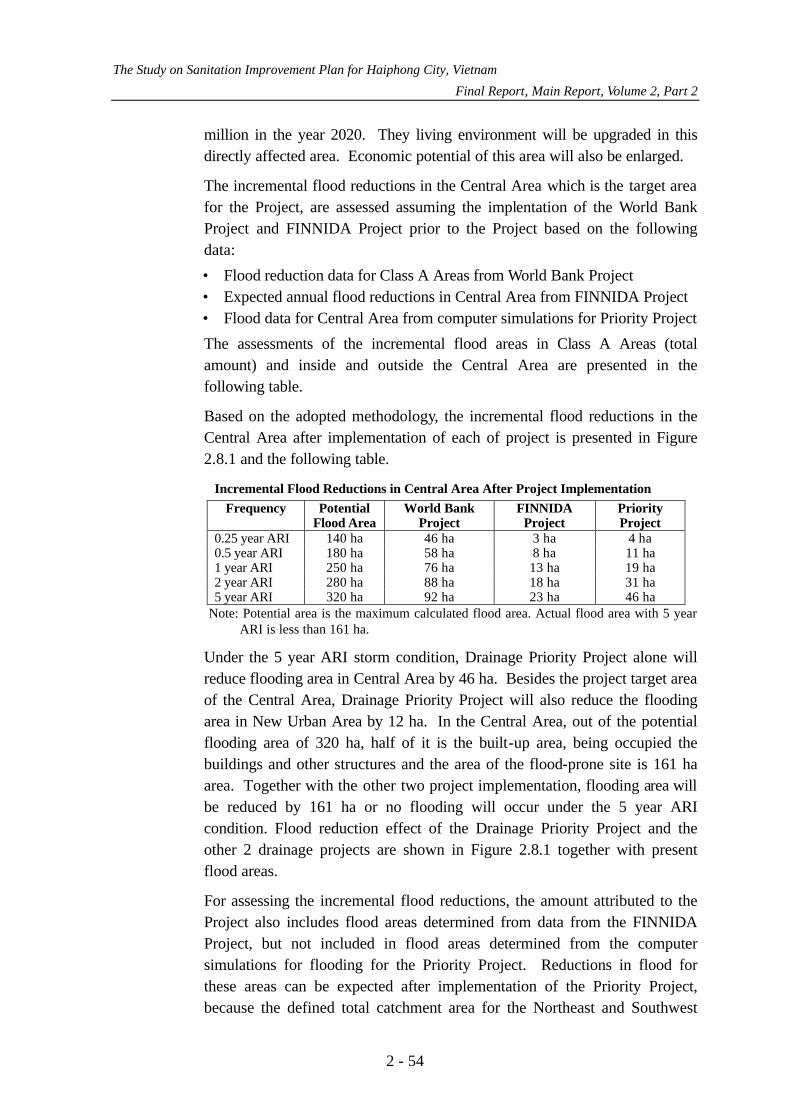
The Study on Sanitation Improvement Plan for Haiphong City, Vietnam
Final Report, Main Report, Volume 2, Part 2
2 - 54
million in the year 2020. They living environment will be upgraded in this directly affected area. Economic potential of this area will also be enlarged.
The incremental flood reductions in the Central Area which is the target area for the Project, are assessed assuming the implentation of the World Bank Project and FINNIDA Project prior to the Project based on the following data:
• Flood reduction data for Class A Areas from World Bank Project • Expected annual flood reductions in Central Area from FINNIDA Project • Flood data for Central Area from computer simulations for Priority Project
The assessments of the incremental flood areas in Class A Areas (total amount) and inside and outside the Central Area are presented in the following table.
Based on the adopted methodology, the incremental flood reductions in the Central Area after implementation of each of project is presented in Figure 2.8.1 and the following table.
Incremental Flood Reductions in Central Area After Project Implementation Frequency Potential
Flood Area World Bank
Project FINNIDA
Project Priority Project
0.25 year ARI 140 ha 46 ha 3 ha 4 ha 0.5 year ARI 180 ha 58 ha 8 ha 11 ha 1 year ARI 250 ha 76 ha 13 ha 19 ha 2 year ARI 280 ha 88 ha 18 ha 31 ha 5 year ARI 320 ha 92 ha 23 ha 46 ha
Note: Potential area is the maximum calculated flood area. Actual flood area with 5 year ARI is less than 161 ha.
Under the 5 year ARI storm condition, Drainage Priority Project alone will reduce flooding area in Central Area by 46 ha. Besides the project target area of the Central Area, Drainage Priority Project will also reduce the flooding area in New Urban Area by 12 ha. In the Central Area, out of the potential flooding area of 320 ha, half of it is the built-up area, being occupied the buildings and other structures and the area of the flood-prone site is 161 ha area. Together with the other two project implementation, flooding area will be reduced by 161 ha or no flooding will occur under the 5 year ARI condition. Flood reduction effect of the Drainage Priority Project and the other 2 drainage projects are shown in Figure 2.8.1 together with present flood areas.
For assessing the incremental flood reductions, the amount attributed to the Project also includes flood areas determined from data from the FINNIDA Project, but not included in flood areas determined from the computer simulations for flooding for the Priority Project. Reductions in flood for these areas can be expected after implementation of the Priority Project, because the defined total catchment area for the Northeast and Southwest

The Study on Sanitation Improvement Plan for Haiphong City, Vietnam
Final Report, Main Report, Volume 2, Part 2
2 - 55
Drainage Basins was 100 ha less for the Priority Project than for the FINNIDA Project. This situation occurs because these catchment areas will be developed as part of the An Kim Hai Channel Basin after implementation of the Priority Project, rather than as part of the Northeast and Southwest Drainage Basins, as planned in the World Bank and FINNIDA Projects.
3) Evaluation by Means of Operation Indicators
(a) Total Storage Capacity of An Kim Hai Channel
This data refers to the storage capacity of AKH Channel when the channel would be empty until the channel would be completely full (i.e. from bottom to top). This data is considered as only indicative, because it does not consider minimum and maximum regulated water levels in the channel.
Before rehab: total storage capacity = 192,000 m3 After rehab: total storage capacity = 375,000 m3
Thus, after rehab the total storage capacity is about 95 % greater than the total storage capacity before rehab.
(b) Hydraulic Conveyance of An Kim Hai Channel
This data is based on the Manning Equation and is defined mathematically as follows:
Conveyance = (1/n)*A*R^(2/3)
where A is the flow area, R is the hydraulic radius, and n is the Manning energy loss coefficient.
Hydraulic conveyance is a good comparative indicator for the increase in hydraulic capacity, because when it is assumed that the energy losses are equivalent in the comparison, then the hydraulic conveyance represents the flowrate (Q) in the channel.
For the following data, the hydraulic conveyance is based on the total flow area in the channel (i.e. the channel is flowing full). Also, because of different channel conditions, the data represents the "composite" hydraulic conveyance of the channel, when considering the representative channel cross-section for a length of the channel.
Before rehab: composite hydraulic conveyance = 641 After rehab: composite hydraulic conveyance = 2013
Thus, the composite hydraulic conveyance after rehab is 215 % greater than the composite hydraulic conveyance before rehab.

The Study on Sanitation Improvement Plan for Haiphong City, Vietnam
Final Report, Main Report, Volume 2, Part 2
2 - 56
(c) Effective Storage Capacity of Lake System
The effective storage capacity of the lake system is defined as the storage capacity available in the lakes where the water levels in the lakes are regulated according to the minimum and maximum water levels (i.e. the effective storage capacity is the volume of water which can be stored between the minimum and maximum water levels).
For Phuong Luu Lake, the minimum and maximum water levels are +1.5 m and +2.7 m, respectively. For the other lakes, similar data is used given in previous sections.
Before: effective storage capacity of lakes = 500,000 m3 After: effective storage capacity of lakes = 790,000 m3
Thus, after construction of PL Lake, the effective storage capacity of the lakes in the PP target planning area is 58 % greater than the effective storage capacity of the lakes before construction of PL Lake.
(d) Combined storage capacity of the lake and channel
After the rehabilitation of An Kim Hai Channel and Phuong Luu Lake, increase in the combined storage capacity is 183,000 m3 from AKH Channel and 290,000 from PL Lake, with a total increase of 473,000 m3.
8.2. Economic Evaluation
8.2.1 General Principles
The drainage and sewerage priority projects are closely interrelated, and form part of a comprehensive program of environmental improvement in Haiphong, which is being developed with the financial assistance of several external agencies. Due to their close physical interrelationship, and to the nature of their impacts and objectives, it is appropriate for the purpose of project evaluation first of all to analyze the two projects individually, and also to present them as a combined project. This second approach is contained in Part 5 Chapter 2, below.
It is not possible to estimate the economic benefits of the priority drainage project with any accuracy due to inadequacy of data on the various influences on measures such as property values, human health, etc. Justification essentially rests upon qualitative analysis of benefits and engineering cost-effective solutions, combined with affordability tests. In this case it will not be possible to check the cost-effectiveness of the project by comparing costs per beneficiary or other unit cost indicators with international experience, or with that of other Vietnamese cities, due to their essentially location-specific nature.
One reason why economic justification is not easy to demonstrate is the existence of very imperfect markets, which do not permit an effective willingness to pay for
The Study on Sanitation Improvement Plan for Haiphong City, Vietnam
Final Report, Main Report, Volume 2, Part 2
2 - 57
housing, utility services etc. The ability to make informed investment decisions will thus depend to a large extent on the pace of economic policy reform, which will allow greater expression of willingness to pay on the part of ultimate beneficiaries of the services concerned.
The main impact of the selected priority project will be in 1,103 ha. of the Phase 1 Area, although the longer-term impact is likely to extend well beyond this boundary.
Economic evaluation of the project must be assessed in light of its contribution to the long-term development of Haiphong City. This city has been identified as a major growth area by the Vietnamese government, and is expected to grow at a rate substantially greater than that for the country as a whole.
Haiphong City’s unique position as the major port area for Hanoi and the Red River Delta area makes its development of primary national importance. As such, it requires a significant improvement in the basic infrastructure, such as roads, water supply, sewerage, and drainage. All these facilities must be upgraded if Haiphong’s potential is to be fully realized.
The drainage project, as described above, is essentially a public good, the benefits of which are not clearly related to any individual household, consumer or street. Rather, they improve the overall environment throughout the Phase 1 area, by reducing the incidence of flooding, providing adequate drainage for normal rainfall conditions, and by reducing environmental pollution and groundwater contamination of the whole area. These improvements are over and above those provided by on-going projects of other external agencies such as the World Bank and FINNIDA. For example, the drainage project will reduce the frequency of flooding from a two year ARI (to be achieved by the World Bank project) to a five-year ARI flood.
It is clear that high-density, high-value economic development in the Study Area will be greatly assisted by the proposed project, which will effectively increase the availability of usable land, create a recreational lake, and regulate the quantity and quality of waste water and normal runoff.
Although the drainage project will reduce the incidence of flooding of households and commercial establishments and roadways, this is not thought to be the major objective, and avoided damage to existing properties from flooding is believed to be relatively small. The major contribution of the drainage project, in association with the sewerage project, will be to allow the affected area to develop as a modern economic residential and commercial area in a systematic way. For example, it is proposed to build a new medical university at the southern end of the Phase 1 Area. This will be at a location that is currently occupied by a lake that will be drained as part of the project.

The Study on Sanitation Improvement Plan for Haiphong City, Vietnam
Final Report, Main Report, Volume 2, Part 2
2 - 58
If adequate data were available, the economic justification of the projects would as a minimum be revealed by an increase in property values in the affected area, or by an increase in the economic productivity of the affected area, that result from the projects. However, data are not available to predict precisely what these impacts would be.
The method employed in this study is therefore to estimate, as two alternative approaches:
• the percentage increase in property values in the affected area that would be required to offset the costs of the projects
• the percentage increase in the productivity of land in the affected area that would be required to offset the costs of the projects
A judgment can then be made as to whether such percentage increases can reasonably be expected. This is known as the “switching value” method.
It is considered that both of the approaches would yield a minimum estimate of the economic benefits of the projects, as their impacts would no doubt extend well beyond the specific areas concerned, where the direct beneficiaries are located. However it will not be possible to estimate the city-wide, or region-wide, impacts.
In estimating the base (without-project) case for property values and productivity, two alternative assumptions are made, i.e. (a) that there is no economic growth in the Study Area after year 2001, and (b) that economic growth will correspond to the Average Scenario referred to in the Environmental Master Plan Report.
Results of the economic analysis are as follows.
8.2.2 Least-Cost Solution
For the preparation of the long-term plan for drainage improvement as an integral part of SMP, 4 alternatives are formulated; D1, D2, D3 and D4. These alternatives are compared from various aspects including the scope of beneficial impact, technical feasibility and cost-effectiveness. Consequently, D2 has been selected. The proposed Drainage Priority Project is the phase 1 or the first phase of the proposed D2 alternative.
Among the 4 alternatives, target area of D1 is smaller, not covering the old city center while the other 3 have the same target area. Out of the 3 alternatives excluding D1, D2 has the smallest investment cost per beneficiary or about 72 % of the second least-costly. The conclusion will not be affected when comparison is made in terms of the overall cost including O&M cost because O&M cost is small compared with the investment cost and its ratio to the investment cost is about the same for all of the alternatives.
The Study on Sanitation Improvement Plan for Haiphong City, Vietnam
Final Report, Main Report, Volume 2, Part 2
2 - 59
8.2.3 Economic Feasibility
The following describes the method used to determine the base case property value and productivity indicators, and alternative assumptions about these indicators in future years. Details of the calculations, as well as of the results of the “switching value” exercise, are presented in Tables 2.8.1 and 2.8.2, attached.
(1) Base Case Property Values and Urban Productivity
1) Property Values: “No Growth” Scenario
Property values in Phase 1 area are derived from Study Team estimates of land values, based upon data supplied by the Haiphong City Finance Department, and updated to year 2000 prices, and which total US$403.7 million. To this is added estimates of the value of buildings and movable property which might be threatened by flooding, which are based upon a survey conducted for the World Bank Three Cities Sanitation Project, and applicable to the Phase 1 area. Updating to 2000 prices, the present value of these properties is estimated at US$480.4 million. (Underlying data and assumptions for this calculation: population of Phase 1 area 238,425; average number of persons per household 4.5; average size per house including commercial areas property 55 m2; value of property US$157 per m2).
Total current value of properties in the Phase 1 area, assumed to be the same in the 2003 base year for the “No Growth” case, is therefore US$884.1 million.
It is considered that as soon as the project is started, property values would start to increase in anticipation of the benefits it would bring. Property values therefore date from the 2003 base year in these calculations.
2) Property Values: “Average Growth” Scenario
It is probable that property values in Haiphong will increase in real terms in the future, as urbanization expands. It is assumed here that property values will increase at the same rate as Haiphong’s overall GRP, under the “Average Growth” scenario presented in the Sanitation Master Plan Report.
Under the Average Growth scenario, the present value of properties in the Phase 1 area (at 10 %, with a 2003 base year) is estimated at US$1,864.3 million.
3) Urban Productivity: ”No Growth” Scenario
Current (year 2000) productivity, or value added, or GRP, per capita in the Phase 1 area is assumed to be the same as that for the non-agricultural population in the Study Area as a whole, i.e. US$742 in 2000 prices. With a current potential beneficiary population of 238,425, the total productivity of

The Study on Sanitation Improvement Plan for Haiphong City, Vietnam
Final Report, Main Report, Volume 2, Part 2
2 - 60
the area is US$176.9 million (corresponding to about US$160,000/ha). This is the base case figure for the “No Growth” scenario. The present value of GRP in Phase 1 over the 20-year period 2003-2023, using a 10 % discount rate, and with 2003 as the base year, is estimated at US$1,346 million. The calculations relating to productivity assume that benefits will begin to accrue halfway through total project completion, i.e. 2006.
4) Productivity Per Hectare: “Average Growth” Scenario
Average growth of productivity per hectare is assumed to be at the same rate as that presented in the Sanitation Master Plan Report. Under this assumption, the present value of GRP in Phase 1 over the 20-year period 2003-2023, using a 10 % discount rate, and with 2003 as the base year, is estimated at US$3,133 million. (As before, productivity benefits are assumed to begin to accrue in 2006).
(2) Economic Feasibility of the Priority Drainage Project: Impact on Property Values and Productivity
The costs of the drainage project as shown above are now compared with the two selected indicators to test if the impact required to demonstrate economic justification is in fact likely to be met. The table below shows the costs of the project in relation to the two indicators, i.e. property values and productivity. In each case, present values at a 10 % discount rate, a 20-year time horizon, and a 2003 base year are used.
Cost of Drainage Project as Percentage of Property Values and Productivity in the Project Area
Present Value of the Property or GRP as of 2023 with 2003
as the Base Year (US$ million)
Present Worth of Project Cost (US$ 32.874 million) as % of
Values in Column (b) (a) (b) (c)
Property value – under No Growth case
884 3.7 %
Property value - under Average Growth case
1,864 1.8 %
Project Area GRP value –under No Growth case
1,346 2.5 %
Project Area GRP value– under Average Growth case
3,133 1.1 %
These results appear to provide a reasonable justification for the drainage project, taken in isolation, particularly if the Average Growth scenario is realized. Under the “No Growth” scenario, which is quite conservative, a 3.7 % increase in property values or 2.5 % increase in productivity would be required to indicate project justification. Under the more realistic Average Growth scenario, these percentages fall to 1.8 % and 1.1 % respectively.

The Study on Sanitation Improvement Plan for Haiphong City, Vietnam
Final Report, Main Report, Volume 2, Part 2
2 - 61
The various assumptions and estimates used to address project impacts are adequate as sensitivity tests on the benefit side. Sensitivity of the results to variations in cost estimates is also tested. The following table shows the percentage increases required to demonstrate project justification under three assumptions, namely the base case (as in the preceding table) and where project costs are increased by 10 % and 20 % respectively.
Even with a 20 % cost increase, the increases in property values or productivity required to demonstrate justification continue to be reasonable.
Cost of Drainage Project as Percentage of Property Values and Productivity in the Project Area: Sensitivity to Cost Estimates
Base Case Costs + 10 % Costs + 20 % Property value – under No Growth case
3.7 % 4.1 % 4.4 %
Property value - under Average Growth case
1.8 % 1.9 % 2.2 %
Project Area GRP value –under No Growth case
2.5 % 2.8 % 3.0 %
Project Area GRP value – under Average Growth case
1.1 % 1.2 % 1.3 %
In order to check whether or not the proposed Drainage Priority Project is affordable for HPPC for financing, reference was made to the drainage project that is under construction in the Hanoi city. Comparison between the 2 cases (Hanoi and Haiphong) was made from the viewpoints as shown in the table below:
• Ratio of the total project investment cost to the annual city expenditure. • Ratio of the counterpart fund out of the total investment cost to the annual city
expenditure • Ratio of the annual counterpart fund out of the total investment cost to the
annual city expenditure
It is noted that majority (about 85 %) of the fund requirement for the Hanoi project has been financed by external ODA loan of concessionary conditions, and for Haiphong project similar loan was assumed to be extended. As shown in Item g in the table, financial burden on HPPC to meet the investment cost that is not covered by the loan, is less than half of the Hanoi case in terms of the whole requirement (see Item g below) and about half in terms of annual requirement (see Item h below).
The Drainage Priority project cost is therefore considered affordable to HPPC

The Study on Sanitation Improvement Plan for Haiphong City, Vietnam
Final Report, Main Report, Volume 2, Part 2
2 - 62
Comparison of Hanoi Drainage Project and Haiphong Drainage Project Hanoi Haiphong a. Implementation Period 9 years (1995 – 2003) 7 years (2003 – 2009) b. Total Project Investment US$200.0 million US$55.7 million c. Counterpart fund financed by the City US$31.2 million US$8.4 million d. Annual average counterpart fund (c/a) US$3.5 million US$1.2 million e. City’s Total Expenditure in the mid year of construction period
US$164.5 million in 2000
US$102.4 million in 2006
f. Ratio of Item b to Item e 121 % 54 % g. Ratio of Item c to Item e 19.0 % 8.2 % h. Ratio of Item d to Item e 2.1 % 1.2 %
Notes: 1. Hanoi city’s total expenditure in 2000 was estimated assuming an exponential expenditure
growth between two years of which data were available to the JICA Study Team (US$156.7 million in 1999, and 172.1 million in 2001) Original amount was indicated in Japanese yen. Yen amounts were converted into US$ using an exchange rate of 110 yen/US$ which seems to be average and dominant rate considering that the rates have ranged from 100 yen/US$ to 120 yen/US$ since 1995 up to present.
2. All other data were obtained by the JICA Study Team
8.3 Financial Evaluation and Affordability
8.3.1 Affordability: General Principles
Even if a project may pass cost-benefit tests, indicating that the present worth of costs over the lifetime of the project may exceed the benefits, it does not necessarily mean that it is financially feasible, or affordable, particularly in the short to medium term. This applies to each of the components of the Sanitary Master Plan individually, the relevant analysis becoming even more important when an investment package, comprising in this case of drainage, sewerage, and solid waste, is considered. Thus while each component of the proposed package of priority projects may be affordable individually, the whole program may not be.
Affordability of the environmental program for Haiphong City as a whole, of which the priority projects are an integral part, has been estimated in the Sanitary Master Plan Report, in which general assumptions were made about loan conditions (25 years, 5% interest). This represented the general financial opportunity costs of the program to the country as a whole, and related to possible concessionary and non-concessionary lending from a variety of sources, which have not been identified.
Results of the Master Plan study suggested that the proposed program would satisfy affordability criteria on an aggregate basis, as long as the basic assumptions about economic growth and cost estimates are realized. In particular, the viability of the program is extremely dependent upon the rate of economic growth in Haiphong. Analysis in this volume more precisely relates costs of individual programs to the capacity to pay of specific beneficiary groups, rather than the Study Area as a whole.

The Study on Sanitation Improvement Plan for Haiphong City, Vietnam
Final Report, Main Report, Volume 2, Part 2
2 - 63
Because the priority drainage project is part of a comprehensive on-going program of drainage investments, financed by other donors as well, affordability of the priority drainage project in isolation is not meaningful. Rather, affordability must be judged in light of the costs of the overall drainage program for the city. Similar estimates will be made subsequently for the priority sewerage and solid waste projects.
Key economic and population indicators for this purpose are presented in Table 2.8.3. The population indicators refer to the whole of Haiphong City, or the Study Area, as defined in the Environmental Master Plan report, Volume 1.
Relevant indicators for judging affordability with regard to the whole population of the Study Area, and for Haiphong City, which are applicable not only to drainage, but also sewerage and solid waste, are as follows:
Per capita GRP in areas benefiting from the program. This provides an indicator of the feasibility of the programs in terms of the overall economic capacity of the concerned community to pay for the services.
Per capita disposable income of direct beneficiaries. This provides an indicator of the financial feasibility of direct beneficiaries to pay, out of their discretionary household incomes, for the services provided. This information is important in a strategic policy sense. Thus, even though costs of certain services may be low when compared with GRP, this may not be so when household disposable incomes are concerned. This applies in particular to services which should ideally be financed by recovery of costs from actual beneficiaries. (As noted below, this applies primarily to sewerage and solid waste rather than to drainage). If the proportion of GRP that is received as disposable income is low, this may frustrate the objective of decentralization. The relationship between the costs of the environmental program and disposable incomes thus provides some indication as to how realistic the prospects are for the effective autonomy of the utilities concerned.
Total HPPC expenditures. This provides an indication of the fiscal feasibility of the proposed programs for Haiphong City government. This is important for solid waste and for sewerage and drainage, even though an increasing proportion of costs is to be recovered in the form of user charges or fees.
Growth rates for the economic indicators listed above correspond to the Average Growth scenario described in Volume 1 of this report.
8.3.2 Affordability of Drainage Program
Results for the drainage program are summarized in the following two tables. In column (2) of the first table, investment costs are amortized, thereby showing how much it will cost, year by year, to repay loans required to finance the program. It is assumed here that funds will be borrowed on terms that correspond on average to
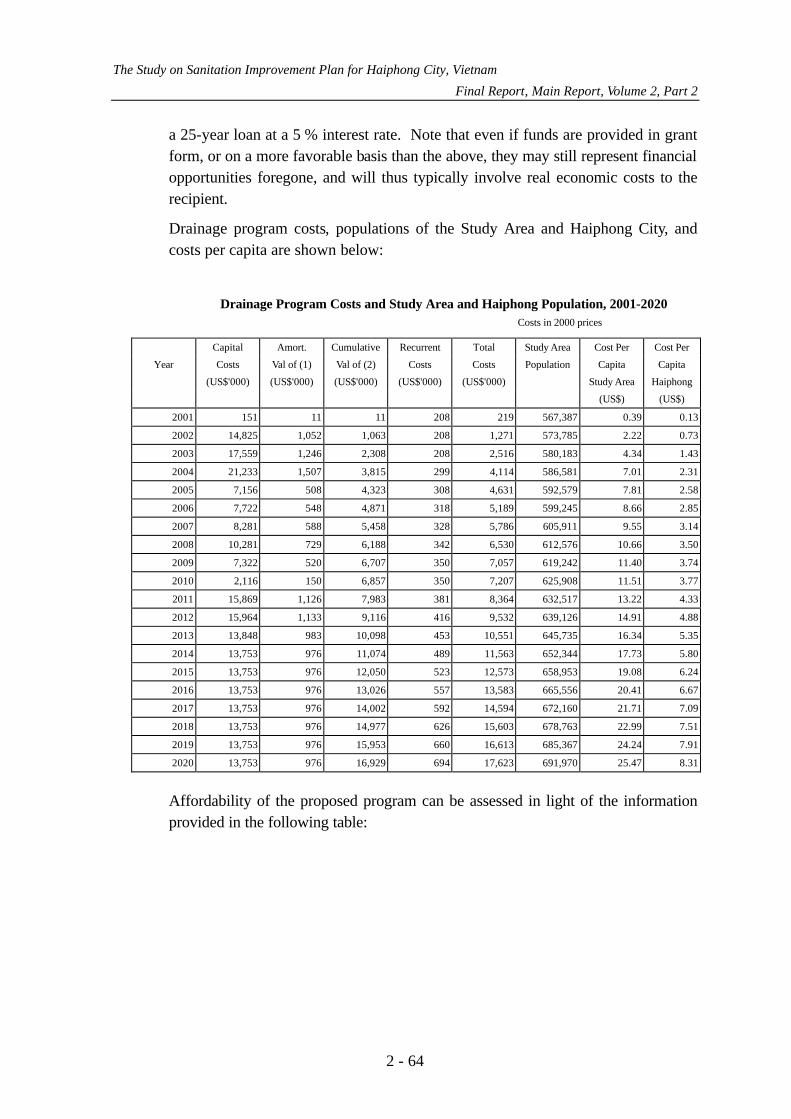
The Study on Sanitation Improvement Plan for Haiphong City, Vietnam
Final Report, Main Report, Volume 2, Part 2
2 - 64
a 25-year loan at a 5 % interest rate. Note that even if funds are provided in grant form, or on a more favorable basis than the above, they may still represent financial opportunities foregone, and will thus typically involve real economic costs to the recipient.
Drainage program costs, populations of the Study Area and Haiphong City, and costs per capita are shown below:
Drainage Program Costs and Study Area and Haiphong Population, 2001-2020
Costs in 2000 prices
Capital Amort. Cumulative Recurrent Total Study Area Cost Per Cost Per
Year Costs Val of (1) Val of (2) Costs Costs Population Capita Capita
(US$'000) (US$'000) (US$'000) (US$'000) (US$'000) Study Area Haiphong
(US$) (US$)
2001 151 11 11 208 219 567,387 0.39 0.13
2002 14,825 1,052 1,063 208 1,271 573,785 2.22 0.73
2003 17,559 1,246 2,308 208 2,516 580,183 4.34 1.43
2004 21,233 1,507 3,815 299 4,114 586,581 7.01 2.31
2005 7,156 508 4,323 308 4,631 592,579 7.81 2.58
2006 7,722 548 4,871 318 5,189 599,245 8.66 2.85
2007 8,281 588 5,458 328 5,786 605,911 9.55 3.14
2008 10,281 729 6,188 342 6,530 612,576 10.66 3.50
2009 7,322 520 6,707 350 7,057 619,242 11.40 3.74
2010 2,116 150 6,857 350 7,207 625,908 11.51 3.77
2011 15,869 1,126 7,983 381 8,364 632,517 13.22 4.33
2012 15,964 1,133 9,116 416 9,532 639,126 14.91 4.88
2013 13,848 983 10,098 453 10,551 645,735 16.34 5.35
2014 13,753 976 11,074 489 11,563 652,344 17.73 5.80
2015 13,753 976 12,050 523 12,573 658,953 19.08 6.24
2016 13,753 976 13,026 557 13,583 665,556 20.41 6.67
2017 13,753 976 14,002 592 14,594 672,160 21.71 7.09
2018 13,753 976 14,977 626 15,603 678,763 22.99 7.51
2019 13,753 976 15,953 660 16,613 685,367 24.24 7.91
2020 13,753 976 16,929 694 17,623 691,970 25.47 8.31
Affordability of the proposed program can be assessed in light of the information provided in the following table:

The Study on Sanitation Improvement Plan for Haiphong City, Vietnam
Final Report, Main Report, Volume 2, Part 2
2 - 65
Affordability of the Drainage Program, 2001-20: Costs as Percentage of Key Indicators
values in 2000 prices Year Total Total Cost Total Cost Total Cost Total Cost Annual
Cost as % of as % of as % of as % of Per Cap. Study Area Haiphong HPPC Study Area Cost in GRP GRP Exp. Disp. Inc. Study Area (US$'000) (%) (%) (%) (%) (US$)
2001 219 0.05 0.03 0.34 0.10 0.39
2002 1,271 0.27 0.17 1.87 0.54 2.22
2003 2,516 0.50 0.31 3.46 1.00 4.34
2004 4,114 0.76 0.48 5.33 1.53 7.01
2005 4,631 0.81 0.51 5.66 1.61 7.81
2006 5,189 0.80 0.51 5.70 1.59 8.66
2007 5,786 0.79 0.52 5.78 1.59 9.55
2008 6,530 0.81 0.54 5.97 1.62 10.66
2009 7,057 0.80 0.54 5.95 1.59 11.40
2010 7,207 0.75 0.51 5.64 1.50 11.51
2011 8,364 0.82 0.55 6.16 1.63 13.22
2012 9,532 0.88 0.60 6.62 1.76 14.91
2013 10,551 0.92 0.63 6.94 1.84 16.34
2014 11,563 0.96 0.65 7.23 1.92 17.73
2015 12,573 0.99 0.67 7.48 1.99 19.08
2016 13,583 1.02 0.69 7.71 2.05 20.41
2017 14,594 1.05 0.71 7.93 2.11 21.71
2018 15,603 1.08 0.73 8.12 2.16 22.99
2019 16,613 1.10 0.75 8.30 2.20 24.24
2020 17,623 1.12 0.76 8.46 2.25 25.47
Note: Investment costs on amortized basis.
This table suggests that the drainage program satisfies the affordability criteria. Since the drainage program is essentially a public good, the most relevant indicators for affordability are GRP per capita of actual beneficiaries (i.e. those living in the Study Area), per capita for Haiphong City as a whole, or HPPC expenditure.
The results are sensitive to the assumptions made about economic growth. Table 2.8.4 shows the results of the foregoing type of analysis if economic growth is half of that estimated above, and costs increase by 10 % and 20 %. Under these conditions, the cost of the program would increase from 0.75 % to 1.33 % of Study Area GRP in 2010, and from 5.6 % to 9 % of HPPC expenditures in that year. Continual monitoring of key economic indicators will be required in order to assess affordability as the program is developed.

The Study on Sanitation Improvement Plan for Haiphong City, Vietnam
Final Report, Main Report, Volume 2, Part 2
2 - 66
8.3.3 Funding Requirements and Financing Plan
In practice, the issue of affordability is eased by the prospect of loans from external development agencies at subsidized rates. If these can be obtained, costs per beneficiary and as a proportion of various income measures would fall significantly. It is therefore proposed that external assistance should be obtained for the priority project. It is assumed that funding will be available on the following terms:
• Interest rate for construction and procurement 1.3 %, and for engineering 0.75 %
• Funding available for 85 % of project costs, repayable over 30 years after a 10-year grace period, during which time interest only is paid
Table 2.8.5 shows the repayment schedule and total financial burden under these conditions. The Average Growth Scenario and base case project costs (in current prices) are assumed.
It is also assumed that the responsibility for repayment of loans for the selected priority projects ultimately rests with HPPC. If so, Table 2.8.5 shows the percentage of HPPC expenditure that would be required to repay the loan, plus the associated recurrent costs of the projects. In addition, HPPC would have to fund the 15 % of project costs not financed by the external lender.
The table shows that during the project construction period, when 15 % of project costs must be found in cash terms, the financial burden for HPPC is relatively high, with maximum cash payment of US$2.6 million in 2004, corresponding to 3.1 % of predicted HPPC expenditures in the same year. These funds might be obtained from increased user charges, or at the expense of other HPPC programs, or possibly by support from the national government. When actual loan repayment begins, i.e. in 2013, the financial burden peaks again, rising to about 1.5 % at its maximum.
8.4 Technical Evaluation
Drainage Priority Project mainly comprises the rehabilitation of An Kim Hai channel, construction of Phuong Luu lake, construction of a connecting channel between the lake and Northeast Channel, construction of a box culvert between the lake and An Kim Hai channel, construction of two tidal gates, and construction of two discharge gates.
Construction of the Drainage Priority Project will be by means of the traditional method and require no peculiar and advance technology. O&M of the project facility themselves will not accompany any advanced skills.
The project facility has dual functions of storm water drainage and irrigation. Tidal influence to the An Kim Hai Channel must be avoided. To serve these objectives,
The Study on Sanitation Improvement Plan for Haiphong City, Vietnam
Final Report, Main Report, Volume 2, Part 2
2 - 67
the recommended gates must be controlled, i.e., closing and opening properly and timely. An appropriate instruction manual is essential for the operation of these project facility together with other related facility including 2 drainage pumping stations, one at the Cam River and the other at Lach Tray River. The established operation rules should duly be observed.
Together with these efforts, the Drainage Priority Project is considered to be technically feasible.
8.5 Environmental Impact Assessment
8.5.1 Environmental Impacts of Drainage Project
The main impacts of the proposed project are described for the design phase, construction phase and operation phase. An alternative without the project implementation has also been described. Details of the EIA and mitigating measures are described in the Supporting Report, Part C.
The proposed drainage project is expected to have the following positive impacts: (i) improvement of drainage system, (ii) reduction of flood problems, (iii) improvement of public health condition, and (iv) improvement of landscape.
The biggest adverse impacts during the project implementation are: (i) land acquisition and resettlement of about 1300 households, (ii) transportation and disposal of dredged material, and (iii) general nuisance during dredging, excavation and transportation, including dust, noise and offensive odor.

The Study on Sanitation Improvement Plan for Haiphong City, Vietnam
Final Report, Main Report, Volume 2, Part 2
2 - 68
Assessment of Advantages and Disadvantage of Project to Living Environment
Cause Time Scale Need for mitigation
Positive Negative Land acquisition and resettlement - - - Long-term Yes Odor during dredging and sludge disposal site - - - Temporary Yes Noise during construction - - Temporary Yes Dust during construction work - - Temporary Yes Traffic jam during construction - - Temporary Yes Relocation of structures (power lines, underground pipes etc)
- Temporary Yes
Risk of soil and groundwater contamination during construction and sludge disposal
- Temporary Yes
Safety for worker - Temporary Yes Influences on spiritual and cultural values + - Temporary No Sludge recycle and reuse for landscaping + Temporary No Usage of sludge as fertilizer + Temporary No Employment creation + Temporary No Reduction of pollution to water supply system + Long-term No Enhancement of storage capacity of regulation lake + + Long-term No Aesthetic improvement + + Long-term No Reduction of water related diseases + + Long-term No Health improvement + + Long-term No Reduction of losses due to flood + + Long-term No Improvement of hydraulic condition in the channel + + + Long-term No Reduction of flood + + + Long-term No Legend: - - - Very negative - - Negative - Less negative + Less positive + + Positive + + + Very Positive
The table above shows that the positive aspects of the project exceed the negative ones. Most of the negative impacts are temporary and short time while the positive impacts are long-term.
The major environmental impacts from dredging of An Kim Hai Channel and construction of Phuong Luu Lake are presented in more detail in Table 2.8.6.
The Without-Project alternative is to leave the project unimplemented (i.e., do-nothing alternative). In that case, the current environmental pollution will increase as follows:
• No changes or even increase of frequent floods along the upper parts of An Kim Hai Channel will create more and more human and infrastructure losses such as degradation of roads, houses, water supply system etc.
• Increase of solid waste and sedimentation in the channel will further obstruct the water flow, increase the current pollution in the channel, increase offensive odors and insects, and increase possibility of disperse water related diseases
8.5.2 Mitigation Measures for Drainage Project
(1) General Instructions
Environmental matters have to be integrated in all the design work and planning of the project. The designing has to be done by minimizing the adverse impacts on

The Study on Sanitation Improvement Plan for Haiphong City, Vietnam
Final Report, Main Report, Volume 2, Part 2
2 - 69
environment using as much as possible existing facilities and selecting the location of new facilities in areas where the disturbance to environment, people and existing structures is the smallest. Where possible, existing rights-of-way has to be used rather than create new ones.
Mitigation measures are given separately for design phase, construction phase and operation phase. The most important activity is to arrange land acquisition, resettlement and site-clearance during design and pre-construction phase. During construction phase special attention should be paid to minimize the adverse impacts from dredging, transportation and disposal of dredged material from An Kim Hai Channel. More detailed information is presented in Table 2.8.6.
(2) Mitigation Measures during Design Phase
1) Land Acquisition and Resettlement Sites
A detailed measurement survey has to be conducted and the exact number and type of houses and infrastructure to be relocated has to be identified. Land acquisition and resettlement has to be done according to the approved resettlement procedures described in Resettlement Action Plan (RAP) to be prepared during or before the detailed design phase of the project. The RAP should include a public relation program, and the affected residents should be informed about the potential need for resettlement in the earliest possible stage of the project. The Study Team strongly recommends that RAP should be undertaken as early as possible.
The preliminary estimation for the needed resettlement area is 5 – 8 ha depending on the type of houses to be constructed. In accordance with the SADCO’s plan, two resettlement sites are proposed, one along Highway No. 5 and one south of Phuong Luu Lake. The third possible option is development of resettlement area around the proposed Phuong Luu Lake. Yet another option is to develop area along the An Kim Hai Channel in the southeast, that is along the down stream reach of the channel. This area is not yet developed much. Location and size of resettlement areas has to be decided during the detailed design phase, and design the necessary infrastructure and other structures.
2) Channel Dredging Design
The channel dredging has to be designed so that the need of site clearance and resettlement is minimized, therefore the widest option was not selected. However, the width of the maintenance roads (margins) along the channel should be wide enough to allow efficient maintenance of the channel and to control encroachment.

The Study on Sanitation Improvement Plan for Haiphong City, Vietnam
Final Report, Main Report, Volume 2, Part 2
2 - 70
In the selection of the dredging method, special attention has to be paid to constraints imposed by the wide range of channel cross-sections, the access limitations for conventional plant and machinery, the availability of suitable sites for sludge disposal, and the operational procedures required for Employer, to improve the situation.
The hydraulic capacity of the existing channel is not adequate, the channel will be widened to achieve an adequate flow transmission capacity. The channel banks will be lined with revetment and some new crossing bridges will be provided under the project as supporting components.
(3) Mitigation Measures during Construction Phase
1) General Instructions
The general instructions concerning working conditions, prevention of noise, odor, litter and dust during works, protection of water and sediment, health and safety, and public relations mentioned in the project documents have to be followed.
2) Dredging, Transportation and Disposal of Sludge
The drainage channel should be dredged during the dry season. The release of heavy metals, possible organic micro-pollutants and loose sediments to the downstream during dredging works has to be minimized by preventing water discharge into the channels.
Sludge disposal can be done in temporary disposal sites located on wasteland or agricultural land downstream of An Kim Hai Channel in section 5. According to the analyzing results there is no need of special treatment of sludge. To minimize odor, mixing with other material is recommended. Protection strips have to be designed around sludge disposal area to separate it from the surroundings.
(4) Mitigation Measures during Operation Phase
The environmental impacts will be minor during operation phase and no special mitigation measures are needed.

The Study on Sanitation Improvement Plan for Haiphong City, Vietnam
Final Report, Main Report, Volume 2, Part 2
2 - 71
(5) Summary of Mitigation Measures for Drainage Project
Phase Main mitigation measures Responsible organization
Design International and Vietnamese design criteria and standards to be used Maintenance roads designed so that need for resettlement is minimized Works designed to implemented during dry season
Design Consultant
Construction Minimize dust, odor, litter, noise and traffic emissions by good operation management and site supervision Appropriate working methods have to be followed Sites have to be kept clean and safe during and after the work Safety and health regulations have to be strictly followed Protective clothing and operational training for workers is essential Sludge disposal on a wasteland downstream of An Kim Hai Channel or other appropriate site should be arranged Transportation has to be minimized and routes selected to avoid public nuisance Transportation during rush hours and night has to be avoided Tight and proper equipment to transport sludge has to be used to avoid accidental spills and odor nuisances Construction sites and time have to be informed to the local people in advance
Contractor
O&M Minimize dust, odor, litter, noise and traffic emissions by good operation management and site supervision Appropriate working methods have to be followed Sites have to be kept clean and safe during and after the work Safety and health regulations have to be strictly followed Protective clothing and operational training for workers is essential Sludge should be disposed of in an environmentally-sound manner at a designated disposal site Transportation has to be minimized and routes should be selected to avoid public nuisance
PIO
8.5.3 Evaluation of the Impacts with the Counter-Measures
Impacts of the project will be monitored in every phase according to the monitoring program (see Supporting Report).
Implementation of smooth land acquisition and resettlement will need good co-operation between local authorities and project affected people. However, the Vietnamese resettlement procedures give good basis to minimize the problems.
Environmental impacts caused by dredging, transportation and disposal of dredged sludge can be minimized to the acceptable levels with good site management and using proper equipment and working methods.

The Study on Sanitation Improvement Plan for Haiphong City, Vietnam
Final Report, Main Report, Volume 2, Part 2
2 - 72
8.6 Organizational Setup and Capability of the Implementing and Managing Bodies
8.6.1 Recommended Organizational Setup
In the Study, the following implementation setup is recommended for the efficient implementation of the Drainage Priority Project.
(1) One Project Management Unit (PMU) should be set up which will be responsible for the 2 priority projects of Sewerage Priority Project and Drainage Priority Project, considering: • Same regulatory and supervising body, i.e., TUPWS and same managing
and O&M body is responsible for both priority projects • Facility and function of both are closely related and dependant on each
other • Timing of the implementation is expected to be about the same
The PMU will assume the prime responsibility of the project implementation including tendering, construction supervision and other related works. TUPWS will be responsible for giving necessary instruction to PMU for smooth implementation when deemed necessary. SADCO will extend assistance for daily works of PMU when deemed necessary.
Drainage Priority Project will involve a sizable amount of resettlement of people for the rehabilitation of An Kim Hai channel. Land Acquisition and resettlement will be carried out in accordance with Decree No.22/1998/ND-CP (1998) and other relevant regulations. A Resettlement Committee will be established in Haiphong PC. The committee will be chaired by a Vice Chairman of the Haiphong PC, and committee members will comprise representatives from Project Implementing Organization (PIO), district and/or phuong-level PCs, Land Administration Dept., Finance Dept., Dept. Construction, DPI, other relevant organizations as well as representatives from Project Affected People (PAP). Under the city-level Resettlement Committee, district/phuong-level Resettlement Committees will also be established. It is the district/phuong-level Resettlement Committees and PIO that work closely with PAPs, while city-level Resettlement Committee will serve as the guiding and decision-making body. In order to ensure smooth land acquisition/resettlement, a detailed Resettlement Action Plan (RAP) should be developed in the early stage of the Detailed Design.
After entering the O&M stage, SADCO will manage the project including all the O&M works.
8.6.2 Capability of the Implementing Body
Sizable scale projects has been implemented in the recent years in the field of sanitation improvement, i.e., water supply (1A) and drainage ( 1B). In the latter
The Study on Sanitation Improvement Plan for Haiphong City, Vietnam
Final Report, Main Report, Volume 2, Part 2
2 - 73
case, the same implementation setup was adopted, i.e., PMU, TUPWS and SADCO and the project is successfully being implemented. Before the start of the Priority Projects, a few more projects are expected to be implemented in the same manner.
Haiphong PC has already carried out the land acquisition/resettlement for HWY 5 Project, and is about to undertake the land acquisition/resettlement for Rehabilitation of NE and SW Channel (World Bank 1B Project), which is very similar to the proposed drainage project.
Assuming strenuous efforts to be made together with the experience to be accumulated, it is expected that HPPC will develop adequate capability to carry out the land acquisition and resettlement by the time of implementation.
Considering the above, it is considered that the Drainage Priority Project can successfully be implemented by the recommended implementation setup.
8.6.3 Capability of the Managing Body
To date, SADCO has experience in managing the drainage system of combined sewers. The Drainage Priority Project, however, is a more comprehensive project comprising various facility including combined sewers, An Kim Hai channel with dual functions of drainage and irrigation, regulating lake, gates and others. It is recommended in the Study that new sections should be created within SADCO for O&M of the drainage facility together with the increase of staffs and provision of adequate manpower training. Before the implementation of Drainage Priority Project, 1B project is scheduled to be implemented which mainly comprises cleaning and rehabilitation as well as new construction of combined sewers and some experience is expected to be obtained. In Hanoi and Ho Chi Minh city, large scale drainage projects are under implementation. These experience and knowledge will be valuable for the implementation of the Drainage Priority Project in Haiphong.
If all the recommended organizational reinforcement and manpower training as well as other efforts to strengthen their capability are realized, SADCO is considered to be capable of managing the Drainage Priority Project.

The Study on Sanitation Improvement Plan for Haiphong City, Vietnam
Final Report, Main Report, Volume 2, Part 2
2 - 74
8.7 Overall Project Evaluation
The Drainage Priority Project will meet the primary objective of the sanitation and environment improvement for the project area as well as for the city by reducing the flood incidence in the central part of the city. Public health will be enhanced through the reduction of the water-borne diseases. Pollution load inflow into the water bodies will be decreased, resulting in the water quality improvement of the ambient waters.
From an economic point of view, the expected contribution of Drainage Priority Project to the economic growth in the future in terms of GRP growth and property value increase can justify the investment cost incurred to implement the project. The project cost is considered within the affordable range of the HPPC/Government in terms of the annual equivalent cost of the project assuming sinking fund with the condition of 5 % annual interest rate and 25 year repayment period. From a financial viewpoint, the assumed concessionary loan is repayable by HPPC/Government.
From a technical feasibility viewpoint, no difficulty is expected in the construction and manufacturing of the project facility. Assuming the recommended organizational strengthening including the setting up of new sections for drainage control as well as adequate training of the staff, operation and maintenance can effectively be carried out by SADCO.
Vigorous efforts of HPPC will be required to implement the resettlement project needed for the An Kim Hai rehabilitation project. Resettlement Action Program should be formulated to alleviate the negative social impact and secure the cooperation of the project affected people. Dredged sludge should be disposed of in an environmentally sound manner. Assuming these efforts, Drainage Priority Project is considered as socially acceptable.
In conclusion, Drainage Priority Project is evaluated to be feasible for implementation.
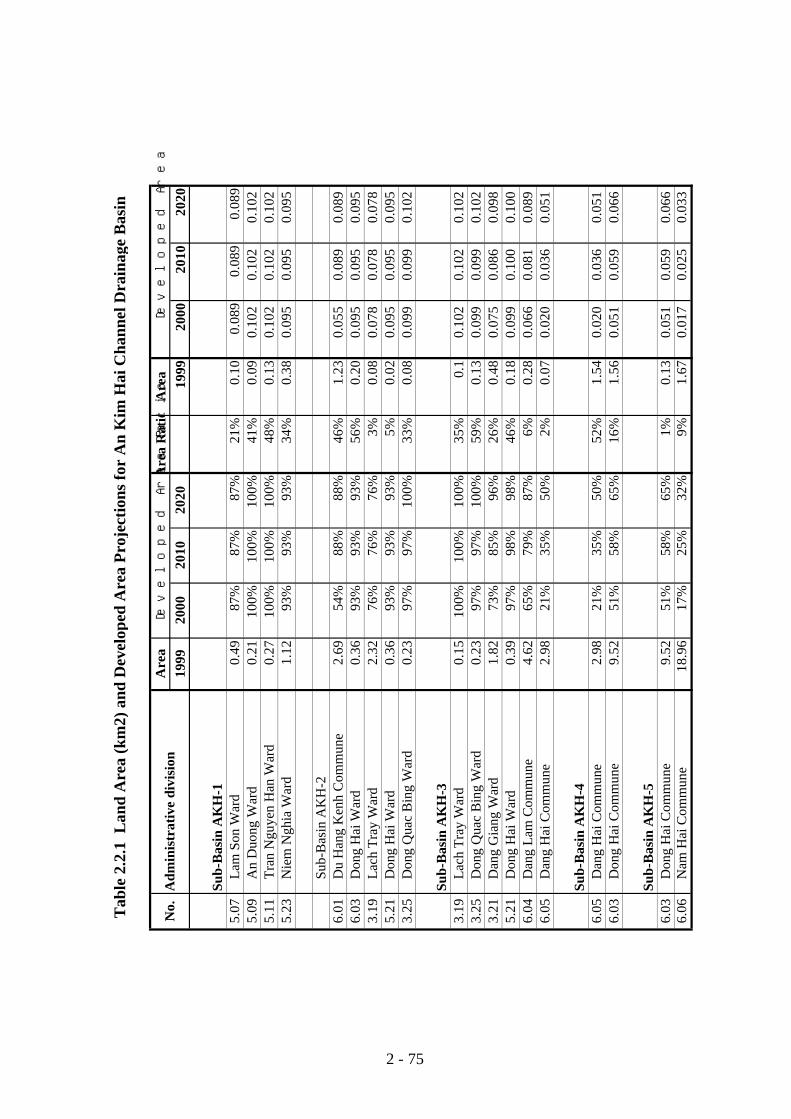
Tab
le 2
.2.1
Lan
d A
rea
(km
2) a
nd D
evel
oped
Are
a Pr
ojec
tions
for
An
Kim
Hai
Cha
nnel
Dra
inag
e B
asin
Are
aA
rea
Rat
ioA
rea
1999
2000
2010
2020
1999
2000
2010
2020
Sub-
Bas
in A
KH
-15.
07L
am S
on W
ard
0.49
87%
87%
87%
21%
0.10
0.08
90.
089
0.08
95.
09A
n D
uong
War
d0.
2110
0%10
0%10
0%41
%0.
090.
102
0.10
20.
102
5.11
Tra
n N
guye
n H
an W
ard
0.27
100%
100%
100%
48%
0.13
0.10
20.
102
0.10
25.
23N
iem
Ngh
ia W
ard
1.12
93%
93%
93%
34%
0.38
0.09
50.
095
0.09
5
Sub-
Bas
in A
KH
-26.
01D
u H
ang
Ken
h C
omm
une
2.69
54%
88%
88%
46%
1.23
0.05
50.
089
0.08
96.
03D
ong
Hai
War
d0.
3693
%93
%93
%56
%0.
200.
095
0.09
50.
095
3.19
Lac
h T
ray
War
d2.
3276
%76
%76
%3%
0.08
0.07
80.
078
0.07
85.
21D
ong
Hai
War
d0.
3693
%93
%93
%5%
0.02
0.09
50.
095
0.09
53.
25D
ong
Qua
c B
ing
War
d0.
2397
%97
%10
0%33
%0.
080.
099
0.09
90.
102
Sub-
Bas
in A
KH
-33.
19L
ach
Tra
y W
ard
0.15
100%
100%
100%
35%
0.1
0.10
20.
102
0.10
23.
25D
ong
Qua
c B
ing
War
d0.
2397
%97
%10
0%59
%0.
130.
099
0.09
90.
102
3.21
Dan
g G
iang
War
d1.
8273
%85
%96
%26
%0.
480.
075
0.08
60.
098
5.21
Don
g H
ai W
ard
0.39
97%
98%
98%
46%
0.18
0.09
90.
100
0.10
06.
04D
ang
Lam
Com
mun
e4.
6265
%79
%87
%6%
0.28
0.06
60.
081
0.08
96.
05D
ang
Hai
Com
mun
e2.
9821
%35
%50
%2%
0.07
0.02
00.
036
0.05
1
Sub-
Bas
in A
KH
-46.
05D
ang
Hai
Com
mun
e2.
9821
%35
%50
%52
%1.
540.
020
0.03
60.
051
6.03
Don
g H
ai C
omm
une
9.52
51%
58%
65%
16%
1.56
0.05
10.
059
0.06
6
Sub-
Bas
in A
KH
-56.
03D
ong
Hai
Com
mun
e9.
5251
%58
%65
%1%
0.13
0.05
10.
059
0.06
66.
06N
am H
ai C
omm
une
18.9
617
%25
%32
%9%
1.67
0.01
70.
025
0.03
3
No.
Adm
inis
trat
ive
divi
sion
Dev
elop
ed A
rea
Rat
ioD
evel
oped
Are
a
2 - 75
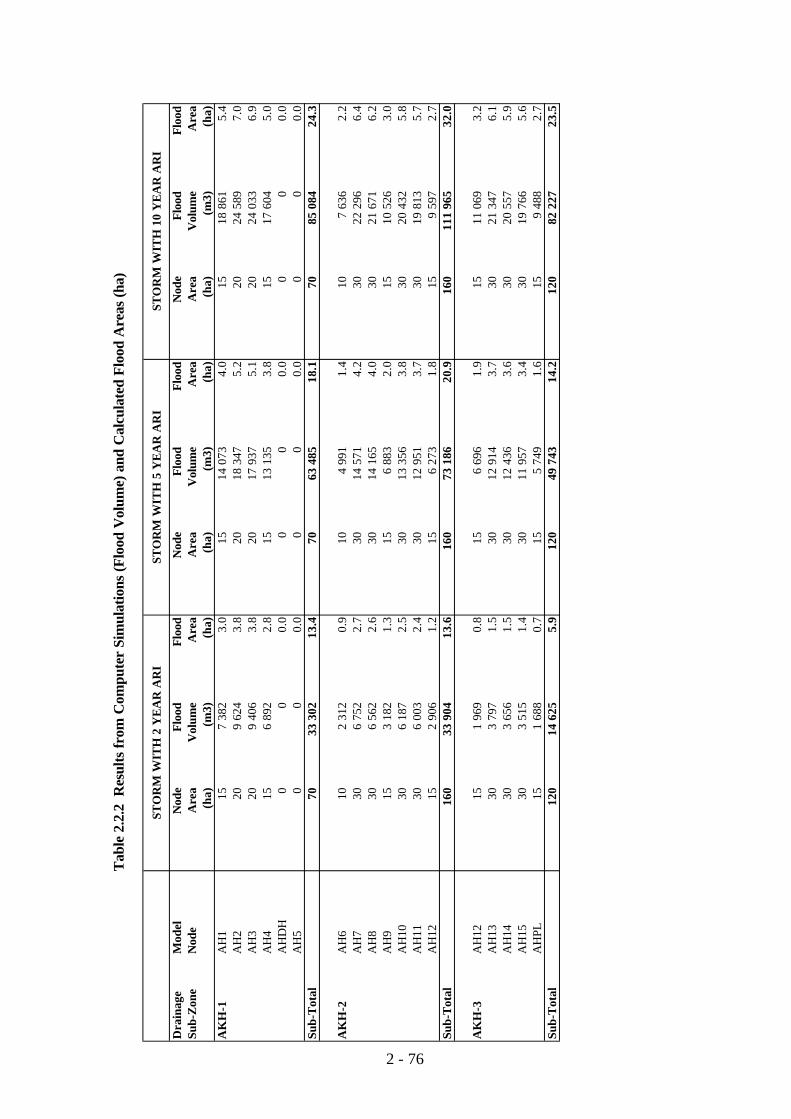
Tabl
e 2.
2.2
Res
ults
from
Com
pute
r Si
mul
atio
ns (F
lood
Vol
ume)
and
Cal
cula
ted
Floo
d A
reas
(ha)
STO
RM
WIT
H 2
YE
AR
AR
IST
OR
M W
ITH
5 Y
EA
R A
RI
STO
RM
WIT
H 1
0 Y
EA
R A
RI
Dra
inag
eM
odel
Nod
eFl
ood
Floo
dN
ode
Floo
dFl
ood
Nod
eFl
ood
Floo
dSu
b-Z
one
Nod
eA
rea
Vol
ume
Are
aA
rea
Vol
ume
Are
aA
rea
Vol
ume
Are
a(h
a)(m
3)(h
a)(h
a)(m
3)(h
a)(h
a)(m
3)(h
a)A
KH
-1A
H1
157
382
3.0
1514
073
4.0
1518
861
5.4
AH
220
9 62
43.
820
18 3
475.
220
24 5
897.
0A
H3
209
406
3.8
2017
937
5.1
2024
033
6.9
AH
415
6 89
22.
815
13 1
353.
815
17 6
045.
0A
HD
H0
00.
00
00.
00
00.
0A
H5
0 0
0.0
0 0
0.0
0 0
0.0
Sub-
Tot
al70
33 3
0213
.470
63 4
8518
.170
85 0
8424
.3
AK
H-2
AH
610
2 31
20.
910
4 99
11.
410
7 63
62.
2A
H7
306
752
2.7
3014
571
4.2
3022
296
6.4
AH
830
6 56
22.
630
14 1
654.
030
21 6
716.
2A
H9
153
182
1.3
156
883
2.0
1510
526
3.0
AH
1030
6 18
72.
530
13 3
563.
830
20 4
325.
8A
H11
306
003
2.4
3012
951
3.7
3019
813
5.7
AH
1215
2 90
61.
215
6 27
31.
815
9 59
72.
7Su
b-T
otal
160
33 9
0413
.616
073
186
20.9
160
111
965
32.0
AK
H-3
AH
1215
1 96
90.
815
6 69
61.
915
11 0
693.
2A
H13
303
797
1.5
3012
914
3.7
3021
347
6.1
AH
1430
3 65
61.
530
12 4
363.
630
20 5
575.
9A
H15
303
515
1.4
3011
957
3.4
3019
766
5.6
AH
PL15
1 68
80.
715
5 74
91.
615
9 48
82.
7Su
b-T
otal
120
14 6
255.
912
049
743
14.2
120
82 2
2723
.5
2 - 76

Tab
le 2
.3.1
Lan
d A
rea
(km
2) a
nd D
evel
oped
Are
a Pr
ojec
tions
for
Nor
thea
st a
nd S
outh
wes
t Dra
inag
e B
asin
s
Are
aA
rea
Rat
ioA
rea
1999
2000
2010
2020
1999
2000
2010
2020
Ngo
Quy
en D
istr
ict
3.01
May
To
War
d1.
4874
%74
%74
%17
%0.
260.
188
0.18
80.
188
3.03
May
Cha
i War
d2.
3276
%76
%76
%19
%0.
450.
339
0.33
90.
339
3.05
Van
My
War
d1.
0888
%90
%90
%10
0%1.
080.
951
0.97
50.
975
3.07
Lac
Vie
n W
ard
0.38
96%
96%
96%
100%
0.38
0.36
50.
365
0.36
63.
09C
au T
re W
ard
0.45
100%
100%
100%
100%
0.45
0.45
00.
450
0.45
03.
13G
ia V
ien
War
d0.
2510
0%10
0%10
0%10
0%0.
250.
251
0.25
10.
251
3.15
Cau
Dat
War
d0.
1510
0%10
0%10
0%14
%0.
020.
022
0.02
20.
022
3.17
Le
Loi
War
d0.
2387
%87
%87
%10
0%0.
230.
200
0.20
00.
200
3.19
Lach
Tra
y W
ard
0.67
95%
95%
95%
62%
0.41
0.39
50.
395
0.39
53.
21D
ang
Gia
ng W
ard
1.82
73%
85%
96%
25%
0.45
0.32
90.
381
0.43
23.
23D
ong
Khe
War
d1.
7654
%78
%94
%10
0%1.
760.
948
1.37
41.
650
Le
Cha
n D
istr
ict
5.07
Lam
Son
War
d0.
4987
%87
%87
%0%
0.00
0.00
00.
000
0.00
05.
09A
n D
uong
War
d0.
2110
0%10
0%10
0%0%
0.00
0.00
00.
000
0.00
05.
11T
ran
Ngu
yen
Han
War
d0.
2710
0%10
0%10
0%52
%0.
140.
140
0.14
00.
140
5.13
Ho
Nam
War
d0.
3693
%93
%93
%10
0%0.
360.
335
0.33
50.
335
5.15
Tra
i Cau
War
d0.
3097
%97
%97
%10
0%0.
300.
292
0.29
20.
292
5.17
Du
Han
g W
ard
0.27
100%
100%
100%
100%
0.27
0.27
00.
270
0.27
05.
19H
ang
Ken
h W
ard
0.37
100%
100%
100%
100%
0.37
0.37
00.
370
0.37
05.
21D
ong
Hai
War
d0.
3997
%98
%98
%54
%0.
210.
205
0.20
70.
207
5.23
Nie
m N
ghia
War
d1.
1293
%93
%93
%0%
0.00
0.00
00.
000
0.00
0
An
Hai
Rur
al D
istr
ict
6.01
Du
Han
g K
enh
Com
.2.
6954
%88
%88
%29
%0.
770.
417
0.68
00.
680
6.02
Vin
h N
iem
Com
.5.
6321
%45
%69
%33
%1.
840.
388
0.82
71.
266
No.
Adm
inis
trat
ive
divi
sion
Dev
elop
ed A
rea
Rat
ioD
evel
oped
Are
a
2 - 77

Table 2.8.1 Property Values: Drainage Project
Total Annual Annual Present Annual PV of Cost Cost
Year Value equiv of Value Value (PV) Project Project as % of as % of
(Land (1) (Avge. of (3) Costs Costs Property Property
plus (No Growth)* (2003 2003 Value Value
Bldgs, Growth) base Yr) base Yr (No (Avge.
Property) Growth) Growth)
($mill) ($mill) ($mill) ($mill) ($1,000) ($mill)
(1) (2) (3) (4) (5) (6) (7) (8)
2001 884.1 104 104
2 104 112
3 104 121 1,864.3 2,734 32.9 3.7 1.8
4 104 129 6,408
5 104 138 7,156
6 104 156 7,722
7 104 174 8,296
8 104 193 10,299
9 104 211 6,502
10 104 229 21
11 104 243 23
12 104 257 25
13 104 270 26
14 104 284 30
15 104 298 33
16 104 311 38
17 104 325 43
18 104 338 49
19 104 352 54
20 104 365 59
21 104 365 64
22 104 365 69
23 104 365 74
2 - 78

Table 2.8.2 Urban Productivity: Drainage Project
Year Value- Present Total PV PV of Proj cost Proj cost
Added Value (PV) Value- of Project as % of as % of
(No Of (1) Added (3) Costs Value Value
Growth) 2003 (Avge. 2003 2003 Added (Avge.
Base yr* Growth base yr base yr (No Growth
after 2001) Growth) after 2001)
($mill) ($mill) ($mill) ($mill) ($mill)
(1) (2) (3) (4) (5) (6) (7)
2001 177 177
2 177 191
3 177 1,346 206 3,132.8 32.9 2.45 1.05
4 177 220
5 177 235
6 177 266
7 177 297
8 177 328
9 177 359
10 177 390
11 177 414
12 177 437
13 177 461
14 177 484
15 177 507
16 177 531
17 177 554
18 177 577
19 177 600
20 177 623
21 177 654
22 177 687
23 177 721
2 - 79

Table 2.8.3 Key Economic Indicators and Population, Study Area and Haiphong
$US '000, 2000 prices)
GRP in GRP in HPPC Disposable Study Area Haiphong
Study Area Haiphong Expenditure Income in Population Population
Study Area
Year
2001 432,050 705,042 63,493 216,025 567,387 1,717,491
2002 467,528 755,728 68,057 233,764 573,785 1,737,503
2003 503,007 806,413 72,621 251,503 580,183 1,757,516
2004 538,485 857,099 77,186 269,243 586,581 1,777,529
2005 573,999 907,785 81,750 287,000 592,579 1,797,542
2006 651,992 1,009,928 90,957 325,996 599,245 1,819,898
2007 729,985 1,112,070 100,164 364,992 605,911 1,842,254
2008 807,978 1,214,213 109,371 403,989 612,576 1,864,610
2009 885,971 1,316,356 118,578 442,985 619,242 1,886,966
2010 963,928 1,418,570 127,786 481,964 625,908 1,909,322
2011 1,024,310 1,507,938 135,836 512,155 632,517 1,930,587
2012 1,084,692 1,597,306 143,886 542,346 639,126 1,951,853
2013 1,145,074 1,686,673 151,936 572,537 645,735 1,973,118
2014 1,205,456 1,776,041 159,986 602,728 652,344 1,994,384
2015 1,265,838 1,865,409 168,036 632,919 658,953 2,015,649
2016 1,326,220 1,954,777 176,086 663,110 665,556 2,036,658
2017 1,386,602 2,044,144 184,136 693,301 672,160 2,057,666
2018 1,446,984 2,133,512 192,186 723,492 678,763 2,078,675
2019 1,507,366 2,222,880 200,236 753,683 685,367 2,099,683
2020 1,567,713 2,312,212 208,286 783,856 691,970 2,120,692
2 - 80

Table 2.8.4 Drainage Program Costs in Relation to Key Indicators:
Sensitivity to Key Assumptions
(20% increase in estimated costs, half the predicted economic growth rate)
values in 2000 prices
Year Total Cost as % Cost as % Cost as % Cost as % Per Capita
Cost of GRP in of GRP in of HPPC of Disp. Inc. Cost in
Study Area Haiphong Exp. Study Area Study Area
($US'000) (%) (%) (%) (%) ($)
2001 263 0.06 0.04 0.41 0.12 0.46
2002 1,525 0.34 0.21 2.31 0.68 2.66
2003 3,019 0.65 0.40 4.40 1.29 5.20
2004 4,937 1.02 0.63 6.95 2.04 8.42
2005 5,557 1.11 0.68 7.57 2.23 9.38
2006 6,227 1.17 0.72 7.95 2.34 10.39
2007 6,943 1.23 0.75 8.36 2.46 11.46
2008 7,836 1.32 0.81 8.96 2.63 12.79
2009 8,468 1.36 0.83 9.24 2.71 13.68
2010 8,648 1.33 0.81 9.03 2.66 13.82
2011 10,037 1.49 0.92 10.17 2.99 15.87
2012 11,438 1.65 1.01 11.25 3.31 17.90
2013 12,661 1.78 1.09 12.12 3.56 19.61
2014 13,876 1.90 1.17 12.94 3.80 21.27
2015 15,088 2.02 1.24 13.73 4.03 22.90
2016 16,300 2.13 1.30 14.48 4.26 24.49
2017 17,513 2.24 1.37 15.22 4.47 26.05
2018 18,724 2.34 1.43 15.92 4.68 27.58
2019 19,936 2.44 1.50 16.61 4.88 29.09
2020 21,148 2.54 1.56 17.27 5.08 30.56
2 - 81
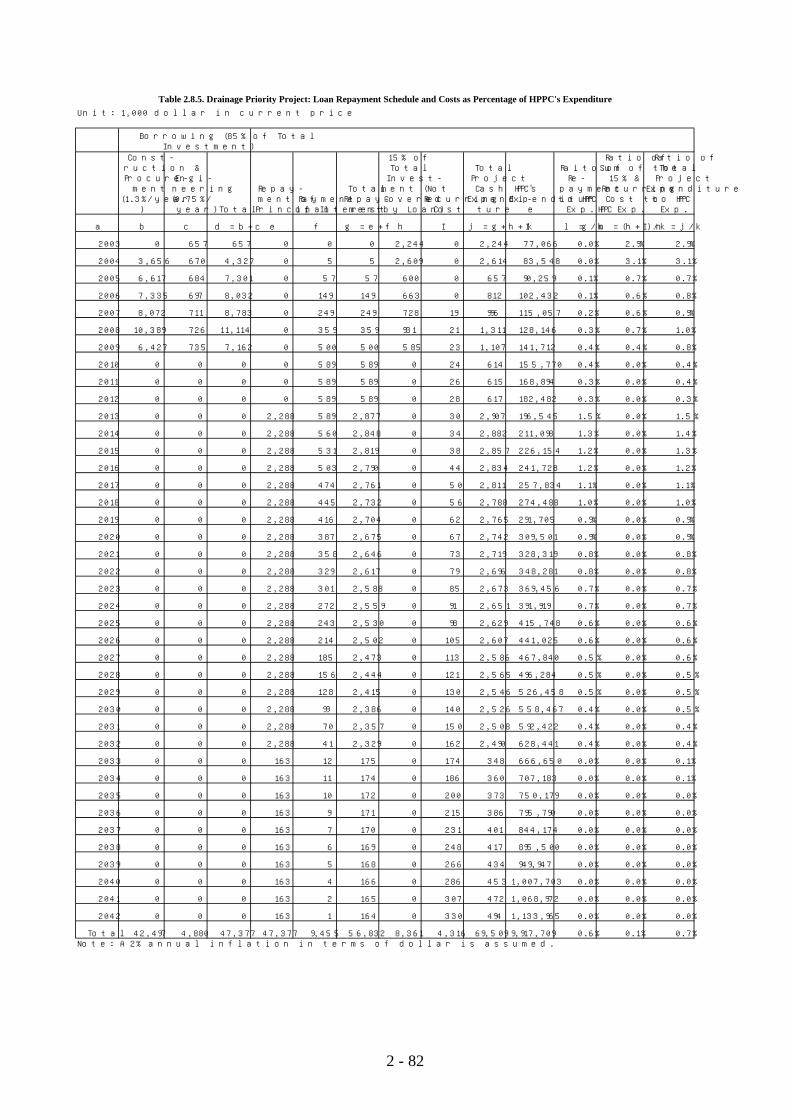
Unit: 1,000 dollar in current price
Const-ruction &Procure-
ment(1.3%/year
)
Engi-neering(0.75%/year) Total
Repay-ment ofPrincipal
Paymentof Interest
TotalRepay-ment
15% ofTotal
Invest-ment (NotCoveredby Loan)
RecurringCost
TotalProjectCash
Expendi-ture
HPPC'sExpenditur
e
Raito ofRe-
paymentto HPPC
Exp.
Ratio ofSum of the
15% &RecurringCost to
HPPC Exp.
Ratio ofTotal
ProjectExpenditure
to HPPCExp.
a b c d = b+c e f g = e+f h I j = g+h+I k l =g/k m = (h+I)/k n = j/k
2003 0 657 657 0 0 0 2,244 0 2,244 77,066 0.0% 2.9% 2.9%
2004 3,656 670 4,327 0 5 5 2,609 0 2,614 83,548 0.0% 3.1% 3.1%
2005 6,617 684 7,301 0 57 57 600 0 657 90,259 0.1% 0.7% 0.7%
2006 7,335 697 8,032 0 149 149 663 0 812 102,432 0.1% 0.6% 0.8%
2007 8,072 711 8,783 0 249 249 728 19 996 115,057 0.2% 0.6% 0.9%
2008 10,389 726 11,114 0 359 359 931 21 1,311 128,146 0.3% 0.7% 1.0%
2009 6,427 735 7,162 0 500 500 585 23 1,107 141,712 0.4% 0.4% 0.8%
2010 0 0 0 0 589 589 0 24 614 155,770 0.4% 0.0% 0.4%
2011 0 0 0 0 589 589 0 26 615 168,894 0.3% 0.0% 0.4%
2012 0 0 0 0 589 589 0 28 617 182,482 0.3% 0.0% 0.3%
2013 0 0 0 2,288 589 2,877 0 30 2,907 196,545 1.5% 0.0% 1.5%
2014 0 0 0 2,288 560 2,848 0 34 2,882 211,098 1.3% 0.0% 1.4%
2015 0 0 0 2,288 531 2,819 0 38 2,857 226,154 1.2% 0.0% 1.3%
2016 0 0 0 2,288 503 2,790 0 44 2,834 241,728 1.2% 0.0% 1.2%
2017 0 0 0 2,288 474 2,761 0 50 2,811 257,834 1.1% 0.0% 1.1%
2018 0 0 0 2,288 445 2,732 0 56 2,788 274,488 1.0% 0.0% 1.0%
2019 0 0 0 2,288 416 2,704 0 62 2,765 291,705 0.9% 0.0% 0.9%
2020 0 0 0 2,288 387 2,675 0 67 2,742 309,501 0.9% 0.0% 0.9%
2021 0 0 0 2,288 358 2,646 0 73 2,719 328,319 0.8% 0.0% 0.8%
2022 0 0 0 2,288 329 2,617 0 79 2,696 348,281 0.8% 0.0% 0.8%
2023 0 0 0 2,288 301 2,588 0 85 2,673 369,456 0.7% 0.0% 0.7%
2024 0 0 0 2,288 272 2,559 0 91 2,651 391,919 0.7% 0.0% 0.7%
2025 0 0 0 2,288 243 2,530 0 98 2,629 415,748 0.6% 0.0% 0.6%
2026 0 0 0 2,288 214 2,502 0 105 2,607 441,025 0.6% 0.0% 0.6%
2027 0 0 0 2,288 185 2,473 0 113 2,586 467,840 0.5% 0.0% 0.6%
2028 0 0 0 2,288 156 2,444 0 121 2,565 496,284 0.5% 0.0% 0.5%
2029 0 0 0 2,288 128 2,415 0 130 2,546 526,458 0.5% 0.0% 0.5%
2030 0 0 0 2,288 99 2,386 0 140 2,526 558,467 0.4% 0.0% 0.5%
2031 0 0 0 2,288 70 2,357 0 150 2,508 592,422 0.4% 0.0% 0.4%
2032 0 0 0 2,288 41 2,329 0 162 2,490 628,441 0.4% 0.0% 0.4%
2033 0 0 0 163 12 175 0 174 348 666,650 0.0% 0.0% 0.1%
2034 0 0 0 163 11 174 0 186 360 707,183 0.0% 0.0% 0.1%
2035 0 0 0 163 10 172 0 200 373 750,179 0.0% 0.0% 0.0%
2036 0 0 0 163 9 171 0 215 386 795,790 0.0% 0.0% 0.0%
2037 0 0 0 163 7 170 0 231 401 844,174 0.0% 0.0% 0.0%
2038 0 0 0 163 6 169 0 248 417 895,500 0.0% 0.0% 0.0%
2039 0 0 0 163 5 168 0 266 434 949,947 0.0% 0.0% 0.0%
2040 0 0 0 163 4 166 0 286 453 1,007,703 0.0% 0.0% 0.0%
2041 0 0 0 163 2 165 0 307 472 1,068,972 0.0% 0.0% 0.0%
2042 0 0 0 163 1 164 0 330 494 1,133,965 0.0% 0.0% 0.0%
Total 42,497 4,880 47,377 47,377 9,455 56,832 8,361 4,316 69,509 9,917,709 0.6% 0.1% 0.7%Note: A 2% annual inflation in terms of dollar is assumed.
Borrowing (85% of TotalInvestment)
Table 2.8.5. Drainage Priority Project: Loan Repayment Schedule and Costs as Percentage of HPPC's Expenditure
2 - 82
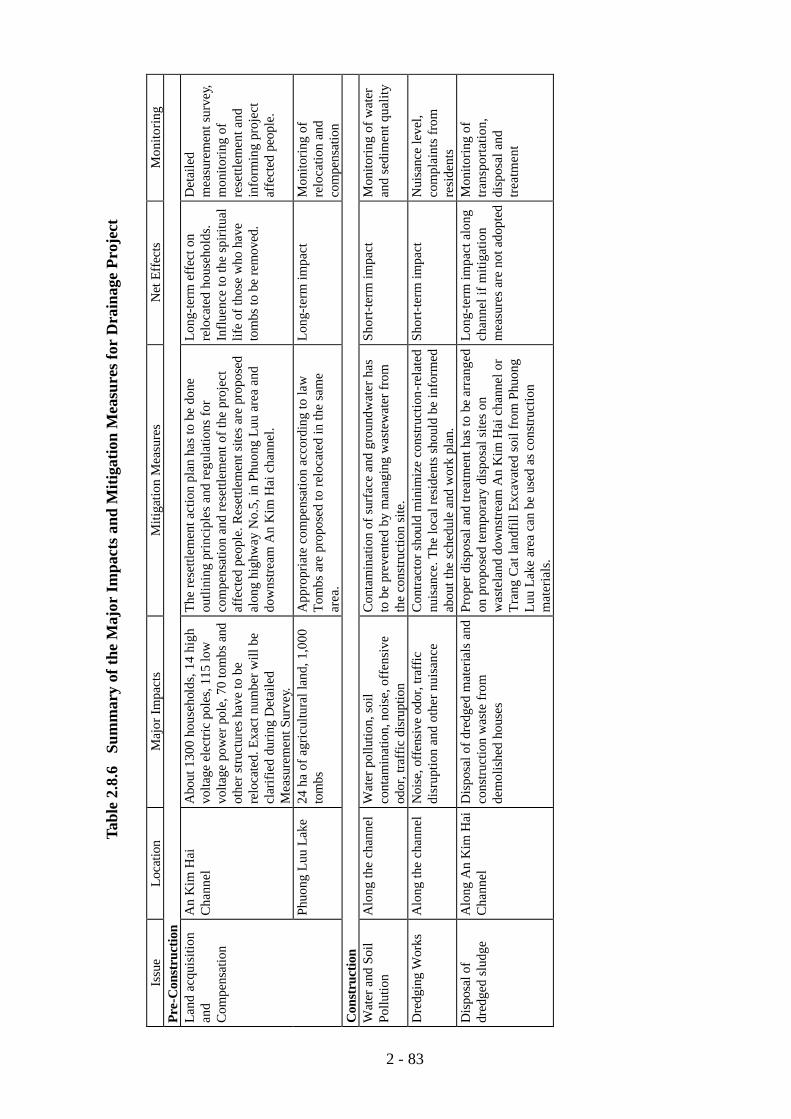
Tabl
e 2.
8.6
Sum
mar
y of
the
Maj
or Im
pact
s and
Miti
gatio
n M
easu
res f
or D
rain
age
Proj
ect
Is
sue
Loca
tion
Maj
or Im
pact
s M
itiga
tion
Mea
sure
s N
et E
ffec
ts
Mon
itori
ng
Pre-
Con
stru
ctio
n
Lan
d ac
quis
ition
an
d C
ompe
nsat
ion
An
Kim
Hai
C
hann
el
Abo
ut 1
300
hous
ehol
ds, 1
4 hi
gh
volta
ge e
lect
ric p
oles
, 115
low
vo
ltage
pow
er p
ole,
70
tom
bs a
nd
othe
r str
uctu
res
have
to b
e re
loca
ted.
Exa
ct n
umbe
r will
be
clar
ifie
d du
ring
Det
aile
d M
easu
rem
ent S
urve
y.
The
rese
ttlem
ent a
ctio
n pl
an h
as to
be
done
ou
tlini
ng p
rinc
iple
s an
d re
gula
tions
for
com
pens
atio
n an
d re
settl
emen
t of t
he p
roje
ct
affe
cted
peo
ple.
Res
ettle
men
t site
s ar
e pr
opos
ed
alon
g hi
ghw
ay N
o.5,
in P
huon
g L
uu a
rea
and
dow
nstr
eam
An
Kim
Hai
cha
nnel
.
Lon
g-te
rm e
ffec
t on
relo
cate
d ho
useh
olds
. In
flue
nce
to th
e sp
iritu
al
life
of th
ose
who
hav
e to
mbs
to b
e re
mov
ed.
Det
aile
d m
easu
rem
ent s
urve
y,
mon
itori
ng o
f re
settl
emen
t and
in
form
ing
proj
ect
affe
cted
peo
ple.
Ph
uong
Luu
Lak
e 24
ha
of a
gric
ultu
ral l
and,
1,0
00
tom
bs
App
ropr
iate
com
pens
atio
n ac
cord
ing
to la
w
Tom
bs a
re p
ropo
sed
to re
loca
ted
in th
e sa
me
area
.
Lon
g-te
rm im
pact
M
onito
ring
of
relo
catio
n an
d co
mpe
nsat
ion
Con
stru
ctio
n
Wat
er a
nd S
oil
Pollu
tion
Alo
ng th
e ch
anne
l W
ater
pol
lutio
n, s
oil
cont
amin
atio
n, n
oise
, off
ensi
ve
odor
, tra
ffic
dis
rupt
ion
Con
tam
inat
ion
of s
urfa
ce a
nd g
roun
dwat
er h
as
to b
e pr
even
ted
by m
anag
ing
was
tew
ater
from
th
e co
nstr
uctio
n si
te.
Shor
t-ter
m im
pact
M
onito
ring
of w
ater
an
d se
dim
ent q
ualit
y
Dre
dgin
g W
orks
A
long
the
chan
nel
Noi
se, o
ffen
sive
odo
r, tra
ffic
di
srup
tion
and
othe
r nui
sanc
e C
ontr
acto
r sho
uld
min
imiz
e co
nstr
uctio
n-re
late
d nu
isan
ce. T
he lo
cal r
esid
ents
sho
uld
be in
form
ed
abou
t the
sch
edul
e an
d w
ork
plan
.
Shor
t-ter
m im
pact
N
uisa
nce
leve
l, co
mpl
aint
s fr
om
resi
dent
s D
ispo
sal o
f dr
edge
d sl
udge
A
long
An
Kim
Hai
C
hann
el
Dis
posa
l of d
redg
ed m
ater
ials
and
co
nstru
ctio
n w
aste
from
de
mol
ishe
d ho
uses
Prop
er d
ispo
sal a
nd tr
eatm
ent h
as to
be
arra
nged
on
pro
pose
d te
mpo
rary
dis
posa
l site
s on
w
aste
land
dow
nstr
eam
An
Kim
Hai
cha
nnel
or
Tra
ng C
at la
ndfi
ll E
xcav
ated
soi
l fro
m P
huon
g L
uu L
ake
area
can
be
used
as
cons
truc
tion
mat
eria
ls.
Lon
g-te
rm im
pact
alo
ng
chan
nel i
f miti
gatio
n m
easu
res
are
not a
dopt
ed M
onito
ring
of
tran
spor
tatio
n,
disp
osal
and
tr
eatm
ent
2 - 83

The
Stud
y on
San
itatio
n Im
prov
emen
t Pla
n fo
r Hai
phon
g C
ity in
The
Soc
ialis
t Rep
ublic
of V
ietn
am
Japa
n In
tern
atio
nal C
oope
ratio
n A
genc
y
Figu
re 2
.1.1
M
odifi
ed T
arge
t Pla
nnin
g A
reas
in
Cla
ss A
Are
as a
nd P
lann
ing
Crit
eria
fo
r Dra
inag
e Im
prov
emen
t Pla
n
Nor
th
Not
To
Scal
e
Old
City
Cen
ter
Cen
tral
Are
a
New
Urb
an A
rea
PLA
NN
ING
CR
ITER
IA
PHA
SE I
Cen
tral
Are
a Su
rfac
e A
rea:
1,1
03 h
a G
rade
A: 5
Yea
r AR
I Sto
rm
Gra
de B
: 2 Y
ear A
RI S
torm
10
Yea
r AR
I Hig
h T
ide
PHA
SE II
O
ld C
ity C
ente
r Su
rfac
e A
rea:
856
ha
Gra
de A
: 2 Y
ear A
RI S
torm
G
rade
B: 2
Yea
r AR
I Sto
rm
10 Y
ear A
RI H
igh
Tid
e N
ew U
rban
Are
a Su
rfac
e A
rea:
3,2
82 h
a G
rade
A: 5
Yea
r AR
I Sto
rm
Gra
de B
: 2 Y
ear A
RI S
torm
10
Yea
r AR
I Hig
h T
ide
Are
aRem
oved
from
Cen
tral
A
rea
and
incl
uded
in N
ew
Urb
an A
rea
2 - 84
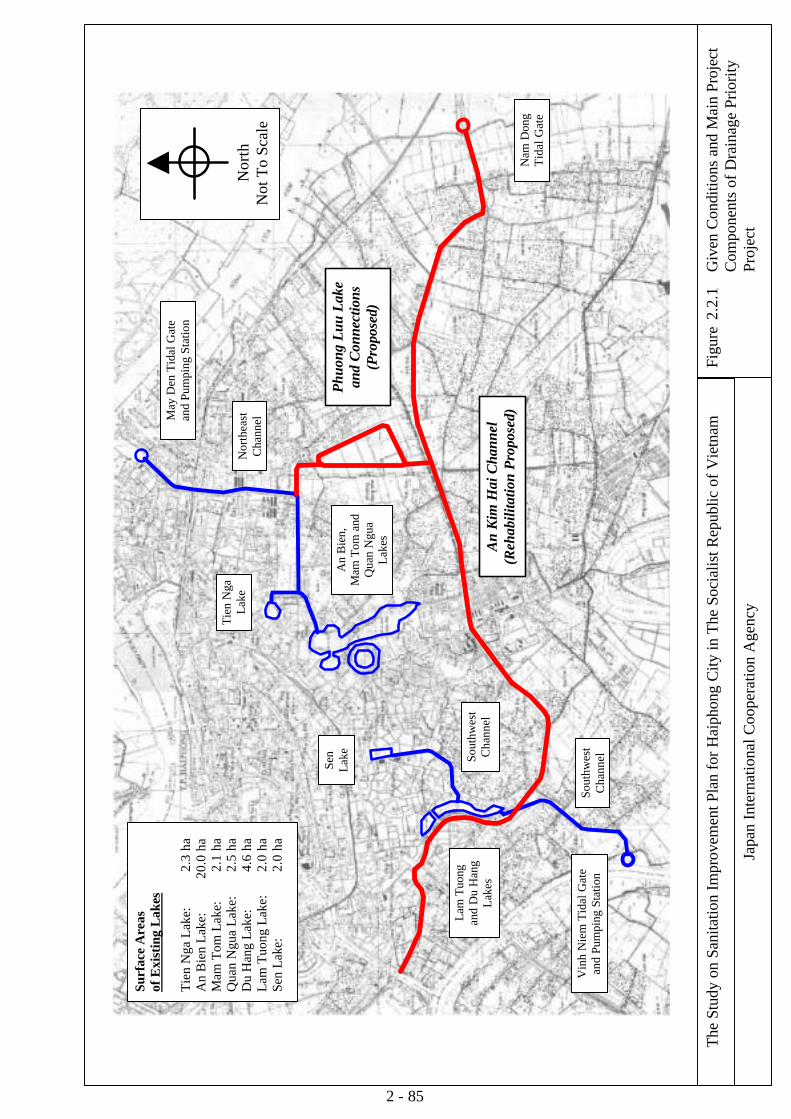
The
Stud
y on
San
itatio
n Im
prov
emen
t Pla
n fo
r Hai
phon
g C
ity in
The
Soc
ialis
t Rep
ublic
of V
ietn
am
Japa
n In
tern
atio
nal C
oope
ratio
n A
genc
y
Figu
re 2
.2.1
G
iven
Con
ditio
ns a
nd M
ain
Proj
ect
Com
pone
nts
of D
rain
age
Prio
rity
Proj
ect
May
Den
Tid
al G
ate
and
Pum
ping
Sta
tion
Vin
h N
iem
Tid
al G
ate
and
Pum
ping
Sta
tion
Nor
thea
st
Cha
nnel
Sout
hwes
t C
hann
el
Sout
hwes
t C
hann
el
Sen
Lake
A
n B
ien,
M
am T
om a
nd
Qua
n N
gua
Lake
s
Tien
Nga
La
ke
Lam
Tuo
ng
and
Du
Han
g La
kes
Phu
ong
Luu
Lak
e an
d C
onne
ctio
ns
(Pro
pose
d)
An
Kim
Hai
Cha
nnel
(R
ehab
ilita
tion
Pro
pose
d)
Nam
Don
g T
idal
Gat
e
Nor
th
Not
To
Scal
e
Surf
ace
Are
as
of E
xist
ing
Lak
es
Tie
n N
ga L
ake:
2
.3 h
a A
n B
ien
Lak
e:
20.0
ha
Mam
Tom
Lak
e:
2.1
ha
Qua
n N
gua
Lak
e:
2.5
ha
Du
Han
g La
ke:
4.6
ha
Lam
Tuo
ng L
ake:
2
.0 h
a Se
n La
ke:
2.0
ha
2 - 85

The
Stud
y on
San
itatio
n Im
prov
emen
t Pla
n fo
r Hai
phon
g C
ity in
The
Soc
ialis
t Rep
ublic
of V
ietn
am
Japa
n In
tern
atio
nal C
oope
ratio
n A
genc
y
Figu
re 2
.2.2
D
rain
age
Zone
Are
as o
f
Dra
inag
e Pr
iorit
y Pr
ojec
t
NE
DZ
SW D
Z
SW D
Z
AK
H-1
AK
H-2
AK
H-4
SW D
Z
NE
DZ
AK
H
Sout
hwes
t Dra
inag
e Zo
ne
Nor
thea
st D
rain
age
Zone
An
Kim
Hai
Cha
nnel
Dra
inag
e Zo
ne
Nor
th
Not
To
Scal
e
AK
H-3
AK
H-5
Lan
d A
reas
N
E D
Z:
600
ha
SW D
Z:
400
ha
AK
H-1
: 7
0 ha
A
KH
-2:
160
ha
AK
H-3
: 12
0 ha
A
KH
-4:
310
ha
AK
H-5
: 18
0 ha
2 - 86
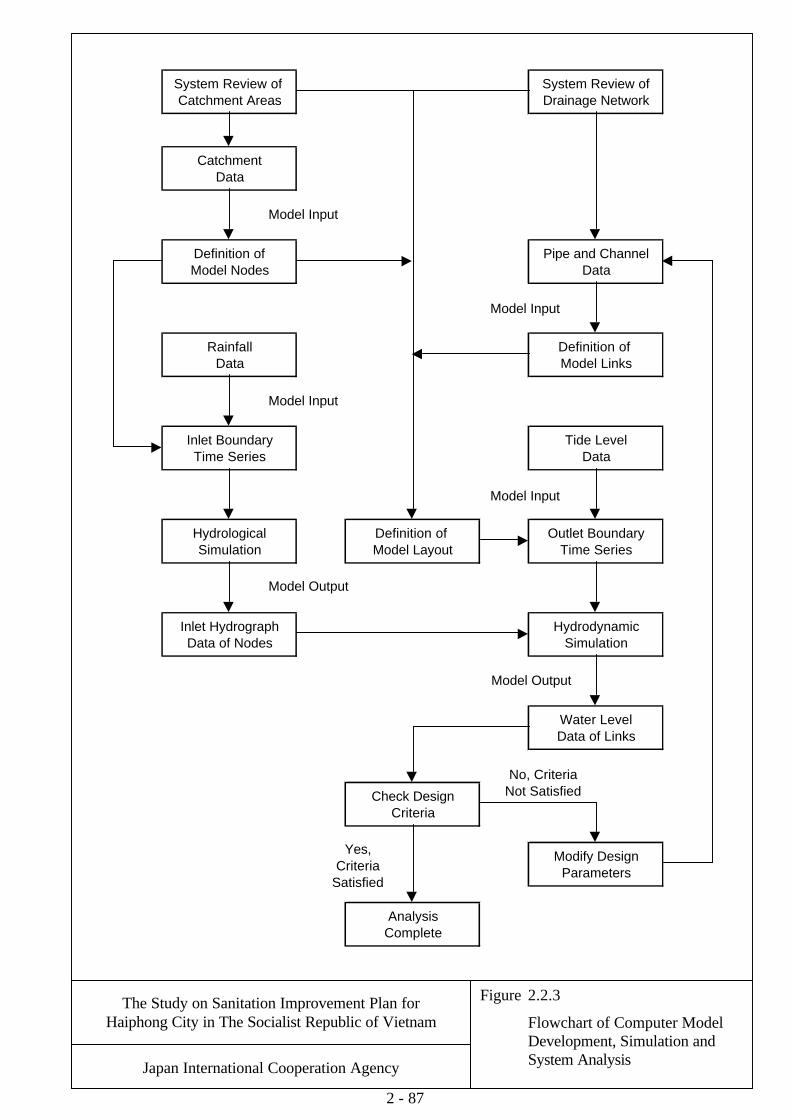
The Study on Sanitation Improvement Plan for Haiphong City in The Socialist Republic of Vietnam
Figure 2.2.3 Flowchart of Computer Model Development, Simulation and System Analysis Japan International Cooperation Agency
System Review of Catchment Areas
CatchmentData
Data of Nodes
Model Layout
Definition ofModel Nodes
RainfallData
Inlet BoundaryTime Series
HydrologicalSimulation
Inlet Hydrograph
System Review ofDrainage Network
Pipe and ChannelData
Hydrodynamic
Time SeriesOutlet Boundary
Model Links
Complete
Check DesignCriteria
Modify DesignParameters
DataTide Level
Definition of
Analysis
Water LevelData of Links
Simulation
Definition of
Yes, Criteria
Satisfied
No, CriteriaNot Satisfied
Model Input
Model Input
Model Input
Model Input
Model Output
Model Output
2 - 87
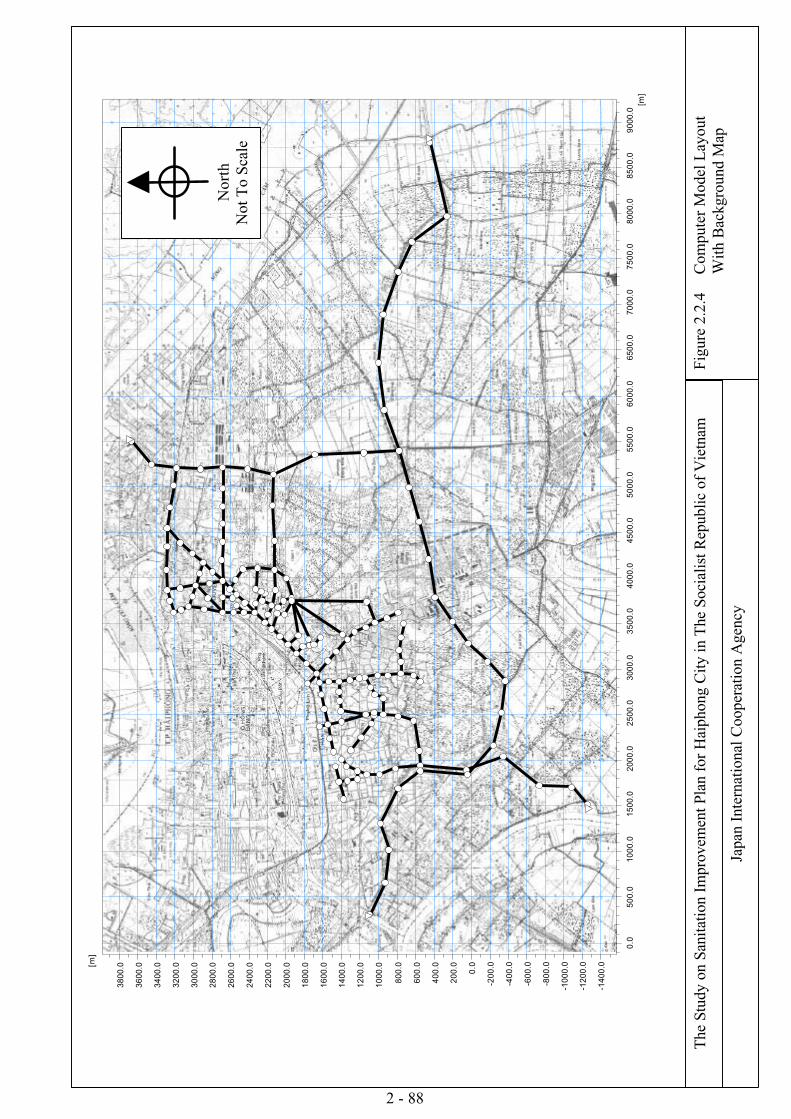
0.
050
0.0
1000
.015
00.0
2000
.025
00.0
3000
.035
00.0
4000
.045
00.0
5000
.055
00.0
6000
.065
00.0
7000
.075
00.0
8000
.085
00.0
9000
.0[m
]
-140
0.0
-120
0.0
-100
0.0
-800
.0
-600
.0
-400
.0
-200
.0
0
.0
200.
0
400.
0
600.
0
800.
0
1000
.0
1200
.0
1400
.0
1600
.0
1800
.0
2000
.0
2200
.0
2400
.0
2600
.0
2800
.0
3000
.0
3200
.0
3400
.0
3600
.0
3800
.0[m]
The
Stu
dy o
n Sa
nita
tion
Impr
ovem
ent P
lan
for
Hai
phon
g C
ity in
The
Soc
ialis
t Rep
ublic
of
Vie
tnam
Japa
n In
tern
atio
nal C
oope
ratio
n A
genc
y
Figu
re 2
.2.4
Com
pute
r M
odel
Lay
out
With
Bac
kgro
und
Map
Nor
thN
ot T
o Sc
ale
2 - 88

0.
050
0.0
1000
.015
00.0
2000
.025
00.0
3000
.035
00.0
4000
.045
00.0
5000
.055
00.0
6000
.065
00.0
7000
.075
00.0
8000
.085
00.0
9000
.0[m
]
-140
0.0
-120
0.0
-100
0.0
-800
.0
-600
.0
-400
.0
-200
.0
0.
0
200.
0
400.
0
600.
0
800.
0
1000
.0
1200
.0
1400
.0
1600
.0
1800
.0
2000
.0
2200
.0
2400
.0
2600
.0
2800
.0
3000
.0
3200
.0
3400
.0
3600
.0
3800
.0[m]
The
Stud
y on
San
itatio
n Im
prov
emen
t Pla
n fo
r Hai
phon
g C
ity in
The
Soc
ialis
t Rep
ublic
of V
ietn
am
Japa
n In
tern
atio
nal C
oope
ratio
n A
genc
y
Figu
re 2
.2.5
C
ompu
ter M
odel
Lay
out
With
Nod
e La
bels
LTTG
CA
MTG
AH
3
AH
DH
AH
4
AH
5
AH
6 A
H7
AH
8 A
H9
AH
10
AH
2
AH
1
AH
12
AH
11
AH
17
AH
16
AH
15
AH
14
AH
PL
AH
13
AH
18
AH
19
AH
20
AH
21
2 - 89

The
Stud
y on
San
itatio
n Im
prov
emen
t Pla
n fo
r Hai
phon
g C
ity in
The
Soc
ialis
t Rep
ublic
of V
ietn
am
Japa
n In
tern
atio
nal C
oope
ratio
n A
genc
y
Figu
re 2
.2.6
R
ainf
all I
nten
sity
, Dur
atio
n an
d Fr
eque
ncy
Dat
a U
sed
for D
esig
n
of
Dra
inag
e Pr
iorit
y Pr
ojec
ts
1015
5.4
172.
815
134.
814
6.8
3010
4.2
112.
860
75.4
86.5
9062
.173
.512
053
.865
.624
032
.741
.336
024
.631
.248
019
.925
.672
014
.618
.914
408.
711
.3
Rai
nfa
ll In
ten
sity
(m
m/h
r)5
Yea
r A
RI
10 Y
ear
AR
IT
ime
(min
ute
s)
0255075100
125
150
175
200
225
060
120
180
240
300
360
420
480
Tim
e (m
inu
tes)
Rainfall (mm/hr)
50 Y
ear A
RI
20 Y
ear A
RI
10 Y
ear A
RI
5 Y
ear A
RI
2 Y
ear A
RI
2 - 90

The
Stud
y on
San
itatio
n Im
prov
emen
t Pla
n fo
r Hai
phon
g C
ity in
The
Soc
ialis
t Rep
ublic
of V
ietn
am
Japa
n In
tern
atio
nal C
oope
ratio
n A
genc
y
Figu
re 2
.2.7
Ti
de L
evel
Dat
a w
ith F
requ
ency
of
10
Yea
r AR
I and
Hig
h Ti
de
Con
ditio
ns
+0.0
+0.5
+1.0
+1.5
+2.0
+2.5
+3.0
+3.5
+4.0
+4.5
1/14
1/15
1/16
1/17
1/18
1/19
1/20
1/21
1/22
1/23
1/24
1/25
1/26
1/27
1/28
1/29
1/30
1/31
Day
Tide Level (+m)
Tim
eT
ide
Lev
el(h
r)(+
m)
3:00
+1.0
4:00
+1.3
5:00
+1.5
6:00
+1.8
7:00
+2.0
8:00
+2.2
9:00
+2.5
10:0
0+2
.811
:00
+3.1
12:0
0+3
.313
:00
+3.6
14:0
0+3
.915
:00
+4.1
16:0
0+3
.917
:00
+3.5
18:0
0+3
.319
:00
+3.0
20:0
0+2
.821
:00
+2.5
22:0
0+2
.223
:00
+2.0
24:0
0+1
.81:
00+1
.52:
00+1
.33:
00+1
.0
2 - 91

The
Stud
y on
San
itatio
n Im
prov
emen
t Pla
n fo
r Hai
phon
g C
ity in
The
Soc
ialis
t Rep
ublic
of V
ietn
am
Japa
n In
tern
atio
nal C
oope
ratio
n A
genc
y
Figu
re 2
.2.8
D
esig
n St
orm
Hye
togr
aph
with
Fr
eque
ncy
of 5
Yea
r AR
I dur
ing
H
igh
Tide
Con
ditio
ns
Tim
eR
ain
fall
Tid
e L
evel
(hr)
(mm
)(+
m)
12:0
00
+2.0
13:0
00
+2.2
14:0
02
+2.5
15:0
04
+2.8
16:0
06
+3.1
17:0
08
+3.3
18:0
012
+3.6
19:0
041
+3.9
20:0
066
+4.1
21:0
014
+3.9
22:0
010
+3.5
23:0
06
+3.3
24:0
04
+3.0
0:00
2+2
.81:
000
+2.5
2:00
0+2
.23:
000
+2.0
4:00
0+1
.85:
000
+1.5
6:00
0+1
.37:
000
+1.0
8:00
0+1
.39:
000
+1.5
10:0
00
+1.8
11:0
00
+2.0
12:0
00
+2.2
13:0
00
+2.5
0102030405060708090100
12:0
014
:00
16:0
018
:00
20:0
022
:00
24:0
01:
003:
005:
007:
009:
0011
:00
13:0
0
Tim
e (h
r)
Rainfall (mm)
+0.
0
+0.
5
+1.
0
+1.
5
+2.
0
+2.
5
+3.
0
+3.
5
+4.
0
+4.
5
Tide Level (+m)
2 - 92

The
Stud
y on
San
itatio
n Im
prov
emen
t Pla
n fo
r Hai
phon
g C
ity in
The
Soc
ialis
t Rep
ublic
of V
ietn
am
Japa
n In
tern
atio
nal C
oope
ratio
n A
genc
y
Figu
re 2
.2.9
D
esig
n St
orm
Hye
togr
aph
with
Fr
eque
ncy
of 1
0 Y
ear A
RI d
urin
g
Ris
ing
Tide
Con
ditio
ns
Tim
eR
ain
fall
Tid
e L
evel
(hr)
(mm
)(+
m)
12:0
00
+1.8
13:0
00
+1.5
14:0
02
+1.3
15:0
05
+1.0
16:0
08
+1.3
17:0
012
+1.5
18:0
016
+1.8
19:0
052
+2.0
20:0
080
+2.2
21:0
018
+2.5
22:0
014
+2.8
23:0
010
+3.0
24:0
06
+3.3
0:00
4+3
.51:
000
+3.9
2:00
0+4
.13:
000
+3.9
4:00
0+3
.55:
000
+3.3
6:00
0+3
.07:
000
+2.8
8:00
0+2
.59:
000
+2.2
10:0
00
+2.0
11:0
00
+1.8
12:0
00
+1.5
13:0
00
+1.3
0102030405060708090100
12:0
014
:00
16:0
018
:00
20:0
022
:00
24:0
01:
003:
005:
007:
009:
0011
:00
13:0
0
Tim
e (h
ou
rs)
Rainfall (mm)
+0.0
+0.5
+1.0
+1.5
+2.0
+2.5
+3.0
+3.5
+4.0
+4.5
Tide Level (+m)
2 - 93

The
Stud
y on
San
itatio
n Im
prov
emen
t Pla
n fo
r Hai
phon
g C
ity in
The
Soc
ialis
t Rep
ublic
of V
ietn
am
Japa
n In
tern
atio
nal C
oope
ratio
n A
genc
y
Figu
re 2
.2.1
0 D
esig
n St
orm
Hye
togr
aph
with
F
requ
ency
of 1
0 Y
ear A
RI d
urin
g
Fal
ling
Tide
Con
ditio
ns
Tim
eR
ain
fall
Tid
e L
evel
(hr)
(mm
)(+
m)
12:0
00
+3.9
13:0
00
+4.1
14:0
02
+3.9
15:0
05
+3.5
16:0
08
+3.3
17:0
012
+3.0
18:0
016
+2.8
19:0
052
+2.5
20:0
080
+2.2
21:0
018
+2.0
22:0
014
+1.8
23:0
010
+1.5
24:0
06
+1.3
0:00
4+1
.01:
000
+1.3
2:00
0+1
.53:
000
+1.8
4:00
0+2
.05:
000
+2.2
6:00
0+2
.57:
000
+2.8
8:00
0+3
.09:
000
+3.3
10:0
00
+3.5
11:0
00
+3.9
12:0
00
+4.1
13:0
00
+3.9
0102030405060708090100
12:0
014
:00
16:0
018
:00
20:0
022
:00
24:0
01:
003:
005:
007:
009:
0011
:00
13:0
0
Tim
e (h
r)
Rainfall (mm)
+0.0
+0.5
+1.0
+1.5
+2.0
+2.5
+3.0
+3.5
+4.0
+4.5
Tide Level (+m)
2 - 94
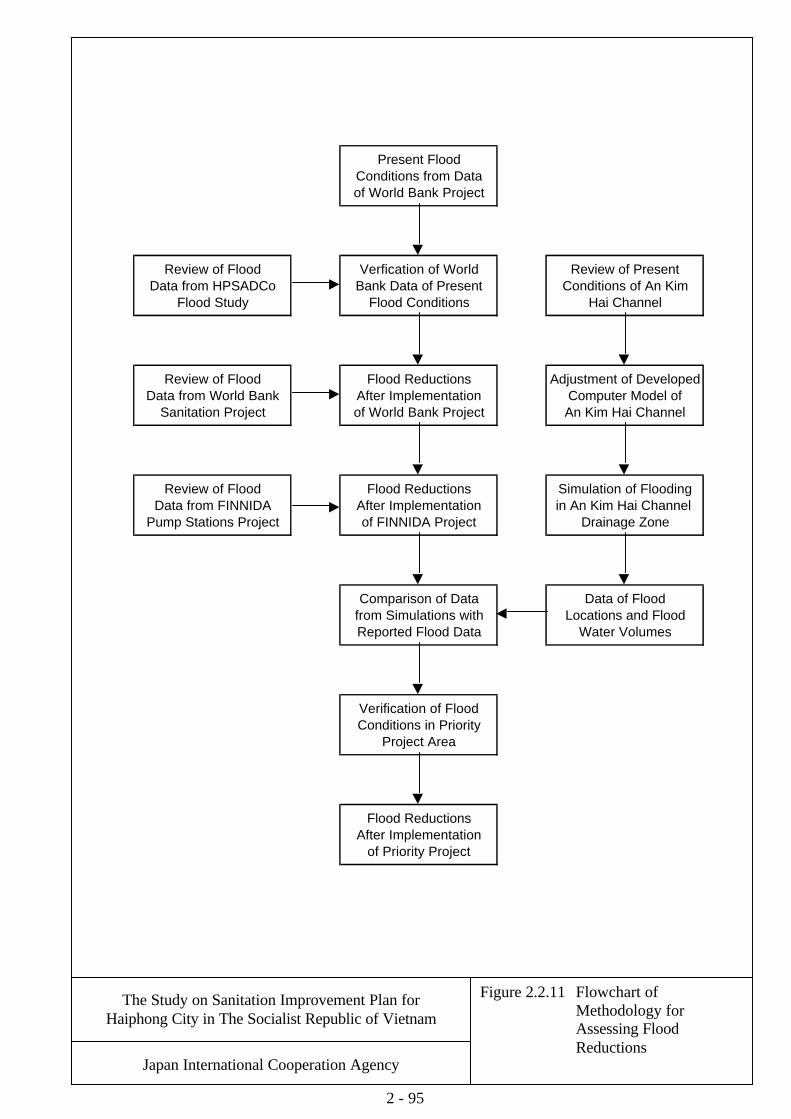
The Study on Sanitation Improvement Plan for Haiphong City in The Socialist Republic of Vietnam
Figure 2.2.11 Flowchart of Methodology for Assessing Flood Reductions
Japan International Cooperation Agency
from Simulations withReported Flood Data
Locations and Flood
Review of FloodData from World Bank
Sanitation Project
Flood ReductionsAfter Implementationof FINNIDA Project
in An Kim Hai Channel
of World Bank Project
Conditions of An Kim
After ImplementationAdjustment of Developed
Computer Model ofAn Kim Hai Channel
Verfication of WorldBank Data of Present
Flood Conditions
Present FloodConditions from Dataof World Bank Project
Flood Reductions
Data of Flood
Flood Reductions
Verification of FloodConditions in Priority
Project Area
Comparison of Data
Water Volumes
Review of Present
Hai Channel
Simulation of Flooding
Drainage Zone
of Priority Project
Review of Flood
After Implementation
Data from FINNIDA
Review of Flood
Flood StudyData from HPSADCo
Pump Stations Project
2 - 95

The
Stud
y on
San
itatio
n Im
prov
emen
t Pla
n fo
r Hai
phon
g C
ity in
The
Soc
ialis
t Rep
ublic
of V
ietn
am
Japa
n In
tern
atio
nal C
oope
ratio
n A
genc
y
Figu
re 2
.2.1
2 A
sses
sed
Floo
d R
educ
tions
in
Cla
ss A
Are
as A
fter
Wor
ld B
ank
Proj
ect
04080120
160
200
240
280
320
360
0.25
yea
r0.
5 ye
ar1
year
2 ye
ar5
year
Sto
rm A
RI F
req
uen
cy
Land Area (ha)
Pre
sent
Ann
ual F
lood
Are
as
Ann
ual F
lood
Are
as A
fter W
orld
Ban
k P
roje
ct
2 - 96

The
Stud
y on
San
itatio
n Im
prov
emen
t Pla
n fo
r Hai
phon
g C
ity in
The
Soc
ialis
t Rep
ublic
of V
ietn
am
Japa
n In
tern
atio
nal C
oope
ratio
n A
genc
y
Figu
re 2
.2.1
3 A
sses
sed
Floo
d R
educ
tions
of
Wor
ld B
ank
and
FIN
NID
A P
roje
cts
Act
ual
Flo
od
Are
as In
Cen
tral
Are
a D
uri
ng
Hig
h T
ide
Wit
ho
ut F
INN
IDA
P
roje
ctW
ith F
INN
IDA
P
roje
ct
Fre
qu
ency
Flo
od
Are
as (
ha)
Flo
od
Are
as (
ha)
0.25
Yea
r A
RI
120
0.5
Yea
r A
RI
330
1 Y
ear
AR
I56
42
Yea
r A
RI
8815
5 Y
ear
AR
I12
834
Exp
ecte
d A
nn
ual
Flo
od
Are
as in
Cen
tral
Are
a
Wit
ho
ut F
INN
IDA
P
roje
ctW
ith F
INN
IDA
P
roje
ct
Fre
qu
ency
Flo
od
Are
as (
ha)
Flo
od
Are
as (
ha)
0.25
Yea
r A
RI
30
0.5
Yea
r A
RI
80
1 Y
ear
AR
I14
12
Yea
r A
RI
224
5 Y
ear
AR
I32
9
Wit
h W
orl
d B
ank
Pro
ject
Wit
h W
orl
d B
ank
Pro
ject
020406080100
120
140
0.25
Yea
r0.
5 Y
ear
1 Y
ear
2 Y
ear
5 Y
ear
Flood Areas (ha)
Act
ual F
lood
Are
as W
ith W
orld
Ban
k P
roje
ct D
urin
g H
igh
Tid
e
Act
ual F
lood
Are
as W
ith W
orld
Ban
k an
d F
INN
IDA
Pro
ject
s D
urin
g H
igh
Tid
e
Ann
ual F
lood
Are
as W
ith W
orld
Ban
k P
roje
ct
Ann
ual F
lood
Are
as W
ith W
orld
Ban
k an
d F
INN
IDA
Pro
ject
s
Dur
ing
Falli
ng T
ide
Dur
ing
Falli
ng T
ide
2 - 97
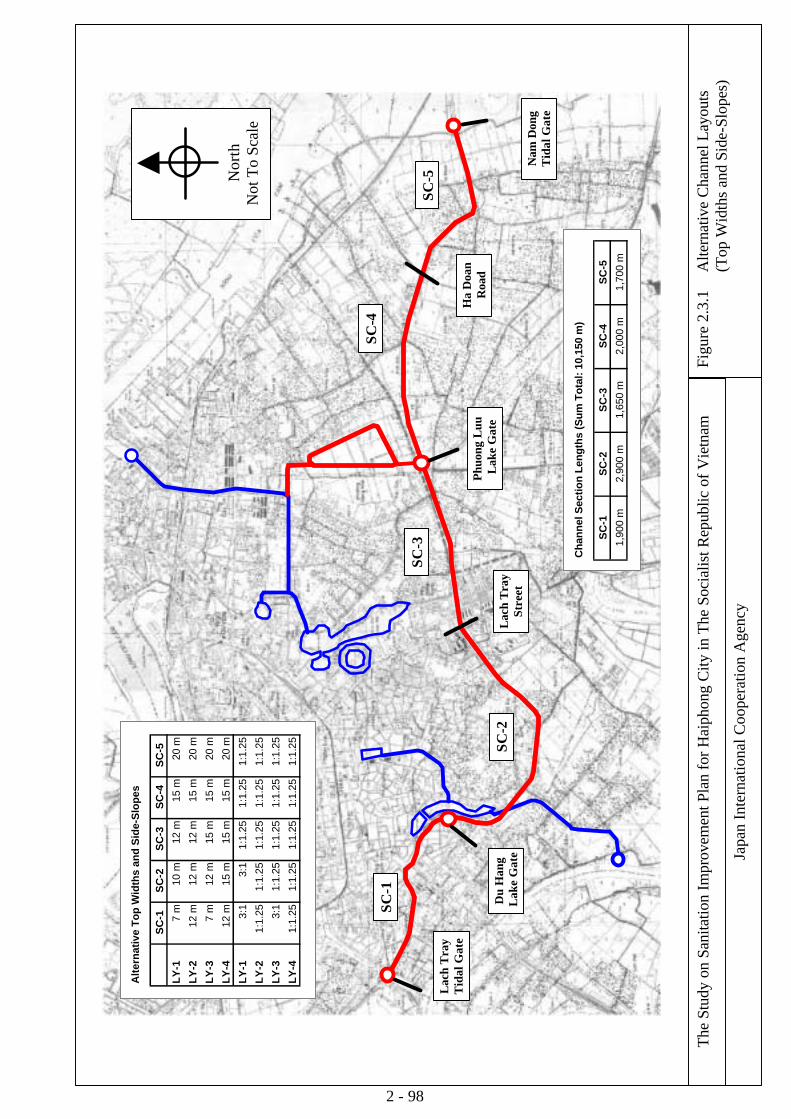
The
Stud
y on
San
itatio
n Im
prov
emen
t Pla
n fo
r Hai
phon
g C
ity in
The
Soc
ialis
t Rep
ublic
of V
ietn
am
Japa
n In
tern
atio
nal C
oope
ratio
n A
genc
y
Figu
re 2
.3.1
A
ltern
ativ
e C
hann
el L
ayou
ts
(Top
Wid
ths
and
Side
-Slo
pes)
SC-5
L
ach
Tra
y T
idal
Gat
e
Nam
Don
g T
idal
Gat
e
Nor
th
Not
To
Scal
e
SC-4
SC-3
SC-2
SC-1
Phuo
ng L
uu
Lak
e G
ate
Du
Han
g L
ake
Gat
e
Alte
rnat
ive
To
p W
idth
s an
d S
ide-
Slo
pes
SC
-1S
C-2
SC
-3S
C-4
SC
-5
LY
-17
m10
m12
m15
m20
m
LY
-212
m12
m12
m15
m20
m
LY
-37
m12
m15
m15
m20
m
LY
-412
m15
m15
m15
m20
m
LY
-13:
13:
11:
1.25
1:1.
251:
1.25
LY
-21:
1.25
1:1.
251:
1.25
1:1.
251:
1.25
LY
-33:
11:
1.25
1:1.
251:
1.25
1:1.
25
LY
-41:
1.25
1:1.
251:
1.25
1:1.
251:
1.25
Cha
nnel
Sec
tion
Leng
ths
(Sum
Tot
al: 1
0,15
0 m
)
SC
-1S
C-2
SC
-3S
C-4
SC
-5
1,90
0 m
2,90
0 m
1,65
0 m
2,00
0 m
1,70
0 m
Ha
Doa
n R
oad
Lach
Tra
y St
reet
2 - 98

1:0.
31:
0.3
+050
0
+380
0
+050
0
+330
0
+330
0
1:1.
251:
1.25
The
Stu
dy o
n Sa
nita
tion
Impr
ovem
ent P
lan
for H
aiph
ong
City
in T
he S
ocia
list R
epub
lic o
f Vie
tnam
Japa
n In
tern
atio
nal C
oope
ratio
n A
genc
y
Figu
re 2
.3.2
A
ltern
ativ
e C
hann
el C
ross
-Sec
tion
Ben
chm
ark
Des
igns
AL
TE
RN
AT
IVE
LY
-1
Rub
ble
Mas
onry
Ret
aini
ng W
all
Side
-Slo
pe =
1:0
.3
AL
TE
RN
AT
IVE
LY
-2
Rub
ble
Mas
onry
Rev
etm
ent
Side
-Slo
pe =
1:1
.25
Mai
nten
ance
Roa
dM
aint
enan
ceR
oad
Mai
nten
ance
+380
0
Mai
nten
ance
Roa
d
Cha
nnel
Sec
tion
SC-2
Cha
nnel
Sec
tion
SC-2
2 - 99

The
Stud
y on
San
itatio
n Im
prov
emen
t Pla
n fo
r Hai
phon
g C
ity in
The
Soc
ialis
t Rep
ublic
of V
ietn
am
Japa
n In
tern
atio
nal C
oope
ratio
n A
genc
y
Figu
re 2
.3.3
Si
mul
ated
Wat
er L
evel
s
in
An
Kim
Hai
Cha
nnel
:
5
Yea
r AR
I Sto
rm, H
igh
Tide
0.
010
00.0
2000
.030
00.0
4000
.050
00.0
6000
.070
00.0
8000
.090
00.0
1000
0.0 [m
]
0.6
0.8
1.0
1.2
1.4
1.6
1.8
2.0
2.2
2.4
2.6
2.8
3.0
3.2
3.4
3.6
3.8[m
]
W
AT
ER
LE
VE
L B
RA
NC
HE
S -
1-1
-199
4 08
:07
5ari.
prf
LTTG
AK1
AH2
AH3
AH4
AHDH
AH5
AH6
AH7
AH8
AH9
AH10
AH11
AH12
AH13
AH14
AH15
AHPL
AH16
AH17
AH18
AH19
AH20
AH21
CAMTG
m3/
sD
isch
arge
-0.0
1.5
3.1
4.6
6.0
-1.6
-2.5
-3.2
-2.2
-0.7
1.2
2.8
4.0
5.6
7.8
10.0
11.4
-6.4
-6.5
-5.3
-3.5
-0.5
1.4
1.9
Hig
hest
Wat
er L
evel
Max
imum
Dis
char
ge
Low
est W
ater
Lev
el
Not
e: M
axim
um d
isch
arge
occ
urs
at ti
me
20:0
7
Water Level
Tim
e
2-100

The
Stud
y on
San
itatio
n Im
prov
emen
t Pla
n fo
r Hai
phon
g C
ity in
The
Soc
ialis
t Rep
ublic
of V
ietn
am
Japa
n In
tern
atio
nal C
oope
ratio
n A
genc
y
Figu
re 2
.3.4
Si
mul
ated
Wat
er L
evel
s
in
An
Kim
Hai
Cha
nnel
:
10
Yea
r AR
I Sto
rm, R
isin
g Ti
de
0.
010
00.0
2000
.030
00.0
4000
.050
00.0
6000
.070
00.0
8000
.090
00.0
1000
0.0 [m
]
0.6
0.8
1.0
1.2
1.4
1.6
1.8
2.0
2.2
2.4
2.6
2.8
3.0
3.2
3.4
3.6
3.8[m
]
W
AT
ER
LE
VE
L B
RA
NC
HE
S -
1-1
-199
4 08
:15
10ar
ir.pr
f
LTTG
AK1
AH2AH3
AH4AHD
HAH5
AH6AH7
AH8AH9
AH10AH11
AH12
AH13
AH14
AH15
AHPL
AH16AH
17AH18
AH19
AH20
AH21CA
MTG
m3/
sD
isch
arge
-9.0
-7.5
-5.8
-4.2
-2.7
-7.3
-7.5
-7.6
-5.9
-3.8
-1.2
1.0
2.7
4.9
7.9
10.9
13.0
0.8
1.3
3.4
6.3
10.5
13.4
14.9
Hig
hest
Wat
er L
evel
Max
imum
Dis
char
ge
Low
est W
ater
Lev
el
Not
e: M
axim
um d
isch
arge
occ
urs
at ti
me
20:1
5
Water Level
Tim
e
2-101
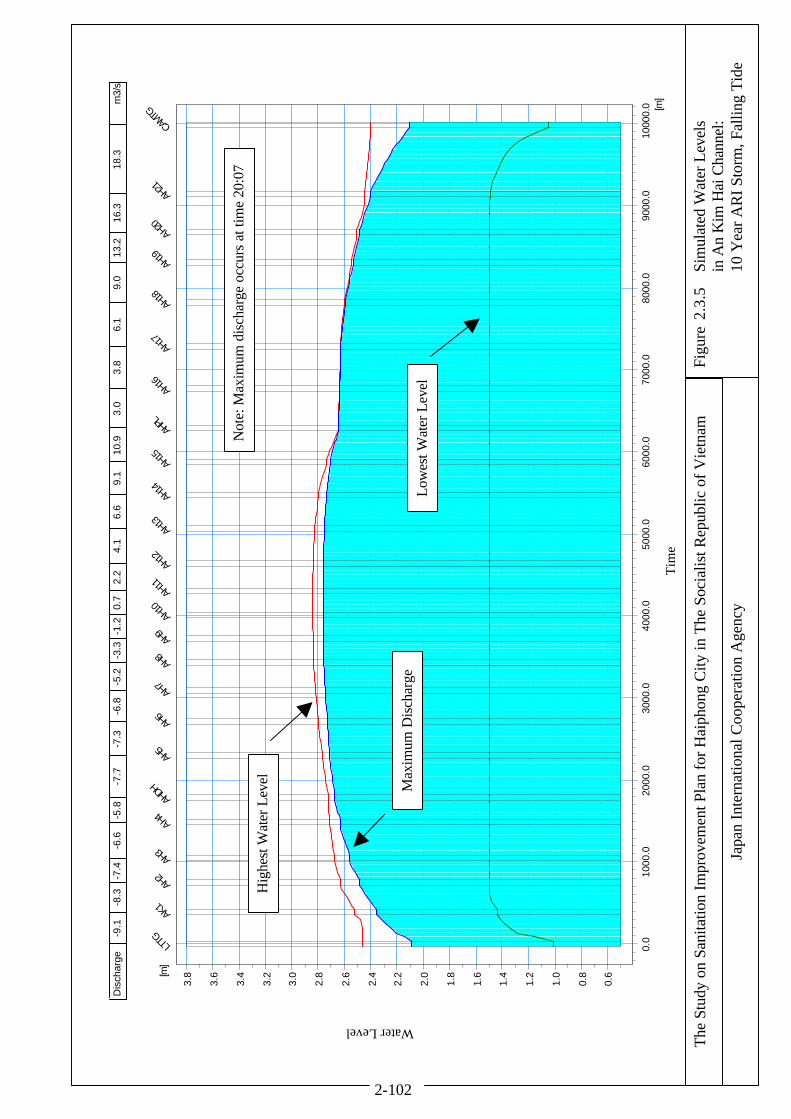
The
Stud
y on
San
itatio
n Im
prov
emen
t Pla
n fo
r Hai
phon
g C
ity in
The
Soc
ialis
t Rep
ublic
of V
ietn
am
Japa
n In
tern
atio
nal C
oope
ratio
n A
genc
y
Figu
re 2
.3.5
Si
mul
ated
Wat
er L
evel
s
in
An
Kim
Hai
Cha
nnel
:
10
Yea
r AR
I Sto
rm, F
allin
g Ti
de
0.
010
00.0
2000
.030
00.0
4000
.050
00.0
6000
.070
00.0
8000
.090
00.0
1000
0.0 [m
]
0.6
0.8
1.0
1.2
1.4
1.6
1.8
2.0
2.2
2.4
2.6
2.8
3.0
3.2
3.4
3.6
3.8[m
]
W
AT
ER
LE
VE
L B
RA
NC
HE
S -
1-1
-199
4 08
:33
10ar
if.pr
f
LTTG
AK1
AH2
AH3
AH4AH
DHAH
5AH
6AH
7AH
8AH
9AH
10AH
11AH
12AH
13AH
14AH
15AH
PLAH
16AH
17AH
18AH
19AH2
0AH
21CA
MTG
m3/
sD
isch
arge
-9.1
-8.3
-7.4
-6.6
-5.8
-7.7
-7.3
-6.8
-5.2
-3.3
-1.2
0.7
2.2
4.1
6.6
9.1
10.9
3.0
3.8
6.1
9.0
13.2
16.3
18.3
Hig
hest
Wat
er L
evel
Max
imum
Dis
char
ge
Low
est W
ater
Lev
el
Not
e: M
axim
um d
isch
arge
occ
urs
at ti
me
20:0
7
Water Level
Tim
e
2-102

The
Stud
y on
San
itatio
n Im
prov
emen
t Pla
n fo
r Hai
phon
g C
ity in
The
Soc
ialis
t Rep
ublic
of V
ietn
am
Japa
n In
tern
atio
nal C
oope
ratio
n A
genc
y
Figu
re 2
.3.6
O
utlin
e of
Sel
ecte
d D
esig
n La
yout
Fo
r Reh
abili
tatio
n D
esig
n of
An
K
im H
ai C
hann
el
Lac
h T
ray
Tid
al G
ate
Nam
Don
g T
idal
Gat
e
Nor
th
Not
To
Scal
e
Du
Han
g F
low
Gat
e
From
: Lac
h T
ray
Tid
al G
ate
To:
D
u H
ang
Flow
Gat
e --
----
----
----
----
----
----
----
----
---
Len
gth
= 1,
900
m
Top
Wid
th =
12
m
Side
-Slo
pes
= 1:
1.25
M
argi
ns (L
/R) =
5 m
/ 5
m
Ha
Doa
n R
oad
From
: Du
Han
g Fl
ow G
ate
To:
H
a D
oan
Roa
d --
----
----
----
----
----
----
----
----
---
Len
gth
= 6,
550
m
Top
Wid
th =
15
m
Side
-Slo
pes
= 1:
1.25
M
argi
ns (L
/R) =
5 m
/ 5
m
From
: Ha
Doa
n R
oad
To:
Nam
Don
g T
idal
Gat
e --
----
----
----
----
----
----
----
----
---
Len
gth
= 1,
700
m
Top
Wid
th =
20
m
Side
-Slo
pes
= 1:
1.25
M
argi
ns (L
/R) =
5 m
/ 5
m
2 - 103
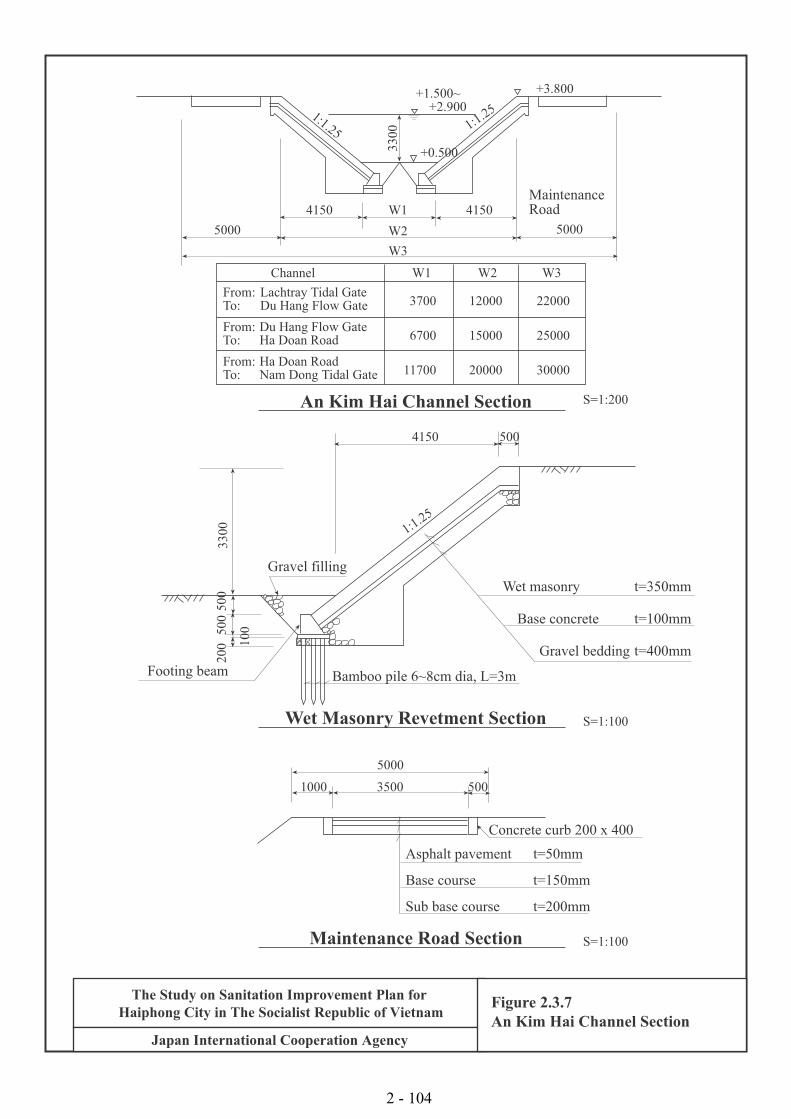
������
����
������
������
�����������������
���� ���� �
� �
����
���������������
����
����� �������� ����� ������ !" #��$ ���% ���
����� !" #��$ ���% ������ #� !��� ����
����� #� !��� ������� &�� !��$ ����� ���
�'��
('��
��'��
�����
�����
�����
�����
�����
�����
)������ � � �
���� ���
������
��*�� +�����$
������$ ,��� -��,�� .��� (�� ���/ �0��
�� ��1���� �0�����
-�1� �������� �0�����
��*�� ,�����$ �0�����
����
���
���
��� ���
23�45��6�� 73�3�836� 93:�;�6
<6 =;8 >5; ?@5663A 93:�;�6 B0�����
B0�����
45;6�3656:3 7�5C 93:�;�6 B0�����
)������� �"�, ��� D ���
E1.���� .�*����� �0����
-�1� ��"�1� �0�����
B", ,�1� ��"�1� �0�����
����
�������� ���
F@3 9��C� �6 956;�5�;�6 G8����3836� HA56 I��>5;�@�6J ?;�� ;6 F@3 9�:;5A;�� 73��KA;: �I L;3�658
M5�56 G6�3�65�;�65A ?���3�5�;�6 <J36:�
N;J��3 OPQPR<6 =;8 >5; ?@5663A 93:�;�6
2 - 104

���� ���� ����������
����
�� �� �����������
���
���
���
���
����
����
����
����
�
�������
�����
��������� ���� ����
����� ���� !
�"�#�
�"�#�
����
����
� $ ���� % & ���� % �'( )�!�) � � ! �!�� � �*���(
&#&#+#,# -�#���
&#+#,# -�#���
,#+#,# -�#���
.�#���-�#���
�� ��� � �����
-�#���
/! )�� ! ��0 !) �) �)! � *�( ��� % ���1 ��� ( �2
34� ��567 �� ���������� 89:;�<�9��� ���� =�;>��:4��? @��7 �� 34� �������A� B�:5C��� �= D�����9
E�:�� 8���;�������� @��:�;����� F?���7
G�?5;� HIJIK3�6�� L��� ���� ��6�������
2 - 105

The Study on Sanitation Improvement Plan for Haiphong City in The Socialist Republic of Vietnam
Figure 2.4.1 Phuong Luu Lake Layout Alternative PL-1
Japan International Cooperation Agency
Tien Nga Lake (Given Condition)
An Bien, Mam Tom and
Quan Ngua Lakes (Given Condition)
Northeast Channel (Given Condition)
Phuong Luu Lake With Connections
(Proposed)
An Kim Hai Channel (Rehabilitation Proposed)
North Not To Scale
May Den Tidal Gate and Pumping Station
(Given Condition)
2 - 106

The Study on Sanitation Improvement Plan for Haiphong City in The Socialist Republic of Vietnam
Figure 2.4.2 Phuong Luu Lake Layout Alternative PL-2
Japan International Cooperation Agency
Phuong Luu Lake With Connections
(Proposed)
An Kim Hai Channel (Rehabilitation Proposed)
North Not To Scale
May Den Tidal Gate and Pumping Station
(Given Condition)
Tien Nga Lake (Given Condition)
Northeast Channel (Given Condition)
An Bien, Mam Tom and
Quan Ngua Lakes (Given Condition)
2 - 107

The Study on Sanitation Improvement Plan for Haiphong City in The Socialist Republic of Vietnam
Figure 2.4.3 Phuong Luu Lake Layout Alternative PL-3
Japan International Cooperation Agency
Phuong Luu Lake With Connections
(Proposed)
An Kim Hai Channel (Rehabilitation Proposed)
North Not To Scale
May Den Tidal Gate and Pumping Station
(Given Condition)
Tien Nga Lake (Given Condition)
Northeast Channel (Given Condition)
An Bien, Mam Tom and
Quan Ngua Lakes (Given Condition)
2 - 108

The Study on Sanitation Improvement Plan for Haiphong City in The Socialist Republic of Vietnam
Figure 2.4.4 Phuong Luu Lake Layout Alternative PL-4
Japan International Cooperation Agency
Phuong Luu Lake With Connections
(Proposed)
An Kim Hai Channel (Rehabilitation Proposed)
North Not To Scale
May Den Tidal Gate and Pumping Station
(Given Condition)
Tien Nga Lake (Given Condition)
Northeast Channel (Given Condition)
An Bien, Mam Tom and
Quan Ngua Lakes (Given Condition)
2 - 109
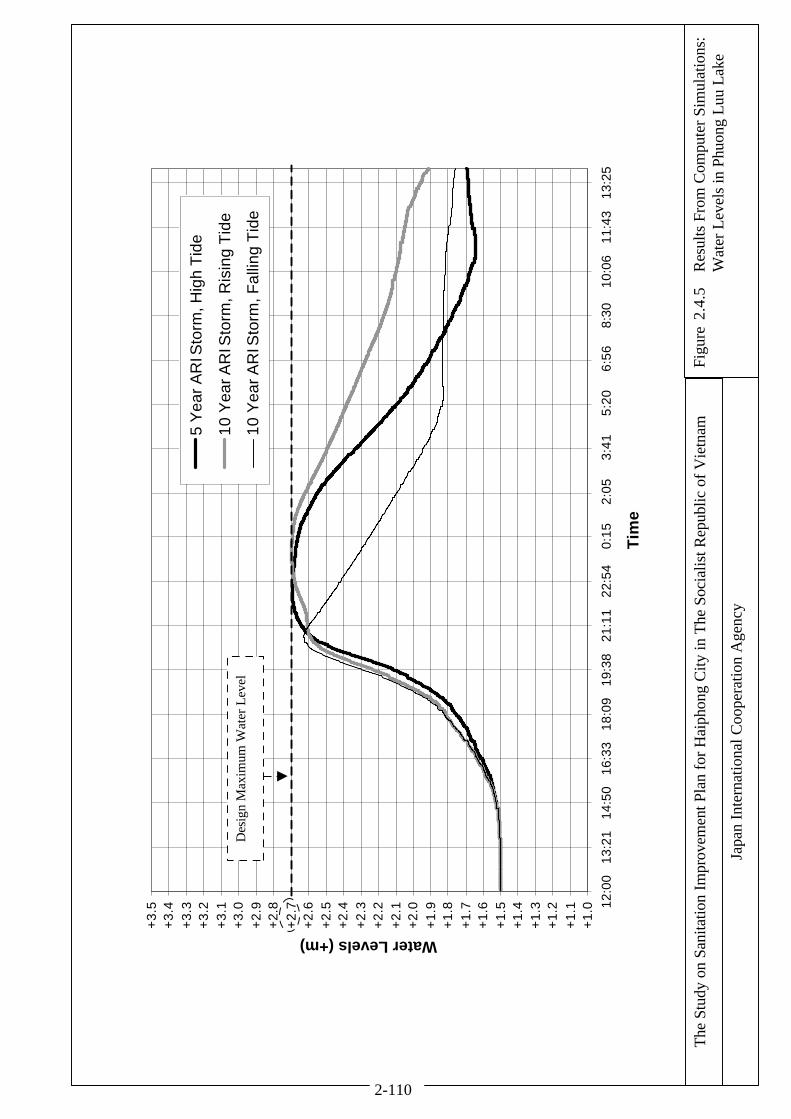
The
Stud
y on
San
itatio
n Im
prov
emen
t Pla
n fo
r Hai
phon
g C
ity in
The
Soc
ialis
t Rep
ublic
of V
ietn
am
Japa
n In
tern
atio
nal C
oope
ratio
n A
genc
y
Figu
re 2
.4.5
R
esul
ts F
rom
Com
pute
r Sim
ulat
ions
: W
ater
Lev
els
in P
huon
g Lu
u La
ke
+1.
0+
1.1
+1.
2+
1.3
+1.
4+
1.5
+1.
6+
1.7
+1.
8+
1.9
+2.
0+
2.1
+2.
2+
2.3
+2.
4+
2.5
+2.
6+
2.7
+2.
8+
2.9
+3.
0+
3.1
+3.
2+
3.3
+3.
4+
3.5 12
:00
13:2
114
:50
16:3
318
:09
19:3
821
:11
22:5
40:
152:
053:
415:
206:
568:
3010
:06
11:4
313
:25
Tim
e
Water Levels (+m)
5 Y
ear A
RI S
torm
, Hig
h T
ide
10 Y
ear A
RI S
torm
, Ris
ing
Tid
e
10 Y
ear A
RI S
torm
, Fal
ling
Tid
eD
esig
n M
axim
um W
ater
Lev
el
2-110

The
Stud
y on
San
itatio
n Im
prov
emen
t Pla
n fo
r Hai
phon
g C
ity in
The
Soc
ialis
t Rep
ublic
of V
ietn
am
Japa
n In
tern
atio
nal C
oope
ratio
n A
genc
y
Figu
re 2
.4.6
R
esul
ts fr
om C
ompu
ter S
imul
atio
ns:
Wat
er L
evel
s in
An
Bie
n La
ke
+1.0
+1.1
+1.2
+1.3
+1.4
+1.5
+1.6
+1.7
+1.8
+1.9
+2.0
+2.1
+2.2
+2.3
+2.4
+2.5
+2.6
+2.7
+2.8
+2.9
+3.0
+3.1
+3.2
+3.3
+3.4
+3.5 12
:00
13:2
114
:50
16:3
318
:09
19:3
821
:11
22:5
40:
152:
053:
415:
206:
568:
3010
:06
11:4
313
:25
Tim
e
Water Levels (+m)5
Yea
r AR
I Sto
rm, H
igh
Tide
10 Y
ear A
RI S
torm
, Ris
ing
Tide
10 Y
ear A
RI S
torm
, Fal
ling
Tide
Des
ign
Max
imum
Wat
er L
evel
2-111

The
Stud
y on
San
itatio
n Im
prov
emen
t Pla
n fo
r Hai
phon
g C
ity in
The
Soc
ialis
t Rep
ublic
of V
ietn
am
Japa
n In
tern
atio
nal C
oope
ratio
n A
genc
y
Figu
re 2
.4.7
R
esul
ts fr
om C
ompu
ter S
imul
atio
ns:
Wat
er L
evel
s in
Du
Han
g La
ke
+1.
0+
1.1
+1.
2+
1.3
+1.
4+
1.5
+1.
6+
1.7
+1.
8+
1.9
+2.
0+
2.1
+2.
2+
2.3
+2.
4+
2.5
+2.
6+
2.7
+2.
8+
2.9
+3.
0+
3.1
+3.
2+
3.3
+3.
4+
3.5 12
:00
13:2
114
:50
16:3
318
:09
19:3
821
:11
22:5
40:
152:
053:
415:
206:
568:
3010
:06
11:4
313
:25
Tim
e
Water Levels (+m)5
Yea
r AR
I Sto
rm, H
igh
Tide
10 Y
ear A
RI S
torm
, Ris
ing
Tide
10 Y
ear A
RI,
Falli
ng T
ide
Des
ign
Max
imum
Wat
er L
evel
2-112
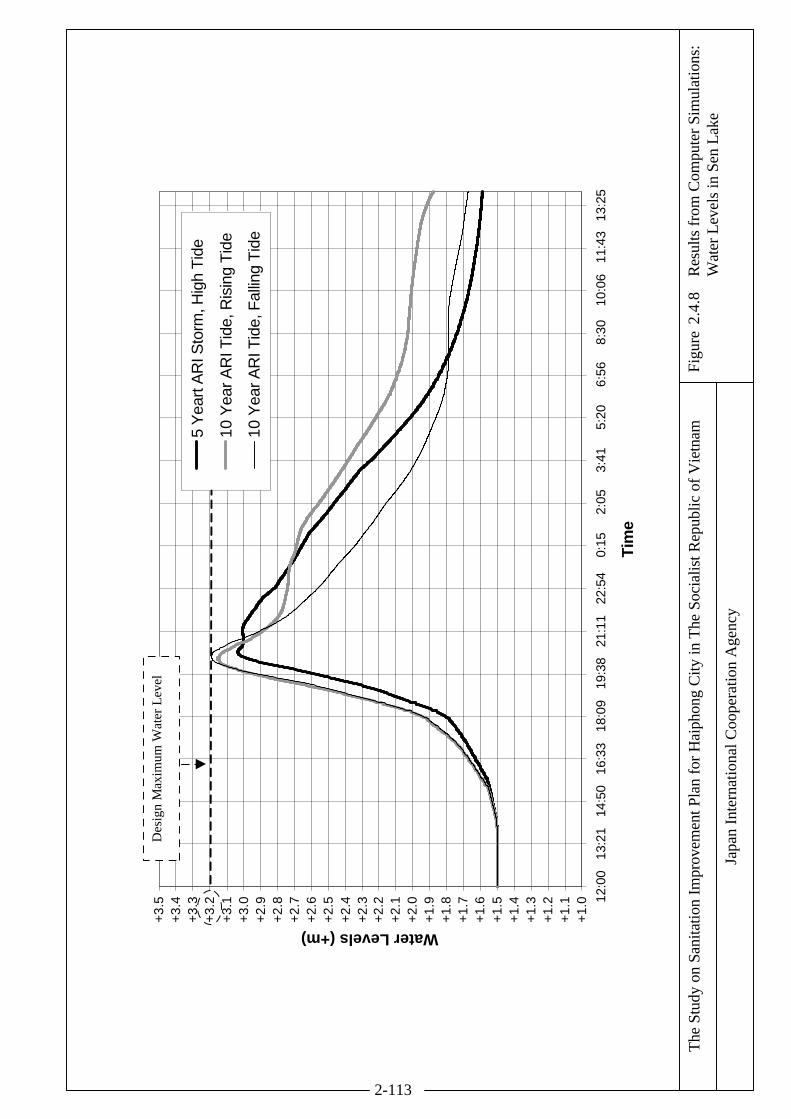
The
Stud
y on
San
itatio
n Im
prov
emen
t Pla
n fo
r Hai
phon
g C
ity in
The
Soc
ialis
t Rep
ublic
of V
ietn
am
Japa
n In
tern
atio
nal C
oope
ratio
n A
genc
y
Figu
re 2
.4.8
R
esul
ts fr
om C
ompu
ter S
imul
atio
ns:
Wat
er L
evel
s in
Sen
Lak
e
+1.0
+1.1
+1.2
+1.3
+1.4
+1.5
+1.6
+1.7
+1.8
+1.9
+2.0
+2.1
+2.2
+2.3
+2.4
+2.5
+2.6
+2.7
+2.8
+2.9
+3.0
+3.1
+3.2
+3.3
+3.4
+3.5 12
:00
13:2
114
:50
16:3
318
:09
19:3
821
:11
22:5
40:
152:
053:
415:
206:
568:
3010
:06
11:4
313
:25
Tim
e
Water Levels (+m)5
Yea
rt A
RI S
torm
, Hig
h Ti
de
10 Y
ear A
RI T
ide,
Ris
ing
Tide
10 Y
ear A
RI T
ide,
Fal
ling
Tide
Des
ign
Max
imum
Wat
er L
evel
2-113

The Study on Sanitation Improvement Plan forHaiphong City in The Socialist Republic of Vietnam
Japan International Cooperation Agency
Figure 2.4.9
North
Not To Scale
Connecting ChannelTotal Length: 500 mChannel Top Width: 15 mMaintenance Roads: Both Sides, Width 7 m
Phuong Luu LakeLake Surface Area: 24 haSite Surface Area: 28 haRoad and Margin Width: 12 m
Lake Access RoadTotal Length: 400 mRoad and Margin Width: 12 mUnderground Box Culvert: 3 x (3.0 m x 2.0 m)
Discharge to An Kim Hai ChannelGates: 3 x (3.0 m x 2.0 m)
Preliminary Layout Design of Phuong Luu Lake and Connections
2 - 114

���� �������� ���������
���
����
� ���
������ �����
������ �����
�����
���� ���� ���������� ��� ���� ������ !"� ���
#$%&�'( )�*)+,(, ("��--.�$, )�/+), ("���--!/00�$, )�/+$, ("���--
1�� 2�3���� ��4��5��� ������ !"� ���
�,( -�$�*+6 ("���--
.�$, )�*)+,(, ("���--
7+�8,' 0,9*: (";��--
.�-0�� %9', <=�)- 9�> �"�-
� ���
���� ���
����
���
;�� ���
?@� �A�� �� ��������� B5C��4�5��� �D�� E��F��C@��G H��� �� ?@� ����D�3� ��CAID�� �E J�����5
K�C�� B�����������D H��C������� LG����
M�GA�� NOPOQR���� ���� ���������� ������� �D�� ��� ������
2 - 115

�������������
� ����
�
����������
� ����
�����������
�����
����
���
����
����
���
���
���
���
����
����
����
�����
��� ��� ���
�������
����
������������������
����
������
� ���
�!���"�������
����
�
#�!�������"
� ����
�
$%&
'()*+,-
'.-/(.(/,-
0123,4&1
&-(56.-7,3
8./2%,-9:/(+/-$%&
',;/.6/<(=
&2)>6/;
,7?/&(-.1
@.2.-0-(&3-.(/,-.6:
,,2&3.(/,-
A9&-;+
B/9)3&CDEDFF
G,H
:)64&3(
IGJDK1
H8CDK1
HJL'&;(/,-
2 - 116
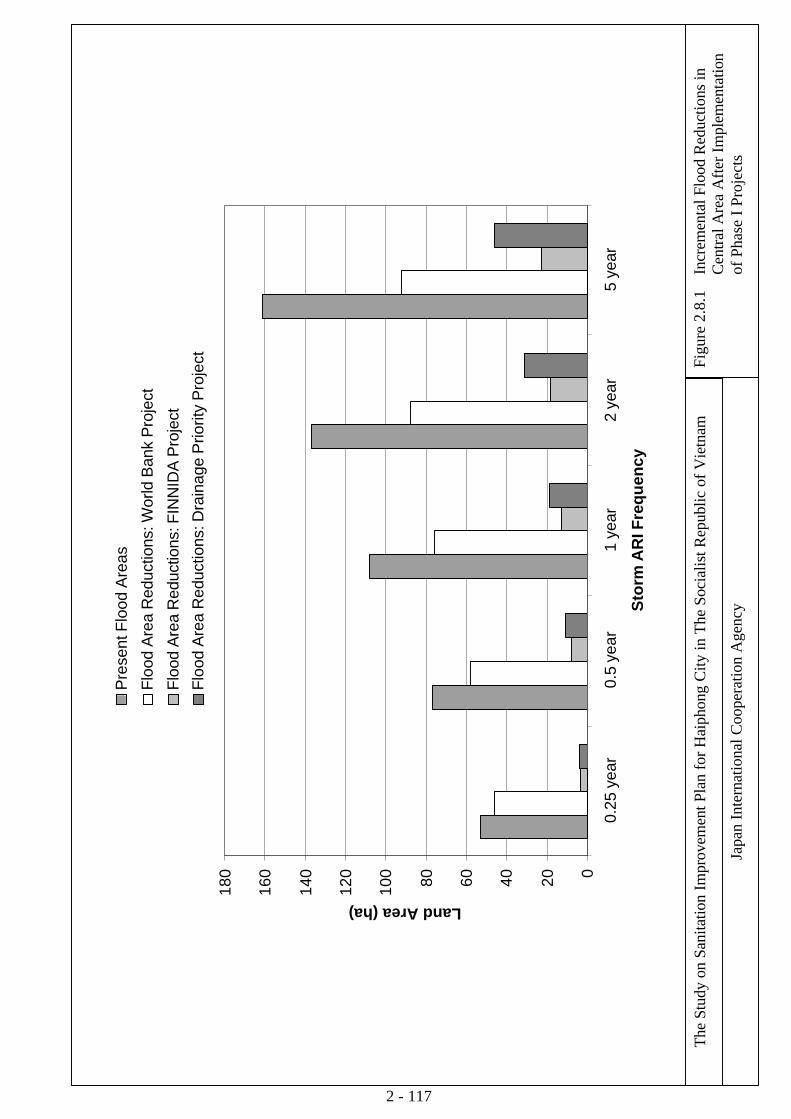
The
Stud
y on
San
itatio
n Im
prov
emen
t Pla
n fo
r Hai
phon
g C
ity in
The
Soc
ialis
t Rep
ublic
of V
ietn
am
Japa
n In
tern
atio
nal C
oope
ratio
n A
genc
y
Figu
re 2
.8.1
In
crem
enta
l Flo
od R
educ
tions
in
C
entra
l Are
a A
fter I
mpl
emen
tatio
n
o
f Pha
se I
Proj
ects
020406080100
120
140
160
180
0.25
yea
r0.
5 ye
ar1
year
2 ye
ar5
year
Sto
rm A
RI F
req
uen
cy
Land Area (ha)
Pre
sent
Flo
od A
reas
Floo
d A
rea
Red
uctio
ns: W
orld
Ban
k P
roje
ct
Floo
d A
rea
Red
uctio
ns: F
INN
IDA
Pro
ject
Flo
od A
rea
Red
uctio
ns: D
rain
age
Prio
rity
Pro
ject
2 - 117

The Study on Sanitation Improvement Plan for Haiphong City, Vietnam
Final Report, Main Report, Volume 2, Part 3
3 - 1
PART 3 FEASIBILITY STUDY OF SEWERAGE PRIORITY PROJECT
CHAPTER 1 BACKGROUND
1.1 Sewerage Improvement Master Plan
(1) Background
Sewerage system development was identified in the Master Plan for the target year 2020. The Study Area consists of the following sub-areas.
• Class A area
Class A area comprises existing urbanized areas in the Haiphong City area with high population densities. Class A Areas include Old City Center (OCC) within Hong Bang District, Le Chan District, south of Le Chan District (2 communes), Ngo Quyen District, and west of Ngo Quyen District (4 communes).
• Class B area
Class B area comprise urbanizing areas outside the Haiphong City Area with middle population densities and tourist areas. This includes Kien An District, Do Son Town, and Quan Toan Area.
• Class C area
Class C area comprise rural or undeveloped areas outside the Haiphong City area with low population density where agricultural land use dominates. This includes Minh Duc, New Development Area, and Dinh Vu.
(2) Present Condition of the Study Area
Class A area: Sewage disposal in Class A area is based on septic tanks followed by wastewater discharge into combined sewer network. Wastewater from the combined sewer network is then discharged into the local receiving waters, including the local rivers, lakes and channels.
For Class A area the main problems with sewage management are as follows:
• Lakes and channels are extremely polluted because of very poor sanitation conditions
• Septic tanks are used, but degree of treatment is not effective • The combined sewer system is characterized by tidal water ingress into the
network
Class B area: For Class B area the main problems with sewage management are as follows:
• Septic tanks are used, but degree of treatment is not effective
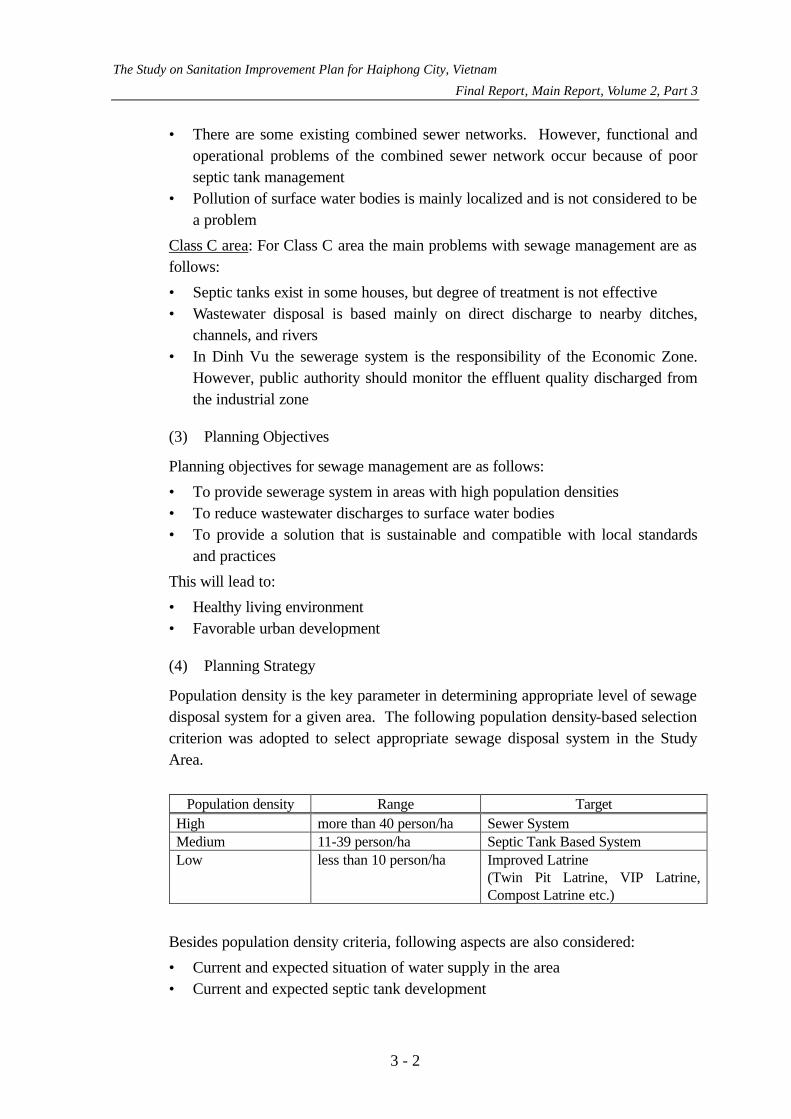
The Study on Sanitation Improvement Plan for Haiphong City, Vietnam
Final Report, Main Report, Volume 2, Part 3
3 - 2
• There are some existing combined sewer networks. However, functional and operational problems of the combined sewer network occur because of poor septic tank management
• Pollution of surface water bodies is mainly localized and is not considered to be a problem
Class C area: For Class C area the main problems with sewage management are as follows:
• Septic tanks exist in some houses, but degree of treatment is not effective • Wastewater disposal is based mainly on direct discharge to nearby ditches,
channels, and rivers • In Dinh Vu the sewerage system is the responsibility of the Economic Zone.
However, public authority should monitor the effluent quality discharged from the industrial zone
(3) Planning Objectives
Planning objectives for sewage management are as follows:
• To provide sewerage system in areas with high population densities • To reduce wastewater discharges to surface water bodies • To provide a solution that is sustainable and compatible with local standards
and practices
This will lead to:
• Healthy living environment • Favorable urban development
(4) Planning Strategy
Population density is the key parameter in determining appropriate level of sewage disposal system for a given area. The following population density-based selection criterion was adopted to select appropriate sewage disposal system in the Study Area.
Population density Range Target
High more than 40 person/ha Sewer System Medium 11-39 person/ha Septic Tank Based System Low less than 10 person/ha Improved Latrine
(Twin Pit Latrine, VIP Latrine, Compost Latrine etc.)
Besides population density criteria, following aspects are also considered:
• Current and expected situation of water supply in the area • Current and expected septic tank development

The Study on Sanitation Improvement Plan for Haiphong City, Vietnam
Final Report, Main Report, Volume 2, Part 3
3 - 3
• Situation of the receiving water quality for treated or raw sewage, that is, seriousness for preserving the quality of the receiving water bodies
• Areas with special interest like ports, tourist spots, industrial areas, etc.
Based on the population density, the appropriate target sewerage systems in 2020 are selected as follows:
Area Population Density (2020) Persons/hector
Target Sewerage System
3 Urban Districts 73 Sewer Kien An Dist. 40 Sewer Do Son Town 11 Septic Quan Toan 14 Septic Minh Duc 22 Septic Dinh Vu -- No action New Development Area 13 Septic
Urban Area (3 central urban districts) and Kien An District are to be served with a sewer system, while other areas in the Study Area are to be served by Septic Tank Based System. No action is proposed in Dinh Vu as wastewater treatment is the responsibility of the Economic Zone Authority. However, proper monitoring is required for the effluent discharged by the Economic Zone to the public water bodies. Since Do Son is a tourism area, a simplified septic tank based sewer system is proposed for the city center and tourism area.
(5) Planning Methodology
A comprehensive sewerage system development master plan for the target year 2020 was prepared. However, the level of particularization differs in each areas. For Class A area, holistic planning was carried out along with an alternative study. Detailed planning was performed for Class B area while outline planning was done for Class C area.
(6) Sewerage Improvement Master Plan for Class A Area
The salient features of the master plan for Class A area is given below.
Catchment Area (Ha)
Beneficiary (2020)
Proposed Sewer System
Implementation Target Year
Central Area 1103 239,938 Combined Sewer 2010 Old City Center (OCC) 856 121,452 Combined Sewer 2020 New Urban Area (NUA) 3282 193,939 Separate Sewer 2020 Total 5241 555,329 -- --
In the M/P, two wastewater treatment plants (WWTP) are proposed and accordingly the whole area is divided into two segments, namely, West WWTP

The Study on Sanitation Improvement Plan for Haiphong City, Vietnam
Final Report, Main Report, Volume 2, Part 3
3 - 4
command area and East WWTP command area. The coverage and beneficiary of these command areas are given below.
Area, population and sewage generation by treatment plant command area Catchment Population (2020) Area (ha)
West Wastewater Treatment Area 439,079 2,654 Phase I Combined sewer system Central Area 239,938 (2010) 1,103 Phase II Combined sewer system Old City Center 121,452 856 Combine sewer extension Central Area 259,286 1,103 Separate sewer system Part of NUA 58,341 695 sub-total(Phase II) 439,079 1,551
East Wastewater Treatment Area 135,598 2,587 Phase II Separate sewer system Part of NUA 135,598 2,587
Grand Total 574,677 5,241
Sewage generation was estimated based on water consumption. Total water consumption includes domestic, industrial and institutional water consumption. Sewage generation is calculated considering sewage generation ratio, sewerage service ratio and groundwater infiltration. Estimated sewage generation in 2020 is 87,485 m3/day.
The planned wastewater quality for 2020 is proposed as follows: • Domestic wastewater: 50 g/c/d of BOD • Commercial wastewater: 350 mg/l of BOD • Industrial wastewater: 400 mg/l of BOD
Considering the unit water consumption of 130 l/c/d (based on water supply sector of the master plan), the pollution load for domestic wastewater is 380 mg/l before considering groundwater infiltration. With 10 % groundwater infiltration, the load is 350 mg/l.
Treated wastewater quality was decided in conformity to the effluent standards in Vietnam. Considering the rivers surrounding Haiphong, the effluent quality should meet Class B river requirements, which is 50 mg/l of BOD.
Based on the design principle explained before, required sewerage facilities are estimated and given in Table 3.1.1 and shown in Figure 3.1.1. Based on the proposed facilities and unit costs, costs estimates of the Project are worked out. The total cost is estimated at US$152 million as direct construction cost. Phase I direct construction cost is US$50 million. The total compensation is US$3.2 million, out of which Phase I requirement is US$2.2 million.
For the east treatment plant, a stabilization pond is most recommended because land is likely to be available for this relatively small-scale treatment plant, though actual land acquisition is yet to be carried out.

The Study on Sanitation Improvement Plan for Haiphong City, Vietnam
Final Report, Main Report, Volume 2, Part 3
3 - 5
For the west WWTP, five treatment options are closely examined. These are Wastewater Stabilization Pond (WSP), Modified Wastewater Stabilization Pond (MWSP), Aerated lagoon (AL), Oxidation Ditch (OD) and Conventional Activated Sludge Process (CAS). A summary of salient features for the five options is given in Table 3.1.2. It can be found from the table that the effluent BOD load is less than Vietnam standard of 50 mg/l of BOD for all cases except MWSP, in which case it is around 100 mg/l. The required land area is lowest for CAS at 12 ha while it is highest for WSP at 130 ha. The construction cost is lowest for MWSP at US$25 million. The O&M cost is also lowest for MWSP at US$0.6 million/year.
For in-depth understanding and comparison of cost, all direst and O&M costs are converted into net present value. Two discount rates are used, namely 5 % and 8 %. Summary is given below.
Net Present Value Unit: US$1,000
Discount Rate Process 5% 8%
WSP 30,102 22,015 MWSP 24,064 17,254 AL 32,965 21,820 OD 43,784 28,638 CAS 55,645 36,023
At 8 % discount rate, MWSP is the cheapest and AL is the second cheapest.
In the draft Master Plan, two possible alternative scenarios are proposed. In one option, Modified Wastewater Stabilization Pond (MWSP) will be implemented in Phase 1, which will be upgraded into Aerated lagoon (AL) in Phase II. In other option, AL will be implemented in Phase 1, which will be continued in Phase II.
However, it is to be noted that the effluent quality of MWSP cannot meet Vietnam effluent standard. Thus, the most recommended option is AL.
(7) Sewerage Improvement Master Plan for Class B and C Areas
Similar methodology was used for Class B area as that used for Class A. Since septic tank based system is sufficient for Quan Toan, facilities planning and cost estimates were carried out for Kien An and Do Son. As no central sewer system is required for Class C, improved latrine and hygienic sanitation is proposed for that area.
(8) Total Cost and Implementation
The total cost for sewerage development for the entire Study Area is US$207 million. Phase I cost is US$69 million.

The Study on Sanitation Improvement Plan for Haiphong City, Vietnam
Final Report, Main Report, Volume 2, Part 3
3 - 6
Construction of the sewerage project is expected to start from 2004. However, pre-construction activities should start from 2001 in order to facilitate smooth implementation of the Project.
(9) Nightsoil and Septage Management
Since the construction of WWTP for the Phase I of the Class A area is expected to be completed by 2006, strategies for nightsoil and septage management were drawn as an interim measure. Total cost for this component is US$15 million.
1.2 Selection of Sewerage Priority Project
Based on the selection criteria explained in previous chapter, Phase I for the Class A area is selected for the priority project.
The salient features of the sewerage priority project is as follows:
• Location Central area of Class A area • Area 1103 ha • Population 240,000 (in 2010) • Collection System Combined Sewer System • Estimated Sewage 36,000 m3/day (in 2010) • Treatment Plant Near Vinh Niem Tidal Gate • Construction Cost US$50 million • Land acquisition US$2.2 million • Total Direct Cost US$52.2 million • Implementation Period 2004 to 2010
The Study on Sanitation Improvement Plan for Haiphong City, Vietnam
Final Report, Main Report, Volume 2, Part 3
3 - 7
CHAPTER 2 SEWERAGE PRIORITY PROJECT
2.1 System Concept of Priority Project
In the project area, at present most of the households have septic tanks. The effluent of the septic tanks enters into the combined sewer where it gets mixed with gray water and during rainy time, with storm water. Main sewers collect combined flow from branch and tertiary sewers and discharge into lake, channel and rivers.
The sewerage priority project proposes to intercept the combined flow before it enters into the surface water bodies and separate sewage from storm water by the means of Combined Sewer Overflows (CSO). Collected sewage is to be collected by sewer pipelines to the wastewater treatment plant (WWTP). The system concept is shown in Figure 3.2.1.
The principal advantage of this system is that all existing combined sewer pipes can be utilized. This will reduce to investment cost and implementation time.
2.2 Compatibility with Other Projects
(1) Related On-going Projects for Sewerage
The proposed World Bank Sanitation Project consists of the following system and facility measures for sewerage improvements:
• Construction of interceptor sewers for 2 lakes in Class A area: Le Chan District (Sen Lake) and Ngo Quyen District (Tien Nga Lake)
• Construction of septage treatment facilities at Trang Cat Landfill • Procurement of sewer cleaning and septage collection vehicles and vacuum
trucks • Revolving fund for households to purchase and install septic tanks
The project is divided into various components. Tender for vehicle procurement component was completed while other components are yet to start. All components are supposed to be completed by 2005.
Proposed FINNIDA projects consist of the following system and facility measures for sewerage improvements:
• Rehabilitation and construction of pilot scale wastewater collection and treatment system in Dong Quoc Bin area in Ngo Quyen District
This is not included in the on-going phase. There is no fixed timetable for the implementation.

The Study on Sanitation Improvement Plan for Haiphong City, Vietnam
Final Report, Main Report, Volume 2, Part 3
3 - 8
(2) Relation between Priority Project and Other On-going Projects
Interceptor Sewer (1B): Details are not finalized yet. If these interceptors completely cover the perimeter of two lakes (Sen and Tien Nga), few CSOs can safely be eliminated from the SPP.
Septage Management (1B): Even after the implementation of the SPP, these facilities can serve Old City Center and New Development Area until the implementation of Phase II. Also SADCO is planning to have a business enterprise for septage management, which can use these facilities to serve areas outside the urban districts, namely Kien An or Do Son. In other ways, the septage treatment plant can be used as sludge treatment plant for the sludge coming out from the proposed Wastewater Treatment Plant. The vehicles can be used as sewer and manhole cleaning vehicles.
Pilot Treatment Plant (FINNIDA): This plant is very small and pilot scale in nature. This will have no impact on the SPP.
2.3 Project Components
The facilities for sewerage priority project consist of five components, namely combined sewer overflows (CSOs), sewer pipelines, pumping stations, wastewater treatment plant and supplementary component. CSOs will be placed at the outlet of combined sewer pipes discharging into surface water bodies. CSOs will separate wastewater from storm water. Pipes will be constructed to collect wastewater separated by CSOs. These will deliver wastewater into main collector pipe. Main collector pipe is proposed to be placed along the National Road No. 5. This will collect wastewater from sewer pipes and transport the wastewater to the WWTP near the Vinh Niem Tidal Gate. Sewage lift pump is to be placed in case gravity flow becomes difficult. Sewage is to be treated in WWTP satisfying VN standard before discharging into river. Storm water separated in CSOs is to be allowed to bypass into surface water bodies.
2.4 Planning and Design Methodology
(1) Collection Principle
The existing combined sewer pipes are collecting most of the sewage at present except from the houses located near the water bodies, which directly discharge their wastewater into the water bodies. Based on the relative elevation of the land and sewer pipe, catchment of the each outlet is identified. The amount of discharge at each outlet is calculated based on water consumption. At the outlet, CSOs are placed to intercept and separate the sewage. Storm water is allowed to bypass into the surface water bodies while sewage is collected through new sewage pipes.

The Study on Sanitation Improvement Plan for Haiphong City, Vietnam
Final Report, Main Report, Volume 2, Part 3
3 - 9
In the Study, three types of sewage pipelines are proposed, namely, conveyance, trunk and lateral. Wastewater is collected from lateral to trunk and from trunk to conveyance. The major sewage pipeline, which delivers all collected wastewater to the treatment plant, is called conveyance. Typically it will have a bigger diameter and will be placed rather deep in the ground. All pipelines delivering wastewater to conveyance is named as trunk. Pipelines delivering wastewater to trunk is named as lateral.
The capacity of the sewer pipelines are to be designed to collect the volume equal to 3 times the Average Dry Weather Flow (ADWF) for the year 2020. ADWF is the flow that occurs in the sewer system when there is no rainfall, essentially this means the sewerage only. Also, sewage collection for Phase II area is considered during the pipe dimensioning. Lift pumping stations are required when sewer elevation becomes too deep. Conveyance pipe delivers the sewage to the WWTP, where 1 x ADWF is treated before discharge into river. This amount is equal to the total sewerage generated. During storm, 3x ADWF amount of flow will enter the treatment plant. At that time, full treatment will be provided to 1 x ADWF. Only preliminary treatment is carried out for the remaining 2 x ADWF flow, but this will occur only during the rainfall. The system mechanism is shown in Fig. 3.2.2.
For areas where combined sewer pipes do not exist, new combined sewer pipes are proposed under ‘Drainage Priority Project’. For areas where existing combined sewer pipes are not functioning properly and will not be rehabilitated under any on-going and planned project, rehabilitation measures are also proposed under ‘Drainage Priority Project’.
For the houses now directly discharging their sewage into the surface water bodies due to lack of nearby sewer pipes, interceptor pipes are proposed under ‘Sewerage Priority Project’ as supplementary components, which is explained in Chapter 7 of Part 3.
Laterals and trucks are designed in a way so that minimum numbers of trunks and minimum numbers of pumping stations are required to reduce the cost and implementation time. Also, due consideration is given to the fact that these pipelines will be used to carry wastewater from the Phase II area in future.
(2) Collection Coverage Area
The coverage area for the priority project is examined critically from hydrological, hydraulic, hydrogeological, and topographic points. Also, existing, on-going and planned facilities related with drainage, sewerage and other relevant sectors are also duly considered.
The boundaries of the coverage area are marked by rivers and channels, railroad and National road No.5. On the northern side the boundary is the railroad and Da

The Study on Sanitation Improvement Plan for Haiphong City, Vietnam
Final Report, Main Report, Volume 2, Part 3
3 - 10
Nang Street, on the east it is the proposed Phoung Luu Lake and Northeast channel, on the south it is the National Road No. 5, and on the west it is the Lach Tray River. The modified area is shown in Figure 3.2.3.
(3) Collection Sub-catchments
From the topographic, hydraulic and location viewpoints, it is proposed to locate one major conveyance pipe along the road no. 5. The whole cover area is proposed to be divided into three sub-catchments oriented in the north south direction. These are west, central and east sub-catchments lying between the railroad and road no.5. The west sub-catchment is the area west of Du Hang Lake, while the east sub-catchment is the area east of An Bien Lake. The area between these two is the central sub-catchment.
(4) Organization of the Report
In the subsequent sections, project components are illustrated. These include Combined Sewer Overflows, sewer pipelines, pumping stations, and treatment plant. In each component, planning issues and design criteria are explained first, followed by alternative study and selection of the most recommended alternative. Finally detail technical design is presented. Supplementary components of the project are explained after that. This is followed by implementation schedule and cost estimates. Finally, issues like institutional and organizational development, EIA and project evaluation are presented.
The Study on Sanitation Improvement Plan for Haiphong City, Vietnam
Final Report, Main Report, Volume 2, Part 3
3 - 11
CHAPTER 3 COMBINED SEWER OVERFLOWS (CSO)
3.1 Planning Issues and Design Criteria
(1) Identification of Command Area of Outlet
Based on the information of existing and planned combined sewer pipes in the Sewerage Priority Project (SPP) area, every outlet of the combined sewer into the surface water bodies is identified. Sewer line survey conducted under the Study provided the information of the existing pipelines while SADCO provided information of the planned pipelines under 1B project. The command areas of sewage collected into each outlet are also identified based on ground elevation, flow direction inside the sewer and other related information. Based on water consumption, amount of sewage expected in each outlet in 2020 is calculated. There are 65 such CSO command areas are identified and shown in Fig. 3.3.1.
(2) CSO Location
CSOs can be placed at each existing outlet or these can be placed after combining a number of outlets. In the first case, though number of CSOs will be higher, operation and maintenance will be simple since the size of the CSOs will be rather small. In the second option, new combined sewer pipes have to be constructed to combine a number of outlets. These pipes will have bigger diameter since these are combined sewer. Also the depth will be higher since these will be placed after the existing outlet. In many cases small pumps will be required. The size of the CSOs will be bigger and will require constant monitoring and skilled maintenance. Manual control will be difficult, and will require expensive mechanical instruments. In this option, number of CSOs will be fewer but it would require skilled maintenance and expensive installation.
Considering the investment cost and importance of proper maintenance required to ensure the smooth functioning of the whole system, CSO control structure is placed at each existing outlet. However, in this case, more manpower is required to maintain the system.
3.2 Alternative Study
(1) Types of CSOs Control Structure
CSOs are well known and widely practiced method used to separate sewage from the combined sewer flow. In USA, over 45 % of the communities with population over 100,000 have some kind of CSO control structure. There are various types of CSOs in practice. Briefs of some of these are given as follows.
The Study on Sanitation Improvement Plan for Haiphong City, Vietnam
Final Report, Main Report, Volume 2, Part 3
3 - 12
Side Weir Type: Typically consists of a weir parallel to the wastewater flow located in the side of the sewer pipe. The weir should be high enough to prevent any discharge of dry-weather flows, but low and long enough to discharge the required excess flow during the wet weather.
Transverse Weir: A weir or small dam placed directly across the sewer, perpendicular to the line of flow, is used to direct ADWF to the interceptor sewer (Fig. 3.3.2). Increase of flow during wet weather results in flow overtopping the weir and discharging to the overflow outlet.
Orifice: These diversion structures allow flow from combined sewer to pass through a circular or rectangular office and enter the interceptor. The orifice is sized to allow the ADWF, and possibly some of the wet weather flow, to pass. The orifices can be oriented in a variety of ways, including horizontally at the invert of the sewer known as ‘drop inlet’, and vertically on the side of the weir (Fig. 3.3.3). Often these types of CSOs are used in conjunction with a transverse weir.
Leaping Weir: A leaping weir is formed by an opening in the invert of a sewer of such dimensions as to permit ADWF to fall through the opening and pass to the interceptor. During storms, the increased velocity and depth of flow cause most of the flow to leap the opening and enter the overflow outlet. The steel weir plate is normally designed so that it can be adjusted for various flow conditions.
High Outlet Regulator: A variation of orifice type CSO in which the invert of the overflow pipe is typically above the crown of the combined sewer.
Relief Siphon: This is a means of regulating the maximum water surface elevation in a sewer with smaller variations in high water level than can be obtained with other devices. A siphon works automatically and does not require any auxiliary mechanisms. The siphon inlet is typically set as far below the top water level as possible to minimize the carryover of floating scum and debris to the overflow outlet.
Mechanical Regulator: This is also known as automatic regulator or reverse taintor gate regulator. This responds to the water level in the combined sewer or interceptor sewer. In either case, the float travel and the corresponding gate travel may be adjusted to regulate closely the flow to the interceptor.
Gate Regulator: The principal is same as mechanical regulator except the gates are controlled manually (Fig. 3.3.4).
Tipping Plate Regulator: In these devices, the plate or gate is pivoted off-center, and its motion is controlled by the difference of water levels above and below the gate. Multiple gates can be used to increase the capacity of an installation.
Hydro Brake Regulator: The configuration imparts a more-or-less centrifugal motion to the entering fluid. This action, which commences when a predetermined
The Study on Sanitation Improvement Plan for Haiphong City, Vietnam
Final Report, Main Report, Volume 2, Part 3
3 - 13
liquid head has been reached, effectively reduces the rate of discharge. This device has been used extensively on combined sewers to limit the flow to the interceptor, thus maximizing storage in the combined sewer.
Vortex CSO: This is a new type of weir, which uses the helical vortex motion created by special internal shape. There are no moving or mechanical parts, thus it is easy to operate and maintain. This not only limits the excess flow into the interceptor sewer during wet weather, but also due to centrifugal force generated inside, it can separate suspended solids.
(2) Selection of CSOs Control Structure
The following factors are carefully considered during the selection process of CSO control structure for the Study:
• Construction cost • Size • Ease of construction • Required maintenance • Design simplicity
Three types of CSO control structures are considered as suitable for Haiphong. Orifice type CSO is selected to be placed when the command area is less than 10 ha. For command areas more than 10 ha, either gate type or weir type CSO is selected. In case the risk of tidal ingress is low, weir type CSO is to be placed. On the other hand, gate type is suitable to prevent outlet water back-flow. A brief description is given below.
Type Command Area Merits and demerits
Weir More than 10ha It is maintenance free, but it is difficult to control the quantity of overflow. When outfall water level rises, water may flow backward.
Gate More than 10ha The volume of intercepted wastewater is controlled by the gate. It requires manual control.
Orifice Less than 10ha In case of small area, orifice type can be adopted to reduce maintenance. However, a functional decline due to a blockage is expected.
Type of each CSO is determined based on the criteria explained before. As most of the large outlets have the tidal influence, gate type CSOs are proposed for large outlets. This will require manual control of the gate in case of heavy rainfall. Since the gates are small in nature, one staff can operate around 10 gates. Location of CSOs are shown in Fig. 3.3.1.
It can be mentioned here that because of the selection of gate type CSO for the inlet with tidal influence, SPP becomes fairly independent from the drainage

The Study on Sanitation Improvement Plan for Haiphong City, Vietnam
Final Report, Main Report, Volume 2, Part 3
3 - 14
priority project. A good share of benefits from the SPP can be obtained even it is implemented without the drainage priority project.
In developed nations, various levels of treatment process are employed for the by passed storm water coming out of the CSO. Considering cost involvement and degree of expected pollution, no such treatment is proposed in the Study.
3.3 Technical Design
(1) Methodology for Sewage Generation Estimation
In the Master Plan Study, sewage generation estimation for the SPP area was provided in Table 4.3.6 (of Volume 1, Main Report). This generation includes ward or phoung wise domestic, commercial, institutional and industrial sewage generation. The calculation considered sewage coverage area ratio, and sewerage service ratio. However, the CSO command area is different from the phoung boundary. As a result an indirect approach is used to calculate the sewage generation for each CSO command area.
Area for each CSO command area is measured from the topographic maps. Each command area includes more than one phoungs. Considering the area of various phoungs included in each command area, a weighted population density is adopted for each phoungs from the population density estimated in the Master Plan Study for each phoungs. Population of each phoung is thus calculated by multiplying the area and weighted population density. However, the total population calculated in this way is slightly different (2 %) from the phoung wise total population. This difference is again adjusted based on the area of each command area. The entire calculations are shown in Table 3.3.1.
Population of each command area is used to estimate domestic sewage generation. However, district level data is used to estimate commercial, institutional and industrial sewage generation. The total sewage generation for these categories is estimated by multiplying the area of each command area with the unit sewage generation for respective districts. To make this estimation more representative, water bodies are excluded from the area calculation.
Table 3.3.2 shows the area of lake in the West Treatment Area. Table 3.3.3 shows the district wise land area excluding water bodies. Unit sewage generation for each district and for each category is calculated based on the land area excluding water bodies. A summary of this calculation is given in Table 3.3.4.
Domestic sewage generation for each command area based on command area population is calculated later in conjunction with the trunk and lateral layout.
The Study on Sanitation Improvement Plan for Haiphong City, Vietnam
Final Report, Main Report, Volume 2, Part 3
3 - 15
(2) CSO Control Structures
As explained above, Orifice type CSO is proposed for smaller outlets having a command area of less than 9 ha. Gate type orifice is proposed for the large outlets having a command area more than 10 ha. Five different sizes of the gate type CSO are considered based on the command area. Design parameters like unit flow, average flow and pipe size for both storm water and wastewater are given in Table 3.3.5.
Though total number of CSO command area is 65, total number of CSO structures is 61, out of which 41 are gate type and 20 are orifice type. There are 4 command areas where it is not possible to place CSO easily. As a result, manhole pumps (small capacity sewage lift pumps placed inside of a manhole) are placed in each of such 4 areas to transfer the sewage to adjoining command area. The breakdown for each sub-catchment and CSO types is shown in Table 3.3.6.
(3) Bill of Quantities for CSO Control Structures
Bill of quantities for gate type and orifice type CSO control structures are given in Table 3.3.7 and 3.3.8, respectively. These include all materials items like pipes, screen and manhole cover, and all work items like excavation, formwork and de-watering.

The Study on Sanitation Improvement Plan for Haiphong City, Vietnam
Final Report, Main Report, Volume 2, Part 3
3 - 16
CHAPTER 4 SEWER PIPELINES
4.1 Planning Issues and Design Criteria
(1) Basic Criteria
Trunk layout is to be planned in a way so that the number of required trunks and laterals is minimized. This will lead to low investment cost, faster implementation, and less maintenance. Also Phase II implementation was fully taken into consideration, as some of these trunks will carry additional sewage after the completion of Phase II. Diameter, depth and gradient are to be selected considering both Phase I and Phase II. Due consideration is given to the trunk layout so that a minimum number of pumping stations is required. Selection of trunk route based on CSO command area is shown in Fig. 3.4.1.
(2) Flow Consideration
For the design of the pipelines, the following flow is considered:
• Hourly Average Dry Weather Flow (ADWF) 1.5 ADWF • Wet Weather Flow 3 ADWF
(3) Earth Covering and Construction Method
The minimum earth covering is determined at 1.0 m to prevent any collapse of the pipes. The maximum depth of earth covering is determined to be 7.0 m in order to minimize construction cost.
However, the earth covering will increase gradually to satisfy the required gradient. It is conventional that sewage flows in the pipeline by gravity. As the SPP area has relatively flat topography, it is expected that the pipelines will become deep rapidly. When depth is more than 7 meters, earth covering is too big. At that stage, a sewage lift pumping station is required, so that pipes can be placed at shallow depths.
There are various methods of pipeline construction. It is conventional and economic to adopt an open cut method in the case of the depth is in between 1.0 and 4.0 m. However, it is possible to use an open cut method even at the depth of 5.0 m when there are few adverse influences of the construction. For example, open cut method is available even at the depth of 5.0 m in case there are few houses in the vicinity and there is enough room spatially, or when construction is carried out beneath a newly planned road and where there is no inhabitant nearby.
When the earth covering is in between 4 and 7 meters, the pipe-jacking method is adopted. From the restriction of the pipe jacking method, the pipe diameter should be at least 800 mm. When the sewer pipe diameter is under 800 mm decided from

The Study on Sanitation Improvement Plan for Haiphong City, Vietnam
Final Report, Main Report, Volume 2, Part 3
3 - 17
the hydraulic condition, a pipe diameter of 800 mm is adopted due to the restriction of the safety of the pipe jacking method.
(4) Conveyance
From the topographic, hydraulic and location viewpoints, it is proposed to place one major conveyance along the Road No. 5. With this location, it will be easy to collect all the wastewater from the trunks and to transfer that to the WWTP.
4.2 Alternative Study
(1) West Sub-catchment
For the west sub-catchment, five alternative trunk routes are considered. These are shown in Fig. 3.4.2. These are as follows:
• W1 Along the river • W2 Along existing road • W3 Along Southwest channel • W4 Along existing road and Road no.5 • W5 Along planned road
Considering the ease of connection with the combined sewer outlets, W1 is the most recommended option. With this option, only one trunk is required for the whole sub-catchment. However, two laterals are required for the complete collection. Layout is shown in Fig. 3.4.3.
(2) Central Sub-catchment
This is the biggest sub-catchment among the three and the population density is also the highest. For the central sub-catchment, five alternative trunk routes are considered. These are shown in Fig. 3.4.2. These are as follows:
• C1 Along the Du Hang lake • C2 Along existing road • C3 Along planned road • C4 Along existing road • C5 Along the An Bien lake
It is rather difficult to have only one trunk for the central sub-catchment. Considering the ease of connection with the combined sewer outlets, C1, C3 and C5 are the most recommended options. With this option, though three trunks are required for the sub-catchment, it will eliminate the need for a pumping station and laterals. Layout is shown in Fig. 3.4.3.
The Study on Sanitation Improvement Plan for Haiphong City, Vietnam
Final Report, Main Report, Volume 2, Part 3
3 - 18
(3) East Sub-catchment
For the east sub-catchment, four alternative trunk routes are considered. This is shown in Fig. 3.4.2. These are as follows:
• W1 Along the planned road in the western side • W2 Along existing road • W3 Along Northeast channel • W4 Along the planned road in the eastern side
Apparently it is difficult to have only one trunk for the eastern sub-catchment. There can be two choices. First, to have multiple trunks and second, to have fewer trunks with meandering and long layout. Considering the implementation time and connection for the Phase II, it is proposed to have fewer trunks. With this option, two trunks are required for the whole sub-catchment. However, two laterals are required for the complete collection. Layout is shown in Fig. 3.4.3.
(4) Conveyance
Proposed conveyance is divided into three sections. the first section is from the pumping station to the road no. 5. The second section is along the road no. 5. The third section is defined as the section between road no. 5 and the WWTP.
For the first section, that is the portion of conveyance between the pumping station and the Road no. 5, the most optimum location is to place that along the planned Vat Cao extention road.
For the second section, that is the portion of conveyance along the Road no. 5, the most optimum location is to place that along the proposed maintenance road along the An Kim Hai Channel.
For the third section, that is the portion between the WWTP and the Road no.5, a number of options are considered. This is shown in Fig. 3.4.2. These are:
• C-1 along existing road • C-2 along Southeast channel • C-3 along the planned road • C-4 through the industrial area road
C-1 option has a number of limitations due to the narrow width of the road. This will lead to construction difficulty and can not serve as an access road to the WWTP. Under 1B project, a 6 m wide maintenance road will be constructed along the Southeast channel. It will be easy to place conveyance under that road and this can be used as a dedicated access road since the road will be under SADCO control. C-3 option is also feasible, however, the actual implementation is not definite and the road can not be used as a dedicated road. Option C-4 will interfere with the activity of the industrial zone. Thus option C-2 is selected as the route for the third section of the conveyance.
The Study on Sanitation Improvement Plan for Haiphong City, Vietnam
Final Report, Main Report, Volume 2, Part 3
3 - 19
The layout of conveyance is shown in Fig. 3.4.4.
4.3 Technical Design
(1) Gradient and Velocity
The minimum velocity of the wastewater inside the combined sewer pipe is adopted as 1 m/s. This will ensure the self cleaning velocity to prevent deposition inside the pipe. Various hydraulic parameters like slope, hydraulic radius and flow for different pipe diameter are given in Table 3.4.1. All commercially available pipe diameters are covered in the table from diameter of 300 mm to 2000 mm. Gradient is calculated based on required velocity. However, in case the required gradient becomes less than 0.08 %, it is proposed to increase the gradient to 0.08 % to ensure smooth flow. This is the case for the pipe with diameter of more than 1350 mm. Therefore, all pipes with a diameter 1350 mm or more should have a slope of 0.0008. According to the Japanese Sewerage Standard, pipe flow calculated based on minimum velocity and gradient is the full capacity and a safety allowance is required to get the allowable flow. According to that standard, the allowance is 100 % for smaller pipe diameters (from 300 mm to 600 mm), 50 % for the medium diameter pipes (from 700 mm to 1500 mm), and 25 % for the larger diameter pipes (from 1650 mm to 2000 mm).
All the calculations mentioned above are repeated again for the combined sewer pipe. In this case, the minimum velocity is adopted as 0.8 m/s. This calculation is required for dimension pipelines for phase II separate system, which have a direct impact on Phase I pipe dimension.
(2) Design Approach
Each trunk and lateral is divided into segments with nodal value. A schematic layout is shown in Figure 3.4.5. Length, flow, slope, velocity and diameter are calculated for each segment. Invert elevation, and earth covering at each nodal point is also calculated. The whole design calculation is iterative in nature. Only final results are explained here.
Preliminary calculation shows that the east trunk is the governing pipe for the determination of conveyance depth. It is found out that the required depth at the entrance of the treatment plant is around 8m. To reduce the cost and difficulty of construction, operation and maintenance, a sewage lift pumping station is required in the eastern sub-catchment.
Selection of pumping station is also directly related with pipe design parameters like depth and gradient. Location of the pumping station and the pipe design is also an iterative process. Result in one set of calculation is to be fed into the second set and the expected modification is fed into the first set. Pipe design is

The Study on Sanitation Improvement Plan for Haiphong City, Vietnam
Final Report, Main Report, Volume 2, Part 3
3 - 20
only explained here based on selected location for the pumping station. Issues related with pumping station selection are given in the following section.
(3) Calculation for Pipe Diameter and Flow
Detail calculation for pipe diameter and flow is given in Table 3.4.2.
Each pipe is divided into various suitable segments. Each segment in turn receives sewage from a number of command areas, and sometimes from Phase II area. Domestic flow is calculated based on population for each command area. A 10 % infiltration flow is added with the combined domestic, institutional, commercial and industrial sewage generation. A peak factor of 3 is used to accommodate the 3 times ADWF. This flow is then compared with Table 3.4.1 to find the proper pipe diameter and slope. Also the full capacity and allowable capacity are given in the table.
(4) Calculation for Longitudinal Section
Detail calculation for longitudinal section is given in Table 3.4.3.
Length of each pipe segment is measured from the topographic maps. Ground elevation of each nodal point is also taken from the topographic maps. The upstream and downstream invert elevation of each pipe segment is calculated from the length and slope. Subsequently, earth covering at each nodal point is calculated. From the iterative calculation, it was found that the governing invert elevation for conveyance come from East Lateral 2 (ET2). This elevation is used for selecting lift head for the pumping station, which is around 3.5m.
Flow from one segment of East Lateral is not possible to collect since the diameter of that segment is very small, resulting in a higher slope. One manhole pump is placed at that location.
Table 3.4.3 also gives the pipe dimension for the connection pipe lines required after the four manhole pumps required due to special location of command area, which was mentioned before.
(5) Manholes
Manhole interval is set depending on the pipe diameter. It is 50 m for 300 mm dia pipe, 75 m for pipe dia from 400 to 600 mm, 100m for pipe dia from 700 to 1000 mm, 150 m for pipe dia from 1100 to 1500mm, and 200m for pipe dia from 1650 to 1800 mm. The total number of manholes is 190, details of which are given in Table 3.4.4.
Plan and sections of different types of manholes are given in Figure 3.4.6.
The Study on Sanitation Improvement Plan for Haiphong City, Vietnam
Final Report, Main Report, Volume 2, Part 3
3 - 21
(6) Geotechnical Recommendation
The geotechnical conditions of the sites have not been investigated within the Study. The conclusions and recommendations are only based on the earlier soil investigations carried out with borings, with standard penetration tests ( SPT ), auger drillings and sampling, in October - November 1998 in IB Project. Detail results can be found in the Supporting Report.
Concrete, steel or plastic pipes of diameter < 800 mm may be founded on ≥ 150 mm thick compacted sand or gravel layer, when pipes are placed on soft to firm silty sand or silty clay layer (N > 2).
When pipes with diameter < 800 mm are on very soft soil (N < 2), pipes are recommended to be founded on 200mm sand bed rounded with geotextile (filter fabric) and surface of sand bed leveled with 100mm sand layer.
Concrete pipes with a diameter of more than diameter 800 mm should be founded either on concrete slab (d = 100mm) or on timber bed. The need of pile foundation shall be checked during detailed design.
The trenches may be, in general, excavated with nearly vertical sides without supporting up to the depth of 1.3 m. If the backfill is thicker than 2.0m, depth may be 1.8 m. The deeper trenches may be excavated with sloping sides with gradient 2 (vertical) to 1 (horizontal) without support provided that, the bottom of the trench is above ground water level, and the depth of the trench is less than 2.0m.
All trenches that reach below groundwater level shall be supported with watertight sheeting. In addition, it is recommendable to construct vertical supported sides in every case when the depth of the trench is more than 2.5m.
The slopes may be supported either with timber poling boards or with steel sheet piles. The maximum depth of timber poling board is 3.0m. Movable shoring devices may be used when depth is less than 2 m.
(7) Bill of Quantities for Sewer Pipes
All pipes are made of reinforced concrete except the pressure pipes after manhole pumps, which are made of steel. Different types of concrete beddings are required depending on the pipe diameter and depth. Four types of bedding are shown in Figure 3.4.7. For the socket type connections, a rubber ring should be placed inside the joint. This is also given in Figure 3.4.7.
The bill of quantity for the sewer pipe length is shown in Table 3.4.4. This specifies each pipe segment by its construction method, diameter, length and earth covering. The total pipe line length is 19.92 km, out of which 11.77 km is open cut, 7.66 km is jacking and 0.49 km is pressure. A summary is given as follows.

The Study on Sanitation Improvement Plan for Haiphong City, Vietnam
Final Report, Main Report, Volume 2, Part 3
3 - 22
Sewer Pipe Length Unit: meter
Pipe Diameter (mm) Open Cut Pipe Jacking Pressure Pipe 100 0 0 230 125 0 0 260 300 920 760 0 400 1,600 0 0 500 1,780 0 0 600 380 580 0 700 940 0 0 800 550 0 0 900 1,520 440 0
1000 1,700 1,240 0 1100 1,500 330 0 1200 880 2,720 0 1350 0 0 0 1500 0 0 0 1650 0 640 0 1800 0 950 0
Total 11,770 7,660 490
The bill of quantity for the sewer construction is given in Table 3.4.5. It includes all the items required for the construction such as excavation, backfilling, pavement, concrete, formwork, reinforcement bar, de-watering, etc.
The bill of quantity for the manhole is given in Table 3.4.6. Types of manholes are selected based on Japanese Sewerage Standard. There are 5 types of manholes based on base diameter. However, there are different types for the base diameter of 1.5 meter (Type 3 and 3A). The bill of quantity includes all work items required for the construction.
The Study on Sanitation Improvement Plan for Haiphong City, Vietnam
Final Report, Main Report, Volume 2, Part 3
3 - 23
CHAPTER 5 PUMPING STATION
5.1 Planning Issues and Design Criteria
(1) Manhole Pumps
As explained in previous sections, small pumps are required where flow is difficult to ensure. These pumps are placed inside the manhole so it is called a manhole pump. In total five manhole pumps are considered in this Study. Four manhole pumps are required to transfer sewage from certain CSO command area to nearby command area due to difficulty in placing sewer pipelines. One manhole pump is required in East Lateral to ensure allowable depth of the downstream pipelines.
(2) Sewage Lift Pump
From the calculation of trunk layout, a sewage lift pumping station is required in the eastern side. Design is to be done in a way that investment and operation and maintenance (O&M) costs are minimum.
According to the Vietnamese regulation, required buffer zones for a sewage pumping station are 25 m from residential area and 4 m from road.
Though provision for standby pumps is made, no option for generator is considered. The capacities of the sewer pipes are for 3 ADWF. So a power failure during dry weather will not cause serious problem. Power failure during wet weather will cause problems. To solve this problems, a number of ways can be considered. In one option, extra water is allowed to enter into a bypass manhole in the pumping station. This in turn can be delivered into the conveyance by gravity. This may cause inundation of low lands in the vicinity. In the second option, local inundation can be avoided by controlling CSO gates to prevent storm water coming into the pumping station. In this case, total combined flow is discharged into the water bodies. Expecting power failure is for short term during a storm period, this will have minimum impact on surface water quality.
5.2 Alternative Study
(1) Manhole Pumps
A manhole pump is only suitable when the 3 ADWF is less than 0.1 m3/sec. Four different types of manhole pumps are proposed based on flow rate. This is shown in the next table.

The Study on Sanitation Improvement Plan for Haiphong City, Vietnam
Final Report, Main Report, Volume 2, Part 3
3 - 24
Types of Manhole-type relay pumping station
Type Catchment area Wastewater ° Pump dia Pump no. D (well dia) d
(effective depth) ha m3/s m3/min mm m m
MP1 10 0.01 0.6 80 2 1.5 0.8 MP2 15 0.015 0.9 100 2 1.5 1.2 MP3 25 0.025 1.5 125 2 1.8 0.6 MP4 50 0.05 3 150 2 1.8 1.2
All of these types will have the following same criteria:
• Pit type Wet pit • Pump type Vertical detachable submersible pump • Screen type Manual bar screen • Grit chamber Sand trap
(2) Sewage Lift Pump
Three locations are selected for the pumping station site. These are Van Cao, Kieu Son and An Da. Detailed investigation for these sites including topographic survey, geo-technical investigation and environmental impact assessment were carried out. Van Cao is located along the National Road No. 5. A number of ponds and few houses are located in this site. Kieu Son site is also along the National Road No. 5. Though there is a big pond, there are some houses in the site. This site is surrounded by many households. An Da site is far from the National Road No. 5, and along the proposed Van Cao Extenion road. The site is swampy agricultural land with no houses nor structures. There are also very few houses in the vicinity.
An Da site is selected considering:
• No resettlement is required • Cost-effective from technical aspect • Far from National Road no. 5 • Ease of construction as located by the side of planned road • Less earth filling compared to other two sites. • Low expected social and environmental impacts
Site layout for the An Da Pumping Station is shown in Figure 3.5.1, which incorporates the buffer zone.
5.3 Technical Design
(1) Manhole Pumps
Based on the area covered and the flow condition, manhole pump type MP1 is selected for command area W6 and W7, type MP2 is selected for command area W14, type MP3 is selected for command area W15, and type MP4 is selected for

The Study on Sanitation Improvement Plan for Haiphong City, Vietnam
Final Report, Main Report, Volume 2, Part 3
3 - 25
the sewer pipe segment ET2-1. Details of pressure pump, pump head and manhole depth is given in Table 3.5.1.
Plan and section of manhole pump is shown in Figure 3.5.2.
(2) Bill of Quantity for Manhole Pumps
The bill of quantity for the manhole pump is given in Table 3.5.2. It includes all materials and work items required for the construction.
(3) Sewage Lift Pumping Station
Design of the An Da pumping station is given in Table 3.5.3.
The necessary number of pumps is recommended based on Japanese standard, which means capacity of each pump is one-third of the total requirement. There will be 3 pumps and one standby. In the pumping station, there are additional facilities required. These include screenings, grit chamber, scum removal facility, and sludge handling facility. The pit will be of dry type.
The required capacity of the pumping station is 0.535 m3/sec. The required capacity of each pump is 0.178 m3/sec. Diameter of the suction pipe is 300 mm. Actual head is 3.5 m. Including the head loss around pump and force main, required head is 5.5 m. Considering pump efficiency and transmission efficiency, the motor rating is 18.5 kW.
Two screens will be placed before the pump while two grit chambers will be placed after the pump. Screen opening size is between 15 and 25 mm. Grit chamber will be placed on the ground and with retention time of 30 sec. Depth of the sand pit is 30 cm considering a surface loading of 3,600 m3/m2/d for combined sewage. Dimension of the grit chamber is 9 m × 1.8 m × 0.5 m, where 0.5 m is the depth of the chamber.
Plan and section of the pumping station is given in Figure 3.5.3 and Figure 3.5.4, respectively.
(4) Geotechnical Recommendation
The geotechnical conditions of the site have been investigated with rotary drilling and standard penetration tests (SPT) in November – December, 2000. Detail results can be found in the Supporting Report.
The soil stratum has very low bearing capacity (< 40 kPa) and it is compressible. The settlements due to 20 kPa additional load will be about 150 - 200 mm. The recommended foundation method for the pumping station is pile foundation. Piles should reach to stiff low plastic clay (layer 5). The estimated bearing capacity of

The Study on Sanitation Improvement Plan for Haiphong City, Vietnam
Final Report, Main Report, Volume 2, Part 3
3 - 26
25 m long cohesion/friction concrete pile (300 mm × 300 mm) is only about 150 kN.
(5) Bill of Quantity for Sewage Lift Pumping Station
The bill of quantity for the pumping station is given in Table 3.5.4. It includes both civil works component and electrical/mechanical components.

The Study on Sanitation Improvement Plan for Haiphong City, Vietnam
Final Report, Main Report, Volume 2, Part 3
3 - 27
CHAPTER 6 WASTEWATER TREATMENT PLANT (WWTP)
6.1 Planning Issues and Design Criteria
(1) Location
The proposed location for the WWTP in the Master Plan of the Study was identical to that proposed by Haiphong Sanitation master plan. Land available at that area is about 10ha. This restriction compels to select Activated Sludge Process only. In the M/P of the Study, Aerated Lagoon (AL) was the most recommended option followed by Modified Stabilization Pond (MSP). Both require more land than 10 ha available at the site. Moreover, a new industrial zone is proposed to be established at that site.
The Study thus proposed to shift the location of the WWTP to further south near the Lac Tray River. The present land use is principally agricultural in nature. Land availability is enough to accommodate the WWTP. Though land acquisition for Phase I is sufficient during the Phase I implementation, steps should be taken to prohibit other uses for the Phase II area. This is very important to ensure smooth operation of the treatment plant, either MSP or AL.
(2) Buffer Zone
According to VN regulation, a buffer zone is required around the WWTP, the values depending on the plant size. For the present case, it is 25 m from dike, 10 m from provincial road and 5 m from waterways.
6.2 Alternative Study
(1) Location
For the AL as treatment process minimum land requirement is around 27 ha total in Phase I and Phase II without required buffer zone. Including the buffer zone (which is a requirement of Vietnamese Regulation) and operational buildings, land requirement is 38 ha.
Because of the land availability, the Study proposed to shift the location of the WWTP as proposed in the draft master plan to further south near the Lac Tray River. The present land use is principally agricultural in nature. In the vicinity of the proposed WWTP, there is an existing dike. A number of roads are planned to be constructed in that area. In this location, area available is around 31 ha. Thus, available land even in this newly proposed area is not enough to accommodate the WWTP.
Considering all alternatives, the Study proposes to relocate the dike and shift one road slightly. The present dike is far from the river edge and vast area is not

The Study on Sanitation Improvement Plan for Haiphong City, Vietnam
Final Report, Main Report, Volume 2, Part 3
3 - 28
utilized for any purpose. By relocating the dike, this unutilized land can be effectively used for the WWTP. Shifting of the dike would be between 50 and 100 m. The Study also proposes to shift the north-south oriented road for about 60 m towards west to make it possible to construct the WWTP. Area available after relocating the dike and road is around 38 ha, which is sufficient to construct the treatment plant. The proposed site details are shown in Fig. 3.6.1.
These proposed relocation would cause little adverse impact. Shifting of dike will not cause any performance decrease for the flood control purpose. Shifting of road also has no negative impact on transportation or urban planning.
The total sewerage priority project is shown in Fig. 3.6.2.
(2) Treatment Process
In the draft Master Plan, MSP and AL were proposed. Though MSP is the less expensive method, it requires larger land and its effluent quality cannot satisfy VN standard. After detail discussion with PMU, TUPWS, SADCO and UPI, it was decided to adopt AL as the treatment process. This will require a land of around 38 ha total in Phase I and Phase II.
6.3 Technical Design
(1) Basic Principle
The WWTP will be designed giving full consideration about the Phase II. As a result, a number of facilities will be designed with capacity including Phase II. For all other facilities also, provision will be kept for the extension in the Phase II.
At the entrance of the WWTP, a lift pumping station is required. The capacity of the pumping station will be 3 ADWF. After that preliminary treatment facility will be placed for the 2 ADWF flow. Preliminary treatment facilities will consist of a settling pond of 3 hour retention time and a chlorination tank for disinfection. This will be used in the wet weather to provide certain treatment. The settling pond will store water for the first 3 hours and stored water will be returned to the secondary treatment line after the rain stops. This will ensure proper treatment for the first flash for a 3 hour period. Any flow occurring after first 3 hours will pass through chlorination tank for disinfection before bypassing into the river. The secondary treatment will consist of a series of aerated lagoon for the capacity of 1 ADWF. Settling tanks will be placed after that to separate sludge. Before discharging, the flow will pass through a chlorination tank for disinfection.
The treated wastewater will be discharged into the Lac Tray River. There is no water intake down stream of the treatment plant, thus it is a Class B river according to the Vietnamese standard. This requires that the discharge BOD should be less than 50 mg/l. Also, there is no fishing village or other important

The Study on Sanitation Improvement Plan for Haiphong City, Vietnam
Final Report, Main Report, Volume 2, Part 3
3 - 29
place near the treatment plant. Thus, discharge into the river satisfies environmental requirements.
Sludge will be treated in sludge drying bed. Water from the bed will be re-circulated for treatment. Dried sludge will be disposed to landfill site or reused or treated at the proposed septage treatment facility.
The treatment flow diagram is given in Figure 3.6.3.
The sewage generation estimated in the master plan study for Phase I area was 40,000 m3/day in 2010. Due to modification of the cover area for Phase I, the sewage generation is recalculated as 36,000 m3/day in 2010. The estimation details are given in Table 3.6.1. Other vital information for the treatment plant is given in the following.

The Study on Sanitation Improvement Plan for Haiphong City, Vietnam
Final Report, Main Report, Volume 2, Part 3
3 - 30
Estimated Generation of Sewage m3/day
Year Combined Separate Total
Phase I Phase II Sub-total Phase II
2010 36,000 0 36,000 0 36,000
2020 40,074 20,462 60,536 11,464 72,000
Average Dry Weather Flow (ADWF) m3/s
Year Combined Separate Total
Phase I Phase II Sub-total Phase II
2010 0.417 0.000 0.417 0.000 0.417
2020 0.464 0.237 0.701 0.133 0.833
Hourly maximum flow (1.5ADWF) m3/s
Year Combined Separate Total
Phase I Phase II Sub-total Phase II
2010 0.625 0.000 0.625 0.000 0.625
2020 0.696 0.355 1.051 0.199 1.250
Wet Weather Flow m3/s
Year Combined Separate Total
Phase I Phase II Sub-total Phase II
2010 1.250 0.000 1.250 0.000 1.250
2020 1.391 0.710 2.102 0.199 2.301
3 ADWF in case of combined sewer
1.5 ADWF in case of separate sewer
Design flow
Pumping station Peak Wet Weather Flow = 3 ADWF
Hourly Maximum Flow = 1.5ADWF
Primary Treatment Wet Weather Flow = 2ADWF
Secondary Treatment Average Dry Weather Flow = 1 ADWF
Chlorination Tank Average Dry Weather Flow = 1 ADWF
In-plant pipe Hourly Maximum Flow = 1.5ADWF
Treatment Flow
Inflow àP/SàAerated Lagoon àSettling Pond àChlorination tank àpublic water
body
Sludge in Settling PondàSludge drying bed
Excess wet weather flowàPrimary treatmentàpublic water bodies
The Study on Sanitation Improvement Plan for Haiphong City, Vietnam
Final Report, Main Report, Volume 2, Part 3
3 - 31
(2) Inlet Pumping Station
The same methodology is used for this pumping station as that adopted for the An Da pumping station. After implementation of Phase II, both combined and separate wastewater will enter in this plant. Two different pumping stations are proposed for the combined flow and separate flow because of the composition difference. Provision is kept for the flow of Phase II area for the combined flow also. All civil works will be made for Phase II demand. However, pumps and motors will be placed for Phase I only. For this purpose, preliminary design for Phase II separate sewerage area is also performed.
Wet weather sewage flow calculated from the sewer pipe design (2.253 m3/sec) is slightly different from that calculated from the capacity of treatment plant (2.102 m3/sec). Design of pumping station is carried out using the higher value.
To save energy cost and construction cost, provision is kept for smaller capacity pump. If the Phase I combined flow is 3Q’, three pumps are proposed with the capacities of 1Q’, 1Q’ and 2Q’. During dry weather pump with the capacity of 1Q’ will operate, while during wet weather one 1Q’ pump and the 2Q’ pump will operate. This will ensure a standby capacity of 1Q’. Phase II combined flow is approximately double. In that stage two pumps with 2Q’ capacity will be installed. At that stage, one 2Q’ pump will operate in dry weather and three 2Q’ pumps will operate in wet weather. Two pumps with capacity Q’ (total 2Q’) will remain as standby.
The detail design of the pumping station for combined flow is given in Table 3.6.2.
The required capacity of the pumping station is 2.253 m3/sec. The required capacities of pumps are 0.751 m3/sec for three pumps and 0.376 m3/sec for two pumps. Diameter of the suction pipe is 600 mm and 400 mm, respectively. Actual heads are 7.3 m for both types of pumps. Including the head loss around pump and force main, required head is 9.3 m. Considering pump efficiency and transmission efficiency, the motor ratings are 110 kW for bigger pumps and 55 kW for smaller pumps.
Six screens will be placed before the pump while six grit chambers will be placed after the pump. Screen opening size is between 15 and 25 mm. Grit chamber will be placed on the ground and with retention time of 30 sec. Depth of the sand pit is 30 cm considering a surface loading of 3,600 m3/m2/d for combined sewage. Dimension of the grit chamber is 9 m × 1.6 m × 0.8 m, where 0.8 m is the depth of the chamber.
The pumping station will receive separate sewage in Phase II. A tentative design for Phase II separate sewage pumping station is given in Table 3.6.3.
The required capacity of the pumping station is 0.199 m3/sec. There will be three pumps and one standby pump. The required capacity of pump is 0.066 m3/sec each.
The Study on Sanitation Improvement Plan for Haiphong City, Vietnam
Final Report, Main Report, Volume 2, Part 3
3 - 32
Diameter of the suction pipe is 300 mm. Actual heads are 7.3 m. Including the head loss around pump and force main, required head is 9.3 m. Considering pump efficiency and transmission efficiency, the motor ratings are 15 kW.
The plan and section of the pumping station is shown in Figure 3.6.4.
(3) Preliminary Treatment for Bypass Flow
During the wet weather, the treatment plant will receive 3 ADWF while the treatment capacity is 1 ADWF. The remaining 2 ADWF will enter into storm water sedimentation pond.
Preliminary treatment facilities will consist of a settling pond of 3 hour retention time and a chlorination tank for disinfection. This will be used in the wet weather to provide certain treatment. The settling pond will store water for the first 3 hours and stored water will be returned to the secondary treatment line after the rain stops. This will ensure proper treatment for the first flash for a 3 hour period. Any flow occurring after first 3 hours will pass through chlorination tank for disinfection before bypassing into the river.
Two ponds are considered for such preliminary treatment. One pond will be constructed in each phase. With a depth of 1.5 m, the required surface area of each pond is 1 ha. Side slope of the bank is 1:2. A free board of 0.5 m is provided. The retention time is 3 hours, which will lead to one-third BOD reduction. The details calculation are given in Table 3.6.4. The plan and section is shown in Figure 3.6.5.
(4) Aerated Lagoons
The flow will be distributed in a number of lagoons by splitter chamber. The plan and section of the splitter chamber is shown in Figure 3.6.6. There will be 4 lagoons for Phase I and 4 lagoons for Phase II. Out of 4 lagoons in Phase II, 2 will receive flow from combined sewer system while the rest 2 will receive flow from separate sewer system. The retention time is set in a way that is sufficient to reduce more than 85 % of BOD load and 80 % of SS load. This effluent from the lagoon will comply with the VN standards, which is 50 mg/l of BOD for discharging into a Class B river like Lac Tray.
Since the process is semi-natural, efficiency depends on the ambient temperature. For the winter season, design air temperature is set at 14ºC while the design air temperature for summer months is 28ºC. Design calculation is done separately for winter and summer. Thus the retention time will be 3 days in winter and 1.9 days in summer. This means that during the summer months, full time aerator operation will not be required.
With a depth of 3 m, area of each lagoon is 9,000 m2. The side slope of the bank is set at 1:2. A free board of 0.5 m is also provided.

The Study on Sanitation Improvement Plan for Haiphong City, Vietnam
Final Report, Main Report, Volume 2, Part 3
3 - 33
Oxygen will be supplied by fixed type surface aerator. Though moving type is more efficient, it requires skilled operation. It is proposed to set eight aerators in each lagoon. Total number of aerators is 64, eight in each lagoon. Aerator power is 55 kW.
The detail calculation is given in Table 3.6.5. The Plan and section is shown in Figure 3.6.7.
(5) Settling Ponds
Settling ponds will be designed for 1 ADWF. There will be 8 ponds corresponding to aerated lagoons. One day retention is sufficient for the acceptable settlement. Cleaning interval is 6 months. With a depth of 1.5 m, area of each pond is 6,000 m2. The side slope is set at 1:2. A free board of 0.5 m is provided. The detail calculation is given in Table 3.6.6. The plan and section is shown in Figure 3.6.8.
(6) Chlorination Tank
There will be two types of chlorination tank, one for the flow coming out from secondary treatment train with 1 ADWF capacity and another for the bypass water coming out from the storm water settling pond with 2 ADWF capacity. Two tanks are proposed for each type, one for each Phase.
Chlorination will be carried out by liquid chlorine to reduce the risk. A contact time of 15 min is selected. The treated wastewater chlorination tank is designed with a depth of 1.5 m, and required surface area is 500 m2. The detail calculation is given in Table 3.6.7.
For the storm water chlorination tank, using the same contact time and same depth as above, the required surface area is 840 m2. The detail calculation is given in Table 3.6.7.
(7) Sludge Treatment
Sludge treatment is proposed through sludge drying bed. There will be 8 bed series corresponding to lagoon number. In each series, there will be 2 beds. Target water content in the dried sludge is 60 %. Drying duration is fixed on the basis of gravity settling, wind, evaporation, temperature, relative humidity and probability of rainfall during drying. Drying duration is found as 23 days. Area required for each bed is 703 m2. Dried sludge volume is 40 m3/day. The detail calculation is given in Table 3.6.8. The plan and section is shown in Figure 3.6.9.
There are a number of options for the disposal of the dried sludge:
• Use as soil improvement material. • Use as cover soil of the landfill site. • Dispose to the landfill site.
The Study on Sanitation Improvement Plan for Haiphong City, Vietnam
Final Report, Main Report, Volume 2, Part 3
3 - 34
• Further treatment at the proposed septage treatment facility.
(8) Internal Pipelines
All the internal pipelines are calculated based on peak flow of 1.5 ADWF. Detail calculation is given in Table 3.6.9.
Since the outfall river is a tidal river, discharge is not possible continuously. Considering that it is possible to discharge into the river for half of the time, the pipelines can still handle the discharge. All pipelines are designed for 1.5 ADWF and there is a 100 % allowance for small diameter pipes.
(9) Required Building Space
A number of control and administrative offices are required for the effective operation of the plant. These are control building, pump station, machine house, electric panel house, sludge pump house, chlorination house and watchman space. The number of buildings, and their space (both total and Phase I) are given in Table 3.6.10. A more detail breakdown for the control building is given in Table 3.6.11. The plan and section of the control building is shown in Figure 3.6.10. The plan and section of the O&M machine building is shown in Figure 3.6.11.
(10) Layouts
Treatment plant layout is given in Figure 3.6.12. A more detail layout is given in Figure 3.6.13. Hydraulic profile for the plant is given in Figure 3.6.14. It may be mentioned here that during the period when the water level of the outside river is higher than the top elevation of chlorination tank, discharge is not possible. During that time, water will be stored within various ponds by closing the outlet. Pipe capacity is sufficient to discharge the stored water during the low tide. Pipeline plan layout inside the plant is shown in Figure 3.6.15.
(11) Geotechnical Recommendations
The geotechnical conditions of the site have been investigated with rotary drilling and standard penetration tests (SPT) in November – December, 2000. Detail results can be found in the Supporting Report.
The site of the Wastewater Treatment Plant is situated at the end of South- West Channel along Lach Tray River in the South-West part of the project area. The area is mainly rice field and some irrigation channels cross the area. Ground surface is in general on level +2.5 to +3.0 m (the north Vietnam Datum). The site borders Lach Tray River and a dyke in the South and the South -West Channel in the West.
The Study on Sanitation Improvement Plan for Haiphong City, Vietnam
Final Report, Main Report, Volume 2, Part 3
3 - 35
The soil conditions are poor at the site and soil stratum has low shearing strength. The prevailing clayey soils are compressible. The calculated geotechnical bearing capacity of upper soil stratum (layer 2) is only qa = 40 kPa for square pad footing. At least 500 mm compacted sand pad should be spread under the footings. Geotextile (filter fabric) is recommended between fill material and natural soil.
The floors of light buildings can be constructed by slab-on–grade and 200 mm compacted sand or gravel layer should be spread under the floor.
The total settlement of the footings with 200 kN vertical load is about 60 - 70 mm. Differential settlements may in that case be about 15 to 25 mm. If there are buildings with high column loads (> 200 kN) or / and the settlements of the structures are critical, pile foundation should be used. Piles should penetrate at least to stiff low plastic clay (layer 5). The estimated bearing capacity of 25 m long cohesion/friction concrete pile (300 mm × 300 mm) is only about 165 kN.
(12) Bill of Quantity
Detail civil bill of quantity for the treatment plant is given in Table 3.6.12. A facility list for electro-mechanical portion is given in Table 3.6.13.

The Study on Sanitation Improvement Plan for Haiphong City, Vietnam
Final Report, Main Report, Volume 2, Part 3
3 - 36
CHAPTER 7 SUPPLEMENTARY COMPONENT
7.1 Manhole Pump
In the detailed design stage, flow in each pipeline should be checked. Careful consideration is made to ensure uninterrupted flow in all pipelines in the Study. In case it is found that flow is not possible in certain time, manhole pumps should be used. Four types of manhole relay pumping stations are proposed in the previous sections. Costs for five additional manhole pumps are included in the Study.
7.2 Interceptor Pipe
In the SPP area, not all households are connected with the existing sewer pipes. New combined sewer and rehabilitation of existing pipes are included in the drainage priority project. In addition, there are a number of households now discharging their wastewater directly to surface water bodies. To collect such wastewater, new interceptor pipes are considered to be constructed. Exact location and layout should be fixed during the detail design stage. Cost for a total 20 km of such pipe is included in the Study. This includes 10 km of 300 mm dia pipe, 5 km of 400 mm dia pipe, 3 km of 500 mm pipe and 2 km of 700 dia pipe. Total number of manholes is estimated as 270 with 900 mm diameter.

The Study on Sanitation Improvement Plan for Haiphong City, Vietnam
Final Report, Main Report, Volume 2, Part 3
3 - 37
CHAPTER 8 COST ESTIMATES
8.1 Investment Cost
Investment cost includes direct construction cost and compensation cost.
Direct construction cost is estimated based on bill of quantities given in this chapter and unit price presented in Chapter 3, Part 1 of volume 2. Details cost estimation can be found in the Supporting Report. A summary is given below.
Item Cost (US$1000)
1. Trunk Sewer, Open Excavation 6,791
2. Trunk Sewer, Pipe jacking Method 17,575
3. CSO 2,266
4. Manhole 354
5. Manhole Pump 419
6. An Da Pumping Station 926
7. Treatment Plant 12,975
Total 41,306
The cost of supplementary component is estimated roughly. Total cost is US$4.4 million (of which, costs for pipe is US$3.8 million, for manhole is US$0.4 million and for manhole pump is US$0.2 million).
Considering 10 % preparatory and mobilization cost, direct construction cost for the main component is US$50.36 million.
Cost of land acquisition and compensation is estimated based on actual field condition and details is given in Supporting Report. Total cost is US$2.2 million. A summary is given below.
Item Cost (US$1000)
1. Treatment Plant (23 household and 38 ha) 1,568
2. Pumping station (3,800 m2) 11
3. Dike Relocation 586
Total 2,165
The total investment cost for the sewerage priority project is US$52.56 million.
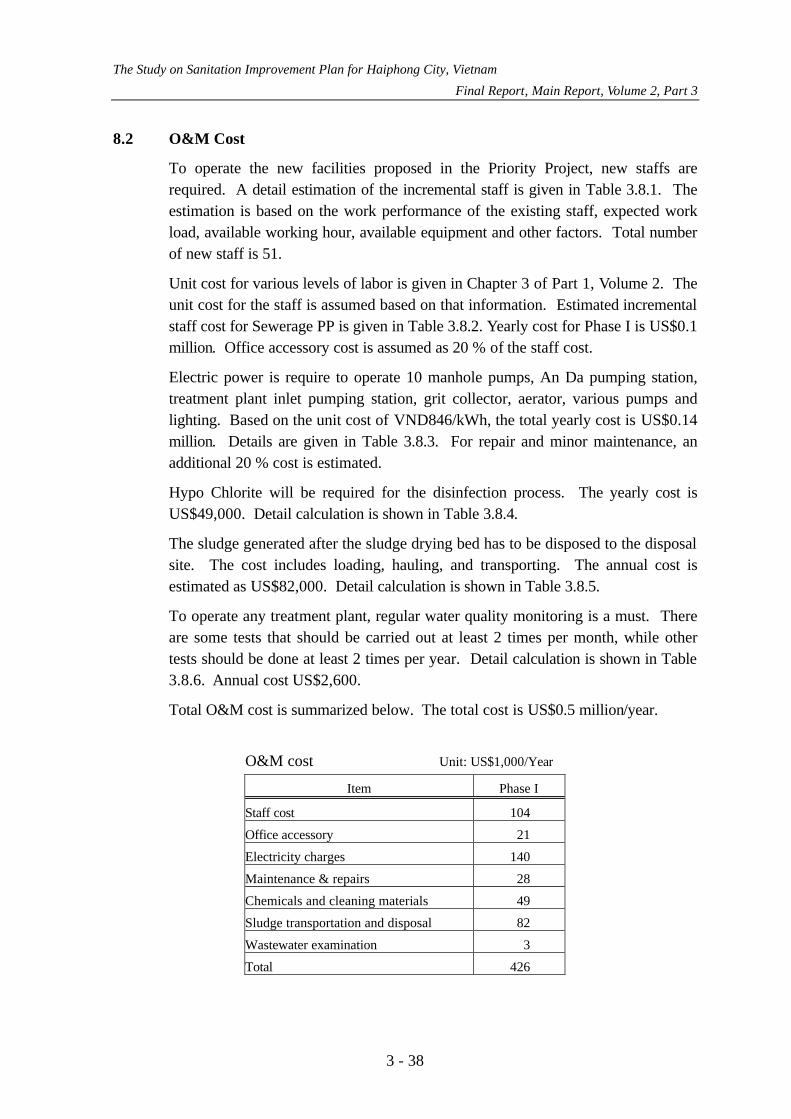
The Study on Sanitation Improvement Plan for Haiphong City, Vietnam
Final Report, Main Report, Volume 2, Part 3
3 - 38
8.2 O&M Cost
To operate the new facilities proposed in the Priority Project, new staffs are required. A detail estimation of the incremental staff is given in Table 3.8.1. The estimation is based on the work performance of the existing staff, expected work load, available working hour, available equipment and other factors. Total number of new staff is 51.
Unit cost for various levels of labor is given in Chapter 3 of Part 1, Volume 2. The unit cost for the staff is assumed based on that information. Estimated incremental staff cost for Sewerage PP is given in Table 3.8.2. Yearly cost for Phase I is US$0.1 million. Office accessory cost is assumed as 20 % of the staff cost.
Electric power is require to operate 10 manhole pumps, An Da pumping station, treatment plant inlet pumping station, grit collector, aerator, various pumps and lighting. Based on the unit cost of VND846/kWh, the total yearly cost is US$0.14 million. Details are given in Table 3.8.3. For repair and minor maintenance, an additional 20 % cost is estimated.
Hypo Chlorite will be required for the disinfection process. The yearly cost is US$49,000. Detail calculation is shown in Table 3.8.4.
The sludge generated after the sludge drying bed has to be disposed to the disposal site. The cost includes loading, hauling, and transporting. The annual cost is estimated as US$82,000. Detail calculation is shown in Table 3.8.5.
To operate any treatment plant, regular water quality monitoring is a must. There are some tests that should be carried out at least 2 times per month, while other tests should be done at least 2 times per year. Detail calculation is shown in Table 3.8.6. Annual cost US$2,600.
Total O&M cost is summarized below. The total cost is US$0.5 million/year.
O&M cost Unit: US$1,000/Year
Item Phase I
Staff cost 104
Office accessory 21
Electricity charges 140
Maintenance & repairs 28
Chemicals and cleaning materials 49
Sludge transportation and disposal 82
Wastewater examination 3
Total 426

The Study on Sanitation Improvement Plan for Haiphong City, Vietnam
Final Report, Main Report, Volume 2, Part 3
3 - 39
CHAPTER 9 PROJECT IMPLEMENTATION PLAN
9.1 Implementation Schedule
The implementation of the sewerage priority project is proposed to start from mid 2004 (beginning with pre-construction work) and to be completed by mid 2010. Loan arrangement is to be completed by mid 2003. Detail design and pre-construction will take about one year to complete. Treatment plant will be constructed over 3 years and is to be completed by 2007. Pumping station will be constructed over 2 years and is to be completed by 2009. CSOs, pipelines and supplementary components will be constructed gradually over the entire six year implementation period.
2001 2002 2003 2004 2005 2006 2007 2008 2009 2010
Feasibility Study
Loan Arrangement
Detailed Design
Pre-Construction Work
CSO
Pipelines
Pumping Station
Treatment Plant
Supplementary Components
9.2 Operational and Organization Plan
(1) Operational Plan
The Project includes CSOs, sewer pipes, pumping stations, and wastewater treatment plant. Proper operations of these facilities are important to tap optimum service from these facilities.
There are two types of CSOs proposed in the Project, namely gate type and orifice type. Both types of CSOs need periodic maintenance. Screens are placed in all CSOs. Workers should periodically clean those screens. However, gate type CSOs also need gate operation. When rainfall intensity and duration are high, gates should be closed manually. These gates are simple to operate and SADCO staffs can operate these gates based on a operation manual. One staff can operate a number of CSOs depending on the location. There is no need to keep dedicated staff for such gate operation since need for such operation occurs only limited times in a year. SADCO’s district level regular staff can handle this situation in addition to their regular duties.

The Study on Sanitation Improvement Plan for Haiphong City, Vietnam
Final Report, Main Report, Volume 2, Part 3
3 - 40
Sewer pipes and manholes need periodic cleaning. Smaller diameter pipes can be cleaned manually while suction pumps should be used for larger diameter pipes. SADCO already has these types of equipment and there is a provision of additional equipment under 1B project.
Pumping stations need periodic cleaning and also periodic instrument inspection. Repair should be done based on the operational manual if required. Repair cost is included in the O&M cost.
Routine water quality test is important for the smooth operation of wastewater treatment plant. Parameters and frequency of such tests are proposed in the Study. The plant also needs periodic cleaning. Since discharge is not continuous, regular gate control is required.
(2) Project Management in SADCO
Prior to the implementation of the proposed project implementation, the existing PMU in SADCO will have the experience with the World Bank 1B project. The PMU is being strengthened along with the overall capacity building efforts of the Finnida funded Water Supply, Drainage, Sewerage, and Sanitation Management Program, 2001-2004 (WSDSSMP). To date progress in developing the staff in SADCO has been slow. However by the time the priority project for sewerage is ready for implementation, it is expected that the capability of the PMU to effectively execute and manage the priority projects will be improved.
However, for planning purposes, it should be assumed that:
• The PMU unit will require further technical assistance to facilitate their participation in the implementation of the priority project
• International advisors will need to participate directly in the bidding, procurement and construction supervision
(3) Prior Reorganization of SADCO
SADCO will need to be reorganized to successfully implement the priority project. The overall organizational structure will be as in the following figure.
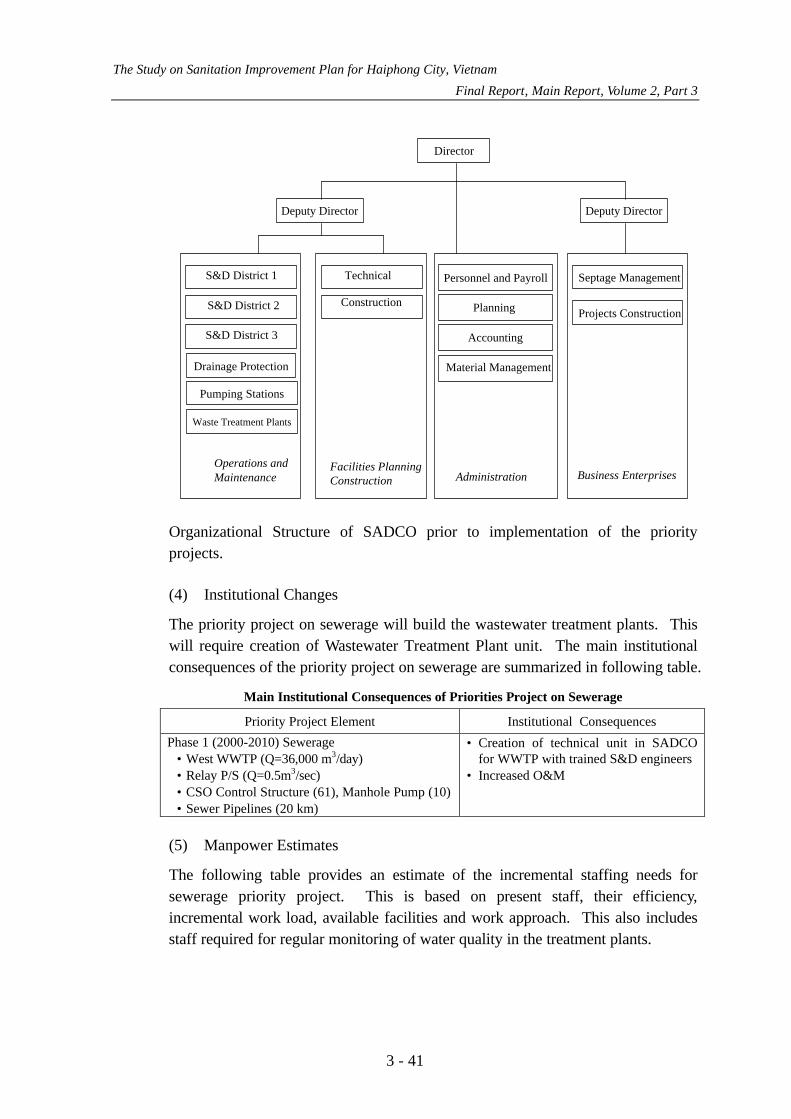
The Study on Sanitation Improvement Plan for Haiphong City, Vietnam
Final Report, Main Report, Volume 2, Part 3
3 - 41
Deputy Director
Director
Deputy Director
S&D District 1
S&D District 2
S&D District 3
Operations and Maintenance
Pumping Stations
Waste Treatment Plants
Facilities PlanningConstruction Business Enterprises
Projects Construction
Personnel and Payroll
Planning
Accounting
Administration
Material Management
Construction
Technical Septage Management
Drainage Protection
Organizational Structure of SADCO prior to implementation of the priority projects.
(4) Institutional Changes
The priority project on sewerage will build the wastewater treatment plants. This will require creation of Wastewater Treatment Plant unit. The main institutional consequences of the priority project on sewerage are summarized in following table.
Main Institutional Consequences of Priorities Project on Sewerage
Priority Project Element Institutional Consequences
Phase 1 (2000-2010) Sewerage • West WWTP (Q=36,000 m3/day) • Relay P/S (Q=0.5m3/sec) • CSO Control Structure (61), Manhole Pump (10) • Sewer Pipelines (20 km)
• Creation of technical unit in SADCO for WWTP with trained S&D engineers
• Increased O&M
(5) Manpower Estimates
The following table provides an estimate of the incremental staffing needs for sewerage priority project. This is based on present staff, their efficiency, incremental work load, available facilities and work approach. This also includes staff required for regular monitoring of water quality in the treatment plants.
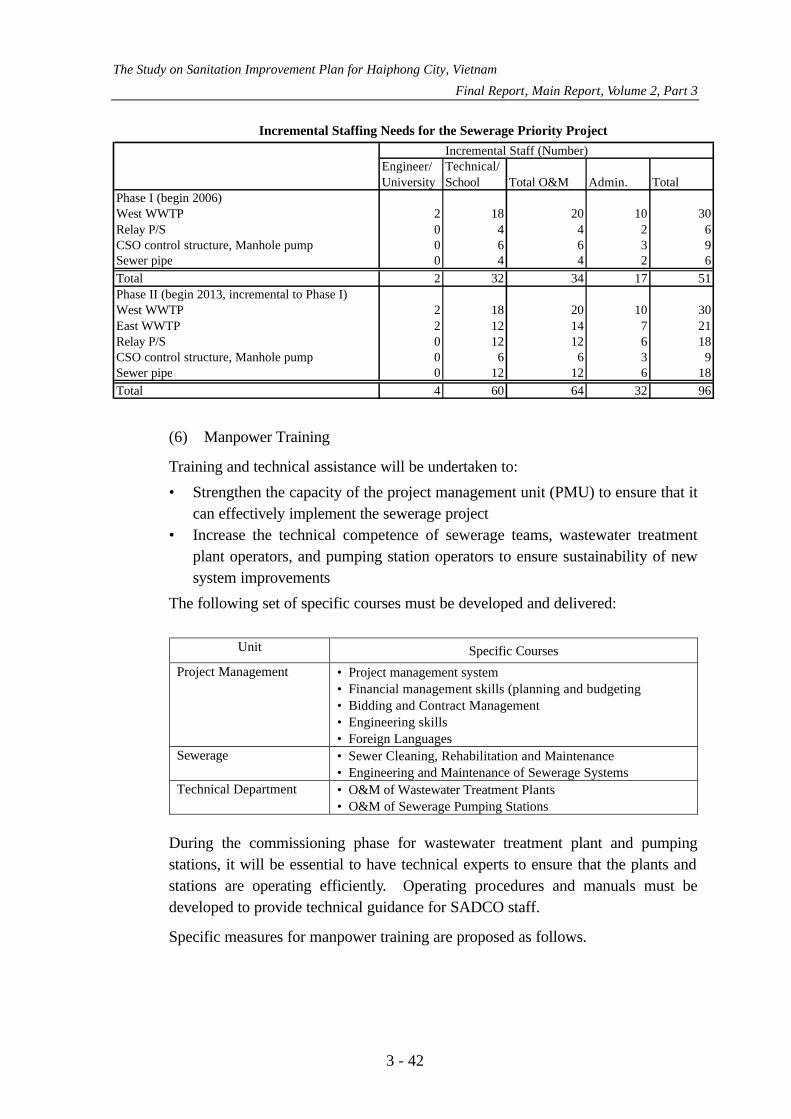
The Study on Sanitation Improvement Plan for Haiphong City, Vietnam
Final Report, Main Report, Volume 2, Part 3
3 - 42
Incremental Staffing Needs for the Sewerage Priority Project Incremental Staff (Number)
Engineer/ Technical/University School Total O&M Admin. Total
Phase I (begin 2006)West WWTP 2 18 20 10 30Relay P/S 0 4 4 2 6CSO control structure, Manhole pump 0 6 6 3 9Sewer pipe 0 4 4 2 6Total 2 32 34 17 51Phase II (begin 2013, incremental to Phase I)West WWTP 2 18 20 10 30East WWTP 2 12 14 7 21Relay P/S 0 12 12 6 18CSO control structure, Manhole pump 0 6 6 3 9Sewer pipe 0 12 12 6 18Total 4 60 64 32 96
(6) Manpower Training
Training and technical assistance will be undertaken to:
• Strengthen the capacity of the project management unit (PMU) to ensure that it can effectively implement the sewerage project
• Increase the technical competence of sewerage teams, wastewater treatment plant operators, and pumping station operators to ensure sustainability of new system improvements
The following set of specific courses must be developed and delivered:
Unit Specific Courses
Project Management • Project management system • Financial management skills (planning and budgeting • Bidding and Contract Management • Engineering skills • Foreign Languages
Sewerage • Sewer Cleaning, Rehabilitation and Maintenance • Engineering and Maintenance of Sewerage Systems
Technical Department • O&M of Wastewater Treatment Plants • O&M of Sewerage Pumping Stations
During the commissioning phase for wastewater treatment plant and pumping stations, it will be essential to have technical experts to ensure that the plants and stations are operating efficiently. Operating procedures and manuals must be developed to provide technical guidance for SADCO staff.
Specific measures for manpower training are proposed as follows.

The Study on Sanitation Improvement Plan for Haiphong City, Vietnam
Final Report, Main Report, Volume 2, Part 3
3 - 43
1) To receive technical assistance from WSC
WSC has relatively long history in Haiphong in the fields of sanitation improvement and management. Their technical skills as well as financial and administrative skills are considered most developed among the sanitation-related companies in Haiphong. Water treatment skills and pipe maintenance skills may be applicable for sewerage management including sewage treatment and pipe maintenance. Through the collection of sewage charge which is currently done by WSC on behalf of SADCO as surcharge on water charge, the 2 companies are already in cooperation. It may be advisable therefore that training opportunity is given by WSC to SADCO through receiving SADCO staff in WSC for training for certain period. Alternatively WSC may give training by dispatching their staff as trainee to SADCO. Since WSC has implemented water supply projects to date, their project management experience and knowledge can also be learnt and transferred to SADCO.
2) To learn from the preceding projects and experience in the cities in Vietnam
In Vietnam, sewerage projects will be implemented in the near future the cities of Hanoi and Ho Chi Minh. Their experience and knowledge can be learnt and transferred to SADCO in various manner in the similar manner as mentioned above for the cooperation between WSC and SADCO.
3) To study in appropriate academic organizations
In Haiphong, the Haiphong Private university has an Environment Faculty and can offer the educational opportunities for sanitation and environmental subjects. Marine university can also offer opportunities for related subjects. In Hanoi located only 2 hours distance from Haiphong, several universities are established which can offer courses related to sanitation management including the followings:
• Hanoi University of Civil Engineering (Center for Environmental Engineering for Towns and Industrial Area)
• Hanoi University of Technology (Center for Environmental Science and Technology)
• Hanoi National University • Hanoi Architecture University • Hanoi Politechnique University • Dong Do Private University • Asian Institute of Technology, Hanoi Branch
The offered courses by Hanoi University of Technology, which is closely related sanitation management, for example, include Environmental Chemistry,
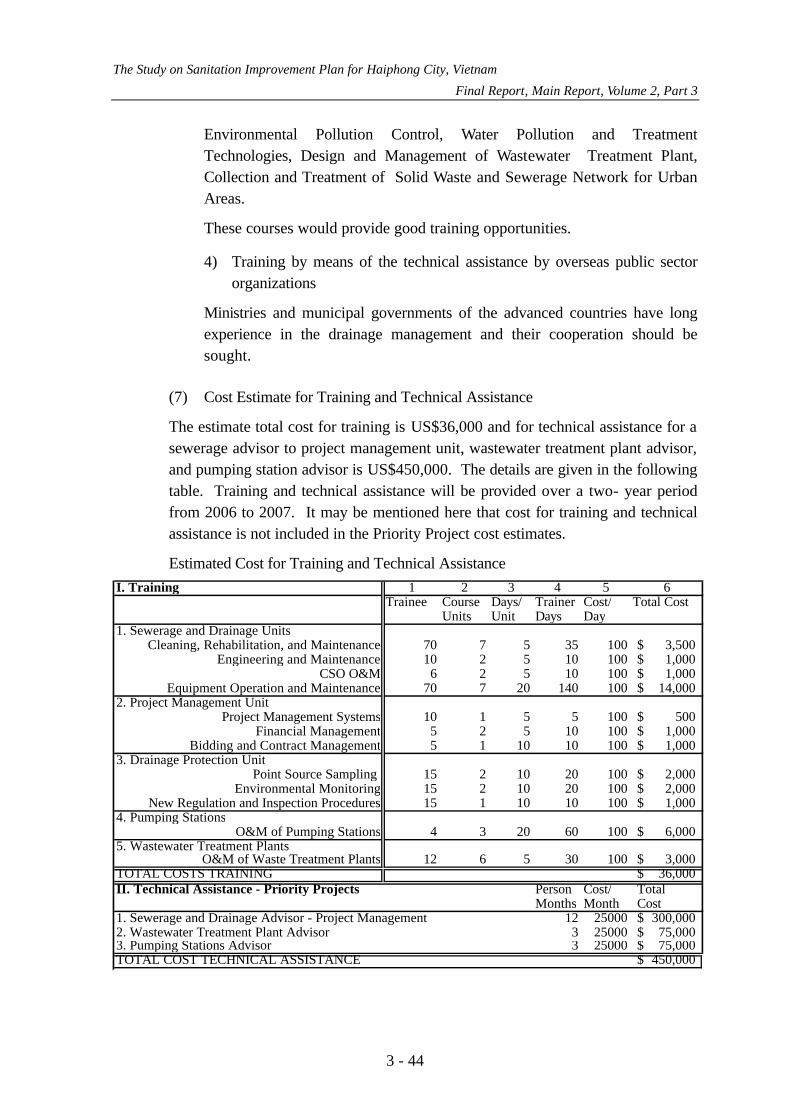
The Study on Sanitation Improvement Plan for Haiphong City, Vietnam
Final Report, Main Report, Volume 2, Part 3
3 - 44
Environmental Pollution Control, Water Pollution and Treatment Technologies, Design and Management of Wastewater Treatment Plant, Collection and Treatment of Solid Waste and Sewerage Network for Urban Areas.
These courses would provide good training opportunities.
4) Training by means of the technical assistance by overseas public sector organizations
Ministries and municipal governments of the advanced countries have long experience in the drainage management and their cooperation should be sought.
(7) Cost Estimate for Training and Technical Assistance
The estimate total cost for training is US$36,000 and for technical assistance for a sewerage advisor to project management unit, wastewater treatment plant advisor, and pumping station advisor is US$450,000. The details are given in the following table. Training and technical assistance will be provided over a two- year period from 2006 to 2007. It may be mentioned here that cost for training and technical assistance is not included in the Priority Project cost estimates.
Estimated Cost for Training and Technical Assistance I. Training 1 2 3 4 5 6
Trainee Course Days/ Trainer Cost/ Total CostUnits Unit Days Day
1. Sewerage and Drainage Units Cleaning, Rehabilitation, and Maintenance 70 7 5 35 100 3,500$
Engineering and Maintenance 10 2 5 10 100 1,000$ CSO O&M 6 2 5 10 100 1,000$
Equipment Operation and Maintenance 70 7 20 140 100 14,000$ 2. Project Management Unit
Project Management Systems 10 1 5 5 100 500$ Financial Management 5 2 5 10 100 1,000$
Bidding and Contract Management 5 1 10 10 100 1,000$ 3. Drainage Protection Unit
Point Source Sampling 15 2 10 20 100 2,000$ Environmental Monitoring 15 2 10 20 100 2,000$
New Regulation and Inspection Procedures 15 1 10 10 100 1,000$ 4. Pumping Stations
O&M of Pumping Stations 4 3 20 60 100 6,000$ 5. Wastewater Treatment Plants
O&M of Waste Treatment Plants 12 6 5 30 100 3,000$ TOTAL COSTS TRAINING 36,000$ II. Technical Assistance - Priority Projects Person Cost/ Total
Months Month Cost1. Sewerage and Drainage Advisor - Project Management 12 25000 300,000$ 2. Wastewater Treatment Plant Advisor 3 25000 75,000$ 3. Pumping Stations Advisor 3 25000 75,000$ TOTAL COST TECHNICAL ASSISTANCE 450,000$
The Study on Sanitation Improvement Plan for Haiphong City, Vietnam
Final Report, Main Report, Volume 2, Part 3
3 - 45
CHAPTER 10 PROJECT EVALUATION
10.1 Objective Achievement
(1) Project Objectives
The Implementation of the Sewerage Priority Project has 3 major objectives as follows:
• Improvement of public health • Improvement of the quality of ambient water bodies • Reinforcement of the economic activities and upgrade the environment for
future economic growth
Public health improvement objective will be achieved by allowing the connected households and buildings to discharge both black and grey waters into the system and thereby providing a sanitary environment.
Sewage discharged into the water bodies without treatment, will be collected and treated in the waste water treatment plant. Pollution loads flowing into the water bodies will be much reduced and the quality of ambient water bodies will be much improved.
With the upgraded sanitary condition, land value of the project area will be enhanced and economic growth will be stimulated. These economic benefit will be discussed in the following section of this chapter.
(2) Objective Achievement Evaluation
1) Evaluation by Means of Impact Indicators
(a) Public Health Iimprovement
The overall public health condition will be improved which will have beneficial impacts on the whole city population which will be 1.909 million in the year 2010 and 2.121 million in the year 2020.
2) Evaluation by Means of Development Indicators
Sewerage Priority Project will provide the central sewerage system for about 11km2 where 240 thousand residents will be living in the year 2010 and 286 thousand in the year 2020. Living environment will be upgraded in this directly affected area. Economic potential of this area will also be enlarged.
In the year 2010, BOD load to be discharged into the water bodies will be reduced by 9,673 kg per day. Namely, about 72 % of the BOD load will be removed, which would be discharged if Sewerage Priority Project is not implemented.

The Study on Sanitation Improvement Plan for Haiphong City, Vietnam
Final Report, Main Report, Volume 2, Part 3
3 - 46
3) Evaluation by Means of Operation Indicators
Through the implementation of the Sewerage Priority Project, about 36,000 m3 of sewage in 2010 will be treated at the waste water treatment plant. The discharge water quality after treatment will be around 50 mg/l which satisfies the Vietnamese standard.
10.2 Economic Evaluation
10.2.1 General Principles
The general principles regarding economic evaluation background and methodology for the sewerage priority project are similar to those set out above for the drainage project in Part 2, 8.2. As in the case of drainage, economic benefits are difficult to quantify.
For example, while the sewerage project will undoubtedly bring about significant improvements in public health, there are not adequate epidemiological data to assess the extent to which this is so. It is not possible to disentangle the contribution that improved drainage makes in the reduction of waterborne disease, when so many other factors are likely to have an effect. In particular, the relatively small number of households who have access to potable water supply via house connections, remains a major potential source of waterborne disease.
The sewerage project also does not immediately create a direct benefit for individual households in a way in which their willingness to pay for this service can be demonstrated. The project will not immediately lead to an increase in the number of properties connected to public sewers; however, this may be expected to occur in the longer term.
As with the drainage project, it is judged that if adequate data were available, the economic justification of the project would be revealed by an increase in property values in the affected area, or by an increase in the economic productivity of the affected area, but data are not available to predict precisely what these impacts would be.
The same approach, using “switching values”, which estimate the increases in property values or land productivity required to demonstrate project justification, is used, and a judgment then made as to whether such increases can reasonably be expected.
Similar assumptions are made as for the evaluation of the drainage project, i.e. (a) that there is no economic growth in the Study Area after year 2001, and (b) that economic growth will correspond to the Average Scenario referred to in the Sanitation Master Plan Report. Results of the analysis are as follows.

The Study on Sanitation Improvement Plan for Haiphong City, Vietnam
Final Report, Main Report, Volume 2, Part 3
3 - 47
10.2.2 Least-Cost Solution
For the preparation of the long-term plan for sewerage improvement as an integral part of SMP, 4 alternatives are formulated; S1, S2, S3 and S4. These alternatives are compared from various aspects including the scope of beneficial impact, technical feasibility and cost-effectiveness. Consequently, S3 has been selected. The proposed Sewerage Priority Project is the phase 1 or the first phase of the proposed S3 alternative.
Among the 4 alternatives, target area of S1 is smaller, not covering the old city center while the other 3 have the same target area. While S2 is the most cost-effective, the small-bore technology adopted for S2 is not yet fully proven, requiring small pilot-scale project to be implemented before full-scale project is realized. Of the 2 remaining alternatives of S3 and S4, S3 requires the smaller investment cost per beneficiary or about 85 % of S4, the second least-costly. Conclusion will not be affected when comparison is made in terms of the overall cost including O&M cost because O&M cost is small compared with the investment cost and its ratio to the investment cost is about the same for the all alternatives.
10.2.3 Economic Feasibility
The approach used for sewerage is similar to that described above for drainage. Details of the calculations are contained in Tables 3.10.1 and 3.10.2.
(1) Base Case Property Values and Urban Productivity
The priority sewerage project provides direct benefits for properties located in the same as the priority drainage project, although the number of people obtaining service is slightly less, i.e. about 90 %. Otherwise, the following calculations assume the same general parameters about incomes, property values, and productivity as detailed in Part 2, 9.2.3 above.
The current value of properties in the project area, assumed to be the same in the 2003 base year for the “No Growth” case, is therefore US$795.7 million. For the “Average growth” scenario it is US$1,678 million.
A similar factor is applied to the productivity data, the present worth of value added in the area being estimated at US$1,211 million under the “No Growth” scenario and US$2,820 million under the “Average Growth” scenario.
(2) Economic Feasibility of the Priority Sewerage Project: Impact on Property Values and Productivity
The costs of the sewerage project as shown above are now compared with the two selected indicators to test if the impact required to demonstrate economic

The Study on Sanitation Improvement Plan for Haiphong City, Vietnam
Final Report, Main Report, Volume 2, Part 3
3 - 48
justification is in fact likely to be met. The table below shows the costs of the project in relation to the two indicators, i.e. property values and productivity. In each case, present values at a 10 % discount rate, a 20-year time horizon, and a 2003 base year are used.
Cost of Sewerage Project as Percentage of Property Values and Productivity in the Project Area
Present Value of the Property or GRP as of 2023 with 2003 as the
Base Year (US$ million)
Present Worth of Project Cost (US$45.51 million) as % of Values in Column
(b)
(a) (b) (c)
Property value – under No Growth case
796 5.7%
Property value - Average Growth case
1,678 2.7%
Project Area GRP value – under No Growth case
1,211 3.8%
Project Area GRP value – under Average Growth case
2,820 1.6%
It is the judgment of the Study Team that these data provide a reasonable economic justification in cost-benefit terms for the sewerage project, taken in isolation, as long as the “Average Growth” scenario is realized. Under the “No Growth” scenario, which is rather unrealistic, the data do not convincingly demonstrate that the sewerage project would be economically justified.
The various assumptions and estimates used to address project impacts are adequate as sensitivity tests on the benefit side. Sensitivity of the results to variations in cost estimates is also tested. The following table shows the percentage increases required to demonstrate project justification under three assumptions, namely the base case (as in the preceding table) and where project costs are increased by 10 % and 20 % respectively.

The Study on Sanitation Improvement Plan for Haiphong City, Vietnam
Final Report, Main Report, Volume 2, Part 3
3 - 49
Cost of Sewerage Project as Percentage of Property Values and Productivity in the Project Area: Sensitivity to Cost Estimates
Base Case Costs + 10% Costs + 20%
Property value – under No Growth case
5.7% 6.3% 6.8%
Property value - under Average Growth case
2.7% 3.0% 3.2%
Project Area GRP value – under No Growth case
3.8% 4.2% 4.6%
Project Area GRP value – under Average Growth case
1.6% 1.8% 1.9%
These results suggest that the sewerage project would probably satisfy economic justification criteria even with an increase in project costs of 20 %
10.3 Financial Evaluation and Affordability
10.3.1 Affordability of Sewerage Program
Affordability of the sewerage program as a whole, not just the priority project, is assessed for the reasons described earlier for drainage, using per capita GRP in direct beneficiary areas; per capita income of direct beneficiaries, and total HPPC expenditures as the key indicators. Results are summarized in the following two tables.
In column (2) of these tables, investment costs are amortized, thereby showing how much it will cost, year by year, to repay loans required to finance the program. It is assumed here that funds will be borrowed on terms that correspond on average to a 25-year loan at a 5 % interest rate. Note that even if funds are provided in grant form, or on a more favorable basis than the above, they may still represent financial opportunities foregone, and will thus typically involve real economic costs to the recipient.
Sewerage program costs, number of direct beneficiaries in the Study Area and Haiphong, and costs per capita are shown in the following:

The Study on Sanitation Improvement Plan for Haiphong City, Vietnam
Final Report, Main Report, Volume 2, Part 3
3 - 50
Sewerage Program Costs, Study Area and Haiphong, 2001-2020 Costs in 2000 prices
Capital Amort. Cumulative Recurrent Total Study Area Cost Per Cost Per
Year Costs Val of (1) Val of (2) Costs Costs Population Capita Capita
(US$'000) (US$'000) (US$'000) (US$'000) (US$'000) Study Area Haiphong
(US$) (US$)
2001 0 0 0 0 0 567,387 0.00 0.00
2002 0 0 0 0 0 573,785 0.00 0.00
2003 1,970 140 140 0 140 580,183 0.24 0.08
2004 8,032 570 710 0 710 586,581 1.21 0.40
2005 17,859 1,267 1,977 0 1,977 592,579 3.34 1.10
2006 19,475 1,382 3,359 0 3,359 599,245 5.61 1.85
2007 16,710 1,186 4,544 309 4,853 605,911 8.01 2.63
2008 10,712 760 5,304 430 5,734 612,576 9.36 3.08
2009 10,712 760 6,065 559 6,624 619,242 10.70 3.51
2010 8,789 624 6,688 573 7,261 625,908 11.60 3.80
2011 22,861 1,622 8,310 585 8,895 632,517 14.06 4.61
2012 31,389 2,227 10,537 646 11,183 639,126 17.50 5.73
2013 31,389 2,227 12,764 897 13,661 645,735 21.16 6.92
2014 14,333 1,017 13,781 1,147 14,928 652,344 22.88 7.49
2015 14,333 1,017 14,798 1,189 15,987 658,953 24.26 7.93
2016 14,333 1,017 15,815 1,233 17,048 665,556 25.61 8.37
2017 14,333 1,017 16,832 1,276 18,108 672,160 26.94 8.80
2018 14,333 1,017 17,849 1,318 19,167 678,763 28.24 9.22
2019 14,333 1,017 18,866 1,361 20,227 685,367 29.51 9.63
2020 14,333 1,017 19,883 1,403 21,286 691,970 30.76 10.04
Affordability of the proposed program can be assessed in light of the information provided in the following table:

The Study on Sanitation Improvement Plan for Haiphong City, Vietnam
Final Report, Main Report, Volume 2, Part 3
3 - 51
Affordability of the Sewerage Program, 2001-20: Costs as Percentage of Key Indicators
Costs in 2000 prices
Year Total Total Cost Total Cost Total Cost Total Cost Annual
Cost as % of as % of As % of as % of Per Cap.
Study Area Haiphong HPPC Study Area Cost in
GRP GRP Exp. Disp. Inc. Study Area
(US$'000) (%) (%) (%) (%) (US$)
2001 0 0.00 0.00 0.00 0.00 0.00
2002 0 0.00 0.00 0.00 0.00 0.00
2003 140 0.03 0.02 0.19 0.06 0.24
2004 710 0.13 0.08 0.92 0.26 1.21
2005 1,977 0.34 0.22 2.42 0.69 3.34
2006 3,359 0.52 0.33 3.69 1.03 5.61
2007 4,853 0.66 0.44 4.85 1.33 8.01
2008 5,734 0.71 0.47 5.24 1.42 9.36
2009 6,624 0.75 0.50 5.59 1.50 10.70
2010 7,261 0.75 0.51 5.68 1.51 11.60
2011 8,895 0.87 0.59 6.55 1.74 14.06
2012 11,183 1.03 0.70 7.77 2.06 17.50
2013 13,661 1.19 0.81 8.99 2.39 21.16
2014 14,928 1.24 0.84 9.33 2.48 22.88
2015 15,987 1.26 0.86 9.51 2.53 24.26
2016 17,048 1.29 0.87 9.68 2.57 25.61
2017 18,108 1.31 0.89 9.83 2.61 26.94
2018 19,167 1.32 0.90 9.97 2.65 28.24
2019 20,227 1.34 0.91 10.10 2.68 29.51
2020 21,286 1.36 0.92 10.22 2.72 30.76
Note: Investment costs on amortized basis
This table indicates that the sewerage program, in isolation, satisfies affordability criteria. In 2010 it will account for only 0.75 % of Study Area GRP, and less than 6 % of HPPC expenditure . As proposed in Vol 1., Ch. 7.4, the target for full recovery of O and M costs in the form of user charges should be the year 2010. Achievement of this target would only require 0.12 % of beneficiaries’ disposable incomes that year.
The results are however sensitive to the assumptions made about economic growth, and therefore of disposable incomes and HPPC expenditures. Table 3.10.3 shows how the preceding results would change if economic growth is half of that estimated above, and costs increase by 10 % and 20 %. Overall affordability in terms of GRP would still be satisfactory, but the impact on the HPPC budget

The Study on Sanitation Improvement Plan for Haiphong City, Vietnam
Final Report, Main Report, Volume 2, Part 3
3 - 52
would be specially significant, and in 2010 the sewerage program would account for 9 % of HPPC expenditure.
10.3.2 Funding Requirements and Financing Plan
As in the case of drainage, it is proposed that external assistance should be obtained for the priority project. It is assumed that funding will be available on the following terms:
• Interest rate for construction and procurement 1.3 %, and for engineering 0.75 %
• Funding available for 85 % of project costs, repayable over 30 years after a 10-year grace period, during which time interest only is paid
Table 3.10.4 shows the repayment schedule and total financial burden under these conditions. The Average Growth Scenario and base case project costs (in current prices) are assumed.
It is also assumed that the responsibility for repayment of loans for the selected priority projects ultimately rests with HPPC. Table 3.10.4 shows the percentage of HPPC expenditure that would be required to repay the loan, plus the associated recurrent costs of the projects. In addition, HPPC would have to fund the 15 % of project costs not financed by the external lender.
The table shows that during the project construction period, when 15 % of project costs must be found in cash terms, the financial burden for HPPC is relatively high, rising to about 2.5 % of predicted HPPC expenditure in 2004. When actual loan repayment begins, i.e. in 2013, the financial burden peaks again, rising to 2 % at its maximum.
10.4 Technical Evaluation
Sewerage Priority Project comprises the combined sewers, CSOs (combined sewer overflow), sewers (lateral, trunk and conveyance sewers), pumps and waste water treatment plant. For the selection of the most appropriate system for sewerage development, various alternatives were considered and compared.
From the technical feasibility aspect, the alternatives were examined whether they are based on proven technology with adequate number of projects already implemented in the world, in particular in Asia, technology level of which are comparable with Vietnam. Required skill level for the O&M of the sewerage system for the alternatives were examined in the light of the current level in Vietnam as well as the expected level in the future after improvement. In this context, among the conceived alternatives, small-bore with simplified treatment plant alternative was dropped considering that it is yet not proven-technology with

The Study on Sanitation Improvement Plan for Haiphong City, Vietnam
Final Report, Main Report, Volume 2, Part 3
3 - 53
very limited number of examples which are implemented outside of Asia. As a waste water treatment plant, the aerated lagoon type was selected with various reasons. One of the major reasons is that the plant can be operated and maintained by SADCO personnel after certain manpower training.
The selected sewerage system is based on the combined sewer system which is a system based on sure and proven technology that are in operation in many countries including Asia. Construction of the system will not require any special and advanced technology. Required facility and equipment are not peculiar to this priority project and can either be manufactured in Vietnam or can be imported from overseas.
CSO is a rather new facility introduced in Vietnam. However, the operation, i.e., gate operation, will be properly done with appropriate instruction based on operation manual. For orifice type CSO, no manual operation is required while ordinary maintenance work is needed. Required skill level for the aerated lagoon is medium among the studied options and within the reach of Vietnamese engineers and technical staff with some training.
In order to ensure successful operation of the system, it is recommended that external technical assistance for acquiring the operation technology by ODA (Official Development Aid) and guidance by the manufacturers of the facility/equipment at the initial stage of the operation be obtained. Similar projects in other cities in Vietnam to precede this project should be studied and experience and knowledge should be transferred to the personnel to be engaged in this project.
Together with these efforts, the Sewerage Priority Project is considered to be technically feasible.
10.5 Environmental Impact Assessment
10.5.1 Environmental Impacts of Sewerage Project
The main impacts of the proposed project are described for design phase, construction phase and operation phase. Alternative without the project implementation has also been described. Details of the EIA and mitigating measures are described in the Supporting Report, Part C.
The proposed sewerage project is expected to bring the following positive impacts: (i) improvement of sanitation and public health condition, and (ii) up to 80 to 100 % reduction of pollution loads to lakes and channels in the project area.
The biggest adverse impacts during the project implementation are: (i) land acquisition and resettlement of about 23 households and relocation of dike, (ii) release of effluent from WWTP to Lach Tray River, (iii) disposal of treatment sludge, and (iv) offensive odor from the WWTP.

The Study on Sanitation Improvement Plan for Haiphong City, Vietnam
Final Report, Main Report, Volume 2, Part 3
3 - 54
Assessment Advantages and Disadvantages of the Project to Living Environment in City Center
Impacts Causes Positive Negative
Time scale Need for mitigation
Dust from construction, traffic - - Temporary Yes Noise during construction. - - Temporary Yes Traffic jam during construction, transportation - - Temporary Yes Risk of soil and ground water contamination - Long-term Yes Soil erosion following the felling of trees, etc., as a result of facility construction and consequent deterioration of water quality
- Temporary Yes
Effect on existing infrastructure - Temporary Yes Health risk for worker - Temporary Yes Impact on cultural, historical aspect + - Temporary No Employment creation + Temporary No Usage of sludge as fertilizer + Long-term Yes Recycle of sludge for landscaping + Long-term No Reduction of health risks due to improvement of sewerage system
+ + + Long-term No
Reduction of wastewater related diseases + + + Long-term No Improvement of health of city community + + + Long-term No Improvement of city’s aesthetics + + + Long-term No
Legend: - - - Very negative - - Negative - Less negative + Less positive + + Positive + + + Very Positive
Assessment of Advantages and Disadvantages of the Project
to Vinh Niem Commune Impact Cause
Positive Negative Time scale Need for
mitigation Acquisition of 38 ha of land and relocation of 23 households
- - - Long-term Yes
Odor nuisance from WWTP - - - Long-term Yes Discharge of treated wastewater to Lach Tray River affecting water quality, and downstream water use
- - - Long-term Yes
Generation of wastewater related diseases - - Long-term Yes Disposal of solid waste and sludge collected from WWTP
- - Long-term Yes
Dust from transportation, construction - - Temporary Yes Safety for workers - Temporary Yes Traffic jam during construction, transportation - Temporary Yes Exhausted gases generated from construction - Temporary No Noise from WWTP and pumping station - Long-term No Social order and security - Temporary Yes Influences on aesthetics and ecology - Long-term No Influences on cultural, historical aspect + - Temporary Yes Creation of employment + Temporary No Environmental awareness for community + + Long-term No
Legend: - - - Very negative - - Negative - Less negative + Less positive + + Positive + + + Very Positive

The Study on Sanitation Improvement Plan for Haiphong City, Vietnam
Final Report, Main Report, Volume 2, Part 3
3 - 55
The above tables show that the positive aspects of the project exceed the negative ones. Although there are long-term negative impacts, those can be minimized with mitigation measures and good management of operation and maintenance of the WWTP.
The major environmental impacts of the proposed projects are presented in more detail in Table 3.10.5.
If the project is not implemented, the current status of pollution in lakes and channels will get worse due to ever increasing wastewater volume and pollution load. Lakes and channels are already seriously polluted, and the situation will become more critical without the proposed sewerage.
10.5.2 Mitigation Measures for Sewerage Project
(1) General Instructions
Environmental matters have to be integrated in all the design work and planning of the project. The designing has to be done by minimizing the adverse impacts on environment; use of existing facilities and siting of new facilities at environmentally less sensitive areas are good examples of approaches to minimize environmental impact. Where possible, existing rights-of-way has to be used rather than create new ones.
Mitigation measures are given separately for the design phase, the construction phase and the operation phase. The most important activity is to arrange land acquisition, resettlement, site-clearance and relocation of dike during design and pre-construction phase. During the operation phase, special attention should be paid to minimize the adverse impacts from the operation of the WWTP. The most critical impacts will be the offensive odor from the WWTP and discharge of effluent to the Lach Tray River. More detailed information is presented in Tables 3.10.5.
(2) Mitigation Measures during Design Phase
Detailed measurement survey has to be conducted, and the exact number and type of houses and infrastructure to be relocated have to be identified. Land acquisition and resettlement has to be done according to the approved resettlement procedures described in Resettlement Action Plan (RAP) to be prepared during the detailed design phase of the project. The RAP should include a detailed public relation program, and the .affected residents should be informed about the potential impact of the project in the earliest possible stage of the project.
Location and size of resettlement areas has to be decided during the detailed design phase, and the necessary infrastructure and other structures should be designed. It

The Study on Sanitation Improvement Plan for Haiphong City, Vietnam
Final Report, Main Report, Volume 2, Part 3
3 - 56
is recommended that resettlement of project affected people should be arranged to the nearest possible vicinity of their existing houses in the same villages.
(3) Mitigation Measures during Construction Phase
1) General Instructions
The general instructions concerning working conditions, prevention of noise, odor, litter and dust during works, protection of water and sediment, health and safety, and public relations mentioned in the project documents have to be followed.
2) Construction of WWTP and Sewers
During construction, excavation and leveling, there is a risk of infiltration of surface water and wastewater into groundwater lading to local contamination of groundwater. This is a risk especially during excavation of deep trenches for different kind of sewers. According to the geotechnical surveys the upper aquifer will not be disturbed in the construction site of wastewater treatment plant.
3) Mitigation Measures during Operation Phase
Long-term mitigation measures will be needed during the operation phase to minimize the adverse impacts from WWTP. Buffer zone with trees should be established around the area to prevent dispersion of offensive odor and gases. Treatment process should be controlled frequently to guarantee the quality of effluent to be discharged to the Lach Tray River. Leachate from sludge drying beds has to be circulated back to the treatment process.

The Study on Sanitation Improvement Plan for Haiphong City, Vietnam
Final Report, Main Report, Volume 2, Part 3
3 - 57
4) Summary of Mitigation Measures for Sewerage Project
Phase Main mitigation measures Responsible organization
Design International and Vietnamese design criteria and standards to be used Underground structures have to be identified before construction of conveyances and other sewers Relocation of the dyke in Vinh Niem has to be designed Works designed to by implemented during dry season
Design Consultant
Construction Minimize dust, odor, litter, noise and traffic emissions by good operation management and site supervision Appropriate working methods have to be followed Groundwater contamination and infiltration to trenches has to prevented during construction of conveyances Sites have to be kept clean and safe during and after the work Safety and health regulations has to be strictly followed Protective clothing and operational training for workers is essential Transportation has to be minimized and routes selected to avoid public nuisance Transportation during rush hours and night has to be avoided Construction sites and time has to be informed to the local people in advance
Contractor
O&M Minimize odor, litter and noise emissions by good operation management and site supervision Appropriate working methods have to be followed Sites have to be kept clean and safe during and after the work Safety and health regulations have to be strictly followed Protective clothing and operational training for workers are essential Regular environmental monitoring program should be implemented
PIO
10.5.3 Evaluation of the Impacts with the Counter-Measures
Impacts of the project will be monitored in every phase of the project according to the monitoring program (see Supporting Report). The monitoring program is concentrating especially on the operation phase.
Implementation of smooth land acquisition and resettlement will need good co-operation between local authorities and project affected people. The Vietnamese resettlement procedures give good basis to minimize the problems.
Environmental impacts caused by operation of WWTP can be minimized with good plant management and using proper working methods.
10.6 Organizational Setup and Capability of the Implementing and Managing Bodies
10.6.1 Recommended Organizational Setup
In the Study, the following implementation setup is recommended for the efficient implementation of the Sewerage Priority Project.

The Study on Sanitation Improvement Plan for Haiphong City, Vietnam
Final Report, Main Report, Volume 2, Part 3
3 - 58
(a) One Project Management Unit (PMU) should be set up which will be responsible for the 2 priority projects of Sewerage Priority Project and Drainage Priority Project, considering:
• Same regulatory and supervising body, i.e., TUPWS and same managing and O&M body is responsible for both priority projects
• Facility and function of both are closely related and dependant each other • Timing of the implementation is expected to be about the same
The PMU will assume the prime responsibility of the project implementation including tendering, construction supervision and other related works. TUPWS will be responsible for giving necessary instruction to PMU for smooth implementation when deemed necessary. SADCO will extend assistance for daily works of PMU when deemed necessary.
According to the preliminary estimation, the resettlement for the Sewerage Priority Project will be limited to about 23 households as the WWTP site was carefully selected in the Feasibility Study. Nevertheless, acquisition of sizable agricultural area in Vinh Niem area is inevitable. Project Implementing Organization (PIO) should prepare a detailed Resettlement (and Compensation) Action Plan (RAP) in the early stage of the Detailed Design, and carry out the plan under the guidance of Haiphong PC in accordance with the Decree No.22/1998/ND-CP (1998) and other relevant regulations. Public consultation and close coordination with local PC (especially commune-level) are essential.
After entering the O&M stage, SADCO will manage the project including all the O&M works.
10.6.2 Capability of the Implementing Body
Sizable scale projects has been implemented in the recent years in the field of sanitation improvement, i.e., water supply (1A) and drainage (1B). In the latter case, the same implementation setup was adopted, i.e., PMU, TUPWS and SADCO and the project is successfully being implemented. Before the start of the Priority Projects, a few more projects are expected to be implemented in the same manner. Capability for resettlement project component of HPPC is expected to be strengthened as explained for Drainage Priority Project.
Considering the above, it is considered that the Sewerage Priority Project can successfully be implemented by the recommended implementation setup.
10.6.3 Capability of the Managing Body
To date, SADCO has experience in managing the drainage system of combined sewers but it has no experience in full-scale central sewerage system. It is

The Study on Sanitation Improvement Plan for Haiphong City, Vietnam
Final Report, Main Report, Volume 2, Part 3
3 - 59
recommended in the Study that new sections should be created within SADCO for O&M of the sewerage facility and overall control of the system together with the increase of staffs. Before the implementation of Drainage Priority Project, small-scale sewage plant is scheduled to be implemented in 1B project and some experience is expected to be obtained.
If all the recommended organizational reinforcement as well as staff augmentation and their training should be realized together with other efforts to strengthen their capability, SADCO is considered to be capable of managing the Sewerage Priority Project.
10.7 Overall Project Evaluation
The Sewerage Priority Project will meet the primary objective of the sanitation and environment improvement for the project area as well as for the city by providing a central sewerage system. Public health will be enhanced through the reduction of the water-borne diseases. Pollution load inflow into the water bodies will be decreased, resulting in the water quality improvement of the ambient waters.
From an economic point of view, the expected contribution of Sewerage Priority Project to the economic growth in the future in terms of GRP growth and property value increase can justify the investment cost incurred to implement the project. The project cost is considered within the affordable range of the HPPC/Government in terms of the annual equivalent cost of the project assuming sinking fund with the condition of 5 % annual interest rate and 25 repayment period. From financial viewpoint, the assumed concessionary loan is considered repayable by HPPC/Government.
From technical feasibility viewpoint, no difficulty is expected for construction and manufacturing of the project facility. Assuming the recommended organizational strengthening including the setting up of new sections for sewerage control including that for waste water treatment plant as well as adequate training of the staff, operation and maintenance can effectively be carried out by SADCO.
Though no significant social impact is expected, Resettlement Action Program should be formulated to alleviate the negative impact including resettlement and secure the cooperation of the project affected people. Alleviation measures also should be taken to minimize the negative environmental impact, including the provision of buffer zone around the waste water treatment plant site. Assuming these efforts, Sewerage Priority Project is considered as socially acceptable.
In conclusion, Sewerage Priority Project is evaluated to be feasible for implementation.
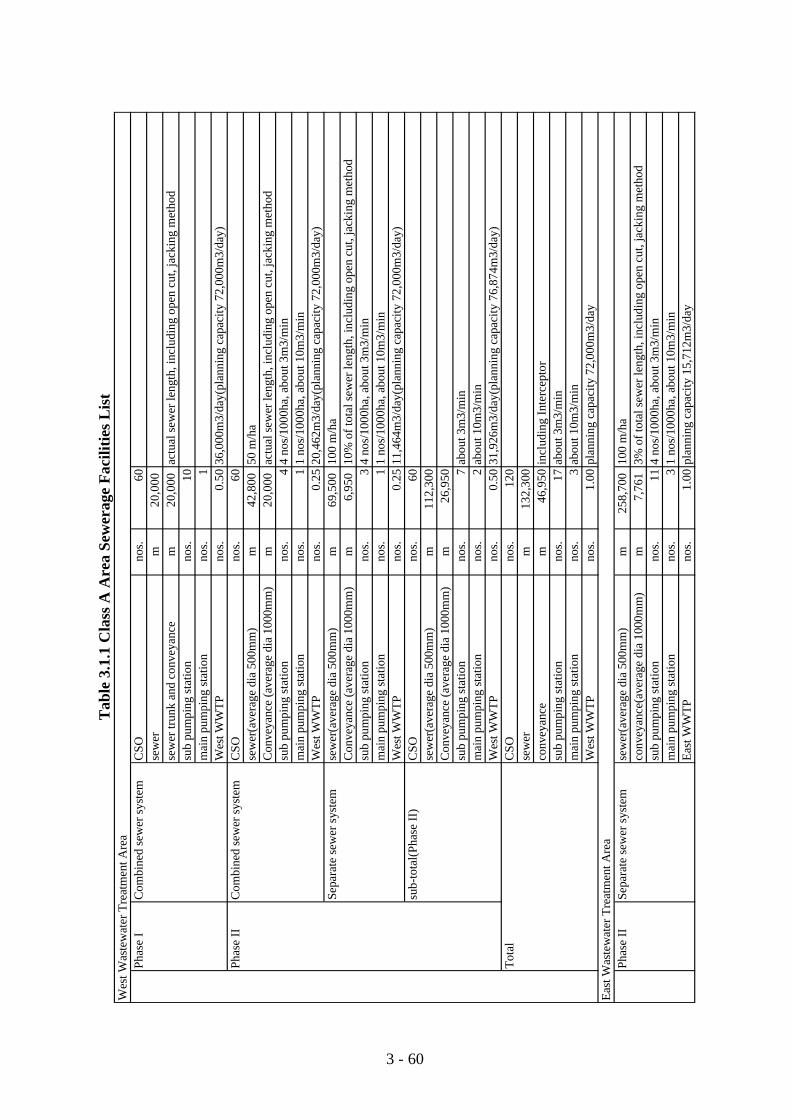
Tab
le 3
.1.1
Cla
ss A
Are
a Se
wer
age
Faci
litie
s Lis
tW
est W
aste
wat
er T
reat
men
t Are
aPh
ase
IC
ombi
ned
sew
er s
yste
mC
SOno
s.60
sew
erm
20,0
00
sew
er tr
unk
and
conv
eyan
cem
20,0
00
ac
tual
sew
er le
ngth
, inc
ludi
ng o
pen
cut,
jack
ing
met
hod
sub
pum
ping
sta
tion
nos.
10
mai
n pu
mpi
ng s
tatio
nno
s.1
W
est W
WTP
no
s.0.
5036
,000
m3/
day(
plan
ning
cap
acity
72,
000m
3/da
y)Ph
ase
IIC
ombi
ned
sew
er s
yste
mC
SOno
s.60
sew
er(a
vera
ge d
ia 5
00m
m)
m42
,800
50 m
/ha
Con
veya
nce
(ave
rage
dia
100
0mm
)m
20,0
00
ac
tual
sew
er le
ngth
, inc
ludi
ng o
pen
cut,
jack
ing
met
hod
sub
pum
ping
sta
tion
nos.
44
nos/
1000
ha, a
bout
3m
3/m
inm
ain
pum
ping
sta
tion
nos.
11
nos/
1000
ha, a
bout
10m
3/m
inW
est W
WTP
no
s.0.
2520
,462
m3/
day(
plan
ning
cap
acity
72,
000m
3/da
y)Se
para
te s
ewer
sys
tem
sew
er(a
vera
ge d
ia 5
00m
m)
m69
,500
100
m/h
aC
onve
yanc
e (a
vera
ge d
ia 1
000m
m)
m6,
950
10
% o
f tot
al s
ewer
leng
th, i
nclu
ding
ope
n cu
t, ja
ckin
g m
etho
dsu
b pu
mpi
ng s
tatio
nno
s.3
4 no
s/10
00ha
, abo
ut 3
m3/
min
mai
n pu
mpi
ng s
tatio
nno
s.1
1 no
s/10
00ha
, abo
ut 1
0m3/
min
Wes
t WW
TP
nos.
0.25
11,4
64m
3/da
y(pl
anni
ng c
apac
ity 7
2,00
0m3/
day)
sub-
tota
l(Ph
ase
II)
CSO
nos.
60se
wer
(ave
rage
dia
500
mm
)m
112,
300
Con
veya
nce
(ave
rage
dia
100
0mm
)m
26,9
50
sub
pum
ping
sta
tion
nos.
7ab
out 3
m3/
min
mai
n pu
mpi
ng s
tatio
nno
s.2
abou
t 10m
3/m
inW
est W
WTP
no
s.0.
5031
,926
m3/
day(
plan
ning
cap
acity
76,
874m
3/da
y)T
otal
CSO
nos.
120
sew
erm
132,
300
conv
eyan
cem
46,9
50in
clud
ing
Inte
rcep
tor
sub
pum
ping
sta
tion
nos.
17ab
out 3
m3/
min
mai
n pu
mpi
ng s
tatio
nno
s.3
abou
t 10m
3/m
inW
est W
WTP
no
s.1.
00pl
anni
ng c
apac
ity 7
2,00
0m3/
day
Eas
t Was
tew
ater
Tre
atm
ent A
rea
Phas
e II
Sepa
rate
sew
er s
yste
mse
wer
(ave
rage
dia
500
mm
)m
258,
700
100
m/h
aco
nvey
ance
(ave
rage
dia
100
0mm
)m
7,76
1
3% o
f tot
al s
ewer
leng
th, i
nclu
ding
ope
n cu
t, ja
ckin
g m
etho
dsu
b pu
mpi
ng s
tatio
nno
s.11
4 no
s/10
00ha
, abo
ut 3
m3/
min
mai
n pu
mpi
ng s
tatio
nno
s.3
1 no
s/10
00ha
, abo
ut 1
0m3/
min
East
WW
TP
nos.
1.00
plan
ning
cap
acity
15,
712m
3/da
y
3 - 60

Tab
le 3
.1.2
Com
pari
son
of T
reat
men
t Pro
cess
Des
ign
flow
72,0
00m
3/da
yLa
nd c
ompe
nsat
ion
cost
3U
S$/m
2 fo
r agr
icul
tura
l lan
dH
ouse
com
pens
atio
n co
st5,
000
US$
/hou
se Mai
n fa
cilit
ies
Req
uire
dR
equi
red
Hou
seC
ost
area
land
loss
Con
stru
ctio
nC
ompe
nsat
ion
sub-
tota
lO
& M
haha
nos.
mill
ion
US$
mill
ion
US$
mill
ion
US$
mill
ion
US$
/yea
r
Stab
iliza
tion
Pond
WSP
Ana
erob
ic P
ond,
Fac
ulta
tive
Pond
,M
atur
atio
n Po
nd, A
vera
gede
pth=
1.5m
108
130
260
26.8
55.
2032
.05
0.62
Mod
ified
Sta
biliz
atio
n Po
ndM
SPFi
rst P
ond,
Sec
ond
Pond
, Ave
rage
dept
h=3.
0m36
4488
24.1
61.
7625
.92
0.59
Aer
ated
Lag
oon
AL
Aer
ated
Lag
oon,
Set
tling
Pon
d,av
erag
e de
pth=
3.0m
2327
5425
.83
1.08
26.9
11.
36
Oxi
datio
n Po
ndO
D
Oxi
datio
n D
itch,
Set
tling
Tan
k,Sl
udge
Thi
cken
ing
Tank
, Slu
dge
Dry
ing
Bed
, Ave
rage
dep
th=3
.0m
1217
3434
.45
0.68
35.1
31.
80
Act
ivat
ed S
ludg
e Pr
oces
sA
SP
Pret
reat
men
t Fac
ilitie
s, P
rimar
ySe
dim
enta
tion
Tank
, Aer
atio
nTa
nk, S
econ
dary
Sed
imen
tatio
nTa
nk, S
ludg
e Th
icke
ning
Tan
k,Sl
udge
Dry
ing
Bed
, Ave
rage
dept
h=4.
0m8
1224
43.0
70.
4843
.55
2.23
3 - 61

Table 3.3.1 Population Estimation for CSO Command AreaPopulation Density Population (after 1st Trail) Adjusted Population
sub_dist ZONE_NAMEdetailed_zAREA (ha) D1999 D2005 D2010 D2015 D2020 P1999 P2005 P2010 P2015 P2020 P1999 P2005 P2010 P2015 P2020210 C01 21.82 150.81 159.87 161.86 163.86 165.86 3291 3488 3532 3575 3619 3414 3594 3629 3663 3698210 C02 11.89 150.81 159.87 161.86 163.86 165.86 1793 1900 1924 1948 1971 1860 1958 1977 1995 2014210 C03 3.35 150.81 159.87 161.86 163.86 165.86 505 536 543 549 556 525 552 557 563 568210 C04 2.68 150.81 159.87 161.86 163.86 165.86 404 428 434 439 444 419 441 445 450 454210 C05 6.69 150.81 159.87 161.86 163.86 165.86 1009 1069 1083 1096 1110 1047 1102 1113 1123 1134311 C06 9.93 299.86 338.24 366.51 394.64 422.64 2977 3358 3638 3917 4195 3089 3459 3738 4013 4287717 C07 22.83 82.58 104.09 123.31 140.44 157.45 1885 2376 2815 3206 3594 1956 2448 2892 3284 3673308 C08 15.68 375.96 356.70 353.70 351.00 348.55 5894 5592 5545 5503 5464 6116 5762 5698 5638 5583308 C09 16.16 375.96 356.70 353.70 351.00 348.55 6074 5763 5715 5671 5632 6303 5938 5872 5810 5754309 C10 19.13 423.30 444.16 465.07 486.01 506.98 8096 8495 8895 9296 9697 8401 8753 9140 9524 9908310 C11 25.63 415.58 451.66 481.09 510.43 539.71 10650 11575 12329 13081 13832 11051 11926 12668 13402 14133311 C12 55.13 299.86 338.24 366.51 394.64 422.64 16530 18646 20204 21755 23299 17153 19211 20760 22288 23806717 C13 25.09 82.58 104.09 123.31 140.44 157.45 2072 2612 3094 3524 3951 2150 2691 3179 3610 4037717 C14 17.41 82.58 104.09 123.31 140.44 157.45 1438 1812 2147 2445 2741 1492 1867 2206 2505 2801307 C15 23.31 468.06 456.36 444.66 432.95 421.25 10908 10636 10363 10090 9818 11319 10958 10648 10338 10031307 C16 14.38 468.06 456.36 444.66 432.95 421.25 6730 6562 6394 6225 6057 6984 6761 6569 6378 6189717 C17 18.68 82.58 104.09 123.31 140.44 157.45 1543 1944 2303 2623 2941 1601 2003 2367 2688 3005717 C18 13.80 82.58 104.09 123.31 140.44 157.45 1139 1436 1701 1938 2172 1182 1480 1748 1985 2220717 C19 11.86 82.58 104.09 123.31 140.44 157.45 979 1234 1462 1665 1867 1016 1272 1502 1706 1908717 C20 4.41 82.58 104.09 123.31 140.44 157.45 365 460 544 620 695 378 473 559 635 710202 E01 40.10 90.96 102.71 111.21 119.64 128.02 3648 4119 4460 4798 5134 3785 4244 4582 4916 5246205 E02 10.79 340.30 331.80 323.29 314.78 306.27 3673 3581 3490 3398 3306 3811 3690 3585 3481 3378204 E03 22.10 330.26 322.00 313.74 305.49 297.23 7297 7115 6932 6750 6567 7572 7331 7123 6915 6710205 E04" 18.76 340.30 331.80 323.29 314.78 306.27 6383 6224 6064 5905 5745 6624 6413 6231 6049 5870201 E04' 17.98 115.89 110.30 109.45 108.70 108.03 2083 1983 1968 1954 1942 2162 2043 2022 2002 1984205 E05 8.40 340.30 331.80 323.29 314.78 306.27 2859 2787 2716 2644 2573 2966 2872 2790 2709 2629205 E06 10.71 340.30 331.80 323.29 314.78 306.27 3644 3553 3462 3371 3280 3781 3661 3557 3454 3351212 E07 22.30 59.75 72.64 81.16 89.59 97.94 1333 1620 1810 1998 2184 1383 1669 1860 2047 2232212 E08 13.75 59.75 72.64 81.16 89.59 97.94 821 998 1116 1231 1346 852 1029 1146 1262 1376212 E09 38.78 59.75 72.64 81.16 89.59 97.94 2317 2817 3148 3474 3798 2405 2903 3234 3560 3881201 E10 17.02 115.89 110.30 109.45 108.70 108.03 1973 1877 1863 1850 1839 2047 1934 1914 1895 1879201 E11 13.27 115.89 110.30 109.45 108.70 108.03 1537 1463 1452 1442 1433 1595 1508 1492 1477 1464212 E12 8.54 59.75 72.64 81.16 89.59 97.94 510 620 693 765 836 529 639 712 784 854207 E13 7.93 422.40 411.84 401.28 390.72 380.16 3348 3265 3181 3097 3014 3474 3364 3268 3173 3079212 E14 4.58 59.75 72.64 81.16 89.59 97.94 274 333 372 410 448 284 343 382 420 458209 E15" 4.30 429.97 379.62 359.63 340.28 321.48 1850 1633 1547 1464 1383 1920 1683 1590 1500 1413210 E15' 2.77 150.81 159.87 161.86 163.86 165.86 418 443 449 454 460 434 457 461 466 470210 E16 34.46 150.81 159.87 161.86 163.86 165.86 5197 5509 5578 5647 5716 5393 5676 5731 5785 5840209 E17 11.88 429.97 379.62 359.63 340.28 321.48 5108 4510 4272 4042 3819 5300 4647 4390 4141 3902207 E18 3.38 422.40 411.84 401.28 390.72 380.16 1426 1390 1354 1319 1283 1479 1432 1392 1351 1311207 E19 5.55 422.40 411.84 401.28 390.72 380.16 2344 2286 2227 2168 2110 2432 2355 2288 2222 2156212 E20 3.81 59.75 72.64 81.16 89.59 97.94 228 277 309 342 373 236 285 318 350 382212 E21 21.19 59.75 72.64 81.16 89.59 97.94 1266 1540 1720 1899 2076 1314 1586 1767 1945 2121211 E22 5.17 81.27 93.09 101.44 109.71 117.92 420 481 525 567 610 436 496 539 581 623211 E23 7.02 81.27 93.09 101.44 109.71 117.92 571 654 712 770 828 592 673 732 789 846212 E24 69.15 59.75 72.64 81.16 89.59 97.94 4132 5023 5612 6195 6773 4288 5176 5767 6347 6920720 E25 8.59 19.89 25.85 31.82 37.79 45.74 171 222 273 324 393 177 229 281 332 401211 E26 15.61 81.27 93.09 101.44 109.71 117.92 1268 1453 1583 1712 1840 1316 1497 1627 1754 1881211 E27 15.03 81.27 93.09 101.44 109.71 117.92 1221 1399 1524 1648 1772 1267 1441 1566 1689 1810211 E28 7.67 81.27 93.09 101.44 109.71 117.92 623 714 778 841 904 647 736 799 862 924305 W01 10.40 480.67 468.65 456.64 444.62 432.60 4998 4873 4748 4623 4498 5186 5020 4878 4736 4596304 W02 12.86 282.35 275.29 268.23 261.17 254.11 3631 3540 3449 3359 3268 3768 3648 3544 3441 3339304 W03 3.81 282.35 275.29 268.23 261.17 254.11 1076 1049 1022 995 968 1117 1081 1050 1020 989304 W04 4.10 282.35 275.29 268.23 261.17 254.11 1159 1130 1101 1072 1043 1202 1164 1131 1098 1066304 W05 36.64 282.35 275.29 268.23 261.17 254.11 10346 10087 9829 9570 9311 10735 10393 10099 9804 9514312 W06 5.23 213.52 271.44 309.04 346.32 383.32 1118 1421 1618 1813 2007 1160 1464 1662 1857 2050304 W07 1.29 282.35 275.29 268.23 261.17 254.11 364 355 345 336 327 377 365 355 345 334312 W08 12.33 213.52 271.44 309.04 346.32 383.32 2632 3346 3809 4268 4724 2731 3447 3914 4373 4827312 W09 8.02 213.52 271.44 309.04 346.32 383.32 1711 2176 2477 2776 3072 1776 2242 2545 2844 3139312 W10 11.19 213.52 271.44 309.04 346.32 383.32 2388 3036 3457 3874 4288 2478 3129 3552 3969 4381312 W11 10.15 213.52 271.44 309.04 346.32 383.32 2167 2755 3137 3515 3891 2249 2839 3223 3601 3975312 W12 33.25 213.52 271.44 309.04 346.32 383.32 7099 9025 10275 11514 12744 7366 9299 10557 11796 13022718 W13 20.91 28.99 40.59 52.19 63.79 75.39 606 849 1091 1334 1577 629 875 1121 1367 1611305 W14 6.24 480.67 468.65 456.64 444.62 432.60 2997 2922 2847 2772 2697 3110 3011 2926 2840 2756306 W15 9.33 418.47 408.01 397.55 387.09 376.62 3906 3808 3710 3613 3515 4053 3924 3812 3701 3592312 W16 44.56 213.52 271.44 309.04 346.32 383.32 9514 12095 13770 15431 17080 9872 12462 14149 15809 17452718 W17 20.01 28.99 40.59 52.19 63.79 75.39 580 812 1044 1276 1508 602 837 1073 1307 1541
1060.72 14266.02 14899.12 15349.51 15783.74 16217.85 208518.85 223090.83 233584.21 243790.79 253960.02 216370 229860 240006 249765 259487
236446 251771 263361 274540 285663EX 20206 22080 23628 25096 26557IN 130 169 274 321 381
216370 229860 240006 249765 259487
0 EII 106.04 12982 14660 15873 17077 182730 CII 248.50 67036 59124 54849 50306 455130 WII1 36.94 13011 12453 12411 12379 123550 WII2 79.95 12935 12612 12288 11965 116420 WII3 157.09 27376 29099 30599 32124 33670
628.52 133340 127948 126021 123850 121452
3 - 62

Tab
le 3
.3.2
Are
a of
Lak
e in
the
Wes
t Tre
atm
ent A
rea
Nam
em
easu
red
area
Dis
trict
Dra
inag
e Sy
stem
Use
Rem
arks
haTh
ien
Nga
1.4
Ngo
Que
nN
orth
-eas
t sys
tem
Reg
ulat
ing
Lake
Phas
e I C
ombi
ned
Mam
Tom
1.8
Ngo
Que
nN
orth
-eas
t sys
tem
Reg
ulat
ing
Lake
Phas
e I C
ombi
ned
Qua
n N
gua
2.8
Ngo
Que
nN
orth
-eas
t sys
tem
Reg
ulat
ing
Lake
Phas
e I C
ombi
ned
An
Bie
n19
.2N
go Q
uen
Nor
th-e
ast s
yste
mR
egul
atin
g La
kePh
ase
I Com
bine
dSe
n1.
7L
e C
han
Sout
h-w
est s
yste
mR
egul
atin
g La
kePh
ase
I Com
bine
dD
u H
ang/
Lam
Tuo
ng6.
1L
e(2.
207)
,Du(
3.89
9)So
uth-
wes
t sys
tem
Reg
ulat
ing
Lake
Phas
e I C
ombi
ned
Phuo
ng L
uu-
Don
g H
ai, D
ang
Lam
Com
.-
Reg
ulat
ing
Lake
Phas
e II
Sep
arat
eD
on N
ghia
47.7
Vin
h N
iem
Com
.-
Reg
ulat
ing
Lake
Phas
e II
Sep
arat
eT
an B
ac4.
6H
ong
Ban
(2.3
), Le
(2.3
)-
Reg
ulat
ing
Lake
Phas
e II
Com
bine
dT
otal
85.3
3 - 63

Tab
le 3
.3.3
Lan
d, L
ake
and
Riv
er A
rea
by D
istr
ict
Uni
t: ha
Dis
tric
tD
istr
ict A
rea
Tre
atm
ent A
rea
Lan
dLa
keR
iver
Hon
g B
ang
Dis
t.1,
520
426
356
268
Ngo
Quy
en D
ist.
1,09
595
483
725
92L
e C
hanD
ist.
442
447
427
615
Du
Han
g K
enh
Com
.26
928
027
64
0V
inh
Nie
m C
om.
563
473
335
4890
(add
-E24
)Don
g H
ai-
22
00
(add
-E25
)Dan
g L
am-
77
00
Tot
al3,
889
2,58
92,
230
8526
5W
est T
A P
hase
I C
ombi
ned
area
1,11
2W
est T
A P
hase
II C
ombi
ned
area
789
Wes
t TA
Pha
se II
Sep
arat
e ar
ea68
7to
tal
1,47
7
3 - 64

Tab
le 3
.3.4
U
nit S
ewag
e by
Pha
se a
nd D
istr
ict
Are
a (h
a)Fl
ow (m
3/da
y)U
nit F
low
(m3/
day/
ha)
Land
Phas
e I
Phas
e II
Phas
e I
Phas
e II
Phas
e I
Phas
e II
Are
aC
ombi
ned
Com
bine
dSe
para
teC
ombi
ned
Com
bine
dSe
para
teC
ombi
ned
Com
bine
dSe
para
teD
istr
ict
ha20
2020
2020
2020
2020
2020
2020
2020
2020
20C
omm
erci
alH
ong
Ban
g D
ist.
354
354
548
1.55
0 N
go Q
uyen
Dis
t.99
066
421
111
61,
172
511
203
1.76
62.
426
0.20
5Le
Cha
nDis
t.42
736
760
729
123
1.98
52.
057
Du
Han
g K
enh
Com
.27
613
614
095
540.
701
0.19
4V
inh
Nie
m C
om.
335
4828
744
268
0.90
90.
800
sub-
tota
l2,
383
1,21
562
454
32,
040
1,18
352
50.
856
0.49
60.
220
Inst
itutio
nal
Hon
g B
ang
Dis
t.35
435
485
72.
424
Ngo
Quy
en D
ist.
990
664
211
116
1,30
277
822
61.
962
3.69
20.
228
Le C
hanD
ist.
427
367
601,
367
231
3.72
33.
857
Du
Han
g K
enh
Com
.27
613
614
095
540.
701
0.19
4V
inh
Nie
m C
om.
335
4828
744
268
0.90
90.
800
sub-
tota
l2,
383
1,21
562
454
32,
808
1,86
754
81.
178
0.78
30.
230
Indu
stri
alH
ong
Ban
g D
ist.
354
354
1,75
24.
953
Ngo
Quy
en D
ist.
990
664
211
116
1,18
31,
530
205
1.78
27.
262
0.20
7Le
Cha
nDis
t.42
736
760
616
104
1.67
71.
738
Du
Han
g K
enh
Com
.27
613
614
013
274
0.97
30.
270
Vin
h N
iem
Com
.33
548
287
6137
21.
263
1.11
1su
b-to
tal
2,38
31,
215
624
543
1,99
13,
386
652
0.83
61.
421
0.27
4T
otal H
ong
Ban
g D
ist.
354
354
3,15
88.
928
Ngo
Quy
en D
ist.
990
664
211
116
3,65
62,
819
635
5.50
913
.379
5.47
2
Le C
hanD
ist.
427
367
602,
711
459
7.38
57.
651
Du
Han
g K
enh
Com
.27
613
614
032
318
22.
374
1.29
8
Vin
h N
iem
Com
.33
548
287
148
909
3.08
23.
163
tota
l2,
383
1,21
562
454
36,
839
6,43
61,
725
5.62
910
.307
3.17
5
Tre
atm
ent A
rea
(not
incl
udin
g L
ake)
Land
Land
Phas
e I
Phas
e II
Are
aC
ombi
ned
Com
bine
dSe
para
teD
istr
ict
ha20
2020
2020
20H
ong
Ban
g D
ist.
354
354
Ngo
Quy
en D
ist.
990
664
211
116
Le C
hanD
ist.
427
367
60D
u H
ang
Ken
h C
om.
276
136
140
Vin
h N
iem
Com
.33
548
287
tota
l2,
383
1,21
562
454
3
3 - 65
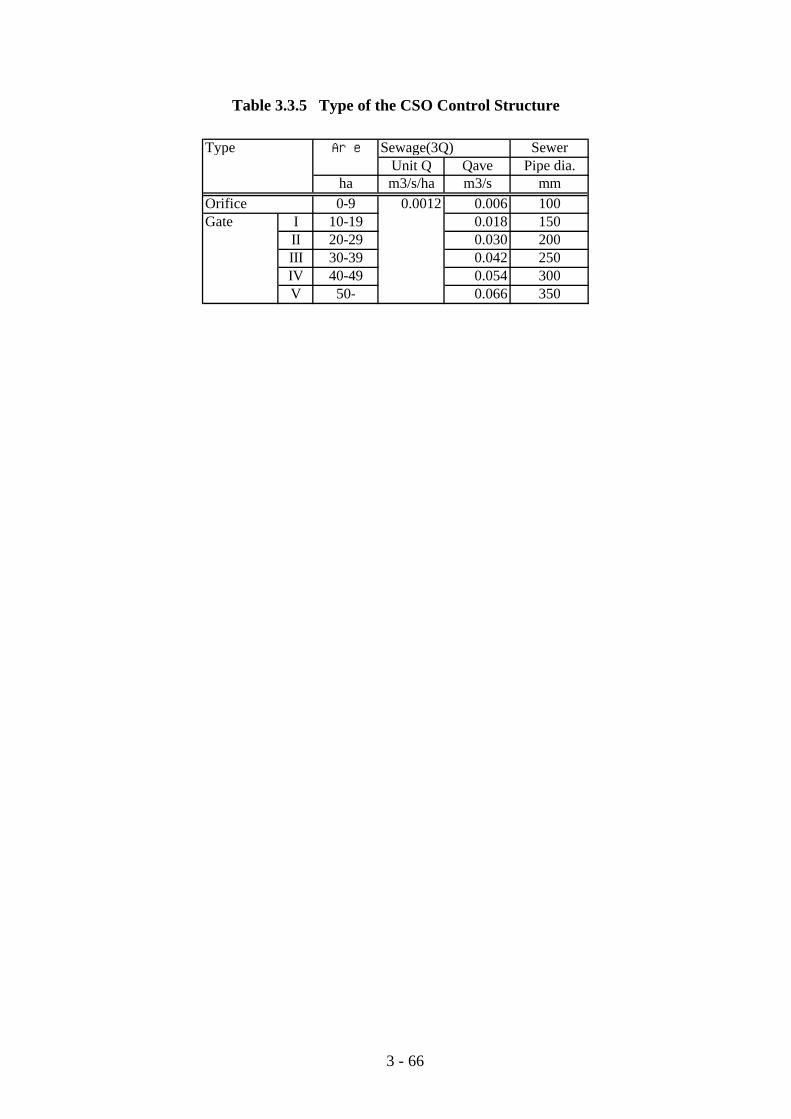
Table 3.3.5 Type of the CSO Control Structure
Type Area Sewage(3Q) SewerUnit Q Qave Pipe dia.
ha m3/s/ha m3/s mmOrifice 0-9 0.0012 0.006 100Gate I 10-19 0.018 150
II 20-29 0.030 200III 30-39 0.042 250IV 40-49 0.054 300V 50- 0.066 350
3 - 66

Table 3.3.6 CSO Control Structure ListUnit : nos.
Type Area Sub-Catchment Area Totalha WEST CENTER EAST
Orifice 0-9 3 5 12 20Gate I 10-19 5 9 8 22
II 20-29 2 4 4 10III 30-39 2 0 3 5IV 40-49 1 0 1 2V 50- 0 1 1 2
Weir 10-19 0 0 0 020-29 0 0 0 030-39 0 0 0 040-49 0 0 0 050- 0 0 0 0
Total 13 19 29 61Orifice sub-total 3 5 12 20Gate sub-total 10 14 17 41Weir sub-total 0 0 0 0
3 - 67

Table 3.3.7 Bill of Quantity of Gate Type Unit Gate Type
I II III IV Vpipe for sewage D1 mm 150 200 250 300 350pipe for stormwater D2 mm 1200 1500 1650 1800 2000length l1 mm 900 900 1200 1200 1200
l2 mm 300 300 300 300 300l3 mm 100 100 150 150 150l4 mm 600 600 600 600 600l5 mm 150 150 200 200 200
width w1 mm 900 900 1200 1200 1200w2 mm 150 150 200 200 200
depth d1 mm 2200 2500 2650 2800 3000d2 mm 200 200 250 250 250d3 mm 150 150 200 200 200
L m 2.2 2.2 2.65 2.65 2.65L' m 1.9 1.9 2.25 2.25 2.25W m 1.2 1.2 1.6 1.6 1.6W' m 0.9 0.9 1.2 1.2 1.2D m 2.35 2.65 2.85 3 3.2D' m 2.2 2.5 2.65 2.8 3V m3 6.20 7.00 12.08 12.72 13.57V' m3 3.76 4.28 7.16 7.56 8.10A1 m2 =L*D 5.17 5.83 7.5525 7.95 8.48A1' m2 =L'*D' 4.18 4.75 5.9625 6.3 6.75A2 m2 =W*D 2.82 3.18 4.56 4.8 5.12A2' m2 =W'*D' 1.98 2.25 3.18 3.36 3.6
excavation m3 20.4 22.8 32.9 34.5 36.7backfilling m3 13.8 15.5 19.9 20.9 22.2surplus soil disposal m3 6.6 7.4 12.9 13.6 14.4pavement m2 8.2 8.2 10.8 10.8 10.8crusher-run stone m3 0.40 0.40 0.85 0.85 0.85reinforced concrete m3 2.44 2.72 4.93 5.16 5.47formwork m2 28.3 32.0 42.5 44.8 47.9reinforcing bar kg 147 163 296 310 328screen nos. W900xH600 1 W900xH600 1 W1200xH900 1 W1200xH900 1 W1200xH900 1gate nos. dia150 1 dia200 1 dia250 1 dia300 1 dia350 1reinforced concrete pipe m dia150 5 dia200 5 dia250 5 dia300 5 dia350 5grating cover nos. 900x1200 1 900x1200 1 1200x1500 1 1200x1500 1 1200x1500 1step nos. W=300 6 W=300 7 W=300 8 W=300 8 W=300 9manhole cover nos. dia600 1 dia600 1 dia600 1 dia600 1 dia600 1stop log nos. W900xH600 1 W900xH600 1 W1200xH900 1 W1200xH900 1 W1200xH900 1de-watering LS 1 1 1 1 1retaining wall LS 1 1 1 1 1flap gate nos. dia 1200 1 dia 1500 1 dia 1650 1 dia 1800 1 dia 2000 1
LS=lump sum
3 - 68

Table 3.3.8 Bill of Quantity of Orifice Type Unit OrificeType
Ipipe for sewage D1 mm 100pipe for stormwater D2 mm 700length l1 mm 600
l2 mm 300l3 mm 100l4 mm 600l5 mm 150
width w1 mm 600w2 mm 150
depth d1 mm 1800d2 mm 150d3 mm 150
L m 1.9L' m 1.6W m 0.9W' m 0.6D m 1.95D' m 1.8V m3 3.33V' m3 1.73A1 m2 =L*D 3.705A1' m2 =L'*D' 2.88A2 m2 =W*D 1.755A2' m2 =W'*D' 1.08
excavation m3 13.671backfilling m3 10.08surplus soil disposal m3 3.591pavement m2 6.5crusher-run stone m3 0.26reinforced concrete m3 1.61formwork m2 18.84reinforcing bar kg 96screen nos. W600xH600 1orifice nos. dia100 1reinforced concrete pipe m dia100 5grating cover nos. 600x900 1step nos. W=300 5manhole cover nos. dia600 1stop log nos. W600xH300 1de-watering LS 1retaining wall LS 1flap gate nos. dia 700 1
3 - 69

Table 3.4.1 Minimum slopes for gravity-flow combined sewer
Based on Manning's equation with a minimum velocity of 1.0 m/s. n=0.013 Steeper slopes should be used for diameter greater than 1350 mm. Diameter Area Perimeter Hydraulic radius Velocity Slope Flow AllowanceAdjusted Flow
D A p R V I Q Qmm m2 m m m/s %o m3/s % m3/s
300 0.07069 0.94248 0.075 1.0 0.0053 0.071 100 0.035400 0.12566 1.25664 0.100 1.0 0.0036 0.126 100 0.063500 0.19635 1.57080 0.125 1.0 0.0027 0.196 100 0.098600 0.28274 1.88496 0.150 1.0 0.0021 0.283 100 0.141700 0.38485 2.19911 0.175 1.0 0.0017 0.385 50 0.257800 0.50265 2.51327 0.200 1.0 0.0014 0.503 50 0.335900 0.63617 2.82743 0.225 1.0 0.0012 0.636 50 0.424
1000 0.78540 3.14159 0.250 1.0 0.0011 0.785 50 0.5241100 0.95033 3.45575 0.275 1.0 0.0009 0.950 50 0.6341200 1.13097 3.76991 0.300 1.0 0.0008 1.131 50 0.7541350 1.43139 4.24115 0.338 1.0 0.0007 1.431 50 0.9541500 1.76715 4.71239 0.375 1.0 0.0006 1.767 50 1.1781650 2.13825 5.18363 0.413 1.0 0.0006 2.138 25 1.7111800 2.54469 5.65487 0.450 1.0 0.0005 2.545 25 2.0362000 3.14159 6.28319 0.500 1.0 0.0004 3.142 25 2.513
The minimum practical slope for construction is about 0.0008 m/m1350 1.43139 4.24115 0.338 1.055 0.0008 1.510 50 1.0061500 1.76715 4.71239 0.375 1.131 0.0008 1.999 50 1.3331650 2.13825 5.18363 0.413 1.206 0.0008 2.578 25 2.0621800 2.54469 5.65487 0.450 1.278 0.0008 3.251 25 2.6012000 3.14159 6.28319 0.500 1.371 0.0008 4.306 25 3.445
3 - 70

Tabl
e 3.
4.2
Com
puta
tion
tabl
e fo
r de
sign
of th
e tr
unck
sew
er (
1/4)
(Eas
t Sub
-Tre
atm
ent A
rea)
Lin
eL
ocat
ion
Res
iden
tial f
low
Com
mer
cial
/Inst
itutio
nal/I
ndus
trial
flow
Infil
tratio
nTo
tal d
esig
n flo
wSe
wer
des
ign
Hon
g B
ang
Dis
trict
Ngo
Quy
en D
istri
ctL
e C
han
Dis
tric
tD
u H
ang
Ken
g C
om.
Vin
h N
iem
Com
.Fr
om
ToSu
bare
aA
rea
Cum
.T
otal
Pop.
Cum
.T
otal
Avg
.un
itflo
w
Cum
.A
vg.
flow
Are
aC
um. T
ota
Avg
.un
itflo
w
Cum
. Avg
.
Are
aC
um.
Tot
alA
vg.
unit
flow
Cum
.A
vg.
flow
Are
aC
um.
Tot
alA
vg.
unit
flow
Cum
.A
vg.
flow
Are
aC
um.
Tot
alA
vg.
unit
flow
Cum
.A
vg.
flow
Are
aC
um.
Tot
alA
vg.
unit
flow
Cum
.A
vg.
flow
Cum
.A
vg.
flow
Infil
trati
on ra
teIn
filtra
tion
flow
Cum
.A
vg.
flow
Peak
fact
orC
um.
Peak
flow
Cum
.Pe
akflo
w
Sew
erdi
amet
er
Slop
eC
apac
ity
full
Allo
wa
ble
Cap
acit
y
Vel
ocit
y fu
ll
haha
pers
onpe
rson
L/ca
pita?d
m3/
dha
ham
3/d/
ham
3/d
haha
m3/
d/ha
m3/
dha
ham
3/d/
ham
3/d
haha
m3/
d/ha
m3/
dha
ham
3/d/
ham
3/d
m3/
d%
m3/
dm
3/d
m3/
dm
3/s
mm
m/m
m3/
sm
3/s
m/s
12
34
56
78
910
1112
1314
1516
1718
1920
2122
2324
2526
2728
2930
3132
3334
3536
3738
3940
4142
(8x9
/100
0)(1
2x13
)(1
6x17
)(2
0x21
)(2
4x25
)(2
8x29
)(10+14
+18+
22+2
6+30
)(3
1x32
/100
)(3
1+33
)(3
4x35
)(3
6/86
400)
ET
1-1
02
EII
106.
018
,273
1,09
3E
140
.15,
246
40.1
E2
10.8
156.
93,
378
26,8
9613
03,
496
10.8
50.9
5.50
928
04,
870
1048
75,
357
3.0
16,0
710.
186
700
0.00
170.
385
0.25
71.
0E
T1-
22
3E
322
.16,
710
22.1
E4'
18.0
1,98
418
.0E4
''18
.85,
870
18.8
E5
8.4
224.
22,
629
44,0
9013
05,
732
8.4
118.
15.
509
651
7,47
510
748
8,22
33.
024
,669
0.28
680
00.
0014
0.50
30.
335
1.0
ET
1-3
36
E6
10.7
3,35
110
.7E
722
.32,
232
22.3
E8
13.7
1,37
613
.7E
938
.830
9.7
3,88
154
,929
130
7,14
138
.820
3.7
5.50
91,
122
9,35
610
936
10,2
913.
030
,874
0.35
790
00.
0012
0.63
60.
424
1.0
to E
T1-
4E
LT
1-1
45
E10
17.0
17.0
1,87
91,
879
130
244
17.0
17.0
5.50
994
338
1034
372
3.0
1,11
50.
013
300
0.00
530.
071
0.03
51.
0E
LT
1-2
56
E11
13.3
1,46
413
.3E
128.
585
48.
5E
137.
946
.83,
079
7,27
613
094
67.
946
.85.
509
258
1,20
310
120
1,32
43.
03,
972
0.04
640
00.
0036
0.12
60.
063
1.0
to E
T1-
4E
T1-
46
11E
144.
636
1.0
458
62,6
6413
08,
146
4.6
255.
05.
509
1,40
510
,644
101,
064
11,7
083.
035
,125
0.40
790
00.
0012
0.63
60.
424
1.0
to E
T1-
5E
LT
2-1
78
E15
'2.
847
02.
8E
15''
4.3
7.1
1,41
31,
883
130
245
4.3
7.1
5.50
939
284
1028
312
3.0
937
0.01
130
00.
0053
0.07
10.
035
1.0
EL
T2-
28
9E
1634
.541
.55,
840
7,72
313
01,
004
34.5
41.5
5.50
922
91,
233
1012
31,
356
3.0
4,06
80.
047
400
0.00
360.
126
0.06
31.
0E
LT
2-3
910
E17
11.9
53.4
3,90
211
,625
130
1,51
111
.953
.45.
509
294
1,80
610
181
1,98
63.
05,
958
0.06
950
00.
0027
0.19
60.
098
1.0
EL
T2-
410
11E
183.
41,
311
3.4
E19
5.5
62.3
2,15
615
,092
130
1,96
25.
562
.35.
509
343
2,30
510
231
2,53
63.
07,
608
0.08
850
00.
0027
0.19
60.
098
1.0
to E
T1-
5E
T1-
511
12E
203.
838
23.
8E
2121
.244
8.4
2,12
180
,258
130
10,4
3421
.234
2.3
5.50
91,
886
13,4
1310
1,34
114
,754
3.0
44,2
610.
512
1,00
00.
0011
0.78
50.
524
1.0
to E
T1-
6E
LT
3-1
1617
C1
21.8
3,69
821
.817
12-
0.0
21.8
3,69
813
048
121
.85.
509
120
601
1060
661
3.0
1,98
30.
023
300
0.00
530.
071
0.03
51.
0to
ET
1-6
ET
1-6
1212
'-
470.
283
,956
130
10,9
1436
4.2
5.50
92,
006
14,0
1310
1,40
115
,415
3.0
46,2
440.
535
1,10
00.
0009
0.95
0.63
41.
0to
P/S
ET
2-1
1314
E24
69.2
6,92
069
.2E
258.
677
.740
17,
322
130
952
8.6
77.7
5.50
942
81,
380
1013
81,
518
3.0
4,55
40.
053
400
0.00
360.
126
0.06
31.
0E
T2-
214
15E
2615
.61,
881
15.6
E27
15.0
108.
41,
810
11,0
1313
01,
432
15.0
108.
45.
509
597
2,02
910
203
2,23
23.
06,
695
0.07
750
00.
0027
0.19
60.
098
1.0
to C
-2C
-19
12E
225.
262
35.
2E
237.
084
67.
0E
287.
749
0.1
924
86,3
4913
011
,225
7.7
384.
05.
5089
2,11
614
,434
101,
443
15,8
773.
047
,632
0.55
11,
100
0.00
090.
950.
634
1.0
C-2
1218
-59
8.4
97,3
6113
012
,657
492.
45.
5089
2,71
316
,463
101,
646
18,1
093.
054
,327
0.62
91,
100
0.00
090.
950.
634
1.0
to C
-3
CSO
con
trol
str
uctu
read
ditio
nal w
aste
wat
er fr
om P
hase
II A
rea
3 - 71

Tab
le 3
.4.2
C
ompu
tatio
n ta
ble
for
desig
n of
the
trun
ck se
wer
(2/4
) (C
ente
r Su
b-T
reat
men
t Are
a)
Lin
eL
ocat
ion
Res
iden
tial f
low
Com
mer
cial
/Inst
itutio
nal/I
ndus
trial
flow
Infil
tratio
nTo
tal d
esig
n flo
wSe
wer
des
ign
Hon
g B
ang
Dis
trict
Ngo
Quy
en D
istri
ctL
e C
han
Dis
tric
tD
u H
ang
Ken
g C
om.
Vin
h N
iem
Com
.Fr
om
ToSu
bare
aA
rea
Cum
.T
otal
Pop.
Cum
.T
otal
Avg
.un
itflo
w
Cum
.A
vg.
flow
Are
aC
um. T
ota
Avg
.un
itflo
w
Cum
. Avg
.
Are
aC
um.
Tot
alA
vg.
unit
flow
Cum
.A
vg.
flow
Are
aC
um.
Tot
alA
vg.
unit
flow
Cum
.A
vg.
flow
Are
aC
um.
Tot
alA
vg.
unit
flow
Cum
.A
vg.
flow
Are
aC
um. T
ota
Avg
.un
itflo
w
Cum
. Avg
.
Cum
.A
vg.
flow
Infil
trati
on ra
teIn
filtra
tion
flow
Cum
.A
vg.
flow
Peak
fact
orC
um.
Peak
flow
Cum
.Pe
akflo
w
Sew
erdi
amet
er
Slop
eC
apac
ity
full
Allo
wa
ble
Cap
acit
y
Vel
ocit
y fu
ll
haha
pers
onpe
rson
L/ca
pita?d
m3/
dha
ham
3/d/
ham
3/d
haha
m3/
d/ha
m3/
dha
ham
3/d/
ham
3/d
haha
m3/
d/ha
m3/
dha
ham
3/d/
ham
3/d
m3/
d%
m3/
dm
3/d
m3/
dm
3/s
mm
m/m
m3/
sm
3/s
m/s
12
34
56
78
910
1112
1314
1516
1718
1920
2122
2324
2526
2728
2930
3132
3334
3536
3738
3940
4142
(8x9
/100
0)(1
2x13
)(1
6x17
)(2
0x21
)(2
4x25
)(2
8x29
)(1
0+14
+18+
22+2
6+30
)(3
1x32
/100
)(3
1+33
)(3
4x35
)(3
6/86
400)
CT1
-117
18C
211
.92,
014
11.9
C3
3.4
15.2
568
2,58
213
033
63.
415
.25.
509
8442
010
4246
23.
01,
385
0.01
630
00.
0053
0.07
10.
035
1.0
C-3
1819
C4
2.7
616.
445
410
0,39
813
013
,052
2.7
510.
35.
509
2,81
116
,956
101,
696
18,6
523.
055
,955
0.64
812
000.
0008
1.13
10.
754
1.0
C-4
1926
C5
6.7
1,13
46.
7C
69.
94,
287
9.9
C7
22.8
655.
83,
673
109,
491
130
14,2
3451
7.0
5.50
92,
848
9.9
7.38
573
22.8
22.8
2.37
4254
.218
,302
101,
830
20,1
333.
060
,398
0.69
912
000.
0008
1.13
10.
754
1.0
to C
-5C
LT
1-1
2021
C9
16.2
16.2
5,75
45,
754
130
748
16.2
16.2
7.38
511
986
710
8795
43.
02,
862
0.03
330
00.
0053
0.07
10.
035
1.0
to C
T2-
1C
T2-1
2122
CII
248.
5
45,5
132,
561
C8
15.7
280.
35,
583
56,8
5113
07,
391
15.7
31.8
7.38
523
510
,187
101,
019
11,2
063.
033
,617
0.38
990
00.
0012
0.63
60.
424
1.0
CT2
-222
23C
1019
.129
9.5
9,90
866
,758
130
8,67
919
.151
.07.
385
376
11,6
1610
1,16
212
,778
3.0
38,3
340.
444
1,00
00.
0011
0.78
50.
524
1.0
CT2
-323
24C
1125
.632
5.1
14,1
3380
,891
130
10,5
1625
.676
.67.
385
566
13,6
4310
1,36
415
,007
3.0
45,0
210.
521
1,00
00.
0011
0.78
50.
524
1.0
CT2
-424
25C
1255
.123
,806
55.1
C13
25.1
405.
34,
037
108,
734
130
14,1
3513
1.7
7.38
597
325
.125
.12.
374
6017
,729
101,
773
19,5
023.
058
,506
0.67
712
000.
0008
1.13
10.
754
1.0
CT2
-525
26C
1417
.442
2.7
2,80
111
1,53
513
014
,500
131.
77.
385
973
17.4
42.5
2.37
410
118
,134
101,
813
19,9
483.
059
,844
0.69
312
000.
0008
1.13
10.
754
1.0
C-5
2634
-10
78.5
221,
025
130
28,7
3351
7.0
5.50
92,
848
141.
67.
385
1,04
665
.32.
374
155
36,4
3710
3,64
440
,081
3.0
120,
242
1.39
216
500.
0008
2.57
82.
062
1.20
6to
C-6
CT3
-127
28C
1523
.323
.310
,031
10,0
3113
01,
304
23.3
23.3
7.38
517
21,
476
1014
81,
624
3.0
4,87
10.
056
400
0.00
360.
126
0.06
31.
0C
T3-2
2829
C16
14.4
37.7
6,18
916
,220
130
2,10
914
.437
.77.
385
278
2,38
710
239
2,62
63.
07,
877
0.09
150
00.
0027
0.19
60.
098
1.0
CT3
-329
30C
1718
.756
.43,
005
19,2
2513
02,
499
37.7
7.38
527
818
.718
.72.
374
442,
822
1028
23,
104
3.0
9,31
20.
108
600
0.00
210.
283
0.14
11.
0C
T3-4
3031
C18
13.8
70.2
2,22
021
,445
130
2,78
837
.77.
385
278
13.8
32.5
2.37
477
3,14
310
314
3,45
83.
010
,373
0.12
060
00.
0021
0.28
30.
141
1.0
CT3
-531
32C
1911
.982
.01,
908
23,3
5313
03,
036
37.7
7.38
527
811
.944
.32.
374
105
3,41
910
342
3,76
13.
011
,284
0.13
160
00.
0021
0.28
30.
141
1.0
C-6
3248
C20
4.4
1165
.071
024
5,08
813
031
,862
517.
05.
509
2,84
817
9.3
7.38
51,
324
4.4
114.
12.
374
271
39,9
5910
3,99
643
,955
3.0
131,
865
1.52
616
500.
0008
2.57
82.
062
1.20
6to
C-7
CSO
con
trol
str
uctu
read
ditio
nal w
aste
wat
er fr
om P
hase
II A
rea
3 - 72

Tab
le 3
.4.2
C
ompu
tatio
n ta
ble
for
desig
n of
the
trun
ck se
wer
(3/4
) (W
est S
ub-T
reat
men
t Are
a)
Lin
eL
ocat
ion
Res
iden
tial f
low
Com
mer
cial
/Inst
itutio
nal/I
ndus
trial
flow
Infil
tratio
nTo
tal d
esig
n flo
wSe
wer
des
ign
Hon
g B
ang
Dis
trict
Ngo
Quy
en D
istri
ctL
e C
han
Dis
tric
tD
u H
ang
Ken
g C
om.
Vin
h N
iem
Com
.Fr
om
ToSu
bare
aA
rea
Cum
.T
otal
Pop.
Cum
.T
otal
Avg
.un
itflo
w
Cum
.A
vg.
flow
Are
aC
um.
Tot
alA
vg.
unit
flow
Cum
.A
vg.
flow
Are
aC
um.
Tot
alA
vg.
unit
flow
Cum
.A
vg.
flow
Are
aC
um.
Tot
alA
vg.
unit
flow
Cum
.A
vg.
flow
Are
aC
um.
Tot
alA
vg.
unit
flow
Cum
.A
vg.
flow
Are
aC
um.
Tot
alA
vg.
unit
flow
Cum
.A
vg.
flow
Cum
.A
vg.
flow
Infil
trati
on ra
teIn
filtra
tion
flow
Cum
.A
vg.
flow
Peak
fact
orC
um.
Peak
flow
Cum
.Pe
akflo
w
Sew
erdi
amet
er
Slop
eC
apac
ity
full
Allo
wa
ble
Cap
acit
y
Vel
ocit
y fu
ll
haha
pers
onpe
rson
L/ca
pita?d
m3/
dha
ham
3/d/
ham
3/d
haha
m3/
d/ha
m3/
dha
ham
3/d/
ham
3/d
haha
m3/
d/ha
m3/
dha
ham
3/d/
ham
3/d
m3/
d%
m3/
dm
3/d
m3/
dm
3/s
mm
m/m
m3/
sm
3/s
m/s
12
34
56
78
910
1112
1314
1516
1718
1920
2122
2324
2526
2728
2930
3132
3334
3536
3738
3940
4142
(8x9
)(1
2x13
)(1
6x17
)(2
0x21
)(2
4x25
)(2
8x29
)(10+14
+18+
22+2
6+30
)(3
1x32
/100
)(3
1+33
)(3
4x35
)(3
6/86
400)
WT
1-1
3334
WII
136
.912
,355
381
WII
280
.011
,642
824
WII
315
7.1
33,6
701,
619
W1
10.4
284.
44,
596
62,2
6213
08,
094
10.4
10.4
7.38
577
10,9
9510
1,09
912
,094
3.0
36,2
830.
420
900
0.00
120.
636
0.42
41.
0W
T1-
234
35W
212
.929
7.2
3,33
965
,601
130
8,52
812
.923
.37.
385
172
11,5
2410
1,15
212
,676
3.0
38,0
290.
440
1,00
00.
0011
0.78
50.
524
1.0
WT
1-3
3536
W3
3.8
301.
198
966
,590
130
8,65
73.
827
.17.
385
200
11,6
8110
1,16
812
,849
3.0
38,5
460.
446
1,00
00.
0011
0.78
50.
524
1.0
WT
1-4
3637
W4
4.1
305.
21,
066
67,6
5613
08,
795
4.1
31.2
7.38
523
011
,849
101,
185
13,0
343.
039
,103
0.45
31,
000
0.00
110.
785
0.52
41.
0W
T1-
537
38W
536
.634
1.8
9,51
477
,170
130
10,0
3236
.667
.87.
385
501
13,3
5710
1,33
614
,693
3.0
44,0
780.
510
1,00
00.
0011
0.78
50.
524
1.0
to W
T1-
6W
LT1
3940
W6
5.2
2,05
05.
2
W
71.
333
41.
3W
812
.34,
827
12.3
W9
8.0
26.9
3,13
910
,351
130
1,34
68.
026
.97.
385
198
1,54
410
154
1,69
83.
05,
095
0.05
940
00.
0036
0.12
60.
063
1.0
to W
T1-
6W
T1-
640
41-
368.
787
,521
130
11,3
7894
.77.
385
699
14,9
0110
1,49
016
,391
3.0
49,1
730.
569
1,10
00.
0009
0.95
0.63
41.
0W
T1-
741
42W
1011
.237
9.8
4,38
191
,902
130
11,9
4711
.210
5.9
7.38
578
215
,553
101,
555
17,1
083.
051
,325
0.59
41,
100
0.00
090.
950.
634
1.0
WT
1-8
4243
W11
10.1
390.
03,
975
95,8
7713
012
,464
10.1
116.
07.
385
857
16,1
4510
1,61
417
,759
3.0
53,2
780.
617
1,10
00.
0009
0.95
0.63
41.
0W
T1-
943
44W
1233
.242
3.2
13,0
2210
8,89
913
014
,157
33.2
149.
37.
385
1,10
218
,083
101,
808
19,8
923.
059
,675
0.69
112
000.
0008
1.13
10.
754
1.0
WT
1-10
4448
W13
20.9
444.
21,
611
110,
510
130
14,3
6614
9.3
7.38
51,
102
20.9
20.9
3.08
264
18,3
5710
1,83
620
,193
3.0
60,5
780.
701
1200
0.00
081.
131
0.75
41.
0to
C-7
WL
T2-
147
48W
146.
22,
756
6.2
W15
9.3
3,59
29.
3W
1644
.617
,452
44.6
W17
20.0
80.1
1,54
125
,341
130
3,29
460
.17.
385
444
20.0
20.0
3.08
262
3,80
010
380
4,18
03.
012
,540
0.14
570
00.
0017
0.38
50.
257
1.0
to C
-7C
-748
49-
1,68
938
0,93
913
049
,522
388.
77.
385
2,87
140
.93.
082
126
58,9
9710
5,90
064
,897
3.0
194,
691
2.25
318
000.
0008
3.25
12.
601
1.27
862
9Ph
ase
II c
ombi
ned
area
1,06
1Ph
ase
I com
bine
d ar
ea
CSO
con
trol
str
uctu
read
ditio
nal w
aste
wat
er fr
om P
hase
II A
rea
3 - 73

Tabl
e 3.
4.2
Com
puta
tion
tabl
e fo
r de
sign
of th
e tr
unck
sew
er (4
/4) (
Sout
h Su
b-Tr
eatm
ent A
rea)
Lin
eL
ocat
ion
Res
iden
tial f
low
Com
mer
cial
/Inst
itutio
nal/I
ndus
trial
flow
Infil
tratio
nTo
tal d
esig
n flo
wSe
wer
des
ign
Hon
g B
ang
Dis
trict
Ngo
Quy
en D
istri
ctL
e C
han
Dis
tric
tD
u H
ang
Ken
g C
om.
Vin
h N
iem
Com
.Fr
om
ToSu
bare
aA
rea
Cum
.T
otal
Pop.
Cum
.T
otal
Avg
.un
itflo
w
Cum
.A
vg.
flow
Are
aC
um.
Tot
alA
vg.
unit
flow
Cum
.A
vg.
flow
Are
aC
um.
Tot
alA
vg.
unit
flow
Cum
.A
vg.
flow
Are
aC
um.
Tot
alA
vg.
unit
flow
Cum
.A
vg.
flow
Are
aC
um.
Tot
alA
vg.
unit
flow
Cum
.A
vg.
flow
Are
aC
um.
Tot
alA
vg.
unit
flow
Cum
.A
vg.
flow
Cum
.A
vg.
flow
Infil
trati
on ra
teIn
filtra
tion
flow
Cum
.A
vg.
flow
Peak
fact
orC
um.
Peak
flow
Cum
.Pe
akflo
w
Sew
erdi
amet
er
Slop
eC
apac
ity
full
Allo
wa
ble
Cap
acit
y
Vel
ocit
y fu
ll
haha
pers
onpe
rson
L/ca
pita?d
m3/
dha
ham
3/d/
ham
3/d
haha
m3/
d/ha
m3/
dha
ham
3/d/
ham
3/d
haha
m3/
d/ha
m3/
dha
ham
3/d/
ham
3/d
m3/
d%
m3/
dm
3/d
m3/
dm
3/s
mm
m/m
m3/
sm
3/s
m/s
12
34
56
78
910
1112
1314
1516
1718
1920
2122
2324
2526
2728
2930
3132
3334
3536
3738
3940
4142
(8x9
)(1
2x13
)(1
6x17
)(2
0x21
)(2
4x25
)(2
8x29
)(10+14
+18
+22
+26
+30
)(3
1x32
/100
)(3
1+33
)(3
4x35
)(3
6/86
400)
ST1
S154
554
558
,341
58,3
4113
07,
584
7,58
4C
omm
erci
al/In
stitu
tiona
l/Ind
ustri
al fl
ow1,72
9to
tal
9,31
410
931
10,2
451.
515
,368
0.17
870
00.
0011
0.30
80.
205
0.8
3 - 74

Table 3.4.3 Longitudinal Section of Trunk SewerEast Trunk Sewer 1 (ET1)
Line From To Distance Pipe dia. Slope Invert elevation Ground ElevationEarth CoveringU/S D/S U/S D/S U/S D/S
ET1-1 0 2 520 700 0.0017 0.830 -0.054 3.03 3.79 1.50 3.14ET1-2 2 3 550 800 0.0014 -0.054 -0.824 3.79 2.79 3.04 2.81ET1-3 3 6 1,000 900 0.0012 -0.824 -2.024 2.79 3.48 2.71 4.60ET1-4 6 11 440 900 0.0012 -2.024 -2.552 3.48 3.48 4.60 5.13ET1-5 11 12 1,240 1,000 0.0011 -2.552 -3.916 3.48 3.80 5.03 6.72ET1-6 12 12' 10 1,100 0.0009 -3.916 -3.925 3.80 3.80 6.62 6.63 to An Da Relay Pumping StationC-1 12' 15 380 1,100 0.0009 -0.418 -0.760 3.80 3.40 3.12 3.06C-2 15 18 220 1,100 0.0009 -0.760 -0.958 3.40 3.84 3.06 3.70C-3 18 19 350 1,200 0.0008 -1.058 -1.338 3.84 3.84 3.70 3.98C-4 19 26 1,300 1,200 0.0008 -1.338 -2.378 3.84 3.10 3.98 4.28C-5 26 32 580 1,650 0.0008 -2.378 -2.842 3.10 3.80 3.83 4.99C-6 32 48 60 1,650 0.0008 -2.842 -2.890 3.80 3.80 4.99 5.04C-7 48 49 950 1,800 0.0008 -3.040 -3.800 3.80 3.60 5.04 5.60 to West WWTP
7,600basically pipe bottom connectionbut, bending points of (C-2 to C-3, and C-6 to C-7) is pipe top connection
East Trunk Sewer 2 (ET2)Line From To Distance Pipe dia. Slope Invert elevation Ground ElevationEarth Covering
U/S D/S U/S D/S U/S D/SET2-1 13 14 440 400 0.0036 1.200 -0.384 3.20 3.20 1.60 3.18 Manhole Pump 1 dropET2-2 14 15 800 500 0.0027 1.700 -0.460 3.20 3.40 1.00 3.36 to C-2 Invert elevation= -0.760 0.300
1,240
East Lateral Trunk Sewer 1 (ELT1)Line From To Distance Pipe dia. Slope Invert elevation Ground ElevationEarth Covering
U/S D/S U/S D/S U/S D/SELT1-1 4 5 180 300 0.0053 1.400 0.446 3.15 4.03 1.45 3.28 dropELT1-2 5 6 420 400 0.0036 0.446 -1.066 4.03 3.48 3.18 4.15 to ET1-4 Invert elevation= -2.024 0.958
600
East Lateral Trunk Sewer 2 (ELT2)Line From To Distance Pipe dia. Slope Invert elevation Ground ElevationEarth Covering
U/S D/S U/S D/S U/S D/SELT2-1 7 8 300 300 0.0053 2.350 0.760 3.65 3.65 1.00 2.59ELT2-2 8 9 120 400 0.0036 0.760 0.328 3.65 3.67 2.49 2.94ELT2-3 9 10 400 500 0.0027 0.328 -0.752 3.67 3.20 2.84 3.45 dropELT2-4 10 11 200 500 0.0027 -0.752 -1.292 3.20 3.48 3.45 4.27 to ET1-5 Invert elevation= -2.552 1.260
720
East Lateral Trunk Sewer 3 (ELT3)Line From To Distance Pipe dia. Slope Invert elevation Ground ElevationEarth Covering
U/S D/S U/S D/S U/S D/SELT3-1 16 17 500 300 0.0053 0.740 -1.910 3.74 3.99 2.70 5.60 dropELT3-2 17 12 260 300 0.0053 -1.910 -3.288 3.99 3.80 5.60 6.79 to C-3 Invert elevation= -3.916 0.628
760
Central Trank Sewer 1 (CT1)Line From To Distance Pipe dia. Slope Invert elevation Ground ElevationEarth Covering
U/S D/S U/S D/S U/S D/S dropCT1-1 17 18 360 300 0.0053 2.150 0.242 3.99 3.84 1.54 3.30 to C-3 Invert elevation= -1.058 1.300
360
Central Trank Sewer 2 (CT2)Line From To Distance Pipe dia. Slope Invert elevation Ground ElevationEarth Covering
U/S D/S U/S D/S U/S D/S 101 102 540 700 0.0017 2.000 1.082 4.00 4.20 1.30 2.42 102 103 220 800 0.0014 1.082 0.774 4.20 4.30 2.32 2.73
103 104 80 800 0.0014 0.774 0.662 4.30 4.30 2.73 2.84 104 21 760 800 0.0014 0.662 -0.402 4.30 3.73 2.84 3.33CT2-1 21 22 320 900 0.0012 -0.402 -0.786 3.73 3.87 3.23 3.76CT2-2 22 23 100 1000 0.0011 -0.786 -0.896 3.87 3.99 3.66 3.89CT2-3 23 24 720 1000 0.0011 -0.896 -1.688 3.99 3.10 3.89 3.79CT2-4 24 25 380 1200 0.0008 -1.688 -1.992 3.10 3.10 3.59 3.89 dropCT2-5 25 26 150 1200 0.0008 -1.992 -2.112 3.10 3.10 3.89 4.01 to C-5 Invert elevation= -2.378 0.266
1,6703,270 including phase II pipeline
Table 3.4.3 Longitudinal Section of Trunk Sewer (2/2)
Central Lateral Trunk Sewer 1 (CLT1)Line From To Distance Pipe dia. Slope Invert elevation Ground ElevationEarth Covering
U/S D/S U/S D/S U/S D/S dropCLT1-1 20 21 80 300 0.0053 1.680 1.256 4.11 3.73 2.13 2.17 to CT2-1 Invert elevation= -0.402 1.658
80
Central Trunk Sewer 3 (CT3)Line From To Distance Pipe dia. Slope Invert elevation Ground ElevationEarth Covering
Upper Lower Upper Lower Upper LowerCT3-1 27 28 120 400 0.0036 1.410 0.978 3.41 3.40 1.60 2.02CT3-2 28 29 380 500 0.0027 0.978 -0.048 3.40 3.90 1.92 3.45CT3-3 29 30 380 600 0.0021 -0.048 -0.846 3.90 3.40 3.35 3.65CT3-4 30 31 380 600 0.0021 -0.846 -1.644 3.40 3.80 3.65 4.84 dropCT3-5 31 32 200 600 0.0021 -1.644 -2.064 3.80 3.80 4.84 5.26 to C-6 Invert elevation= -2.842 0.778
1,460
West Trunk Sewer 1(WT1)Line From To Distance Pipe dia. Slope Invert elevation Ground ElevationEarth Covering
U/S D/S U/S D/S U/S D/S201 202 260 400 0.0036 2.500 1.564 4.50 4.50 1.60 2.54202 33 100 400 0.0036 1.564 1.204 4.50 4.36 2.54 2.76
WT1-1 33 34 200 900 0.0012 1.204 0.964 4.36 4.36 2.26 2.50WT1-2 34 35 400 1,000 0.0011 0.964 0.524 4.36 4.35 2.40 2.83WT1-3 35 36 180 1,000 0.0011 0.524 0.326 4.35 4.35 2.83 3.02WT1-4 36 37 180 1,000 0.0011 0.326 0.128 4.35 4.33 3.02 3.20WT1-5 37 40 120 1,000 0.0011 0.128 -0.004 4.33 3.40 3.20 2.40WT1-6 40 41 600 1,100 0.0009 -0.004 -0.544 3.40 4.10 2.30 3.54WT1-7 41 42 300 1,100 0.0009 -0.544 -0.814 4.10 4.70 3.54 4.41WT1-8 42 43 320 1,100 0.0009 -0.814 -1.102 4.70 4.70 4.41 4.70WT1-9 43 44 1060 1,200 0.0008 -1.102 -1.950 4.70 4.10 4.60 4.85 dropWT1-10 44 48 360 1,200 0.0008 -1.950 -2.238 4.10 3.80 4.85 4.84 to C-7 Invert elevation= -3.040 0.802total 3,360
3,720 including phase II pipelineWest Lateral Trunk Sewer 1 (WLT1)
Line From To Distance Pipe dia. Slope Invert elevation Ground ElevationEarth CoveringU/S D/S U/S D/S U/S D/S
38 39 250 125 pressure 3.50 3.50 1.00 1.00 Manhole Pump 2 39 10 100 pressure 3.50 1.00 1.00 Manhole Pump 3 drop
WLT1-1 39 40 500 400 0.0036 2.200 0.400 3.50 3.40 0.90 2.6 to WT1-6 Invert elevation= -0.004 0.404500
West Lateral Trunk Sewer 2 (WLT2)Line From To Distance Pipe dia. Slope Invert elevation Ground ElevationEarth Covering
U/S D/S U/S D/S U/S D/S45 46 220 100 pressure 3.48 3.50 1.00 1.00 Manhole Pump 446 10 125 pressure 3.50 1.00 1.00 Manhole Pump 5 drop
WLT2-1 47 48 420 700 0.0017 0.800 0.086 3.00 3.80 1.50 3.01 to C-7 Invert elevation= -2.238 2.324420
U/S = Up Stream End, D/S = Down Stream End
3 - 75

Tab
le 3
.4.4
The
Bill
of Q
uant
ity o
f Tru
nk S
ewer
(by
eart
h co
veri
ng)
Line
From
Dis
tanc
ePip
e di
a.Ea
rth C
over
ing
Con
stru
ctio
n M
etho
dU
pper
Low
erA
vera
ge
Ope
nJa
ckin
gPr
essu
reJa
ckin
gO
pen
Jack
ing
Ope
nJa
ckin
gO
pen
Jack
ing
Ope
nJa
ckin
gO
pen
Jack
ing
Ope
nJa
ckin
gO
pen
Jack
ing
Ope
nJa
ckin
gO
pen
Jack
ing
Ope
nJa
ckin
gdi
adi
a10
012
530
030
030
030
040
040
040
040
050
050
050
050
060
060
060
060
070
070
070
070
080
080
080
080
090
090
090
090
010
0010
0010
0010
0011
0011
0011
0011
0012
0012
0012
0012
0013
5015
0016
5018
00d=
1.0
d=1.
0>=
4>=
3>=
2>=
1>=
4>=
3>=
2>=
1>=
4>=
3>=
2>=
1>=
4>=
3>=
2>=
1>=
4>=
3>=
2>=
1>=
4>=
3>=
2>=
1>=
4>=
3>=
2>=
1>=
4>=
3>=
2>=
1>=
4>=
3>=
2>=
1>=
4>=
3>=
2>=
1>=
4>=
4>=
4>=
4m
mm
mE
ast T
runk
Sew
er 1
(ET
1)ET
1-1
520
700
1.50
3.14
2.32
Ope
n70
052
0ET
1-2
550
800
3.04
2.81
2.93
Ope
n80
055
0ET
1-3
1,00
090
02.
714.
603.
66O
pen
900
1000
ET1-
444
090
04.
605.
134.
87 J
acki
ng90
044
0ET
1-5
1,24
01,
000
5.03
6.72
5.87
Jac
king
1000
1240
ET1-
610
1,10
06.
626.
636.
62 J
acki
ng11
0010
C-1
380
1,10
03.
123.
063.
09O
pen
1100
380
C-2
220
1,10
03.
063.
703.
38O
pen
1100
220
C-3
350
1,20
03.
703.
983.
84O
pen
1200
350
C-4
1,30
01,
200
3.98
4.28
4.13
Jac
king
1200
1300
C-5
580
1,65
03.
834.
994.
41 J
acki
ng16
5058
0C
-660
1,65
04.
995.
045.
02 J
acki
ng16
5060
C-7
950
1,80
05.
045.
605.
32 J
acki
ng18
0095
0E
ast T
runk
Sew
er 2
(ET
2)ET
2-1
440
400
1.60
3.18
2.39
Ope
n40
044
0ET
2-2
800
500
1.00
3.36
2.18
Ope
n50
080
0E
ast L
ater
al T
runk
Sew
er 1
(EL
T1)
ELT1
-118
030
01.
453.
282.
37O
pen
300
180
ELT1
-242
040
03.
184.
153.
67O
pen
400
420
Eas
t Lat
eral
Tru
nk S
ewer
2 (E
LT
2)EL
T2-1
300
300
12.
591.
80O
pen
300
300
ELT2
-212
040
02.
492.
942
2.72
Ope
n40
012
0EL
T2-3
400
500
2.84
23.
452
3.15
Ope
n50
040
0EL
T2-4
200
500
3.45
24.
272
3.86
Ope
n50
020
0E
ast L
ater
al T
runk
Sew
er 3
(EL
T3)
ELT3
-150
030
02.
705.
604.
15 J
acki
ng30
050
0EL
T3-2
260
300
5.60
6.79
6.19
Jac
king
300
260
Cen
tral
Tra
nk S
ewer
1 (C
T1)
CT1
-136
030
01.
543.
302.
42O
pen
300
360
Cen
tral
Tra
nk S
ewer
2 (C
T2)
CT2
-132
090
03.
233.
763.
49O
pen
900
320
CT2
-210
010
003.
663.
893.
77O
pen
1000
100
CT2
-372
010
003.
893.
793.
84O
pen
1000
720
CT2
-438
012
003.
593.
893.
74O
pen
1200
380
CT2
-515
012
003.
894.
013.
95O
pen
1200
150
Cen
tral
Lat
eral
Tru
nk S
ewer
1 (C
LT1)
CLT
1-1
8030
02.
132.
172.
15O
pen
300
80C
entr
al T
runk
Sew
er 3
(CT3
)C
LT3-
112
040
01.
602.
021.
81O
pen
400
120
CLT
3-2
380
500
1.92
3.45
2.69
Ope
n50
038
0C
LT3-
338
060
03.
353.
653.
50O
pen
600
380
CLT
3-4
380
600
3.65
4.84
4.25
Jac
king
600
380
CLT
3-5
200
600
4.84
5.26
5.05
Jac
king
600
200
Wes
t Tru
nk S
ewer
1(W
T1)
WT1
-120
090
02.
262.
502.
38O
pen
900
200
WT1
-240
01,
000
2.40
2.83
2.61
Ope
n10
0040
0W
T1-3
180
1,00
02.
833.
022.
93O
pen
1000
180
WT1
-418
01,
000
3.02
3.20
3.11
Ope
n10
0018
0W
T1-5
120
1,00
03.
202.
402.
80O
pen
1000
120
WT1
-660
01,
100
2.30
3.54
2.92
Ope
n11
0060
0W
T1-7
300
1,10
03.
544.
413.
98O
pen
1100
300
WT1
-832
01,
100
4.41
4.70
4.56
Jac
king
1100
320
WT1
-910
601,
200
4.60
4.85
4.73
Jac
king
1200
1060
WT1
-10
360
1,20
04.
854.
844.
84 J
acki
ng12
0036
0W
est L
ater
al T
runk
Sew
er 1
(WLT
1)W
LT1-
125
012
51.
001.
001.
00O
pen
125
250
WLT
1-1
1010
01.
001.
001.
00O
pen
100
10W
LT1-
150
040
00.
902.
601.
75O
pen
400
500
Wes
t Lat
eral
Tru
nk S
ewer
2 (W
LT2)
WLT
2-1
220
100
1.00
1.00
1.00
Ope
n10
022
0W
LT2-
110
125
1.00
1.00
1.00
Ope
n12
510
WLT
2-1
420
700
1.50
3.01
2.26
Ope
n70
042
0to
tal
19,9
2023
026
076
00
620
300
042
056
062
00
600
1180
058
038
00
00
094
00
00
550
044
013
2020
00
1240
1000
700
033
090
060
00
2720
880
00
00
640
950
tota
l (O
pen)
11,7
7092
016
0017
8038
094
055
015
2017
0015
0088
0to
tal (
Jack
ing)
7,66
076
00
058
00
044
012
4033
027
200
064
095
0to
tal (
pres
sure
)49
023
026
0>=
4>=
3>=
2>=
176
6055
0053
5092
0M
anho
le(O
pen)
Man
hole
Inte
rval
m
5075
7575
100
100
100
100
150
150
Man
hole
Num
ber
nos.
132
1821
245
96
1517
106
(Jac
king
)M
anho
le In
terv
alm
10
010
010
010
010
010
010
010
015
015
015
015
020
020
0M
anho
le N
umbe
rno
s.58
80
06
00
412
218
00
35
3 - 76

Tabl
e 3.
4.5
The
Uni
t Bill
of Q
uant
ity o
f Tru
nk S
ewer
Ear
th C
over
ing
= 1-
2mU
nit :
met
er (f
or p
ipes
)Ex
cava
tion
Con
cret
e B
ase
exca
vatio
nba
ckfil
ling
surp
lus
soil
disp
osal
pave
men
tcr
ushe
r-ru
n st
one
conc
rete
form
wor
kre
info
rcin
gre
info
rced
tim
ber
bam
boo
leve
lling
soil
de-w
ater
ing
reta
inin
gw
idth
dept
hw
idth
heig
ht
bar
conc
rete
pip
eco
ncre
te(1
0cm
)im
prov
emen
twal
lW
D
B
h m
mm
mm
3m
3m
3m
2m
3m
3m
2kg
mm
3m
2m
2m
3L
Sm
Sand
300
1.1
2.1
--
2.3
2.0
2.3
1.1
0.12
--
-1.
00.
120.
80.
8-
1.0
1.0
400
1.2
2.2
--
2.6
2.1
2.6
1.2
0.14
--
-1.
00.
140.
90.
9-
1.0
1.0
500
1.3
2.3
--
3.0
2.2
3.0
1.3
0.15
--
-1.
00.
151.
01.
0-
1.0
1.0
600
1.4
2.4
--
3.4
2.2
3.4
1.4
0.17
--
-1.
00.
171.
11.
1-
1.0
1.0
700
1.7
2.5
--
4.3
2.7
4.3
1.7
0.21
--
-1.
00.
211.
41.
4-
1.0
1.0
800
1.8
2.6
--
4.7
2.7
4.7
1.8
0.23
--
-1.
00.
231.
51.
5-
1.0
1.0
900
1.9
2.7
--
5.1
2.6
5.1
1.9
0.24
--
-1.
00.
241.
61.
6-
1.0
1.0
1000
2.0
2.8
--
5.6
2.5
5.6
2.0
0.26
--
-1.
00.
261.
71.
7-
1.0
1.0
1100
2.1
2.9
--
6.1
2.3
6.1
2.1
0.27
--
-1.
00.
271.
81.
8-
1.0
1.0
1200
2.2
3.0
--
6.6
2.1
6.6
2.2
0.29
--
-1.
00.
291.
91.
9-
1.0
1.0
Ear
th C
over
ing
= 2-
3mC
oncr
ete
300
1.3
3.2
0.4
0.1
4.2
3.9
4.2
1.3
-0.
040.
20-
1.0
0.20
1.0
1.0
-1.
01.
090
°40
01.
43.
30.
50.
14.
64.
14.
61.
4-
0.05
0.20
-1.
00.
211.
11.
1-
1.0
1.0
500
1.5
3.4
0.6
0.1
5.1
4.3
5.1
1.5
-0.
060.
20-
1.0
0.23
1.2
1.2
-1.
01.
060
01.
63.
50.
70.
15.
64.
55.
61.
6-
0.07
0.20
-1.
00.
241.
31.
3-
1.0
1.0
Con
cret
e70
02.
13.
71.
00.
157.
86.
27.
82.
1-
0.15
0.30
-1.
00.
321.
81.
8-
1.0
1.0
120°
800
2.2
3.8
1.1
0.15
8.4
6.4
8.4
2.2
-0.
170.
30-
1.0
0.33
1.9
1.9
-1.
01.
090
02.
33.
91.
20.
159.
06.
49.
02.
3-
0.18
0.30
-1.
00.
352.
02.
0-
1.0
1.0
1000
2.4
4.0
1.3
0.2
9.6
6.5
9.6
2.4
-0.
260.
402.
61.
00.
362.
12.
13.
41.
01.
011
002.
54.
11.
40.
210
.36.
510
.32.
5-
0.28
0.40
2.8
1.0
0.38
2.2
2.2
3.9
1.0
1.0
1200
2.6
4.2
1.5
0.2
10.9
6.4
10.9
2.6
-0.
300.
403.
01.
00.
392.
32.
34.
31.
01.
0E
arth
Cov
erin
g =
3-4m
Con
cret
e30
01.
54.
30.
60.
16.
56.
26.
51.
5-
0.06
0.20
-1.
00.
231.
21.
23.
31.
01.
012
0°40
01.
64.
40.
70.
17.
06.
57.
01.
6-
0.07
0.20
-1.
00.
241.
31.
33.
61.
01.
050
01.
74.
50.
80.
17.
76.
97.
71.
7-
0.08
0.20
-1.
00.
261.
41.
44.
11.
01.
060
01.
84.
60.
90.
18.
37.
18.
31.
8-
0.09
0.20
-1.
00.
271.
51.
54.
51.
01.
0C
oncr
ete
700
2.3
4.7
1.2
0.15
10.8
9.3
10.8
2.3
-0.
271.
00-
1.0
0.35
2.0
2.0
5.6
1.0
1.0
180°
800
2.4
4.8
1.3
0.15
11.5
9.5
11.5
2.4
-0.
291.
10-
1.0
0.36
2.1
2.1
6.1
1.0
1.0
900
2.5
4.9
1.4
0.15
12.3
9.7
12.3
2.5
-0.
321.
20-
1.0
0.38
2.2
2.2
6.7
1.0
1.0
1000
2.6
5.0
1.5
0.2
13.0
9.9
13.0
2.6
-0.
451.
404.
51.
00.
392.
32.
37.
21.
01.
011
002.
75.
11.
60.
213
.810
.013
.82.
7-
0.48
1.50
4.8
1.0
0.41
2.4
2.4
7.8
1.0
1.0
1200
2.8
5.2
1.7
0.2
14.6
10.0
14.6
2.8
-0.
511.
605.
11.
00.
422.
52.
58.
41.
01.
0
3 - 77
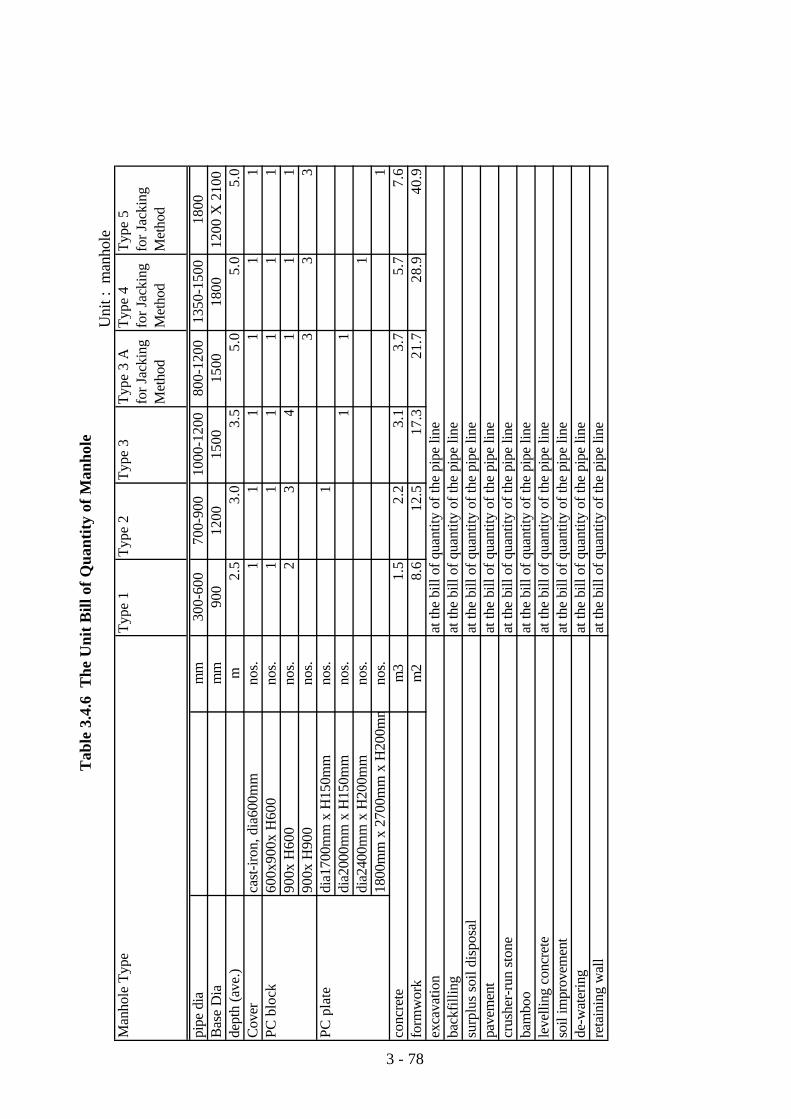
Tab
le 3
.4.6
The
Uni
t Bill
of Q
uant
ity o
f Man
hole
Uni
t : m
anho
leM
anho
le T
ype
Typ
e 1
Typ
e 2
Typ
e 3
Typ
e 3
AT
ype
4T
ype
5fo
r Jac
king
for J
acki
ngfo
r Jac
king
Met
hod
Met
hod
Met
hod
pipe
dia
mm
300-
600
700-
900
1000
-120
080
0-12
0013
50-1
500
1800
Bas
e D
iam
m90
012
0015
0015
0018
0012
00 X
210
0de
pth
(ave
.)m
2.5
3.0
3.5
5.0
5.0
5.0
Cov
erca
st-ir
on, d
ia60
0mm
nos.
11
11
11
PC b
lock
600x
900x
H60
0no
s.1
11
11
190
0x H
600
nos.
23
41
11
900x
H90
0no
s.3
33
PC p
late
dia1
700m
m x
H15
0mm
nos.
1di
a200
0mm
x H
150m
mno
s.1
1di
a240
0mm
x H
200m
mno
s.1
1800
mm
x 2
700m
m x
H20
0mm
nos.
1co
ncre
tem
31.
52.
23.
13.
75.
77.
6fo
rmw
ork
m2
8.6
12.5
17.3
21.7
28.9
40.9
exca
vatio
nat
the
bill
of q
uant
ity o
f the
pip
e lin
eba
ckfil
ling
at th
e bi
ll of
qua
ntity
of t
he p
ipe
line
surp
lus
soil
disp
osal
at th
e bi
ll of
qua
ntity
of t
he p
ipe
line
pave
men
tat
the
bill
of q
uant
ity o
f the
pip
e lin
ecr
ushe
r-ru
n st
one
at th
e bi
ll of
qua
ntity
of t
he p
ipe
line
bam
boo
at th
e bi
ll of
qua
ntity
of t
he p
ipe
line
leve
lling
con
cret
eat
the
bill
of q
uant
ity o
f the
pip
e lin
eso
il im
prov
emen
tat
the
bill
of q
uant
ity o
f the
pip
e lin
ede
-wat
erin
gat
the
bill
of q
uant
ity o
f the
pip
e lin
ere
tain
ing
wal
lat
the
bill
of q
uant
ity o
f the
pip
e lin
e
3 - 78
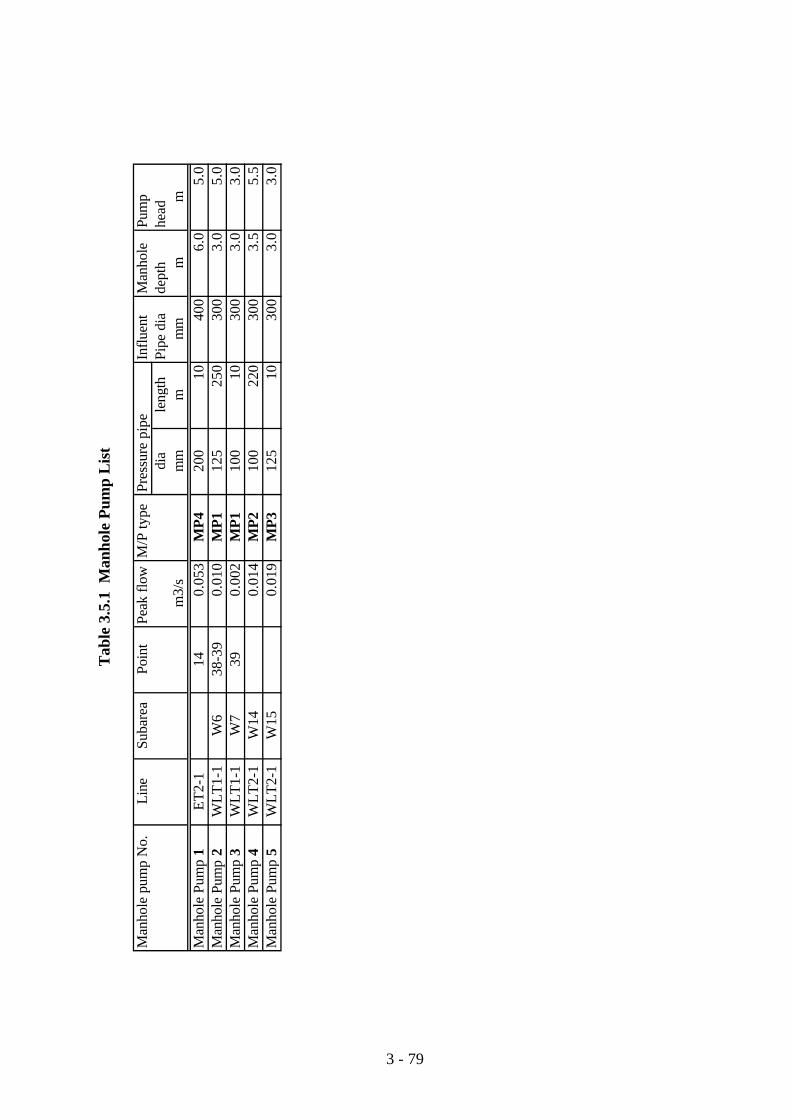
Tab
le 3
.5.1
Man
hole
Pum
p L
ist
Man
hole
pum
p N
o.Li
neSu
bare
aPo
int
Peak
flow
M/P
type
Pres
sure
pip
eIn
fluen
tM
anho
le
Pum
pdi
ale
ngth
Pipe
dia
dept
hhe
adm
3/s
mm
mm
mm
mM
anho
le P
ump
1E
T2-
114
0.05
3M
P420
010
400
6.0
5.0
Man
hole
Pum
p 2
WL
T1-
1W
638
-39
0.01
0M
P112
525
030
03.
05.
0M
anho
le P
ump
3W
LT
1-1
W7
390.
002
MP1
100
1030
03.
03.
0M
anho
le P
ump
4W
LT
2-1
W14
0.01
4M
P210
022
030
03.
55.
5M
anho
le P
ump
5W
LT
2-1
W15
0.01
9M
P312
510
300
3.0
3.0
3 - 79
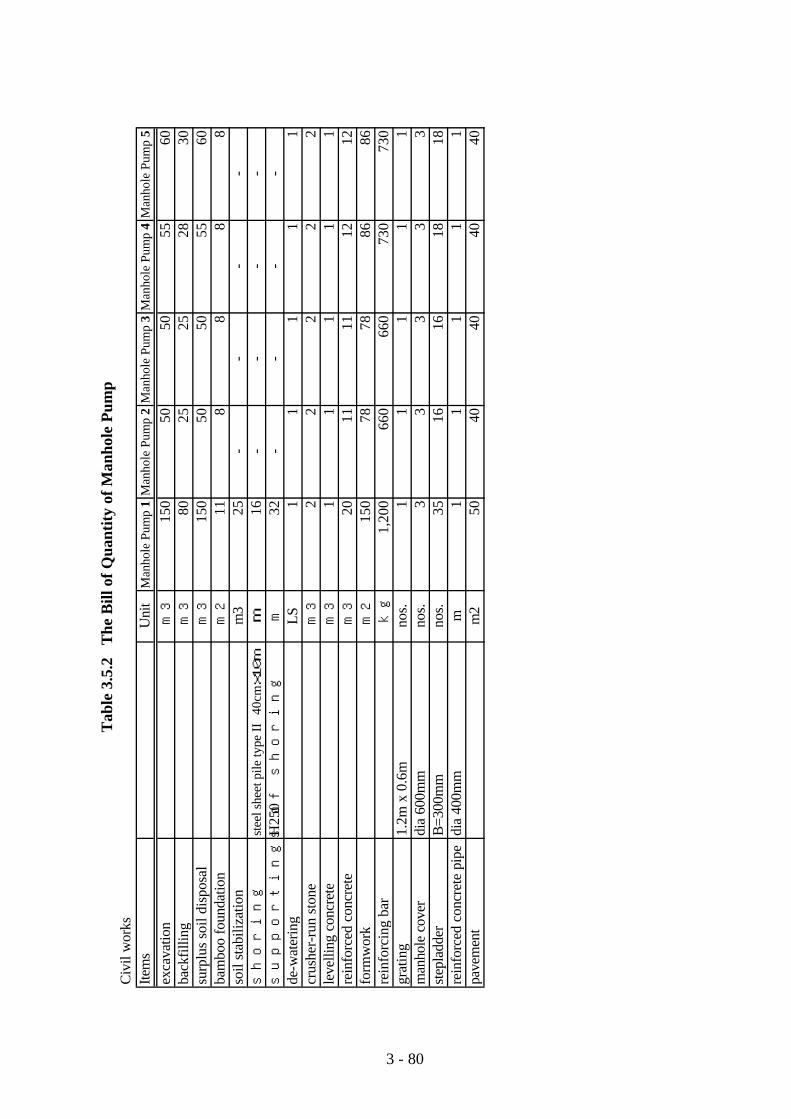
Tab
le 3
.5.2
T
he B
ill o
f Qua
ntity
of M
anho
le P
ump
Civ
il w
orks
Item
sU
nit
Man
hole
Pum
p 1
Man
hole
Pum
p 2
Man
hole
Pum
p 3
Man
hole
Pum
p 4
Man
hole
Pum
p 5
exca
vatio
nm
315
050
5055
60ba
ckfil
ling
m3
8025
2528
30su
rplu
s so
il di
spos
alm
315
050
5055
60ba
mbo
o fo
unda
tion
m2
118
88
8so
il st
abili
zatio
nm
325
--
--
shor
ing
stee
l she
et p
ile ty
pe II
40
cmx1
0m
m16
--
--
supp
ortin
gs o
f sh
orin
gH
250
m32
--
--
de-w
ater
ing
LS1
11
11
crus
her-
run
ston
em
32
22
22
leve
lling
con
cret
em
31
11
11
rein
forc
ed c
oncr
ete
m3
2011
1112
12fo
rmw
ork
m2
150
7878
8686
rein
forc
ing
bar
kg1,
200
660
660
730
730
grat
ing
1.2m
x 0
.6m
nos.
11
11
1m
anho
le c
over
dia
600m
mno
s.3
33
33
step
ladd
erB
=300
mm
nos.
3516
1618
18re
info
rced
con
cret
e pi
pedi
a 40
0mm
m1
11
11
pave
men
tm
250
4040
4040
3 - 80
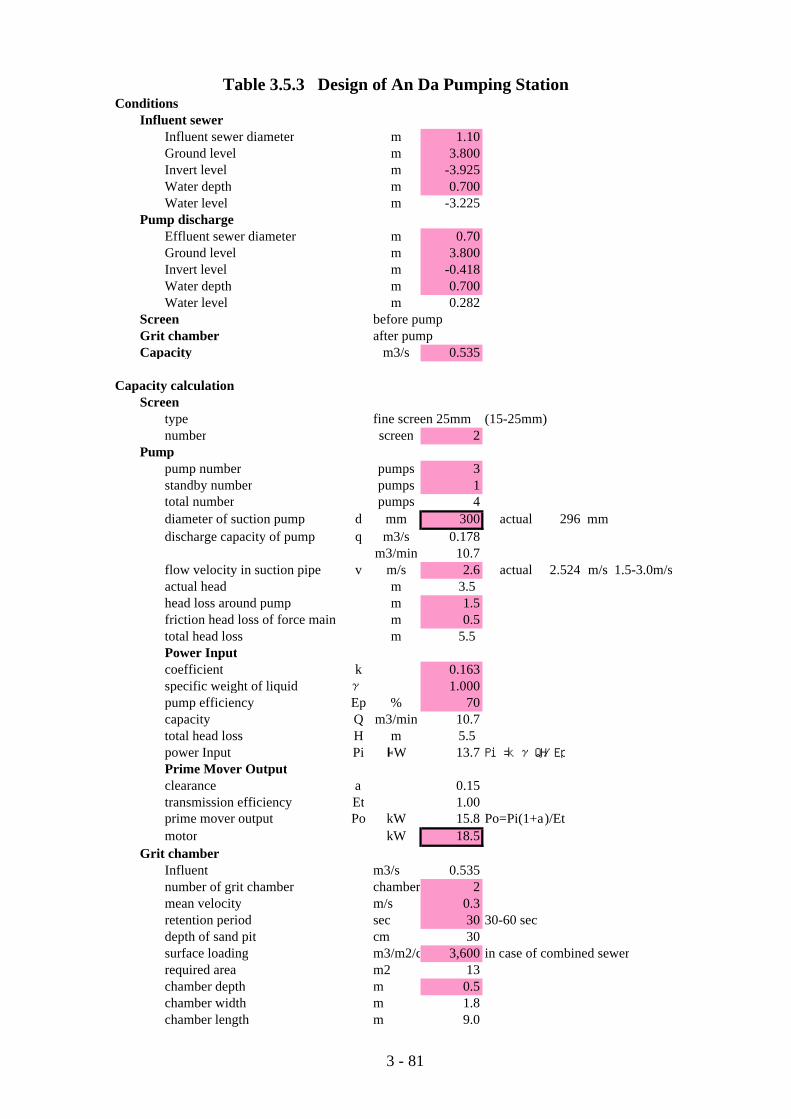
Table 3.5.3 Design of An Da Pumping StationConditions
Influent sewerInfluent sewer diameter m 1.10Ground level m 3.800Invert level m -3.925Water depth m 0.700Water level m -3.225
Pump discharge Effluent sewer diameter m 0.70Ground level m 3.800Invert level m -0.418Water depth m 0.700Water level m 0.282
Screen before pumpGrit chamber after pumpCapacity m3/s 0.535
Capacity calculationScreen
type fine screen 25mm (15-25mm)number screen 2
Pumppump number pumps 3standby number pumps 1total number pumps 4diameter of suction pump d mm 300 actual 296 mmdischarge capacity of pump q m3/s 0.178
m3/min 10.7flow velocity in suction pipe v m/s 2.6 actual 2.524 m/s 1.5-3.0m/sactual head m 3.5head loss around pump m 1.5friction head loss of force main m 0.5total head loss m 5.5Power Inputcoefficient k 0.163specific weight of liquid γ 1.000pump efficiency Ep % 70 capacity Q m3/min 10.7total head loss H m 5.5power Input Pi kW 13.7 Pi=kγQH/EpPrime Mover Outputclearance a 0.15transmission efficiency Et 1.00prime mover output Po kW 15.8 Po=Pi(1+a)/Etmotor kW 18.5
Grit chamberInfluent m3/s 0.535number of grit chamber chamber 2mean velocity m/s 0.3retention period sec 30 30-60 secdepth of sand pit cm 30surface loading m3/m2/d 3,600 in case of combined sewerrequired area m2 13chamber depth m 0.5chamber width m 1.8chamber length m 9.0
3 - 81

Table 3.5.4 The Bill of Quantity of An Da Pumping Station Civil Works and BuildingsItem Unit BQexcavation m3 3,110backfilling m3 5,270surplus soil disposal m3 3,110pile foundation work PC pile dia 300 x 6m (long nose plier 6m) nos. 40
PC pile dia 300 x 6m nos. 16shoring steel sheet pile type III 40cm x 10 m m 49supportings of shoring H300x300x10x15, 94kg/m ton 18.6soil stabilization m3 924de-watering LS 1crusher-run stone m3 55levelling concrete m3 19reinforced concrete m3 428formwork m2 1,680reinforcing bar kg 34,240work platforms m2 547supportings m3 265control building m2 42reinforced concrete pipe dia 1100mm m 30plant trees m2 3,200fence and gate m 250lighting LS 1water supply LS 1pavement m2 210drainage side ditch B=300mm m 140house for guard m2 30Mechanical and Electrical FacilitiesItem Unit nos.Horizontal shaft sewage pump 300mmdia., 11m3/min, 5.5m, 18.5kW pumps 4Check valve delivery, 300mmdia. mm 4Sluice valve suction and delivery, 300mmdia. set 8Steel pipe 300mm-700mmdia L.S 1Gate W800 x H800 set 1Screen fine screen, W800 x H800, 25mm set 1Chain block 1t, manual operation set 1Transformer 150 kVA set 1Incoming panel set 1Control panel set 2Local panel set 4
3 - 82

Table 3.6.1 Estimated Generation of Sewage (West Treatment Area)
Master Plan(including lake and river area) Feasibility Study (including lake and river area)Area Unit Phase I Phase II Total Phase I Phase II Total Phase I
Combined Combined Separate Combined Combined Separate Combined2,020 2020 2020 2020 2,020 2020 2020 2020 2010 2010
Hong Bang m3/d 8,573 8,573 8,573 8,573Ngo Quyen m3/d 18,345 7,990 3,185 29,520 13,489 7,990 3,185 24,664 16,497 12,130Le Chan m3/d 23,027 3,899 26,926 23,027 3,899 26,926 21,646 21,646South of Le Chan m3/d 3,576 8,279 11,856 3,576 8,279 11,856 1,781 1,781Total m3/d 44,948 20,462 11,464 76,874 40,092 20,462 11,464 72,018 39,924 35,557
72,000 36,000Hong Bang ha 456 456 456 456Ngo Quyen ha 646 337 112 1,095 475 337 112 924Le Chan ha 378 64 442 378 64 442Du ha 172 97 269 172 97 269Vinh ha 79 484 563 79 484 563Total ha 1,275 857 693 2,825 1,104 857 693 2,654
ha 2,132 1,961
Note: Area excluded is included in East Treatment Area
3 - 83

Table 3.6.2 Design of Pumping Station (Combined sewer system)Total (Phase I + Phase II)Conditions
Planned capactiy (3Q) m3/s 2.253 from computation tableInfluent sewer
Influent sewer diameter m 1.80Ground level m 3.600Invert level m -3.800Water depth m 1.200Water level m -2.600
Pump discharge Effluent sewer diameter m 1.35Ground level m 4.200Invert level m 3.350Water depth m 1.350Water level m 4.700
Screen before pumpGrit chamber after pump
Capacity calculationScreen
type fine screen 25mm (15-25mm)number screen 6
PumpPump number pumps 3 → 2 2standby number pumps 1 → 1total number pumps 4 2Diameter of suction pump d mm 600 actual 596 mm 400 actual 400 mmDischarge capacity of pumpq m3/s 0.751 0.376
m3/min 45.1 22.5Flow velocity in suction pipev m/s 2.7 actual 2.657 m/s 3.0 actual 2.990 m/sActual head m 7.3 7.3Head loss around pump m 1.5 1.5Friction head loss of force main m 0.5 0.5Total head loss m 9.3 9.3Power InputCoefficient k 0.163 0.163Specific weight of liquid γ 1.000 1.000Pump efficiency Ep % 79 76 Capacity Q m3/min 45.1 22.5Total head loss H m 9.3 9.3Power Input Pi kW 86.5 Pi=kγQH/Ep 44.9 Pi=kγQH/EpPrime mover outputClearance a 0.15 0.15Transmission efficiency Et 1.00 1.00Prime mover output Po kW 99.4 Po=Pi(1+a)/Et 51.7 Po=Pi(1+a)/EtMotor kW 110 55
Grit chamberInfluent m3/s 2.253Number of grit chamber chamber 6Mean velocity m/s 0.3Retention period sec 30 30-60 secDepth of sand pit cm 30Surface loading m3/m2/d 3,600 in case of combined sewerRequired area m2 54.1chamber depth m 0.8chamber width m 1.6chamber length m 9.0
3 - 84
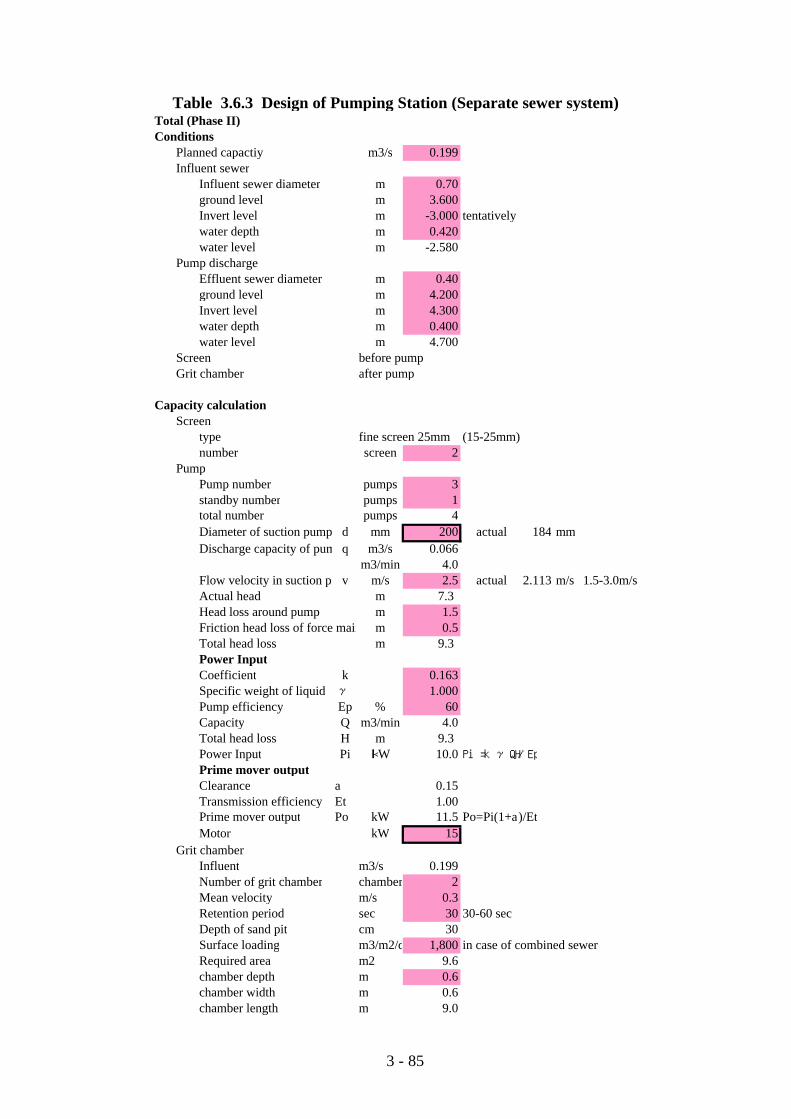
Table 3.6.3 Design of Pumping Station (Separate sewer system)Total (Phase II)Conditions
Planned capactiy m3/s 0.199Influent sewer
Influent sewer diameter m 0.70ground level m 3.600Invert level m -3.000 tentativelywater depth m 0.420water level m -2.580
Pump discharge Effluent sewer diameter m 0.40ground level m 4.200Invert level m 4.300water depth m 0.400water level m 4.700
Screen before pumpGrit chamber after pump
Capacity calculationScreen
type fine screen 25mm (15-25mm)number screen 2
PumpPump number pumps 3standby number pumps 1total number pumps 4Diameter of suction pump d mm 200 actual 184 mmDischarge capacity of pumpq m3/s 0.066
m3/min 4.0Flow velocity in suction pipev m/s 2.5 actual 2.113 m/s 1.5-3.0m/sActual head m 7.3Head loss around pump m 1.5Friction head loss of force main m 0.5Total head loss m 9.3Power InputCoefficient k 0.163Specific weight of liquid γ 1.000Pump efficiency Ep % 60 Capacity Q m3/min 4.0Total head loss H m 9.3Power Input Pi kW 10.0 Pi=kγQH/EpPrime mover outputClearance a 0.15Transmission efficiency Et 1.00Prime mover output Po kW 11.5 Po=Pi(1+a)/EtMotor kW 15
Grit chamberInfluent m3/s 0.199Number of grit chamber chamber 2Mean velocity m/s 0.3Retention period sec 30 30-60 secDepth of sand pit cm 30Surface loading m3/m2/d 1,800 in case of combined sewerRequired area m2 9.6chamber depth m 0.6chamber width m 0.6chamber length m 9.0
3 - 85
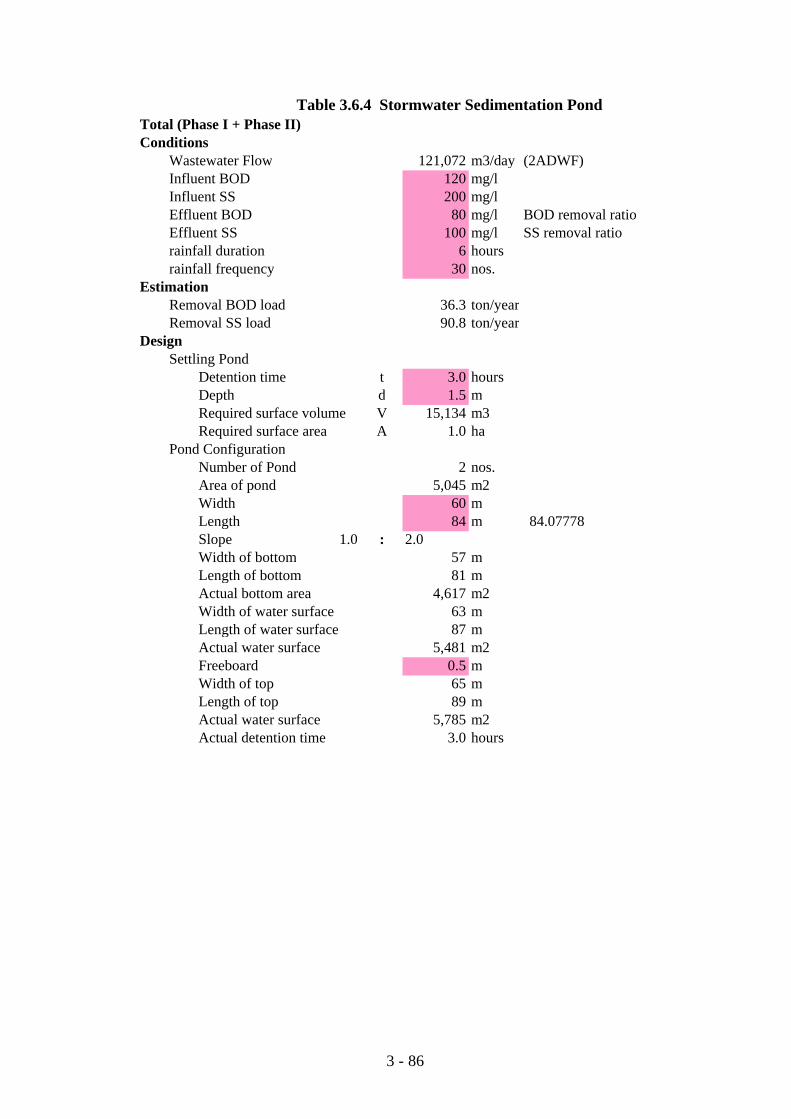
Table 3.6.4 Stormwater Sedimentation PondTotal (Phase I + Phase II)Conditions
Wastewater Flow 121,072 m3/day (2ADWF)Influent BOD 120 mg/lInfluent SS 200 mg/lEffluent BOD 80 mg/l BOD removal ratioEffluent SS 100 mg/l SS removal ratiorainfall duration 6 hoursrainfall frequency 30 nos.
EstimationRemoval BOD load 36.3 ton/yearRemoval SS load 90.8 ton/year
DesignSettling Pond
Detention time t 3.0 hoursDepth d 1.5 mRequired surface volume V 15,134 m3Required surface area A 1.0 ha
Pond ConfigurationNumber of Pond 2 nos.Area of pond 5,045 m2Width 60 mLength 84 m 84.07778Slope 1.0 : 2.0Width of bottom 57 mLength of bottom 81 mActual bottom area 4,617 m2Width of water surface 63 mLength of water surface 87 mActual water surface 5,481 m2Freeboard 0.5 mWidth of top 65 mLength of top 89 mActual water surface 5,785 m2Actual detention time 3.0 hours
3 - 86

Table 3.6.5 Aerated Lagoon Treatment Process (AL)Total (Phase I + Phase II)Conditions
Wastewater Flow 72,000 m3/day (ADWF)Influent BOD 350 mg/lInfluent SS 315 mg/lEffluent BOD 50 mg/l BOD removal ratio 86 %Effluent SS 60 mg/l SS removal ratio 81 %
EstimationBOD load 25.2 ton/day 9,198 ton/yearSS load 22.7 ton/day 8,278 ton/yearRemoval BOD load 21,600 kg/day 7,884 ton/yearRemoval SS load 18,360 kg/day 6,701 ton/year
DesignAerated Lagoon (AL)
Q 72,000 m3/d → 0.000264 19.0 Mgal/dInfluent waste temperature in winter Ti 20 °C → 68.0 ?Influent waste temperature in summer Tis 26 °C → 78.8 ?Ambient air temperature in winter Ta 14 °C → 57.2 ?Ambient air temperature in summer Tas 28 °C → 82.4 ?Proportionality constant f 0.000012 → 0.000012Surface area A 84,000 m2 x 10.7639 904,168 ft2Lagoon water temperature in winter Tw 17.8 ℃ ← 64.1 ? Tw=(AfTa+QTi)/(Af+Q)Lagoon water temperature in summer Tws 26.7 ℃ ← 80.1 ? Tws=(AfTas+Qtis)/(Af+Q)BOD removal-rate constant in winter kT 2.20 d-1 kT=2.5(1.06)^(Tw-20)
BOD removal-rate constant in summer kTs 3.70 d-1 kT=2.5(1.06)^(Tws-20)Mean cell-residence time θc 3.0 days in winter 1.9 days in summerAL depth d 3.0 m 3.0 m Required surface area A 7.2 ha 4.5 haEffluent BOD Le 46.0 mg/l Le=Li/(1+kT x θc) 44.1 mg/lBOD Removal 86.9 % 87.4 %
Lagoon ConfigurationNumber of AL 8 nos.Volume of lagoon 27,000 m3Area of lagoon 9,000 m2Width 64 mLength 140 m 141Slope 1.0 : 2.0Width of bottom 58 mLength of bottom 134 mActual bottom area 7,772 m2Width of water surface 70 mLength of water surface 146 mActual water surface 10,220 m2 x 8 81,760Freeboard 0.5 mWidth of top 72 mLength of top 148 mActual Top surface 10,656 m2
The concentration of biological solids producedInfluent BOD So 350Effluent BOD S 46.0cell yield coefficient Y 0.65endogenous decay coefficient kd 0.07mean cell-residence time θc 3.0biological solids produced X 163 mg/L VSS X=Y(So-S)/(1+kd?c)
The suspended solids in the lagoon effluent before settlingInfluent SS Li 315 mg/lSP influent SS SS 519 mg/l SS=Li+X/0.80
The amount of biological solids wasted per dayobserved yield Yobs 0.537 Yob=Y/(1+kd?c)net waste activated sludge produced each day Px 11,757 kg/d Px=YobsQ(So-S)/1000
The oxygen requirementconversion factor for converting BOD5 to BODL f 0.68oxygen requirement Or 15,491 kgO2/d =Q(So-S)/1000/f-1.42Px
The ratio of oxygen required to BOD5 removedBOD5 removed 21,887 kg/dthe ratio of oxygen required to BOD5 removed 0.71
The correction factortransfer rate in water at 20C and zero dissolved oxygen No 1.8 kgO2/kWhsalinity-surface tension correction factor β 1oxygen saturation concentration for tap water at given temperatureCwalt 9.45 17.8 °Coxygen saturation concentration for tap water 20C Cs20 9.08operating oxygen concentration CL 1.5temperature T 17.8oxygen-transfer correction factor for waste α 0.82correction factor N/No 1.23 N/No=((βCwalt-CL)/Cs20)(1.024^(T-20))αfield-transfer rate N 2.21 kgO2/kWh
The amount of O2 transferred per day unit O 53.0 kgO2/kWdThe total power required Pr 292 kW Pr=Or/OCheck the energy requirements for mixing
the power requirement 16 kW/1000m3Each Lagoon volume 27,000 m3/lagoonEach Lagoon Power required 432 kW/lagoonAerators number per lagoon 8 aerators/lagoonAerator power 54.0 kW/aerator
Use Eight 55kW surface aerators each lagoonTotal aerator number 64 aerators
3 - 87
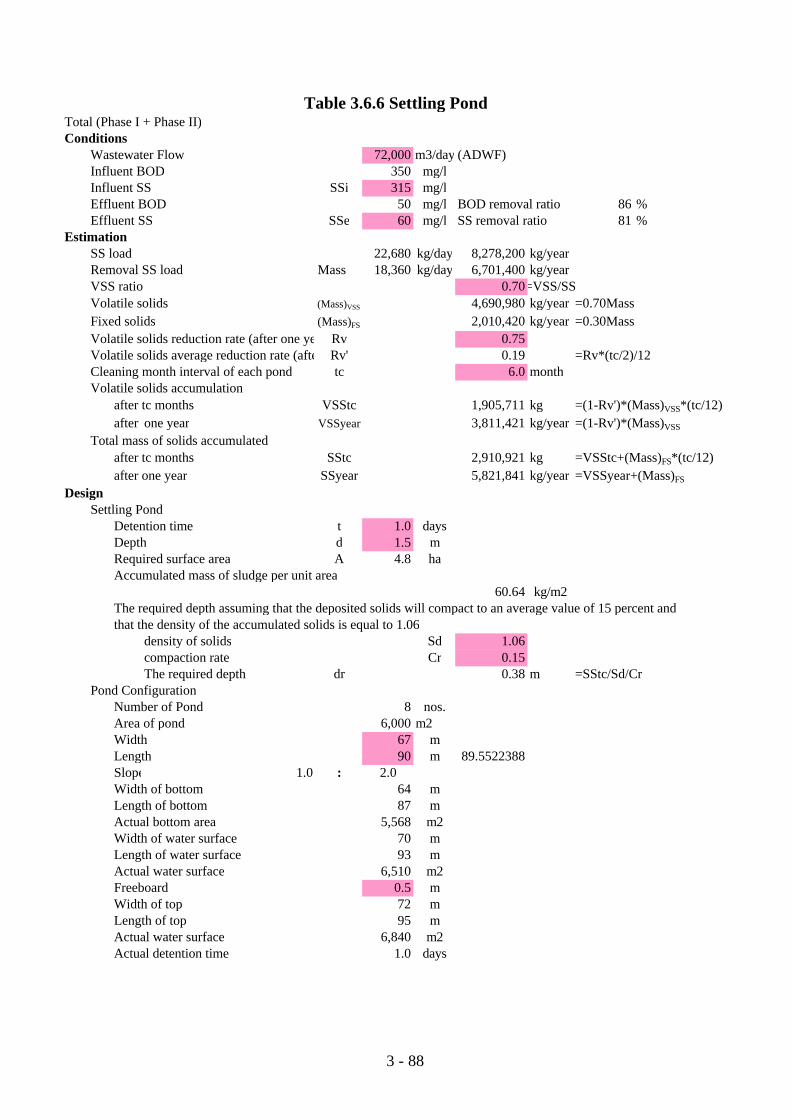
Table 3.6.6 Settling PondTotal (Phase I + Phase II)Conditions
Wastewater Flow 72,000 m3/day (ADWF)Influent BOD 350 mg/lInfluent SS SSi 315 mg/lEffluent BOD 50 mg/l BOD removal ratio 86 %Effluent SS SSe 60 mg/l SS removal ratio 81 %
EstimationSS load 22,680 kg/day 8,278,200 kg/yearRemoval SS load Mass 18,360 kg/day 6,701,400 kg/yearVSS ratio 0.70=VSS/SSVolatile solids (Mass)VSS 4,690,980 kg/year =0.70MassFixed solids (Mass)FS 2,010,420 kg/year =0.30MassVolatile solids reduction rate (after one year)Rv 0.75Volatile solids average reduction rate (after tc months)Rv' 0.19 =Rv*(tc/2)/12Cleaning month interval of each pond tc 6.0 monthVolatile solids accumulation
after tc months VSStc 1,905,711 kg =(1-Rv')*(Mass)VSS*(tc/12)after tc monthsone year VSSyear 3,811,421 kg/year =(1-Rv')*(Mass)VSS
Total mass of solids accumulatedafter tc months SStc 2,910,921 kg =VSStc+(Mass)FS*(tc/12)after one year SSyear 5,821,841 kg/year =VSSyear+(Mass)FS
DesignSettling Pond
Detention time t 1.0 daysDepth d 1.5 mRequired surface area A 4.8 haAccumulated mass of sludge per unit area
60.64 kg/m2The required depth assuming that the deposited solids will compact to an average value of 15 percent andthat the density of the accumulated solids is equal to 1.06
density of solids Sd 1.06compaction rate Cr 0.15The required depth dr 0.38 m =SStc/Sd/Cr
Pond ConfigurationNumber of Pond 8 nos.Area of pond 6,000 m2Width 67 mLength 90 m 89.5522388Slope 1.0 : 2.0Width of bottom 64 mLength of bottom 87 mActual bottom area 5,568 m2Width of water surface 70 mLength of water surface 93 mActual water surface 6,510 m2Freeboard 0.5 mWidth of top 72 mLength of top 95 mActual water surface 6,840 m2Actual detention time 1.0 days
3 - 88
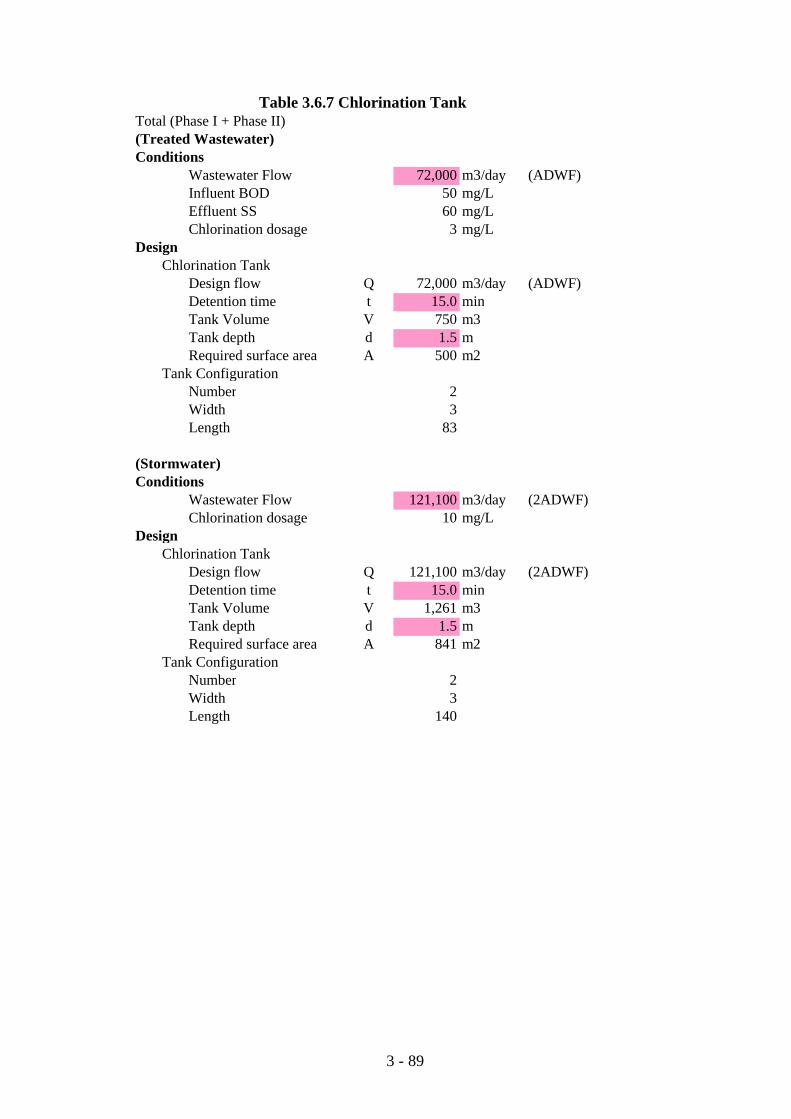
Table 3.6.7 Chlorination TankTotal (Phase I + Phase II)(Treated Wastewater)Conditions
Wastewater Flow 72,000 m3/day (ADWF)Influent BOD 50 mg/LEffluent SS 60 mg/LChlorination dosage 3 mg/L
DesignChlorination Tank
Design flow Q 72,000 m3/day (ADWF)Detention time t 15.0 minTank Volume V 750 m3Tank depth d 1.5 mRequired surface area A 500 m2
Tank ConfigurationNumber 2Width 3Length 83
(Stormwater)Conditions
Wastewater Flow 121,100 m3/day (2ADWF)Chlorination dosage 10 mg/L
DesignChlorination Tank
Design flow Q 121,100 m3/day (2ADWF)Detention time t 15.0 minTank Volume V 1,261 m3Tank depth d 1.5 mRequired surface area A 841 m2
Tank ConfigurationNumber 2Width 3Length 140
3 - 89

Table 3.6.8 Sludge Drying BedTotal (Phase I + Phase II)Conditions
Yearly solids produced Sy 5,821,841 kg/yearDesign
Sludge Drying BedDaily solids produced Sd 15,950 kg/daySludge concentration 20,000 mg/lSludge feeded Qs 798 m3/day
291,092 m3/yearSludge feeded frequency 16 nos./yearSludge feeded per one time 18,193 m3/one timepump operating hours 80 hourPump number 3 pumpsPump capacity 1.3 m3/min 0.021 m3/secPump dia 125 mm
Drying durationDrying duration by gravity Nw 2 daysDrying duration by evaporation
wind speed V 1.0 m/secevaporation maximum D 4.9 g/m3 =(0.0384x10^(0.0231(t+10)) -0.017)x(100-Hr)temperature t 26 ℃relative humidity Hr 80 %drying duration by evaporation Nd 19 days =75/((0.40xV^(1/3)+0.42)xD)
Probability of rainfall (more than 3mm/day)R 0.08Drying duration N 23 days =(Nw+Nd)/(1-R)
Drying Bed ConfigulationThickness of feeded sludge 20 cmRequired surface area A 9.0 ha
series number 8 series 1.13 ha/seriesbeds number per series 16 beds 703 m2/bedwidth W 26.0 m length L 27.1 m
Sludge producedDryed sludge water contents 60 %Dryed sludge volume Vs 40 m3/day
CheckSludge loading rate 65 kg/m2/year=Sy/10000A
59-98kg/m2*year for primary and waste activated digestedDosage solids loading 4.0 kg/m2 =Sd x N/10000A
less than 3.0-4.0kg/m2O.K.
3 - 90
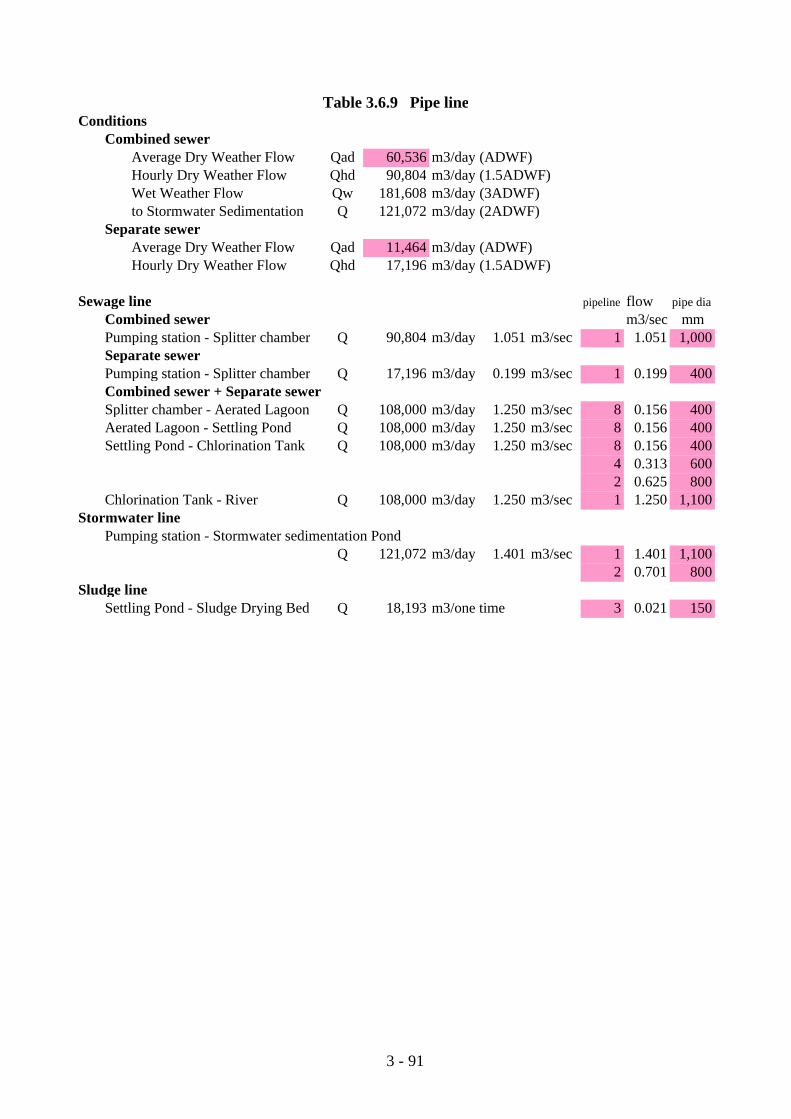
Table 3.6.9 Pipe lineConditions
Combined sewer Average Dry Weather Flow Qad 60,536 m3/day (ADWF)
Hourly Dry Weather Flow Qhd 90,804 m3/day (1.5ADWF)Wet Weather Flow Qw 181,608 m3/day (3ADWF)to Stormwater Sedimentation Q 121,072 m3/day (2ADWF)
Separate sewerAverage Dry Weather Flow Qad 11,464 m3/day (ADWF)Hourly Dry Weather Flow Qhd 17,196 m3/day (1.5ADWF)
Sewage line pipeline flow pipe diaCombined sewer m3/sec mmPumping station - Splitter chamber Q 90,804 m3/day 1.051 m3/sec 1 1.051 1,000Separate sewerPumping station - Splitter chamber Q 17,196 m3/day 0.199 m3/sec 1 0.199 400Combined sewer + Separate sewerSplitter chamber - Aerated Lagoon Q 108,000 m3/day 1.250 m3/sec 8 0.156 400Aerated Lagoon - Settling Pond Q 108,000 m3/day 1.250 m3/sec 8 0.156 400Settling Pond - Chlorination Tank Q 108,000 m3/day 1.250 m3/sec 8 0.156 400
4 0.313 6002 0.625 800
Chlorination Tank - River Q 108,000 m3/day 1.250 m3/sec 1 1.250 1,100Stormwater line
Pumping station - Stormwater sedimentation PondQ 121,072 m3/day 1.401 m3/sec 1 1.401 1,100
2 0.701 800Sludge line
Settling Pond - Sludge Drying Bed Q 18,193 m3/one time 3 0.021 150
3 - 91

Table 3.6.10 Building Space for O & M of WWTP
Number SpacePhase I+II Phase I Phase I+II Phase I
nos. nos. m2/Build. m2 m21 Control building 1 1 640 640 6402 Pump station building 1 1 160 160 603 O & M machine building 1 1 240 240 2404 Electric panel house for AL 8 4 10 80 405 Sludge Pump Maintenace House 2 1 40 80 406 Building for chrolination 2 1 20 40 207 House for watchman 1 1 30 30 30
Total 16 10 1,270 1,070
3 - 92

Table 3.6.11 Room Space of Control Building
No. Item m21 Operating panel room 1202 Generator room 803 Laboratory 1204 Balance room 405 Office 506 Meeting room 507 Rest room 108 Worker's room 209 Kitchen 5
10 Toilet 1011 Shower 512 Warespace for documents 3013 Warespace for materials 3014 Entrance hole 2015 Passage 50
Total 640
3 - 93

Table 3.6.12 The Bill of Quantity of West Wastewater Treatment Plant (1/3)
Civil Works and Buildings
1 Pumping Station (Combined sewer system)Item Unit BQexcavation m3 5,150backfilling m3 5,200surplus soil disposal m3 5,150pile foundation work PC pile dia 300 x 6m (follower 6m) nos. 90shoring steel sheet pile type III 40cmx10m m 83supportings of shoring H300x300x10x15, 94kg/m ton 32.4soil stabilization m3 1,520de-watering LS 1crusher-run stone m3 70levelling concrete m3 24reinforced concrete m3 570formwork m2 2,100reinforcing bar kg 45,000work platforms m2 1,430supportings m3 380control building m2 54
2 Aerated Lagoon Treatment Process (AL)Item Unit BQ
1 excavation m3 12,8002 backfilling m3 03 surplus soil disposal m3 12,8004 soil stabilization lime soil stabilization, t=30cm m3 12,8005 preparation of pond bottom m2 31,1006 pretection of bottom concrete t=10cm, crushed stone t=15cm m2 10,4007 trimming of slope m2 12,8008 riprap stone m2 1,6409 inlet works nos. 8
10 outlet works the same of inlet works nos. 811 access slope concrete t=20cm m2 84012 de-watering LS 1
inlet works or outlet workscrusher-run stone m3 1.2levelling concrete m3 0.6reinforced concrete m3 3.3formwork m2 20reinforcing bar kg 130stop log B400mm x H1000mm nos. 1
3 - 94

Table 3.6.12 The Bill of Quantity of West Wastewater Treatment Plant (2/3)
3 Settling PondItem Unit BQ
1 excavation m3 49,0002 backfilling m3 03 surplus soil disposal m3 49,0004 soil stabilization lime soil stabilization, t=30cm m3 8,2005 preparation of pond bottom m2 22,0006 trimming of slope m2 5,8007 riprap stone m2 1,3008 inlet works nos. 89 outlet works the same of inlet works nos. 8
10 access slope concrete t=20cm m2 48011 de-watering LS 1
inlet works or outlet workscrusher-run stone m3 1.2levelling concrete m3 0.6reinforced concrete m3 3.3formwork m2 20reinforcing bar kg 130stop log B400mm x H1000mm nos. 1
4 Chlorination TankItem Unit BQ
1 excavation m3 2502 backfilling m3 1003 surplus soil disposal m3 2504 bamboo foundation m2 4905 crusher-run stone m3 1006 levelling concrete m3 507 reinforced concrete m3 2608 formwork m2 9809 reinforcing bar kg 156005 Stormwater Sedimentation Pond
Item Unit BQ1 excavation m3 4,7002 backfilling m3 03 surplus soil disposal m3 4,7004 soil stabilization lime soil stabilization, t=30cm m3 1,4005 preparation of pond bottom m2 4,7006 trimming of slope m2 1,3007 riprap stone m2 1,3008 inlet works nos. 19 outlet works the same of inlet works nos. 1
10 access slope concrete t=20cm m2 12011 de-watering LS 1
inlet works or outlet workscrusher-run stone m3 1.7levelling concrete m3 0.9reinforced concrete m3 6.0formwork m2 36reinforcing bar kg 240
3 - 95

Table 3.6.12 The Bill of Quantity of West Wastewater Treatment Plant (3/3)
6 Sludge Drying BedItem Unit BQ
1 excavation m3 1,6002 backfilling m3 8003 surplus soil disposal m3 1,6004 soil stabilization lime soil stabilization, t=15cm m3 6,8005 preparation of bed m2 45,0006 crushed stone m3 4107 concrete m3 1,5308 formwork m2 8,6009 reinforcing bar kg 61,200
10 coarse sand m3 6,80011 fine gravel m3 9,00012 coarse gravel m3 32013 perforated tile dia150mm m 3,50014 concrete pipe dia200mm m 1,7007 Control Building etc
as you will see from the enclosed paper8 Other Works
Splitter chamber chmbers 1excavation m3 50backfilling m3 10surplus soil disposal m3 50bamboo foundation m2 20crusher-run stone m3 6levelling concrete m3 2reinforced concrete m3 16formwork m2 110reinforcing bar kg 640
gate of outfall 1500mmx1500mm nos. 1bank banking m3 15,600
trimming of bank m2 5,600bamboo foundation m2 9,800
pavement m2 3,400banking m2 17,000drainage dia 300mm m 1,800
U flume 300mm m 1,800landscape m2 20,500turfing m2 10,400de-watering LS 1Equipment lawn tractor tractor 1
swamp bulldozer bulldozer 1swamp shovel shovel 1truck for sludge disposal, 10ton truck 1wastewater examination equipment LS 1
Fencing m 1,720Lighting LS 1
3 - 96
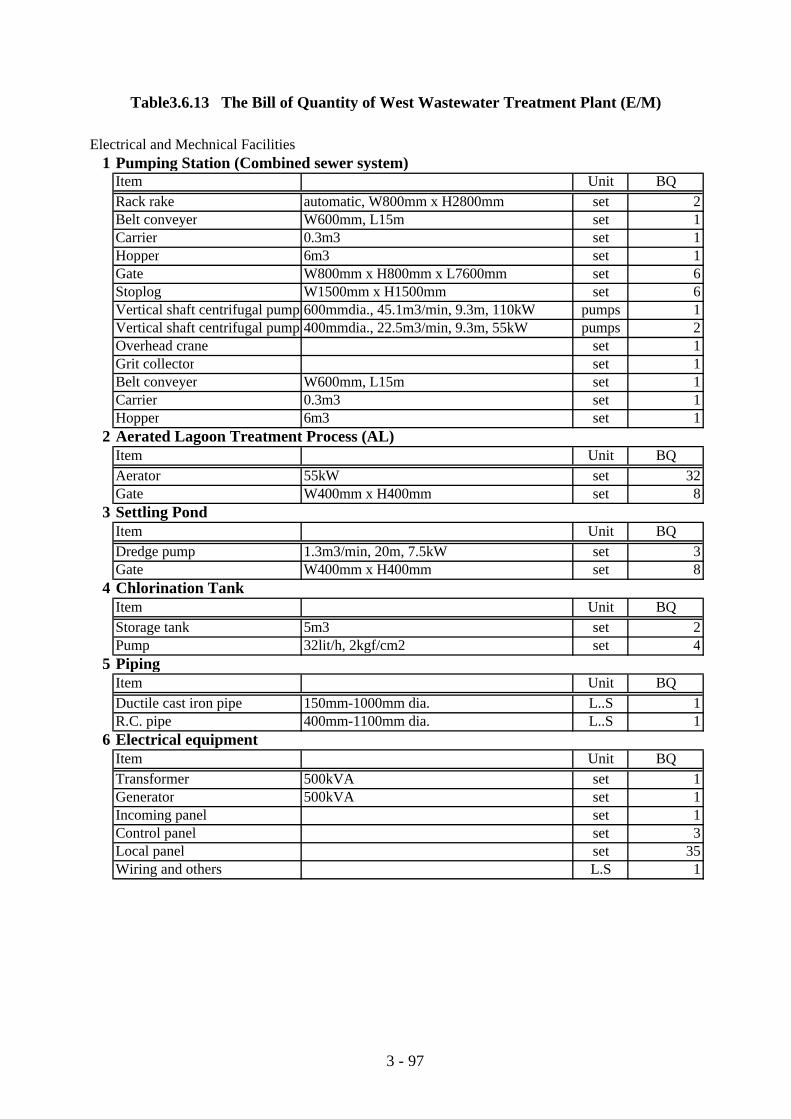
Table3.6.13 The Bill of Quantity of West Wastewater Treatment Plant (E/M)
Electrical and Mechnical Facilities1 Pumping Station (Combined sewer system)
Item Unit BQRack rake automatic, W800mm x H2800mm set 2Belt conveyer W600mm, L15m set 1Carrier 0.3m3 set 1Hopper 6m3 set 1Gate W800mm x H800mm x L7600mm set 6Stoplog W1500mm x H1500mm set 6Vertical shaft centrifugal pump 600mmdia., 45.1m3/min, 9.3m, 110kW pumps 1Vertical shaft centrifugal pump 400mmdia., 22.5m3/min, 9.3m, 55kW pumps 2Overhead crane set 1Grit collector set 1Belt conveyer W600mm, L15m set 1Carrier 0.3m3 set 1Hopper 6m3 set 1
2 Aerated Lagoon Treatment Process (AL)Item Unit BQAerator 55kW set 32Gate W400mm x H400mm set 8
3 Settling PondItem Unit BQDredge pump 1.3m3/min, 20m, 7.5kW set 3Gate W400mm x H400mm set 8
4 Chlorination TankItem Unit BQStorage tank 5m3 set 2Pump 32lit/h, 2kgf/cm2 set 4
5 PipingItem Unit BQDuctile cast iron pipe 150mm-1000mm dia. L..S 1R.C. pipe 400mm-1100mm dia. L..S 1
6 Electrical equipmentItem Unit BQTransformer 500kVA set 1Generator 500kVA set 1Incoming panel set 1Control panel set 3Local panel set 35Wiring and others L.S 1
3 - 97
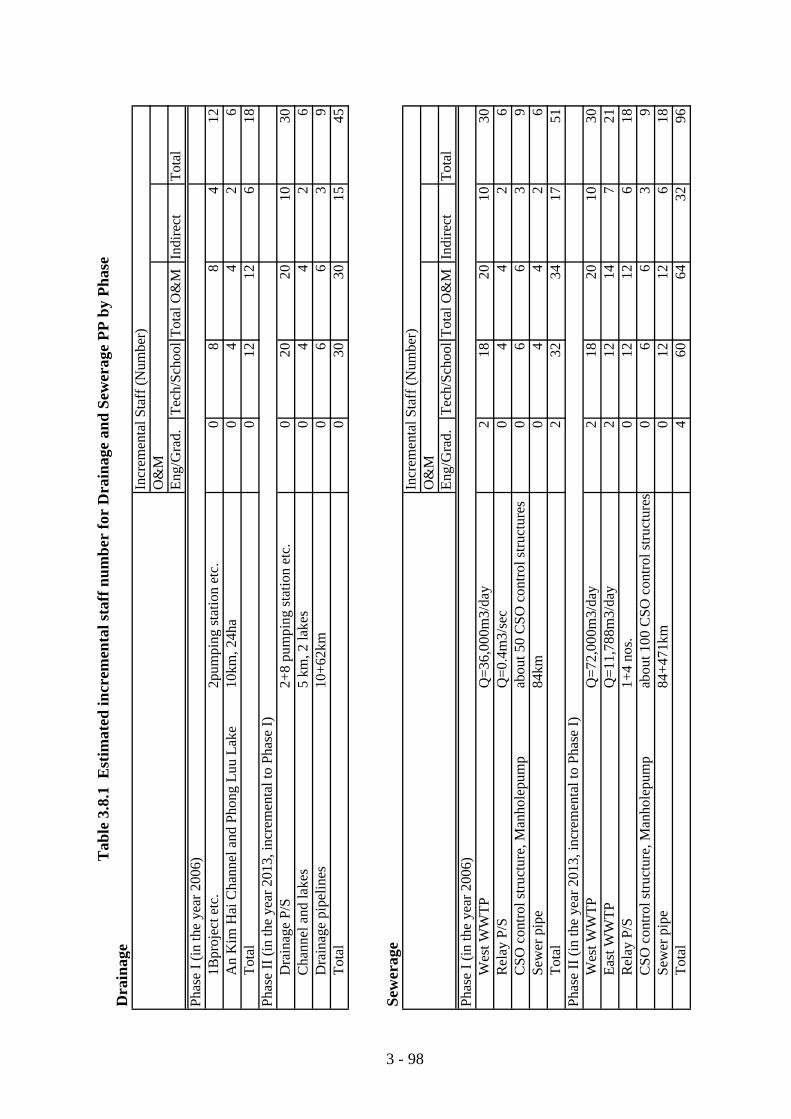
Tab
le 3
.8.1
Est
imat
ed in
crem
enta
l sta
ff n
umbe
r fo
r D
rain
age
and
Sew
erag
e PP
by
Phas
e D
rain
age
Incr
emen
tal S
taff
(Num
ber)
O&
ME
ng/G
rad.
Tec
h/Sc
hool
Tota
l O&
MIn
dire
ctT
otal
Phas
e I (
in th
e ye
ar 2
006)
1Bpr
ojec
t etc
.2p
umpi
ng s
tatio
n et
c.0
88
412
An
Kim
Hai
Cha
nnel
and
Pho
ng L
uu L
ake
10km
, 24h
a0
44
26
Tot
al0
1212
618
Phas
e II
(in
the
year
201
3, in
crem
enta
l to
Phas
e I)
Dra
inag
e P/
S2+
8 pu
mpi
ng s
tatio
n et
c.0
2020
1030
Cha
nnel
and
lake
s5
km, 2
lake
s0
44
26
Dra
inag
e pi
pelin
es10
+62k
m0
66
39
Tot
al0
3030
1545
Sew
erag
e In
crem
enta
l Sta
ff (N
umbe
r)O
&M
Eng
/Gra
d.T
ech/
Scho
olTo
tal O
&M
Indi
rect
Tot
alPh
ase
I (in
the
year
200
6)W
est W
WT
PQ
=36,
000m
3/da
y2
1820
1030
Rel
ay P
/SQ
=0.4
m3/
sec
04
42
6C
SO c
ontr
ol s
truc
ture
, Man
hole
pum
pab
out 5
0 C
SO c
ontr
ol s
truc
ture
s 0
66
39
Sew
er p
ipe
84km
04
42
6T
otal
232
3417
51Ph
ase
II (i
n th
e ye
ar 2
013,
incr
emen
tal t
o Ph
ase
I)W
est W
WT
PQ
=72,
000m
3/da
y2
1820
1030
Eas
t WW
TP
Q=1
1,78
8m3/
day
212
147
21R
elay
P/S
1+4
nos.
012
126
18C
SO c
ontr
ol s
truc
ture
, Man
hole
pum
pab
out 1
00 C
SO c
ontr
ol s
truc
ture
s0
66
39
Sew
er p
ipe
84+4
71km
012
126
18T
otal
460
6432
96
3 - 98

Table 3.8.2 Estimated incremental Staff Cost for Sewerage PP by Phase
Occupation title Number ofpersonnel
Unit Cost Cost
nos. US$/person/year US$/yearPhase I (in the year 2006)
Eng/Grad. 2 3,100 6,200Tech/School 32 2,000 64,000Indirect 17 2,000 34,000Total 51 104,200
Phase II (in the year 2013, incremental to Phase I)Eng/Grad. 4 3,100 12,400Tech/School 60 2,000 120,000Indirect 32 2,000 64,000Total 96 196,400
Total (Phase I+II)Eng/Grad. 6 18,600Tech/School 92 184,000Indirect 49 98,000Total 147 300,600
3 - 99

Tabl
e 3.
8.3
Ele
ctri
city
Cha
rges
Phas
e I
No
Faci
litie
s N
ame
Equ
ipm
ent N
ame
Mot
orQ
'tyM
otor
Ope
ratin
gLo
adPo
wer
Rat
ing
Dut
ySt
n.B
yT
otal
Load
Hou
rFa
ctor
Con
sum
ptio
n
kWkW
hour
/day
hour
skW
h/da
yM
anho
le P
ump
1M
anho
le P
ump
No.
1V
ertic
al D
etac
habl
e Su
bmer
sibl
e Pu
mp(
150m
m)
5.5
11
26
80.
835
2M
anho
le P
ump
No.
2V
ertic
al D
etac
habl
e Su
bmer
sibl
e Pu
mp(
80m
m)
1.5
11
22
80.
810
3M
anho
le P
ump
No.
3V
ertic
al D
etac
habl
e Su
bmer
sibl
e Pu
mp(
80m
m)
1.5
11
22
80.
810
4M
anho
le P
ump
No.
4V
ertic
al D
etac
habl
e Su
bmer
sibl
e Pu
mp(
100m
m)
3.7
11
24
80.
824
5M
anho
le P
ump
No.
5V
ertic
al D
etac
habl
e Su
bmer
sibl
e Pu
mp(
125m
m)
7.5
11
28
80.
848
6O
ther
sV
ertic
al D
etac
habl
e Su
bmer
sibl
e Pu
mp(
80m
m)
1.5
55
108
80.
848
An
Da
Lif
ting
Pum
p St
atio
n7
Sew
age
Pum
pL
iftin
g Se
wag
e Pu
mp
(300
mm
)18
.53
14
5612
0.8
533
8L
ight
ing
10
112
0.8
10W
est W
aste
wat
er T
reat
men
t Pla
nt9
Scre
en &
Grit
cha
mbe
rG
rit C
olle
ctor
etc
151
115
80.
896
10Se
wag
e Pu
mp
Lift
ing
Sew
age
Pum
p (6
00m
m)
110
10
111
01
0.8
8811
Sew
age
Pum
pL
iftin
g Se
wag
e Pu
mp
(400
mm
)55
11
255
240.
81,
056
14A
erat
ed L
agoo
nA
erat
or55
320
321,
760
4.5
0.8
6,33
616
Settl
ing
Pond
Slud
ge p
ump
7.5
31
423
40.
872
19O
ther
s10
108
0.8
6420
Lig
htin
g10
1012
0.8
96T
otal
8,52
4D
aily
ele
ctric
ity c
onsu
mpt
ion
kWh/
day
8,52
4Y
early
ele
ctric
ity c
onsu
mpt
ion
kWh/
year
3,11
1,43
5U
nit c
ost
US$
/kW
h0.
06V
ND
/kW
h84
6D
aily
ele
ctric
ity c
harg
esU
S$/d
ay51
1Y
early
ele
ctric
ity c
harg
esU
S$/y
ear
187,
000
3 - 100

Table 3.8.4 Calculation of Chemicals and Cleaning Materials Comsumption Hypo Chlorite (NaOCL) for Disinfection
Phase I(Treated Wastewater)
Effective chlorine concentration Cc % 12Specific gravity γc 1.12Average dry weather flow Q m3/day 36,000 Phase INaOCL average dosing rate Rd mg/l 3 as 100% chlorineRequired capacity per day kg/d 900 =Q*Rd/1000*100/Cc
l/d 804 =Q*Rd/1000*100/Cc/?cMonthly consumption m3/month 24Yearly consumption m3/year 289Unit cost of NaOCL VND/kg 2,000 (12% Effective chlorine)
US$/kg 0.15Daily cost US$/day 135Yearly cost US$/year 49,000
(Stormwater)Effective chlorine concentration Cc % 12Specific gravity γc 1.12
m3/day 72,000m3/hour 3,000hours/year 275
Average dry weather flow Q m3/year 825,000 Phase INaOCL average dosing rate Rd mg/l 10 as 100% chlorineRequired capacity per day kg/year 68,750 =Q*Rd/1000*100/Cc
l/year 61,384 =Q*Rd/1000*100/Cc/?cYearly consumption m3/year 61Unit cost of NaOCL VND/kg 2,000 (12% Effective chlorine)
US$/kg 0.15Yearly cost US$/year 10,313
Total Yearly cost US$/year 59,313
3 - 101

Table 3.8.5 Sludge disposal costPhase I
Daily sludge volume(Sewage) Vsd m3/day 20Annual sludge volume(Sewage) Vsa m3/year 7,300Screenings and grit Vsg m3/year 2,190Stormwater pump capacity m3/hour 3,000 2Q=2*36,000m3/day=3,000m3/hourAverage storm hours in year has hours 275Operating hours hours 550 =has * 2Expected average stormwater SS mg/l 100Removal rate % 50Removal sluge ton 83Sludge water content % 60Sludge weight ton 138Sludge unit weight ton/m3 1.1Annual sludge volume(Stormwater) Vst m3 125Annual sludge volume Vs m3 9,615 =Vsa + Vsg + Vst
Sludge disposal unit cost US$/m3 8.5Including loading, hauling andspreading, haulage distance about
Annual sludge disposal cost US$/year 81,728
3 - 102
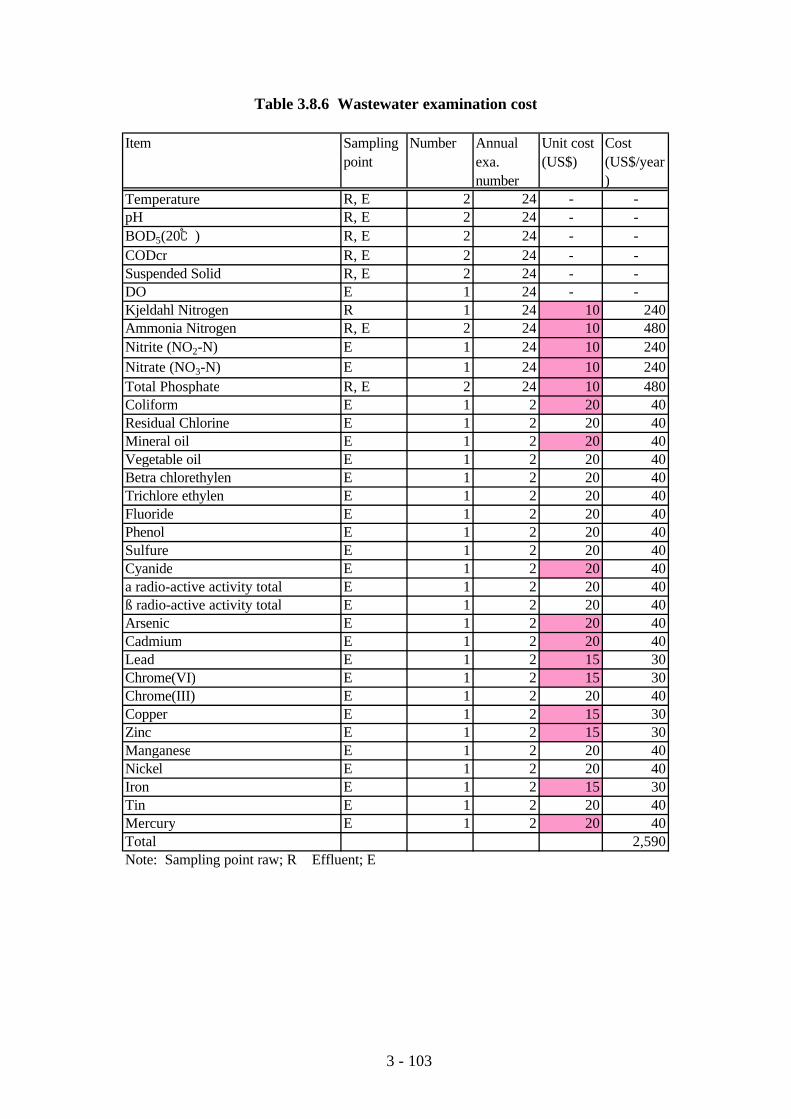
Table 3.8.6 Wastewater examination cost
Item Samplingpoint
Number Annualexa.number
Unit cost(US$)
Cost(US$/year)
Temperature R, E 2 24 - -pH R, E 2 24 - -BOD5(20℃) R, E 2 24 - -CODcr R, E 2 24 - -Suspended Solid R, E 2 24 - -DO E 1 24 - -Kjeldahl Nitrogen R 1 24 10 240Ammonia Nitrogen R, E 2 24 10 480Nitrite (NO2-N) E 1 24 10 240Nitrate (NO3-N) E 1 24 10 240Total Phosphate R, E 2 24 10 480Coliform E 1 2 20 40Residual Chlorine E 1 2 20 40Mineral oil E 1 2 20 40Vegetable oil E 1 2 20 40Betra chlorethylen E 1 2 20 40Trichlore ethylen E 1 2 20 40Fluoride E 1 2 20 40Phenol E 1 2 20 40Sulfure E 1 2 20 40Cyanide E 1 2 20 40a radio-active activity total E 1 2 20 40ß radio-active activity total E 1 2 20 40Arsenic E 1 2 20 40Cadmium E 1 2 20 40Lead E 1 2 15 30Chrome(VI) E 1 2 15 30Chrome(III) E 1 2 20 40Copper E 1 2 15 30Zinc E 1 2 15 30Manganese E 1 2 20 40Nickel E 1 2 20 40Iron E 1 2 15 30Tin E 1 2 20 40Mercury E 1 2 20 40Total 2,590Note: Sampling point raw; R Effluent; E
3 - 103
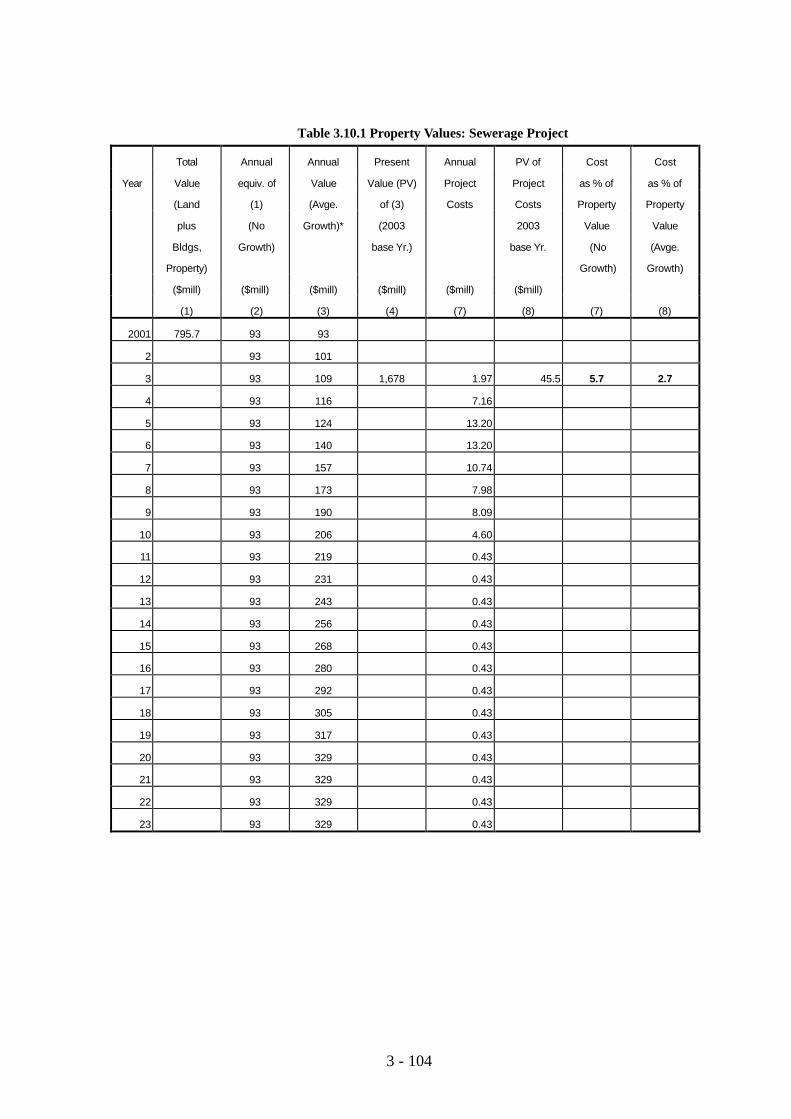
Table 3.10.1 Property Values: Sewerage Project
Total Annual Annual Present Annual PV of Cost Cost
Year Value equiv. of Value Value (PV) Project Project as % of as % of
(Land (1) (Avge. of (3) Costs Costs Property Property
plus (No Growth)* (2003 2003 Value Value
Bldgs, Growth) base Yr.) base Yr. (No (Avge.
Property) Growth) Growth)
($mill) ($mill) ($mill) ($mill) ($mill) ($mill)
(1) (2) (3) (4) (7) (8) (7) (8)
2001 795.7 93 93
2 93 101
3 93 109 1,678 1.97 45.5 5.7 2.7
4 93 116 7.16
5 93 124 13.20
6 93 140 13.20
7 93 157 10.74
8 93 173 7.98
9 93 190 8.09
10 93 206 4.60
11 93 219 0.43
12 93 231 0.43
13 93 243 0.43
14 93 256 0.43
15 93 268 0.43
16 93 280 0.43
17 93 292 0.43
18 93 305 0.43
19 93 317 0.43
20 93 329 0.43
21 93 329 0.43
22 93 329 0.43
23 93 329 0.43
3 - 104

Table 3.10.2 Urban Productivity: Sewerage Project
Year Value- Present Total PV PV of Proj. cost Proj. cost
Added Value (PV) Value- of Project as % of as % of
(No of (1) Added (3) Costs Value Value
Growth) 2003 (Avge. 2003 2003 Added (Avge.
base yr* Growth base yr base yr (No Growth
after 2001) Growth) after 2001)
($mill) ($mill) ($mill) ($mill) ($mill)
(1) (2) (3) (4) (5) (6) (7)
2000
2001 159 159
2 159 172
3 159 1,211 185 2,820 45.5 3.76 1.61
4 159 198
5 159 211
6 159 239
7 159 267
8 159 295
9 159 323
10 159 351
11 159 372
12 159 393
13 159 414
14 159 435
15 159 456
16 159 477
17 159 498
18 159 518
19 159 539
20 159 559
21 159 587
22 159 617
23 159 648
3 - 105

Table 3.10.3 Sewerage Program Costs in Relation to Key Indicators: Sensitivity to Key Assumptions
(20% increase in estimated costs, half the predicted economic growth rate)
values in 2000 prices
Year Total Cost as % Cost as % Cost as % Cost as % Per Capita
Cost of GRP in of GRP in of HPPC of Disp. Inc. Cost in
Study Area Haiphong Exp. Study Area Study Area
($'000) (%) (%) (%) (%) ($)
2001 0 0.00 0.00 0.00 0.00 0.00
2002 0 0.00 0.00 0.00 0.00 0.00
2003 168 0.04 0.02 0.24 0.07 0.29
2004 852 0.18 0.11 1.20 0.35 1.45
2005 2,372 0.48 0.29 3.23 0.95 4.00
2006 4,031 0.76 0.46 5.14 1.51 6.73
2007 5,824 1.03 0.63 7.01 2.06 9.61
2008 6,881 1.16 0.71 7.87 2.31 11.23
2009 7,949 1.27 0.78 8.67 2.55 12.84
2010 8,713 1.34 0.82 9.10 2.68 13.92
2011 10,674 1.59 0.97 10.81 3.18 16.88
2012 13,420 1.94 1.19 13.20 3.88 21.00
2013 16,393 2.31 1.41 15.69 4.61 25.39
2014 17,914 2.46 1.50 16.71 4.91 27.46
2015 19,184 2.57 1.57 17.45 5.13 29.11
2016 20,458 2.67 1.64 18.18 5.34 30.74
2017 21,730 2.77 1.70 18.88 5.55 32.33
2018 23,000 2.87 1.76 19.56 5.75 33.89
2019 24,272 2.97 1.82 20.22 5.94 35.42
2020 25,543 3.07 1.88 20.86 6.13 36.91
3 - 106

Unit: 1,000 dollar in current price
Const-ruction &Procure-
ment(1.3%/year
)
Engi-neering(0.75%/year) Total
Repay-ment ofPrincipal
Paymentof Interest
TotalRepay-ment
15% ofTotal
Invest-ment (NotCoveredby Loan)
RecurringCost
TotalProjectCash
Expendi-ture
HPPC'sExpenditur
e
Raito ofRe-
paymentto HPPC
Exp.
Ratio ofSum of the
15% &RecurringCost to
HPPC Exp.
Ratio ofTotal
ProjectExpenditure
to HPPCExp.
a b c d = b+c e f g = e+f h I j = g+h+I k l =g/k m = (h+I)/k n = j/k
2003 0 766 766 0 0 0 1,325 0 1,325 77,066 0.0% 1.7% 1.7%
2004 4,894 782 5,676 0 6 6 2,071 0 2,077 83,548 0.0% 2.5% 2.5%
2005 11,986 797 12,783 0 75 75 1,787 0 1,862 90,259 0.1% 2.0% 2.1%
2006 12,226 813 13,039 0 237 237 1,823 0 2,060 102,432 0.2% 1.8% 2.0%
2007 9,702 830 10,531 0 402 402 1,452 355 2,209 115,057 0.3% 1.6% 1.9%
2008 7,070 846 7,916 0 534 534 1,065 362 1,962 128,146 0.4% 1.1% 1.5%
2009 7,212 863 8,075 0 633 633 1,087 509 2,229 141,712 0.4% 1.1% 1.6%
2010 3,640 880 4,520 0 733 733 562 519 1,814 155,770 0.5% 0.7% 1.2%
2011 0 0 0 0 733 733 0 530 1,263 168,894 0.4% 0.3% 0.7%
2012 0 0 0 0 733 733 0 540 1,273 182,482 0.4% 0.3% 0.7%
2013 0 0 0 3,056 787 3,843 0 551 4,394 196,545 2.0% 0.3% 2.2%
2014 0 0 0 3,056 748 3,804 0 562 4,366 211,098 1.8% 0.3% 2.1%
2015 0 0 0 3,056 710 3,766 0 573 4,339 226,154 1.7% 0.3% 1.9%
2016 0 0 0 3,056 671 3,727 0 585 4,312 241,728 1.5% 0.2% 1.8%
2017 0 0 0 3,056 633 3,688 0 597 4,285 257,834 1.4% 0.2% 1.7%
2018 0 0 0 3,056 594 3,650 0 608 4,258 274,488 1.3% 0.2% 1.6%
2019 0 0 0 3,056 556 3,611 0 621 4,232 291,705 1.2% 0.2% 1.5%
2020 0 0 0 3,056 517 3,573 0 633 4,206 309,501 1.2% 0.2% 1.4%
2021 0 0 0 3,056 479 3,534 0 646 4,180 328,319 1.1% 0.2% 1.3%
2022 0 0 0 3,056 440 3,496 0 659 4,154 348,281 1.0% 0.2% 1.2%
2023 0 0 0 3,056 402 3,457 0 672 4,129 369,456 0.9% 0.2% 1.1%
2024 0 0 0 3,056 363 3,419 0 685 4,104 391,919 0.9% 0.2% 1.0%
2025 0 0 0 3,056 325 3,380 0 699 4,079 415,748 0.8% 0.2% 1.0%
2026 0 0 0 3,056 286 3,342 0 713 4,055 441,025 0.8% 0.2% 0.9%
2027 0 0 0 3,056 248 3,303 0 727 4,030 467,840 0.7% 0.2% 0.9%
2028 0 0 0 3,056 209 3,265 0 742 4,006 496,284 0.7% 0.1% 0.8%
2029 0 0 0 3,056 171 3,226 0 757 3,983 526,458 0.6% 0.1% 0.8%
2030 0 0 0 3,056 132 3,188 0 772 3,959 558,467 0.6% 0.1% 0.7%
2031 0 0 0 3,056 93 3,149 0 787 3,936 592,422 0.5% 0.1% 0.7%
2032 0 0 0 3,056 55 3,111 0 803 3,914 628,441 0.5% 0.1% 0.6%
2033 0 0 0 219 16 236 0 819 1,055 666,650 0.0% 0.1% 0.2%
2034 0 0 0 219 15 234 0 835 1,069 707,183 0.0% 0.1% 0.2%
2035 0 0 0 219 13 232 0 852 1,084 750,179 0.0% 0.1% 0.1%
2036 0 0 0 219 12 231 0 869 1,100 795,790 0.0% 0.1% 0.1%
2037 0 0 0 219 10 229 0 886 1,115 844,174 0.0% 0.1% 0.1%
2038 0 0 0 219 8 227 0 904 1,132 895,500 0.0% 0.1% 0.1%
2039 0 0 0 219 7 226 0 922 1,148 949,947 0.0% 0.1% 0.1%
2040 0 0 0 219 5 224 0 941 1,165 1,007,703 0.0% 0.1% 0.1%
2041 0 0 0 219 3 223 0 959 1,182 1,068,972 0.0% 0.1% 0.1%
2042 0 0 0 219 2 221 0 979 1,200 1,133,965 0.0% 0.1% 0.1%
Total 56,730 6,577 63,307 63,307 12,594 75,901 11,172 25,171 112,244 9,917,709 0.8% 0.4% 1.1%Note: A 2% annual inflation in terms of dollar is assumed.
Borrowing (85% of TotalInvestment)
Table 3.10.4 Sewage Priority Project: Loan Repayment Schedule and Costs as Percentage of HPPC's Expenditure
3 - 107
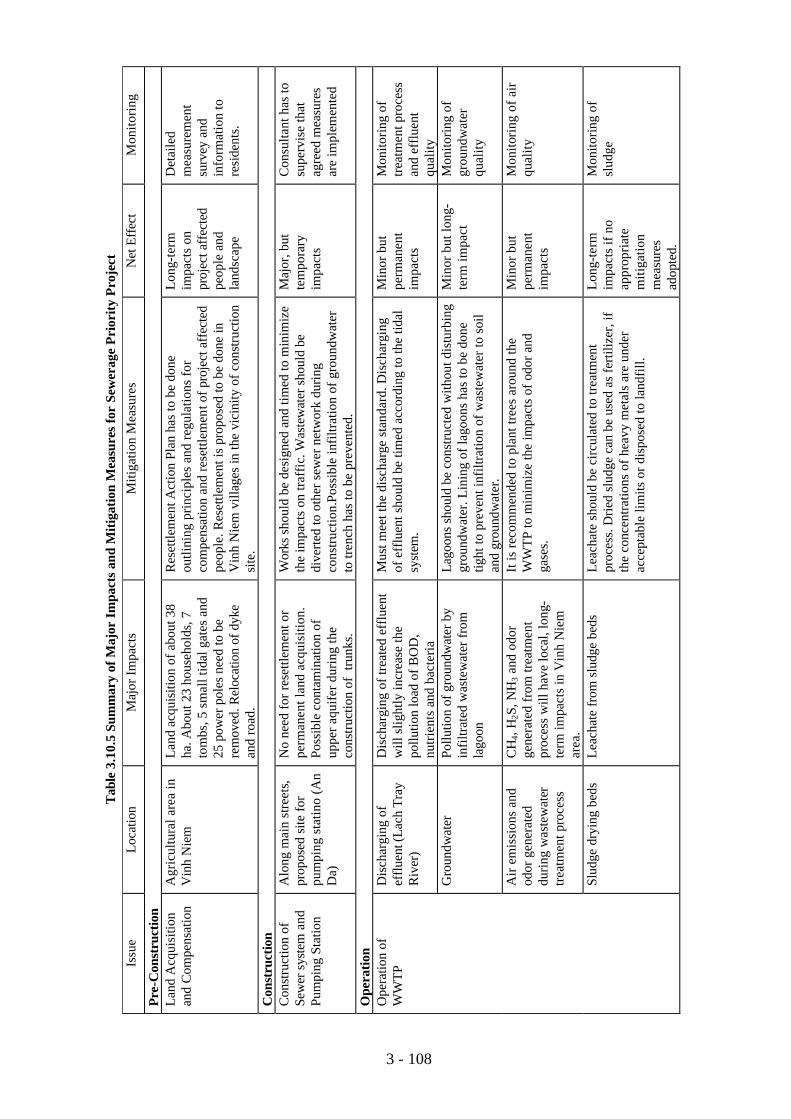
Tabl
e 3.
10.5
Sum
mar
y of
Maj
or Im
pact
s and
Miti
gatio
n M
easu
res f
or S
ewer
age
Prio
rity
Pro
ject
Issu
e Lo
catio
n M
ajor
Impa
cts
Miti
gatio
n M
easu
res
Net
Eff
ect
Mon
itori
ng
Pre-
Con
stru
ctio
n
Lan
d A
cqui
sitio
n an
d C
ompe
nsat
ion
Agr
icul
tura
l are
a in
V
inh
Nie
m
Lan
d ac
quis
ition
of a
bout
38
ha. A
bout
23
hous
ehol
ds, 7
to
mbs
, 5 s
mal
l tid
al g
ates
and
25
pow
er p
oles
nee
d to
be
rem
oved
. Rel
ocat
ion
of d
yke
and
road
.
Res
ettle
men
t Act
ion
Plan
has
to b
e do
ne
outli
ning
pri
ncip
les
and
regu
latio
ns fo
r co
mpe
nsat
ion
and
rese
ttlem
ent o
f pro
ject
aff
ecte
d pe
ople
. Res
ettle
men
t is
prop
osed
to b
e do
ne in
V
inh
Nie
m v
illag
es in
the
vici
nity
of c
onst
ruct
ion
site
.
Lon
g-te
rm
impa
cts
on
proj
ect a
ffec
ted
peop
le a
nd
land
scap
e
Det
aile
d m
easu
rem
ent
surv
ey a
nd
info
rmat
ion
to
resi
dent
s.
Con
stru
ctio
n
Con
stru
ctio
n of
Se
wer
sys
tem
and
Pu
mpi
ng S
tatio
n
Alo
ng m
ain
stre
ets,
pr
opos
ed s
ite fo
r pu
mpi
ng s
tatin
o (A
n D
a)
No
need
for r
eset
tlem
ent o
r pe
rman
ent l
and
acqu
isiti
on.
Poss
ible
con
tam
inat
ion
of
uppe
r aqu
ifer
dur
ing
the
cons
truc
tion
of t
runk
s.
Wor
ks s
houl
d be
des
igne
d an
d tim
ed to
min
imiz
e th
e im
pact
s on
traf
fic.
Was
tew
ater
sho
uld
be
dive
rted
to o
ther
sew
er n
etw
ork
duri
ng
cons
truc
tion.
Poss
ible
infi
ltrat
ion
of g
roun
dwat
er
to tr
ench
has
to b
e pr
even
ted.
Maj
or, b
ut
tem
pora
ry
impa
cts
Con
sulta
nt h
as to
su
perv
ise
that
ag
reed
mea
sure
s ar
e im
plem
ente
d
Ope
ratio
n
Ope
ratio
n of
W
WT
P D
isch
argi
ng o
f ef
fluen
t (La
ch T
ray
Riv
er)
Dis
char
ging
of t
reat
ed e
fflu
ent
will
slig
htly
incr
ease
the
pollu
tion
load
of B
OD
, nu
trie
nts
and
bact
eria
Mus
t mee
t the
dis
char
ge s
tand
ard.
Dis
char
ging
of
eff
luen
t sho
uld
be ti
med
acc
ordi
ng to
the
tidal
sy
stem
.
Min
or b
ut
perm
anen
t im
pact
s
Mon
itori
ng o
f tr
eatm
ent p
roce
ss
and
efflu
ent
qual
ity
G
roun
dwat
er
Pollu
tion
of g
roun
dwat
er b
y in
filtr
ated
was
tew
ater
from
la
goon
Lago
ons
shou
ld b
e co
nstr
ucte
d w
ithou
t dis
turb
ing
grou
ndw
ater
. Lin
ing
of la
goon
s ha
s to
be
done
tig
ht to
pre
vent
infi
ltrat
ion
of w
aste
wat
er to
soi
l an
d gr
ound
wat
er.
Min
or b
ut lo
ng-
term
impa
ct
Mon
itori
ng o
f gr
ound
wat
er
qual
ity
Air
em
issi
ons
and
odor
gen
erat
ed
duri
ng w
aste
wat
er
trea
tmen
t pro
cess
CH
4, H
2S, N
H3 a
nd o
dor
gene
rate
d fr
om tr
eatm
ent
proc
ess
will
hav
e lo
cal,
long
-te
rm im
pact
s in
Vin
h N
iem
ar
ea.
It is
reco
mm
ende
d to
pla
nt tr
ees
arou
nd th
e W
WT
P to
min
imiz
e th
e im
pact
s of
odo
r and
ga
ses.
Min
or b
ut
perm
anen
t im
pact
s
Mon
itori
ng o
f ai
r qu
ality
Slud
ge d
ryin
g be
ds
Leac
hate
from
slu
dge
beds
L
each
ate
shou
ld b
e ci
rcul
ated
to tr
eatm
ent
proc
ess.
Drie
d sl
udge
can
be
used
as
ferti
lizer
, if
the
conc
entr
atio
ns o
f hea
vy m
etal
s ar
e un
der
acce
ptab
le li
mits
or d
ispo
sed
to la
ndfi
ll.
Lon
g-te
rm
impa
cts
if n
o ap
prop
riat
e m
itiga
tion
mea
sure
s ad
opte
d.
Mon
itori
ng o
f sl
udge
3 - 108

The
Stu
dy o
n Sa
nita
tion
Impr
ovem
ent P
lan
for
Hai
phon
g C
ity in
The
Soc
ialis
t Rep
ublic
of V
ietn
am
Japa
n In
tern
atio
nal C
oope
ratio
n A
genc
y
Lege
ndSe
wer
age
syst
emPh
ase
IW
est T
reat
men
t Are
a (C
ombi
ned
syst
em)
I-1W
Inte
rcep
ter P
ipe
Line
Max
.dia
1,65
0m
mP-
1WM
ain
Pum
ping
Sta
tion
Cap
acity
30m
3/m
inT-
WW
est W
aste
wat
er T
reat
men
t Pla
nt(in
202
0)72
,000
m3/
day
Phas
e II
Wes
t Tre
atm
ent A
rea
(Com
bine
d sy
stem
)I-
2WIn
terc
epte
r Pip
e Li
neM
ax.d
ia1,
100
mm
I-3W
Inte
rcep
ter P
ipe
Line
Max
.dia
1,10
0m
mP-
3WM
ain
Pum
ping
Sta
tion
appr
ox10
m3/
min
Wes
t Tre
atm
ent A
rea
(Sep
arat
e sy
stem
)C
-1W
Con
veya
nce
Pipe
Lin
eM
ax.d
ia80
0m
mP-
4WM
ain
Pum
ping
Sta
tion
appr
ox10
m3/
min
Wes
t Tre
atm
ent A
rea
(Sep
arat
e sy
stem
)C
-2E
Con
veya
nce
Pipe
Lin
eM
ax.d
ia70
0m
mC
-3E
Con
veya
nce
Pipe
Lin
eM
ax.d
ia45
0m
mP-
5EM
ain
Pum
ping
Sta
tion
appr
ox10
m3/
min
P-6E
Mai
n Pu
mpi
ng S
tatio
nap
prox
10m
3/m
inP-
7EM
ain
Pum
ping
Sta
tion
appr
ox10
m3/
min
T-E
Eas
t Was
tew
ater
Tre
atm
ent P
lant
(in 2
020)
10,6
11m
3/da
y
P-3
W
Ph
ase
II
Ph
ase
II
Ph
ase
II
Ph
ase
I
C-1
W
P
P
P-4
WP
P-6
E
P
P P-5
E
C-2
E
T-E
C-3
E
P-7
EP
-1W
Cen
tral
Are
aO
ld C
ity C
ente
rN
ew D
evel
opm
ent A
rea
(Wes
t)N
ew D
evel
opm
ent A
rea
(Eas
t)
Ph
ase
IP
ha
se
II
Sew
erag
e Fa
cilit
ies M
apFi
gure
3.1
.1
P
T-W
T-W
3 - 109