Aracely Rosales - Helping diverse consumers navigate health insurance exchanges

Final report
Helping Consumers Reduce Food
Waste – A Retail Survey 2011
In 2009, WRAP undertook a survey across UK retailers, and a selection of food products, of a range of factors believed to influence household food waste. To provide an updated picture, and gauge progress against the recommendations in the 2009 report, the work was repeated in 2011 and this report summarises the findings.
Project code: RHF523-002 Research date: February 2011-March 2012 Date: June 2012

WRAP’s vision is a world without waste, where resources are used sustainably. We work with businesses, individuals and communities to help them reap the benefits of reducing waste, developing sustainable products and using resources in an efficient way. Find out more at www.wrap.org.uk
Written by: Brook Lyndhurst & WRAP
Front cover photography: Shop aisle (Fotofolia)
While we have tried to make sure this report is accurate, we cannot accept responsibility or be held legally responsible for any loss or damage arising out of or in
connection with this information being inaccurate, incomplete or misleading. This material is copyrighted. You can copy it free of charge as long as the material is
accurate and not used in a misleading context. You must identify the source of the material and acknowledge our copyright. You must not use material to endorse or
suggest we have endorsed a commercial product or service. For more details please see our terms and conditions on our website at www.wrap.org.uk
Suggested citation for this report:
Helping Consumers Reduce Food Waste – A Retail Survey 2011. Brook Lyndhurst & WRAP, June 2012.

Helping Consumers Reduce Food Waste – A Retail Survey 2011 1
Executive summary
In 2009, WRAP undertook a survey across UK retailers, and a selection of food products, of a range of factors believed to influence household food waste1. Data on, for example, pack size, price, functionality, labelling and point of sale communications, were reviewed for approximately 10,000 separate products from 19 product categories. The data collected through that research constituted an important resource for WRAP and the food industry to identify good practice that could be implemented more widely, and areas where inconsistency or lack of clarity could be addressed to help consumers get more out of what they buy and waste less. One of the recommendations from the 2009 research was to repeat the project in 2011 to determine what had changed in the previous two years. This report summarises the findings from the 2011 research, creating a new baseline from which changes in the UK retail environment may be measured. Where comparable data existed, this report documents change, or lack of change, since 2009. Data were collected on 12,000 separate products from 20 product categories. In some cases, there may well be genuine reasons why guidance given to consumers differs between products that are, from a consumer perspective, similar. These could relate to differences in product formulation, use of preservatives, differences in packaging materials and design and so on. However, in many cases, differences may have arisen for historical reasons or as a result of decisions taken in isolation by individuals or organisations. It is hoped that this report will encourage a review of the products and information provided to consumers, and WRAP will be working with retailers, food manufacturers, trade associations, governments and the Food Standards Agency to continue to facilitate changes to the retail environment that will help reduce food waste. As in 2009, the project involved collecting a range of data on key product types thought to be representative of their category. Categories were chosen to reflect those where food wastage is highest. Full definitions of each product type, and how they compare to 2009, are found in Appendix 1. In summary, the 2011 products were: 1 Sliced white bread. 2 Plain white rolls. 3 World breads (plain white pittas, plain tortilla wraps, garlic or garlic and herb naans). 4 Standard tomato/original or tomato and herb pasta sauce. 5 Sliced ham. 6 Unsmoked back bacon. 7 Whole, skinless chicken breast fillets (chilled and frozen). 8 Fresh potatoes. 9 Braeburn apples. 10 Fresh carrots. 11 Bagged salad; iceberg/mixed salad. 12 Standard long-grain rice; dry and microwaveable variants. 13 Dry fusili pasta. 14 Chilled and frozen cottage pie ready meals. 15 Standard yoghurts. 16 Hen eggs. 17 Mature cheddar cheese. 18 Standard mayonnaise.
1 Helping Consumers Reduce Food Waste: A Retail Survey, WRAP, 2010

Helping Consumers Reduce Food Waste – A Retail Survey 2011 2
19 Semi-skimmed milk. 20 Chilled orange juice (added in 2011). Delivering the WRAP recommendations from the 2009 survey In addition to repeating the Retail Survey in 2011, and extending it to include a product from the drinks category (orange juice), WRAP committed to several other actions in the 2009 report. Firstly, to undertake research into how promotional strategies are deployed. In late 2011, WRAP published its review of how different promotional mechanics are used by the UK grocery sector (covering the period between 2007-2010), and a survey to investigate the link between promotions and food waste in the UK2. Secondly, to undertake research into how consumers understand and use date labels and storage guidance. A consumer insight report into this was published by WRAP in May 20113. There were several key findings from this research, most relevant to this work were:
The presence of a ‘display until’ date reduced understanding of both ‘best before’ and ‘use by’ dates – the proportion of people interpreting ‘use by’ as a quality mark rose from 25% to 32% when a ‘display until’ date was present and the proportion interpreting ‘best before’ as a safety date increased from 14% to 20% when a ‘display until’ date was present.
Although interpretation and use of date labels is driven principally by product type, the report revealed that the type of date label present on the pack does have an effect on behaviour, albeit to a lesser extent than product type. Swapping the ‘best before’ for a ‘use by’ on yoghurt caused the proportion of people who said they ‘would eat it up until the date on the label’ to rise, from 32% for yoghurt with ‘best before’ to 42% for yoghurt with ‘use by’. For cheese, those saying they ‘would eat it after the date label’ reduced from 75% for cheese with ‘best before’ to 69% for cheese with ‘use by’.
The majority of respondents selected that they would prefer to buy the product with a longer specified period to use the product after opening (‘use within x days’). For ham the increase was around 50% points preferring the longer date, for milk around 45% points and for ambient cooking sauce around 30% points.
Thirdly, to work with the food industry to investigate alternatives to ‘freeze on the day of purchase’ labelling. WRAP research4 showed that 90% of respondents regularly bought fresh or refrigerated food to freeze at home, with fresh meat, fish and bakery being the most common. 59% stated that they thought they had to freeze the product on the day they buy it, with half of these thinking that this is for food safety reasons. This behaviour is in-line with the majority of current on-pack guidance. WRAP’s research5 showed that on-pack guidance has a very strong influence on respondents’ willingness to freeze food. The proportion saying they would freeze it after the day they bought it greatly increased where a ‘freeze before/date mark’ was shown. For example, for bacon, the proportion indicating that they would freeze it ‘any time before the date on the label’ increased from 25% to 44% when the ‘freeze before / use by’ label was shown. For bread rolls the proportions increased from 13% to 29%. This indicates that many consumers (ca.35%) will make use of the flexibility alternative labelling gives them.
2 Investigation into the Possible Impact of Promotions on Food Waste, WRAP, 2011 3 Consumer Insight: Date Labels and Storage Guidance, WRAP, 2011 4 Understanding Consumer Use of the Freezer, WRAP, 2010 5 Consumer Insight: Date Labels and Storage Guidance, WRAP, 2011

Helping Consumers Reduce Food Waste – A Retail Survey 2011 3
Fourthly, WRAP committed to develop consumer-facing messaging demonstrating the benefits of packaging in helping to prevent household food waste. WRAP is currently working with Incpen, the Packaging Federation, BRC, FDF, together with Courtauld Commitment signatories to develop an approach to demonstrate to consumers the benefits of well-designed packaging in helping to prevent household food waste. The Love Food Hate Waste website also now includes consumer-focused case studies of how the food industry is helping customers waste less food, including some examples of packaging functionality6. Finally, it was recommended WRAP explore consumer perceptions of price gradients. It was thought that consumers may believe that all smaller packs come at a premium for products where this is not in fact the case, such as chicken (where a relatively gentle and unpronounced price gradient between the smallest and largest packs was seen). Price was investigated through WRAP’s earlier research7 in terms of consumers’ willingness to buy smaller packs. This suggested that consumers are not necessarily averse to paying a little more per unit of volume/weight to avoid being left with unnecessary surplus. Having said this, there was considerable variation in how much more respondents were willing to pay between products, and there were doubts as to how well ‘stated’ willingness to pay more would translate into actual purchase decisions. When interviewees who said they would not consider buying packs in alternative sizes were asked why, price was listed as a significant factor. Given the difficulties in accurately investigating consumers’ perceptions of price, and other areas of research being prioritised in discussions with industry, WRAP has not undertaken any further work on this. The 2011 Retail Survey suggests that price gradients remain an aspect of food retailing that could encourage consumers to buy more than they need (Section 3.3). For example, a steep, linear price gradient results in a strong incentive to buy bigger packs e.g. potatoes, orange juice, bacon and world breads. There was a high premium for the smallest examples of some packs e.g. carrots and bagged salad. As in 2009, both chilled and frozen chicken showed non-linear price gradients, indicating that consumers would be wrong to think that buying a larger pack always represents better value for this product, whilst bread showed pronounced price gradients between smaller and larger packs. Key developments since 2009 The 2011 Retail Survey reveals several major developments since 2009 that are in line with recommendations in the 2009 Retail Survey report and subsequent WRAP research (summarised above). This section details these key developments since 2009 as well as any significant developments that have taken place since the fieldwork. As summarised above, WRAP research8 found that consumers are better able to understand the ‘use by’ and ‘best before’ dates in the absence of ‘display until’ dates. The extent to which ‘display until’ dates are used has declined between 2009 and 2011, with 39% of products for which dates were recorded carrying a ‘display until’ date in the 2009 sample, and 29% carrying a ‘display until’ date in the 2011 sample9. It is worth stating that no instances of ‘sell by’ dates were found in 2011 (3 were found in 2009). For all retailers, there were categories in which no products were found with ‘display until’ dates at all (Section 7.2). As in 2009, continued use of ‘display until’ dates is driven by own-label products.
6 See: http://www.wrap.org.uk/downloads/Retailer_and_Brand_Case_Studies.06c14310.11392.pdf 7 Research into consumer behaviour in relation to food dates and portion sizes, WRAP, 2008 8 Consumer Insight: Date Labels and Storage Guidance, WRAP, 2011 9 This reduction becomes slightly smaller when the 2011 sample is weighted so that the proportion of different retailers in the sample matches that used in 2009. The proportion of products carrying a ‘display until’ date then becomes 32% in the 2011 sample. This still indicates a fairly substantial (7%) decrease in use of this type of date.
Helping Consumers Reduce Food Waste – A Retail Survey 2011 4
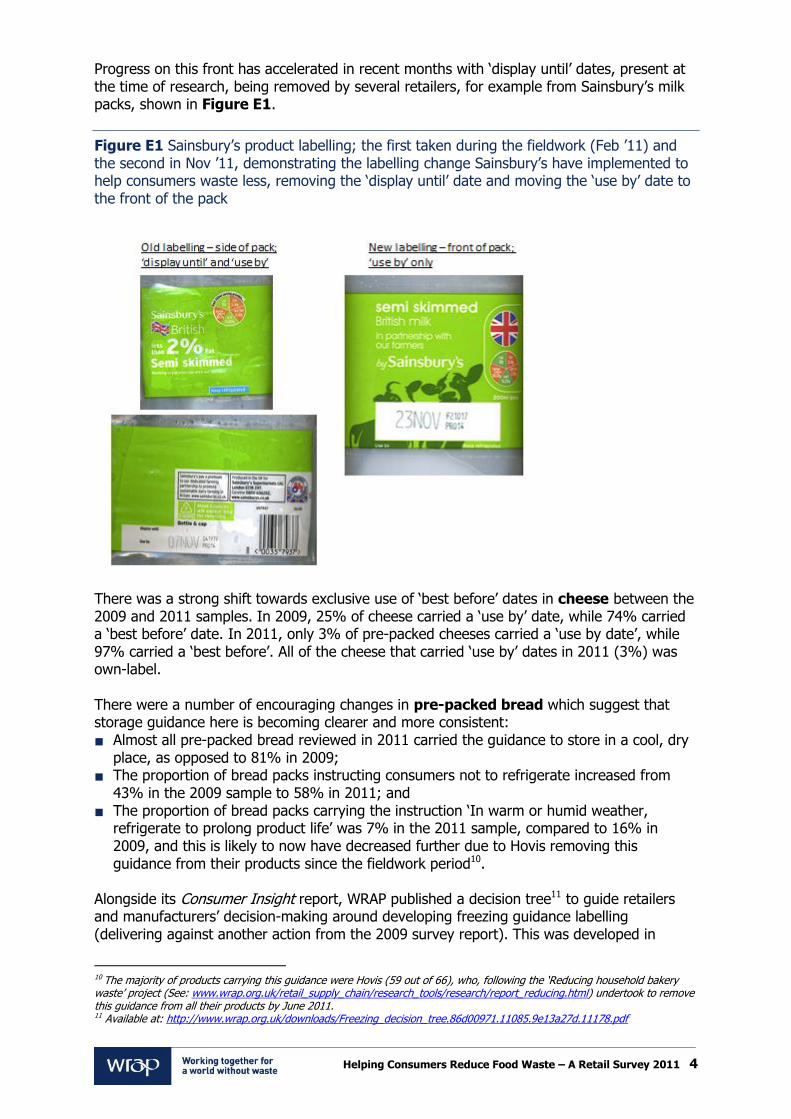
Progress on this front has accelerated in recent months with ‘display until’ dates, present at the time of research, being removed by several retailers, for example from Sainsbury’s milk packs, shown in Figure E1.
Figure E1 Sainsbury’s product labelling; the first taken during the fieldwork (Feb ’11) and the second in Nov ’11, demonstrating the labelling change Sainsbury’s have implemented to help consumers waste less, removing the ‘display until’ date and moving the ‘use by’ date to the front of the pack
There was a strong shift towards exclusive use of ‘best before’ dates in cheese between the 2009 and 2011 samples. In 2009, 25% of cheese carried a ‘use by’ date, while 74% carried a ‘best before’ date. In 2011, only 3% of pre-packed cheeses carried a ‘use by date’, while 97% carried a ‘best before’. All of the cheese that carried ‘use by’ dates in 2011 (3%) was own-label. There were a number of encouraging changes in pre-packed bread which suggest that storage guidance here is becoming clearer and more consistent:
Almost all pre-packed bread reviewed in 2011 carried the guidance to store in a cool, dry place, as opposed to 81% in 2009;
The proportion of bread packs instructing consumers not to refrigerate increased from 43% in the 2009 sample to 58% in 2011; and
The proportion of bread packs carrying the instruction ‘In warm or humid weather, refrigerate to prolong product life’ was 7% in the 2011 sample, compared to 16% in 2009, and this is likely to now have decreased further due to Hovis removing this guidance from their products since the fieldwork period10.
Alongside its Consumer Insight report, WRAP published a decision tree11 to guide retailers and manufacturers’ decision-making around developing freezing guidance labelling (delivering against another action from the 2009 survey report). This was developed in
10 The majority of products carrying this guidance were Hovis (59 out of 66), who, following the ‘Reducing household bakery waste’ project (See: www.wrap.org.uk/retail_supply_chain/research_tools/research/report_reducing.html) undertook to remove this guidance from all their products by June 2011. 11 Available at: http://www.wrap.org.uk/downloads/Freezing_decision_tree.86d00971.11085.9e13a27d.11178.pdf

Helping Consumers Reduce Food Waste – A Retail Survey 2011 5
conjunction with the Food Standards Agency (FSA) and has led to changes in freezing guidance labelling since the 2011 fieldwork was carried out. For example, M&S and Sainsbury’s now label products with a ‘Freeze by date mark shown’ message rather than to ‘Freeze on day of purchase’ (Figure E2).
Figure E2 New product labelling; the first taken during the fieldwork (Feb ’11) and the second in Nov ’11, demonstrating the labelling change implemented to help consumers waste less
WRAP is working with other retailers and manufacturers to embed the freezing decision tree into labelling practice and hopes others will follow M&S’s and Sainsbury’s lead. Other highlights:
Increased proportion of smaller packs for potatoes, milk, cooking sauce, world breads and bread rolls. For example, there was an increase in four packs of rolls to 32% of the sample (from a previous 18%). The proportion of two packs of rolls also increased, from 5% in the 2009 sample to 13% in 2011.

Helping Consumers Reduce Food Waste – A Retail Survey 2011 6
An example of a single breast pack of chilled chicken (none were found in 2009) (see Figure 2, main report).
High availability of loose apples, carrots and potatoes, across most store formats (loose products were found in 53 of 57 stores visited).
47% of all packaged products were re-closable in some way.
35% of cheese came in a re-closable pack, compared to 26% in the 2009 sample.
73% of standard dry rice packs were re-closable, compared to 44% of standard rice in the 2009 sample.
17% of chilled chicken packs reviewed in 2011 were re-closable, compared to only 5% of the sample in 2009.
Continued high proportion of on-pack storage guidance (96% of all packaged products). The introduction of Morrisons’ ‘best kept’ front of pack logo being a key development.
18% of ISB rolls carried storage guidance (n=42), compared to just 3% in the 2009 sample.
All deli ham carried storage guidance (n=33), including guidance to refrigerate.
16 of the 52 stores that sold loose produce (apples, carrots and potatoes) provided plastic bags for these products which carried on-bag storage guidance.
30% of pre-packed cheese carried guidance about using packaging or storage containers to keep the product fresh, which is a significant increase compared to the 6% of pre-packed cheese in the 2009 sample.
19% of pre-packed cheeses carried an on pack ‘flash’ label informing consumers that the pack is re-closable in order to keep the product fresher for longer.
44% of freezable products carried the snowflake logo, with 32% using accompanying text. Chilled naans had a very high prevalence of snowflake/star freezing symbols, with 90% of products carrying a symbol.
The majority (73%) of products which gave freezing guidance recommended how long the product could be kept frozen for. In most cases, this was either one month (81%) or three months (19%).
The proportion of chilled cooking sauces carrying freezing instructions increased between the samples, from 88% of packs in 2009, to 98% in 2011.
82% of products that require cooking, carried cooking guidance.
As in 2009, a number of chicken packs carried guidance on use of leftovers. 8% of packs of chilled chicken (all Waitrose) carried the guidance ‘Cool leftovers to room temperature, refrigerate within 2 hours and consume within 2 days’.
15% of products had a recipe on-pack (compared to just 8% in 2009).
65% of pasta packs carried portioning guidance (compared to 57% in 2009).
During the research, 252 examples of point of sale information that might help prevent food waste were noted including: online links, printed loose produce / deli bags, shelf edge labels and leaflets.
Areas for improvement Very few examples of packs of bagged salad under 100g were found (10% of 2011 sample, down from 14% of the 2009 sample). An increased proportion of branded bagged salad in the 2011 sample (34%, up from 25%) brought with it more larger, rather than smaller, packs with 15% of branded salad now falling in the 201-250g range. Only 2% of branded salads were found in each of the smallest size brackets (100g or less; 101 to 150g). Although the proportion of bagged salad split into smaller sections increased from 2% in 2009 to 9% in 2011. Despite regulatory changes which now allow for pre-packed bread in non-standard sizes, very few packs of bread were found in anything other than 400g or 800g sizes. There was a slight increase in availability of 400g loaves, from 28% to 35% between the two samples.

Helping Consumers Reduce Food Waste – A Retail Survey 2011 7
There were examples of steep, linear price gradients (£/kg), resulting in a strong incentive to buy bigger packs, e.g. for potatoes, orange juice, bacon and world breads. There was a high premium for the smallest packs of carrots and bagged salad. There was a high level of promotion on many products in the survey, for example:
51% of single yoghurts were associated with a promotion in 2011, and 93% of these promotions were multi-buy offers.
40% of multipack yoghurts were associated with a promotion, and 76% of these promotions were multi-buy offers.
38% of pre-packed ham was found to be on offer, a similar level to that found in the 2009 sample (36%). The majority of these were multi-buy within the product category (54%), although a reasonable proportion were cross category promotions (36%). Almost twice the proportion of own-brand pre-packed ham as branded was promoted (41% and 22% respectively).
30% of pre-packed apples were promoted, compared to 8% of all apples in 2009. The most frequent type of promotion was multi-buy (57%) evenly split within and between product categories. 40% of promotions on apples were temporary price reductions (TPR).
22% of pre-packed cheese and 11% of deli cheese were promoted in 2011, compared to 13% of all cheese in the 2009 sample.
23% of chicken was promoted in 2011, compared to 11% in 2009. As detailed in WRAP’s research12, retailers should be conscious of the potential for promotions to lead to food waste, their customers’ perception that promotions lead to food waste, and the needs of different types of household, and take this into consideration when planning promotional strategies, especially for perishable, short shelf life products (in terms of which type of promotion, product shelf life, pack sizes chosen etc.). Highlighting what can be frozen on-pack, providing freezing tips at the shelf edge alongside the promotional offer, maximising given shelf life, having clear date labelling, providing flexible meal plans and encouraging batch cooking / freezing (e.g. cook once eat twice) will all help ensure consumers get real value from a promotion rather than food ending up being thrown away. Figure E3 gives a recent example found in Sainsbury’s.
Figure E3 In-store communications to promote freezing extra items, bought on promotion
On packs of pasta, in contrast to rice, there appears to have been a decrease in re-closability, from 73% of the 2009 sample to 56% of the 2011 sample. There was a decrease
12 Investigation into the Possible Impact of Promotions on Food Waste, WRAP, 2011
Helping Consumers Reduce Food Waste – A Retail Survey 2011 8
in the number of packs of ham that were re-closable between 2009 (11%) and 2011. In 2009, 21% of rolls (including ISB rolls sold in packs) came in re-closable packs. In 2011 the proportion of packed rolls (including ISB rolls sold in packs) that were re-closable was 14%. If this functionality is not suitable for packs of pasta, promoting the use of food clips or of guidance advising that the product should be stored in an airtight container once opened is advised. On-pack storage guidance on where to keep potatoes in 2011 was quite varied. 18% said simply store somewhere dark, 17% somewhere cool and dry, 37% somewhere cool and dark, and 28% somewhere cool, dry AND dark. In line with WRAP’s research13 and guidance from the Potato Council, potato packs would ideally be consistently labelled ‘keep in a cool, dark place’. As in 2009, no pre-packed potatoes carried portion guidance. FSA guidance states that where specific temperature guidance is given, for products to be
stored in the fridge, this guidance should be ‘below 5C’. 31% of chilled products specified a temperature or range of temperatures at which the products should be kept. The vast majority (81%) of these products carried guidance conforming to the FSA standard.
30% of instances of this guidance on chilled products stated specifically that the product
should be stored ‘below 5C’.
The remaining 70% gave a range of temperatures, of which 5C was the top of range
value, e.g. ‘store at 0-5C’ or ‘store at between 2 and 5C’.
As in 2009, storage guidance for eggs was quite consistent. 98% of eggs reviewed carried guidance to refrigerate. However, 48 packs of eggs (9%) suggested ‘Store in a cool, dry place OR keep refrigerated’. The presence of storage guidance on ISB bread was a lot lower than that found in the 2009 sample, at 14% compared to 55%. The proportion of ISB bread carrying freezing guidance also fell from 28% to 1% between 2009 and 2011. For ISB rolls, however, this trend was reversed: while none carried freezing guidance in 2009, 7% did so in 2011. This suggests that there is scope to substantially increase the prevalence of freezing guidance on ISB products. The proportion of bread giving freezing guidance had decreased between the two samples from 91% in 2009 to 82% in 2011. For most of the other freezable products, there had been no increase (or decrease) with just 63% of all freezable products carrying freezing guidance and 45% carrying defrosting guidance (i.e. not all freezing guidance was accompanied with defrosting guidance). The number of milk packs carrying snowflake/star freezing symbols doubled from 4% of the 2009 sample to 8% in 2011, despite the proportion of products carrying freezing guidance remaining constant between the two samples (24%) and 12% of milk packs stating that they were not suitable for freezing. Still the most common form of freezing guidance was ‘freeze on day of purchase’ (79%). (Changes such as those detailed in Figure E2 are subsequent to the fieldwork being carried out and so are not reflected in this data.) A higher proportion of bread packs in 2011 stated they needed to be used within just 1 month of freezing than in 2009 (31% and 28%). Nearly all chilled chicken (96%) reviewed in 2011 carried guidance to use within one month of freezing, compared to 76% in 2009.
13 Reducing supply chain and consumer potato waste, WRAP, 2012
Helping Consumers Reduce Food Waste – A Retail Survey 2011 9
The proportion of chilled cooking sauces carrying guidance to use within one month of freezing increased from 87% in 2009 to 97% in the 2011 sample. Where this guidance was given for chicken and chilled cooking sauces, consumers were always given one month to use these products (in 2009 as in 2011). Increases in the prevalence of guidance to ‘use within one month of freezing’ between 2009 and 2011, therefore, reflect an overall increase in use of this type of guidance for these products, rather than a shortening of the amount of time consumers are being given. In 2011, 25% of all yoghurts (both single and multipack) displayed guidance not to freeze. 6% of yoghurts in 2011 employed a crossed out snowflake symbol alongside this guidance. 12% of milk packs stated that they were not suitable for freezing, despite the fact that milk is a freezable product, and 24% of milk packs did carry freezing guidance. 4% of orange juice advised against freezing, again despite being a freezable product, with 19% of packs surveyed carrying freezing guidance. In addition to the snowflake logo, several other, potentially confusing logos were noted e.g.
crossed out snowflake to mean both do not freeze and do not refreeze;
snowflake logos to mean keep refrigerated and keep frozen;
polar bears to highlight defrosting guidance; and
igloos to mean suitable for freezing. In contrast to the increased consistency of date type within cheese, noted above, the proportions of ‘use by’ and ‘best before’ dates on yoghurts were similar in the 2009 and 2011 samples – 77% and 76% carried a ‘use by’ date, respectively, compared to 23% and 24%, which carried a ‘best before’ date. Only branded pots of yoghurt, both single (69% of branded) and multipack (21% of branded), carried ‘best before’ dates in 2011. A worked example, developed by Dairy UK, for yoghurt was included in the Defra decision tree14, to support decision-making around which date type to use on products. Guidance such as ‘Do not exceed the use by date’ is helpful to consumers and reinforces the message that ‘use by’ dates are about safety. It was found on 27% of products which carried a ‘use by’ date in the 2011 sample. Guidance not to exceed the date was also found on some products which carried a ‘best before’ date. This is not helpful to consumers, as it effectively converts a ‘best before’ date into a ‘use by’ date, and is likely to confuse consumers and prompt them to think of ‘best before’ dates as safety dates, when in fact they refer to food quality. This guidance was found on 8% of products which carried a ‘best before’ date in the 2011 sample. One category particularly stands out; it was found on over a quarter (28%) of cheese, which in some ways negates the general shift towards use of ‘best before’ rather than ‘use by’ type dates on this product. Summary of progress since 2009 Table E1 compares progress against the industry recommendations WRAP made in the last survey report.
14 Guidance on the application of date labels to food, Defra, 2011. Available at: http://www.defra.gov.uk/publications/2011/09/15/pb13629-food-labels
Helping Consumers Reduce Food Waste – A Retail Survey 2011 10
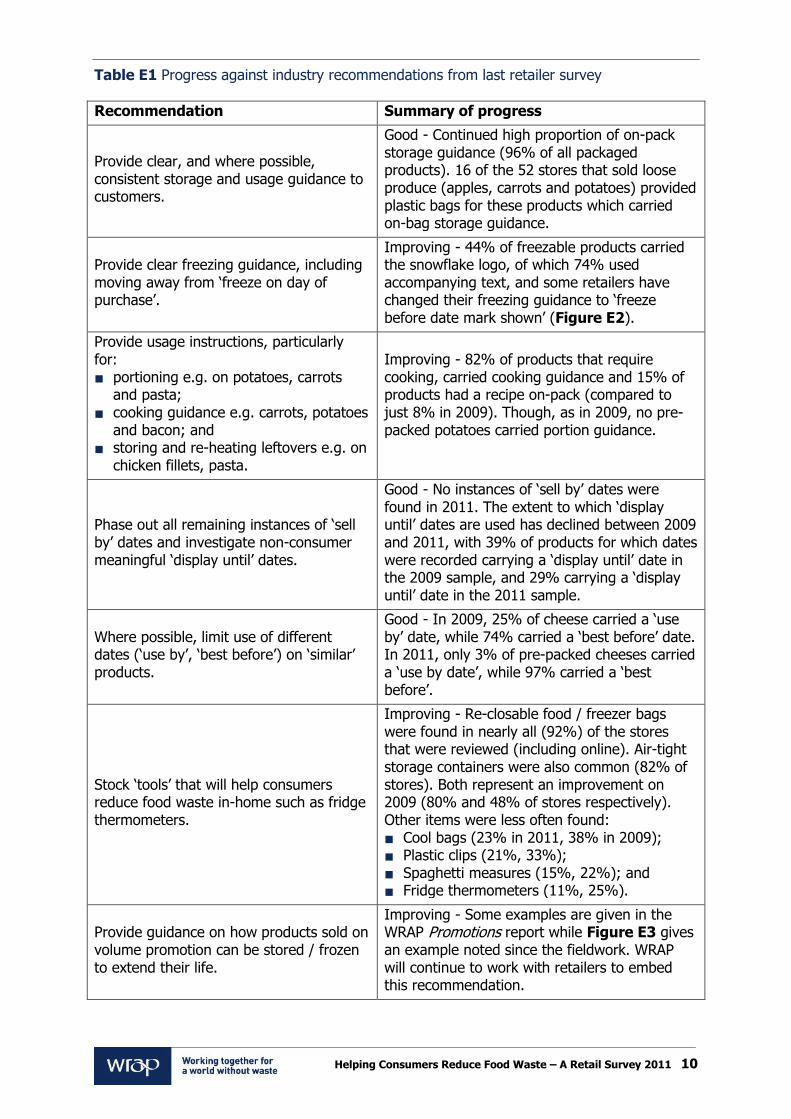
Table E1 Progress against industry recommendations from last retailer survey
Recommendation Summary of progress
Provide clear, and where possible, consistent storage and usage guidance to customers.
Good - Continued high proportion of on-pack storage guidance (96% of all packaged products). 16 of the 52 stores that sold loose produce (apples, carrots and potatoes) provided plastic bags for these products which carried on-bag storage guidance.
Provide clear freezing guidance, including moving away from ‘freeze on day of purchase’.
Improving - 44% of freezable products carried the snowflake logo, of which 74% used accompanying text, and some retailers have changed their freezing guidance to ‘freeze before date mark shown’ (Figure E2).
Provide usage instructions, particularly for:
portioning e.g. on potatoes, carrots and pasta;
cooking guidance e.g. carrots, potatoes and bacon; and
storing and re-heating leftovers e.g. on chicken fillets, pasta.
Improving - 82% of products that require cooking, carried cooking guidance and 15% of products had a recipe on-pack (compared to just 8% in 2009). Though, as in 2009, no pre-packed potatoes carried portion guidance.
Phase out all remaining instances of ‘sell by’ dates and investigate non-consumer meaningful ‘display until’ dates.
Good - No instances of ‘sell by’ dates were found in 2011. The extent to which ‘display until’ dates are used has declined between 2009 and 2011, with 39% of products for which dates were recorded carrying a ‘display until’ date in the 2009 sample, and 29% carrying a ‘display until’ date in the 2011 sample.
Where possible, limit use of different dates (‘use by’, ‘best before’) on ‘similar’ products.
Good - In 2009, 25% of cheese carried a ‘use by’ date, while 74% carried a ‘best before’ date. In 2011, only 3% of pre-packed cheeses carried a ‘use by date’, while 97% carried a ‘best before’.
Stock ‘tools’ that will help consumers reduce food waste in-home such as fridge thermometers.
Improving - Re-closable food / freezer bags were found in nearly all (92%) of the stores that were reviewed (including online). Air-tight storage containers were also common (82% of stores). Both represent an improvement on 2009 (80% and 48% of stores respectively). Other items were less often found:
Cool bags (23% in 2011, 38% in 2009);
Plastic clips (21%, 33%);
Spaghetti measures (15%, 22%); and
Fridge thermometers (11%, 25%).
Provide guidance on how products sold on volume promotion can be stored / frozen to extend their life.
Improving - Some examples are given in the WRAP Promotions report while Figure E3 gives an example noted since the fieldwork. WRAP will continue to work with retailers to embed this recommendation.

Helping Consumers Reduce Food Waste – A Retail Survey 2011 11
Recommendations from 2011 survey On the basis of the insights from this 2011 data collection exercise, WRAP is keen to work with the food industry to:
Continue the excellent progress to remove ‘display until’ dates, and to increase consistency of ‘use by’ or ‘best before’ date type use within a product category, where appropriate.
Increase use of storage guidance that reinforces what the ‘use by’ date means e.g. ‘Do not exceed use by date’ and decrease similar advice for ‘best before’ date products.
Increase proportion of freezable products that carry freezing and defrosting guidance. Highlight this on the front of pack where possible using the snowflake logo, and consider how to amplify this type of guidance during a volume promotion.
Increase use of alternative freezing guidance, and communicate these changes to customers e.g. using the ‘Freeze before / date mark’ label rather than stating to ‘Freeze on day of purchase’.
Reduce use of the snowflake logo to indicate anything other than ‘suitable for home freezing’. Reduce use of other logos to indicate products can be frozen.
Continue to provide clear storage guidance that is consistent within a product category, where appropriate, for both packed and loose formats.
Follow FSA recommended ‘keep refrigerated below 5oC’ where fridge temperature guidance is stated on-pack.
Extend shelf life where possible (without reducing quality or increasing food safety risks):
Extend the ‘best before’ or ‘use by’ date.
Extend ‘Use within x days of opening’.
Extend ‘Use within x months of freezing’.
Continue to provide cooking and portioning information on-pack, and develop pack functionality that aids portioning and extends open shelf life e.g. by being re-closable.
Continue improvements in availability of smaller pack sizes / loose variants, where appropriate. Where it is not possible to provide smaller packs, investigate how to provide guidance on optimising storage, freezing and using leftovers.
Increase the provision and accessibility of tools that help prevent food waste in the home e.g. air-tight storage containers and bag clips, for example, signposting to them from the relevant fixtures.
Use Love Food Hate Waste materials to raise awareness of the benefits of reducing food waste and engaging consumers to act. Continue to use existing communication channels to raise awareness of the benefits (both financial and environmental) of reducing food waste, and provide tips / guidance to optimise in-home storage and food use e.g. through recipes.
WRAP will continue to provide updated guidance documents and support to industry to help implement recommendations. Suggested further research / next steps 1. Investigate the optimum approach to date labelling for fresh produce - In 2011, 10% of pre-packed apples, 16% of pre-packed potatoes and 18% of pre-packed carrots carried a ‘display until’ date only (i.e. no ‘best before’ date) while 4% of carrots and potatoes and 36% of apples carried no date at all. WRAP investigated consumer preference with regards date type on fresh produce through its Consumer Insight project but the findings were not conclusive. In the short-term, the food industry is encouraged to simplify the approach to labelling fruit & vegetables in line with the main recommendations from that study. They are also encouraged to extend shelf life where possible (particularly in line with seasonality), and reinforce optimum storage guidance and the meaning of the date labels. It is suggested that

Helping Consumers Reduce Food Waste – A Retail Survey 2011 12
further in-store trials are conducted to determine the optimum approach to date labelling for fresh fruit and vegetables, and any impact on wastage in-store and at home. 2. Discuss initial findings (Box E1) relating to which factors influence given life15 and open life16 with the food industry to determine where the greatest potential to safely extend shelf life to reduce food waste exists and how this would be best approached.
Box E1 – Initial findings (discussed in Section 8) suggest there can be substantial variation in given lives within a particular product category. Variables which seemed to be most important in differences in given life were:
The supermarket/retailer selling the product;
The particular brand;
The range of own label products (e.g. premium, standard, value); and
Whether a product was on promotion. Regarding open shelf life, there appeared to be a trend, on average across the products, towards an increased proportion of products having ‘once opened’ guidance, and towards shorter recommended open lives. Again, in most cases, open life was longer for branded
than for own-label products.
3. Continue to develop relevant messages and materials through Love Food Hate Waste that can be used by industry to communicate to customers.
4. Continue to recognise progress, good practice and areas for improvement by repeating the Retail Survey in early 2013 to review changes to the retail environment since 2011.
15 The number of days between the date a product is audited (purchased in store or received from an online order) and the ‘use-by’ or ‘best before’ date (or ‘display until’ date where that is the only date present). 16 The number of days given to the consumer to eat the product once it has been opened, as according to instructions on the packaging: ‘use within x days’.
Helping Consumers Reduce Food Waste – A Retail Survey 2011 13
Contents
1.0 Introduction ............................................................................................... 17 1.1 Background to this study .......................................................................... 17 1.2 What data were collected? ........................................................................ 17 1.3 How to use this report .............................................................................. 21
2.0 Methods ...................................................................................................... 22 2.1 Key data collected .................................................................................... 22 2.2 Changes to what data were collected since 2009 ........................................ 22 2.3 A note on comparisons between 2009 and 2011 ......................................... 23 2.4 Where were the data collected? ................................................................ 23 2.5 How were the data collected? ................................................................... 25 2.6 Analysis ................................................................................................... 25
3.0 Pack size range, availability, pack features and price ................................ 26 3.1 Pack size range ........................................................................................ 26
3.1.1 A note about the interplay of pack size and food management........... 26 3.1.2 Products for which consumers had a limited choice of pack size ......... 26 3.1.3 Products for which pack size is less of an issue ................................. 27 3.1.4 Apparent improvements in availability of pack size ............................ 29 3.1.5 New pack sizes appearing in the sample .......................................... 29 3.1.6 Products where there is an opportunity to develop smaller pack sizes . 30
3.2 Availability of deli / loose products ............................................................. 31 3.3 Price gradients ......................................................................................... 32
3.3.1 Steep linear price gradients............................................................. 33 3.3.2 High premium for smallest pack ...................................................... 33 3.3.3 Unclear or non-linear price gradients ............................................... 34
3.4 Pack functionality ..................................................................................... 34 3.4.1 Some excellent examples of pack functionality.................................. 34 3.4.2 Potential to improve product life through pack functionality ............... 38
4.0 Promotions ................................................................................................. 39 4.1 General landscape of promotions ............................................................... 39 4.2 Differences between promotions in 2009 and 2011 ..................................... 39
4.2.1 Highly promoted product categories in both 2009 and 2011 samples .. 39 4.2.2 Products found to be promoted more in the 2011 sample .................. 40 4.2.3 Products less promoted than in 2009 ............................................... 41
4.3 Influence of pack volume on promotions .................................................... 41 5.0 Storage guidance ........................................................................................ 42
5.1 Presence of guidance and guidance given .................................................. 42 5.1.1 Headline examples of good or improved guidance............................. 42 5.1.2 Guidance which could be improved .................................................. 43 5.1.3 Encouraging consumers to re-close the pack .................................... 44 5.1.4 Guidance on deli / loose / ISB products ........................................... 44
5.2 Fridge temperature guidance .................................................................... 45 5.2.1 Product categories found to carry specific temperature guidance ....... 46 5.2.2 Temperature values given............................................................... 46 5.2.3 Product categories largely in line with FSA temperature guidelines ..... 47 5.2.4 Product categories with guidance varying from FSA guidelines ........... 48
5.3 Use of on pack ‘flash’ – storage guidance ................................................... 48 5.4 Retail environment in which products are stored ......................................... 50
6.0 Freezing and defrosting guidance .............................................................. 51 6.1 Freezability of products ............................................................................. 51 6.2 Presence of guidance ............................................................................... 51
6.2.1 Presence of freezing guidance in 2009 and 2011 .............................. 52
Helping Consumers Reduce Food Waste – A Retail Survey 2011 14
6.2.2 Presence of defrosting guidance in 2011 .......................................... 52 6.2.3 Presence of guidance on loose / deli products .................................. 53
6.3 Freezing guidance given in 2011 ............................................................... 54 6.3.1 Guidance on when to freeze ........................................................... 54 6.3.2 Guidance on how long to freeze ...................................................... 55 6.3.3 Freezer star marking guidance ........................................................ 58
6.4 Use of on pack ‘flash’ – freezing guidance .................................................. 59 6.5 Freezing symbols ..................................................................................... 59
6.5.1 Use of snowflake logo .................................................................... 59 6.5.2 Use of snowflake logo to denote refrigeration guidance ..................... 62 6.5.3 Other freezing symbols found ......................................................... 63 6.5.4 Use of symbols on frozen products .................................................. 65
6.6 Warning not to freeze ............................................................................... 65 6.7 How to defrost / use ................................................................................ 67 6.8 Guidance not to refreeze .......................................................................... 69
7.0 Date labels .................................................................................................. 70 7.1 Use of ‘best before’ and ‘use by’ ................................................................ 70
7.1.1 Product specific examples ............................................................... 73 7.1.2 ‘Other’ types of date ....................................................................... 74
7.2 Use of ‘display until’ ................................................................................. 74 7.2.1 Use of only ‘display until’ date, or no date ........................................ 77
7.3 Reference to ‘best before’ or ‘use by’ in storage guidance ............................ 78 8.0 Shelf life ..................................................................................................... 81
8.1 Given life ................................................................................................. 83 8.1.1 Comparison of branded and own-label products ............................... 86 8.1.2 Impact of date type ....................................................................... 88 8.1.3 Other factors influencing given life .................................................. 89
8.2 Open life ................................................................................................. 90 8.2.1 Changes in open life since 2009 ...................................................... 91 8.2.2 Comparison of branded and own-label products ............................... 91 8.2.3 Other factors of influence on open life ............................................. 92
8.3 Given shelf life according to the ‘display until’ date ..................................... 92 9.0 Cooking and portioning guidance ............................................................... 94
9.1 Presence of cooking guidance ................................................................... 94 9.2 Presence of recipes .................................................................................. 94 9.3 Presence of portioning guidance ................................................................ 95 9.4 Tips ........................................................................................................ 99
10.0 Point of sale information .......................................................................... 100 10.1 Online links ............................................................................................ 100 10.2 Extra information on loose bags .............................................................. 100 10.3 Shelf edge labels .................................................................................... 101 10.4 Leaflets, e.g. recipe cards ....................................................................... 101 10.5 Banners ................................................................................................ 102 10.6 Availability of tools to help prevent consumer food waste .......................... 102
11.0 Closing remarks ........................................................................................ 104 11.1 Key developments since 2009 ................................................................. 104 11.2 Recommendations for industry ................................................................ 105
Appendix 1 – Product category scope 2009 - 2011 ............................................ 106 Appendix 2 - Data collection methodology ......................................................... 109

Helping Consumers Reduce Food Waste – A Retail Survey 2011 15
Glossary
BAH – bake at home – part baked bread or bread rolls for consumers to finish cooking in the home.
‘Best before’ dates – the date of minimum durability of a food, until which the foodstuff retains its specific properties when properly stored. Refers to quality rather than food safety. When the date is passed, the food won’t be unsafe but might begin to lose its flavour and texture.
BOGOF – buy one get one free promotion – applies to identical items only.
Freezable – products which commonly carry freezing guidance, and which can be home frozen and defrosted without quality change.
FODOP – freeze on day of purchase – an abbreviation of the common freezing guidance.
Given shelf life – the number of days between the date a product is audited (purchased in store or received from an online order) and the ‘use-by’ or ‘best before’ date (or ‘display until’ date where that is the only date present).
ISB – in-store bakery – products baked in-store and packaged or sold loose.
MAP - modified atmosphere packaging e.g. pack states ‘packed in protective atmosphere’.
Multi-buy – promotion where more than one of a product is within the promotion either another of the same product or another within the category (e.g. buy any two from the sliced meat range for £x).
On pack ‘flash’ – prominent logo or consumer instruction (e.g. to freeze the product).
Open shelf life – the number of days given to the consumer to eat the product once it has been opened, as according to instructions on the packaging: ‘use within x days’.
Packed product – any product sold in a pack which determines the amount of product a consumer can buy. Includes packaged ISB goods, but excludes loose or deli products.
Pre-packed product – used here in reference to bread and rolls to distinguish them from ISB, deli or loose goods.
Price gradient – describes the correlation between pack price and pack size.
POS – point of sale – communication material displayed at the point of sale e.g. shelf edge labels, recipe cards.
Product category – description of each product type reviewed in this research, see Appendix 1 for details.
Shelf life – the period of time for which a product remains safe and meets its quality specifications under expected storage and use. The shelf life determines the durability date and is expressed as a ‘use by’ or ‘best before’ date on a product17.
SKU – stock keeping unit – a unique product.
Store fascia – type of store e.g. supermarket, convenience / local store or online.
TPR – temporary price reduction promotion.
‘Use by’ dates – In the case of food which, from the microbiological point of view, are highly perishable and are therefore likely after a short period to constitute an immediate danger to human health, the date of minimum durability (‘best before’ date) is replaced by the ‘use by’ date. Food can be eaten up to the end of the ‘use by’ date, but not after even if it looks and smells fine.
17 As described in Articles 9 and 10 of Directive 2000/13/EC. (Source: EC guidance on Listeria monocytogenes shelf life studies for ready-to-eat foods, under Regulation (EC) No 2073/2005).

Helping Consumers Reduce Food Waste – A Retail Survey 2011 16
A note about use of ‘base’ and ‘n’ in this document Throughout this report, the terms ‘base’ and ‘n’ are used to quantify figures in tables. These terms are not interchangeable, and in this report they are used as follows:
Base - the number of relevant samples from which percentages are drawn; and
Frequency (expressed in shorthand as 'n=') or the number of occurrences.
So if the base is 100, and a feature is found on 30% of packs, n=30. The term 'Total base' is used where row percentages (individually ‘based’ figures) are nested within a larger table (e.g. 30% of pre-packed bread carried x feature, while 10% of ISB bread did, etc.). The total base is used to express the overall number of relevant samples which the information in the table is drawn from.
Acknowledgements
With particular thanks the staff of all the major UK retailers who enabled our field workers to undertake in-store survey work and to our field workers who collected all the data for analysis. WRAP also wishes to thank the Brook Lyndhurst research team: David Fell, Michael Fernandez, Sara Giorgi, Ruth Townend, Margot Tong and Susie Stevenson.

Helping Consumers Reduce Food Waste – A Retail Survey 2011 17
1.0 Introduction 1.1 Background to this study In 2009, WRAP published Household Food and Drink Waste in the UK18. This found that ca. 8.3 million tonnes of food and drink is thrown away each year in the UK (22% of all the food and drink purchased) and 5.3 million tonnes of this could have been eaten. WRAP announced a reduction in total household food and drink waste of 1.1 million tonnes in November 201119. Consumer’s knowledge and understanding of how to store and use foods in the home will influence the amount of food waste. Similarly, availability of, and incentives to buy, appropriately sized packs of food can prevent or lead to wastage. Many decisions about what guidance is available to consumers with respect to storage and use of foods, and decisions about the availability of different pack sizes, are in the hands of retailers and manufacturers. This research provides a snapshot of relevant aspects of the retail industry at a particular point in time. It seeks to inform WRAP’s work with retailers and manufacturers through the Courtauld Commitment20, in order to enable change and widespread adoption of good practice, with the aim of reducing consumer food waste. In early 2011, Brook Lyndhurst set out to review the labelling and packaging of key products in the UK retail sector. Data were collected on some 12,000 products, in twenty product categories, stocked by ten major retailers across the UK. This work was a repeat of a data collection exercise conducted by Brook Lyndhurst and ESA in 2009, which looked at approximately 10,000 products, split into nineteen product categories. This report summarises the key findings from the 2011 research, creating a new baseline from which changes in the UK retail environment may be measured. Where comparable data existed, this report documents change, or lack of change, since 2009. 1.2 What data were collected? Data were collected on twenty key product categories, which are listed below. The product categories in 2011 were broadly consistent with 2009, although minor adjustments were made to reflect WRAP’s areas of interest, as well as lessons learned about the practicalities of the data collection process in the course of the 2009 research. Product categories in 2009 had been selected on the basis that WRAP’s research21 had shown them to be high waste categories, and included an understanding of which food types are most commonly discarded, and in what state (e.g. whole, unopened, opened but uncooked, leftover etc.). An additional category, chilled orange juice, was added to the sample in 2011. This addition reflects the fact that fruit juice is very commonly wasted, and has some of the same challenges (in terms of storage / freezing guidance) as other chilled food products. Full details of all twenty product categories, including a description of the new category and details of the original nineteen categories, as well as any modifications for the 2011 research, can be found in Appendix 1. A summary of the 2011 categories can be found in Table 1.
18 Household Food and Drink Waste in the UK, WRAP, 2009. 19 New estimates for household food and drink waste in the UK, WRAP, 2011. Available at: www.wrap.org.uk/hhfwfacts 20 See: http://www.wrap.org.uk/retail_supply_chain/voluntary_agreements/courtauld_commitment/index.html 21 Household Food and Drink Waste in the UK, WRAP, 2009
Helping Consumers Reduce Food Waste – A Retail Survey 2011 18
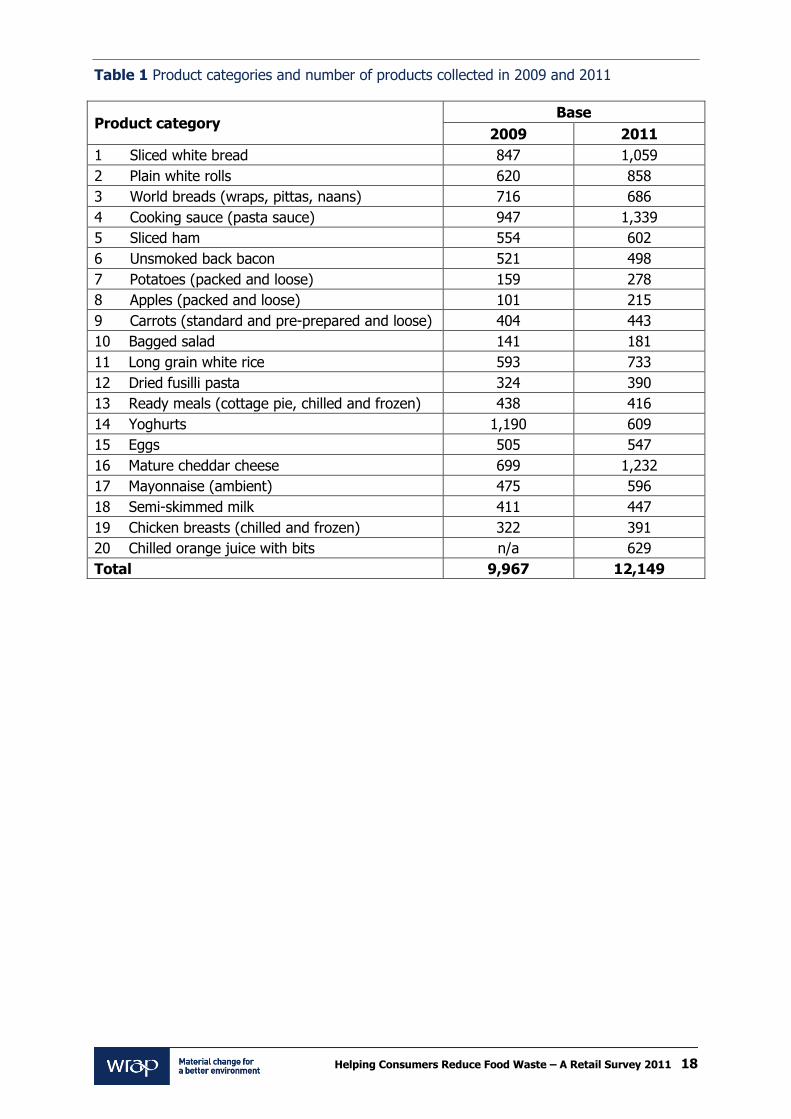
Table 1 Product categories and number of products collected in 2009 and 2011
Product category Base
2009 2011
1 Sliced white bread 847 1,059
2 Plain white rolls 620 858
3 World breads (wraps, pittas, naans) 716 686
4 Cooking sauce (pasta sauce) 947 1,339
5 Sliced ham 554 602
6 Unsmoked back bacon 521 498
7 Potatoes (packed and loose) 159 278
8 Apples (packed and loose) 101 215
9 Carrots (standard and pre-prepared and loose) 404 443
10 Bagged salad 141 181
11 Long grain white rice 593 733
12 Dried fusilli pasta 324 390
13 Ready meals (cottage pie, chilled and frozen) 438 416
14 Yoghurts 1,190 609
15 Eggs 505 547
16 Mature cheddar cheese 699 1,232
17 Mayonnaise (ambient) 475 596
18 Semi-skimmed milk 411 447
19 Chicken breasts (chilled and frozen) 322 391
20 Chilled orange juice with bits n/a 629
Total 9,967 12,149

Helping Consumers Reduce Food Waste – A Retail Survey 2011 19
1.2.1 Sub-categories A number of product categories were further split into sub-categories, which sometimes reflect differences in the format of a product, e.g. yoghurts – single and multipack, and sometimes reflect deeper splits in the category, e.g. chicken – chilled or frozen, or world breads – pittas, wraps, naans. Table 2 details the sub-categories into which products were split, and lists the numbers reviewed in each sub-category.
Table 2 Number of products reviewed in each category or sub-category, 2011 | Base: 12,149
Product category Sub-category Base
Bread Pre-packed 882
ISB 177
Rolls Pre-packed 624
ISB 234
World bread Pittas 193
Wraps 290
Naans – ambient 172
Naan – chilled 31
Cooking sauce Chilled 98
Ambient 1,241
Ham Pre-packed 569
Deli 33
Bacon Pre-packed 486
Deli 12
Potatoes Pre-packed 257
Loose 21
Apples Pre-packed 146
Loose 69
Carrots Standard 304
Standard – loose 47
Pre-prepared 92
Rice Standard dry 578
Pre-cooked – microwavable 155
Ready meals Chilled 328
Frozen 88
Yoghurt Single 286
Multipack 323
Cheese Pre-packed 1,186
Deli 46
Chicken Frozen 78
Chilled 313
Total 12,149
In 2011, all retailers surveyed carried both branded and own-label ranges. The proportion of own-label to branded products varied from retailer to retailer and from product category to product category (see Table 3). In the sample of all packed products reviewed, 44% were branded while 56% were own-label.

Helping Consumers Reduce Food Waste – A Retail Survey 2011 20
Table 3 % packed products, by category, by own-label or branded, 2011 | Total base: 11,875
Retailer Product origin
Bre
ad
Rolls
World
bre
ads
Cookin
g
sauce
Ham
Baco
n
Pota
toes
Apple
s
Carr
ots
Sala
d
Ric
e
Past
a
Ready
meals
Yoghurt
s
Eggs
Cheese
Mayonnai
se
Milk
Chic
ken
Ora
nge
juic
e
To
tal
Aldi
Branded 100% 100% 100% 100% 77% 100% 75% 50% 88% 100% 100% 100% 100% 100% 100% 100% 100% 100% 88%
Own-label 23% 100% 100% 25% 50% 13% 12%
Asda
Branded 79% 26% 51% 78% 9% 23% 9% 41% 47% 51% 11% 63% 58% 59% 66% 30% 10% 43% 45%
Own-label 21% 74% 49% 22% 100% 91% 77% 100% 91% 59% 53% 49% 89% 37% 42% 41% 34% 70% 90% 57% 55%
Co-op
Branded 66% 45% 62% 80% 7% 10% 43% 33% 24% 61% 18% 36% 72% 23% 6% 55% 45%
Own-label 34% 55% 38% 20% 93% 90% 100% 100% 100% 100% 57% 67% 76% 39% 82% 64% 28% 77% 94% 45% 55%
Lidl
Branded 100% 100% 100% 100% 100% 100% 100% 50% 100%
88% 100% 100% 100% 33% 100% 100% 100% 100% 100% 93%
Own-label
50%
13%
67%
7%
M&S
Branded
45%
2%
Own-label 100% 100% 100% 100% 100% 100% 100% 100% 100% 100% 100% 100% 100% 100% 100% 100% 55% 100% 100% 100% 98%
Morrisons
Branded 55% 19% 55% 75% 10% 24%
2% 34% 55% 32% 22% 63% 39% 55% 66% 35% 11% 49% 43%
Own-label 45% 81% 45% 25% 90% 76% 100% 100% 98% 66% 45% 68% 78% 38% 61% 45% 34% 65% 89% 51% 57%
Ocado
Branded 64% 14% 60% 83% 29% 33% 60% 63% 64% 59% 36% 48% 75% 43% 55% 52%
Own-label 36% 86% 40% 17% 71% 67% 100% 100% 100% 100% 40% 38% 36% 41% 64% 52% 25% 57% 100% 45% 48%
Sainsbury's
Branded 61% 18% 47% 76% 4% 25% 4% 56% 56% 40% 27% 86% 43% 50% 64% 34% 4% 50% 44%
Own-label 39% 82% 53% 24% 96% 75% 96% 100% 100% 44% 44% 60% 73% 14% 57% 50% 36% 66% 96% 50% 56%
Tesco
Branded 53% 31% 42% 72% 19% 27% 3% 62% 53% 54% 28% 58% 42% 52% 62% 17% 13% 48% 44%
Own-label 47% 69% 58% 28% 81% 73% 100% 100% 97% 38% 47% 46% 72% 42% 58% 48% 38% 83% 87% 52% 56%
Waitrose
Branded 48% 36% 55% 76% 12% 16% 7% 56% 48% 31% 61% 37% 49% 69% 37% 58% 45%
Own-label 52% 64% 45% 24% 88% 84% 93% 100% 100% 100% 44% 52% 69% 39% 63% 51% 31% 63% 100% 42% 55%
Total
Branded 60% 26% 48% 75% 12% 22% 9% 1% 5% 34% 52% 46% 24% 61% 42% 51% 65% 28% 10% 47% 44%
Own-label 40% 74% 52% 25% 88% 78% 91% 99% 95% 66% 48% 54% 76% 39% 58% 49% 35% 72% 90% 53% 56%

Helping Consumers Reduce Food Waste – A Retail Survey 2011 21
1.2.2 Range Products were categorised as ‘premium own-label’, ‘standard own-label’, ‘value own-label’ or branded. Figure 1 details the relative proportions of each, found in the 2011 research.
Figure 1 Proportion of packed products in different ranges carried by supermarkets, 2011
1.2.3 Fascia Stores reviewed fell into three store fascias (defined by the project team) supermarket / hypermarket, convenience or online. Table 4 details the split of products collected across the store fascias.
Table 4 Store fascia, all products, 2011 | Base: 10,10122
Store fascia Frequency %
Supermarket/hypermarket 7,279 72%
Convenience 1,688 17%
Online 1,134 11%
1.3 How to use this report This report is a summary of extensive sub-category specific analysis of the data collected. It contains what were considered the most interesting outcomes of the research, alongside key comparisons, where possible, to data from the 2009 survey. The information in the report is arranged thematically under eight headings:
Pack size and price incentives, pack features and format;
Promotions;
Storage guidance;
Freezing and defrosting guidance;
Date labels;
Given and open shelf life;
Cooking and portioning guidance; and
Point of sale information.
Where reference is made to a specific product category or sub-category, the name of that category is picked out in bold, so that in skimming the report a reader may pick up on categories they are interested in.
22 Store fascia information was not available for 2,048 products as these were proxy data.
10%
39%
8%
43%
Range, 2011: Base: 11,875
Premium own label(n= 1134)
Standard own label(n= 4588)
Value own label(n= 983)
Branded(n= 5170)

Helping Consumers Reduce Food Waste – A Retail Survey 2011 22
2.0 Methods 2.1 Key data collected The key data collected on each product surveyed, were as follows:
Type and details of dates displayed on packaging;
Storage guidance (both presence of, and detail);
Freezing instructions (both presence of, and detail);
Defrosting instructions (both presence of, and detail);
Pack size, features and format;
Recipes, tips and information;
Portion guidance;
Price and promotions;
Presence of symbols;
Presence of on-pack ‘flash’ labelling; and
Presence of on pack tips on waste avoidance or use of leftovers.
In addition the following contextual information (where relevant) was recorded:
Retailer;
Store type (fascia);
Store location (geographical);
Sub-type of product (if relevant);
Whether branded or own-label, and if own-label, whether ‘premium’, ‘standard’ or ‘value’;
Brand/sub brand;
Variant (e.g. extra strong; Mediterranean; wafer thin);
In store location, whether chilled, ambient, frozen or from the deli counter); and
Any point of sale information. Alongside data about products, data were collected about the availability of tools that might help consumers better store or manage the food they purchased. Data on the following types of tools were collected:
Re-closable food / freezer bags;
Air-tight storage containers;
Cool bags;
Plastic clips;
Spaghetti measures; and
Fridge thermometers.
Throughout this work there has been a keen awareness of the need for longevity in the research. Innovations such as the recording of programming code23 to enable future statistical analysis; the development of identification numbers for unique products (SKUs) as well as for unique records; and the development of a user interface for data collection, will enable similar work to be carried out at greater speed and reduced cost in future years. 2.2 Changes to what data were collected since 2009 The 2011 research involved a number of changes to what data was collected. Most notable were changes in the sample, in terms of the proportions of retailers and store fascias that were reviewed, and changes to the product categories. These changes are described in Sections 2.4 and Appendix 1. In 2011, researchers collected, ‘best before’, ‘use by’ and ‘display until’ dates on products, and recorded the dates on which products were reviewed. This data allowed subsequent calculation of given shelf life – the number of days between the date of review and the ‘best
23 In IBM SPSS statistics package.

Helping Consumers Reduce Food Waste – A Retail Survey 2011 23
before’ or ‘use by’ date of the product, and also allowed calculation of the intervals between ‘best before’ or ‘use by’ dates and ‘display until’ dates. Increased emphasis was placed on collection of data about symbols, for example the ‘snowflake’ freezing symbol, and on ‘on pack ‘flash’ labelling on products. The categories to which products were assigned were further refined in 2011, with separate analysis generally being conducted for all aspects of loose versus packed, factory baked versus in store bakery, and chilled versus ambient or frozen versions of products. A decision was taken not to count 5-a-day information as portion guidance in 2011. Hence guidance such as ‘80g = 1 of your 5 a day’ would be counted as portion guidance in 2009, but not counted in 2011. Examples of guidance judged to be portion guidance in 2011 were ‘This pack contains 2 servings’ and ‘One portion = 80g’. This has led to the appearance of a decrease in the proportion of products carrying portion guidance, but is a more accurate reflection of true guidance around portion sizes. Data on portion guidance in this report should therefore be considered to be a revision to the previous baseline, rather than a comparison with 2009. 2.3 A note on comparisons between 2009 and 2011 It should be noted that a quota sampling approach has been taken in both the 2009 and 2011 research, and that the quotas changed between the two years. Neither the 2009 or the 2011 sample is intended to be representative of the retail environment as a whole, but each gives a snapshot of the retail environment, through a particular lens, at a particular point in time. Where comparisons are made it should be noted that they are between the two samples and are not necessarily representative of changes in the retail environment as a whole. That said, efforts have been made to ensure that reported changes between the samples are of sufficient magnitude to be likely to reflect genuine change. Specific comparisons have been subject to double checking with a 2011 dataset weighted to match the relative proportion of retailers in the 2009 sample. Where such checks have been carried out they are detailed in the footnotes. 2.4 Where were the data collected? In 2009, data collection involved visits to four examples of each type of fascia for nine major retailers. For each store fascia, examples were visited in the following locations:
two in England (one north, one south);
one in Wales; and
one in Scotland.
In 2011, the numbers of stores visited was adjusted in order to bolster the presence of some retailers in the sample and to scale down the presence of others to reflect changes in market share. The locations in which stores were visited also changed in order to allow representation of the midlands as well as North, South, Scotland and Wales in the sample. Data collection in 2011 involved visits to four examples of each of the following store fascias:
M&S department stores;
M&S Simply Food;
Sainsbury’s Local;
Sainsbury’s supermarket;
Tesco Express;
Tesco Extra;
Tesco Metro;

Helping Consumers Reduce Food Waste – A Retail Survey 2011 24
Tesco supermarket;
The Co-operative (convenience store);
The Co-operative (supermarket); and
Waitrose. Two examples of each of the following stores: Aldi and Lidl. Eight Morrisons supermarket stores, which does not have a ‘convenience’ store fascia. Asda was unable to participate in in-store reviews, but was keen to participate in the survey. In-house staff carried out a review of products in one Superstore, and this, in combination with data from an online shop, was used to create proxy data. Proxy data were multiplied by eight in order to represent the four superstores and four supermarkets that would otherwise have been reviewed: Asda supermarket and Asda Wal-Mart Supercentre. Certain data that was likely to vary from store to store was excluded from the proxy data:
Price;
Promotions;
Region;
Date item audited; and
Any ‘use by’, ‘best before’ or ‘display until’ dates.
This means that calculations such as given shelf life could not be made for proxy products. As mentioned above, stores from the Midlands were included in the 2011 sample. This has made the spread of locations in the sample somewhat more complex. Table 5 briefly outlines where stores were located. Data were also collected from five online stores in 2011. Goods were reviewed online and purchased in three of these online shops: Asda; Tesco; and Waitrose. Goods were reviewed online, but not purchased from two further online stores: Ocado and Sainsbury’s due to time and budgetary constraints. The online reviews allowed capture of ‘point of sale’ information that is available to consumers as they shop online. Of particular interest was a high incidence of information about the ‘expected’, or ‘guaranteed’ life of certain products. More details about this information can be found in Section 10.1. Table 5 shows that data was collected from three nations during the research – England, Scotland and Wales. A number of tests were run to investigate potential differences between these nations. Some differences were found in the data, but these differences were attributable to the differences in the sample of retailers taken from each country, rather than reflective of differences in products available to consumers in these nations. For this reason, no further analysis by nation was carried out.

Helping Consumers Reduce Food Waste – A Retail Survey 2011 25
Table 5 Locations of store fascias visited in 2011 | Base: 64 Retailer and store fascia
Location
Midlands North Scotland South
East Wales
Proxy
data
1 Waitrose 1
1 1 1
2 Aldi
1
1
3 Lidl
1
1
4 M&S Department Store 1 1 1
1
5 M&S Simply Food 1
1 1 1
6 Tesco Metro 1 1 1
1
7 Tesco Express 1 1
1 1
8 Tesco Extra
1 1 1 1
9 Tesco Supermarket 1 1 1 1
10 Sainsbury's Local 1 1 1 1
11 Sainsbury's
Supermarket 1 1
1 1
12 Morrisons 2 1 1 2 2
13 Asda Supercentre
1
15 The Co-op (Convenience)
1 1 1 1
16 The Co-op
(Supermarket) 1 1
1 1
Asda proxy
7
Total 12 12 10 12 11 7
2.5 How were the data collected? An initial phase of survey design and piloting was carried out, followed by training of the research field force. Two tranches of fieldwork were then conducted. The fieldwork tranches were punctuated by a two week gap, which allowed the Brook Lyndhurst team to clean the data collected and to refine the data collection process where possible. Full details of this phase of work are given in Appendix 2. 2.6 Analysis Once fieldwork was complete and all databases returned, the data was subjected to further cleaning, and allocation of photographs to records in Excel, before being uploaded to SPSS, where detailed analysis was conducted. A series of category reports were produced, detailing information gathered on each product category or sub-category, according to thematic headings similar to those used in this summary report. These reports were subjected to detailed review by WRAP. A workshop was then held with WRAP and Brook Lyndhurst to examine emergent themes from the product category reports and to agree on the focus of additional analysis.
Helping Consumers Reduce Food Waste – A Retail Survey 2011 26
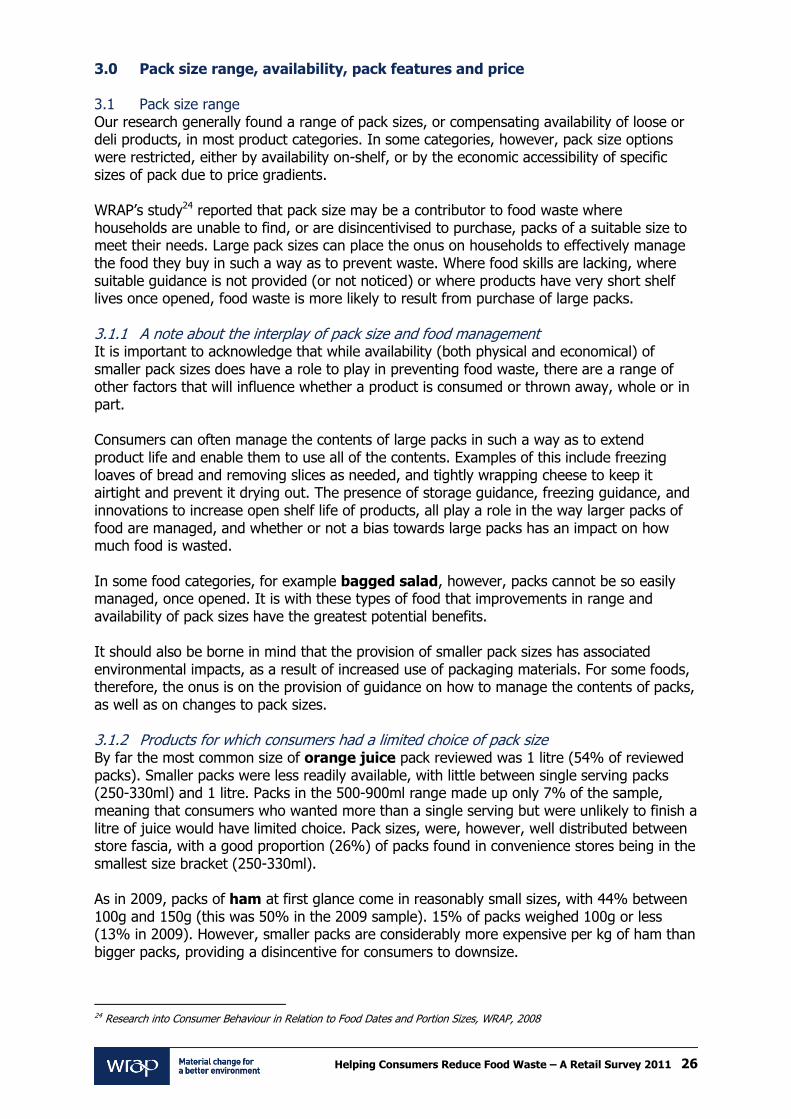
3.0 Pack size range, availability, pack features and price 3.1 Pack size range Our research generally found a range of pack sizes, or compensating availability of loose or deli products, in most product categories. In some categories, however, pack size options were restricted, either by availability on-shelf, or by the economic accessibility of specific sizes of pack due to price gradients. WRAP’s study24 reported that pack size may be a contributor to food waste where households are unable to find, or are disincentivised to purchase, packs of a suitable size to meet their needs. Large pack sizes can place the onus on households to effectively manage the food they buy in such a way as to prevent waste. Where food skills are lacking, where suitable guidance is not provided (or not noticed) or where products have very short shelf lives once opened, food waste is more likely to result from purchase of large packs. 3.1.1 A note about the interplay of pack size and food management It is important to acknowledge that while availability (both physical and economical) of smaller pack sizes does have a role to play in preventing food waste, there are a range of other factors that will influence whether a product is consumed or thrown away, whole or in part. Consumers can often manage the contents of large packs in such a way as to extend product life and enable them to use all of the contents. Examples of this include freezing loaves of bread and removing slices as needed, and tightly wrapping cheese to keep it airtight and prevent it drying out. The presence of storage guidance, freezing guidance, and innovations to increase open shelf life of products, all play a role in the way larger packs of food are managed, and whether or not a bias towards large packs has an impact on how much food is wasted. In some food categories, for example bagged salad, however, packs cannot be so easily managed, once opened. It is with these types of food that improvements in range and availability of pack sizes have the greatest potential benefits. It should also be borne in mind that the provision of smaller pack sizes has associated environmental impacts, as a result of increased use of packaging materials. For some foods, therefore, the onus is on the provision of guidance on how to manage the contents of packs, as well as on changes to pack sizes. 3.1.2 Products for which consumers had a limited choice of pack size By far the most common size of orange juice pack reviewed was 1 litre (54% of reviewed packs). Smaller packs were less readily available, with little between single serving packs (250-330ml) and 1 litre. Packs in the 500-900ml range made up only 7% of the sample, meaning that consumers who wanted more than a single serving but were unlikely to finish a litre of juice would have limited choice. Pack sizes, were, however, well distributed between store fascia, with a good proportion (26%) of packs found in convenience stores being in the smallest size bracket (250-330ml). As in 2009, packs of ham at first glance come in reasonably small sizes, with 44% between 100g and 150g (this was 50% in the 2009 sample). 15% of packs weighed 100g or less (13% in 2009). However, smaller packs are considerably more expensive per kg of ham than bigger packs, providing a disincentive for consumers to downsize.
24 Research into Consumer Behaviour in Relation to Food Dates and Portion Sizes, WRAP, 2008
Helping Consumers Reduce Food Waste – A Retail Survey 2011 27
Almost all premium own-label packs of ham weighed less than 150g (114 of 117 packs), while over half of value packs of ham (48 of 90 packs) weighed over 300g (the highest weight band for this product). That said, looking only at standard own-label packs of ham, there was still a strong price gradient, with standard-own label packs under 100g costing an average of £17.03 per kilogram, and standard-own label packs over 300g costing an average of £6.85 per kilogram. Packs of apples with fewer than six apples made up only 18% of the pre-packed apple sample, meaning that if consumers restrict themselves to pre-packed produce, they will have a limited choice of pack size. Convenience store pre-packed apples were more likely to be in packs of eight (35% of the convenience store sample in 2011) than in packs of four (13%) or five (<1%). The proportion of convenience store stock that consisted of six packs was similar to that in supermarkets and online. Loose apples, were fairly widely available, however, making up 32% of the total apple sample in 2011. 60% of the loose apple sample was found in supermarkets, 30% in convenience stores, and 10% online. Mayonnaise25 pack sizes appeared more homogenous in 2011, with 40% of packs weighing 401-500g. Where smaller packs of 301-400g had previously been well represented (23% of 2009 sample) they now fell to 14% of the 2011 sample. There was a slight increase in the second smallest mayonnaise size (201-330g) from 11% to 15%. The proportion of mayonnaise in the smallest weight band decreased very slightly, and, as in 2009, no own-label mayonnaise was found in this band. Distribution of mayonnaise pack sizes across store fascias was also more homogenous, with the disappearance of the largest size (600g+) from convenience stores (previously 18% of the convenience store sample) and a reduction in the proportion of the second largest size (501-600g) from 9% to 3%. The proportion of smaller 201-300g packs also decreased from 15% of the sample in 2009 to 3% in 2011. Six-packs of eggs continue to dominate the sample, at 65% (68% in 2009). The lack of availability of smaller pack sizes is to some extent ameliorated by this foodstuff’s long shelf life, which gives consumers a long period over which a pack of eggs may be used. With larger packs there appears to have been a slight shift away from 12 packs (10% of the 2011 sample, compared to 15% of the 2009 sample) and towards ten packs (10% of the 2011 sample, compared to 5% of the 2009 sample), which would give consumers options beyond multiples of six when purchasing larger quantities of eggs. Bacon was not found in packs of 180g or less, and only nine packs under 200g were found in the course of 2011 research. Deli bacon was not widely available (12 examples in 2011), which gives consumers limited options if they wish to purchase a small amount. Bacon has a short open shelf life and the price gradient is strong for this product, two factors which exacerbate the issue of a narrow range of pack size. The premium for the smallest packs is slightly reduced if standard own-label products are looked at in isolation, but there is still a strong price gradient for standard own-label products in this range. Bacon is, however, a very freezable product, with 91% of packs in 2011 carrying freezing guidance. 3.1.3 Products for which pack size is less of an issue A wide variety of pack sizes for standard carrots was available, with packs ranging from 150g (6%) to over 2kg (8%). The most frequent pack size was 451-550g (34%), but there was reasonable representation of smaller packs (13% were under 450g, including 9% weighing 250g or less). There were very few branded carrots on the market (20 packs reviewed) but the vast majority of these were between 651g and 1kg in size.
25 Note that the size of some mayonnaise packs was expressed in millilitres rather than grams. In order to consider all packs on a like for like basis, pack sizes by volume were converted to grams using a conversion factor of 1ml to 0.95g.
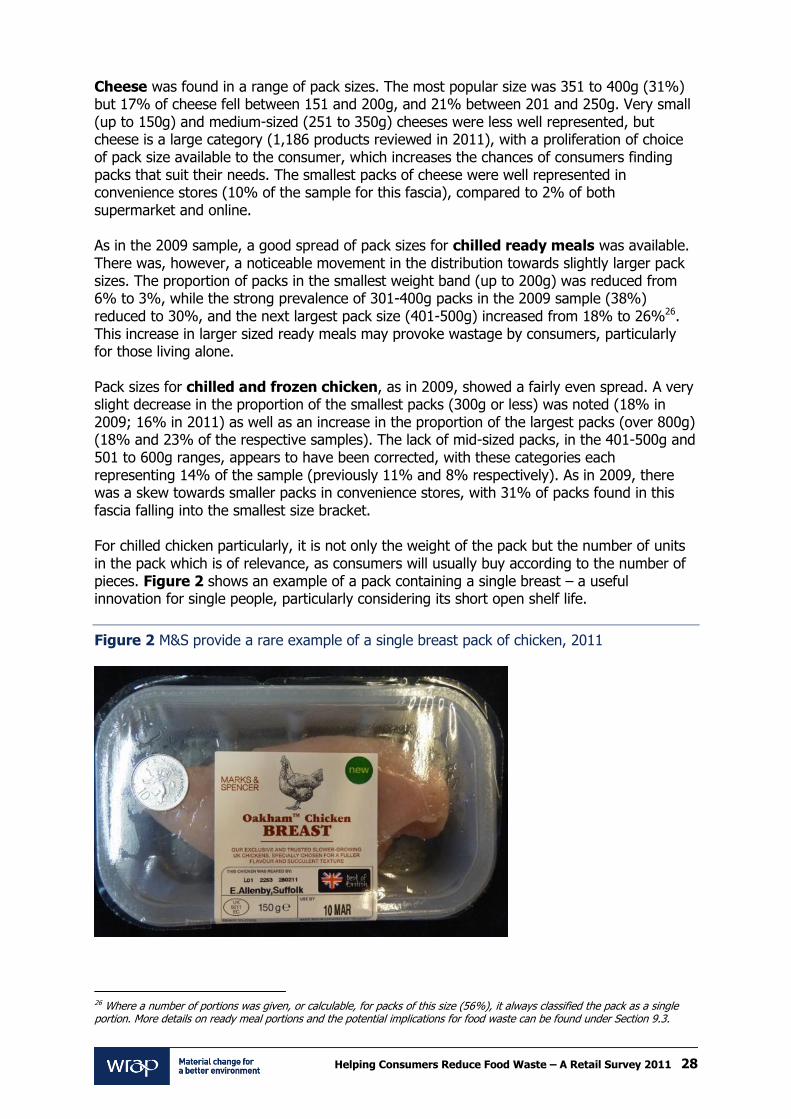
Helping Consumers Reduce Food Waste – A Retail Survey 2011 28
Cheese was found in a range of pack sizes. The most popular size was 351 to 400g (31%) but 17% of cheese fell between 151 and 200g, and 21% between 201 and 250g. Very small (up to 150g) and medium-sized (251 to 350g) cheeses were less well represented, but cheese is a large category (1,186 products reviewed in 2011), with a proliferation of choice of pack size available to the consumer, which increases the chances of consumers finding packs that suit their needs. The smallest packs of cheese were well represented in convenience stores (10% of the sample for this fascia), compared to 2% of both supermarket and online. As in the 2009 sample, a good spread of pack sizes for chilled ready meals was available. There was, however, a noticeable movement in the distribution towards slightly larger pack sizes. The proportion of packs in the smallest weight band (up to 200g) was reduced from 6% to 3%, while the strong prevalence of 301-400g packs in the 2009 sample (38%) reduced to 30%, and the next largest pack size (401-500g) increased from 18% to 26%26. This increase in larger sized ready meals may provoke wastage by consumers, particularly for those living alone. Pack sizes for chilled and frozen chicken, as in 2009, showed a fairly even spread. A very slight decrease in the proportion of the smallest packs (300g or less) was noted (18% in 2009; 16% in 2011) as well as an increase in the proportion of the largest packs (over 800g) (18% and 23% of the respective samples). The lack of mid-sized packs, in the 401-500g and 501 to 600g ranges, appears to have been corrected, with these categories each representing 14% of the sample (previously 11% and 8% respectively). As in 2009, there was a skew towards smaller packs in convenience stores, with 31% of packs found in this fascia falling into the smallest size bracket. For chilled chicken particularly, it is not only the weight of the pack but the number of units in the pack which is of relevance, as consumers will usually buy according to the number of pieces. Figure 2 shows an example of a pack containing a single breast – a useful innovation for single people, particularly considering its short open shelf life.
Figure 2 M&S provide a rare example of a single breast pack of chicken, 2011
26 Where a number of portions was given, or calculable, for packs of this size (56%), it always classified the pack as a single portion. More details on ready meal portions and the potential implications for food waste can be found under Section 9.3.

Helping Consumers Reduce Food Waste – A Retail Survey 2011 29
3.1.4 Apparent improvements in availability of pack size There was an increased presence of smaller pack sizes for potatoes, with 40% of packs weighing less than 2.5kg, compared to 20% in the 2009 sample. Packs smaller than 1.5kg were still relatively rare, however – just 7 examples in a sample of 187. Packs were well distributed between store fascias, with 39% of the convenience store sample consisting of smaller bags (1.5 to 1.99kg), compared to 12% of the supermarket sample and 4% of the online sample. While there was improved availability of smaller pack sizes in the 2011 sample, potatoes were still most commonly sold in packs of 2.5-4.99kg (46% of all packs). Potatoes purchased in-store frequently had a given shelf life of 4-6 days (63% of packs for which this calculation could be made), so a household purchasing a 2.5kg pack of potatoes would need to eat 417g of potatoes a day to get through this pack in 6 days, before the ‘best before’ date lapsed. Potatoes can, of course, be consumed after the ‘best before’ date, but the current narrowness of this window may be off-putting for consumers who have the option of using dried staple foods which last longer. There was a slight movement between the 2009 and 2011 samples towards smaller pack sizes for milk. The proportion of 2.27 litre bottles dropped (23% of 2009 sample; 18% of 2011), while the proportion of 1 litre bottles increased (7% to 12%). Availability of pack sizes across store fascias appears to change quite dramatically – in the 2009 sample, availability of pack size was erratic, while in 2011 the spread is remarkably even. The most dramatic change is in 1 litre and 2.27 litre packs in convenience stores. In the 2009 sample, these were 2% and 31% of convenience store stock respectively. In 2011, they were 14% and 17% respectively27. The very smallest pack sizes of milk (less than 568ml) were not, however, available in convenience stores, despite making up 4% of stock in supermarkets and online. Looking at all packs of bread rolls containing more than one roll (including both pre-packed rolls, and ISB rolls baked and packed in store) there was an apparent shift towards smaller packs. In the 2011 sample, 38% were six packs (down from 44% in 2009), while there was a substantial increase in four packs of rolls to 32% of the sample (from a previous 18%). The proportion of two packs of rolls also appeared to increase, from 5% in the 2009 sample to 13% in 2011. This suggests there may now be a greater choice of smaller packs of rolls available to consumers. A similar pattern of change is apparent across the samples when looking at pre-packed rolls in isolation. There were proportionally fewer packs of 2-4 pre-packed rolls in the convenience store sample than in supermarket or online fascias. A very high proportion of the convenience store sample of ISB rolls was, however, made up of loose rolls (48%). This far exceeds the proportion of supermarket (16%) and online (20%) ISB rolls which were loose, meaning that consumers wishing to buy a small number of rolls will be well provided for. 3.1.5 New pack sizes appearing in the sample In ambient cooking sauce, there was a marked increase in the availability of pasta sauce marketed specifically as an individual portion. Nine 150g ‘My Dolmio’ packs were found in the 2009 ambient sample (1%), while in 2011, 76 examples of these types of packs were found, both ‘My Dolmio’ and ‘Loyd Grossman – For One’ (6% of the ambient sample). Overall, within ambient cooking sauce, there was a slight shift towards smaller pack sizes28. While the increasing availability of single portion packs of ambient cooking sauce is encouraging, 63% of the cooking sauce reviewed in 2011 fell into the 301 to 500g weight band. Many that were
27 This result was cross checked with a weighted 2011 sample, and the figures remained similar – 1 litre packs were 13% of the convenience store sample, whilst 2.27 litre packs were 18%. 28 It should be noted that consistency of sauce and recommended size of one portion are highly variable, so this shift is a less reliable indicator of change than the increase in availability of single portion packs. See Section 9.3.2 for further discussion.

Helping Consumers Reduce Food Waste – A Retail Survey 2011 30
smaller than this were premium or of the more intense ‘stir through’ variety. This suggests that there is still scope for smaller packs of more standard types of cooking sauce. In world breads, there was an increase in the proportion of pittas reviewed in packs of four. In 2009, they made up 7% of the pitta sample, while in 2011 this was 12%. There was a corresponding decrease in the proportion of six packs, from 71% in 2009 to 64% in 2011. 2011 also saw the appearance of three and five packs in the wraps sample (each representing 3% of the sample). The appearance of these smaller packs was driven by brands. While there have been improvements in the availability of smaller packs for world breads, availability of packs with less than 6 units for pitta breads and wraps are still limited. These products tend to have short shelf lives once opened, obliging consumers to use them quickly and increasing the potential for wastage if the product is not used in time. Ten milk packs reviewed were found to carry advertisements for individual portion packs (see Figure 3). The packs were ‘Lactofree’ by Arla – and contained long-life milk of a type suited to those with special dietary needs. While portion packs of milk are widely seen in the catering environment, they are not widely available in supermarkets. This innovation may help prevent waste of specialist milk where an entire carton might otherwise be bought for infrequent use by a single individual within a household.
Figure 3 An advert for smaller portion packs on Arla's Lactofree milk, 2011
3.1.6 Products where there is an opportunity to develop smaller pack sizes There are clearly trade-offs to be considered in development of small pack sizes. The environmental impacts of increasing the ratio of packaging materials to product need to be balanced with the potential to reduce food waste. For certain product categories however, particularly those where open shelf life is very short, it does seem that there is scope and demand for development in this area. The very short open shelf life of most bagged salad, and high levels of waste from this category, highlight a largely unaddressed need for smaller bags of salad to be made widely available to consumers. Very few examples of packs under 100g were found (10% of 2011 sample, down from 14% of the 2009 sample). An increased proportion of branded bagged salad in the 2011 sample (34%, up from 25%) brought with it more larger, rather than

Helping Consumers Reduce Food Waste – A Retail Survey 2011 31
smaller packs, with 15% of branded salad now falling in the 201-250g range. Only 2% of branded salads were found in each of smallest size brackets (100g or less; 101 to 150g). Despite regulatory changes which now allow for pre-packed bread in non-standard sizes, very few packs of bread were found in anything other than 400g or 800g loaves. There was a slight increase in availability of 400g loaves, from 28% to 35% between the two samples. 600g loaves were slightly more likely to be available online than in store (5% of online sample as opposed to 1% of convenience and supermarket samples). One excellent example of pack size innovation was the Kingsmill ‘Little Big Loaf’ (Figure 4) a 470g loaf with slices the same size as an 800g loaf would have. This is an excellent response to both the consumer preference for standard-sized bread slices and the high volumes of bread waste that result from consumers buying packs too large for their needs. The loaves were not widely found in our sample, however, and the loaves were more expensive (£1.90p per kg) than their 800g counterparts (£1.50 per kg).
Figure 4 Kingsmill ‘Little Big Loaf’, 2011
3.2 Availability of deli / loose products29 Loose and deli products provide a good option for consumers who are unable to find an appropriate pack size to meet their needs amongst packed products. Products are generally priced per-kilogram, meaning the price gradient is entirely flat no matter how much or how little a consumer chooses to buy30. The benefits of this complete control of pack size should, for deli products (e.g. bacon, ham), be balanced against the fact that these products generally have shelf lives far shorter than their pre-packed counterparts. Loose products were found in 53 of 57 stores visited31 and across 17 of the 21 different retailer store fascias32 included in the review, including convenience, supermarket and superstore fascias. Deli products were found in 26 stores, across different 8 different fascias, all of which were supermarkets or superstores. Of the loose fresh fruit and vegetables reviewed, loose apples were most frequently found (in 51 of the 57 stores visited, split across 16 different fascias), followed by loose carrots (39 stores, split across 15 fascias) and then loose potatoes (20 stores, split across 10 fascias). Just under a third (30%) of loose apples reviewed were found in convenience stores. This proportion is greater than that of pre-packed apples found in this store fascia (20%). In bakery, similarly, 28% of loose ISB rolls were found in convenience stores, a proportion which is greater than that of their packaged ISB counterparts, 7% of which were found in convenience stores.
29 Data on loose and deli items from the 2011 fieldwork should be considered as a new baseline, in preference to data found in the 2009 report. 30 A full explanation of price gradients is found in Section 3.3. 31 ‘Visits’ include online shops, but not proxy data shops. 32 ‘Fascias’ describe the type of store, e.g. supermarket fascia, convenience fascia.
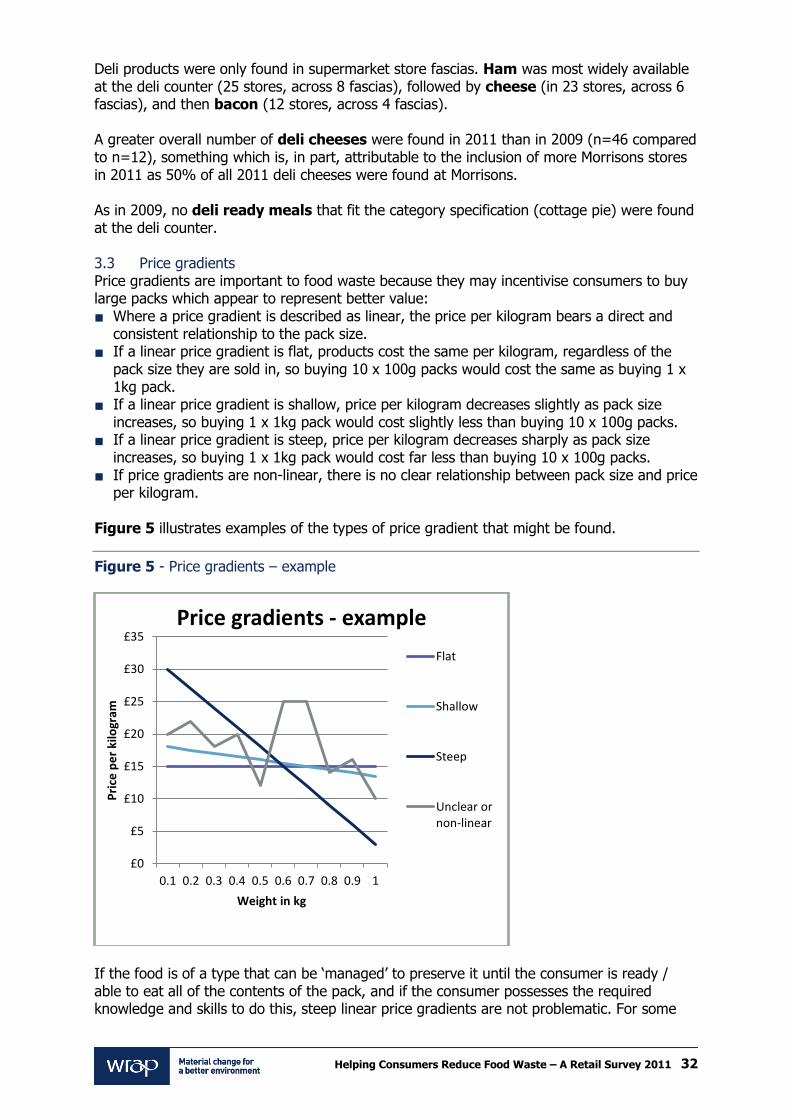
Helping Consumers Reduce Food Waste – A Retail Survey 2011 32
Deli products were only found in supermarket store fascias. Ham was most widely available at the deli counter (25 stores, across 8 fascias), followed by cheese (in 23 stores, across 6 fascias), and then bacon (12 stores, across 4 fascias). A greater overall number of deli cheeses were found in 2011 than in 2009 (n=46 compared to n=12), something which is, in part, attributable to the inclusion of more Morrisons stores in 2011 as 50% of all 2011 deli cheeses were found at Morrisons. As in 2009, no deli ready meals that fit the category specification (cottage pie) were found at the deli counter. 3.3 Price gradients Price gradients are important to food waste because they may incentivise consumers to buy large packs which appear to represent better value:
Where a price gradient is described as linear, the price per kilogram bears a direct and consistent relationship to the pack size.
If a linear price gradient is flat, products cost the same per kilogram, regardless of the pack size they are sold in, so buying 10 x 100g packs would cost the same as buying 1 x 1kg pack.
If a linear price gradient is shallow, price per kilogram decreases slightly as pack size increases, so buying 1 x 1kg pack would cost slightly less than buying 10 x 100g packs.
If a linear price gradient is steep, price per kilogram decreases sharply as pack size increases, so buying 1 x 1kg pack would cost far less than buying 10 x 100g packs.
If price gradients are non-linear, there is no clear relationship between pack size and price per kilogram.
Figure 5 illustrates examples of the types of price gradient that might be found.
Figure 5 - Price gradients – example
If the food is of a type that can be ‘managed’ to preserve it until the consumer is ready / able to eat all of the contents of the pack, and if the consumer possesses the required knowledge and skills to do this, steep linear price gradients are not problematic. For some
£0
£5
£10
£15
£20
£25
£30
£35
0.1 0.2 0.3 0.4 0.5 0.6 0.7 0.8 0.9 1
Pri
ce p
er
kilo
gram
Weight in kg
Price gradients - example
Flat
Shallow
Steep
Unclear ornon-linear

Helping Consumers Reduce Food Waste – A Retail Survey 2011 33
foods, however, particularly those with short shelf lives once opened, buying a bigger pack may result in waste. In such cases large packs may be worse value for the consumer than buying a smaller pack. It should be noted that price gradients are not always straightforward comparisons of like with like. The existence of premium, standard and value products within supermarket’s own-label ranges, and differences between own-label and branded products, may mean that price differences are a reflection of the additional benefits to consumers which are offered by some more ‘premium’ products. This is exacerbated by the tendency for ‘premium’ products to be sold in smaller packs. Where price gradients are very likely to have been complicated by intervening variables in the examples below, we have tried to highlight these potential complications, and to rule them out, where possible. 3.3.1 Steep linear price gradients Pre-packed potatoes have a steep, linear price gradient, resulting in a strong incentive to buy bigger packs. Larger packs represent a substantial saving for consumers, with bags of over 7.5kg costing less than half the price per kilo (£0.39/kg) than 2 to 2.5kg bags (£0.85/kg). Orange juice had a moderately steep, linear price gradient, giving a fairly strong incentive for consumers to buy larger packs. There was a 64 pence per litre saving for consumers buying orange juice in 2 litre packs rather than 1 litre packs. In 2011, larger packs of bacon were considerably cheaper per kilogram than their smaller counterparts. Large packs (301 to 500g) cost around half the price per kilogram of small packs (151 to 200g). The price gradient flattened with the largest packs (over 500g), in fact increasing very slightly (£6.46/kg for 301 to 500g packs, £6.71/kg for packs over 500g). Across all four world bread sub-types there was a tendency for units (e.g. one pitta bread) to be more expensive in smaller packs than in bigger packs, although sample sizes for packs with fewest units tended to be very small. 3.3.2 High premium for smallest pack The price gradient for carrots was fairly flat, aside from the smallest packs (up to 250g) of standard and pre-prepared carrots. Per kilo, standard carrots in the smallest packs (up to 250g) cost over 3.5 times the price of any other pack size. While these carrots were not all sold as premium own-label products, they were all ‘baby’ type carrots, a factor which may explain their higher price. Pre-prepared carrots in 250g packs cost 2.5 times the per kilo price of carrots sold in any other pack size. Several of these packs appear to be ‘snack pack’ type products, which may again explain the premium charged. Packs of bagged salad also showed steep, linear price gradients, incentivising consumers to purchase larger packs. Though the samples of packs weighing less than 150g was small (18 packs in each of the ‘up to 100g’ and ‘101 to 150g’ categories), these packs came at a substantial premium (£12.28/kg and £10.74/kg respectively). Packs weighing 151-200g were around 1.5 times the per kilo price of the largest (251-300g) packs. The price difference between the smallest packs of standard dry rice and their larger counterparts increased between the 2009 and 2011 samples. In 2009, the smallest packs of rice (250-300g) cost 161% of the per kilogram price of 500g packs; in 2011 this was 235%. Aside from this jump, rice showed an even, and steep linear price gradient, providing a strong incentive to consumers to buy larger packs. The largest bags of rice (over 4kg) cost only 18% of the per kilogram price of the smallest packs.

Helping Consumers Reduce Food Waste – A Retail Survey 2011 34
The smallest packs of pasta (up to 250g) were nearly twice the price per kilo of any other pasta, though the base size was very small (4 packs). 400g and 500g packs were priced approximately equally by the kilo, while economies of scale were found in packs weighing 1kg or more. 3.3.3 Unclear or non-linear price gradients Some categories showed unclear or non-linear price gradients. In some cases this was clearly a result of skewing of the data, as a result of promotions, or of differing proportions of branded or premium products within a category. One example of this was milk, where it appeared that buying milk by the pint was cheaper than buying it by the litre. This appeared to be due to the fact that own-brand milk tended to be sold in pints, whilst branded milk, which encompassed a number of premium or speciality products, tended to be sold by the litre. Both chilled and frozen chicken showed non-linear price gradients, indicating that consumers would be wrong to think that buying a larger pack always represents better value for this product. In chilled chicken, for example, 701-800g packs were slightly more expensive, at £11.07/kg, than 400-500g packs, at £10.61/kg, while packs over 800g in size were more expensive (£9.26/kg) than 601-700g packs (£8.77/kg). As in 2009, analysis of price per egg showed that, on average, larger packs were cheaper than smaller ones. However, again, as in 2009, the relationship was non-linear. For example, an egg in a pack of 12 eggs was more expensive than one in a pack of 10 eggs. This gradient may result from the fact that a quarter of ten packs of eggs were value own-label, while none of the 12 packs were. The price gradient for cheese shows an uneven downward trend as pack size increases. 201-250g packs cost the same as 351-400g packs per kilogram (£8.62 and £8.68). Packs between these two weight bands cost slightly more, but there were fewer products in these weight bands than in those either side of them, suggesting less mainstream, and potentially more premium, cheese. The breakdown by brand or own-label sheds little light on this, with branded and own-label cheeses having similar prices in all categories. The average price per kilogram of ambient cooking sauce fluctuated by pack size, showing an uneven price gradient in the 2011 sample. The price of the smallest packs of cooking sauce (£8.28/kg for up to 200g ) was almost double that of other size options (between £2.53/kg for packs of 501-600g and £4.67/kg for packs of 301-400g). This may be due to the high prevalence of more concentrated ‘stir through’ type sauce in the smallest weight band. As was found in 2009, bread showed pronounced price gradients between smaller and larger packs, with smaller 400g loaves costing £1 per kilogram more than 800g loaves. Interestingly, while 800g own-label loaves were generally cheaper than branded loaves (£1.14/kg, as opposed to £1.48/kg), 400g own-label loaves were more expensive than their branded counterparts (£2.77/kg as opposed to £2.25/kg). 3.4 Pack functionality The research examined the range of pack functionality available to consumers which was intended to help prolong given and open shelf life. 3.4.1 Some excellent examples of pack functionality In the 2011 sample, 47% of all packaged products were re-closable in some way.

Helping Consumers Reduce Food Waste – A Retail Survey 2011 35
35% of cheese came in a re-closable pack, compared to 26% in the 2009 sample. Re-closability in cheese is predominantly led by brands, with 56% of branded cheese being re-closable, compared to only 13% of own-label cheese. An increase in the proportion of the re-closable cheese sample that was branded as opposed to own-label (from 74% branded in 2009 to 82% branded in 2011) suggests that brand manufacturers are increasingly adopting this mechanism to keep their products fresh. Of the branded re-closable packs of cheese found, half were Cathedral City. Re-close functionality in cheese was seen in two forms (Figure 6) – ziplock bags and sticky label re-closability, and re-closable packs were frequently seen in conjunction with on-pack ‘flash’ labelling to highlight their re-closability. Re-closability was also associated with changes to storage guidance indicating that cheese may be kept longer after opening. Information about on-pack ‘flash’ labelling can be found in Section 5.3.
Figure 6 Two types of reclose mechanism in cheese, with on pack ‘flash’, 2011
73% of standard dry rice packs were re-closable, compared to 44% of standard rice in the 2009 sample, which represents improved uptake of this functionality. A small number of rice packs in 2011 emphasised their re-closability with an on pack ‘flash’ (n=12). On packs of pasta, in contrast to rice, there appears to have been a decrease in re-closability, from 73% of the 2009 sample to 56% of the 2011 sample. If this functionality is not viable for pasta, the promotion of use of food clips or of guidance advising that the product be stored in an airtight container once opened may go some way towards compensating for this, ensuring that consumers can keep their pasta in top condition. There does not, however, appear to have been an increase in this sort of guidance on pasta between the two samples. See Section 5.1.3 for further discussion. 26% of wraps came in a re-closable pack, a similar proportion to the 2009 sample (28%) (Figure 7). 43% of re-closable packs in 2011 advertised this fact using an on-pack ‘flash’. 18% of the remaining tortilla packs, while not providing re-closable functionality, did instruct consumers to re-close the pack in on-pack storage guidance.

Helping Consumers Reduce Food Waste – A Retail Survey 2011 36
Figure 7 Tesco own-label re-closable wraps, 2011
17% of chilled chicken packs reviewed in 2011 were re-closable, compared to only 5% of the sample in 2009. Re-closable packs tended to be of the ‘fresh for freezing variety’ containing individually wrapped fillets which are designed to be home frozen and taken from the freezer as needed (Figure 8).
Figure 8 Sainsbury's chicken fillets, individually wrapped and re-closable, 2011

Helping Consumers Reduce Food Waste – A Retail Survey 2011 37
Packs that were split into smaller sections were noted to be rare in all product categories in 2009, and this continued to be the case in 2011, with just 6% of the sample of packaged products having this functionality. The proportion of bagged salad packs in the sample that were split into smaller sections rose from 2% in 2009 to 9% in 2011. Employment of this functionality in salad has real potential benefits because of the rarity of very small pack sizes for this product, and because of its extremely short open shelf life (a single day, in the majority of cases). See Figure 9 for an example of this type of packaging found in Morrisons.
Figure 9 Morrisons lettuce pack split into smaller sections, 2011
The proportion of bacon for which packs were split into smaller sections seemed to decrease slightly between the two samples, form 16% in 2009 to 13% in 2011. 7% of naan packs (both ambient and chilled) were split into smaller sections. This was an increase from 6% in 2009. (It should be noted that the sample of naans was reduced in 2009, as the category was limited to garlic or garlic and herb naans where previously it had also contained plain naans.) A very small proportion (2%) of bread in 2011 came in packs split into smaller sections. There were some interesting innovations in this, however, which are well worth noting. Figure 10 shows a M&S loaf which contains half white and half brown bread – a useful innovation for smaller households with different bread preferences. This innovation has the added advantage of having only two end slices rather than the four that would result if one white and one brown 400g loaves were purchased instead. WRAP research33 showed that 65% of respondents threw bread ends away ‘sometimes’.
33 Reducing Household Bakery Waste, WRAP, 2011
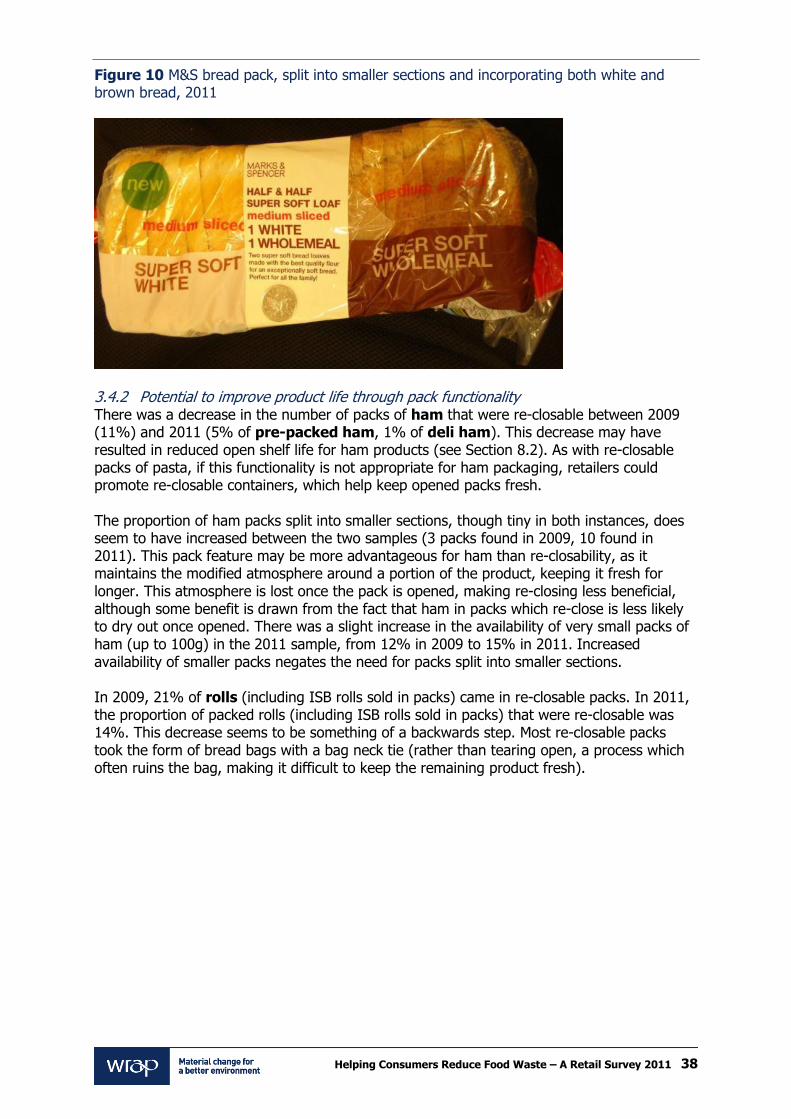
Helping Consumers Reduce Food Waste – A Retail Survey 2011 38
Figure 10 M&S bread pack, split into smaller sections and incorporating both white and brown bread, 2011
3.4.2 Potential to improve product life through pack functionality There was a decrease in the number of packs of ham that were re-closable between 2009 (11%) and 2011 (5% of pre-packed ham, 1% of deli ham). This decrease may have resulted in reduced open shelf life for ham products (see Section 8.2). As with re-closable packs of pasta, if this functionality is not appropriate for ham packaging, retailers could promote re-closable containers, which help keep opened packs fresh. The proportion of ham packs split into smaller sections, though tiny in both instances, does seem to have increased between the two samples (3 packs found in 2009, 10 found in 2011). This pack feature may be more advantageous for ham than re-closability, as it maintains the modified atmosphere around a portion of the product, keeping it fresh for longer. This atmosphere is lost once the pack is opened, making re-closing less beneficial, although some benefit is drawn from the fact that ham in packs which re-close is less likely to dry out once opened. There was a slight increase in the availability of very small packs of ham (up to 100g) in the 2011 sample, from 12% in 2009 to 15% in 2011. Increased availability of smaller packs negates the need for packs split into smaller sections. In 2009, 21% of rolls (including ISB rolls sold in packs) came in re-closable packs. In 2011, the proportion of packed rolls (including ISB rolls sold in packs) that were re-closable was 14%. This decrease seems to be something of a backwards step. Most re-closable packs took the form of bread bags with a bag neck tie (rather than tearing open, a process which often ruins the bag, making it difficult to keep the remaining product fresh).
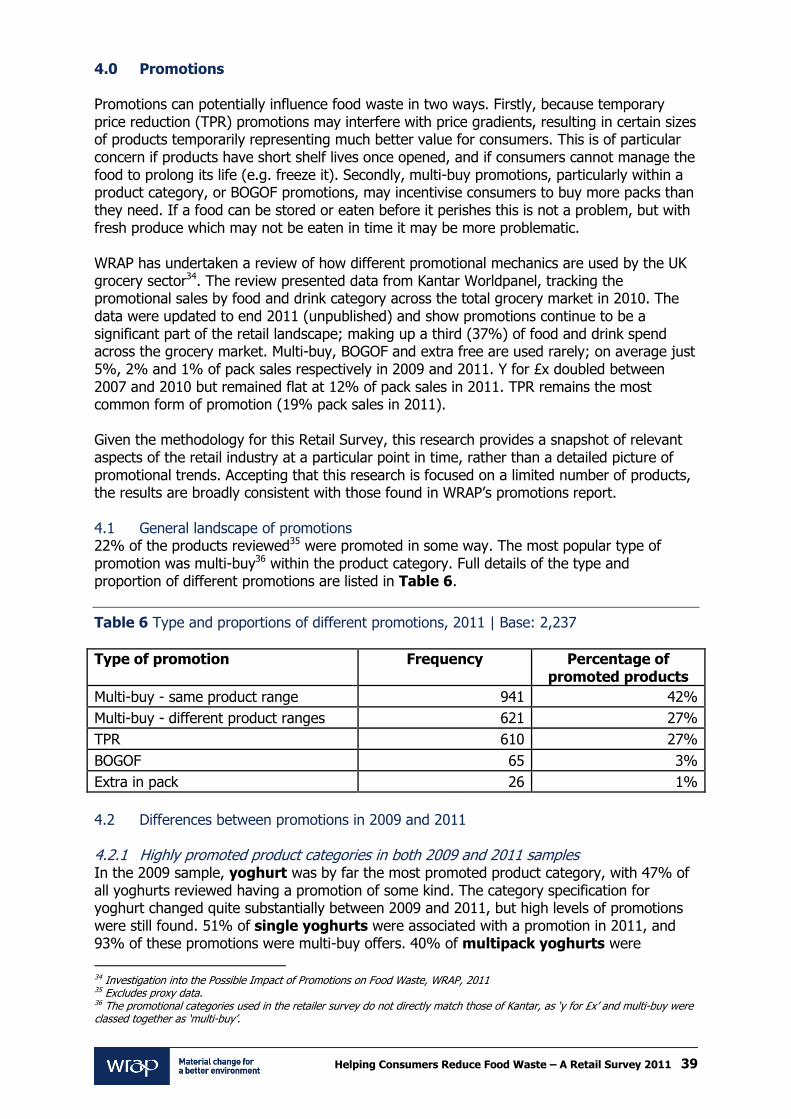
Helping Consumers Reduce Food Waste – A Retail Survey 2011 39
4.0 Promotions Promotions can potentially influence food waste in two ways. Firstly, because temporary price reduction (TPR) promotions may interfere with price gradients, resulting in certain sizes of products temporarily representing much better value for consumers. This is of particular concern if products have short shelf lives once opened, and if consumers cannot manage the food to prolong its life (e.g. freeze it). Secondly, multi-buy promotions, particularly within a product category, or BOGOF promotions, may incentivise consumers to buy more packs than they need. If a food can be stored or eaten before it perishes this is not a problem, but with fresh produce which may not be eaten in time it may be more problematic. WRAP has undertaken a review of how different promotional mechanics are used by the UK grocery sector34. The review presented data from Kantar Worldpanel, tracking the promotional sales by food and drink category across the total grocery market in 2010. The data were updated to end 2011 (unpublished) and show promotions continue to be a significant part of the retail landscape; making up a third (37%) of food and drink spend across the grocery market. Multi-buy, BOGOF and extra free are used rarely; on average just 5%, 2% and 1% of pack sales respectively in 2009 and 2011. Y for £x doubled between 2007 and 2010 but remained flat at 12% of pack sales in 2011. TPR remains the most common form of promotion (19% pack sales in 2011). Given the methodology for this Retail Survey, this research provides a snapshot of relevant aspects of the retail industry at a particular point in time, rather than a detailed picture of promotional trends. Accepting that this research is focused on a limited number of products, the results are broadly consistent with those found in WRAP’s promotions report. 4.1 General landscape of promotions 22% of the products reviewed35 were promoted in some way. The most popular type of promotion was multi-buy36 within the product category. Full details of the type and proportion of different promotions are listed in Table 6.
Table 6 Type and proportions of different promotions, 2011 | Base: 2,237
Type of promotion Frequency Percentage of promoted products
Multi-buy - same product range 941 42%
Multi-buy - different product ranges 621 27%
TPR 610 27%
BOGOF 65 3%
Extra in pack 26 1%
4.2 Differences between promotions in 2009 and 2011 4.2.1 Highly promoted product categories in both 2009 and 2011 samples In the 2009 sample, yoghurt was by far the most promoted product category, with 47% of all yoghurts reviewed having a promotion of some kind. The category specification for yoghurt changed quite substantially between 2009 and 2011, but high levels of promotions were still found. 51% of single yoghurts were associated with a promotion in 2011, and 93% of these promotions were multi-buy offers. 40% of multipack yoghurts were
34 Investigation into the Possible Impact of Promotions on Food Waste, WRAP, 2011 35 Excludes proxy data. 36 The promotional categories used in the retailer survey do not directly match those of Kantar, as ‘y for £x’ and multi-buy were classed together as ‘multi-buy’.
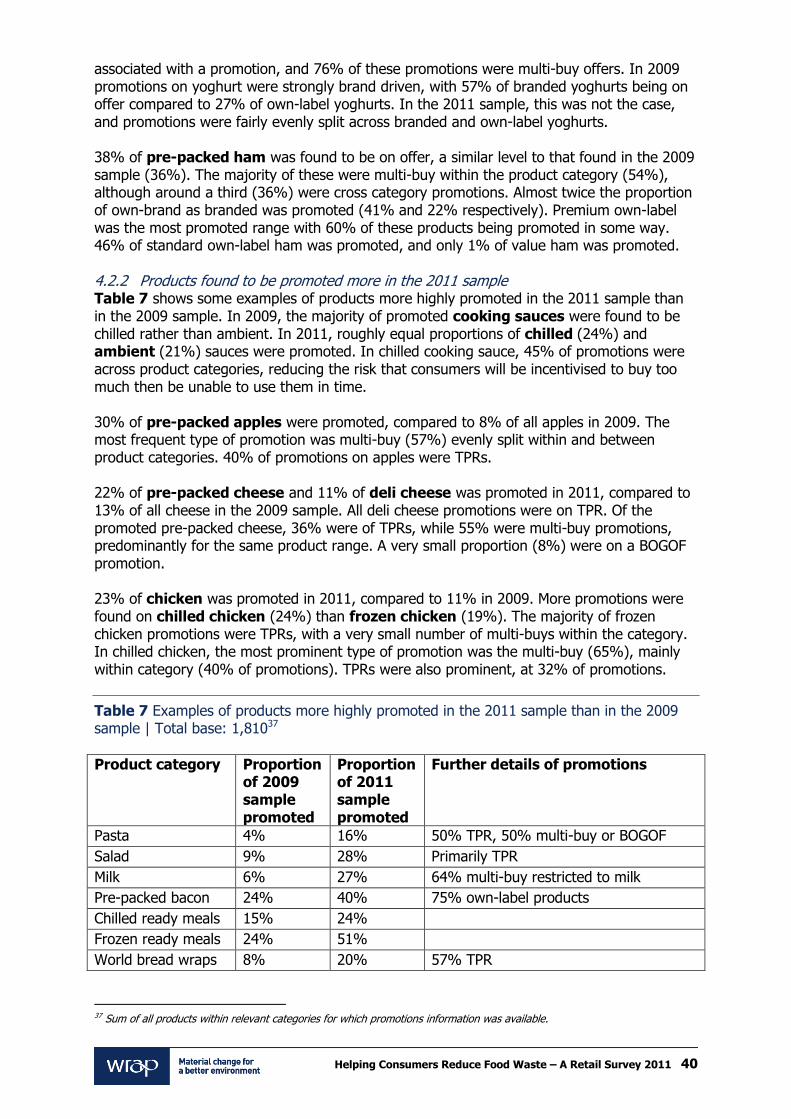
Helping Consumers Reduce Food Waste – A Retail Survey 2011 40
associated with a promotion, and 76% of these promotions were multi-buy offers. In 2009 promotions on yoghurt were strongly brand driven, with 57% of branded yoghurts being on offer compared to 27% of own-label yoghurts. In the 2011 sample, this was not the case, and promotions were fairly evenly split across branded and own-label yoghurts. 38% of pre-packed ham was found to be on offer, a similar level to that found in the 2009 sample (36%). The majority of these were multi-buy within the product category (54%), although around a third (36%) were cross category promotions. Almost twice the proportion of own-brand as branded was promoted (41% and 22% respectively). Premium own-label was the most promoted range with 60% of these products being promoted in some way. 46% of standard own-label ham was promoted, and only 1% of value ham was promoted. 4.2.2 Products found to be promoted more in the 2011 sample Table 7 shows some examples of products more highly promoted in the 2011 sample than in the 2009 sample. In 2009, the majority of promoted cooking sauces were found to be chilled rather than ambient. In 2011, roughly equal proportions of chilled (24%) and ambient (21%) sauces were promoted. In chilled cooking sauce, 45% of promotions were across product categories, reducing the risk that consumers will be incentivised to buy too much then be unable to use them in time. 30% of pre-packed apples were promoted, compared to 8% of all apples in 2009. The most frequent type of promotion was multi-buy (57%) evenly split within and between product categories. 40% of promotions on apples were TPRs. 22% of pre-packed cheese and 11% of deli cheese was promoted in 2011, compared to 13% of all cheese in the 2009 sample. All deli cheese promotions were on TPR. Of the promoted pre-packed cheese, 36% were of TPRs, while 55% were multi-buy promotions, predominantly for the same product range. A very small proportion (8%) were on a BOGOF promotion. 23% of chicken was promoted in 2011, compared to 11% in 2009. More promotions were found on chilled chicken (24%) than frozen chicken (19%). The majority of frozen chicken promotions were TPRs, with a very small number of multi-buys within the category. In chilled chicken, the most prominent type of promotion was the multi-buy (65%), mainly within category (40% of promotions). TPRs were also prominent, at 32% of promotions.
Table 7 Examples of products more highly promoted in the 2011 sample than in the 2009 sample | Total base: 1,81037
Product category Proportion of 2009 sample promoted
Proportion of 2011 sample promoted
Further details of promotions
Pasta 4% 16% 50% TPR, 50% multi-buy or BOGOF
Salad 9% 28% Primarily TPR
Milk 6% 27% 64% multi-buy restricted to milk
Pre-packed bacon 24% 40% 75% own-label products
Chilled ready meals 15% 24%
Frozen ready meals 24% 51%
World bread wraps 8% 20% 57% TPR
37 Sum of all products within relevant categories for which promotions information was available.

Helping Consumers Reduce Food Waste – A Retail Survey 2011 41
4.2.3 Products less promoted than in 2009 19% of rolls (18% of pre-packed rolls, and 30% of ISB rolls) were found to be on offer, compared to 23% of rolls in the 2009 sample. Amongst world breads, almost no pitta breads were promoted (2% in 2011, 9% in 2009). 13% of ambient naans were promoted, again primarily through TPR, as were a similar proportion of chilled naans. In 2009, 14% of all naans were found to be on promotion. The most popular promotion for orange juice packs was ‘multi-buy – same product range’. One in five packs of orange juice carried such a promotion. Unopened packs of orange juice tend to have fairly long shelf lives, but short shelf lives once opened, so this type of promotion on this product is probably preferable, from a food waste perspective, to something such as ‘extra in pack’ or TPR on larger packs which may interfere with price gradients and make it more economical for a consumer to buy more product than they need, rather than the right amount. 4.3 Influence of pack volume on promotions 800g loaves of pre-packed bread were three times as likely to be promoted (21%) than 400g loaves (7%). The predominant type of promotion was multi-buy, same product category. This type of promotion may encourage consumers to buy more bread than they need, a concern considering the short given shelf life of bread. In other product categories, larger pack sizes were less commonly promoted. With pre-packed ham, the most promoted packs were medium sized, 201 to 250g, with just under half of the 33 packs in this weight band promoted in some way. Promotions were predominantly multi-buy, split evenly across same and different product categories. Similar levels of promotion are seen in the smallest and second smallest ham weight bands – up to 100g (43%) and 101 to 150g (44%). Promotions in both these categories were predominantly multi-buy – same product category. Just 3% of ham in the largest weight band (over 300g) was promoted. The most promoted size of multipack yoghurt were four-packs, 44% of which were promoted. The majority of these promotions were multi-buy, split evenly between same and different product categories. 35% of six-packs were promoted, predominantly multi-buy – same category. No twelve-packs of yoghurts were promoted.

Helping Consumers Reduce Food Waste – A Retail Survey 2011 42
5.0 Storage guidance The way in which food is stored can have a significant impact on its given and open shelf life and quality. Consumer research38 suggests that numerous factors come into play when consumers make decisions about how and where to store a product. Decisions may be influenced, amongst other things by where the food was stored in the shop, by habit, or even by aesthetic considerations (many people like to keep fruit ‘out’ in a bowl, rather than in the fridge, for example). Despite this, storage guidance has the potential to influence consumer decisions about food storage in such a way as to prolong product life, to improve food safety and to prevent food waste. 5.1 Presence of guidance and guidance given The vast majority of items reviewed in the course of the 2011 research had storage guidance. 95%39 of all products carried storage guidance, and when restricted to packed products, excluding loose and deli products, this rose to 96%. These figures are in line with what was found in 2009 (96% of all products carried storage guidance). 5.1.1 Headline examples of good or improved guidance Appropriateness of guidance and consistency across product categories or sub-categories are considered key to strong storage guidance, as they may contribute to the improvement of food management skills in consumers who are exposed to them. There were a number of encouraging changes in pre-packed bread which suggest that storage guidance here is becoming clearer and more consistent:
Almost all pre-packed bread reviewed in 2011 carried the guidance to store in a cool, dry place, as opposed to 81% in 2009;
The proportion of bread packs instructing consumers not to refrigerate increased from 43% in the 2009 sample to 58% in 2011; and
The proportion of bread packs carrying the instruction ‘In warm or humid weather, refrigerate to prolong product life’ was 7% in the 2011 sample, compared to 16% in 2009, and this is likely to now have decreased further due to Hovis removing this guidance from their products since the fieldwork period40.
A majority of packs of bread (59%) carried a ‘weather warning’. 50% of bread carried a warning that storage life may be reduced in warm or humid weather, while a very small proportion reinforced guidance to store in a cool, dry place ‘particularly in warm weather’. 7% of bread instructed consumers to store bread in the fridge during warm or humid weather, though the majority of these packs were Hovis (59 of 66), who had committed to removing this guidance during the summer of 2011. This kind of ‘weather warning’, by contrast, was found on only 20% of pre-packed rolls, and never included guidance to refrigerate, but only warned of shortened product life in warm conditions. 95% of pasta reviewed carried storage instructions, and this guidance was very consistent, with 99% of packs with instructions stating ‘Store in a cool dark place’. The 5% of pasta products reviewed which did not have storage guidance were all branded products.
38 Consumer Insight: Date Labels and Storage Guidance, WRAP, 2011 39 This proportion remains constant when the sample is weighted to match that used in 2009. 40 The majority of products carrying this guidance were Hovis (59 out of 66), who, following the ‘Reducing household bakery waste’ project (WRAP, 2011) undertook to remove this guidance from all their products by June 2011.
Helping Consumers Reduce Food Waste – A Retail Survey 2011 43
Asda potatoes carried both strong storage guidance on-pack and an explanation of why it was important to follow it. The guidance read ‘Potatoes will last longer if stored in a cool, dry, dark place. Warmth encourages sprouting and light causes potatoes to turn green’. 92% of pre-packed apples in the 2011 sample had the storage guidance to keep refrigerated, compared to 89% in 2009. An increase in this sort of guidance would be encouraging as it is in line with WRAP guidance which suggests that apples last longest if stored in the fridge41. The storage guidance on pre-packed apples also frequently referred to maintaining ‘freshness’ or keeping the product ‘at its best’, explanatory language which may encourage consumers to follow storage guidance. 39% of apples with storage guidance carried the guidance ‘For maximum freshness/to maintain/retain freshness’, while 33% carried ‘To enjoy the product at its best’ alongside guidance to refrigerate. 5.1.2 Guidance which could be improved As in 2009, storage guidance for eggs was quite consistent. 98% of eggs reviewed carried guidance to refrigerate. However, 48 packs of eggs (9%) suggested ‘Store in a cool, dry place OR keep refrigerated’. This was over double the occurrence in the 2009 sample (4%). The majority of these eggs were branded, and they were sold across several different supermarkets. This guidance goes against FSA guidance (which recommends eggs should be refrigerated in-home) and may be confusing for consumers. The presence of storage guidance on ISB bread was a lot lower than that found in the 2009 sample, at 14% compared to 55%. Only three ISB loaves were found ‘loose’ or without packaging, so it is surprising that the prevalence of storage guidance is so low. 21% of the 2011 sample of packed rolls carried the guidance ‘best/ideally not refrigerated’. This was 30% in the 2009 sample. There were, however, considerably more bake at home (BAH) rolls in the 2011 sample (n=109, compared to n=27). If these are excluded from both samples the difference narrows very slightly to 24% in 2009 and 32% in 2011. 42% of BAH rolls carried guidance to refrigerate once opened. This could confuse consumers as to whether bakery should be stored in the fridge or not. Clarity that it is uncooked, rather than cooked product that needs refrigeration would be beneficial, together with explanation as to why this is needed for BAH varieties. On-pack storage guidance on where to keep potatoes in 2011 was quite varied. 18% said simply store somewhere dark, 17% somewhere cool and dry, 37% somewhere cool and dark, and 28% somewhere cool, dry AND dark. All Vivaldi potatoes found stated ‘store in a cool, dry place’, with no reference to keeping them in the dark, but this was only six packs. Guidance with no reference to keeping potatoes in the dark, however, also occurred on King Edward, Maris Piper, and mainstream potatoes, though less consistently. All packs of potatoes lacking guidance to store in the dark were own-label. Although it is possible that this inconsistency of guidance may be due to the variety of potatoes, e.g. some (like King Edwards) are more susceptible to greening, the Potato Council advises storing potatoes ‘somewhere cool, dark and airy - not the fridge’42, which suggests consistent labelling is possible in this category. In early 2012, WRAP published detailed consumer insight into potato usage43 which recommended optimising storage guidance to make all packs say ‘store in a cool, dark place’.
41 Helping Consumers Reduce Fruit and Vegetable Waste, WRAP, 2008 42 See: http://www.lovepotatoes.co.uk/the-potato/faq/#How should I store my potatoes? 43 Reducing supply chain and consumer potato waste, WRAP, 2012

Helping Consumers Reduce Food Waste – A Retail Survey 2011 44
As in 2009, only a small proportion of standard carrots reviewed included advice to store them in their packaging (13% in 2011, 14% in 2009). The percentage of standard carrots carrying guidance to refrigerate also reduced from 87% in the 2009 sample to 84% in 2011. 5.1.3 Encouraging consumers to re-close the pack In several product categories, keeping products airtight helps prevent drying, staling or taking on smells from other foods stored close by. Very few packs of pre-packed ham carried any guidance about reclosing the pack. Only 7 out of 569 packs of ham carried the guidance ‘Keep covered’. This is surprising, as ham is very susceptible to drying out, which may make it unpalatable to consumers. 19 of 33 deli ham products reviewed carried the guidance ‘Always store in its original bag / Keep wrapped in packaging / Keep product in this bag’. 30% of pre-packed cheese carried guidance about using packaging or storage containers to keep the product fresh, something which compares favourably with 6% of pre-packed cheese in the 2009 sample. 9% of this guidance recommended wrapping cheese or storing it in an airtight container, while the remaining packs carried an on-pack ‘flash’ advertising that the pack was re-closable. 19% of pre-packed bread carried guidance about using packaging or storage containers to keep the product fresh. 12% of bread carried guidance to re-close the pack (compared to 11% of pre-packed bread in 2009), while 3% instructed consumers to keep it in an airtight container once opened (a reduction from 7% of the 2009 sample). A small number of bread products, of the ‘crusty’ variety, instructed consumers to keep the product in its original bag, and not to cover a clear, perforated window, to prevent the loaf from losing crustiness. Around a third (34%) of pasta carried guidance about using a storage container or the packaging functionality. On 22% of pasta, this guidance instructed consumers to ‘store in a sealed/airtight container’ or ‘keep airtight’ once opened, while 11% instructed consumers to re-close. 6% of standard dry rice packs carried guidance to re-close the pack, compared to 3% in the 2009 sample. This is despite an increase in the proportion of rice packs that were re-closable (44% in 2009, 73% in 2011). Only 12 packs of standard rice (2%) used an on-pack ‘flash’ to advertise that they were re-closable. 5% of standard rice in 2011 carried guidance to store in an airtight container once opened. This is compared to 7% in 2009. Amongst world breads:
Around a quarter of pitta packs (26%) carried the instruction ‘Once opened store in a sealed/airtight container/keep airtight’. This was 23% in 2009;
Three quarters of wraps (76%) carried this type of instruction. 37% carried guidance to re-close (31% in 2009), 15% to keep covered (16% in 2009) and 24% to store in an airtight container (10% in 2009); and
Ambient naans only carried guidance to store in an airtight container (39%, 17% in 2009) while no packs of chilled naans carried guidance about using a storage container or the packaging functionality. In 2009 naans also carried guidance to keep covered (8%).
5.1.4 Guidance on deli / loose / ISB products Of the 52 stores visited (including online) which sold loose produce (apples, carrots and potatoes), 16 stores, split evenly between the eight Morrisons and eight The Co-operative stores, provided plastic bags which carried storage guidance relating to products which might be put in them.

Helping Consumers Reduce Food Waste – A Retail Survey 2011 45
As shown in Figure 11 below, these bags provide a range of storage guidance specific to different types of product. The bags at The Co-operative also included use of the WRAP ‘Love Food, Hate Waste’ logo, while the bags at Morrisons included the strap-line ‘making food waste a thing of the past’.
Figure 11 The Co-operative and Morrisons loose produce bags
18% of ISB rolls carried storage guidance (n=42), compared to just 3% in the 2009 sample. 13 of these 42 products were strictly ‘loose’, coming with a paper or plastic bag. The majority of products (n=34) which carried guidance, either on-pack or on a bag for selection of loose produce, stated to ‘store in a cool dry place’, and guidance to ‘eat on the day of purchase’ or ‘as soon as possible’ was also frequent. All deli ham carried storage guidance (n=33), including guidance to refrigerate (again, all products), guidance on when to eat the product, and guidance to keep the product in its original packaging (referring to the deli bag). One example of The Co-operative ham carried the guidance ‘You should take all chilled food home AS QUICKLY AS POSSIBLE’ [sic], which is useful guidance to reiterate to consumers the importance of minimising the time chilled food is out of a chilled environment. The majority (91%) of deli cheese carried storage guidance (n=46), predominantly guidance to refrigerate, alongside information about when to consume and guidance to keep the product in its original packaging. Three quarters of deli bacon carried storage guidance (n=12), again relating to refrigeration, keeping the product wrapped in packaging and keeping the product in its original bag. 5.2 Fridge temperature guidance A number of products reviewed carried guidance as to the specific temperature at which they should be stored, before and/or after opening. A range of specific guidance was given, varying from product to product and from category to category. It seems that this is an area

Helping Consumers Reduce Food Waste – A Retail Survey 2011 46
of guidance which is unnecessarily confusing for consumers, who are likely to have a single fridge, set to a single temperature, which they may or may not be able to monitor through the use of a fridge thermometer or digital temperature display. The 2011 FSA survey44 found that just 46% of consumers correctly stated that the temperature of a fridge should be below 5oC. 38% ‘didn’t know’. 16% got the answer wrong: 5% said lower than 0oC and 10% said 5oC. If retailers and manufacturers feel that specific temperature guidance is important to the preservation of their products in optimum condition in the home, it would be preferable to state ‘refrigerate below 5oC’ in line with FSA guidance45. 5.2.1 Product categories found to carry specific temperature guidance 13% of all products in the sample carried guidance to store the product at, below, or between specific temperatures. Table 8 outlines the presence of specific temperature storage guidance by product category.
Table 8 Presence of specific temperature storage guidance by product category46, 2011 |Total base: 4,877
Category Sub-category Base Percentage carrying specific temperature storage guidance
Chicken Chilled 313 71%
Yoghurt Multipack 323 44%
Milk 447 43%
Cheese Pre-packed 1186 36%
Ready meals Chilled 328 30%
Yoghurt Single 286 29%
Cooking sauce Chilled 98 26%
Bacon Pre-packed 486 25%
Juice 629 21%
Ham Pre-packed 569 20%
World bread Naan - chilled 31 19%
Salad 181 17%
5.2.2 Temperature values given FSA guidance states that where specific temperature guidance is given, for products to be
stored in the fridge, this guidance should be ‘below 5C’. 31% of chilled products reviewed specified a temperature or range of temperatures at which the products should be kept. The vast majority (81%) of these products carried guidance conforming to the FSA standard. In 30% of instances on chilled products, this guidance stated specifically that the product
should be stored ‘below 5C’. The remaining 70% of chilled products gave a range of
temperatures, of which 5C was the top of range value, e.g. ‘store at 0-5C’ or ‘store at
between 2 and 5C’.
19% of chilled products which carried specific temperature storage guidance gave guidance that did not conform to the FSA advice. This equates to 6% of all chilled products. This guidance was in some cases more cautious than that recommended by the FSA – i.e. it stated a temperature lower than 5C, or a temperature range in which the top-of-range
44 Food and You Survey, FSA, 2011 45 See: http://www.nhs.uk/Livewell/homehygiene/Pages/how-to-store-food-safely.aspx 46 Small numbers of deli products, mayonnaise packs, bread, rolles, pre-prepared carrots, ambient cooking sauce and eggs also carried this type of guidance.

Helping Consumers Reduce Food Waste – A Retail Survey 2011 47
value was lower than 5C. This was true of 14% of chilled products which gave specific temperature guidance. For a still smaller proportion of chilled products, the guidance allowed
for consumers to store at a temperature higher than 5C – i.e. it stated a temperature higher
than 5C, or a temperature range in which the top-of-range value was higher than 5C. This was true of 5% of chilled products which gave specific temperature storage guidance.
Table 9 Type of temperature guidance given across all chilled products | Base: 5,081
Type of guidance given Frequency Percentage of all chilled products
Non-specific temperature guidance given 42 1%
Guidance to 'refrigerate' given 3405 67%
“Lower” temperature or range (finishing lower than 5C) 227 4%
Standard temperature guidance given (at or below 5C) 1298 26%
“Extended” temperature or range (finishing higher than 5C)
73 1%
No temperature guidance given 36 1%
Total 5081 100%
Overall, 22% of chilled products carried guidance to keep the product within a temperature range. These temperature ranges came in a variety of combinations. Full details of ranges seen in the course of the review are detailed in Table 9.
Table 10 Temperature ranges given on chilled products, across all product categories, 2011 | Base: 1,112
Temperature range Frequency Percentage of all temperature ranges
2 to 5C 523 47%
0 to 5C 373 34%
-2 to 4C 154 14%
0 to 4C 19 2%
1 to 5C 17 2%
2 to 4.5C 13 1%
4 to 8C 10 1%
Other 3 <1%
486 chilled products (10% of the total chilled sample) gave single specific temperature values, e.g. ‘Keep refrigerated at 5C’. The most common single value given was ‘at 5C’,
carried by 79% of chilled products giving a single temperature value. The next most common temperature specified was ‘at 6C’ (10%), followed by ‘at 4C’ (8%). A very small
number of chilled products (13 in total) gave guidance to store ‘at 7C’ or ‘at 8C’. 5.2.3 Product categories largely in line with FSA temperature guidelines Milk had quite high use of temperature specific guidance (43%) in 2011, and this guidance was very consistent, with 99% of specific guidance given conforming to FSA guidelines, stating the milk should be stored at or below 5°C. 23% of these specified the product should be stored ‘at 5°C’, 61% specified ‘between 0-5°C’, and 16% specified ‘at 2-5°C’. One product specified it should be stored ‘at 6°C’.

Helping Consumers Reduce Food Waste – A Retail Survey 2011 48
30% of chilled ready meals carried temperature specific guidance (compared to 14% in 2009). All of this guidance conformed to FSA guidelines. Guidance on pre-packed cheese was also consistent where a temperature was specified. 36% had specific temperature storage guidance, and all but one pack was in line with FSA guidelines. A quarter (25%) of pre-packed bacon carried specific temperature storage guidance (compared to 26% in 2009), and this guidance was very consistent, with 97% being in line with FSA guidelines, while the remaining 3% of specific temperature guidance was cautious – finishing below 5°C. 26% of chilled cooking sauce gave specific temperature storage guidance. The vast majority of this was in line with FSA guidelines, but a very small number of products in this category carried guidance that was higher than recommended by the FSA, instructing consumers to store ‘at 8°C’ (2 cases). 5.2.4 Product categories with guidance varying from FSA guidelines 71% of chilled chicken in 2011 carried specific temperature guidance. However 92% of this was ‘cautious’ in comparison with FSA guidelines. As in 2009, a number of different temperature ranges were provided for this product:
69% of this guidance suggested between -2 to 4°C (51% in 2009);
11% suggested below 5°C;
8% suggested between 2 and 5°C; and
9% suggested between 0 and 4°C;
4% suggested below 4°C.
81% of single yoghurts in 2011 carried non-temperature specific guidance to ‘refrigerate’. The remaining 29% specified temperatures, 73% of which conformed to FSA guidelines. 15% gave cautious specific temperatures, and 12% temperatures higher than recommended by the FSA (including 6 products with ranges finishing at 8°C). 55% of multi-pack yoghurts carried only guidance to ‘refrigerate’, while 44% carried specific temperature guidance. 69% of the specific guidance was in line with FSA guidelines, while 31% gave temperature guidance higher than recommended by the FSA, up to 6°C. 21% of orange juice in the 2011 sample carried specific temperature guidance. 91% of this guidance was in line with FSA guidelines, while the remaining 9% of specific guidance given was higher than recommended by the FSA, up to 7°C (n=2) or 8°C (n=10).
20% of pre-packed ham carried specific temperature storage guidance, 96% of which was in line with FSA guidelines. Some cautious and some temperature values higher than recommended by the FSA were also given, including ‘below 4°C’ and ‘below 7°C’. 17% of salad in the sample had specific temperature guidance, and 94% of this was in line with FSA guidelines. The remainder was cautious guidance, either ‘1-4°C’ or ‘2-4°C’. 5.3 Use of on pack ‘flash’ – storage guidance Use of visual cues can draw consumers’ attention to particular guidance which may be key to keeping products in an appropriate way. Numerous examples of this type of guidance were found in 2011. A number of products reviewed were found to carry on pack ‘flash’ labelling that gave storage guidance.

Helping Consumers Reduce Food Waste – A Retail Survey 2011 49
19% of pre-packed cheeses carried an on pack ‘flash’ label informing consumers that the pack is re-closable in order to keep the product fresher for longer. 22% of milk reviewed carried on pack ‘flash’ labelling with information about the expected life of the product. These products were generally filtered in order to increase their shelf lives. 77% of these products were branded, the remainder were own-label. 14% of wraps carried on pack ‘flash’ labelling. The majority of these were information about re-closing the pack (n=33), while a smaller proportion were tips on how best to store at home (n=8). A very small number of packs of apples (n=11) carried on pack ‘flash’ labelling with information about how best to store them at home (in the refrigerator). All of these apple packs were own-label, and were split between Sainsbury's (5 of their 16 packs) and Morrisons (6 of 24 packs). 35 packs of standard carrots (12%) had on pack ‘flash’ labelling with information about how best to store them at home (in the refrigerator); 33 of these were from Morrisons. 23% of potatoes had on pack ‘flash’ labelling giving information about how best to store potatoes at home. 26 of these packs were reviewed at Tesco (51% of Tesco potatoes), and 33 at Morrisons (77% of Morrisons pre-packed potatoes). 7% of pre-packed bread carried on-pack ‘flash’ labelling, and these labels conveyed a variety of types of information. Most common was information that the product would stay ‘fresher for longer’ (n=34), followed by information about how best to store the product at home (n=19). Small numbers of products carried pointers that the pack was split into smaller sections or information about the expected life of the product. All of those carrying information about how best to store at home were Morrisons own-label (Figure 12). This pack also states the number of slices in the pack (including the ends), which was a recommendation from earlier WRAP research47.
Figure 12 Morrisons bread with on pack ‘flash’ detailing how best to store at home, 2011
The ‘Lasting Leaf’ salad uses the product name as a type of ‘flash’, carrying the information ‘Opened this bagged salad lasts a minimum of 2 days longer than standard bagged salads’. This highlights the product’s extended open shelf life to consumers who might be concerned that they will not get through a standard bag of salad before it spoils, and who are unable to find a pack size that suits their needs.
47 Reducing Household Bakery Waste, WRAP, 2011

Helping Consumers Reduce Food Waste – A Retail Survey 2011 50
Kingsmill’s ‘Little Big Loaf’ used its name in a similar way. This pre-packed bread stated ‘Bread is best when it is soft and fresh, which is why Kingsmill has taken your favourite bread and specially baked a little big loaf. A loaf with full sized slices, just fewer of them. Each slice will be as enjoyable as the first and no wastage too’. Kingsmill also used a bread bin logo to frame and draw attention to storage guidance (9% of pre-packed bread; Figure 13).
Figure 13 Kingsmill bread bin logo, 2011
5.4 Retail environment in which products are stored It is interesting to note that some products, which may be stored at ambient temperatures but will keep longer in the fridge, may be presented to consumers in either chilled or ambient locations in store. Previous research48 has shown that some consumers take their cue as to where to store a product by its location in the retail environment. Storing products such as apples and carrots in chilled conditions in the shop, may therefore make some consumers more likely to refrigerate them when they get them home49. Table 11 details the proportion of carrots and apples in the 2011 sample found in chilled and ambient retail environments.
Table 11 Proportions of apples and carrots found in chilled and ambient retail environments, 2011 | Total base: 566
Product category Sub-category Bases Chilled Ambient50
Carrots
Standard – pre-packed 304 17% 83%
Standard – loose 47 19% 81%
Apples
Pre-packed 146 5% 95%
Loose 69 13% 87%
It seemed that loose apples and carrots were slightly more likely to be sold chilled in convenience stores than they were in supermarkets, but the sample sizes of loose apples and carrots in convenience stores (n=16 and n=7 respectively) and overall (n=69 and n=47 respectively) was quite small, so this is not particularly robust. Standard carrots were more likely to be chilled in convenience stores than in supermarkets, but again the sample size is small (n=27 products in convenience stores).
48 Consumer Insight: Date Labels and Storage Guidance, WRAP, 2011 49 The additional energy which would be required to chill products currently sold in ambient locations might prohibit wider uptake of this practice, both on financial and environmental grounds. 50 The judgement as to whether a product was stored in chilled or ambient conditions was made by the researcher at the point of sale. Some products will have appeared to be ambient, when they were in fact chilled. As researcher judgement can be assumed to be similar to that of the average consumer (or indeed better informed) it may be assumed that influence on consumer decisions about where to store a product at home would be similar for a product that only appeared to be stored ambiently, and one that was in fact stored ambiently.

Helping Consumers Reduce Food Waste – A Retail Survey 2011 51
6.0 Freezing and defrosting guidance 6.1 Freezability of products Products falling under the following categories or sub-categories were classed as ‘freezable’ for the purposes of this research:
Bread;
Rolls;
World breads;
Cooking sauce;
Bacon;
Chilled ready meals;
Milk;
Chilled chicken; and
Orange juice.
Products in two sub-categories were sold frozen, and are treated separately in this research:
Frozen chicken; and
Frozen ready meals. The exclusion of all the other products researched through this survey from our analysis of freezable products is not an endorsement of their lack of freezing guidance. There are ways to successfully freeze, defrost and use several of these products e.g. yoghurt and cheese, but we recognise that they are not as easily home frozen by the consumer, and that this makes it more difficult for retailers and manufacturers to communicate the potential for freezing these products in on-pack messaging. WRAP is keen to explore how guidance on freezing these products might be successfully delivered to consumers e.g. online, through recipes etc. and is undertaking research51 to develop optimum freezing guidance that could be used in communications activities. 6.2 Presence of guidance Data was gathered on freezing guidance which took different forms on products. The most complex and detailed guidance was found in the form of text on product labels, or on the outer pack sleeve. Detail on labels was usually found on the front, external side of the packaging, but in some cases, if a product was cased in clear plastic e.g. chicken, or bacon, instructions were found on the reverse of labels, requiring the consumer to open the pack to view the full freezing guidance (Figure 14)52.
Figure 14 Chicken indicating storage guidance is on reverse of the label, together with storage and freezing guidance given on the reverse (Jan ’12)
Freezing guidance was also given in the form of symbols, sometimes isolated, sometimes with caption text, and sometimes alongside detailed freezing guidance. In the analysis below it is stated whether the guidance we are referring to was seen as ‘text’ or in symbol form.
51 Review of literature informing industry guidance to consumers on the home freezing of food, WRAP, May 2012 52 The presence of this type of guidance was observed through the study but not separately recorded.
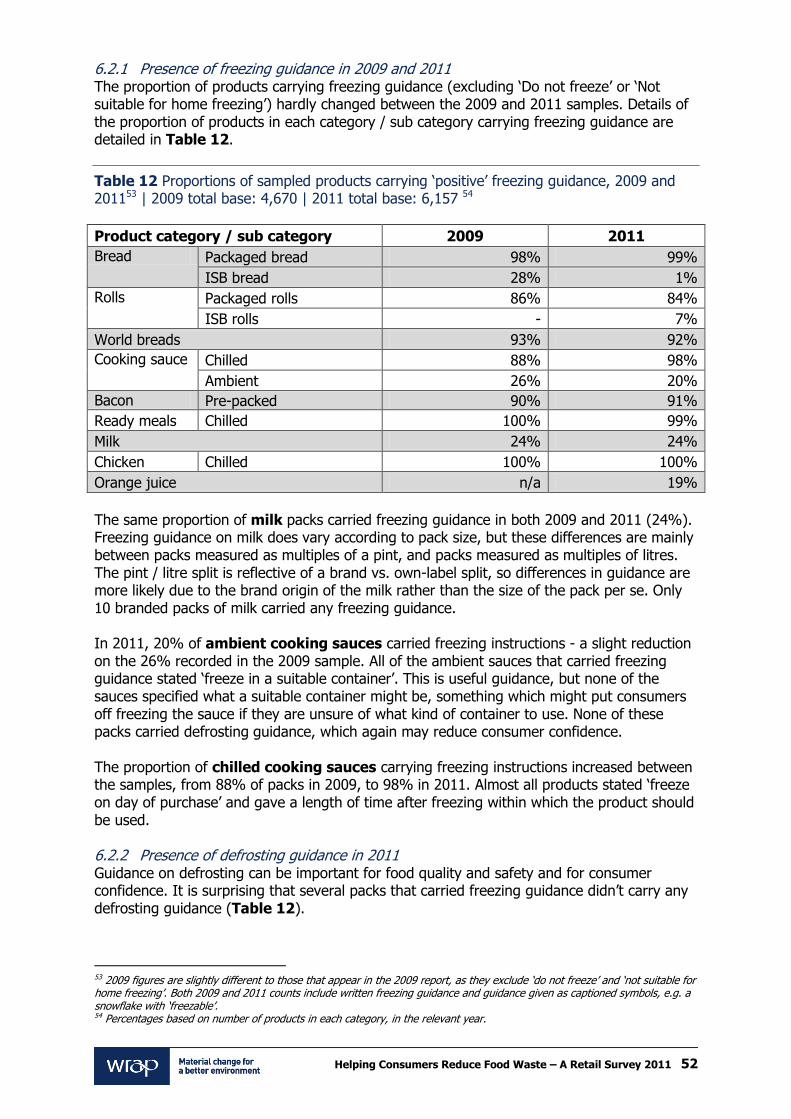
Helping Consumers Reduce Food Waste – A Retail Survey 2011 52
6.2.1 Presence of freezing guidance in 2009 and 2011 The proportion of products carrying freezing guidance (excluding ‘Do not freeze’ or ‘Not suitable for home freezing’) hardly changed between the 2009 and 2011 samples. Details of the proportion of products in each category / sub category carrying freezing guidance are detailed in Table 12.
Table 12 Proportions of sampled products carrying ‘positive’ freezing guidance, 2009 and 201153 | 2009 total base: 4,670 | 2011 total base: 6,157 54
Product category / sub category 2009 2011
Bread Packaged bread 98% 99%
ISB bread 28% 1%
Rolls Packaged rolls 86% 84%
ISB rolls - 7%
World breads 93% 92%
Cooking sauce Chilled 88% 98%
Ambient 26% 20%
Bacon Pre-packed 90% 91%
Ready meals Chilled 100% 99%
Milk 24% 24%
Chicken Chilled 100% 100%
Orange juice n/a 19%
The same proportion of milk packs carried freezing guidance in both 2009 and 2011 (24%). Freezing guidance on milk does vary according to pack size, but these differences are mainly between packs measured as multiples of a pint, and packs measured as multiples of litres. The pint / litre split is reflective of a brand vs. own-label split, so differences in guidance are more likely due to the brand origin of the milk rather than the size of the pack per se. Only 10 branded packs of milk carried any freezing guidance. In 2011, 20% of ambient cooking sauces carried freezing instructions - a slight reduction on the 26% recorded in the 2009 sample. All of the ambient sauces that carried freezing guidance stated ‘freeze in a suitable container’. This is useful guidance, but none of the sauces specified what a suitable container might be, something which might put consumers off freezing the sauce if they are unsure of what kind of container to use. None of these packs carried defrosting guidance, which again may reduce consumer confidence. The proportion of chilled cooking sauces carrying freezing instructions increased between the samples, from 88% of packs in 2009, to 98% in 2011. Almost all products stated ‘freeze on day of purchase’ and gave a length of time after freezing within which the product should be used. 6.2.2 Presence of defrosting guidance in 2011 Guidance on defrosting can be important for food quality and safety and for consumer confidence. It is surprising that several packs that carried freezing guidance didn’t carry any defrosting guidance (Table 12).
53 2009 figures are slightly different to those that appear in the 2009 report, as they exclude ‘do not freeze’ and ‘not suitable for home freezing’. Both 2009 and 2011 counts include written freezing guidance and guidance given as captioned symbols, e.g. a snowflake with ‘freezable’. 54 Percentages based on number of products in each category, in the relevant year.

Helping Consumers Reduce Food Waste – A Retail Survey 2011 53
For chilled naans and orange juice defrosting guidance was given wherever freezing guidance was. For the other categories and sub-categories reviewed, freezing guidance was given on some products which carried no defrosting guidance. 19% of orange juice packs carried freezing guidance, and all of these also carried guidance to consumers on the best way to defrost the product. 9% of the packs which carried storage guidance used emotive language which may be useful in encouraging consumers to freeze the product. Both ‘ideal for freezing’ and ‘freezes beautifully’ were seen. A further 4% of orange juice packs, however, stated explicitly that the product should not be frozen. There does seem to be some variation in this by packaging type, with 7% of all plastic bottles/jars of juice carrying this guidance, compared with less than 1% of cartons.
Table 13 Proportion of products in category / sub category carrying freezing and defrosting guidance55, 2011 | Total base: 6,157
Product category
Product sub category Freezing present
Defrosting present
Bases
Bread Packaged bread 99% 33% 882
ISB bread 1% 1% 177
Rolls Packaged rolls 84% 49% 624
ISB rolls 7% <1% 234
World bread Pitta 87% 62% 193
Wraps 97% 41% 290
Naans - ambient 90% 75% 172
Naans - chilled 94% 94% 31
Chicken Chilled 100% 86% 313
Bacon Bacon - pre-packed 91% 81% 486
Bacon - deli - - 12
Milk 24% 22% 447
Ready meals Chilled 99% 81% 328
Orange juice 19% 19% 629
Cooking sauce Chilled 98% 71% 98
Ambient 20% - 1241
Total
63% 45% 6157
6.2.3 Presence of guidance on loose / deli products The proportion of ISB bread carrying freezing guidance fell from 28% to 1% between 2009 and 2011. A very small proportion of ISB bread (1%) carried both freezing guidance and defrosting guidance. It would be good to see more guidance on this type of product. For ISB rolls, however, this trend was reversed: while none carried freezing guidance in 2009, 7% did so in 2011. This suggests that there is scope to substantially increase the prevalence freezing guidance on ISB products. 7% of ISB rolls gave freezing guidance, the highest proportion of any loose or deli category. None of these provided defrosting guidance, however. No deli bacon carried freezing guidance. This would be a useful addition, as the very short given shelf life of this product means anything that would aid consumers in managing it to avoid waste would be welcomed.
55 Omits guidance not to freeze, includes guidance in the form of symbols with associated text.
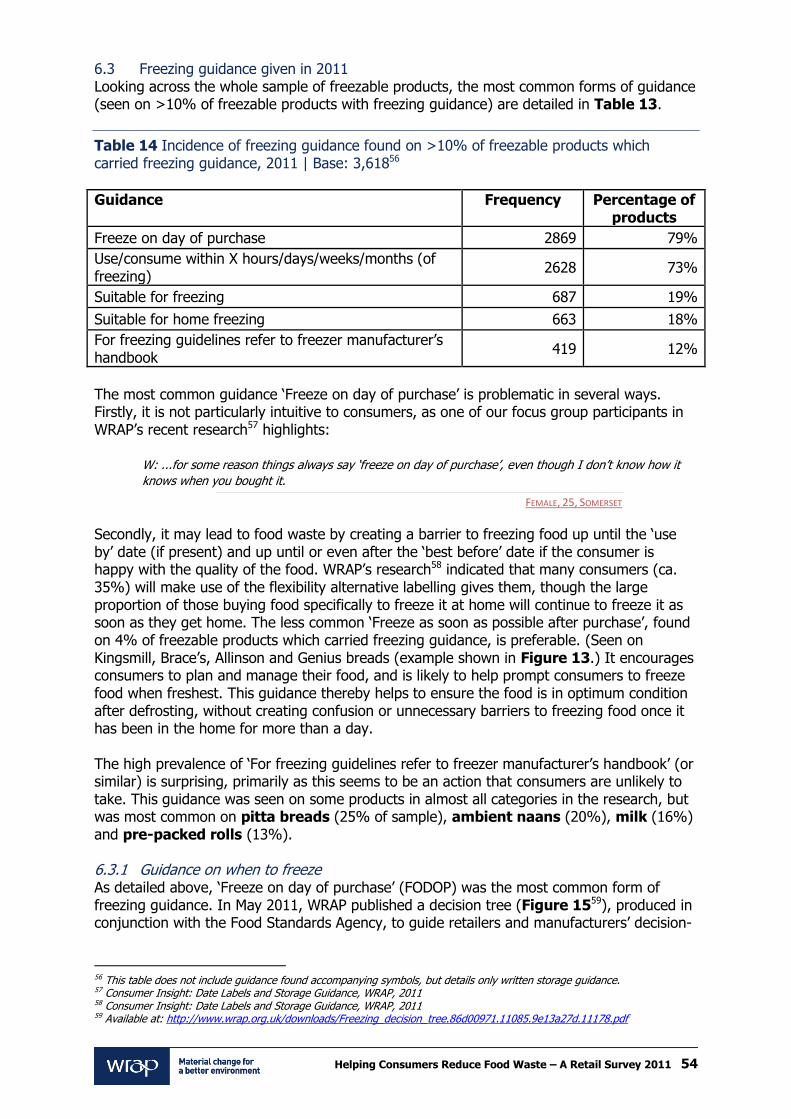
Helping Consumers Reduce Food Waste – A Retail Survey 2011 54
6.3 Freezing guidance given in 2011 Looking across the whole sample of freezable products, the most common forms of guidance (seen on >10% of freezable products with freezing guidance) are detailed in Table 13.
Table 14 Incidence of freezing guidance found on >10% of freezable products which carried freezing guidance, 2011 | Base: 3,61856
Guidance Frequency Percentage of products
Freeze on day of purchase 2869 79%
Use/consume within X hours/days/weeks/months (of freezing)
2628 73%
Suitable for freezing 687 19%
Suitable for home freezing 663 18%
For freezing guidelines refer to freezer manufacturer’s handbook
419 12%
The most common guidance ‘Freeze on day of purchase’ is problematic in several ways. Firstly, it is not particularly intuitive to consumers, as one of our focus group participants in WRAP’s recent research57 highlights:
W: ...for some reason things always say ‘freeze on day of purchase’, even though I don’t know how it
knows when you bought it.
FEMALE, 25, SOMERSET
Secondly, it may lead to food waste by creating a barrier to freezing food up until the ‘use by’ date (if present) and up until or even after the ‘best before’ date if the consumer is happy with the quality of the food. WRAP’s research58 indicated that many consumers (ca. 35%) will make use of the flexibility alternative labelling gives them, though the large proportion of those buying food specifically to freeze it at home will continue to freeze it as soon as they get home. The less common ‘Freeze as soon as possible after purchase’, found on 4% of freezable products which carried freezing guidance, is preferable. (Seen on Kingsmill, Brace’s, Allinson and Genius breads (example shown in Figure 13.) It encourages consumers to plan and manage their food, and is likely to help prompt consumers to freeze food when freshest. This guidance thereby helps to ensure the food is in optimum condition after defrosting, without creating confusion or unnecessary barriers to freezing food once it has been in the home for more than a day. The high prevalence of ‘For freezing guidelines refer to freezer manufacturer’s handbook’ (or similar) is surprising, primarily as this seems to be an action that consumers are unlikely to take. This guidance was seen on some products in almost all categories in the research, but was most common on pitta breads (25% of sample), ambient naans (20%), milk (16%) and pre-packed rolls (13%). 6.3.1 Guidance on when to freeze As detailed above, ‘Freeze on day of purchase’ (FODOP) was the most common form of freezing guidance. In May 2011, WRAP published a decision tree (Figure 1559), produced in conjunction with the Food Standards Agency, to guide retailers and manufacturers’ decision-
56 This table does not include guidance found accompanying symbols, but details only written storage guidance. 57 Consumer Insight: Date Labels and Storage Guidance, WRAP, 2011 58 Consumer Insight: Date Labels and Storage Guidance, WRAP, 2011 59 Available at: http://www.wrap.org.uk/downloads/Freezing_decision_tree.86d00971.11085.9e13a27d.11178.pdf
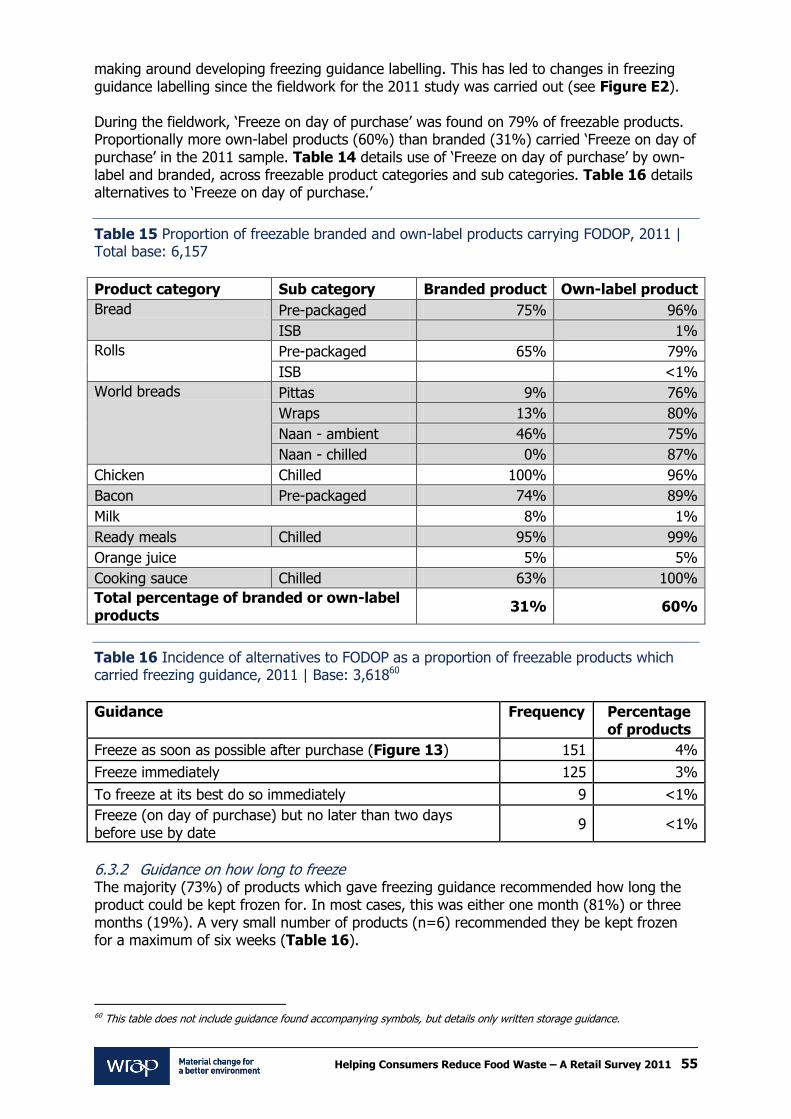
Helping Consumers Reduce Food Waste – A Retail Survey 2011 55
making around developing freezing guidance labelling. This has led to changes in freezing guidance labelling since the fieldwork for the 2011 study was carried out (see Figure E2). During the fieldwork, ‘Freeze on day of purchase’ was found on 79% of freezable products. Proportionally more own-label products (60%) than branded (31%) carried ‘Freeze on day of purchase’ in the 2011 sample. Table 14 details use of ‘Freeze on day of purchase’ by own-label and branded, across freezable product categories and sub categories. Table 16 details alternatives to ‘Freeze on day of purchase.’
Table 15 Proportion of freezable branded and own-label products carrying FODOP, 2011 | Total base: 6,157
Product category Sub category Branded product Own-label product
Bread Pre-packaged 75% 96%
ISB
1%
Rolls Pre-packaged 65% 79%
ISB
<1%
World breads Pittas 9% 76%
Wraps 13% 80%
Naan - ambient 46% 75%
Naan - chilled 0% 87%
Chicken Chilled 100% 96%
Bacon Pre-packaged 74% 89%
Milk 8% 1%
Ready meals Chilled 95% 99%
Orange juice 5% 5%
Cooking sauce Chilled 63% 100%
Total percentage of branded or own-label products
31% 60%
Table 16 Incidence of alternatives to FODOP as a proportion of freezable products which carried freezing guidance, 2011 | Base: 3,61860
Guidance Frequency Percentage of products
Freeze as soon as possible after purchase (Figure 13) 151 4%
Freeze immediately 125 3%
To freeze at its best do so immediately 9 <1%
Freeze (on day of purchase) but no later than two days before use by date
9 <1%
6.3.2 Guidance on how long to freeze The majority (73%) of products which gave freezing guidance recommended how long the product could be kept frozen for. In most cases, this was either one month (81%) or three months (19%). A very small number of products (n=6) recommended they be kept frozen for a maximum of six weeks (Table 16).
60 This table does not include guidance found accompanying symbols, but details only written storage guidance.

Helping Consumers Reduce Food Waste – A Retail Survey 2011 56
Figure 15 Freezing refrigerated food – labelling decision tree
1. Review products to determine their suitability for home freezing. 2. For those foods that are suitable for home freezing, include the ‘snowflake’ logo on the
label, with text ‘suitable for home freezing’ or equivalent where possible. 3. For those products that are marked with the snowflake logo, provide clear and
consistent, supplementary guidance. Guidance could be communicated on-pack, online and in-store.

Helping Consumers Reduce Food Waste – A Retail Survey 2011 57
Table 17 Length of time to freeze products, by branded and own-label, 2011 | Total branded base: 2,779; Total own-label base: 3,378
Category or sub-category
Length of time product may be frozen for
Percentage of branded product in this (sub) category, carrying this guidance
Percentage of own-label products in this (sub) category, carrying this guidance
Overall percentage
of this category
giving this guidance
Bread packaged 1 month 6% 92% 31%
3 months 38%
27%
Bread ISB 1 month
1% 1%
3 months
Rolls packaged 1 month 14% 65% 47%
3 months 9% 11% 10%
Rolls ISB 1 month
<1% <1%
3 months
4% 4%
World bread - pitta 1 month 36% 76% 64%
3 months
World bread - wrap 1 month 8% 80% 30%
3 months 62%
43%
World bread - naan - ambient
1 month 86% 64% 73%
3 months
World bread - naan - chilled
1 month
93% 90%
3 months
Chicken - chilled 1 month 100% 96% 96%
3 months
Bacon - pre-packed 1 month 48% 88% 79%
3 months 14% 7% 8%
Milk 1 month 1% 9% 7%
3 months
Ready meals - chilled 1 month 64% 97% 90%
3 months 30% 3% 9%
Juice 1 month 2% 22% 13%
3 months
Cooking sauce - chilled 1 month 63% 36% 97%
3 months
Total percentage branded / own-label
1 month 10% 54% 34%
3 months 15% 3% 57%
In the 2011 sample, a greater proportion of bread carried instructions to use within 1 month of freezing (31%) than within 3 months of freezing (27%). This is the inverse of what was found in 2009, when 43% of bread carried the instruction to use within 3 months of freezing, while 28% instructed consumers to use within one month. Nearly all chilled chicken (96%) reviewed in 2011 carried guidance to use within one month of freezing, compared to 76% in 2009.

Helping Consumers Reduce Food Waste – A Retail Survey 2011 58
The proportion of chilled cooking sauces carrying guidance to use within one month of freezing increased from 87% in 2009 to 97% in the 2011 sample. Where this guidance was given for chicken and chilled cooking sauces, consumers were always given one month to use these products (in 2009 as in 2011). Increases in the prevalence of guidance to ‘use within one month of freezing’ between 2009 and 2011, therefore, reflect an overall increase in use of this type of guidance for these products, rather than a shortening of the amount of time consumers are being given in which to use them. 6.3.3 Freezer star marking guidance Freezer star marking guidance appears on various frozen and freezable foods to indicate how long the product will last in its frozen state before spoiling, in different types of freezers61. The star is classified according to the temperature the freezer compartment will be able to maintain. Figure 16 shows the two types of star marking guidance found. The distinction between these two types of guidance is that the freezer star marking table gives consumers options as to what appliance they can freeze the product in, while the ‘Freeze in a x ‘*’ freezer guidance suggests that the product cannot be frozen in an appliance with a different star rating. Table 16 details the prevalence of freezer star marking guidance in each product category in which it was found.
Figure 16 Two types of freezer star marking guidance, 2011
Table 17 Presence of freezer star marking guidance by product category / sub category, 2011 | Total base: 6,323
Product category/sub category
Freezer star marking table
'Freeze in a (x)* freezer' guidance
Chicken Frozen 94%
Ready meals Frozen 75% 5%
World bread Wraps 7%
World bread Pittas 5% 4%
Ready meals Chilled 3% 7%
Chicken Chilled 5%
Cooking sauce Chilled 4%
Bacon Pre-packed 4%
Orange juice 3%
Rolls Pre-packed 3%
World bread Naan – ambient 3%
Bread Pre-packed 1%
Total, for freezable sample 3% 2%
61 Commission Regulation (EC) No. 643/2009 specifies the * rating dependent on the temperature the freezer or freezer compartment achieves.

Helping Consumers Reduce Food Waste – A Retail Survey 2011 59
The proportions of branded and own-label products which carry freezer star marking guidance are similar (3% of each of their respective freezable/frozen sample). Only own-label products used ‘freeze in an (x)* freezer’, and this made up 4% of the sample of own-label freezable/frozen products (base: 3,483). Overall, use of freezer star marking guidance is low, but most common on frozen products. It is not clear the extent to which this sort of labelling is clear / useful to consumers. In previous WRAP research62, just under one third of the sample understood that star marking guidance is related to how long food can be stored according to the type of freezer they own/where in the freezer they store it. Half had some idea that it’s related to freezing food but could not be more specific than that. 6.4 Use of on pack ‘flash’ – freezing guidance Some products used on pack ‘flash’ labelling to draw consumers’ attention to the fact that they could be frozen. This type of labelling is useful for prompting consumers to think about how they will manage the food they buy while they are in the supermarket. A small number of packs of chilled chicken carried an on pack ‘flash’ label, stating either ‘Individually wrapped & ideal for freezing’ or ‘Fresh for freezing’. All of these packs contained individually wrapped fillets that could be removed from the pack and defrosted as required, a good way of enabling consumers to effectively manage its short open shelf life, particularly if they are only likely to use one fillet at a time. 9 large (24 roll) packs of ISB rolls from Asda carried an on pack ‘flash’ stating ‘Ideal for freezing’63. 64 packs of Discovery wraps employed the snowflake logo on the front of their packs with the caption ‘Eat me now or freeze me for later!’ (Figure 17).
Figure 17 On pack ‘flash’ on Discovery tortilla wraps, 2011
6.5 Freezing symbols A number of symbols were used to communicate the freezability (or otherwise) of products, as well as to highlight defrosting guidance or indicate that a product should not be refrozen once thawed. Some symbols which are commonly used to denote freezability were also employed for different ends. 6.5.1 Use of snowflake logo The use of snowflake logos can draw consumer attention to the fact that a product is freezable, and encourage good food management behaviours. Numerous examples of snowflake logos, or star logos intended to represent snowflakes were found. Table 18 summarises the main types and combinations of these logos.
62 Understanding Consumer Use of the Freezer, WRAP, 2010 63 Eight of these products are proxy data, generated from a product purchased in the Asda online shop.

Helping Consumers Reduce Food Waste – A Retail Survey 2011 60
Table 18 Use of snowflake and star logos, 2011 | Base: 12,149
Symbol(s) Total products (Base: 12,149)
Freezable products (Base: 6,175)
Frequency % Frequency %
Snowflake/star - standard use, with accompanying text
1800 15% 1800 29%
Snowflake/star - standard use, next to freezing guidance
577 5% 577 9%
Snowflake - standard use, with accompanying text, and star - standard use, next to freezing guidance.
188 2% 188 3%
Snowflake/star - standard use, without text 126 1% 126 2%
Snowflake - alternative use, frozen product 68 1% n/a n/a
Snowflake - alternative use, refrigeration temperature guidance
56 <1% 36 <1%
Snowflake - alternative use - refrigeration temperature guidance, and star - standard use - with accompanying text.
49 <1% 49 <1%
Other use of star or snowflake 19 <1% 5 <1%
No snowflake or star 9266 76% 3376 55%
It is encouraging to see that the most commonly used form of freezing symbol is the clearest and most straightforward, a snowflake or star with accompanying text. The most common text to accompany the snowflake or star freezing symbols was ‘Suitable for home freezing’ (42% of accompanying text recorded). ‘Freezable’ (35%) was also popular, as was ‘Suitable for freezing’ (18%). There were small numbers of snowflake or star symbols that appeared with other accompanying text, including ‘Eat me now or freeze me for later’ (3%) ‘Freeze unopened on day of purchase’ (1%) and ‘Fresh for freezing’ (<1%). The use of a snowflake or a star next to freezing guidance is also positive, but is less likely to draw the consumer’s attention than a separate symbol on the front of a pack, particularly at the point of sale when food management plans may be being made. The snowflake with accompanying text, in combination with the star next to freezing guidance is a thorough approach that draws attention, explains the symbol, and highlights more detailed freezing guidance where it occurs. The use of snowflakes or stars without text is not problematic, but retailers and manufacturers should be aware that understanding of these logos is not universal (when shown the snowflake logo only half (54%) recognised it as meaning the item is suitable for freezing64, though this had risen slightly to 62% in a later WRAP study65) and more could be done to help increase it. Accompanying text, even a simple ‘freezable’, would be an improvement on this use of logos. Around half of products classed as ‘freezable’ did not carry a snowflake or star symbol at all, and some snowflake logos observed during the fieldwork have subsequently been removed, even where there was space on-pack to include it. This seems like a missed opportunity to highlight a product’s freezability to consumers, when this is something which may be instrumental in buying decisions at the point of sale. Table 19 details use and context of snowflake and star symbols found in the research.
64 Understanding Consumer Use of the Freezer, WRAP, 2010 65 Consumer Insight: Date Labels and Storage Guidance, WRAP, 2011

Helping Consumers Reduce Food Waste – A Retail Survey 2011 61
Table 19 Type and context of symbol used by product category / sub category of freezable and frozen products, 2011 | Total base: 6,323 Product category / sub category
Snowflake/ star - standard use, with accompanying text
Snowflake/ star - standard use, next to freezing guidance
Snowflake - standard use, with accompanying text, and star - standard use, next to freezing guidance.
Snowflake/ star - standard use, without text
Snowflake - alternative use, frozen product
Snowflake - alternative use - refrigeration temperature guidance, and star - standard use - with accompanying text.
Snowflake - alternative use, refrigeration temperature guidance
Other use of star or snowflake
No freezing symbol present
Bread Pre-packaged 52% 20% 4% 11%
0% 13%
Rolls Pre-packaged 59% 9% 9% 0%
1%
23%
ISB 0%
100%
World bread
Pitta 56% 11% 8% 1%
24%
Wraps 66% 4% 6% <1%
24%
Naan - ambient 41% 17% 8% 1%
34%
Naan - chilled 39% 19% 32%
10%
Chicken Frozen
38%
9% 53%
Chilled 43% 25%
4%
8%
<1% 21%
Bacon Pre-packed 36% 14%
2%
5%
43%
Milk
8%
92%
Ready meals
Chilled 69% 1% 13% <1%
3% 2% 1% 10%
Frozen
43%
8% 49%
Juice 1% 11%
1%
1%
86%
Cooking sauce
Chilled 49% 22% 1% 1%
11%
15%
Total 28% 9% 3% 2% 1% 1% 1% 0% 55%

Helping Consumers Reduce Food Waste – A Retail Survey 2011 62
The number of milk packs carrying snowflake/star freezing symbols doubled from 4% of the 2009 sample to 8% in 2011, despite the proportion of products carrying freezing guidance remaining constant between the two samples (24%). 80% of chilled chicken had a snowflake/star freezing symbol. 71% of these symbols had accompanying text. Chilled naans had a very high prevalence of snowflake/star freezing symbols (90%) (base: 31). The majority of ambient world bread carried the snowflake symbol. Symbols were most prevalent on packs of wraps and pittas at 76%, compared to 66% for ambient naans. 91% of pre-packed bacon carried freezing guidance (90% in the 2009 sample) and 52% of bacon products carried a snowflake/star symbol to indicate freezability. As in 2009, most of the bacon packs that did not provide guidance on freezing were branded - 24% against 5% of all own-label bacon packs. As in 2009, no snowflake freezing symbols were seen on ambient cooking sauce in 2011. Chilled cooking sauce had a high incidence of snowflake/star freezing symbols in the 2011 sample at 73%, a slight increase on the 67% seen in the 2009 sample. 13% of orange juice packs carried a snowflake freezing symbol. 6.5.2 Use of snowflake logo to denote refrigeration guidance The use of snowflakes to highlight refrigeration temperature guidance is not helpful to
consumer understanding. This use of the symbol was seen with both ‘below 4C’ and ‘below
5C’ accompanying text. Again this detracts from the meaning of the snowflake. This symbol occurred on bagged salad (n=15) (Figure 19), carrots (n=3) and ham (n=2), amongst other products. 5% of bacon packs were found to employ a snowflake symbol to highlight refrigeration
temperature guidance. All of these snowflakes carried the accompanying text ‘below 5C’. 5% of chilled cooking sauces in 2011 were found to employ a snowflake symbol to highlight refrigeration temperature guidance. All of these snowflakes carried the
accompanying text ‘below 5C’. Details of how this use of the snowflake symbol to signify refrigeration was spread across product categories can be found in Table 20.
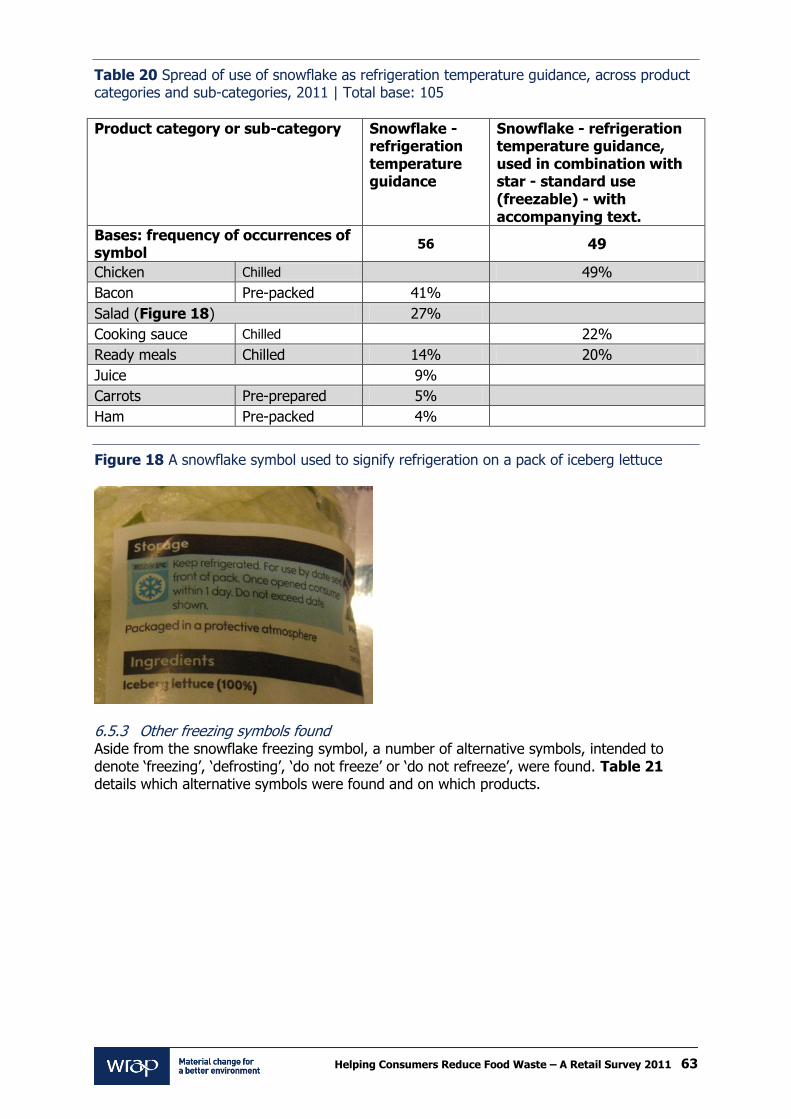
Helping Consumers Reduce Food Waste – A Retail Survey 2011 63
Table 20 Spread of use of snowflake as refrigeration temperature guidance, across product categories and sub-categories, 2011 | Total base: 105
Product category or sub-category Snowflake - refrigeration temperature guidance
Snowflake - refrigeration temperature guidance, used in combination with star - standard use (freezable) - with accompanying text.
Bases: frequency of occurrences of symbol
56 49
Chicken Chilled
49%
Bacon Pre-packed 41%
Salad (Figure 18) 27%
Cooking sauce Chilled
22%
Ready meals Chilled 14% 20%
Juice 9%
Carrots Pre-prepared 5%
Ham Pre-packed 4%
Figure 18 A snowflake symbol used to signify refrigeration on a pack of iceberg lettuce
6.5.3 Other freezing symbols found Aside from the snowflake freezing symbol, a number of alternative symbols, intended to denote ‘freezing’, ‘defrosting’, ‘do not freeze’ or ‘do not refreeze’, were found. Table 21 details which alternative symbols were found and on which products.

Helping Consumers Reduce Food Waste – A Retail Survey 2011 64
Table 21 Alternative and variant freezing symbol; ‘use by’ product category, 2011 | Total base: 1,049
*
(variant of snowflake)
Nine pointed black star (variant of snowflake) Igloo
Jug with three stars inside Polar bear
Crossed out snowflake66
Polar bear with crossed out snowflake67
Example image
Bases: frequency of occurrences of symbol
495 81 31 9 50 67 316
Bread packaged 14% 100%
25%
Rolls packaged 25%
10% 3% 22%
World bread - pitta 8%
4% 13%
World bread - wrap 3% 94%
9%
World bread - naan - ambient 4% 6%
9%
World bread - naan - chilled 2%
1%
Chicken - chilled 12%
6% 37% 1%
Bacon - pre-packed 7%
5%
Milk
100% 56%
Ready meals - chilled 18%
24%
Orange juice
58% 16%
Cooking sauce - chilled 6%
Total, of alternative symbols
47% 8% 3% 1% 5% 6% 30%
66 Crossed out snowflakes were used in isolation to signify that a product was either (a) not freezable; or (b) should not be refrozen once thawed. 67 When used in conjunction with a polar bear symbol, the crossed out snowflake always signified that the product should not be refrozen once thawed.
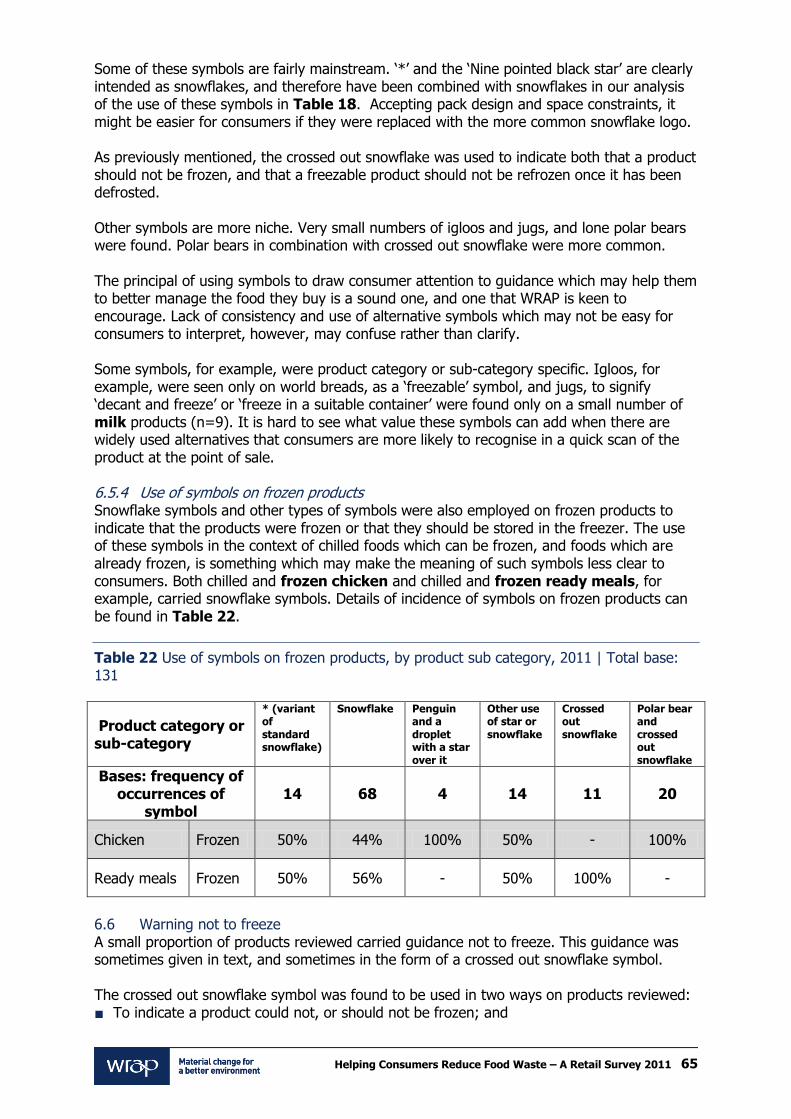
Helping Consumers Reduce Food Waste – A Retail Survey 2011 65
Some of these symbols are fairly mainstream. ‘*’ and the ‘Nine pointed black star’ are clearly intended as snowflakes, and therefore have been combined with snowflakes in our analysis of the use of these symbols in Table 18. Accepting pack design and space constraints, it might be easier for consumers if they were replaced with the more common snowflake logo. As previously mentioned, the crossed out snowflake was used to indicate both that a product should not be frozen, and that a freezable product should not be refrozen once it has been defrosted. Other symbols are more niche. Very small numbers of igloos and jugs, and lone polar bears were found. Polar bears in combination with crossed out snowflake were more common. The principal of using symbols to draw consumer attention to guidance which may help them to better manage the food they buy is a sound one, and one that WRAP is keen to encourage. Lack of consistency and use of alternative symbols which may not be easy for consumers to interpret, however, may confuse rather than clarify. Some symbols, for example, were product category or sub-category specific. Igloos, for example, were seen only on world breads, as a ‘freezable’ symbol, and jugs, to signify ‘decant and freeze’ or ‘freeze in a suitable container’ were found only on a small number of milk products (n=9). It is hard to see what value these symbols can add when there are widely used alternatives that consumers are more likely to recognise in a quick scan of the product at the point of sale. 6.5.4 Use of symbols on frozen products Snowflake symbols and other types of symbols were also employed on frozen products to indicate that the products were frozen or that they should be stored in the freezer. The use of these symbols in the context of chilled foods which can be frozen, and foods which are already frozen, is something which may make the meaning of such symbols less clear to consumers. Both chilled and frozen chicken and chilled and frozen ready meals, for example, carried snowflake symbols. Details of incidence of symbols on frozen products can be found in Table 22.
Table 22 Use of symbols on frozen products, by product sub category, 2011 | Total base: 131
Product category or sub-category
* (variant of standard snowflake)
Snowflake Penguin and a droplet with a star over it
Other use of star or snowflake
Crossed out snowflake
Polar bear and crossed out snowflake
Bases: frequency of occurrences of
symbol 14 68 4 14 11 20
Chicken Frozen 50% 44% 100% 50% - 100%
Ready meals Frozen 50% 56% - 50% 100% -
6.6 Warning not to freeze A small proportion of products reviewed carried guidance not to freeze. This guidance was sometimes given in text, and sometimes in the form of a crossed out snowflake symbol. The crossed out snowflake symbol was found to be used in two ways on products reviewed:
To indicate a product could not, or should not be frozen; and

Helping Consumers Reduce Food Waste – A Retail Survey 2011 66
To indicate that a product should not be re-frozen once it had been defrosted.
Because of this ambiguity, only crossed-out snowflakes appearing on products alongside guidance not to freeze were considered ‘do not freeze’ symbols. Table 23 contains a breakdown of the proportion of all products reviewed carrying guidance not to freeze, with or without a crossed out snowflake, by product category or sub-category.
Table 23 Prevalence of guidance not to freeze, by product category / sub category, 2011 | Base: 12,149
Product category
Product sub-category (where pertinent)
Guidance not to freeze only
Guidance not to freeze with crossed out snowflake
Rolls Pre-packaged 1% <1%
ISB 3%
Carrots
Standard 9%
Pre-prepared 7%
Ham Pre-packed 6% 5%
Cheese Pre-packed 2%
Yoghurt Single 32% 8%
Multipack 9% 3%
Milk 12%
Juice 2% 2%
Cooking sauce Ambient 2%
Mayonnaise 43%
Total – percentage of all products 5% 1%
Guidance not to freeze in conjunction with a crossed out snowflake, was only found on own-label products (n=75). Guidance not to freeze, without the crossed out snowflake, was found on approximately equal numbers of branded (n=284) and own-label (n=274) products. This represents 5% of branded and 4% of own-label products. Overall, 2% of products classified as ‘freezable’ carried guidance not to freeze. 21% of yoghurts (both single and multipack) in 2009 displayed guidance not to freeze. In 2011, 25% of all yoghurts (both single and multipack) displayed guidance not to freeze. 6% of yoghurts in 2011 employed a crossed out snowflake symbol alongside this guidance. Despite the fact that cheese can be frozen, allowing for some textural change, no pre-packed cheese in 2011 carried freezing guidance, but 2% of packs carried guidance not to freeze. These cheeses were both own-label (n=14) and branded (n=8). A high proportion of mayonnaise packs (43%) carried guidance not to freeze. This was predominantly found on branded products. 11% of pre-packed ham in 2011 carried guidance not to freeze, a similar proportion to that found in the 2009 sample (12%). Around half of these (5% of sample) carried a crossed out snowflake symbol. 12% of milk packs stated that they were not suitable for freezing, despite the fact that milk is a freezable product, and 24% of milk packs did carry freezing guidance. All of these packs were own-label.
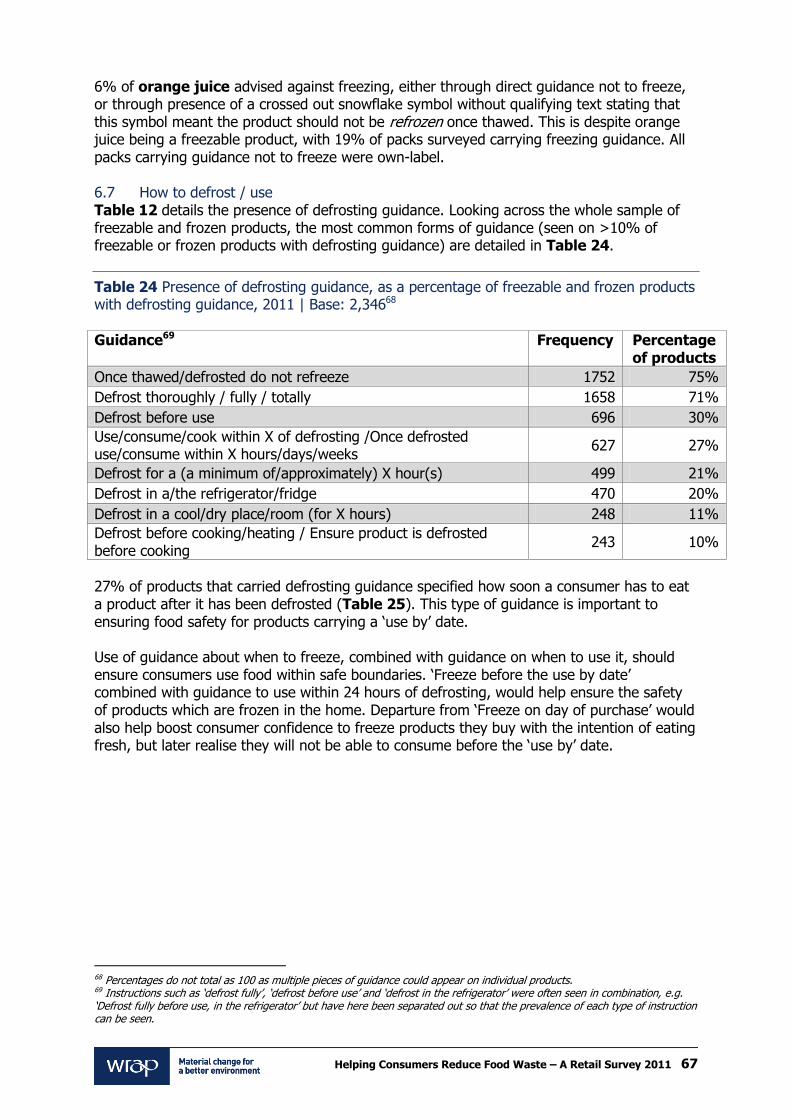
Helping Consumers Reduce Food Waste – A Retail Survey 2011 67
6% of orange juice advised against freezing, either through direct guidance not to freeze, or through presence of a crossed out snowflake symbol without qualifying text stating that this symbol meant the product should not be refrozen once thawed. This is despite orange juice being a freezable product, with 19% of packs surveyed carrying freezing guidance. All packs carrying guidance not to freeze were own-label. 6.7 How to defrost / use Table 12 details the presence of defrosting guidance. Looking across the whole sample of freezable and frozen products, the most common forms of guidance (seen on >10% of freezable or frozen products with defrosting guidance) are detailed in Table 24.
Table 24 Presence of defrosting guidance, as a percentage of freezable and frozen products with defrosting guidance, 2011 | Base: 2,34668
Guidance69 Frequency Percentage of products
Once thawed/defrosted do not refreeze 1752 75%
Defrost thoroughly / fully / totally 1658 71%
Defrost before use 696 30%
Use/consume/cook within X of defrosting /Once defrosted use/consume within X hours/days/weeks
627 27%
Defrost for a (a minimum of/approximately) X hour(s) 499 21%
Defrost in a/the refrigerator/fridge 470 20%
Defrost in a cool/dry place/room (for X hours) 248 11%
Defrost before cooking/heating / Ensure product is defrosted before cooking
243 10%
27% of products that carried defrosting guidance specified how soon a consumer has to eat a product after it has been defrosted (Table 25). This type of guidance is important to ensuring food safety for products carrying a ‘use by’ date. Use of guidance about when to freeze, combined with guidance on when to use it, should ensure consumers use food within safe boundaries. ‘Freeze before the use by date’ combined with guidance to use within 24 hours of defrosting, would help ensure the safety of products which are frozen in the home. Departure from ‘Freeze on day of purchase’ would also help boost consumer confidence to freeze products they buy with the intention of eating fresh, but later realise they will not be able to consume before the ‘use by’ date.
68 Percentages do not total as 100 as multiple pieces of guidance could appear on individual products. 69 Instructions such as ‘defrost fully’, ‘defrost before use’ and ‘defrost in the refrigerator’ were often seen in combination, e.g. ‘Defrost fully before use, in the refrigerator’ but have here been separated out so that the prevalence of each type of instruction can be seen.

Helping Consumers Reduce Food Waste – A Retail Survey 2011 68
Table 25 Number of days given to consume a product after defrosting, by product category/sub-category, own-label and branded, 2011 | Total branded base: 2,839; total own-label base: 3,483 Category or sub-category Length of
time given to use product
after defrosting
Percentage of
branded product in this
(sub) category,
carrying this
guidance
Percentage of
own-label products in
this (sub) category,
carrying this
guidance
Overall percentage of
this category giving this
guidance
Bread pre-packaged 1 day 1% 14% 5%
Rolls pre-packaged 1 day70 2% 23% 16%
2 days 4% 3%
3 days 2% 1%
Rolls ISB 1 day <1% <1%
World bread - pitta 1 day 16% 11%
World bread - wrap 1 day 1% 47% 15%
World bread - naan -
ambient 1 day 37% 15% 24%
World bread - naan - chilled 1 day 27% 26%
Chicken - frozen Immediately 7% 26% 19%
1 day 21% 8% 13%
Chicken - chilled 12 hours 15% 14%
1 day 15% 21% 21%
Bacon – pre-packed 1 day 19% 29% 27%
2 days 3% 2%
Ready meals - chilled 1 day 10% 8%
Ready meals - frozen 1 day 6% 2%
Cooking sauce - chilled 1 day 11% 10%
3 days 13% 1%
Milk 3 days 22% 16%
Total percentage branded / own-label
Immediately <1% <1% <1%
12 hours
1% 1%
1 day 3% 12% 8%
2 days
1% <1%
3 days <1% 2% 1%
The proportion of milk giving guidance to use within a specific time of defrosting increased from 47% in 2009 to 70% in 2011. In all instances the guidance suggested the product be used within 3 days. All of these products also carried the storage guidance ‘once opened use/consume within 3 days’. 16% of pre-packed rolls gave guidance as to how soon to eat after defrosting. Guidance that was unique to rolls was also found ‘Eat on day of defrost’. The majority (73%) of these rolls (n=94) specified rolls should be eaten within 1 day of defrosting. Smaller proportions suggested within 2 days (18%) and 3 days (10%).
70 This includes the code ‘Eat on day of defrost’ found only on rolls.
Helping Consumers Reduce Food Waste – A Retail Survey 2011 69
All world breads, which had guidance on when to consume after defrosting, suggested one day, with the exception of two packs of ambient naans, which gave consumers a whole month. The majority (74%) of naan packs that suggested consuming within a day of defrost also carried storage guidance stating that they should be used within a day of opening. A further 17% of these suggested use within 2 days of opening, 5% within three days, and 2% immediately after opening. The remaining world breads which were to be used within a day of defrost did not carry storage guidance stating how soon after opening they should be used. Only a third of pre-packed bread carried any defrosting guidance, but 21% of packs that did, gave a time within which the product should be used after defrost. Some of this data appears to be inaccurate (giving 1 month and 3 months to use) but the majority of bread gave a single day to use after defrost, something which could probably be extended to 2-3 days. That defrosted bakery will stale as fresh, however, reinforces the need to encourage consumers to freeze / defrost part loaves. 11% of chilled cooking sauce carried this type of guidance, and the majority of which (10%) specified it should be used within a day. It is interesting that the defrosting guidance given on chilled and frozen chicken is quite different. Frozen chicken tends to state that it should be used immediately after defrosting (19%) with a smaller proportion (13%) giving consumers a day to use it. Chilled chicken, on the other hand, never says it should be used immediately after defrost; is most likely to give consumers a day (21%) with a smaller proportion giving 12 hours (14%). 6.8 Guidance not to refreeze Where products were frozen or freezable, guidance not to refreeze products was also found. This guidance came in two forms – as text guidance – ‘once thawed/defrosted do not refreeze’ but also in the form of a crossed out snowflake symbol. The crossed out snowflake is also used as a ‘do not freeze’ symbol (discussed above). Table 26 details the proportion of products carrying guidance not to refreeze across freezable and frozen product categories and sub categories. For products such as bread and rolls, guidance not to refreeze the product will be to ensure good product quality. For products such as chicken and bacon, the guidance will rather be to ensure food safety. The exception to this is if you have defrosted raw food, such as meat or poultry, once you have cooked it, it can be refrozen.

Helping Consumers Reduce Food Waste – A Retail Survey 2011 70
Table 26 Presence of ‘do not refreeze’ guidance and symbol on freezable and frozen products, 2011|Total base: 6,323
Product category
Sub-category Percentage of products in (sub) category carrying ‘once thawed/defrosted do not refreeze’ text
Percentage of products in (sub) category carrying crossed out snowflake as a ‘do not refreeze’ symbol
Bread Pre-packaged 19% 9%
ISB 1%
Rolls Pre-packaged 30% 11%
World bread Pittas 42% 21%
Wraps 23% 10%
Naans - ambient 47% 16%
Naans - chilled 71% 3%
Chicken Frozen 94% 26%
Chilled 76% 9%
Bacon Pre-packaged 60% 3%
Milk 21%
Ready meals Chilled 73%
Frozen 67% 13%
Orange juice 14% 13%
Cooking sauce Chilled 61%
Total sample 7% 6%
7.0 Date labels WRAP’s consumer research71 suggests that misunderstanding or mis-use of date labels by consumers may be a key cause of food waste. The way in which retailers and manufacturers apply date labels has the potential to influence consumer understanding and confidence. 7.1 Use of ‘best before’ and ‘use by’ Table 27 examines the overall use of different date types across product categories and pertinent sub-categories in the 2009 and 2011 sample. In the following tables it should be noted that there are a small number of examples of anomalous date labels. These include:
1 chilled ready meal carrying a ‘best before’ date;
1 ISB bread carrying a ‘use by’ date; and
4 packs of white rolls carrying ‘use by’ dates (same brand).
These anomalies appear to be labelling errors by retailers or manufacturers, or, in the case of the ready meal, may be due to an ambient product being stored in the chilled section of a store. Where variation in date type is seen within a product category elsewhere in the data, this is an accurate reflection of mixed date type use by retailers and manufacturers of these products.
71 Consumer Insight: Date Labels and Storage Guidance, WRAP, 2011

Helping Consumers Reduce Food Waste – A Retail Survey 2011 71
Table 27 Use of different date types by product category and pertinent sub-categories72, 2009 and 2011|Total base 2009: 9,957 | Total base 2011: 11,70273
All use by Use by only Use by, display until
All best before Best before only
Best before, display until
Display until only
Other type of date
No date shown
Base
‘09 ‘11 ‘09 ‘11 ‘09 ‘11 ‘09 ‘11 ‘09 ‘11 ‘09 ‘11 ‘09 ‘11 ‘09 ‘11 ‘09 ‘11 ‘09 ‘11
Cooking sauce - chilled 100% 100% 31% 72% 69% 28%
90 93
Ham 100% 97% 22% 49% 78% 48%
1%
1%
2%
<1% 552 584
Carrots – pre-prepared 100% 99% 13% 20% 87% 79%
1%
113 80
Bagged salad 100% 99% 38% 58% 62% 41%
1%
141 178
Ready meals - chilled 100% 100% 24% 65% 76% 34%
<1%
<1%
339 317
Milk 100% 100% 43% 44% 57% 56%
411 439
Chicken - chilled 100% 100% 43% 43% 57% 57%
276 313
Bacon 92% 94% 32% 42% 60% 52% 8% 6% 8% 6%
<1% <1%
<1% 521 482
Yoghurts 77% 76% 48% 51% 29% 24% 23% 24% 23% 24%
<1%
1190 580
Cheese 25% 5% 4% 2% 21% 3% 74% 94% 59% 71% 15% 23%
<1% 1% 1%
<1% 699 1177
World bread 13% 3% 5% 2% 9% 1% 86% 97% 82% 94% 4% 3%
1%
709 670
Bread
<1%
<1% 100% 99% 59% 76% 41% 23%
<1%
1% 846 1010
Mayonnaise <1% 3% <1% 3%
100% 97% 100% 97%
1%
475 567
Eggs
100% 99% 1% 1% 99% 97%
1%
<1% 505 516
Chicken - frozen
100% 99% 67% 69% 43% 30%
1% 46 77
Rice
99% 100% 99% 100%
1% <1%
593 704
Ready meals - frozen
99% 100% 80% 83% 19% 17%
1%
99 86
Cooking sauce - ambient
96% 98% 96% 98%
4% 2%
857 1190
Bread rolls
<1%
94% 94% 59% 83% 35% 12% 1% <1% <1%
4% 5% 620 837
Pasta
93% 92% 93% 92%
6% 8%
324 375
Potatoes
67% 74%
3% 67% 71% 25% 15%
1% 8% 10% 159 270
Carrots - standard
66% 67% <1% <1% 66% 67% 19% 16%
15% 17% 291 345
Apples
46% 36%
46% 36% 12% 9% 1% <1% 42% 55% 101 207
Orange Juice n/a 94% n/a 58% n/a 36% n/a 4% n/a 4% n/a
n/a
n/a 2% n/a
n/a 605
72 Unless a sub-category is specified, the whole category, without exclusions is included. E.g. ‘Bread’ means ‘Bread, ISB and non-ISB’. 73 This base excludes records from the dataset for which no data was recorded on the type of date used.

Helping Consumers Reduce Food Waste – A Retail Survey 2011 72
Table 28 examines use of ‘use by’ and ‘best before’ dates in 2011, by category and sub-category.
Table 28 ‘Display until’ only, ‘Best before’, ‘use by’, no date shown and other type of date by 2011 product sub-category | Total base: 11,701
Product category
Product sub-category
Bases Display until only
Best before
Use by No date shown
Other type of date
Bread Pre-packed 839 100%
ISB 170 93% 1% 6% 1%
Rolls Pre-packed 502 99% 1%
ISB 228 <1% 81% 19%
BAH 107 100%
World bread Pitta 184 100%
Wrap 285 100%
Ambient naan 170 100%
Chilled naan 31 42% 58%
Carrots Standard 299 18% 78% 4%
Loose 46 100%
Pre-packed 80 99% 1%
Apples Pre-packed 140 10% 53% 36% 1%
Loose 67 6% 94%
Potatoes Packed 250 16% 80% 4%
Loose 20 90% 10%
Salad 178 99% 1%
Chicken Frozen 77 99% 1%
Chilled 313 100%
Bacon Pre-packed 470 6% 94%
Deli 12 75% 8% 17%
Ham Pre-packed 551 100%
Deli 33 24% 45% 3% 27%
Cheese Pre-packed 1131 <1% 97% 3%
Deli 46 28% 48% 2% 22%
Yoghurt Single 276 34% 65% 1%
Multipack 303 15% 85%
Milk 439 100%
Ready meals Chilled 317 <1% 100%
Frozen 86 100%
Juice 605 4% 94% 2%
Cooking sauce Chilled 93 100%
Ambient 1190 98% 2%
Mayonnaise 567 97% 3% 1%
Rice Standard 554 100%
Pre-cooked 150 100%
Pasta 375 92% 8%
Eggs 516 1% 99% <1%
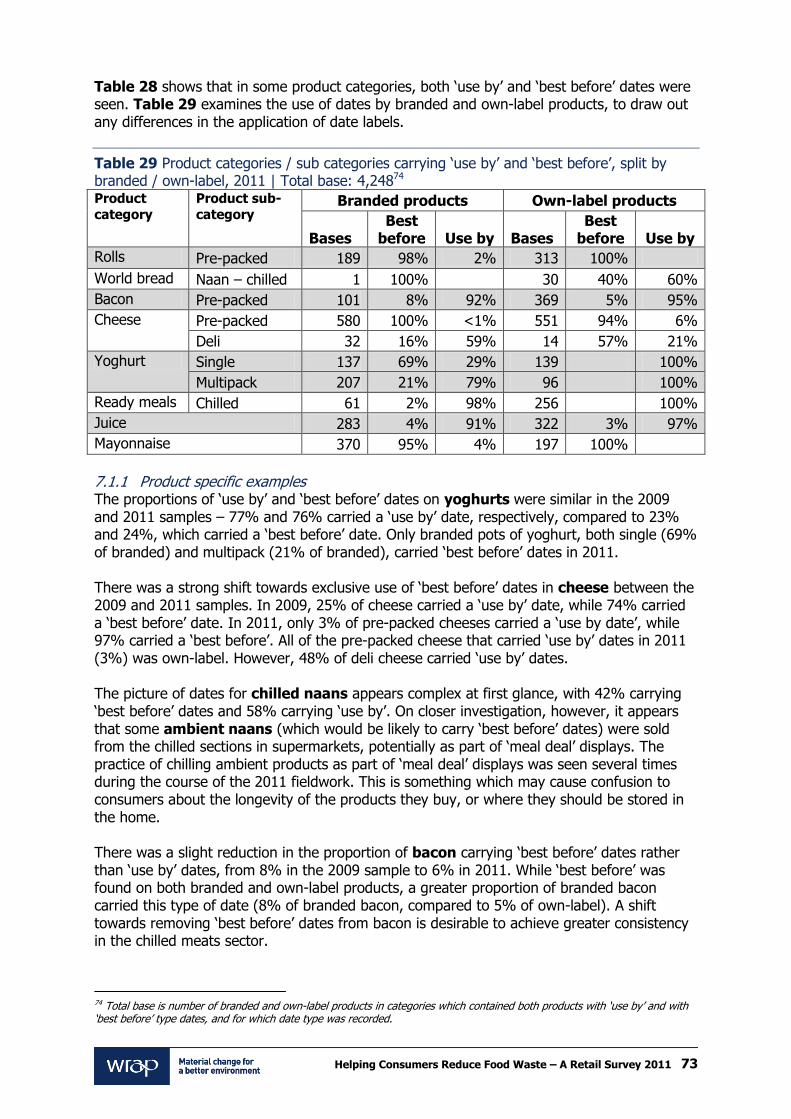
Helping Consumers Reduce Food Waste – A Retail Survey 2011 73
Table 28 shows that in some product categories, both ‘use by’ and ‘best before’ dates were seen. Table 29 examines the use of dates by branded and own-label products, to draw out any differences in the application of date labels.
Table 29 Product categories / sub categories carrying ‘use by’ and ‘best before’, split by branded / own-label, 2011 | Total base: 4,24874 Product
category
Product sub-
category Branded products Own-label products
Bases Best
before Use by Bases Best
before Use by
Rolls Pre-packed 189 98% 2% 313 100%
World bread Naan – chilled 1 100% 30 40% 60%
Bacon Pre-packed 101 8% 92% 369 5% 95%
Cheese Pre-packed 580 100% <1% 551 94% 6%
Deli 32 16% 59% 14 57% 21%
Yoghurt Single 137 69% 29% 139 100%
Multipack 207 21% 79% 96 100%
Ready meals Chilled 61 2% 98% 256 100%
Juice 283 4% 91% 322 3% 97%
Mayonnaise 370 95% 4% 197 100%
7.1.1 Product specific examples The proportions of ‘use by’ and ‘best before’ dates on yoghurts were similar in the 2009 and 2011 samples – 77% and 76% carried a ‘use by’ date, respectively, compared to 23% and 24%, which carried a ‘best before’ date. Only branded pots of yoghurt, both single (69% of branded) and multipack (21% of branded), carried ‘best before’ dates in 2011. There was a strong shift towards exclusive use of ‘best before’ dates in cheese between the 2009 and 2011 samples. In 2009, 25% of cheese carried a ‘use by’ date, while 74% carried a ‘best before’ date. In 2011, only 3% of pre-packed cheeses carried a ‘use by date’, while 97% carried a ‘best before’. All of the pre-packed cheese that carried ‘use by’ dates in 2011 (3%) was own-label. However, 48% of deli cheese carried ‘use by’ dates. The picture of dates for chilled naans appears complex at first glance, with 42% carrying ‘best before’ dates and 58% carrying ‘use by’. On closer investigation, however, it appears that some ambient naans (which would be likely to carry ‘best before’ dates) were sold from the chilled sections in supermarkets, potentially as part of ‘meal deal’ displays. The practice of chilling ambient products as part of ‘meal deal’ displays was seen several times during the course of the 2011 fieldwork. This is something which may cause confusion to consumers about the longevity of the products they buy, or where they should be stored in the home. There was a slight reduction in the proportion of bacon carrying ‘best before’ dates rather than ‘use by’ dates, from 8% in the 2009 sample to 6% in 2011. While ‘best before’ was found on both branded and own-label products, a greater proportion of branded bacon carried this type of date (8% of branded bacon, compared to 5% of own-label). A shift towards removing ‘best before’ dates from bacon is desirable to achieve greater consistency in the chilled meats sector.
74 Total base is number of branded and own-label products in categories which contained both products with ‘use by’ and with ‘best before’ type dates, and for which date type was recorded.

Helping Consumers Reduce Food Waste – A Retail Survey 2011 74
7.1.2 ‘Other’ types of date A small number of ‘other’ types of dates were found during fieldwork. These were manufacturing codes and other forms of ‘use by’ such as ‘eat by’ and ‘enjoy by’. These were found on products which tended to carry the standard guidance elsewhere (e.g. ‘for use by see lid’ was written on the label, with ‘enjoy by’ and the date on the lid). These types of dates may potentially confuse consumers who are already unsure about which dates mean what, and their use should be carefully considered75. 7.2 Use of ‘display until’ Consumer research76 suggests that consumers are better able to understand the ‘use by’ and ‘best before’ dates in the absence of ‘display until’ dates. The extent to which ‘display until’ dates are used has declined between 2009 and 2011, with 39% of products for which dates were recorded carrying a ‘display until’ date in the 2009 sample, and 29% carrying ‘display until’ in the 2011 sample77. Table 30 details the relative proportions of ‘display until’ dates for each product category, in both the 2011 and 2009 samples.
Table 30 Use of ‘display until’ by product category, 2009 and 2011 samples | Total base 2009: 3,877; total base 2011: 3,402.
Product category
Display until present
2009 2011
Bread 41% 23%
White rolls 36% 12%
World breads 12% 3%
Cooking sauce 7% 2%
Ham 78% 48%
Bacon 60% 52%
Potatoes 92% 86%
Apples 57% 44%
Carrots 85% 82%
Salad 62% 41%
Ready meals 63% 31%
Yoghurts 29% 25%
Eggs 99% 98%
Cheese 36% 26%
Milk 57% 56%
Chicken 55% 52%
Orange juice n/a 36%
Total 39% 29%
‘Display until’ dates tended to be more prevalent on own-label products (47%) than branded (6%). Table 31 breaks down the use of ‘display until’ by sub-category and category, by branded and own-label products, and gives the overall proportion of products carrying ‘display until’ dates in each category or sub-category.
75 NB where alternative date types were given alongside more ‘conventional’ types, both were recorded. 76 Consumer Insight: Date Labels and Storage Guidance, WRAP, 2011 77 This reduction becomes slightly smaller when the 2011 sample is weighted so that the proportion of different retailers in the sample matches that used in 2009. The proportion of products carrying a ‘display until’ date then becomes 32% in the 2011 sample. This still indicates a fairly substantial (7%) decrease in use of this type of date.
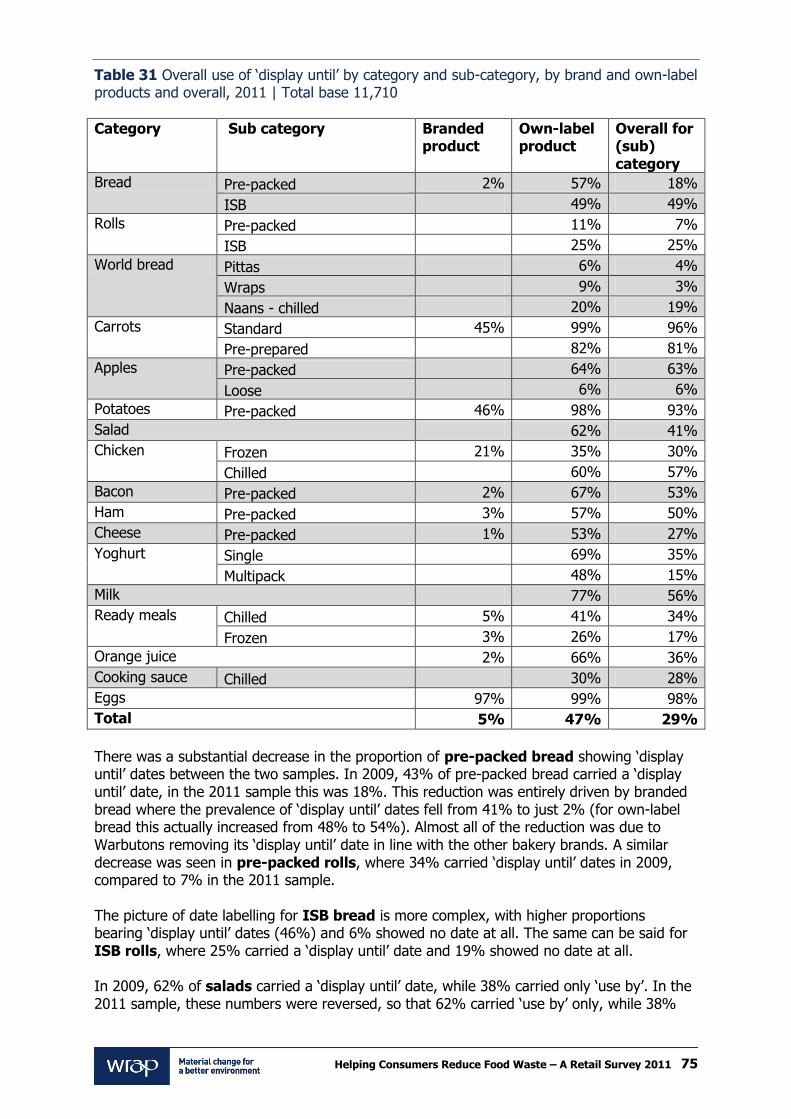
Helping Consumers Reduce Food Waste – A Retail Survey 2011 75
Table 31 Overall use of ‘display until’ by category and sub-category, by brand and own-label products and overall, 2011 | Total base 11,710
Category Sub category Branded product
Own-label product
Overall for (sub) category
Bread Pre-packed 2% 57% 18%
ISB 49% 49%
Rolls Pre-packed 11% 7%
ISB 25% 25%
World bread Pittas 6% 4%
Wraps 9% 3%
Naans - chilled 20% 19%
Carrots Standard 45% 99% 96%
Pre-prepared 82% 81%
Apples Pre-packed 64% 63%
Loose 6% 6%
Potatoes Pre-packed 46% 98% 93%
Salad 62% 41%
Chicken Frozen 21% 35% 30%
Chilled 60% 57%
Bacon Pre-packed 2% 67% 53%
Ham Pre-packed 3% 57% 50%
Cheese Pre-packed 1% 53% 27%
Yoghurt Single 69% 35%
Multipack 48% 15%
Milk 77% 56%
Ready meals Chilled 5% 41% 34%
Frozen 3% 26% 17%
Orange juice 2% 66% 36%
Cooking sauce Chilled 30% 28%
Eggs 97% 99% 98%
Total 5% 47% 29%
There was a substantial decrease in the proportion of pre-packed bread showing ‘display until’ dates between the two samples. In 2009, 43% of pre-packed bread carried a ‘display until’ date, in the 2011 sample this was 18%. This reduction was entirely driven by branded bread where the prevalence of ‘display until’ dates fell from 41% to just 2% (for own-label bread this actually increased from 48% to 54%). Almost all of the reduction was due to Warbutons removing its ‘display until’ date in line with the other bakery brands. A similar decrease was seen in pre-packed rolls, where 34% carried ‘display until’ dates in 2009, compared to 7% in the 2011 sample. The picture of date labelling for ISB bread is more complex, with higher proportions bearing ‘display until’ dates (46%) and 6% showed no date at all. The same can be said for ISB rolls, where 25% carried a ‘display until’ date and 19% showed no date at all. In 2009, 62% of salads carried a ‘display until’ date, while 38% carried only ‘use by’. In the 2011 sample, these numbers were reversed, so that 62% carried ‘use by’ only, while 38%

Helping Consumers Reduce Food Waste – A Retail Survey 2011 76
also carried ‘display until’. This may be in part due to the overall increase in branded salad products, none of which carried a ‘display until’ date in 2011. The proportion of milk carrying a ‘display until’ date showed little change between 2009 (57%) and 2011 (56%). The same can be said of eggs (99% in 2009, 98% in 2011), although the ubiquity of use of ‘display until’ here is likely to be the result of legislation78 which states eggs must be sold seven days before the ‘best before’ date. Use of ‘display until’ dates in pre-packed ham in 2011 (50%) was considerably lower than for pre-packed ham in the 2009 sample (79%). 69% of chilled cooking sauce carried a ‘display until’ date in 2009. In 2011 this was 28%. For all retailers, there were categories in which no products were found with ‘display until’ dates at all indicating that some retailers have systems in place to effectively manage stock without the use of ‘display until’ dates. Table 32 details where ‘display until’ dates are absent from product categories or sub-categories by retailer.
78 See: http://animalhealth.defra.gov.uk/egg-and-milk/eggs/marketingseggs.html

Helping Consumers Reduce Food Waste – A Retail Survey 2011 77
Table 32 Retailers where no products with ‘display until’ dates were found, 201179 Retailer
1 2 3 4 5 6 7 8 9 10
Bread Pre-packed × × × × × × × ISB
NA NA × × NA × Rolls Pre-packed
× × ISB
NA NA × × × NA
World bread Pittas ×
Wraps ×
Naans - chilled NA NA NA × NA NA NA
Carrots Standard × × × × × × × × Pre-prepared
NA NA × × × × ×
Apples Pre-packed × × × × × ×
Loose NA NA × NA
Potatoes Pre-packed × × × × × × × × Salad × NA × × × × Chicken Frozen
NA NA ×
Chilled × × × × Bacon Pre-packed × × × × × × Ham Pre-packed × × × × × × Cheese Pre-packed × × × × × Yoghurt Single × × × × × ×
Multipack × × × × × Milk × × × × ×
Ready meals Chilled × NA NA × × × ×
Frozen × ×
Orange juice × × × × × Cooking sauce Chilled × NA NA × × × Eggs × × × × × × × × ×
Key
NA No product in this category/sub category found in this retailer’s stores
No products with ‘display until’ dates found
× Products with ‘display until’ dates found
7.2.1 Use of only ‘display until’ date, or no date Uncut, fresh fruit and vegetables do not have a legal requirement to carry a date mark, and some retailers apply just a ‘display until’ date or no date, while some apply a ‘best before’. While a clear understanding of dates allows us to consider a product which carries only a ‘display until’ date, and a product which carries no date at all as equivalent in the information they convey (i.e. no guide to the consumer as to when the product might be at its best quality), it should be noted that consumers’ understanding of dates may not be sufficiently nuanced for them to do the same. Where no other date is present (or even if one is present), consumers may use the ‘display until’ date as a proxy for a ‘best before’, or as an ‘early indicator’ that food quality may be deteriorating.
79 Loose carrots, loose potatoes, deli ham, deli cheese and deli bacon, and ambient cooking sauce are excluded from this table as no products in these categories were found to carry ‘display until’ dates.
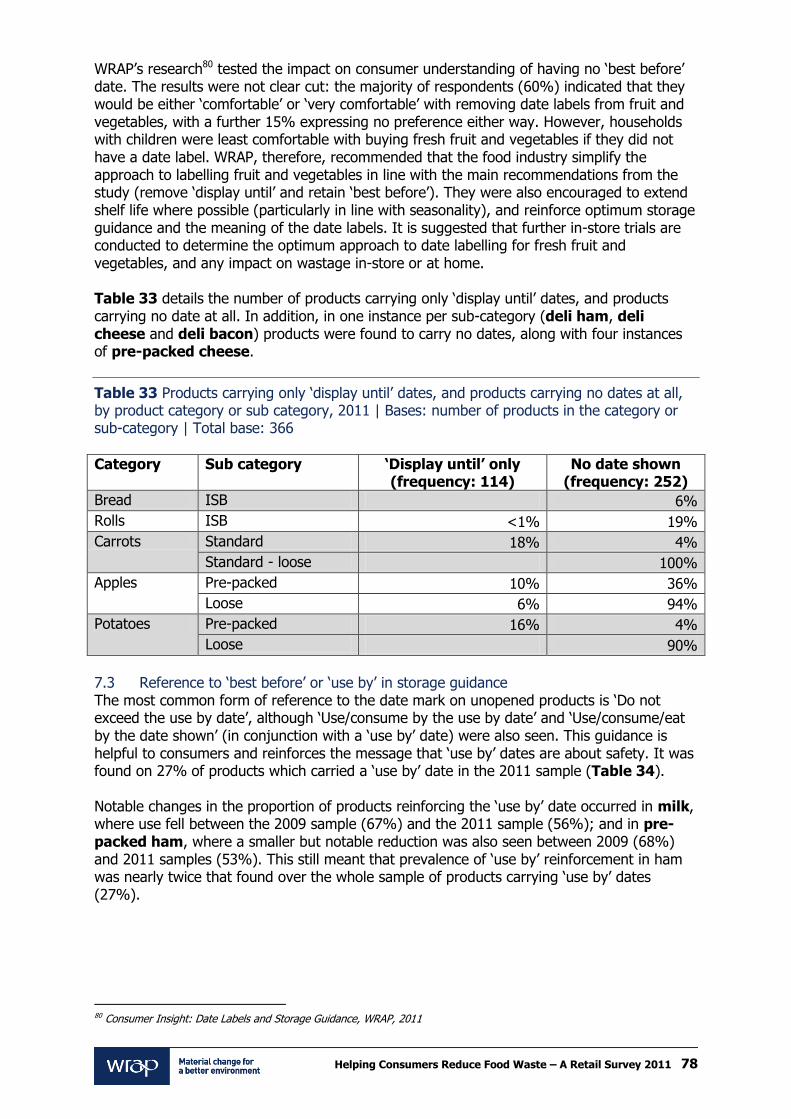
Helping Consumers Reduce Food Waste – A Retail Survey 2011 78
WRAP’s research80 tested the impact on consumer understanding of having no ‘best before’ date. The results were not clear cut: the majority of respondents (60%) indicated that they would be either ‘comfortable’ or ‘very comfortable’ with removing date labels from fruit and vegetables, with a further 15% expressing no preference either way. However, households with children were least comfortable with buying fresh fruit and vegetables if they did not have a date label. WRAP, therefore, recommended that the food industry simplify the approach to labelling fruit and vegetables in line with the main recommendations from the study (remove ‘display until’ and retain ‘best before’). They were also encouraged to extend shelf life where possible (particularly in line with seasonality), and reinforce optimum storage guidance and the meaning of the date labels. It is suggested that further in-store trials are conducted to determine the optimum approach to date labelling for fresh fruit and vegetables, and any impact on wastage in-store or at home. Table 33 details the number of products carrying only ‘display until’ dates, and products carrying no date at all. In addition, in one instance per sub-category (deli ham, deli cheese and deli bacon) products were found to carry no dates, along with four instances of pre-packed cheese.
Table 33 Products carrying only ‘display until’ dates, and products carrying no dates at all, by product category or sub category, 2011 | Bases: number of products in the category or sub-category | Total base: 366
Category Sub category ‘Display until’ only (frequency: 114)
No date shown (frequency: 252)
Bread ISB 6%
Rolls ISB <1% 19%
Carrots Standard 18% 4%
Standard - loose 100%
Apples Pre-packed 10% 36%
Loose 6% 94%
Potatoes Pre-packed 16% 4%
Loose 90%
7.3 Reference to ‘best before’ or ‘use by’ in storage guidance The most common form of reference to the date mark on unopened products is ‘Do not exceed the use by date’, although ‘Use/consume by the use by date’ and ‘Use/consume/eat by the date shown’ (in conjunction with a ‘use by’ date) were also seen. This guidance is helpful to consumers and reinforces the message that ‘use by’ dates are about safety. It was found on 27% of products which carried a ‘use by’ date in the 2011 sample (Table 34). Notable changes in the proportion of products reinforcing the ‘use by’ date occurred in milk, where use fell between the 2009 sample (67%) and the 2011 sample (56%); and in pre-packed ham, where a smaller but notable reduction was also seen between 2009 (68%) and 2011 samples (53%). This still meant that prevalence of ‘use by’ reinforcement in ham was nearly twice that found over the whole sample of products carrying ‘use by’ dates (27%).
80 Consumer Insight: Date Labels and Storage Guidance, WRAP, 2011
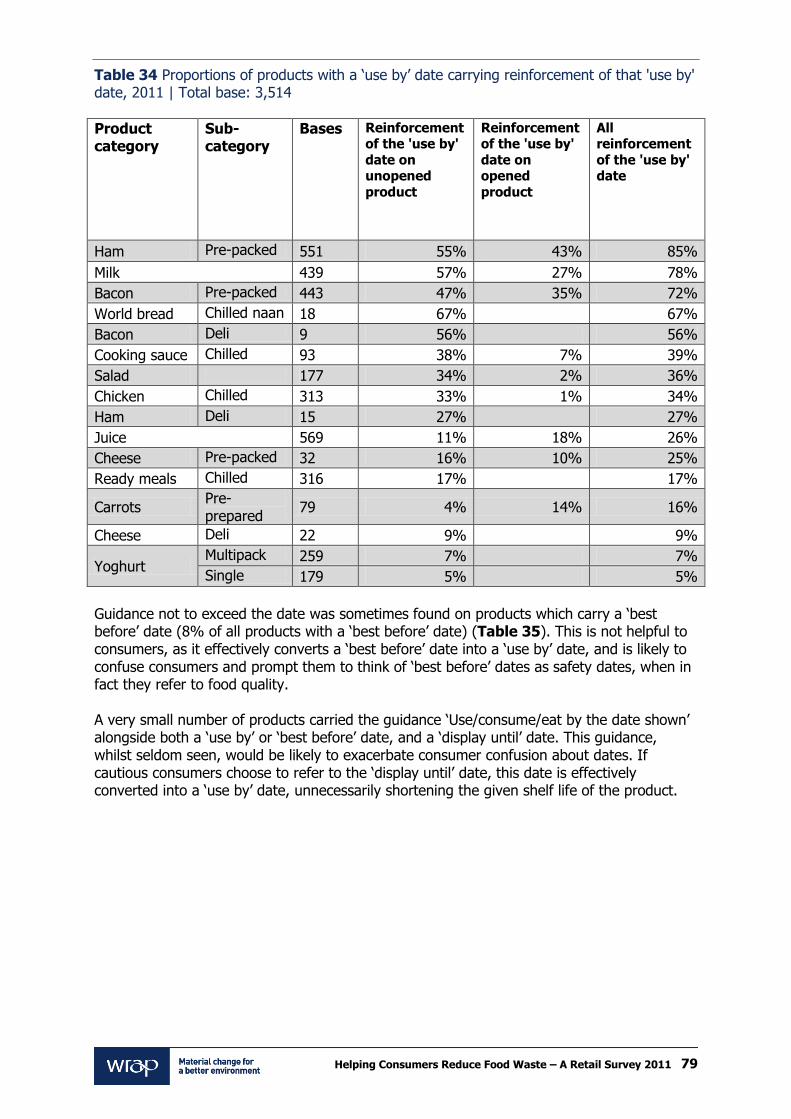
Helping Consumers Reduce Food Waste – A Retail Survey 2011 79
Table 34 Proportions of products with a ‘use by’ date carrying reinforcement of that 'use by' date, 2011 | Total base: 3,514
Product category
Sub-category
Bases Reinforcement of the 'use by'
date on unopened
product
Reinforcement of the 'use by'
date on opened
product
All reinforcement
of the 'use by' date
Ham Pre-packed 551 55% 43% 85%
Milk 439 57% 27% 78%
Bacon Pre-packed 443 47% 35% 72%
World bread Chilled naan 18 67% 67%
Bacon Deli 9 56% 56%
Cooking sauce Chilled 93 38% 7% 39%
Salad 177 34% 2% 36%
Chicken Chilled 313 33% 1% 34%
Ham Deli 15 27%
27%
Juice 569 11% 18% 26%
Cheese Pre-packed 32 16% 10% 25%
Ready meals Chilled 316 17%
17%
Carrots Pre-prepared
79 4% 14% 16%
Cheese Deli 22 9% 9%
Yoghurt Multipack 259 7% 7%
Single 179 5% 5%
Guidance not to exceed the date was sometimes found on products which carry a ‘best before’ date (8% of all products with a ‘best before’ date) (Table 35). This is not helpful to consumers, as it effectively converts a ‘best before’ date into a ‘use by’ date, and is likely to confuse consumers and prompt them to think of ‘best before’ dates as safety dates, when in fact they refer to food quality. A very small number of products carried the guidance ‘Use/consume/eat by the date shown’ alongside both a ‘use by’ or ‘best before’ date, and a ‘display until’ date. This guidance, whilst seldom seen, would be likely to exacerbate consumer confusion about dates. If cautious consumers choose to refer to the ‘display until’ date, this date is effectively converted into a ‘use by’ date, unnecessarily shortening the given shelf life of the product.

Helping Consumers Reduce Food Waste – A Retail Survey 2011 80
Table 35 Proportions of products converting 'best before' to 'use by' through reinforcement of the 'best before' date, 2011 | Total base: 3,642
Product category
Sub-category Bases Instruction not to eat after the 'best before' date on unopened product
Instruction not to eat after the 'best before' date on opened product
All instruction not to eat after the 'best before' date
Cheese Pre-packed 1095 17% 11% 28%
World bread Naan – ambient 170 3% 24% 27%
Chicken Frozen 76 24%
24%
Bacon Pre-packed 27
19% 19%
Mayonnaise 548 2% 14% 16%
World bread Naan – chilled 13 15%
15%
World bread Pitta 184
13% 13%
Cooking sauce Ambient 1167 1% 10% 11%
Ready meals Frozen 86 10%
10%
Yoghurt Multipack 44 5%
5%
Carrots Standard - pre-packed 232 1%
1%
8% of all products which carried a ‘best before’ date carried the guidance ‘once open(ed) use/consume/eat by date shown’ either in reference to the unopened or the opened product. This guidance was seen on over a quarter (28%) of cheese, which in some ways negates the general shift towards use of ‘best before’ rather than ‘use by’ type dates on this product. For some products, guidance to consume by the ‘best before’ date once the product is opened is a reflection of the fact that the shelf-life of the product alters after opening. This is likely to be the case for bacon, mayonnaise, and cooking sauce, all of which carried guidance referring to use of the opened product before the ‘best before’ date.
Helping Consumers Reduce Food Waste – A Retail Survey 2011 81
8.0 Shelf life In 2011, changes to the method of collecting data made it possible to calculate aspects of product shelf life. Two forms of shelf life were investigated, these were:
Given life - defined as the difference between the ‘use by’ or ‘best before’ date, and the date the item was reviewed in store (simulating the date it might have been purchased by a consumer) or the date the item was delivered if part of an online shop; and
Open life – defined as the number of days given, through on-pack guidance to consumers, for consumption of the product after the packaging has been opened.
The analysis originally conducted in this research indicated some factors which appeared to be very important in influencing given life and open life. However, it also showed that the factors potentially influencing given life and open life are highly complex. As a result, an additional research project was commissioned to unpack those factors further. For the additional research, a shorter list of products was investigated. The shortlist was determined by excluding product categories where given shelf life was not going to be of particular interest (e.g. rice and pasta, frozen products, eggs and mayonnaise), and products with limited data (e.g. deli products). Investigations were then focused on a working list of 20 categories or sub-categories, with flexibility to examine other sub-categories where these were likely to produce interesting findings. The products investigated, as well as their mean shelf life, are shown for both ‘given life’ and ‘open life’ definitions below in Tables 36 and 37 respectively. This chapter will not detail all the findings of that additional research, but will highlight some of the key insights. Further details of the additional research are available on request from WRAP, and will form the basis of discussions with the food industry on where opportunities exist to increase given and open shelf life.

Helping Consumers Reduce Food Waste – A Retail Survey 2011 82
Table 36 Given life of products analysed | Base: 5,854 NB Given life - defined as the difference between the ‘use by’ or ‘best before’ date, and the date the item was reviewed in store (simulating the date it might have been purchased by a consumer) or the date the item was delivered if part of an online shop.
Given life for products chosen for analysis
Product category/sub-category
Mean number of
days
Min Max Std. Deviation
N
Bakery Bread- packaged 3.2 1 12 1.5 601
Bread - ISB 1.2 1 3 0.4 116
Rolls - packaged 2.8 1 8 1.2 323
Rolls - ISB 1.4 1 3 0.5 136
Rolls - Bake At Home 30.0 1 94 23.5 91
World breads
World bread - pitta 13.3 1 83 19.0 123
World bread - tortillas 76.2 1 187 69.0 232
Fruit & Veg
Salad 3.3 0 7 1.7 135
Carrots - standard - packed 3.9 0 8 1.4 210
Apples - packed 6.9 2 19 2.7 86
Potatoes - packed 4.8 0 10 1.7 168
Chilled Chicken - chilled 4.6 0 10 2.0 237
Bacon - pre-packed 21.1 0 60 8.2 373
Ham - pre-packed 12.7 0 27 4.7 451
Cheese - pre-packed 48.8 1 116 21.8 943
Yoghurt – single 15.7 0 34 6.2 213
Yoghurt - multipack 18.2 1 44 6.9 247
Juice 30.3 0 84 15.8 526
Ready meals - chilled 7.5 1 36 7.0 221
Milk 11.1 2 27 6.1 340
Cooking sauce - chilled 14.5 1 26 6.6 82

Helping Consumers Reduce Food Waste – A Retail Survey 2011 83
Table 37 Open life of products analysed | Base: 3,457
Open life for products with data chosen for analysis
Product category/ sub-category
Mean number of days
Min Max Std. Deviation
N
Bakery Rolls - packaged 1.6 1 4 1.3 5
Rolls - Bake At Home 1.2 0 3 0.8 72
World breads
World bread - pitta 1.8 1 3 0.5 103
World bread - tortillas 2.5 0 5 1.0 230
Fruit & Veg Salad 1.0 1 2 0.2 93
Chilled Chicken - chilled 0.7 0 2 0.7 214
Bacon - pre-packed 2.9 2 4 0.8 325
Ham - pre-packed 2.1 2 3 0.2 452
Cheese - pre-packed 5.5 3 7 1.8 765
Yoghurt – single 4.0 2 7 1.7 338
Juice 4.1 1 5 1.3 484
Ready meals - chilled 1.0 1 1 0.0 2
Milk 4.0 2 7 1.7 338
Cooking sauce - chilled 1.8 1 3 0.7 36
As can be seen in Tables 36 and 37, there can be substantial variation in shelf lives within a particular product category. This chapter aims both to describe differences in given life and/or open life for different product categories, as well as to report the findings of research to identify correlations between variation in shelf life and other factors. Across the product categories investigated here, the factors under consideration can be divided into three main groups:
Factors relating to the product and packaging;
Factors relating to on pack advice and guidance to consumers, and
Factors relating to the retail context in which the product was audited.
8.1 Given life Table 38 details the mean given life of products carrying ‘use by’ dates, and Table 39 the mean given life for products carrying ‘best before’81 dates. These figures are the average of all given lives which could be calculated for that product category or sub-category. The tables also give the minimum, maximum and standard deviation, to give an idea of how consistent given life is in that category. A large range between the minimum and maximum given life indicates that widely different numbers of days were given on different individual products. Standard deviation indicates how ‘spread out’ given lives are within a product category – a high standard deviation suggests products tend to deviate widely from the mean82. There may well be good reasons why given life available to consumers at point of sale differs between products that are similar from a consumer perspective. These could relate to differences in residence time in-store, product formulation, differences in packaging materials, MAP, pack functionality and so on. However, it may also be that differences may
81 Calculation of given shelf life for products which carry ‘best before’ dates is not intended to indicate that the product cannot be eaten after this period. For a full description of these terms see the glossary at the start of this document. 82 It should be remembered that the range and standard deviation will increase with the mean given shelf life of the product, simply because longer shelf lives provides more scope for variation.

Helping Consumers Reduce Food Waste – A Retail Survey 2011 84
have arisen for historical reasons, brand reasons, or as a result of decisions taken in isolation by individuals or organisations.
Table 38 Given life of products carrying ‘use by’ dates, 2011 | Base: 2,696
Given life for products carrying 'use-by' dates
Product category/ sub-category
Mean number of
days
Min Max Std. Deviation
N
Fruit & Veg Salad 3.3 0 7 1.7 134
Chilled Chicken – chilled (Figure 19)
4.6 0 10 2.0 237
Bacon - pre-packed 21.0 0 60 8.2 347
Ham - pre-packed 12.7 0 27 4.7 448
Cheese - pre-packed 42.9 12 82 16.9 32
Yoghurt – single 13.4 0 34 5.5 145
Yoghurt - multipack 17.9 1 44 17.9 205
Juice 30.0 0 76 15.5 507
Ready meals - chilled 7.5 1 36 7.0 219
Milk 11.1 2 27 6.1 340
Cooking sauce - chilled 14.5 1 26 6.6 82
Among the products listed, some have particularly high ranges for given life, which are worth considering further:
Pre-packed bacon (0-60 days);
Pre-packed cheese (12-82 days);
Juice (0-76 days);
Milk (2-27 days) – this wide variation arises because this category includes both filtered and non-filtered milks; and
Yoghurts (1-44 days) – multipack yoghurts appear to have a wider range, higher mean given life, and much higher standard deviation than the single yoghurts category in our sample.
The distribution of given life was obviously not even. An example of how it was spread across the products is shown in Figure 19 for chilled chicken.

Helping Consumers Reduce Food Waste – A Retail Survey 2011 85
Figure 19 Histogram showing the given life distribution for chilled chicken
Table 39 Given life of products carrying ‘best before’ dates, 2011 | Base: 3,047
Given life for products carrying ‘best before’ dates
Product category/ sub-category
Mean number of
days
Min Max Std. Deviation
N
Bakery Bread- packaged (Figure 20)
3.2 1 12 1.5 601
Bread - ISB 1.2 1 3 0.5 113
Rolls - packaged 2.8 1 8 1.2 319
Rolls - ISB 1.4 1 3 0.5 135
Rolls - Bake At Home 30.0 1 94 23.5 91
World breads
World bread - pitta 13.3 1 83 19.0 123
World bread - tortillas 76.5 1 187 68.9 231
Fruit & Veg
Carrots - standard - packed 4.2 1 8 1.3 165
Apples - packed 7.0 2 19 2.8 72
Potatoes - packed 5.1 1 10 1.6 128
Chilled
Bacon - pre-packed 21.8 3 37 8.1 26
Ham - pre-packed 12.3 10 16 3.2 3
Cheese - pre-packed 49.0 1 116 21.9 911
Yoghurt – single 20.6 8 28 4.3 68
Yoghurt - multipack 19.9 2 33 7.3 42
Juice 39.6 4 84 20.0 19
The following products which carried a ‘best before’ date tended to give consumers very few days before the date passed (mean ≤ 4 days):
ISB bread and rolls (1 day); and
Packaged bread and rolls (3 days) (Figure 20).

Helping Consumers Reduce Food Waste – A Retail Survey 2011 86
Figure 20 Histogram showing the given life distribution for packaged bread
It is also worth noting that in many categories, the minimum given shelf life is surprisingly short (e.g. 1 day on potatoes and pre-packed cheese). While some variation in given life is to be expected as a result of stock control, this data demonstrates that, for a minority of products in each category, consumers receive a very limited given life compared to the category average. Data analysis demonstrates correlations between variable given and open life and a range of different factors. Details of these correlations are outlined below. 8.1.1 Comparison of branded and own-label products Tables 40 and 41 compare mean given lives of branded and own-label products in each product category or sub-category, for products carrying ‘use by’ dates and ‘best before’ dates respectively. ‘Use by’ and ‘best before’ dated products were separated out as there are often notable differences between the mean shelf lives of products in these two categories. This allows us to consider differences between the branded and own-label versions average given life in product categories knowing that this difference has been controlled for.

Helping Consumers Reduce Food Waste – A Retail Survey 2011 87
Table 40 Given life for products carrying ‘use by’ dates, by own-label or branded, where both are present in a category, 2011 | Base: 2,345
Sub types used in report, 2011
Product own-label or
branded, 2011
Mean Min Max Std. Deviation
N
Salad Branded 4.5 1 7 1.5 42
Own-label 2.8 0 5 1.4 92
Bacon – pre-packed Branded 21.7 0 60 9.5 84
Own-label 20.8 1 33 7.7 263
Ham - pre-packed Branded 12.0 1 27 5.8 67
Own-label 12.8 0 23 4.4 381
Yoghurt - single Branded 16.5 3 34 7.6 33
Own-label 12.5 0 21 4.3 112
Yoghurt - multipack Branded 17.6 1 44 6.2 130
Own-label 18.4 5 44 7.8 75
Milk Branded 16.9 3 27 6.8 89
Own-label 9.1 2 24 4.2 251
Ready meals - chilled Branded 20.2 1 36 10.9 28
Own-label 5.7 1 23 3.6 191
Juice Branded 33.0 2 76 11.1 229
Own-label 27.5 0 59 18.0 278
It can be seen from Table 40, that for most products where ‘use by’ dates were present, own-label products tended to have a shorter mean given life than branded products. This was less clear for packed bacon, packed ham, and yoghurt multipacks, for which given life was not notably different for own-label and branded products. The differences were particularly pronounced for:
Single yoghurts – own label 4 days shorter;
Chilled ready meals – 16 days;
Milk83 – 8 days; and
Orange juice – 6 days.
83 This difference was found to be an outcome of the proportion of branded vs. own label milks which had undergone a filtration process, rather than a genuine difference between own-label and branded products.

Helping Consumers Reduce Food Waste – A Retail Survey 2011 88
Table 41 Given life for products carrying ‘best before’ dates, by own-label or branded, where both are present in a category84, 2011 | Base: 2,185
Sub types used in report, 2011
Product own-label or branded, 2011
Mean Min Max Std. Deviation
N
Bread - packaged Branded 3.2 1 6 1.1 418
Own-label 3.4 1 12 2.1 183
Rolls - packaged Branded 3.3 1 5 1.0 126
Own-label 2.4 1 8 1.2 193
World bread - pitta Branded 35.7 2 83 32.1 23
Own-label 8.2 1 33 8.6 100
World bread - tortilla Branded 96.1 1 187 67.2 163
Own-label 29.5 1 168 46.9 68
Cheese - pre-packed Branded 57.5 1 116 22.9 467
Own-label 40.1 1 96 16.7 444
Comparing the own-label and branded product given lives among products carrying a ‘best before’ date in Table 41, we find again that own-label products tend to have shorter given lives than branded products within the same product category. The exception here is packaged bread. Overall however, the differences are even more pronounced among products carrying ‘best before’ dates, than for those carrying ‘use by’ dates:
Pitta breads – own label 28 days shorter;
Tortillas – 66 days; and
Pre-packed cheese – 18 days. 8.1.2 Impact of date type Where products in the same category carried different types of dates, differences in the given shelf life of these products were found. For product categories which included both ‘best before’ and ‘use by’ labels, the following differences were noted. In pre-packed bacon, products with ‘best before’ and ‘use-by’ dates gave consumers very similar given lives on average (22 days [n=26] vs. 21 days), with a similar level of variance. In pre-packed cheese given lives of products carrying ‘best before’ dates were slightly longer than ‘use by’ dates; packs with ‘best before’ had an average of 49 days given life, compared to 43 days for packs with ‘use-by’. In single and multipack yoghurts, consumers were given 21 days and 20 days respectively where there was a ‘best before’ date, and 13 days and 18 days respectively where there was a ‘use by’ date. In orange juice, products carrying a ‘best before’ date gave consumers 40 days of given shelf life, whilst products carrying a ‘use by’ date gave 30 days (n=19).
84 Some products have been excluded from this table, where the sample size for either branded or own-label products was particularly small (i.e. n<10).

Helping Consumers Reduce Food Waste – A Retail Survey 2011 89
8.1.3 Other factors influencing given life In addition to the own-label vs. branded difference, and the impact of date type, further factors were investigated in the additional stage of analysis and found to have impacts. While this section will not go into the full details of the findings of that additional analysis, it will provide an outline of headline points of interest. Variables which seemed to be most important were:
The supermarket/retailer selling the product;
The particular brand;
The range of own label products (e.g. premium, standard, value); and
Whether a product was on promotion.
Further details of this analysis are available on request from WRAP.

Helping Consumers Reduce Food Waste – A Retail Survey 2011 90
8.2 Open life Initial analysis showed that this guidance frequently varied between products within a category or sub-category. Table 42 details the proportion of products in each (sub) category which carried open life guidance, along with the length of open life given for each product subcategory.
Table 42 Length of open life, by product category or sub-category85, 2011 | Total base: 4,986
Product Immediately 1 day 2 days 3 days 4 days 5 days <1 week N % of all products in category
carrying guidance
Bread 25% 13% 63% 24 3%
Rolls 9% 44% 17% 23% 7% 121 19%
Pittas 17% 77% 6% 159 82%
Wraps 1% 18% 18% 60% 3% 276 95%
Chicken 42% 41% 17% 231 74%
Bacon 51% 27% 22% 424 87%
Ham 94% 6% 559 98%
Cheese 31% 18% 51% 941 79%
Milk 2% 74% 24% 432 97%
Orange juice 5% 13% 5% 21% 55% 545 87%
Cooking sauce (chilled) 48% 40% 13% 48 49%
Cooking sauce (ambient) <1% 6% 85% <1% 1% 7% 1226 99%
85 Product categories or sub categories with fewer than 10 instances of this sort of guidance have been excluded

Helping Consumers Reduce Food Waste – A Retail Survey 2011 91
Around a fifth of pre-packed rolls gave guidance on open life. 7% of these stated they should be used immediately once opened, 2% gave half a day, while just under half (44%) instructed consumers to eat within 1 day of opening. 17% gave 2 days and 23% gave 3 days. A small but notable minority gave up to 4 days (7%). 87% of packs of orange juice with storage guidance carried suggestions on when to consume once opened – this ranged from one to five days. The most common guidance had a value of five days (55%) then four days (21%) and then one or three days (both at 5%). World breads were generally found to have reasonably long given lives, attributable to their modified atmosphere packaging (MAP). These products tend to have short open lives. The majority of pittas gave 2 days (77%), while tortillas gave 3 days (60%). For both of these products, examples of items giving longer than the sub-category average were found, so it seems there is scope for extending open life in this category. 49% of chilled cooking sauce products gave open life guidance. Just under half of these (48%) stated the product should be used within 1 day of opening. 40% gave consumers 2 days, while 13% gave 3 days. A very small proportion (3%) of pre-packed bread carried guidance on open life. The majority stated 3 days, around a quarter stated 1 day and a minority 2 days. Given that bread carries a ‘best before’ date, it is not clear how this guidance is useful to consumers. 8.2.1 Changes in open life since 2009 There appears to have been a trend, on average across the products, towards an increased proportion of products having ‘once opened’ guidance, and towards shorter recommended open lives. 97% of milk in 2011 carried guidance on open life, compared to 89% in the 2009 sample. Proportions of the different numbers of days given were similar to those seen in the 2009 sample, although there was a slight shift away from an open life of 2 days (2% compared with 10% in 2009), with slightly higher proportions giving an open life of 3 days (74% compared with 70% in 2009) or 7 days (24% compared with 20% in 2009). Milk with an open life of 7 days has undergone filtration while that with open life of 2-3 days is not filtered. 66% of salad in 2011 carried information about open life, up from 50% in the 2009 sample. 97% of these recommended eating within a single day of opening (100% in 2009), while just 3% gave consumers 2 days. All products which gave consumers 2 days were the ‘Lasting Leaf’ brand, sold, at the time of fieldwork, exclusively in Waitrose stores. The length of time consumers were instructed to keep pre-packed ham after opening fell between 2009 and 2011 samples. In 2009, 84% of instructions stated that the product should be consumed within 2 days of opening, while in the 2011 sample this was 93%. The proportion of instructions stating 3 days were 16% in 2009 and 6% in 2011. There was a high instance of open life guidance on pre-packed bacon in the 2011 sample (87%) compared to the 2009 sample (75%). The majority of this guidance (51%, compared to 41% in the 2009 sample) stated consumers had 2 days to eat the product, while 27% gave three days (38% in 2009) and 22% gave 4 days (20% in 2009). 8.2.2 Comparison of branded and own-label products Open life, like given life, varied between branded and own-label products. It appears that, in most cases where a difference was seen, open shelf life is longer for branded than for own-
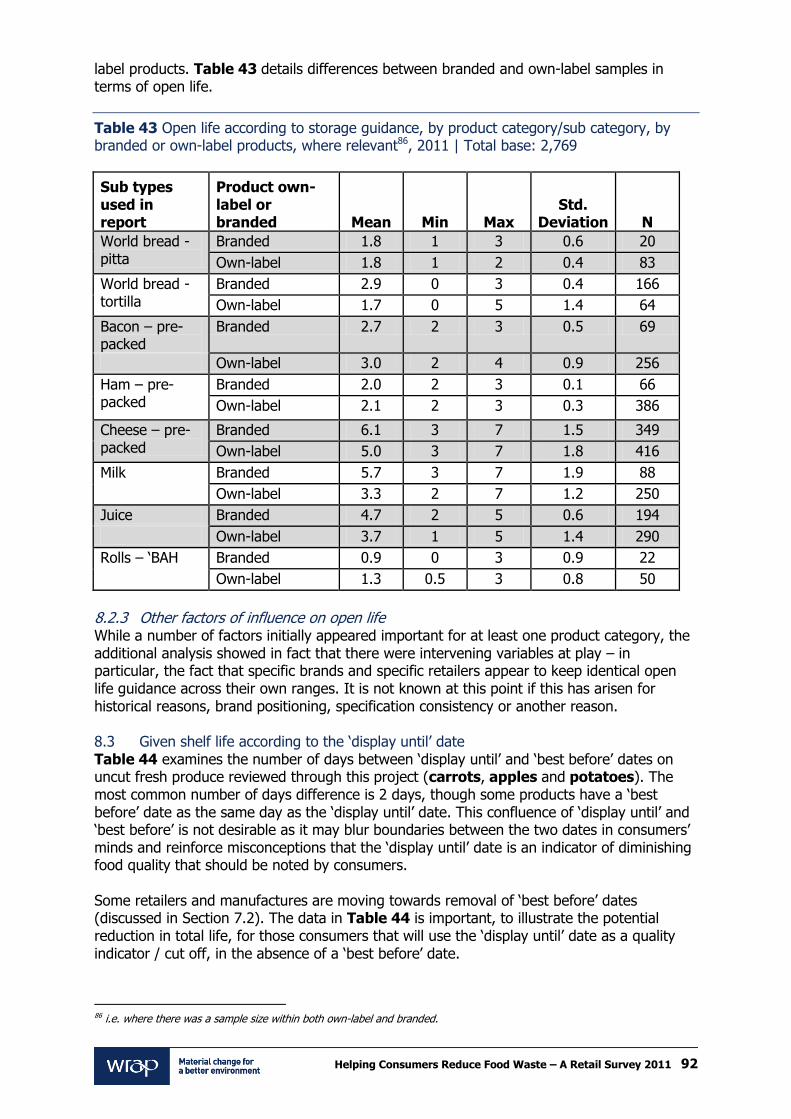
Helping Consumers Reduce Food Waste – A Retail Survey 2011 92
label products. Table 43 details differences between branded and own-label samples in terms of open life.
Table 43 Open life according to storage guidance, by product category/sub category, by branded or own-label products, where relevant86, 2011 | Total base: 2,769
Sub types used in report
Product own-label or branded Mean Min Max
Std. Deviation N
World bread - pitta
Branded 1.8 1 3 0.6 20
Own-label 1.8 1 2 0.4 83
World bread - tortilla
Branded 2.9 0 3 0.4 166
Own-label 1.7 0 5 1.4 64
Bacon – pre-packed
Branded 2.7 2 3 0.5 69
Own-label 3.0 2 4 0.9 256
Ham – pre-packed
Branded 2.0 2 3 0.1 66
Own-label 2.1 2 3 0.3 386
Cheese – pre-packed
Branded 6.1 3 7 1.5 349
Own-label 5.0 3 7 1.8 416
Milk Branded 5.7 3 7 1.9 88
Own-label 3.3 2 7 1.2 250
Juice Branded 4.7 2 5 0.6 194
Own-label 3.7 1 5 1.4 290
Rolls – ‘BAH Branded 0.9 0 3 0.9 22
Own-label 1.3 0.5 3 0.8 50
8.2.3 Other factors of influence on open life While a number of factors initially appeared important for at least one product category, the additional analysis showed in fact that there were intervening variables at play – in particular, the fact that specific brands and specific retailers appear to keep identical open life guidance across their own ranges. It is not known at this point if this has arisen for historical reasons, brand positioning, specification consistency or another reason. 8.3 Given shelf life according to the ‘display until’ date Table 44 examines the number of days between ‘display until’ and ‘best before’ dates on uncut fresh produce reviewed through this project (carrots, apples and potatoes). The most common number of days difference is 2 days, though some products have a ‘best before’ date as the same day as the ‘display until’ date. This confluence of ‘display until’ and ‘best before’ is not desirable as it may blur boundaries between the two dates in consumers’ minds and reinforce misconceptions that the ‘display until’ date is an indicator of diminishing food quality that should be noted by consumers. Some retailers and manufactures are moving towards removal of ‘best before’ dates (discussed in Section 7.2). The data in Table 44 is important, to illustrate the potential reduction in total life, for those consumers that will use the ‘display until’ date as a quality indicator / cut off, in the absence of a ‘best before’ date.
86 i.e. where there was a sample size within both own-label and branded.

Helping Consumers Reduce Food Waste – A Retail Survey 2011 93
Table 44 In-home life – as difference between ‘display until’ date and ‘best before’ date, 2011 | Base: 361
Product category Same day 1 day 2 days 3 days 4 days N
Carrots – standard – pre-packed 24 17 117 5 1 164
Apples – pre-packed 2 0 58 11 0 71
Potatoes – pre-packed 3 10 92 21 0 126
Total 29 27 267 37 1 361

Helping Consumers Reduce Food Waste – A Retail Survey 2011 94
9.0 Cooking and portioning guidance 9.1 Presence of cooking guidance 42% of all packaged products carried cooking information in 2011. When this is narrowed down to products which would always or often be cooked before eating (cooking sauce, bacon, potatoes, carrots, rice, pasta, ready meals, eggs and chicken) the proportion rises to 82%. Products with high levels of cooking instructions:
Chicken, both chilled (100%) and frozen (99%);
Chilled cooking sauce (100%);
Chilled and frozen ready meals (both 99%);
Rice, both standard and pre-cooked (99%); and
Pasta (98%). Products where a proportion of products lacked cooking instructions:
Ambient cooking sauce (10% lacked instructions);
Pre-packed bacon (12%) and deli bacon (42%);
Carrots: Pre-prepared-packed (13%), standard (18%);
Potatoes (22% of pre-packed potatoes lacked cooking instructions); and
Eggs (98% of which lacked cooking instructions). The overall proportion of pre-packed carrots carrying cooking guidance appears to have decreased between the 2009 and 2011 samples, being on 81% and 74% of packs respectively. Fewer pre-packed potatoes carried cooking instructions in the 2011 sample (78%) than in 2009 (82%). While no loose carrots carried cooking instructions, 5% of loose potatoes did carry this sort of guidance – as part of information printed on bags provided. A very small proportion of pre-packed apples (4%) carried cooking information, something which may be of use to consumers seeking to use up apples that are past their best, or those which have passed their ‘best before’ date. A small proportion of pre-packed ham (5%) carried cooking instructions, something which may be useful to consumers seeking to use up ham once opened, given the short open shelf life common to this type of product. 9.2 Presence of recipes 15% of all products reviewed in 2011 carried a recipe of some kind, compared to just over half that (8%) in the 2009 sample. In contrast to 2009, where recipes were found on products in around half of the product categories, nearly every product category in 2011 was found to contain products carrying a recipe of some kind. The exceptions to this are orange juice, ready meals and yoghurts. The increase in recipes is beneficial from a food waste perspective as it provides consumers with potentially new ways of using a food, which may help them to use up an excess if a pack is opened (perhaps for another recipe) but not finished. This is particularly useful on foods which have short shelf lives or short shelf lives once opened. A greater proportion of cooking sauce carried a recipe for cooking a full dish (as opposed to cooking instructions, such as ‘stir through hot pasta’ or ‘heat and serve’) in the 2011
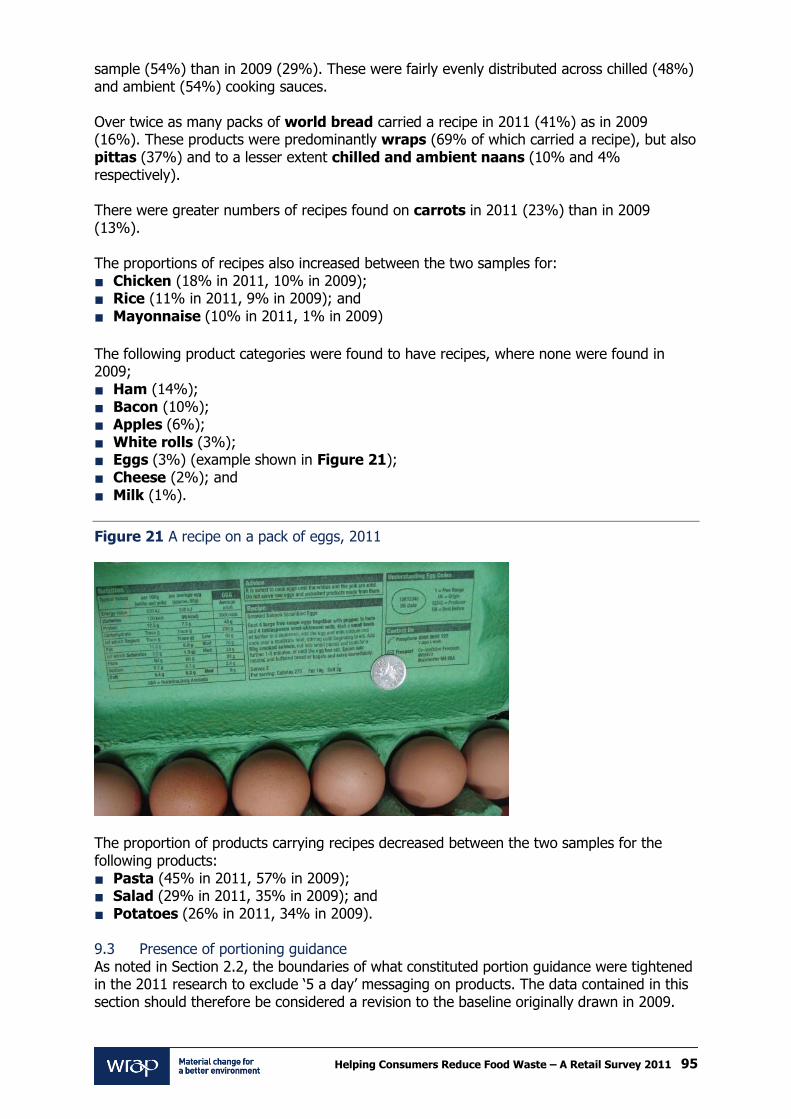
Helping Consumers Reduce Food Waste – A Retail Survey 2011 95
sample (54%) than in 2009 (29%). These were fairly evenly distributed across chilled (48%) and ambient (54%) cooking sauces. Over twice as many packs of world bread carried a recipe in 2011 (41%) as in 2009 (16%). These products were predominantly wraps (69% of which carried a recipe), but also pittas (37%) and to a lesser extent chilled and ambient naans (10% and 4% respectively). There were greater numbers of recipes found on carrots in 2011 (23%) than in 2009 (13%). The proportions of recipes also increased between the two samples for:
Chicken (18% in 2011, 10% in 2009);
Rice (11% in 2011, 9% in 2009); and
Mayonnaise (10% in 2011, 1% in 2009)
The following product categories were found to have recipes, where none were found in 2009;
Ham (14%);
Bacon (10%);
Apples (6%);
White rolls (3%);
Eggs (3%) (example shown in Figure 21);
Cheese (2%); and
Milk (1%).
Figure 21 A recipe on a pack of eggs, 2011
The proportion of products carrying recipes decreased between the two samples for the following products:
Pasta (45% in 2011, 57% in 2009);
Salad (29% in 2011, 35% in 2009); and
Potatoes (26% in 2011, 34% in 2009). 9.3 Presence of portioning guidance As noted in Section 2.2, the boundaries of what constituted portion guidance were tightened in the 2011 research to exclude ‘5 a day’ messaging on products. The data contained in this section should therefore be considered a revision to the baseline originally drawn in 2009.

Helping Consumers Reduce Food Waste – A Retail Survey 2011 96
Some comparisons have been made for illustrative purposes, but these should be considered in light of the aforementioned changes. 19% of all packed products carried portioning information. This guidance came in several forms:
A specific number of portions, e.g. ‘Serves 3’ – 59%;
A specific weight or volume, e.g. ‘100g = 1 portion’ – 17%;
A specific weight or volume and a number of portions, e.g. ‘This pack contains two 150g portions’ – 17%;
A weight / volume range, e.g. ‘Allow 70-100g per person’ – 3%; or
A number of portions range, e.g. ‘Serves 2-3’ – 3%.
9.3.1 Portion guidance on staple foods Around 100,000 tonnes of rice and pasta are disposed of annually in the UK87, the majority of it because too much is prepared, cooked or served. Portion guidance on these types of food might reasonably be considered as an important step towards reducing this kind of waste. 92% of packs of standard dry rice carried portion size information in 2011 (90% in 2009). Where guidance was given it was primarily both a specific weight/volume and a specific number of portions (54% of guidance). The most common portion size was equivalent to 62.5g88 (48% of guidance), then 75g (33%). These numbers are similar to those found on standard packs of rice in 2009 (52% 62.5g portions and 33% 75g portions). 11% of guidance in 2011 stated a single portion was 50g. These are quite substantial variations in portion size. If there is doubt about how much constitutes a reasonable portion it may be better for retailers or manufacturers to state a range, e.g. ‘50-75g = 1 portion’. This would allow consumers to better judge the bounds of portioning, and decide for themselves which portion best suits their appetite. In 2011, 77% of pre-cooked microwavable rice products carried portion guidance, an increase on the 49% found in the 2009 sample. In 2009, 100% of this type of rice which carried portion guidance gave 125g as the weight of one portion. In 2011, guidance was more varied. 50% of packs carrying this guidance gave a weight of 125g for a single portion, 26% suggested 100g and 22% suggested 150g. In the 2011 sample, 65% of packs of pasta carried portion information compared to 57% in the 2009 sample. As in 2009, the guidance was inconsistent. Most commonly, packs gave a specific weight (63% of packs with portion guidance), but a fair proportion (29%) gave a portion weight range. The remainder gave both a weight and a number of portions. Ranges given were all 75-100g, though 53 products also gave a smaller range, 50-70g for a ‘starter’ portion. The most common single portion size given was 75g (36% of guidance). It is interesting that the range only increases from this base, rather than taking it as a central point, as might be expected. These proportions of guidance are similar to those found in the 2009 sample. Portion guidance for pasta was more commonly available on own-label (89%) than branded products (36%), however the proportion of branded products carrying guidance was greater than in the 2009 (21%) sample.
87 Household Food and Drink Waste in the UK, WRAP, 2009 88 Where only a number of portions was given the portion size was calculated from this number and the pack weight or volume if present.

Helping Consumers Reduce Food Waste – A Retail Survey 2011 97
As in 2009, no pre-packed potatoes carried portion guidance. 9.3.2 Portion guidance on non-staple foods In 2011, of the 35% of ambient cooking sauce products that carried portion guidance, values given ranged broadly from 65-200g. The most common values were 125g and 150g (both constituting 17% of portion guidance given). This said, the consistency of sauces varies considerably, as does consumer preference to how much sauce is used. Portion guidance on sauce, combined with guidance about how to keep leftover product, may be useful to help combat waste of opened cooking sauce not used before it goes off. 49% of ready meals carried portion guidance in 2011, compared to 39% of the 2009 sample. All portion guidance was in the form of a specific number of portions. Portion guidance sizes in frozen ready meals were more homogenous than for chilled ready meals, being either 351-400g (88% of frozen products carrying this guidance) or up to 250g (13%). In chilled ready meals, portion sizes fell into six 50g bands from 500g down to less than 250g. The most common size for one portion was 351 to 400g (52%), but substantial proportions of products carried guidance stating one portion was 201 to 300g (11%) and 401 to 450g (21%). The smallest portions were 250g or less (5%) and the largest 451 to 500g (5%). As ready meals commonly provide a single portion, it might be said that this variation is useful to consumers, who can choose a meal of a size that fits their needs. The many competing considerations that consumers experience when shopping, however, may mean that the size of portion they are purchasing is not at the front of their mind when they buy a meal, and the variation then may well lead to waste, or to the consumer eating more or less than they hoped to.
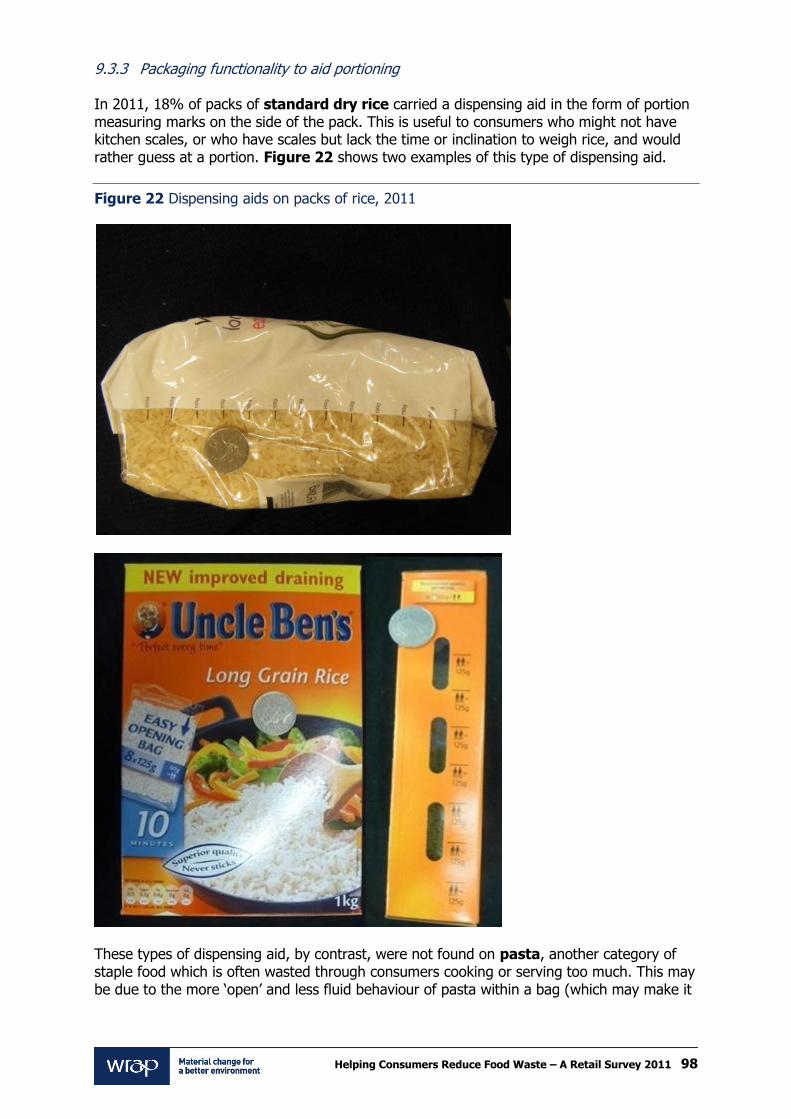
Helping Consumers Reduce Food Waste – A Retail Survey 2011 98
9.3.3 Packaging functionality to aid portioning In 2011, 18% of packs of standard dry rice carried a dispensing aid in the form of portion measuring marks on the side of the pack. This is useful to consumers who might not have kitchen scales, or who have scales but lack the time or inclination to weigh rice, and would rather guess at a portion. Figure 22 shows two examples of this type of dispensing aid.
Figure 22 Dispensing aids on packs of rice, 2011
These types of dispensing aid, by contrast, were not found on pasta, another category of staple food which is often wasted through consumers cooking or serving too much. This may be due to the more ‘open’ and less fluid behaviour of pasta within a bag (which may make it

Helping Consumers Reduce Food Waste – A Retail Survey 2011 99
harder make the contents of the bag sit evenly) and the variety of pasta shapes, which would make it difficult for the manufacturer to allocate a portion scale on-pack. 9.4 Tips Some examples of tips on avoiding food waste, or advice about how to use leftovers were found in the course of the research. As in 2009, a number of chicken packs carried guidance on use of leftovers. 8% of packs of chilled chicken carried the guidance ‘Cool leftovers to room temperature, refrigerate within 2 hours and consume within 2 days’. All 26 packs were Waitrose and Waitrose/Essential own-label. While fewer pre-packed potatoes carried recipes in 2011 than in 2009, 59 packs carried waste avoidance tips or guidance. Some of this was in the form of detailed storage guidance ‘Potatoes will last longer if stored in a cool dark place or in the fridge. Warmth encourages sprouting and light causes potatoes to turn green’ (17% of potatoes) or ‘Potatoes will last longer if stored in a cool dry dark place’ (3%). Other packs gave the tip ‘Why not try leaving the skin on and bashing up with chopped spring onion and sour cream’ (useful given 480,000 tonnes of potato peel are thrown away each year89).
89 Household Food and Drink Waste in the UK, WRAP, 2009

Helping Consumers Reduce Food Waste – A Retail Survey 2011 100
10.0 Point of sale information Retailers employ point of sale information to various ends, including those that intend, or might promote the avoidance of food waste. Our research found 252 instances of point of sale information being used to ends that might prevent food waste. These fell into five formats:
Online links (n= 230);
Extra information on loose bags (n= 13);
Shelf edge labels (n= 5);
Leaflets, e.g. recipe cards (n= 3); and
Banners (n= 1).
The information given was categorised into six types:
Product life guarantee (n= 168);
Food waste mention (n= 55);
Short product life warning (n= 42);
Expected product life information (n= 19);
Information on how best to store at home (n= 10); and
Recipes (n= 5).
10.1 Online links 230 products which were sold online carried point of sale information in the form of an online link. The majority of this information was in the form of a product life guarantee (n=168). 42 online links gave a short product life warning and mentioned food waste, and 19 gave expected product life information. 1 online link gave a recipe. 10.2 Extra information on loose bags 49 instances of bags printed with information were recorded by our researchers as being available with loose or deli products. In 13 instances, the researchers reported that the bags mentioned food waste and / or the Love Food Hate Waste logo, and five of these bags were also reported to give information about how best to store foods at home. Using the bag to provide storage guidance for loose products is an excellent way to help consumers keep what they buy at its best and waste less. Figure 23 shows a Tesco deli bag that also provides food safety tips from the Food Standards Agency.
Figure 23 Tesco deli produce bag with FSA guidelines, 2011

Helping Consumers Reduce Food Waste – A Retail Survey 2011 101
10.3 Shelf edge labels In five instances, Sainsbury’s loose carrots were found to have shelf-edge labels stating ‘At home, refrigerate for freshness’ (Figure 24).
Figure 24 Shelf edge label on Sainsbury’s loose carrots, 2011
10.4 Leaflets, e.g. recipe cards Recipe cards for both own-label and branded products were found in stores (Figures 25-27). Some of these cards are useful for the simple reason that they provide consumers with information on how they might use the products they buy in new or different ways. Others carry information about how leftovers may be used, helping build consumer’s food management skills at the same time as preventing waste of a specific product. Others seemed particularly geared towards inexperienced cooks or people who were not the main cook in the household, pointing out what ingredients were likely to be in the store cupboard, and which ones might need to be bought specifically for the recipe.
Figure 25 M&S recipe card with details of stock cupboard ingredients and those that should be bought, plus advertisement of the long given shelf life of the ingredient, 2011
Figure 26 Morrisons' recipe card advertising ‘Great Taste Less Waste’ with leftover recipe ideas, 2011
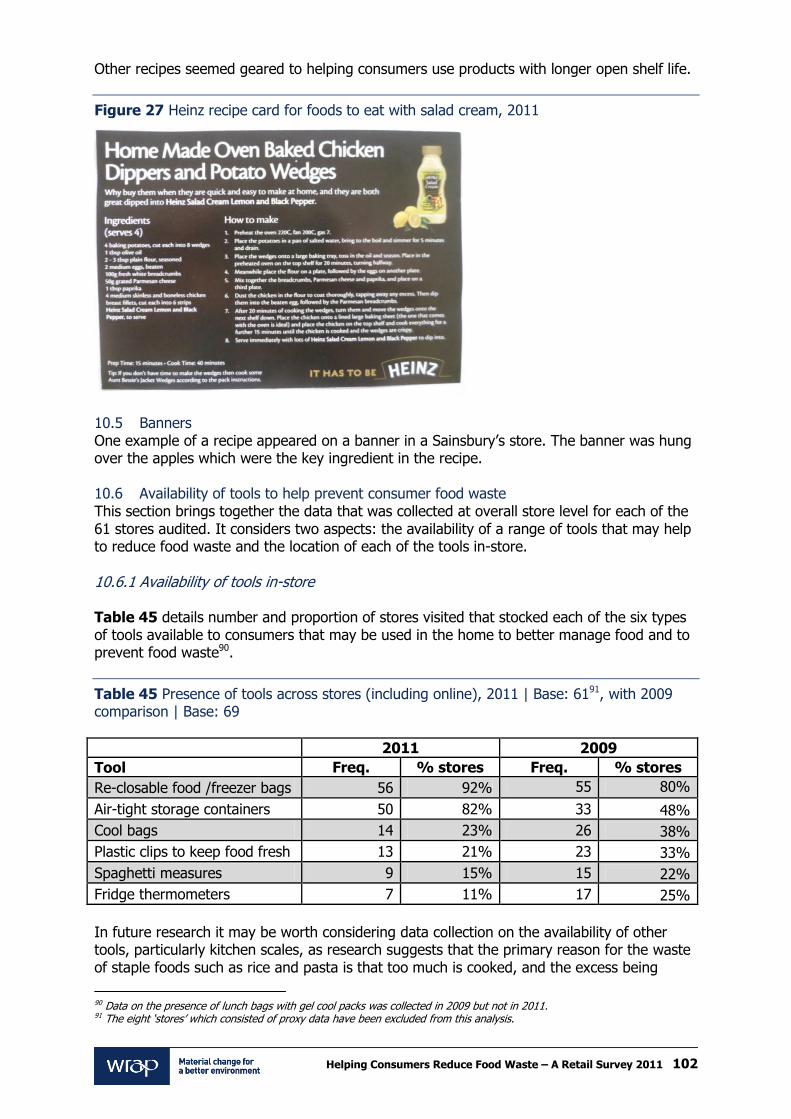
Helping Consumers Reduce Food Waste – A Retail Survey 2011 102
Other recipes seemed geared to helping consumers use products with longer open shelf life.
Figure 27 Heinz recipe card for foods to eat with salad cream, 2011
10.5 Banners One example of a recipe appeared on a banner in a Sainsbury’s store. The banner was hung over the apples which were the key ingredient in the recipe. 10.6 Availability of tools to help prevent consumer food waste This section brings together the data that was collected at overall store level for each of the 61 stores audited. It considers two aspects: the availability of a range of tools that may help to reduce food waste and the location of each of the tools in-store. 10.6.1 Availability of tools in-store Table 45 details number and proportion of stores visited that stocked each of the six types of tools available to consumers that may be used in the home to better manage food and to prevent food waste90.
Table 45 Presence of tools across stores (including online), 2011 | Base: 6191, with 2009 comparison | Base: 69
2011 2009
Tool Freq. % stores Freq. % stores
Re-closable food /freezer bags 56 92% 55 80%
Air-tight storage containers 50 82% 33 48%
Cool bags 14 23% 26 38%
Plastic clips to keep food fresh 13 21% 23 33%
Spaghetti measures 9 15% 15 22%
Fridge thermometers 7 11% 17 25%
In future research it may be worth considering data collection on the availability of other tools, particularly kitchen scales, as research suggests that the primary reason for the waste of staple foods such as rice and pasta is that too much is cooked, and the excess being
90 Data on the presence of lunch bags with gel cool packs was collected in 2009 but not in 2011. 91 The eight ‘stores’ which consisted of proxy data have been excluded from this analysis.

Helping Consumers Reduce Food Waste – A Retail Survey 2011 103
thrown away92. The majority of rice and pasta products that gave portion guidance in this research gave it in grams, suggesting that consumers need to be encouraged to weigh these foods in order to cook the correct amount. The larger supermarkets were more likely to sell each type of tool available than ‘metro’ or convenience stores. However, the majority of convenience stores reviewed stocked re-closable food /freezer bags and storage containers (Table 46).
Table 46 Tools by store fascia, 2011 | Base: 61
Supermarket
‘Metro’ / Convenience
store Online
Re-closable food /freezer bags 29 22 5
Air-tight storage containers 28 17 5
Cool bags 6 5 3
Plastic clips 11 2 -
Spaghetti measures 8 - 1
Fridge thermometers 5 - 2
Base 32 24 5
10.6.2 In store location of tools93 Table 47 shows that in most stores tools are found in non-food areas – i.e. not near the food products with which they might be used. Air-tight containers and re-closable food/freezer bags were the tools most likely to be found in the food aisles/areas of stores, while cool bags were the tool most likely found near the till. Spaghetti measures and fridge thermometers were never located by the food area of any of the stores reviewed.
Table 47 Tools by in-store location, 2011 | Base: 61
Tool Non-food area
Food area
Till Online Base
Re-closable food /freezer bags 41 6 - 5 56
Air-tight storage containers 38 9 - 5 50
Cool bags 2 2 8 3 14
Plastic clips 13 2 - - 13
Spaghetti measures 8 - - 1 9
Fridge thermometers 5 - - 2 7
92 Household Food and Drink Waste in the UK, WRAP, 2009 93 Seven types of tools were found in two different locations of the store reviewed and six tools were recorded as present in store but their location was not specified. This explains why some base figures in the tables do not tally.
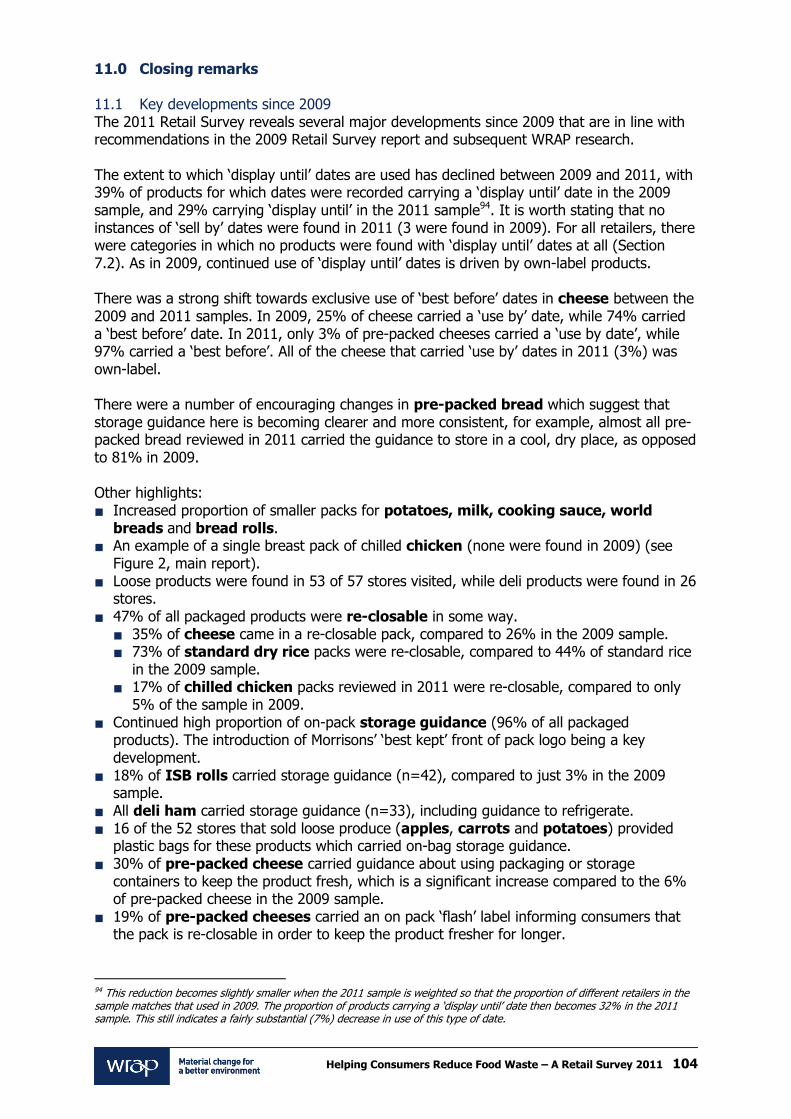
Helping Consumers Reduce Food Waste – A Retail Survey 2011 104
11.0 Closing remarks 11.1 Key developments since 2009 The 2011 Retail Survey reveals several major developments since 2009 that are in line with recommendations in the 2009 Retail Survey report and subsequent WRAP research. The extent to which ‘display until’ dates are used has declined between 2009 and 2011, with 39% of products for which dates were recorded carrying a ‘display until’ date in the 2009 sample, and 29% carrying ‘display until’ in the 2011 sample94. It is worth stating that no instances of ‘sell by’ dates were found in 2011 (3 were found in 2009). For all retailers, there were categories in which no products were found with ‘display until’ dates at all (Section 7.2). As in 2009, continued use of ‘display until’ dates is driven by own-label products. There was a strong shift towards exclusive use of ‘best before’ dates in cheese between the 2009 and 2011 samples. In 2009, 25% of cheese carried a ‘use by’ date, while 74% carried a ‘best before’ date. In 2011, only 3% of pre-packed cheeses carried a ‘use by date’, while 97% carried a ‘best before’. All of the cheese that carried ‘use by’ dates in 2011 (3%) was own-label. There were a number of encouraging changes in pre-packed bread which suggest that storage guidance here is becoming clearer and more consistent, for example, almost all pre-packed bread reviewed in 2011 carried the guidance to store in a cool, dry place, as opposed to 81% in 2009. Other highlights:
Increased proportion of smaller packs for potatoes, milk, cooking sauce, world breads and bread rolls.
An example of a single breast pack of chilled chicken (none were found in 2009) (see Figure 2, main report).
Loose products were found in 53 of 57 stores visited, while deli products were found in 26 stores.
47% of all packaged products were re-closable in some way.
35% of cheese came in a re-closable pack, compared to 26% in the 2009 sample.
73% of standard dry rice packs were re-closable, compared to 44% of standard rice in the 2009 sample.
17% of chilled chicken packs reviewed in 2011 were re-closable, compared to only 5% of the sample in 2009.
Continued high proportion of on-pack storage guidance (96% of all packaged products). The introduction of Morrisons’ ‘best kept’ front of pack logo being a key development.
18% of ISB rolls carried storage guidance (n=42), compared to just 3% in the 2009 sample.
All deli ham carried storage guidance (n=33), including guidance to refrigerate.
16 of the 52 stores that sold loose produce (apples, carrots and potatoes) provided plastic bags for these products which carried on-bag storage guidance.
30% of pre-packed cheese carried guidance about using packaging or storage containers to keep the product fresh, which is a significant increase compared to the 6% of pre-packed cheese in the 2009 sample.
19% of pre-packed cheeses carried an on pack ‘flash’ label informing consumers that the pack is re-closable in order to keep the product fresher for longer.
94 This reduction becomes slightly smaller when the 2011 sample is weighted so that the proportion of different retailers in the sample matches that used in 2009. The proportion of products carrying a ‘display until’ date then becomes 32% in the 2011 sample. This still indicates a fairly substantial (7%) decrease in use of this type of date.

Helping Consumers Reduce Food Waste – A Retail Survey 2011 105
44% of freezable products carried the snowflake logo, with 32% using accompanying text. Chilled naans had a very high prevalence of snowflake/star freezing symbols, with 90% of products carrying a symbol.
The majority (73%) of products which gave freezing guidance recommended how long the product could be kept frozen for. In most cases, this was either one month (81%) or three months (19%).
The proportion of chilled cooking sauces carrying freezing instructions increased between the samples, from 88% of packs in 2009, to 98% in 2011.
82% of products that require cooking, carried cooking guidance.
15% of products had a recipe on-pack (compared to just 8% in 2009).
65% of pasta packs carried portioning guidance (compared to 57% in 2009).
During the research, 252 examples of point of sale information that might help prevent food waste were noted including: online links, printed loose produce / deli bags, shelf edge labels and leaflets.
11.2 Recommendations for industry On the basis of the insights from this 2011 data collection exercise, WRAP is keen to work with the food industry to:
Continue the excellent progress to remove / disguise ‘display until’ dates, and to increase consistency of ‘use by’ or ‘best before’ date type use within a product category, where appropriate.
Increase use of storage guidance that reinforces what the ‘use by’ date means e.g. ‘Do not exceed use by date’ and decrease similar advice for ‘best before’ date products.
Increase proportion of freezable products that carry freezing and defrosting guidance. Highlight this on the front of pack where possible using the snowflake logo, and consider how to amplify this type of guidance during a volume promotion.
Increase use of alternative freezing guidance, and communicate these changes to customers e.g. using the ‘Freeze before / date mark’ label rather than stating to ‘Freeze on day of purchase’.
Reduce use of the snowflake logo to indicate anything other than ‘suitable for home freezing’. Reduce use of other logos to indicate products can be frozen.
Continue to provide clear storage guidance that is consistent within a product category, where appropriate, for both packed and loose formats.
Follow FSA recommended ‘keep refrigerated below 5oC’ where fridge temperature guidance is stated on-pack.
Give the longest possible shelf life:
Extend the ‘best before’ or ‘use by’ date where possible.
Extend ‘Use within x days of opening’ where possible.
Extend ‘Use within x months of freezing’ where possible.
Continue to provide cooking and portioning information on-pack, and develop pack functionality that aids portioning and extends open shelf life e.g. by being re-closable.
Continue improvements in availability of smaller pack sizes / loose variants, where appropriate. Where it is not possible to provide smaller packs, investigate how to provide guidance on optimising storage, freezing and using leftovers.
Increase the provision and accessibility of tools that help prevent food waste in the home e.g. air-tight storage containers and bag clips, for example, signposting to them from the relevant fixtures.
Use Love Food Hate Waste materials to raise awareness of the benefits of reducing food waste and engaging consumers to act. Continue to use existing communication channels to raise awareness of the benefits (both financial and environmental) of reducing food waste, and provide tips / guidance to optimise in-home storage and food use e.g. through recipes.

Helping Consumers Reduce Food Waste – A Retail Survey 2011 106
Appendix 1 – Product category scope
2009 - 2011
2009 2011
Apples Examples of all available packs of Braeburn apples. If unavailable, then all available Gala apples. If unavailable again then all available Pink Lady apples.
All information relating to loose apples (price, promo, dates etc.) including any information given on the produce bags (field workers were told not to purchase them as standard, but told that if necessary they should purchase 2 loose apples of the same type as selected for the packs, e.g. Braeburn).
NOT organic apples.
Examples of all available packs of Braeburn apples. If unavailable, then all available Gala apples. If unavailable again then all available Pink Lady apples.
All information relating to loose apples (price, promo, dates etc.) including any information given on the produce bags. If necessary purchase one loose apple (the same type as selected for the packs e.g. Braeburn).
NOT organic apples.
Bacon Examples of every available pack of unsmoked back bacon;
100g of any unsmoked back bacon available from the deli counter; but
NOT organic bacon
Examples of every available pack of unsmoked back bacon
Deli counter - 100g of any unsmoked back bacon available
NOT organic
Rolls One example of every packet of plain white rolls.
One white roll (any) from the in-store bakery.
NOT seeded rolls.
One example of every packet of plain white rolls.
One white roll (any) from the in-store bakery.
NOT seeded rolls but includes finger / hot dog rolls, sub rolls, ciabatta and panini.
Bread Examples of all available medium-sliced white bread. If these were unavailable then they were told to pick thick OR thin sliced white bread.
From the in-store bakery, an example of all available sizes of a ‘standard’ white loaf (i.e. NOT bloomers, crusty etc.) - sliced where available.
NOT brown bread.
Examples of all available medium-sliced white bread. If unavailable then pick thick OR thin sliced white bread.
In-store bakery (ISB) – example of all available sizes of a ‘standard’ white loaf (i.e. NOT bloomers, crusty etc.). ISB and Bake at home examples need to be recorded as such under variant field.
NOT brown bread or 50/50 or ‘best of both’.
Carrots Examples of all available packs of fresh carrots available, including organic varieties AND pre-prepared carrots;
loose carrots (price, promo, dates etc.) including any information given on the
produce bags (not purchased as standard, however if necessary purchase 2 loose carrots);
NOT tinned or frozen carrots, or any packs of mixed vegetables containing carrots.
Examples of all available packs of fresh carrots available, including organic varieties AND pre-prepared carrots.
Capture information relating to loose carrots (price, promo, dates etc.) including any
information given on the produce bags. . Do not purchase as standard, however if necessary purchase 2 loose carrots.
NOT tinned or frozen carrots, or any packs of mixed vegetables containing carrots.
Cheese Examples of all mature cheddar available; 100g of ANY mature cheddar at the deli
counter where available; NOT grated/sliced cheese or soft cheese
(e.g. Philadelphia, Dairylea etc.).
Examples of all mature cheddar available. Where a range of sizes available, please
select smallest size (only one pack size of each type/brand required for purchase). Please log an example of all pack sizes available across the cheese category.
Deli counter – 100g of ANY mature cheddar. NOT grated/sliced cheese or soft cheese
(e.g. Philadelphia, Dairylea etc.).
Include organic versions of produce.
Chicken An example of every available pack of whole skinless chicken breast fillets (NOT mini or diced chicken fillets).
All available sizes i.e. small (1-2 fillets), medium (3-4 fillets) and large (5-8 fillets)
Examples of every available pack of whole skinless chicken breast fillets (NOT mini or diced chicken fillets).
Log all available sizes of packs of chicken fillets i.e. small (1-2 fillets), medium (3-4
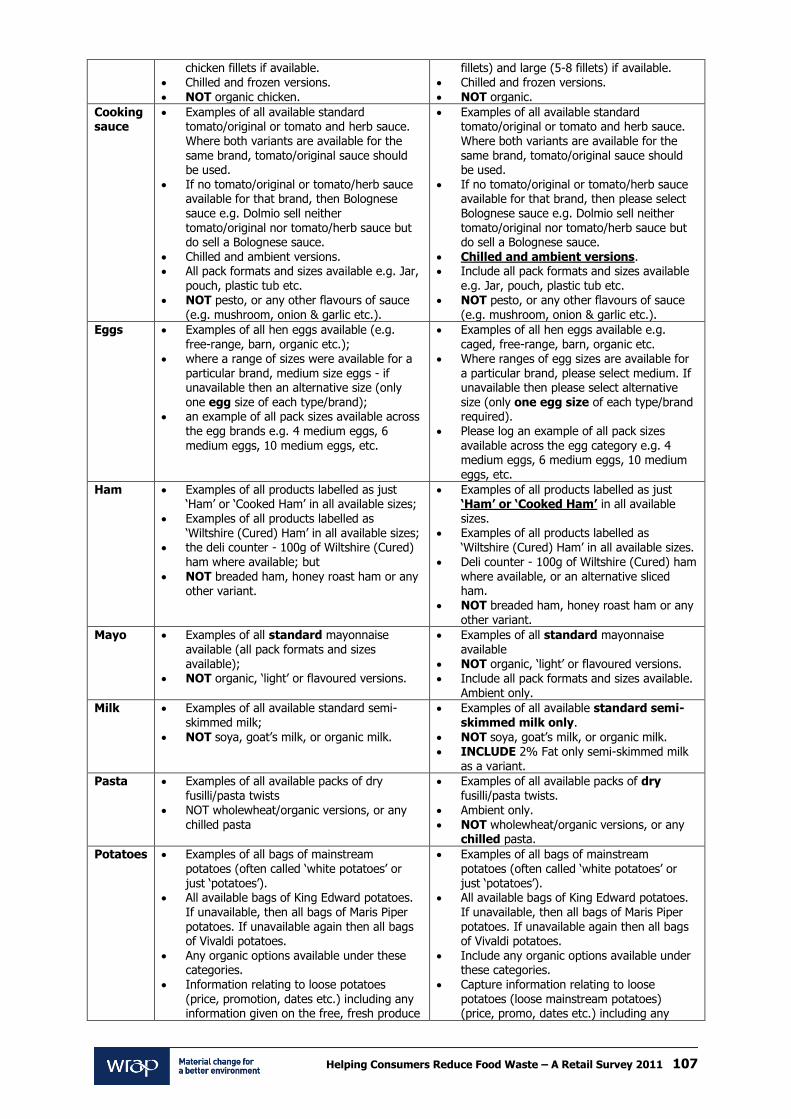
Helping Consumers Reduce Food Waste – A Retail Survey 2011 107
chicken fillets if available. Chilled and frozen versions. NOT organic chicken.
fillets) and large (5-8 fillets) if available. Chilled and frozen versions. NOT organic.
Cooking sauce
Examples of all available standard tomato/original or tomato and herb sauce. Where both variants are available for the same brand, tomato/original sauce should be used.
If no tomato/original or tomato/herb sauce available for that brand, then Bolognese sauce e.g. Dolmio sell neither tomato/original nor tomato/herb sauce but do sell a Bolognese sauce.
Chilled and ambient versions. All pack formats and sizes available e.g. Jar,
pouch, plastic tub etc. NOT pesto, or any other flavours of sauce
(e.g. mushroom, onion & garlic etc.).
Examples of all available standard tomato/original or tomato and herb sauce. Where both variants are available for the same brand, tomato/original sauce should be used.
If no tomato/original or tomato/herb sauce available for that brand, then please select Bolognese sauce e.g. Dolmio sell neither tomato/original nor tomato/herb sauce but do sell a Bolognese sauce.
Chilled and ambient versions. Include all pack formats and sizes available
e.g. Jar, pouch, plastic tub etc. NOT pesto, or any other flavours of sauce
(e.g. mushroom, onion & garlic etc.).
Eggs Examples of all hen eggs available (e.g. free-range, barn, organic etc.);
where a range of sizes were available for a particular brand, medium size eggs - if unavailable then an alternative size (only one egg size of each type/brand);
an example of all pack sizes available across the egg brands e.g. 4 medium eggs, 6 medium eggs, 10 medium eggs, etc.
Examples of all hen eggs available e.g. caged, free-range, barn, organic etc.
Where ranges of egg sizes are available for a particular brand, please select medium. If unavailable then please select alternative size (only one egg size of each type/brand required).
Please log an example of all pack sizes available across the egg category e.g. 4 medium eggs, 6 medium eggs, 10 medium eggs, etc.
Ham Examples of all products labelled as just ‘Ham’ or ‘Cooked Ham’ in all available sizes;
Examples of all products labelled as ‘Wiltshire (Cured) Ham’ in all available sizes;
the deli counter - 100g of Wiltshire (Cured) ham where available; but
NOT breaded ham, honey roast ham or any other variant.
Examples of all products labelled as just ‘Ham’ or ‘Cooked Ham’ in all available
sizes. Examples of all products labelled as
‘Wiltshire (Cured) Ham’ in all available sizes. Deli counter - 100g of Wiltshire (Cured) ham
where available, or an alternative sliced ham.
NOT breaded ham, honey roast ham or any other variant.
Mayo Examples of all standard mayonnaise available (all pack formats and sizes available);
NOT organic, ‘light’ or flavoured versions.
Examples of all standard mayonnaise available
NOT organic, ‘light’ or flavoured versions. Include all pack formats and sizes available.
Ambient only.
Milk Examples of all available standard semi-skimmed milk;
NOT soya, goat’s milk, or organic milk.
Examples of all available standard semi-skimmed milk only.
NOT soya, goat’s milk, or organic milk. INCLUDE 2% Fat only semi-skimmed milk
as a variant.
Pasta Examples of all available packs of dry fusilli/pasta twists
NOT wholewheat/organic versions, or any chilled pasta
Examples of all available packs of dry fusilli/pasta twists.
Ambient only. NOT wholewheat/organic versions, or any
chilled pasta.
Potatoes Examples of all bags of mainstream potatoes (often called ‘white potatoes’ or just ‘potatoes’).
All available bags of King Edward potatoes. If unavailable, then all bags of Maris Piper potatoes. If unavailable again then all bags of Vivaldi potatoes.
Any organic options available under these categories.
Information relating to loose potatoes (price, promotion, dates etc.) including any information given on the free, fresh produce
Examples of all bags of mainstream potatoes (often called ‘white potatoes’ or just ‘potatoes’).
All available bags of King Edward potatoes. If unavailable, then all bags of Maris Piper potatoes. If unavailable again then all bags of Vivaldi potatoes.
Include any organic options available under these categories.
Capture information relating to loose potatoes (loose mainstream potatoes) (price, promo, dates etc.) including any
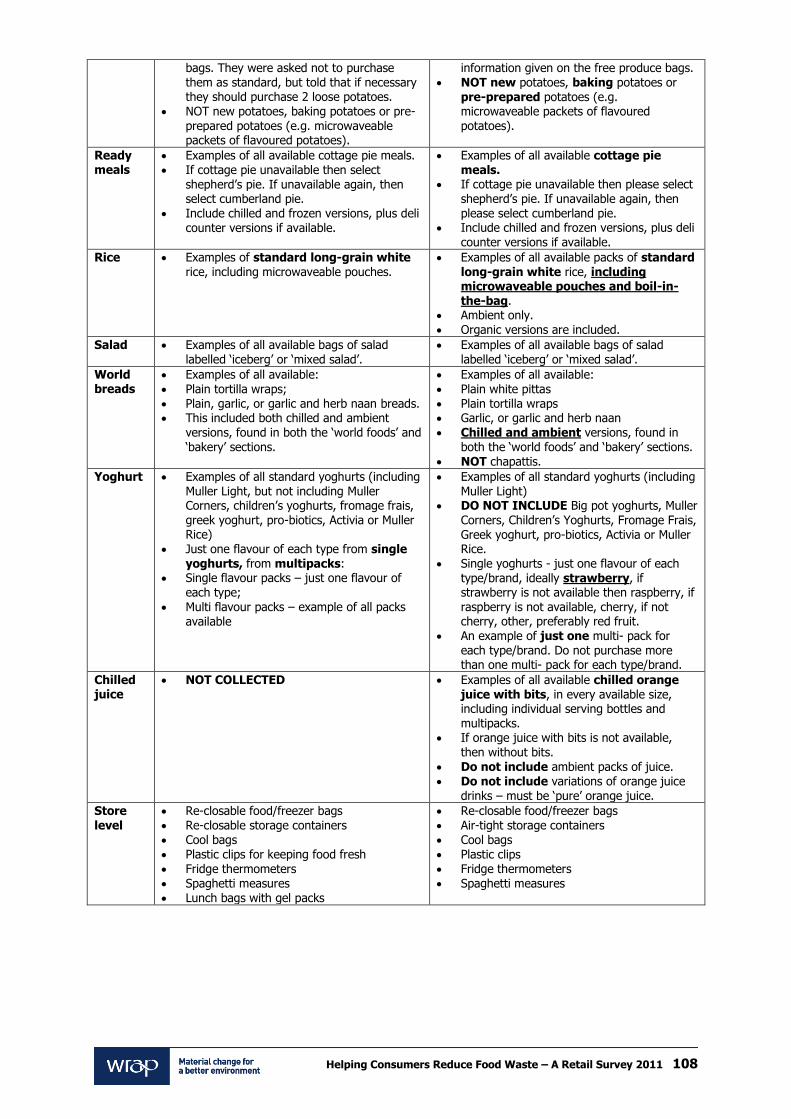
Helping Consumers Reduce Food Waste – A Retail Survey 2011 108
bags. They were asked not to purchase them as standard, but told that if necessary they should purchase 2 loose potatoes.
NOT new potatoes, baking potatoes or pre-prepared potatoes (e.g. microwaveable packets of flavoured potatoes).
information given on the free produce bags. NOT new potatoes, baking potatoes or
pre-prepared potatoes (e.g. microwaveable packets of flavoured potatoes).
Ready meals
Examples of all available cottage pie meals. If cottage pie unavailable then select
shepherd’s pie. If unavailable again, then select cumberland pie.
Include chilled and frozen versions, plus deli counter versions if available.
Examples of all available cottage pie meals.
If cottage pie unavailable then please select shepherd’s pie. If unavailable again, then please select cumberland pie.
Include chilled and frozen versions, plus deli counter versions if available.
Rice Examples of standard long-grain white rice, including microwaveable pouches.
Examples of all available packs of standard long-grain white rice, including microwaveable pouches and boil-in-the-bag.
Ambient only. Organic versions are included.
Salad Examples of all available bags of salad labelled ‘iceberg’ or ‘mixed salad’.
Examples of all available bags of salad labelled ‘iceberg’ or ‘mixed salad’.
World breads
Examples of all available: Plain tortilla wraps; Plain, garlic, or garlic and herb naan breads. This included both chilled and ambient
versions, found in both the ‘world foods’ and ‘bakery’ sections.
Examples of all available: Plain white pittas Plain tortilla wraps Garlic, or garlic and herb naan Chilled and ambient versions, found in
both the ‘world foods’ and ‘bakery’ sections. NOT chapattis.
Yoghurt Examples of all standard yoghurts (including Muller Light, but not including Muller Corners, children’s yoghurts, fromage frais,
greek yoghurt, pro-biotics, Activia or Muller Rice)
Just one flavour of each type from single yoghurts, from multipacks:
Single flavour packs – just one flavour of each type;
Multi flavour packs – example of all packs available
Examples of all standard yoghurts (including Muller Light)
DO NOT INCLUDE Big pot yoghurts, Muller
Corners, Children’s Yoghurts, Fromage Frais, Greek yoghurt, pro-biotics, Activia or Muller Rice.
Single yoghurts - just one flavour of each type/brand, ideally strawberry, if strawberry is not available then raspberry, if raspberry is not available, cherry, if not cherry, other, preferably red fruit.
An example of just one multi- pack for each type/brand. Do not purchase more than one multi- pack for each type/brand.
Chilled juice
NOT COLLECTED Examples of all available chilled orange juice with bits, in every available size, including individual serving bottles and multipacks.
If orange juice with bits is not available, then without bits.
Do not include ambient packs of juice. Do not include variations of orange juice
drinks – must be ‘pure’ orange juice.
Store level
Re-closable food/freezer bags Re-closable storage containers Cool bags Plastic clips for keeping food fresh Fridge thermometers Spaghetti measures Lunch bags with gel packs
Re-closable food/freezer bags Air-tight storage containers Cool bags Plastic clips Fridge thermometers Spaghetti measures

Helping Consumers Reduce Food Waste – A Retail Survey 2011 109
Appendix 2 - Data collection methodology
Survey design and piloting (December 2010 to January 2011) In the 2009 review, data collection was carried out by ESA, and Brook Lyndhurst received the complete dataset after fieldwork had been completed. In 2011, Brook Lyndhurst took on full responsibility for the data collection. Review of the 2009 data highlighted areas of the research which had been of most use and interest to WRAP, as well as those which were less helpful, or where information might be obtained from other sources. This review allowed us to refine the survey design, allowing addition and exclusion of data collection points as appropriate. A new coding frame was developed to allow the field force to record the different types of storage, freezing and defrosting guidance that appeared on products. This coding frame was an advance on that used in 2009, being universal across the product categories, rather than category specific. This later enabled detailed overarching analysis of the data. Four pilot visits to supermarkets were carried out during the survey and interface design phase, to refine the survey questions and the user interface, and to enable the team to familiarise itself with the iPad tablet computers which were to be used in the data collection process. The 2009 data was refined and standardised in order to generate product review directories for field workers, which were tailored to include own-brand products specific to the store that was being visited in each review, as well as all available branded products within the categories. Field worker training (20th January 2011) Eight temporary field workers were recruited to form the field force, and a training day was held at Brook Lyndhurst’s offices on 20th January 2011, in which field workers were introduced to the issues behind the research, and trained in the use of the iPads, the Filemaker user interface, the gathering of data and the taking of suitable photographs of products. The field force split into teams of two for the duration of the fieldwork. Wave 1, 3 online shops, 12 stores (24st January to 4th February 2011) The field force training day was followed by an initial round of data collection from products purchased in online shops at Tesco and Asda. This initial fieldwork was carried out in Brook Lyndhurst’s offices with supervision from our team. The field force used product review directories in the iPad ‘Filemaker’ interface to search for each product they were presented with. If a record was found, it was cross checked with the 2009 product and any necessary changes were made to the record. If a product was not on the product review directory a new record was created and details of that product were logged. Photographs were taken of all new products, all products that had changed since the 2009 research, and any products which had not changed but for which no 2009 photograph was available. When data entry from these online shops was complete, pairs of field workers went out to stores in South East England, accompanied on the first day by a member of the Brook Lyndhurst team. Here they logged new products and changes to existing products since 2009, taking photographs where appropriate and buying products if they carried interesting packaging features or unusual formats that could not be captured in photographs. They also logged any information at the point of sale that might help reduce consumer food waste, and

Helping Consumers Reduce Food Waste – A Retail Survey 2011 110
looked for any tools sold in shops (in both food and non-food areas) that might be useful to consumers in storing or using foods in such a way as to reduce food waste. Field workers were sent Filemaker databases containing bespoke product review directories at the beginning of each shop. These were sent these back to us each time a shop was completed, and uploaded into a master Excel spreadsheet. When the field worker pairs completed their quotient of shops, they returned to our offices and worked on reviewing products from an online shop at Waitrose, Sainsbury’s and Ocado. At the end of Wave 1, a debrief session was held, in which field workers discussed their experiences of fieldwork and shared tips about how to collect data with the greatest speed and accuracy. Any food purchased in either wave of fieldwork, through online shops or by field workers in stores, was either eaten by the team or donated to a local charity for vulnerable and homeless people95. Data cleaning phase (February 7th to February 18th 2011) At the end of phase one, nearly 3,000 products had been reviewed. We began the process of cleaning the gathered data. At this stage we began to allocate ‘unique product IDs’ to individual SKUs which had been reviewed several times in different locations. This made the generation of product review directories simpler, and allowed us to identify and follow up queries about particular SKUs. Photographs allocated to SKUs were numbered according to these SKU IDs, and linked to the records through hyperlinks in the Excel database. With such a large sample, some degree of human error in data gathering or in data entry was inevitable. The data checking process allowed us to identify and resolve discrepancies between records which appeared to be the same SKU, yet had differences in the data recorded. To facilitate checking, and to expedite the reviewing process where we were confident we had an accurate record of a product, we developed three product statuses:
Checked– products which have been reviewed several times in different locations. The records created matched each other exactly, giving us confidence that the records were an accurate representation of the SKU. When a ‘checked product’ was found in store and matched to the record in the product review directory, field workers added price, promotions, point of sale and date information to the record, and took photos if necessary;
To check – products which have been reviewed several times in different locations. The records did not match each other exactly, and field worker input was needed to ascertain if differences were data entry errors, if there was variation on a single SKU (e.g. different types of portion guidance), or if records actually represented different SKUs. When a ‘to check’ product was found and matched to a record, field workers added price, promotions, point of sale and date information. They then followed-up any queries recorded in the ‘details to check’ field (e.g. ‘Record states there is portion guidance, but none is visible in photograph’) by correcting the record if necessary, and writing a response to let us know how the query had been resolved. Photos were also taken if necessary; and
Unchecked – field workers treated these records as templates with some information in, but which could not be relied upon to be accurate. They checked every pre-entered data point, and added price, promotions, point of sale and date information, then took photos if necessary.
95 The Upper Room http://www.theupperroom.org.uk

Helping Consumers Reduce Food Waste – A Retail Survey 2011 111
This iterative checking process gave us a high level of confidence in the accuracy of the data, as well as imparting an understanding of the potential fluidity of packaging, dates and storage and freezing guidance. Wave 2, 44 stores (24th February to 10th March 2011) Field force pairs travelled to four regional ‘hubs’96 from which they carried out visits to the remaining stores. Updated product review directories were sent to field workers before they visited each store, and the data checking process continued throughout Wave 2, so that improved directories and queries could be passed on to the field force as they were completed.
96 Regional ‘hubs’ were Cardiff, Leeds, Edinburgh and Leicester.

www.wrap.org.uk/retail