Final report for a survey for harbour porpoises (Phocoena ... · Final report for a survey for...
19
Acoustic and visual survey for harbour porpoises of the Dogger Bank and southern North Sea, November 2011 1 Final report for a survey for harbour porpoises (Phocoena phocoena) of the Dogger Bank and southern North Sea conducted from R/V Song of the Whale 7 th – 24 th November 2011 Report prepared by: Marine Conservation Research International 1 High Street Kelvedon Essex CO5 9AG, UK Email: [email protected] April 2012 With core funding from the International Fund for Animal Welfare, and financial support from ASCOBANS, Wageningen IMARES and WWF-UK
Transcript of Final report for a survey for harbour porpoises (Phocoena ... · Final report for a survey for...

Acoustic and visual survey for harbour porpoises of the Dogger Bank and southern North Sea, November 2011
1
Final report for a survey for harbour porpoises
(Phocoena phocoena) of the Dogger Bank and southern North Sea
conducted from R/V Song of the Whale
7th
– 24th
November 2011
Report prepared by:
Marine Conservation Research International
1 High Street
Kelvedon
Essex CO5 9AG, UK
Email: [email protected]
April 2012
With core funding from the International Fund for Animal Welfare, and financial support from
ASCOBANS, Wageningen IMARES and WWF-UK

Acoustic and visual survey for harbour porpoises of the Dogger Bank and southern North Sea, November 2011
2
CONTENTS
EXECUTIVE SUMMARY ........................................................................................................................ 2
1. INTRODUCTION ............................................................................................................................... 3
1.1 Harbour porpoises in the North Sea ......................................................................................... 3
1.2 The Dogger Bank ....................................................................................................................... 4
1.3 Acoustic surveying for Harbour porpoises ............................................................................... 4
1.4 Aims ........................................................................................................................................... 5
2. METHODOLOGY ............................................................................................................................... 6
2.1 Data collection ........................................................................................................................... 6
2.1 Data analysis .............................................................................................................................. 8
3. RESULTS ........................................................................................................................................... 9
3.1 Sightings .................................................................................................................................. 10
3.2 Acoustic detections ................................................................................................................. 11
4. DISCUSSION ................................................................................................................................... 14
4.1 Harbour porpoises ................................................................................................................... 14
4.2. Other species .......................................................................................................................... 16
5. ACKNOWLEDGEMENTS ................................................................................................................. 17
6. REFERENCES .................................................................................................................................. 17
EXECUTIVE SUMMARY Novel data on the abundance and distribution of harbour porpoises in the North Sea, particularly in
winter, are required to determine their current conservation status. A priority area for survey effort
is the Dogger Bank, currently a candidate Special Area of Conservation (cSAC) under the EC Habitats
Directive (Natura 2000) and part of the OSPAR network of Marine Protected Areas in the North East
Atlantic Ocean. Data from the Joint Cetacean Protocol Database have indicated that the UK cSAC
area is no more important for harbour porpoises than other parts of the North Sea and porpoises
have therefore been removed as a qualifying feature of the site by the JNCC. However, the JCP relies
on visual techniques that may be inferior to acoustic techniques for detecting porpoise presence.
During November 2011, IFAW and Marine Conservation Research International conducted a visual-
acoustic survey in the central North Sea to investigate the presence and distribution of harbour
porpoises with the aim of providing baseline data on distribution and relative abundance in a period
that has traditionally received little survey effort. Over 4187 km of survey effort, 13 porpoise groups
were observed with between one and six individuals (mean group size = 1.6). The acoustic detection
rate was approximately 50 times higher, with 769 unique events being identified of which 561 were
made on the survey trackline (19.0 detections per 100 km). There were significantly more detections
in the west of the survey region than the east, with peak detections (43.7 per 100 km) in the waters
to the southwest of the cSAC. These findings support growing evidence of a southward shift of
harbour porpoises in the North Sea. A similar survey recently conducted by IFAW/MCR International
suggests any elevation in porpoise number in the south of the North Sea is unlikely to be due to
migration through the English Channel. If any recovery of porpoise numbers in the North Sea is to be
secured, efforts must be made to limit potentially disturbing activities, such as those associated with
the proposed development of the Hornsea Offshore (Round 3 Zone 4) Wind Farm. Sightings of other
marine mammals are also presented.

Acoustic and visual survey for harbour porpoises of the Dogger Bank and southern North Sea, November 2011
3
1. INTRODUCTION This report summarises research conducted from R/V Song of the Whale in November 2011 over the
Dogger Bank and surrounding waters of the southern North Sea, including waters under the national
jurisdictions of the UK, the Netherlands, Germany and Denmark. The aim of the proposed survey
conducted by IFAW, MCRI and partners was to investigate the winter presence, distribution and
relative abundance of harbour porpoises (Phocoena phocoena) on and around the Dogger Bank.
Novel data on the abundance and distribution of harbour porpoises in the North Sea, particularly in
winter, are required to determine their current conservation status. In order to assess the impact of
bycatch and other human activities on the population status, on-going collection of such data is
essential. Although stranding data and shore-based sightings provide invaluable insights into coastal
distribution and behaviour, they do not provide a comprehensive overview of offshore distribution.
1.1 Harbour porpoises in the North Sea
There is considerable concern for the conservation status of harbour porpoises in the North Sea and
adjacent waters. This concern has arisen from substantial incidental mortality in fishing operations
(Carlström & Berggren, 1997; Lowry & Teilmann, 1994; Tregenza et al., 1997; Vinther & Larsen,
2004), from variation in stranding records (Haelters & Camphuysen, 2008; Smeenk, 1987) and from
encounter rates in coastal waters. Porpoises in European waters are protected by both national
legislation and international agreements including the EU Habitats Directive, the Agreement on the
Conservation of Small Cetaceans of the Baltic and North Seas (ASCOBANS) and their status has been
subject to much discussion and concern within the Scientific Committee of the International Whaling
Commission (IWC). In some areas the total bycatch of harbour porpoises has been well above a level
deemed acceptable (e.g. ASCOBANS, 1997). Indeed, a marked increase in the number of stranded
porpoises showing lesions indicative of bycatch along the Dutch and Belgian coast has been noted in
recent years with up to 60% of carcasses showing signs of fisheries entanglement (Haelters &
Camphuysen, 2008; Haelters et al., 2011; Leopold & Camphuysen, 2006; Smeenk et al., 2004).
Additional pressures on porpoise populations may be presented by offshore renewable energy
projects, particularly in relation to construction noise (Carstensen et al., 2006; Nedwell & Howell,
2004; Tougaard et al., 2003).
From 1900 to the early 1950’s, harbour porpoises were considered abundant in coastal waters
throughout the southern North Sea (Haelters & Camphuysen, 2008). However, it appears that
porpoise numbers started to decline in these waters and by the 1970’s sightings of harbour
porpoises were so rare that the animal could be considered locally extinct in Dutch and Belgian
waters (Camphuysen, 1982). Conversely, at this time harbour porpoises were considered common
throughout the rest of the North Sea (Reid et al., 2003). Following a virtual absence of strandings
from the southern North Sea during the 1970s and 1980s, a steady increase between the 1990s and
2006 was observed (Haelters & Camphuysen, 2008; Haelters et al., 2011). This increase in stranding
records is corroborated by large-scale surveys conducted in the eastern North Atlantic, which
provided population estimates for harbour porpoises throughout the ASCOBANS region in July 1994
(SCANS survey, see Hammond et al., 2002) and July 2005 (SCANS-II, 2008). Although the overall
numbers were comparable between the SCANS surveys, porpoise abundance in the northern North
Sea and Danish waters had declined from 239,000 to 120,000, whereas in the central and southern
North Sea, Channel and Celtic Shelf, numbers had increased from 102,000 to 215,000 between the

Acoustic and visual survey for harbour porpoises of the Dogger Bank and southern North Sea, November 2011
4
survey in 1994 and the subsequent survey in 2005. This is thought to represent a southwards shift in
range rather than actual changes in population size (Winship, 2009) and is consistent with recent
stranding data and observations from seabird surveys, indicating a comeback in the species along
the Dutch and Belgian coasts (Camphuysen, 2004; Haelters et al., 2011; Thomsen et al., 2006).
1.2 The Dogger Bank
A priority area for survey effort in the North Sea is the Dogger Bank, currently a candidate Special
Area of Conservation (cSAC) under the EC Habitats Directive (Natura 2000) and part of the OSPAR
network of Marine Protected Areas in the North East Atlantic Ocean. The Dogger Bank is situated in
the middle of the southern North Sea, approximately 150 miles east of the city of Sunderland, UK
and is the largest single continuous expanse of shallow sandbank in UK waters (JNCC, 2011) (Figure
1). The bank is situated in waters in the EEZ of the UK, the Netherlands, Germany and Denmark.
The bank ranges in water depths between 20 - 40 metres in the UK sector to over 50 metres in the
Dutch and German waters. Although the substantial wave action experienced by the bank prevents
any colonisation by vegetation, the bank is of great importance to benthic and fish communities.
Sand eels are plentiful over the Dogger Bank and the primary prey source for a variety of species
including, fish, seabirds and cetaceans including harbour porpoise (Cefas, 2007). Harbour porpoises
are distributed within the waters over and around the Dogger Bank and within the candidate SAC
area. Results from the two SCANS surveys in 1994 and 2005 (Hammond et al., 2002 and SCANS-II,
2008) and data from Reid et al. (2003) indicate porpoise presence throughout the year over the
Dogger Bank (Todd et al., 2009), however data from the Joint Cetacean Protocol Database indicate
that the designated UK cSAC area is no more important for harbour porpoises than other parts of
the North Sea (JNCC, 2011). Harbour porpoises therefore have recently been removed as a
qualifying feature of the site by the JNCC (JNCC, 2011) although they are still considered a feature of
interest under the EU Habitats Directive and member states are legally obliged to afford this species
protection.
In addition to harbour porpoises, white-beaked dolphins (Lagenorhynchus albirostris), minke whales
(Balaenoptera acutorostrata) (ECS, 2008), grey (Halichoerus grypus) and common (Phoca vitulina)
seals are all commonly sighted on the Dogger bank and southern North Sea area (Hammond et al.,
2002; SCANS II, 2008).
1.3 Acoustic surveying for Harbour porpoises
Due to the small size, cryptic surfacing behaviour and often solitary nature of harbour porpoises,
visual detection rates for the species are closely linked to environmental conditions. Palka (2006)
suggests that detection probability of harbour porpoises decreases by 50% between Beaufort 0 and
Beaufort 3 and continues to decrease substantially as sea state degrades. As harbour porpoises are
believed to echolocate almost continuously while underwater (Verfuβ et al., 2005), passive acoustic
monitoring can be an effective survey tool, complimenting traditional visual surveying techniques
(for example, Boisseau et al., 2007; Booth, 2010; CODA, 2009; Embling, 2007; Gillespie et al.,2005;
Gordon et al., 2003; Hastie et al., 2005; Leaper et al., 2000; Hammond, 2002). Acoustic surveys allow
for detection of harbour porpoises at night, during most weather states and poor sighting
conditions. Acoustic surveys have shown particular worth for harbour porpoise research with

Acoustic and visual survey for harbour porpoises of the Dogger Bank and southern North Sea, November 2011
5
acoustic detection rates being as much as eight times higher than visual detection rates (Gillespie et
al., 2005).
Harbour porpoises produce high-frequency, narrow band clicks with peak frequencies between 115
and 145 kHz (Goodson and Sturtivant, 1996), and maximum source levels (SL) reported between
178-205 dB re 1 μPa @ 1m pp with a mean SL of 191 dB re 1 μPa pp @ 1m (Villadsgaard et al., 2007).
Click rates increase (Kastelein et al., 2008, Verfuβ et al., 2005; Verfuβ et al., 2008) and source levels
decrease (Atem et al., 2009) as animals approach a target. Due to the ultrasonic nature of harbour
porpoise clicks, passive acoustic monitoring has its limitations. Harbour porpoise clicks attenuate
quickly in water (Urick, 1983) and can rarely be detected more than 300 metres from the
hydrophone (Goodson and Sturtivant, 1996). Additionally, the clicks are highly directional, therefore
animals are much more likely to be detected when orientated towards the hydrophone (Goodson
and Sturtivant, 1996).
1.4 Aims
IFAW and Marine Conservation Research International (MCR International) conducted this survey to
investigate the presence and distribution of harbour porpoises during November 2011, with the aim
of providing baseline data on distribution and relative abundance in a period that has traditionally
received little survey effort. Results from this project will contribute to baseline data on the winter
distribution of porpoises over the Dogger Bank, provide novel data to update the SCANS-II survey in
2005, and will supplement on-going research and conservation work in the region (for example, data
will be contributed to the JNCC Joint Cetacean Protocol project to investigate the status of cetaceans
within the ASCOBANS area).
Thus, the primary aims of survey work in the Dogger Bank and southern North Sea were to:
1. Detect harbour porpoises both visually and acoustically.
2. Investigate the winter presence and distribution of porpoises.
3. Derive estimates of relative abundance for harbour porpoises.
To maximise efficiency through the project, secondary aims included:
1. Taking high definition video of porpoise encounters from the A-frame enabling accurate range
measurements to be made to correct distance estimates.
2. Recording sighting information and acoustic recordings for all species of marine mammal in the
study areas.
3. Recording the presence and distribution of other odontocetes using acoustic detection systems.
4. Collect information on distribution of seabirds, turtles, sharks and sunfish.
5. Continuous logging of Automatic Identification System (AIS) information reporting on the
presence distribution and identity of ships.

Acoustic and visual survey for harbour porpoises of the Dogger Bank and southern North Sea, November 2011
6
2. METHODOLOGY
2.1 Data collection
The survey was conducted between 7th and 24th November 2011 from R/V Song of the Whale, a 21
metre auxiliary-powered cutter-rigged sailing research vessel, owned by the International Fund for
Animal Welfare and operated by Marine Conservation Research (MCR) Ltd.
The Dogger Bank and surrounding water were treated as three survey blocks, the largest covering
the bank itself and surrounding waters (including UK, Dutch, German and Danish portions of the
bank; split into two blocks to allow transects to be designed with favourable wind directions); and
two smaller blocks to the west and south, covering the UK section of the Bank and the waters to the
south, towards the north Norfolk coast. Using the programme Distance 6.0 (Thomas et al., 2010),
randomly generated tracklines were planned to provide equal coverage. Within each small block this
amounted to around 600 km of trackline and approximately 1200 km in the larger block (in the east
and west blocks combined) (see Figure 1). The tracklines were designed with the predominant wind
direction as a factor for each block to allow for optimal sailing conditions. While on survey effort a
single stereo hydrophone array was towed approximately 200 metres behind the research vessel.
Acoustic surveys took place for 24 hours/day in sea conditions up to Beaufort 6.
Figure 1. Bathymetry of the Dogger Bank (data from GEBCO, 2008).

Acoustic and visual survey for harbour porpoises of the Dogger Bank and southern North Sea, November 2011
7
Figure 2. The Dogger Bank and adjacent waters were divided into three blocks displayed as black
boxes; a southern North Sea block, a block covering the JNCC designated Special Area of
Conservation over the UK sector of the Dogger bank, and a large block (split into east and west to
allow transects with favourable wind direction to be carried out) covering the whole Dogger bank
area. The grey outline displays, from west to east, the UK, Dutch and German areas of the Dogger
Bank.
Observer effort followed distance sampling protocols. In daylight hours and in sea states below four,
two visual observers were positioned on an A frame platform 5.5 metres above sea level to record
any cetacean sightings; observers were not prompted by acoustic cues and/or deck observers. In
higher sea states, observers kept a lookout from deck. Sightings were logged to a database via the
Logger software (IFAW). Environmental and GPS data were logged automatically to the same
database, including date, vessel position (lat-long), sea surface temperature (°C) and wind speed
(knots). Manual updates of other environmental variables (such as sea state, wave and swell height)
and survey effort (numbers of observers at which positions) were made hourly to the database.
Visual observers scanned out to 90 degrees either side of the trackline, and from close to the boat
out to the horizon with the naked eye, using binoculars for species confirmation. Estimated distance
and relative angles (using an angle board) to sightings were recorded. Whenever possible, a third
observer took high definition video from the A-frame of porpoise encounters to calculate range
independently.
Seabirds were also logged through visual scans every 15 minutes to provide a snap shot of local
distribution.

Acoustic and visual survey for harbour porpoises of the Dogger Bank and southern North Sea, November 2011
8
Acoustic surveys were conducted using a 200 metre towed two-element broadband hydrophone
array (SEICHE Ltd.). Continuous stereo 500 kHz recordings were made via a SEICHE buffer box
passing signals to a National Instruments USB-6251 sound card. The buffers were configured to give
a variable frequency response and the response of the system was 2 to 200 kHz (within 10 dB).
However, in the bandwidth of interest for harbour porpoise clicks (approximately 115 to 180 kHz;
Villadsgaard et al., 2006), the response of the system was approximately flat. Recordings were made
using PAMGUARD (Passive Acoustic Monitoring Guardianship) and written to hard drive as two-
channel 16 bit wav files. As typical harbour porpoise clicks are distinctive high frequency,
narrowband signals with a long duration (100 μs), a peak frequency of around 130 kHz, an inter-click
interval of around 60 ms and a maximum source level of 172 dB re 1μPa pp @ 1 m (Møhl and
Andersen, 1973; Akamatsu et al., 1994; Teilmann et al., 2002), it is possible to detect and extract
potential harbour porpoise clicks from background noise using click detection algorithms. Thus,
acoustic signals were monitored in real-time using a PAMGUARD click detector whereby sounds with
significant energy (>8 dB above background noise) in the 100 to 150 kHz band were classified as
potential harbour porpoise clicks.
2.1 Data analysis
A more thorough investigation of potential porpoise clicks was conducted post-process on the
recorded audio files. During post-processing, clicks were classified as harbour porpoise clicks if they
met the following criteria: the click had a peak frequency between 100 to 160 kHz, the energy of the
click was at least 5dB above the background noise levels and less than 2ms in duration and if the
click had a waveform resembling that of published data for harbour porpoises, with a relatively flat
frequency structure revealed in a Wigner plot. Non-porpoise clicks were classified as echo-sounder
(with centre frequencies of: 38, 100 and 200 kHz) or unknown (with no identified source). When
clicks were automatically identified, they were displayed visually with their bearing, waveform,
frequency spectrum and Wigner plot in Pamguard Viewer program window (Figure 4). Each click was
then manually checked by an analyst to remove any false detections and separate the clicks into
acoustic events. A second analyst independently confirmed these events.
Acoustic events were assessed using the same classification criteria developed for the SCANS-II
analysis to allow comparison between results. The SCANS-II criteria are displayed in Table 1.
Table 1. SCANS-II criteria for harbour porpoise acoustic events (SCANS II, 2008).
Event Description
Porpoise Click One or two individual clicks
Porpoise Event A train of porpoise clicks with no clear or defined track.
Single Track A train of porpoise clicks with a clear and defined track from a single
animal
Multiple Track One or more trains of porpoise clicks with a clear defined track from
multiple animals
Single tracks were consolidated as multiple tracks if the click trains overlapped in time, or if they
occurred within 115 seconds of each other (this is the time it takes to cover 300 m when travelling at
the average survey speed of 6.3 knots). The time allowed accounts for the time it takes for the vessel
Acoustic and visual survey for harbour porpoises of the Dogger Bank and southern North Sea, November 2011
9
to move past a stationary porpoise or cruising porpoise travelling at an average speed of 1.25 knots
(Read and Westgate, 1997). Additionally, 300 metres is the likely maximum detection range for the
species (Goodson and Sturtivant, 1996). GPS positions were given for each detection by comparing
the exact timing of the start of the click train to the Logger GPS database.
3. RESULTS
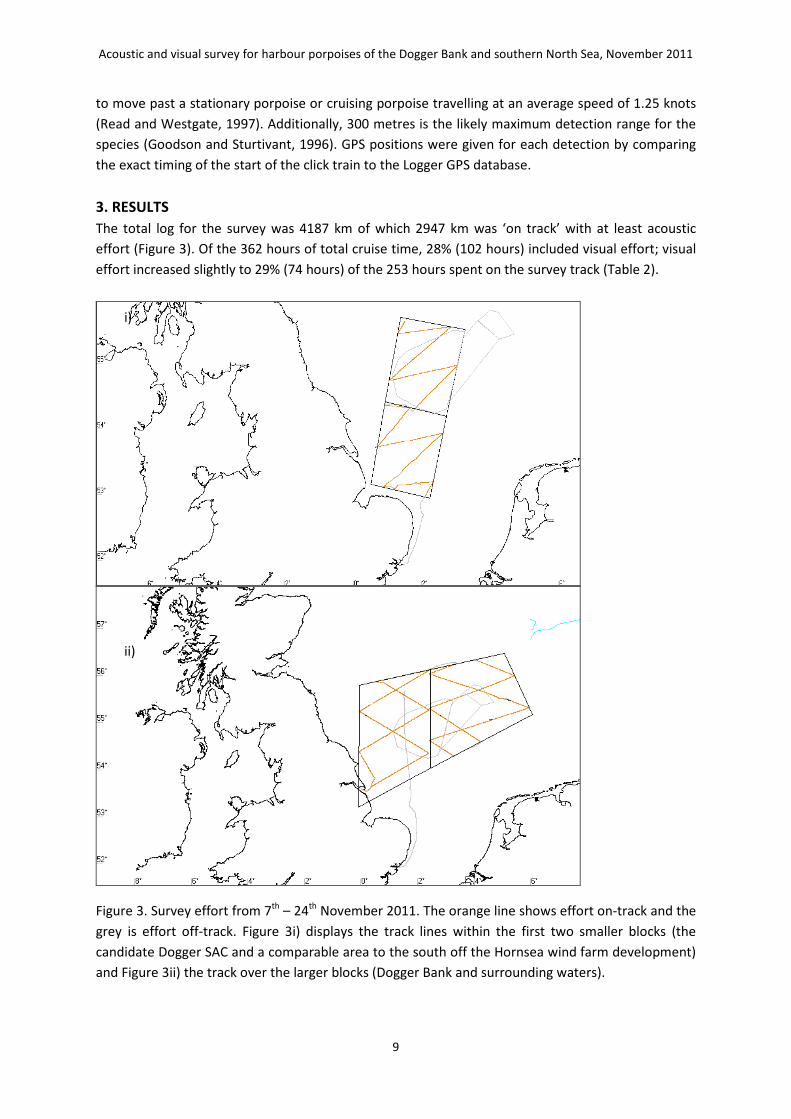
The total log for the survey was 4187 km of which 2947 km was ‘on track’ with at least acoustic
effort (Figure 3). Of the 362 hours of total cruise time, 28% (102 hours) included visual effort; visual
effort increased slightly to 29% (74 hours) of the 253 hours spent on the survey track (Table 2).
Figure 3. Survey effort from 7th – 24th November 2011. The orange line shows effort on-track and the
grey is effort off-track. Figure 3i) displays the track lines within the first two smaller blocks (the
candidate Dogger SAC and a comparable area to the south off the Hornsea wind farm development)
and Figure 3ii) the track over the larger blocks (Dogger Bank and surrounding waters).
i)
ii)

Acoustic and visual survey for harbour porpoises of the Dogger Bank and southern North Sea, November 2011
10
Table 2. Summary of research effort from 7th – 24th November 2011.
Effort status Nautical Miles Km Time (hhh:mm)
Passage 58.4 108.1 09:20
Passage + acoustic 412.7 764.3 65:34
Passage + acoustic + visual 182.3 337.5 28:08
Track + acoustic 1122.4 2078.6 178:49
Track + acoustic + visual 468.9 868.4 73:56
Other 16.4 30.3 06:31
Total track 2261.9 4187.3 365:18
3.1 Sightings
Three species of cetacean were identified visually in 27 separate encounters both on and off the
survey trackline (Figure 2); harbour porpoise (n = 13 sighting), white-beaked dolphins (n = 11), minke
whale (n = 2) and unidentified dolphin (n=1). Additionally there were 20 sightings of seals, 18 of
which were confirmed grey seal sightings, and two unknown seal encounters.
Figure 4. All 47 visual encounters with marine mammals during the survey; harbour porpoise=star
outline, white beaked dolphin=filled circle, minke whale=filled square, unknown dolphin=outlined
circle, grey seal=filled triangle and unknown seal=triangle outline. Grey lines show the transect lines
covered and black area show the Dogger Bank candidate protected areas.

Acoustic and visual survey for harbour porpoises of the Dogger Bank and southern North Sea, November 2011
11
The number of individuals in each encounter was variable, but typically the harbour porpoises were
in small groups of one to two individuals (although there was one sighting with five individuals)
whilst the dolphins were typically in groups of seven or more. The seals tended to be sighted
individually, although there were often several sightings over a short period of time.
3.2 Acoustic detections
In addition to continuous recording, the signal from the hydrophone array was monitored every 15
minutes (approximately 1.58 nautical miles at the average survey speed of 6.3 knots) for animal and
ship noise. There were several dolphin detections while listening to the hydrophone and many
harbour porpoise detections were noted also. Additionally, a few fishing vessels were recorded
acoustically and one submarine was noted (acoustically and visually). Anthropogenic noise levels
were particularly high near oil and gas installations.
During post process analysis, porpoise detections were examined in greater detail. ‘Certain’ and
‘likely’ harbour porpoise events were identified using the waveform, time frequency and energy
spectrum of the clicks. The peak frequency of the harbour porpoise clicks recorded during this
survey was relatively high varying between 130 and 140 kHz, with duration of approximately 0.15
ms. Throughout the survey there was a detection frequency of 19.0 ‘certain’ harbour porpoise
detections for every 100 km of trackline surveyed (Table 3). Detection rates, expressed as unique
acoustic detections per 100 km, were highest in the block to the south of the UK cSAC (43.7
detections per 100 km). Indeed the detection rate here was significantly higher than the similarly
sized cSAC block (χ2 = 16.4, d.f. = 7, p = 0.02), being approximately twice as high (17.9 detections per
100 km). The 561 certain detections made on the survey trackline were used to interpolate the
density of porpoise detections for the entire study site (Figure 5). A clear clustering of porpoise
detections was evident to the west of the study site closest to the UK coast; however, porpoises
were detected acoustically throughout the study area, including what appeared to be relatively high
levels in the waters surveyed furthest to the east. Nevertheless, significantly more detections of
porpoises were made in the western block than the eastern block (χ2 = 29.7, d.f. = 7, p < 0.01). When
examining the residuals, it was evident that the category of detection that deviated most from
expected was that of multiple tracks; considerably more multiple tracks of clicks than expected were
recorded in the western block than the eastern block. This suggests group sizes in the western block
may have been larger than the east.

Aco
ust
ic a
nd
vis
ua
l su
rve
y fo
r h
arb
ou
r p
orp
ois
es
of
the
Do
gg
er
Ba
nk
an
d s
ou
the
rn N
ort
h S
ea
, N
ove
mb
er
20
11
12
Ta
ble
3:
Aco
ust
ic d
ete
ctio
ns
of
po
rpo
ise
s p
er
10
0 k
m b
y su
rve
y b
lock
, m
ad
e b
oth
on
an
d o
ff t
he
su
rve
y tr
ack
line
(n
um
be
r o
f d
ete
ctio
ns
in p
are
nth
ese
s).
Sou
th o
f U
K c
SAC
U
K c
SAC
W
est
ern
Do
gg
er
Ea
ste
rn D
og
ge
r N
on
-blo
ck s
pe
cifi
c C
om
bin
ed
To
tal
E
ven
t O
n
Off
O
n
Off
O
n
Off
O
n
Off
O
ff
On
O
ff
CERTAIN
Po
rpo
ise
Cli
ck
5.7
(2
9)
2.7
(7
) 0
.8 (
4)
1.5
(3
) 1
.3 (
11
) 0
.0 (
0)
1.2
(1
2)
0.0
(0
) 2
.7 (
20
) 1
.9 (
56
) 2
.4 (
30
)
Po
rpo
ise
Eve
nt
9.4
(4
8)
4.7
(1
2)
4.2
(2
1)
2.5
(5
) 4
.2 (
37
) 4
.0 (
1)
2.8
(2
9)
6.5
(2
) 4
.0 (
30
) 4
.6 (
13
5)
4.0
(5
0)
Sin
gle
Tra
ck
9.8
(5
0)
14
.5 (
37
) 5
.6 (
28
) 4
.6 (
9)
9.7
(8
5)
4.0
(1
) 6
.1 (
63
) 6
.5 (
2)
7.3
(5
4)
7.7
(2
26
) 8
.3 (
10
3)
Mu
ltip
le T
rack
1
0.0
(5
1)
4.3
(1
1)
2.0
(1
0)
1.0
(2
) 8
.3 (
73
) 0
.0 (
0)
1.0
(1
0)
0.0
(0
) 1
.6 (
12
) 4
.9 (
14
4)
2.0
(2
5)
To
tal
34
.9 (
17
8)
26
.2 (
67
) 1
2.6
(6
3)
9.6
(1
9)
23
.4 (
20
6)
7.9
(2
) 1
1.1
(1
14
) 1
2.9
(4
) 1
5.3
(1
16
) 1
9.0
(5
61
) 1
6.8
(2
08
)
LIKELY
Po
rpo
ise
Cli
ck
3.3
(1
7)
0.0
(0
) 2
.4 (
12
) 1
.0 (
2)
2.0
(1
8)
0.0
(0
) 1
.4 (
14
) 0
.0 (
0)
1.3
(1
0)
2.1
(6
1)
1.3
(1
6)
Po
rpo
ise
Eve
nt
2.7
(1
4)
2.4
(6
) 2
.0 (
10
) 0
.5 (
1)
1.9
(1
7)
0.0
(0
) 1
.0 (
10
) 0
.0 (
0)
1.3
(1
0)
1.7
(5
1)
1.4
(1
7)
Sin
gle
Tra
ck
2.0
(1
0)
1.6
(4
) 0
.4 (
2)
0.5
(1
) 1
.0 (
9)
0.0
(0
) 0
.9 (
9)
0.0
(0
) 0
.7 (
5)
1.0
(3
0)
0.5
(6
)
Mu
ltip
le T
rack
0
.8 (
4)
1.6
(4
) 0
.2 (
1)
0.5
(1
) 0
.3 (
3)
0.0
(0
) 0
.2 (
2)
0.0
(0
) 0
.1 (
1)
0.3
(1
0)
0.5
(6
)
To
tal
8.8
(4
5)
5.5
(1
4)
5.0
(2
5)
2.5
(5
) 5
.3 (
47
) 0
.0 (
0)
3.4
(3
5)
0.0
(0
) 3
.5 (
26
) 5
.2 (
15
2)
3.6
(4
5)
O
vera
ll t
ota
l 4
3.7
(2
23
) 3
1.7
(8
1)
17
.6 (
88
) 1
2.2
(2
4)
28
.7 (
25
3)
7.9
(2
) 1
4.5
(1
49
) 1
2.2
(4
) 1
9.1
(1
42
) 2
4.2
(7
13
) 2
0.4
(2
53
)

Acoustic and visual survey for harbour porpoises of the Dogger Bank and southern North Sea, November 2011
13
Figure 5. All 769 ‘certain’ detections of porpoises. Smaller orange symbols represent the 208
detections made off the track; larger red spheres represent the 561 detections made on the track.

Acoustic and visual survey for harbour porpoises of the Dogger Bank and southern North Sea, November 2011
14
Figure 6. An interpolation of the density of all ‘certain’ porpoises detected in the survey blocks. The
interpolation involved dividing the entire survey in to 10 second segments and calculating the
percentage of these segments that contained the start of a unique porpoise detection (created using
Quantum GIS, Inverse Distance Coefficient = 1, grid resolution = 7.5 minutes by 7.5 minutes).
4. DISCUSSION
The survey documented 47 sightings of marine mammals including sightings of harbour porpoise,
white-beaked dolphin, minke whale and grey seals. Although the majority of sightings were on the
western side of the study area, there were sightings of both harbour porpoises and grey seals over
Dogger Bank itself.
4.1 Harbour porpoises
Harbour porpoises were expected to be the most regularly observed cetacean as they are the most
numerous cetacean in the North Sea (Geelhoed et al., 2011). During this survey there were 13
sightings of harbour porpoises, totalling 21 animals sighted in groups of one to five individuals. There
were no obvious groupings of harbour porpoise sightings across the survey area, however the
majority of sightings were on the west side of the North Sea. Additionally, four of the harbour
porpoise sightings were over the Dogger Bank proper, two over the UK portion and two over the
Dutch portion of the bank.
The distribution of harbour porpoises is difficult to establish from sightings data as they are a cryptic,
wide ranging species, with strong seasonal variation in density throughout the North Sea. Dutch
coastal waters have the highest density of harbour porpoise in March with fewer animals observed
in summer and autumn months (Camphuysen, 2011; Geelhoed et al., 2011). The sightings of harbour
porpoises in this survey were too few to draw any conclusions about abundance or distribution over
the survey area. The limited number of sightings of harbour porpoises was expected in this winter
survey as harbour porpoise sightings are very dependent on sea state. Palka (2006) suggests that
detection probability of harbour porpoises decreases by 50% between Beaufort 0 and Beaufort 3
and continues to decrease substantially as sea state degrades. The vessel used for these findings
had observers at 9 and 14 metres above sea level; observers aboard R/V Song of the Whale have an
eye height of 5.5 metres above sea level, therefore causing sea state to have an even greater impact
on sighting rates. The average sea state during the Dogger Bank survey was three and ranged up to
sea state five, hampering the possibility of sightings.
Post survey analysis of recordings revealed many more detections than sightings as acoustic
techniques are less impacted by adverse weather conditions. As harbour porpoises vocalise almost
constantly (Villadsgaard et al., 2006) to detect prey, navigate and communicate, it is assumed that
most animals passing within 250 metres of the vessel would have been detected regardless of the
environmental conditions. There were 561 ‘certain’ detections of harbour porpoises on the survey
track line, approximately 50 times more detections than sightings, indicating that the species is far
more prevalent in these waters than indicated by sightings data alone. Of these detections, almost
exactly twice as many (28.7 per 100 km) were made in the western block than the eastern block
(14.5 per 100 km), with both blocks incorporating similar levels of effort (881 km on the trackline in
the eastern block compared with 1029 km in the western block). This is also evident from the
interpolated density of detections in Figure 6. There also seemed to be some evidence that group
Acoustic and visual survey for harbour porpoises of the Dogger Bank and southern North Sea, November 2011
15
sizes may have been larger in the western block than the eastern block, with considerably more
multiple tracks of clicks than expected by chance alone. Acoustic detection rates were moderately
high (17.6 per 100 km) within the UK c SAC section of the Dogger Bank – this was higher than in the
eastern block (14.5 per 100 km). Although effort was not evenly distributed over the entire Dogger
Bank, it seems that detection rates were higher over the UK region of the Bank than either the Dutch
or German regions. However, a similar degree of survey effort was completed in the similarly-sized
Hornsea block to the south of the Bank (510 km of trackline effort versus 500 km for the UK cSAC
block), and here the detection rates were extremely high (43.7 detections per 100 km), more than
twice that measured over the UK cSAC block. Although the acoustic data suggest porpoises were
widespread throughout the central North Sea in November 2011, it would appear that some areas
such as the block to the south of the Bank itself had particularly high densities of porpoises.
In comparison with other regions, the acoustic detection rate for porpoises was high throughout the
study area. Similar studies using the same detection equipment have and ranged up 6 detections per
100 km off West Africa (Boisseau et al., 2007) to 17 detections in some parts of the Baltic sea
(Gillespie et al., 2005). The high detection rates in this study support the apparent shift of harbour
porpoise distribution within the North Sea, with the main concentration shifting from the northwest
in 1994 to the southwest in 2005 (SCANS-II, 2008). It is of particular interest that the November
distribution documented in this study is similar to that of the July distribution of the 2005 SCANS
survey, suggesting the apparent shift in distribution may persist throughout the year. This shift also
appears to be corroborated by increases in sightings of porpoises from Belgian, Dutch and German
coasts over the last decade and the number of porpoise stranded in the southern North Sea
(Camphuysen, 2004; Gilles et al., 2011; Haelters et al., 2011; Thomsen et al., 2006). A possible
explanation for increased porpoise density in the southern North Sea may be immigration from the
west of Britain and Ireland. However, there is scant evidence for the significant migration of
individuals through the English Channel required to account for the increase in density in the
southern North Sea. For example, a recent acoustic-visual survey throughout the Channel using the
same vessel and techniques in this report found low densities of porpoises (0.4 per 100 km), with
most detections being made in the deeper waters of the Western Approaches (MCR, 2011). It seems
more likely that elevated numbers in the southern North Sea may relate to in influx of individuals
from northern waters. The cause of this shift in distribution is unclear; it may in part relate to a
decline in prey availability in the north, particularly whiting and sandeel (ICES, 2008). It may also
relate to reduced bycatch in the southern North Sea, with the number of days spent at sea by UK
boats using gill/tangle nets falling from 17,000 in 1995 to under 7,000 by 2007
(http://archive.defra.gov.uk/environment/biodiversity/documents/indicator/200812m6.pdf).
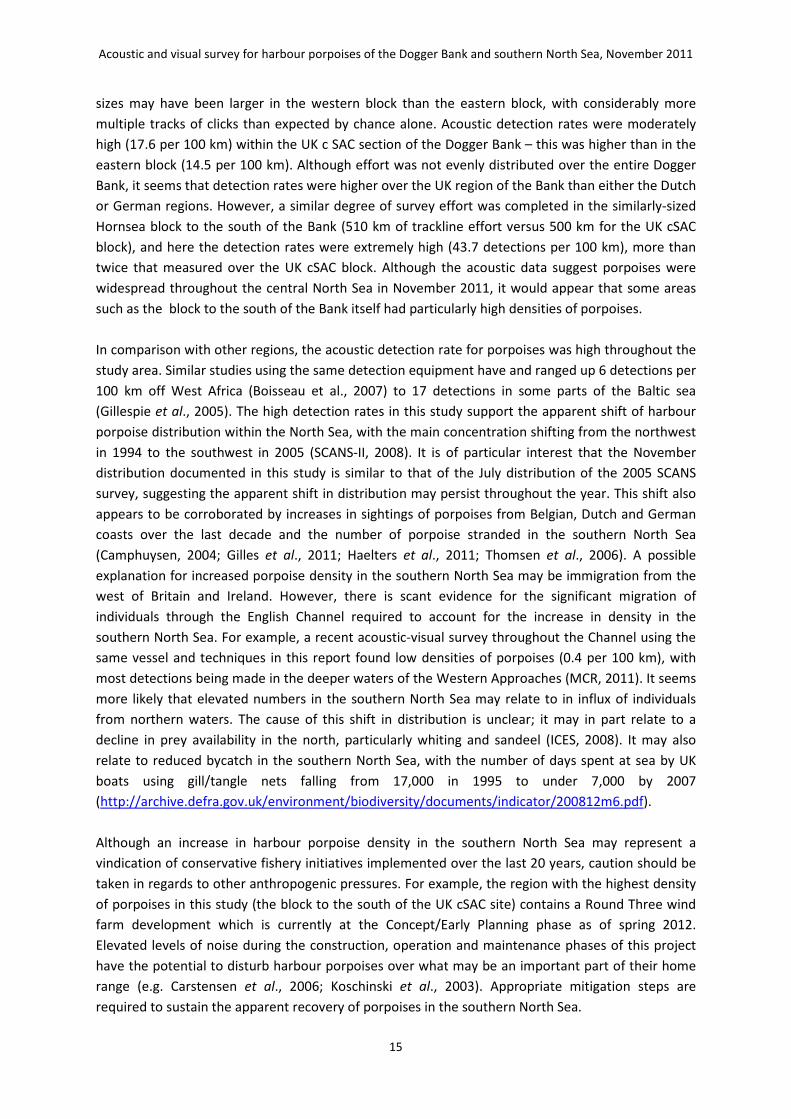
Although an increase in harbour porpoise density in the southern North Sea may represent a
vindication of conservative fishery initiatives implemented over the last 20 years, caution should be
taken in regards to other anthropogenic pressures. For example, the region with the highest density
of porpoises in this study (the block to the south of the UK cSAC site) contains a Round Three wind
farm development which is currently at the Concept/Early Planning phase as of spring 2012.
Elevated levels of noise during the construction, operation and maintenance phases of this project
have the potential to disturb harbour porpoises over what may be an important part of their home
range (e.g. Carstensen et al., 2006; Koschinski et al., 2003). Appropriate mitigation steps are
required to sustain the apparent recovery of porpoises in the southern North Sea.

Acoustic and visual survey for harbour porpoises of the Dogger Bank and southern North Sea, November 2011
16
4.2. Other species
Two minke whales were seen very close together in the west of the North Sea, just off Grimsby.
From previous research minke whales appear more prevalent in the west of the North Sea
(Hammond et al., 1995) and generally rare in the southern half of the North Sea south of
Humberside in the summer months (Reid et al., 2003). The second SCANS survey in 2005 recorded
a shift the summer distribution of minke whales in the North Sea to more northern and central
latitudes (SCANS-II, 2008). In general, minke whales are thought to occur mainly in depths of 200
metres or less on the northwest European continental shelf year around, although the majority of
sightings recorded between May and September with very few records at other times of year (Reid
et al., 2003). Those sightings that have been recorded in northwest Europe in autumn and winter
months between October and April are mostly south of 50°N (Reid et al., 2003). The sightings from
this survey in November are particularly interesting in terms of both the season and relatively high
latitude (53°N), compared to other sightings recorded at this time of year.
There were 11 sightings of white-beaked dolphins during this survey, all closely grouped between
54.5° and 55.5° N and in the west of the North Sea. White beaked dolphins are believed to have a
more limited range than most of the species present in the UK waters, being found only in cool
temperate and subarctic waters of the north Atlantic (Reid et al., 2003). In contrast to the harbour
porpoise, in the 1990’s there was a general shift northwards in the geographical locations of
reported strandings (Jepson, 2006) which has been linked to changing sea surface temperature, local
primary productivity and prey abundance (MacLeod et al., 2007; Weir et al., 2007). White-beaked
dolphins are thought to be most common in continental shelf waters with depths between 50 and
100 metres and rarely out to 200 metres (Northridge et al., 1995; Reid et al., 2003; Weir et al. 2001).
These dolphins are abundant in the central (Pollock et al., 1997; 2000; Coles et al., 2001) and
northern (Northridge et al., 1995; Weir et al., 2001; Reid et al., 2003) North Sea being much less
common in the southern North Sea, the English Channel and Irish Sea. However, the white-beaked
dolphins encountered during this survey were observed in the southern North Sea, as far south as
54.5°N. This westerly distribution is supported by previous research (Pollock et al., 1997; 2000;
Coles et al., 2001). Although these dolphins have been noted to be present on the UK continental
shelf year around, they have been reported most frequently between June and October (Evans 1992;
Northridge et al., 1995).
There were 18 confirmed grey seal sightings. These were mostly found in the west of the UK sector
of the study area, although were also found in smaller numbers in the east and over the Dogger
Bank itself. Approximately 45% of the world’s grey seal population breed in the UK, mostly in
Scottish colonies (Thompson and Duck, 2010). Within the North Sea there is evidence of wide-
spread movement between areas both within and outside the breeding season (Thompson and
Duck, 2010), therefore many of the grey seals pupping in Scotland may visit other areas of the North
Sea. In eastern England pupping occurs mainly between early November to mid-December
(Thompson and Duck, 2010).
Additional surveys of the entire southern North Sea would be extremely beneficial to the
understanding of cetacean distribution across the area as a whole, especially across different

Acoustic and visual survey for harbour porpoises of the Dogger Bank and southern North Sea, November 2011
17
seasons and to gain more understanding of the southerly shift in the distribution of harbour
porpoises which has been noted in recent decades. It is planned that the data presented in this
report will be analysed further to derive probability detection functions and local abundance
estimates for harbour porpoises.
5. ACKNOWLEDGEMENTS
This survey was conducted with core funding from the International Fund for Animal Welfare
(IFAW), and additional financial support and collaboration from ASCOBANS, IMARES-Wageningen UR
and WWF-UK. The MCR International team would like to thank the German, Dutch and Danish
Governments for providing the diplomatic clearance for research to be conducted in their waters of
the North Sea. Thanks to Steve Hunt from the British Foreign and Commonwealth Office for assisting
with the permitting process.
MCR International also thank Dr. Peter Evans (Sea Watch Foundation) and Dr. Meike Scheidat
(IMARES) for their assistance in identifying participants. Thanks also to Heidrun Frisch (ASCOBANS)
for help with coordination. Meike, Anita Gilles and Russell Leaper provided valuable support and
advice during preparation, planning and fundraising for the survey. The survey team consisted of
Richard McLanaghan (MCR), Jim Compton (MCR), Brian Morrison (MCR), Oliver Boisseau (MCR
International), Jack Bloomfield (MCR), Anna Cucknell (MCR International), Susannah Calderan (MCR
International), Danielle Gibas (Sea Watch Foundation), Katrin Lohrengel (Sea Watch Foundation),
Lisette Mekkes (IMARES) and Tessa van Heumen (IMARES).
6. REFERENCES Akamatsu, T., Hatakeyama, Y., Kojima, T. and Soeda, H., 1994. Echolocation rates of two harbor porpoises (Phocoena
phocoena). Marine Mammal Science 10: 401-411.
ASCOBANS. 1997. Second Meeting of Parties to ASCOBANS: 17-19 November 1997, Bonn, Germany. ASCOBANS. 67pp.
Boisseau, O., Matthews, J. N., Gillespie, D., Lacey, C., Moscrop, A. and El Ouamari, N. 2007. A visual and acoustic survey for
harbour porpoises off North-West Africa: further evidence of a discrete population. African J Mar Sci, 29, 403.
Camphuysen, C. J. 2004. The return of the harbour porpoise (Phocoena phocoena) in Dutch coastal waters. Lutra 47(2):
113-122.
Camphuysen, C.J. 1982. Zeezoogdieren langs de Nederlandse kust. Mededelingen Club van Zeetrekwaarnemers 5 (2): 6-8.
Camphuysen, C. J. 2011. Recent trends and spatial patterns in nearshore sightings of Harbour Porpoises (Phocoena
phocoena) in the Netherlands (Southern Bight, North Sea), 1990-2010. Lutra 54(1): 37-44.
Carlström, J. and Berggren, P. 1997. Bycatch rates of harbour porpoises (Phocoena phocoena) in Swedish bottom set gillnet
fisheries obtained from independent observers. European Research on Cetaceans, Proc. 10th Ann. Conf. European
Cetacean Society, Lisbon, 11-13 March 1996.
Carstensen, J., Henriksen, O. D. and Teilmann, J. 2006. Impacts of offshore wind farm construction on harbour porpoises:
acoustic monitoring of echolocation activity using porpoise detectors (T-PODs). Mar Ecol Prog Series 321: 295–308.
CEFAS, 2007. Mulitpleces fisheries management: A comprehensive impact assessment of the sandeel fishery along the
English east coast. Defra project M0323 (http://randd.defra.gov.uk/Document.aspx?Document=MF0323_6512_FRP.doc).
Coles, P., Diamond, J., Harrop, H., Macleod, K. and Mitchell, J., 2001. A report on the whales, dolphins and porpoises of the
Bay of Biscay and English Channel 2000. Orca, 2: 9-61.

Acoustic and visual survey for harbour porpoises of the Dogger Bank and southern North Sea, November 2011
18
ECS, 2008. Selected criteria for Marine Protected Areas for Cetaceans. In the proceedings of the
ECS/ASCOBANS/ASCOBAMS workshop held at the European Cetacean Society’s 21st
Annual Conference, 2007. Editor:
Peter G.H. Evans. ECS Special Publication Series 48.
Evans, P.G.H., 1992. Status Review of Cetaceans in British and Irish Waters. Report to UK DOE, Oxford.
GEBCO, 2008. The GEBCO_08 Grid, version 20091120. http://www.gebco.net.
Geelhoed, S., Scheidt, M., Aarts, G., van Bemmelen, R., Janinhoff, N., Verdaat, H. amd Witte, R., 2011. Shortlist Master plan
Wind Aerial surveys of harbour porpoises on the Dutch Continental Shelf. IMARES Wageningen UR Report # C103/11.
Gilles, A., Adler, S., Kaschner, K., Scheidat, M. and Siebert, U. 2011. Modelling harbour porpoise seasonal density as a
function of the German Bight environment: implications for management. Endangered Species Research 14, 157-169.
Gillespie, D., Berggren, P., Brown, S., Kuklik, I., Lacey, C., Lewis, T., Matthews, J. N., McLanaghan, R., Moscrop, A. and
Tregenza, N. 2005. Relative abundance of harbour porpoises (Phocoena phocoena) from acoustic and visual surveys of the
Baltic Sea and adjacent waters during 2001 and 2002. J. Cetacean Res. Manage., 7, 51.
Haelters, J. and Camphuysen, C. J. 2008. The harbour porpoise in the southern North Sea: Abundance, threats and
research- & management proposals. Report commissioned by IFAW EU office, 60pp.
Haelters, J., F. Kerckhof, T. G. Jacques & S. Degraer. 2011. The harbour porpoise Phocoena phocoena in the Belgian part of
the North Sea: trends in abundance and distribution. Belgian Journal of Zoology, 141, 75.
Hammond, P.S., Benke, H., Berggren, P., Borchers, D.L., Buckland, S.,T., Collet, A., Heide-Jørgensen, M.P., Heimlich-Boran,
S., Hiby, A.R., Leopold, M.F. and Øien, N., 1995. Distribution and abundance of the harbour porpoise and other small
cetaceans in the North Sea and adjacent waters. Final Report to the EC under contract LIFE 92-2/UK/27
Hammond, P.S., Benke, H., Berggren, P., Borchers, D.L., Buckland, S.,T., Collet, A., Heide-Jørgensen, M.P., Heimlich-Boran,
S., Hiby, A.R., Leopold, M.F. and Øien, N., 2002. Abundance of harbor porpoise and other cetaceans in the North Sea and
adjacent waters. Journal of Applied Ecology, 39: 361-376.
ICES. 2008. Report of the Working Group on the Assessment of Demersal Stocks in the North Sea and Skagerrak - Spring
and Autumn (WGNSSK). ICES CM 2008\ACOM:09. ICES, Copenhagen, Denmark.
Jepson, P.D., 2006. Trends in cetacean strandings around the UK coastline and cetacean and marine turtle post-mortem
investigations, 2000 to 2004 inclusive. Defra contract CRO 238.
JNCC, 2011. Offshore Special Area of Conservation: Dogger Bank. SAC Selection Assessment # 9.0 (26th
August 2011).
Leopold, M. F. and Camphuysen, C. J. 2006. Bruinvisstrandingen in Nederland in 2006. Achtergronden, leeftijdsverdeling,
sexratio, voedselkeuze en mogelijke oorzaken, IMARES rapport C083/06, NIOZ Report 2006-5, 89pp.
Koschinski, S., Culik, B. M., Henriksen, O. D., Tregenza, N., Ellis, G. M., Jansen, C. and Kathe, G. 2003. Behavioural reactions
of free-ranging porpoises and seals to the noise of a simulated 2 MW windpower generator. Mar Ecol Prog Ser, 265, 263.
Lowry, N. and Teilmann, J. 1994. Bycatch and bycatch reduction of the harbour porpoise Phocoena phocoena) in Danish
waters. Reports of the International Whaling Commission, Special Issue 15: 203-209.
Macleod, C.D., Weir, C.R., Pierpoint, C. and Harland, E.J., 2007. The habitat preferences of marine mammals west of
Scotland. Journal of the Marine Biological Association of the United Kingdom, 87: 157-164.
MCR. 2011. Final Report of a Survey for Harbour Porpoises Conducted from R/V Song of the Whale in French and British
waters of the English Channel, May to June 2011. Report prepared by Marine Conservation Research. 23 pp.
Møhl, B. and Anderson, S., 1973. Echolocation: high-frequency component in the click of the harbor porpoise (Phocoena
ph.L). Journal of the Acoustical Society of America 54: 1368-1373.
Nedwell, J. and Howell, D. 2004. A review of offshore wind farm related underwater noise sources, COWRIE report no. 544
R 0308, 57pp.

Acoustic and visual survey for harbour porpoises of the Dogger Bank and southern North Sea, November 2011
19
Northridge, S.P., Tasker, M.L., Webb, A and Williams, J.M., 1995. Distribution and relative abundance of harbour porpoises
(Phocoena phocoena L.), white-beaked dolphins (Lagenorhynchus albirostris Gray), and minke whales (Balaenoptera
acutorostrata Lacepède) around the British Isles. ICES Journal of Marine Science, 52, 55-66.
Palka, D., 1996. Effects of Beaufort Sea State on the Sightability of Harbour Porpoises in the Gulf of Maine. Reports of the
International Whaling Commission: 46, 1996: SC/47/SM26
Pollock, C.M., Reid, J.B., Webb, A. and Tasker, M., 1997. The distribution of seabirds and cetaceans in the waters around
Ireland. JNCC Report No 267. Joint Nature Conservation Committee, Peterborough, UK.
Pollock, C.M., Mavor, R., Weir, C.R., Reid, A., White, R.W., Tasker, M.L., Webb, A. and Reid, J.B., 2000. The distribution of
seabirds and marine mammals in the Atlantic Frontier, north and west Scotland. JNCC, Aberdeen, UK.
Reid, J.B., Evans, P.G.H. and Northridge, S.P., 2003. Atlas of cetacean distribution in north-west European waters. Joint
Nature Conservation Committee, Aberdeen, UK.
SCANS-II, 2008. Small cetaceans in the European Atlantic and North Sea. Final Report to the European Commission under
project LIFE04NAT/GB/000245, SMRU, Gatty Marine Laboratory, University of St. Andrews, Fife KY16 8LB, UK.
Smeenk, C. 1987. The harbour porpoise Phocoena phocoena (L., 1758) in the Netherlands: stranding records and decline.
Lutra 30: 77–90.
Smeenk, C., García Hartmann, M., Addink, M. J. and Fichtel, L. 2004. High number of by-catch among beach-cast harbour
porpoises, Phocoena phocoena, in The Netherlands. Kolmården, Sweden, ECS 18th Annual Conference, 1st April 2004.
Teilmann, J., Miller, L.A., Kirketerp, T., Kastelein, R.A., Madsen, P.T., Nielsen. B.K. and Au, W.W.L., 2002. Characteristics of
echolocation signals used by a harbor porpoise (Phocoena phocoena) in a target detection experiment. Aquatic Mammals,
28.3: 275-284.
Thomsen, F., Laczny, M. and Piper, W. 2006. A recovery of harbour porpoises (Phocoena phocoena) in the southern North
Sea? A case study off Eastern Frisia, Germany. Helgoland Marine Research 60(3): 189-195.
Thompson, D. and Duck, C., 2010. Berkwickshire and North Northumberland Coast European Marine Site: grey seal
population status. Report to Natural England: 20100902-RFQ.
Thomas, L., S.T. Buckland, E.A. Rexstad, J. L. Laake, S. Strindberg, S. L. Hedley, J. R.B. Bishop, T. A. Marques, and K. P.
Burnham. 2010. Distance software: design and analysis of distance sampling surveys for estimating population size.
Journal of Applied Ecology 47: 5-14.
Todd, V.L.G., Pearse, W.D., Tregenza, N.C., Lepper, P.A. and Todd, I.B., 2009. Diel echolocation activity of harbor porpoises
(Phocoena phocoena) around North Sea offshore gas installations. ICES Journal of Marine Science, 66.
Tougaard, J., Cartensen, J., Henriksen, O. D., Skov, H. and Teilmann, J. 2003. Short-term effects of the construction of wind
turbines on harbour porpoises at Horns Reef. DDH-Consulting, Roskilde, Denmark, 72pp.
Tregenza, N. J. C., Berrow, S. D., Hammond, P. S. and Leaper, R. 1997. Harbour porpoise (Phocoena phocoena L.) by-catch in
set gillnets in the Celtic Sea. ICES Journal of Marine Science 54(5): 896-904.
Villadsgaard, A., Wahlberg, M. and Tougaard, J., 2006. Echolocation signals of wild harbor porpoises, Phocoena phocoena.
The Journal of Experimental Biology, 210: 56-64.
Vinther, M. and Larsen, F. 2004. Updated estimates of harbour porpoise (Phocoena phocoena) bycatch in the Danish North
Sea bottom-set gillnet fishery. Journal of Cetacean Research & Management 6: 19-24.
Weir, C.R., Pollack, C., Cronin, C. and Taylor, S., 2001. Cetaceans of the Atlantic Frontier, north and west of Scotland.
Continental Shelf Science, 21: 1047-1071.
Weir, C.R., Stockin, K.A. and Pierce, G.J., 2007. Spatial and temporal trends in distribution of harbour porpoises, white-
beaked dolphins and minke whales off Aberdeenshire (UK), north-western North Sea. Journal of the Marine Biological
Association of the United Kingdom, 87: 327-338.
Winship, A. 2009. Estimating the impact of bycatch and calculating bycatch limits to achieve conservation objectives as
applied to harbour porpoise in the North Sea. University of St Andrews, PhD Thesis, 262pp.