Final Report - EPSG Geodetic Parameter · PDF fileFinal Report . Subsea Dispersant ... for any...
60
SINTEF Materials and Chemistry Oil Spills Research 2014-11-30 A26541 - Unrestricted Final Report Subsea Dispersant Effectiveness Bench-Scale Test - Protocol Development and Documentation for IPIECA-OGP OSR JIP A comparative experimental study performed both at CEDRE and SINTEF Author(s) Per Johan Brandvik, Per S. Daling, Frode Leirvik, Øistein Johansen, Emlyn Davies and Daniel F. Krause.
Transcript of Final Report - EPSG Geodetic Parameter · PDF fileFinal Report . Subsea Dispersant ... for any...

SINTEF Materials and Chemistry Oil Spills Research 2014-11-30
A26541 - Unrestricted
Final Report
Subsea Dispersant Effectiveness Bench-Scale Test - Protocol Development and Documentation for IPIECA-OGP OSR JIP A comparative experimental study performed both at CEDRE and SINTEF Author(s) Per Johan Brandvik, Per S. Daling, Frode Leirvik, Øistein Johansen, Emlyn Davies and Daniel F. Krause.

SINTEF Materials and Chemistry Oil Spills Research 2014-11-30


PROJECT NO. 10200 4780
REPORT NO. A26541
VERSION Final
2 of 58
Document history VERSION DATE VERSION DESCRIPTION
Draft version 1 2014-09-15 Draft version to be discussed with OGP-IPIECA
Final 2014-11-30 Final version including comments from IPIECA and internal QA at SINTEF
Disclaimer: The statements, technical information, results, conclusions and recommendations contained herein are believed to be accurate as of the date hereof. Since any use of this information is beyond our control, SINTEF expressly disclaims all liability for any results obtained or arising from any use of this report or
reliance on any information in this report.
Recommended reference: Per Johan Brandvik, Per S. Daling, Frode Leirvik, Øistein Johansen, Emlyn Davies and
Daniel F. Krause.. 2014: Subsea Dispersant Effectiveness Bench-Scale Test Protocol Development and Documentation SINTEF report no: A26541. Trondheim Norway 2014. ISBN: 9788214057539.
This study has been funded by the International Petroleum Industry Environmental Conservation Association (IPIECA) on behalf of the IPIECA-OGP OSR-JIP.

PROJECT NO. 10200 4780
REPORT NO. A26541
VERSION Final
3 of 58
Table of contents 1 Introduction .................................................................................................................................. 5
2 Objectives ..................................................................................................................................... 7
3 Development of a new bench-Scale test protocol ........................................................................... 8 3.1 Simulation realistic mixing energies (or turbulence) ..................................................................... 8 3.2 Simulating "high" and "Low" turbulence levels ............................................................................. 9 3.3 Quantifying droplet sizes and dispersant effectiveness .............................................................. 10 3.4 Dispersant application ................................................................................................................. 11 3.5 Dispersant to Oil Ratio (DOR) ....................................................................................................... 12
4 Proposed protocol – Dispersant Injection Effectiveness Test (DIET) ............................................... 13 4.1 Continuous mode to measure effectiveness ............................................................................... 15 4.2 Static mode to measure coalescence .......................................................................................... 15 4.3 Static mode to test re-dispersion of surfaced oil ......................................................................... 16
5 Documenting the new test protocol ............................................................................................. 17 5.1 Oil type ......................................................................................................................................... 17 5.2 Type of dispersant ........................................................................................................................ 18 5.3 Test program ................................................................................................................................ 18 5.4 Activity 21 - Oil type-dispersant-DOR testing .............................................................................. 18 5.5 Activity 22 - Turbulence experiments .......................................................................................... 20 5.6 Activity 23 - Coalescence experiments ........................................................................................ 20 5.7 Activity 24 – Re-dispersion experiments ..................................................................................... 20
6 Results ........................................................................................................................................ 25 6.1 Oil-Dispersant effectiveness testing ............................................................................................ 25
6.1.1 Upstream versus SIT injection ......................................................................................... 37 6.2 Different turbulence level testing ................................................................................................ 38 6.3 Re-dispersion testing ................................................................................................................... 40 6.4 Comparison with results from SINTEF Tower basin testing ......................................................... 43 6.5 Using SINTEF MiniTower for subsea dispersant screening .......................................................... 48
7 Discussion ................................................................................................................................... 50 7.1 General design ............................................................................................................................. 50 7.2 Testing of Settling and coalescence ............................................................................................. 50
7.2.1 Injection techniques for dispersants ............................................................................... 50 7.3 Testing of dispersant effectiveness as a function of oil type, dispersant and dosage ................ 51
7.3.1 Oil type ............................................................................................................................. 51 7.3.2 Dispersant type ................................................................................................................ 51

PROJECT NO. 10200 4780
REPORT NO. A26541
VERSION Final
4 of 58
7.4 Testing of effectiveness at reduced turbulence .......................................................................... 52 7.5 Testing of re-dispersion of surfaced treated oil........................................................................... 52 7.6 Comparison with large-scale results ............................................................................................ 53 7.7 Example of using the MiniTower for operational dispersant screening ...................................... 53
8 Conclusions ................................................................................................................................. 54
9 Recommendations for further work ............................................................................................. 56
10 Literature .................................................................................................................................... 57

PROJECT NO. 10200 4780
REPORT NO. A26541
VERSION Final
5 of 58
1 Introduction This study is a part of a comparative study performed both at CEDRE and SINTEF. This report covers the work performed at SINTEF in the period October 2013 to August 2014. The size distribution of oil droplets formed in deep water oil and gas blowouts is known to have strong impact on the subsequent fate of the oil in the environment. Large droplets will rise relatively rapidly and come to the surface relatively close to the discharge location, while small droplets will rise more slowly and can be transported long distances from the discharge location with ambient currents before reaching the sea surface. The smallest droplets may even be kept suspended in the water masses for prolonged periods by vertical oceanic turbulent mixing, and this mechanism is the main rational for application of chemical dispersants. Releases which are predominantly producing large oil droplets (in the millimetre size range) may thus result in relatively thick surface oil slicks, while thin surface films may be expected from releases producing small droplets (micrometre range). Thin oil films are more susceptible to natural dispersion and will have distinctly shorter persistence on the sea surface than thicker oil slicks, and the possibility of oiling of adjacent shorelines may thus be strongly reduced. Subsea injection of dispersants will change the droplet size distribution of the oil due to lowering of the interfacial tension between oil and water. This could strongly affect the fate and effect of the oil from an accidental subsea release. Testing dispersant effectiveness for subsea injection is very different compared to screening of dispersants for surface oil spills. Changes in physical properties of surface oil slicks due to weathering (e.g. increased viscosity due to emulsification) are important for the effectiveness of dispersant applied on traditional surface oil slicks. The sea state is also important, since the dispersion process, in most cases, demands a certain energy (braking waves). Screening testing of dispersants for surface application is for this reason usually done with artificially weathered oils and a relevant turbulence level. The different standard test methods, IFP, MNS, WSL, Swirling flask and others can be regarded as representations of different turbulence levels (sea states). The following factors are usually important for dispersant screening for surface oil slicks:
1. Weathering degree, defines the "time window" for effective dispersant use 2. Dispersant is sprayed/applied on the surface of weathered oil (simulating aerial spraying) 3. Effectiveness is measured as percentage of surface oil dispersed down in the water column as small
droplets 4. "Turbulence level" reflects varying sea state (WSL>MNS> IFP>Swirling flask…..) 5. "Turbulence levels" are related to operative conditions (sea states) by comparing lab effectiveness
with results from experimental sea trials
Since traditional bench-scale dispersant testing is performed under conditions that we can relate to important operative parameters for surface oil slicks (sea state, dispersant application, weathering), the results from this testing become operatively relevant. Two examples;
• Screening studies to identify good products on a specific oil type (the dispersants penetrate differently into weathered/emulsified oils) or
• Studies to map effectiveness versus weathering degree to find the time window for using dispersants on a particular oil type.
The situation is different with subsea injection of dispersants. The dispersant is applied directly into a stream of fresh/warm oil usually under very turbulent conditions. Using any of the existing bench-scale dispersant

PROJECT NO. 10200 4780
REPORT NO. A26541
VERSION Final
6 of 58
tests with e.g. premixed dispersant would make it very difficult to differentiate between dispersants, since dispersant effectiveness of fresh/premixed oil is very high (90-100%), even with the less turbulent test methods, e.g. the IFP test. The following list summarises important factors for dispersant testing for subsea oil spills: 1. Fresh oil, no weathering effects are relevant. 2. Dispersant is injected into the oil immediately before or after release in the highly "Turbulent jet-zone". 3. Effectiveness of the dispersant is measured as a shift in droplet size distribution (e.g. from millimeters
to micrometers) 4. "Turbulence level" should reflect varying subsea release rates and release diameters, producing realistic
release speeds of oil into the water (1-10 m/s). 5. "Turbulence level" should be variable (release rates/diameters). 6. "Turbulence levels" in the test method can be related to large scale basin testing (e.g. SINTEF Tower
Basin) and operative field conditions e.g. by using the Ohnesorge vs. Reynolds number diagram (Figure 3.2).
To perform meaningful screening of dispersants for subsea application, a test protocol should include different dispersant injection methods into a steady stream of oil (premixed, simulated injection tool and into the jet zone immediately above the release where the oil droplets are formed). This should also be possible for a wide range of dispersant to oil ratio DOR (1:1000 – 1:25). A very realistic and relevant measure of dispersant effectiveness is to quantify the relative shift in the oil droplet size distribution. For this reason, SINTEF has developed a prototype for a new test method that reflects turbulence levels, possible injection methods and quantification of effectiveness that are relevant for subsea injection of dispersants, the Dispersant Injection Effectiveness Test (DIET). The SINTEF MiniTower is the core part of this new bench-scale test method (DIET) and are used in this study. However, several modifications were needed to satisfy additions requests described in this RFP (e.g. regarding re-dispersion of surface oil). This study is a part of a comparative study performed both at CEDRE and SINTEF. This report covers the work performed at SINTEF in the period October 2013 to August 2014.
PROJECT NO. 10200 4780
REPORT NO. A26541
VERSION Final
7 of 58
2 Objectives The overall objective of this project was to develop a protocol for conducting bench-top testing of the effectiveness of dispersants injected subsea into jets of oil from an out-of-control well. According to the OGP-IPIECA RFP of February 2013, the new prototype bench-top protocol should have the following properties:
1. Simulating realistic mixing energy for an energetic jet of oil being released into a static body of water
2. Simulating both "Low" and "High" energy conditions 3. Effectiveness evaluated by the change in droplet size distribution:
a. immediately after oil is dispersed (dynamic measurement) and b. as a function of time (10 min static measurement) as a measure of coalescence
4. Two different injection methods (premixed + direct injection) 5. Possibilities for varying Dispersant to Oil Ratios (DORs) 6. Possibilities for testing of "re-dispersion" of surface oil (in-situ modified IFP test).

PROJECT NO. 10200 4780
REPORT NO. A26541
VERSION Final
8 of 58
3 Development of a new bench-Scale test protocol This section describes the different tasks performed to develop a new bench-scale test protocol for effectiveness testing of subsea application of dispersants. In this proposal, the term "protocol" is used for a combination of:
1. A description of the new SINTEF Dispersant Injection Effectiveness Test (DIET), with modifications to satisfy additional requests beyond those initially stated in the RFP from OGP-IPIECA.
2. An experimental procedure describing its use for a specific purpose (dispersant effectiveness screening)
3.1 Simulation realistic mixing energies (or turbulence) Droplet breakup may be caused by different mechanisms depending on the properties of the fluid and outlet conditions, ranging from pendant droplets that separate from the nozzle when the buoyant forces outrange the interfacial tension forces, through various axial or transverse instabilities of the jet, to full atomization where droplets of a wide size range are generated almost instantaneously at the jet exit. The full range of breakup regimes of oil jets in water were investigated in laboratory experiments reported by Masutani and Adams (2000) and Tang and Masutani (2003). Examples of the various breakup regimes of oil jets are shown in Figure 3.1. As previously observed from breakup experiments with liquid jets in air, Masutani and coworkers found that the breakup regimes of oil jets in water could be delimited in a Reynolds number (re) vs. Ohnesorge number (Z or Oh) diagram (Figure 3.2). The two non-dimensional numbers are defined as Re = ρ U D/μ and Oh = μ/(ρ σ D)1/2, where U is the exit velocity, D the orifice diameter, and ρ and μ are the density and dynamic viscosity of the jet fluid. The Ohnesorge number can also be expressed as a combination of the Reynolds number and the Weber number, i.e. Oh = We1/2/Re, where We = ρ U2 D/σ. The two boundaries which are shown in the diagram were derived from visual inspection of the breakup conditions. The thin line shows the boundary between laminar and transitional breakup, while the thicker line shows the boundary between the transitional and turbulent (atomization) break regimes. Both lines were found to represent linear relationships of the form Oh = c Re-1, where c is a constant of proportionality. From the definition of Ohnesorge number mentioned above, this relationship implies that both boundaries are lines for constant Weber number, with We = c2, or We = 18 x 18 = 324 for the boundary between the transitional and turbulent breakup regime. In earlier studies at SINTEF for both individual oil companies and for API, the main focus has been on turbulent break up. Figure 3.2 shows how the Ohnesorge vs. Reynolds number diagram can be used to delimit the range of discharge conditions. The parallelogram formed grid in the diagram depicts a range of possible orifice diameters and oil flow rates that might be used in the tower tank experiments. The orifice diameters are here limited to the range from 0.1 to 5 mm, with oil flow rates in the range from 0.02 to 5 L/minute. The thick solid line drawn in the diagram shows the boundary between the transition regime and the turbulent breakup (or atomization) regime.

PROJECT NO. 10200 4780
REPORT NO. A26541
VERSION Final
9 of 58
Figure 3.1: Illustration of oil jet breakup regimes from Tang and Masutani (2003). At low velocities,
Rayleigh instability dominates, producing a near mono-dispersion of droplets larger than the orifice (a). As velocity is increased, the breakup location moves away from the nozzle and at some point the instability changes to a sinuous mode (b). At higher velocities, two instability mechanisms appear to operate in parallel: the surface of the jet becomes unstable to short wavelength disturbances and disintegrates close to the nozzle into fine droplets, while the core of the jet persists as a continuous fluid filament that breaks up further downstream into large droplets (c). Raising the velocity moves the breakup location of the jet core filament closer to the nozzle and also increases the fraction of fine droplets (d). Finally, atomization is obtained (e). Source: Tang and Masutani (2003).
3.2 Simulating "high" and "Low" turbulence levels We could simulate release conditions with high and low turbulence levels by positioning the experiments in different locations in the Reynold vs. Onesorge number diagram in Figure 3.2. By performing experiments in the "Intermediate" and in the "Atomizing spray" zone, different levels of turbulence can be compared. Such an approach is indicated by the two circles in the figure indicating different "Energy levels" (Low/High), or more correctly, different break-up regimes (low or high turbulence levels) from Figure 3.2

PROJECT NO. 10200 4780
REPORT NO. A26541
VERSION Final
10 of 58
Figure 3.2: Possible experimental conditions relevant for the SINTEF MiniTower plotted in an Ohnesorge
vs. Reynolds number diagram. Injection rate varied from 0.02 to 5 L/min, while nozzle diameters varied from 0.1 to 5 mm. (Source: SINTEF).
As noted earlier, the diagonal lines dividing the three different release regimes have constant Weber numbers. The line dividing the Transitional and Atomizing (or turbulent break up) zone has a We of 384. The two release regimes used in this study for high and low turbulence have Weber numbers of 2 020 and 84, respectively. The Weber number for the release conditions mostly used in the SINTEF Tower basin (1.5 mm nozzle and 1.5 L/min) is 17 000 (Brandvik et al., 2013).
3.3 Quantifying droplet sizes and dispersant effectiveness The dispersant effectiveness in the prototype test apparatus is evaluated by the change in droplet size distribution from a reference release of untreated oil. The droplet size distribution is measured with a standard laser diffraction scattering instrument, LISST100X and a holographic camera LISST HOLO from the same producer (www.Sequoiasci.com). Both LISSTs are operated 50 cm above the nozzle to obtain stable, more homogenous conditions and to obtain necessary dilution of the oil plume (10 – 300 ppm). The LISST 100X instrument determines size distribution of an ensemble of particles, as opposed to counting type devices that size one particle at a time. Laser diffraction is largely unaffected by composition of particles since the scattering of laser light is observed at multiple, small forward angles. At these small angles, light scattering is determined almost entirely by light diffracted by the particle. Since the light transmitted through the particle makes only a weak contribution to the measured scattering, the method of laser diffraction is mostly independent of particle composition (Andrews et al., 2010). Thus, except for shape effects, laser diffraction offers an excellent method for size-distribution estimation. Uncertainties due to shape are small in these studies since the measured particles (oil droplets) are spherical (Karp-Boss 2007 and Andrews et al., 2010). Density or temperature gradients during the release due to release of warm oil (18 ºC) in cold water (8-10 ºC) are small and are not expected to interfere with the light scattering from the particles

PROJECT NO. 10200 4780
REPORT NO. A26541
VERSION Final
11 of 58
(Mikkelsen et al., 2008). The optical density is dependent on concentration and droplet sizes and if it becomes too high it will reduce and obscure the light scattering. An optical path reducer (90%) reducing the optical path from 50 mm to 5 mm was used to extend the concentration range for the LISST instrument. The instrument was also operated 50 cm above the release point to obtain a suitable dilution of the oil plume, while still giving sufficient optical density, producing a good signal to noise ratio in the diffraction patterns. For these reasons, the applied laser diffraction methods deliver an equivalent-sphere size distribution that is very suitable for the purpose of this study. The LISST instrument makes 10 measurements every second (covering 32 logarithmic spaced bins in the 5-500 µm range) and stores these as an average reading. An average over a 30 second period, which means 300 individual droplet size scans, is used in this study to quantify each droplet size distribution. Averaging over this period should reduce uncertainties from possible drifting or pulsing in oil or dispersant flow rates and inhomogeneity in the rising oil & gas plume. Further details can be found in Brandvik et al., 2013. The application of in-line holography has recently become a topic of interest for the measurement of marine suspended particles, such as sediments and phytoplankton, and a commercial system (LISST-HOLO) is now produced by Sequoia Scientific Inc. to complement their LISST-100 series of instruments. Owen and Zozulya (2000) and Graham and Nimmo-Smith (2010) describe how digital in-line holography can be used to measure marine particle size, shape and settling velocity. One of the main advantages of digital holography is that the hologram of the sample volume can be reconstructed at any depth through the imaging volume (substantially increasing the effective depth-of-field), allowing for an accurate measurement of any particle within the sample without errors due to focussing which are problematic in standard imaging techniques and microscopy. A study by Davies et al (2011) compared the responses of in-line holography and laser diffraction and reported very good agreement between the two techniques. The LISST-HOLO has also been recently been evaluated alongside the LISST-100 in the SINTEF Mini-Tower and produced promising results for oil droplet size, shape and concentration measurements. The LISST HOLO used in this study took 1 image every 2 seconds. The droplets in the measuring volume 1.86 cm3 were quantified by later image analysis of the holograms. Droplets in the 50-3000 µm range are quantified by this method.
3.4 Dispersant application Three different injection techniques for the dispersant are implemented in this proposed test protocol. These injection techniques simulate both techniques used during the Macondo release and planned for future subsurface dispersant injection. The following three injection techniques are possible:
1. Upstream or premixed dispersant (injected into the oil feeding line before the release nozzle. The injection point is positioned 1000 release diameters or 50 cm upstream).
2. Simulated insertion tool – SIT (dispersant injected 6 release diameters before the release nozzle) 3. Direct injection (dispersant injected directly into the oil stream 6 release diameters above the release
nozzle) Experience from earlier subsea dispersant injection studies at SINTEF shows that injecting the dispersant just before the release nozzle or immediate after, where there is a solid cone of oil gives the most effective dispersion. This gives optimum mixing of the dispersant into the oil, producing low surface tensions and formation of small oil droplets, before the oil enters the highly turbulent zone where the droplets are formed. In this study, as requested by IPIECA, only the two first injection techniques are used.

PROJECT NO. 10200 4780
REPORT NO. A26541
VERSION Final
12 of 58
When dispersant is injected into the oil feeding line, turbulent flow (Re > 2000) to ensure sufficient mixing of dispersant and oil, is important. See the specification of the proposed apparatus and procedure in Chapter 4 for further details.
3.5 Dispersant to Oil Ratio (DOR) In the case of subsurface use of dispersants, the volume of dispersant used could be significant and impose a logistical challenge. A possible reduction in DOR would for this reason be regarded as a large benefit. To evaluate the different ability of dispersants to perform at low DORs as a function of oil properties (oil types) and turbulence levels, testing with the new protocol may be performed over a large range of DORs (1:1000 to 1:25). See the specification of the proposed apparatus and procedure in Chapter 4 for further details.

PROJECT NO. 10200 4780
REPORT NO. A26541
VERSION Final
13 of 58
4 Proposed protocol – Dispersant Injection Effectiveness Test (DIET) Existing bench-scale tests are designed to test dispersant for use on surface oil slicks where the turbulence levels reflects various sea states or degree of breaking waves. For this reason, SINTEF suggested a concept for a new test method that reflects turbulence levels, possible injection methods and quantification of effectiveness that is specifically relevant for subsea injection of dispersants. See Section 1 Introduction for more discussion of principles for "surface" vs. "subsea" testing of dispersants. SINTEF had already established a prototype for such a bench-top test before this project was initiated. This concept was used for this project and the principles are presented in Figure 4.1 and Figure 4.3.
Figure 4.1: Outline of the new subsea Dispersion Injection Effectiveness Test, illustrating the flow through
system of natural sea water, injection system of dispersant and release system for oil. The LISST laser scattering system is used for monitoring droplet sizes. Source: SINTEF.
The main features for the new proposed test apparatus are discussed in the next chapters. To fulfil the objectives for this project the bench-scale test can be operated in three main modes; Continuous, Static and Re-dispersion mode.
Water in
LISST 100Water out
"Water flow diffusor"
Dispersantinjection
(DOR: 1:25 – 1:1000)
Oil injection
(0.05 – 0.5 l/min)
mixingchamber
Injected into jet zone (+6 dia)
Simuleted injection tool (-6 dia)
"Premixed"

PROJECT NO. 10200 4780
REPORT NO. A26541
VERSION Final
14 of 58
Figure 4.2: SINTEF MiniTower after the initial modifications were made for this project.
Figure 4.3: The SINTEF MiniTower used for studying the effect of subsurface dispersant injection. A: Oil
release without dispersant injected (large droplets, d50: 220 µm) and B: oil release at same flow rate with dispersant injected (small droplets d50: 70 µm).
A B

PROJECT NO. 10200 4780
REPORT NO. A26541
VERSION Final
15 of 58
4.1 Continuous mode to measure effectiveness Objective: Testing dispersant effectiveness for different injection techniques, oil-dispersant combinations and turbulence levels (shift in droplet size distribution). As illustrated in Figure 4.1, water will flow continuously trough the 80 L test chamber to prevent build-up of oil droplets. The released oil and the formed plume of droplets are continuously flushed out of the system. This allows different test conditions such as dosages (DORs) and injection techniques to be tested in a continuous sequence with the same oil-dispersant combination. The effect of the dispersant is quantified by the shift in droplet size distribution compared to the untreated oil. Different turbulence levels are simulated by using different flow rates with corresponding Ohnesorge and Reynolds numbers that locate the experiments in the "intermediate" and "atomizing" zone (see Figure 3.2).
4.2 Static mode to measure coalescence Objective: Testing dispersant effectiveness for different injection techniques, oil-dispersant combinations and turbulence levels (possible coalescence).
Figure 4.4: An outline of the new subsea Dispersion Injection Effectiveness Test operated in "Static mode"
(B), where coalescence of oil droplets is monitored during a static settling period (B1 to B2). Source: SINTEF.
To study possible coalescence after initial droplet formation the new apparatus can be used in a "Static mode". This mean that the continuous flow of water is stopped and the changes in droplet size distribution and concentration is monitored as a function of time. Any deviation from a settling rate described by Stokes law can then be used to quantify coalescence (formation of larger droplets). By comparing such effects between treated and non-treated oil the coalescence preventing properties of the surfactants may be quantified.
Static mode (B1)Start of settling period
Static mode (B2)After settling period)
(10 min?)
LISST 100 LISST 100
PROJECT NO. 10200 4780
REPORT NO. A26541
VERSION Final
16 of 58
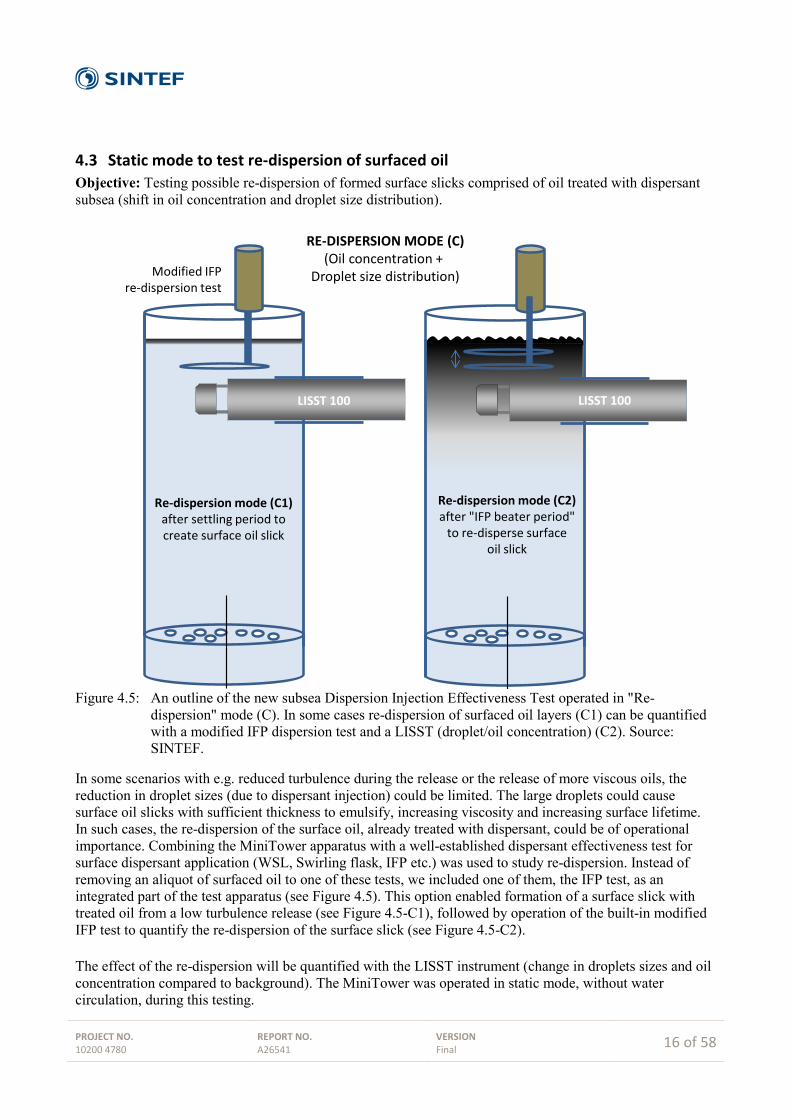
4.3 Static mode to test re-dispersion of surfaced oil Objective: Testing possible re-dispersion of formed surface slicks comprised of oil treated with dispersant subsea (shift in oil concentration and droplet size distribution).
Figure 4.5: An outline of the new subsea Dispersion Injection Effectiveness Test operated in "Re-
dispersion" mode (C). In some cases re-dispersion of surfaced oil layers (C1) can be quantified with a modified IFP dispersion test and a LISST (droplet/oil concentration) (C2). Source: SINTEF.
In some scenarios with e.g. reduced turbulence during the release or the release of more viscous oils, the reduction in droplet sizes (due to dispersant injection) could be limited. The large droplets could cause surface oil slicks with sufficient thickness to emulsify, increasing viscosity and increasing surface lifetime. In such cases, the re-dispersion of the surface oil, already treated with dispersant, could be of operational importance. Combining the MiniTower apparatus with a well-established dispersant effectiveness test for surface dispersant application (WSL, Swirling flask, IFP etc.) was used to study re-dispersion. Instead of removing an aliquot of surfaced oil to one of these tests, we included one of them, the IFP test, as an integrated part of the test apparatus (see Figure 4.5). This option enabled formation of a surface slick with treated oil from a low turbulence release (see Figure 4.5-C1), followed by operation of the built-in modified IFP test to quantify the re-dispersion of the surface slick (see Figure 4.5-C2). The effect of the re-dispersion will be quantified with the LISST instrument (change in droplets sizes and oil concentration compared to background). The MiniTower was operated in static mode, without water circulation, during this testing.
RE-DISPERSION MODE (C)(Oil concentration +
Droplet size distribution)
Re-dispersion mode (C2)after "IFP beater period"
to re-disperse surfaceoil slick
Re-dispersion mode (C1)after settling period to create surface oil slick
LISST 100
Modified IFP re-dispersion test
LISST 100

PROJECT NO. 10200 4780
REPORT NO. A26541
VERSION Final
17 of 58
5 Documenting the new test protocol This section describes the experimental work performed in this project to document the proposed protocol for bench-scale testing of dispersant injection.
5.1 Oil type Effectiveness of dispersants applied on surface oil slicks is dependent on factors such as: oil type, turbulence levels and weathering degree. Both field and laboratory studies document that different dispersants perform differently with varying oil types and weathering degrees. In the case of subsea use of dispersants, weathering (evaporation, emulsification etc.) is not an issue since the dispersant is injected directly into the fresh oil. For this reason, the interaction between the chemical components in the oil (the oil type) and the surfactants in the dispersant (type of dispersant) is probably more important to study in case of sub surface injection of dispersants. To ensure that a maximum amount of information could be drawn out of the dispersant testing, a selection of four different crude oils with varying composition was selected to span different oil properties. Examples are shown in Table 5.1. A 3 litre sample of each oil type was also sent to CEDRE, who performed similar testing with an alternative concept for bench-scale testing of dispersant injection. Table 5.1: Oil properties for the four North Sea oil types used.
Oseberg blend
2012-0347
Grane 2006-1060
Kobbe 2006-1061
Norne blend
2007-0260 Specific gravity (kg/l) 0.832 0.941 0.797 0.860 Pour Point (°C) -6 -24 -36 12 Viscosity (mPas at 13°C) 44 640 22 89 Asphaltene (wt%) 0.3 1.4 0.03 0.3 Waxes (wt%) 3.2 3.2 3.4 4.2 150°C – Evap loss (vol%) 22 3 34 9 200°C – Evap loss (vol%) 34 5 43 18 250°C – Evap loss (vol%) 45 13 54 28
These oils represent a broad selection of oil types and should be representative for a large number of oils worldwide.
• Paraffinic crude oil (e.g. Oseberg): Rich in paraffin and saturated components. • Waxy crude oil (e.g. Norne): Rich in waxes (higher saturated components > C20),
high pour point. Usually high pour points. • Light oil or condensate oil (e.g. Kobbe): High content of volatile component. Many have a paraffinic
nature and could have a waxy oil appearance and high pour point when light components have evaporated.
• Asphaltenic crude oil (e.g. Grane): Rich in polar resins and asphaltenes, high density (or low API gravity).

PROJECT NO. 10200 4780
REPORT NO. A26541
VERSION Final
18 of 58
5.2 Type of dispersant The following three commercial dispersants were selected for testing based on their worldwide licensing and approval status:
1. Dasic Slickgone NS 2. Corexit 9500 3. Finasol OSR 52
These were supplied by Nalco in the US (Corexit), Total Fluids in France (Finasol) and Dasic International in the UK (Dasic). All products were used as delivered and they were given individual IDs upon arrival, which were tracked during the experimental work.
5.3 Test program The main objective with the bench-scale testing was to, cost effectively, perform a large number of experiments defined by the parameters described in chapter 4:
1. Different oil types (four) 2. Different dispersants (Corexit 9500, Dasic NS and Finasol 52) 3. Different energy/turbulence levels (Low/High) 4. DORs (three; 1.250, 1:100 and 1:50 + oil alone) 5. Injection techniques (2)
5.4 Activity 21 - Oil type-dispersant-DOR testing This activity includes effectiveness testing of different combinations of dispersants, oils, DORs and injection techniques. This mode of operating the MiniTower is known to us from earlier projects (effectiveness screening of dispersants) and this type of experiment is performed using the following procedure:
1. Testing and calibration of LISST 100X (background & 80 + 200 µm particle standard). 2. Start flow through pumps for natural sea water (50 L/min). 3. Release of oil (100 mL/min – 0.5 mm nozzle) to give an oil distribution with approximate d50 = 300
µm (dependant on oil viscosity and oil-sea water IFT). 4. Continuous monitoring of droplet sizes with LISST (minimum 30 seconds for each setting). 5. Concentration of droplets around LISST is regulated with the sea water flow through system (30 –
100 L/min).
The steps 2-5 above were repeated for each of the combinations of oil, dispersant, DOR and injection technique described in the project description.
1. four different oil types (Norne, Oseberg, Kobbe and Grane) 2. three different dispersants (Corexit C9500, Finasol OSR-52 and Dasic Slickgone NS) 3. three different DORs (1:250, 1:100 & 1:50) 4. two injection techniques (upstream & simulated injection tool)
The experiments were performed by holding the oil type and particular dispersant constant (the system has one oil pump and one dispersant pump) while injection technique and DOR were changed automatically. The dispersant lines were thoroughly cleaned when changing to a different dispersant. A series of three independent, replicate measurements were performed for each oil type to document the reproducibility of the method (oil alone + one dispersant, 1:100, simulated injection tool).

PROJECT NO. 10200 4780
REPORT NO. A26541
VERSION Final
19 of 58
Figure 5.1: Continuous rising plume of untreated Oseberg blend (A) and oil treated with Corexit 9500 DOR
1:100 (B). Dispersant injection syringe pump (blue box) is shown (A).
Similar appearance was observed for Oseberg, Kobbe and Grane, but the waxy Norne blend behaved differently, see Figure 5.2 below.
Figure 5.2: Injection of the waxy and high pour point (21 ºC) Norne blend (untreated) in the cold water
(10 ºC), forming a combination of small droplets and larger oil "particles" or "lumps".
PROJECT NO. 10200 4780
REPORT NO. A26541
VERSION Final
20 of 58
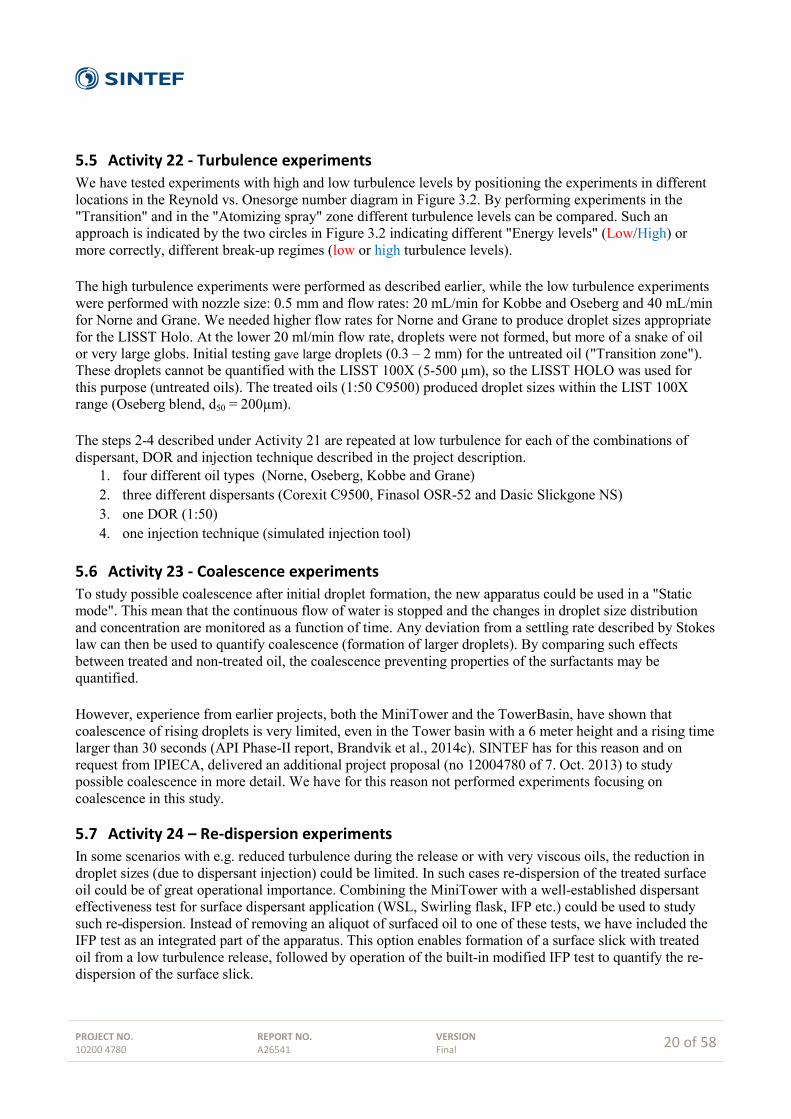
5.5 Activity 22 - Turbulence experiments We have tested experiments with high and low turbulence levels by positioning the experiments in different locations in the Reynold vs. Onesorge number diagram in Figure 3.2. By performing experiments in the "Transition" and in the "Atomizing spray" zone different turbulence levels can be compared. Such an approach is indicated by the two circles in Figure 3.2 indicating different "Energy levels" (Low/High) or more correctly, different break-up regimes (low or high turbulence levels). The high turbulence experiments were performed as described earlier, while the low turbulence experiments were performed with nozzle size: 0.5 mm and flow rates: 20 mL/min for Kobbe and Oseberg and 40 mL/min for Norne and Grane. We needed higher flow rates for Norne and Grane to produce droplet sizes appropriate for the LISST Holo. At the lower 20 ml/min flow rate, droplets were not formed, but more of a snake of oil or very large globs. Initial testing gave large droplets (0.3 – 2 mm) for the untreated oil ("Transition zone"). These droplets cannot be quantified with the LISST 100X (5-500 µm), so the LISST HOLO was used for this purpose (untreated oils). The treated oils (1:50 C9500) produced droplet sizes within the LIST 100X range (Oseberg blend, d50 = 200µm). The steps 2-4 described under Activity 21 are repeated at low turbulence for each of the combinations of dispersant, DOR and injection technique described in the project description.
1. four different oil types (Norne, Oseberg, Kobbe and Grane) 2. three different dispersants (Corexit C9500, Finasol OSR-52 and Dasic Slickgone NS) 3. one DOR (1:50) 4. one injection technique (simulated injection tool)
5.6 Activity 23 - Coalescence experiments To study possible coalescence after initial droplet formation, the new apparatus could be used in a "Static mode". This mean that the continuous flow of water is stopped and the changes in droplet size distribution and concentration are monitored as a function of time. Any deviation from a settling rate described by Stokes law can then be used to quantify coalescence (formation of larger droplets). By comparing such effects between treated and non-treated oil, the coalescence preventing properties of the surfactants may be quantified. However, experience from earlier projects, both the MiniTower and the TowerBasin, have shown that coalescence of rising droplets is very limited, even in the Tower basin with a 6 meter height and a rising time larger than 30 seconds (API Phase-II report, Brandvik et al., 2014c). SINTEF has for this reason and on request from IPIECA, delivered an additional project proposal (no 12004780 of 7. Oct. 2013) to study possible coalescence in more detail. We have for this reason not performed experiments focusing on coalescence in this study.
5.7 Activity 24 – Re-dispersion experiments In some scenarios with e.g. reduced turbulence during the release or with very viscous oils, the reduction in droplet sizes (due to dispersant injection) could be limited. In such cases re-dispersion of the treated surface oil could be of great operational importance. Combining the MiniTower with a well-established dispersant effectiveness test for surface dispersant application (WSL, Swirling flask, IFP etc.) could be used to study such re-dispersion. Instead of removing an aliquot of surfaced oil to one of these tests, we have included the IFP test as an integrated part of the apparatus. This option enables formation of a surface slick with treated oil from a low turbulence release, followed by operation of the built-in modified IFP test to quantify the re-dispersion of the surface slick.

PROJECT NO. 10200 4780
REPORT NO. A26541
VERSION Final
21 of 58
The effect of the re-dispersion is quantified with the LISST instrument (change in droplets sizes and oil concentration compared to background). The MiniTower was operated in static mode, without water circulation, during this testing. Initial testing has shown that a larger nozzle is needed to obtain sufficient amount of oil (50 mL) to be released within an acceptable time (minutes). The 0.5 mm nozzle gave too small droplets for the treated oil or very small flow rates. We suggest the following settings for these types of experiments:
• Nozzle. 1.5 mm • Flow rate: 50 ml/min. • DOR: 1:100 (C9500) • Release time: 30 seconds • Waiting time to let all oil settle on surface (5 minutes) • IFP beater time (10 minutes)

PROJECT NO. 10200 4780
REPORT NO. A26541
VERSION Final
22 of 58
This testing is done with the MiniTower in static mode (no water circulation). The water level is lowered to a fixed level (a valved drain pipe was used regulate this). This is important for the correct positioning of the IFP beater below the water level (defining the energy input). The released oil, treated with dispersant, formed large droplets (mm) that rises to the surface with very little formation of smaller droplets (Figure 5.3A-B). After the release is ended, a clear or defined surface layer of oil can be seen on top of the MiniTower (Figure 5.3C). The IFP beater is set to simulate the original IFP test settings (distance under water surface, shape of generated wave and frequency). The surfaced oil is resting on the surface for 5 minutes after the end of the release before the IFP beater is started (Figure 5.3D). Droplet sizes & concentration of the re-dispersed oil is monitored with the LISST instrument (Figure 5.3E). After a standard time (10 min), the dispersed oil was gently homogenised for 30 seconds with a small propeller to homogenise oil concentration in the 80 litre MiniTower. This homogenisation of the dispersed
A B
E
D C
Figure 5.3: Illustration of a re-dispersion experiment.
A: Low turbulent release of large droplets. B: large droplets passing the LISST towards the
surface. C: 5 minutes after release a surface layer of treated oil
is formed (IFP beater is high position). D: After the first initial strokes with the IFP beater
(beater in low position). E: Cloud of re-dispersed oil formed after 10 minutes of
IFP beater operation.

PROJECT NO. 10200 4780
REPORT NO. A26541
VERSION Final
23 of 58
oil will increase the quality of the estimated dispersion effectiveness (see figure below). Concentration of dispersed oil was estimated based on the measured oil concentration in each of the 32 size bins from the LISST instrument.
Figure 5.4: Kobbe – Re-dispersion: Oil droplet sizes and concentration after first 10 minutes of IFP beating
as a function of "post beating" stirring time 1-5 minutes.
0,00
0,10
0,20
0,30
0,40
0,50
0,60
5,29
6,24
7,36
8,69
10,2
12,1
14,3
16,8
19,9
23,5
27,7
32,7
38,5
45,5
53,7
63,3
74,7
88,2
104
128
157
186
219
259
293
332
391
462
Conc
entr
atio
n (p
pm)
Droplet size (um)
Kobbe 1:100 Dasic Post Beater/Stirrer
Kobbe 1:100 Dasic Post Beater/Stirrer (1 min)
Kobbe 1:100 Dasic Post Beater/Stirrer (2 min)
Kobbe 1:100 Dasic Post Beater/Stirrer (3 min)
Kobbe 1:100 Dasic Post Beater/Stirrer (4 min)
Kobbe 1:100 Dasic Post Beater/Stirrer (5 min)
Kobbe 1:100 Dasic End of Beating prior to Stirring

PROJECT NO. 10200 4780
REPORT NO. A26541
VERSION Final
24 of 58
Figure 5.5: Treated Norne blend released and collected on the surface before re-dispersion. Due to the
high pour point (21 ºC), compared to the water temperature (10 ºC), the oil shows a semi-solid behaviour and very little re-dispersion was observed.

PROJECT NO. 10200 4780
REPORT NO. A26541
VERSION Final
25 of 58
6 Results This section presents the results from the documentation of the proposed new bench-scale concept for effectiveness testing of subsurface dispersant effectiveness testing.
6.1 Oil-Dispersant effectiveness testing The results from the effectiveness testing with different oil types, dispersants and DORs are presented in the following figures.

PROJECT NO. 10200 4780
REPORT NO. A26541
VERSION Final
26 of 58
Figure 6.1: Oseberg – SIT: Relative droplet size distribution (volume %) for oil alone and as a function of
DORs (1:250, 1:100 and 1:50), dispersants; C9500, Finasol OSR 52 and Dasic NS. Peak droplet sizes or median volume diameters (d50) are indicated for DOR 1:100.
0
2
4
6
8
10
12
14
16
18
4,48
5,29
6,24
7,36
8,69
10,2
12,1
14,3
16,8
19,9
23,5
27,7
32,7
38,5
45,5
53,7
63,3
74,7
88,2
104
122
144
170
201
237
280
331
390
460
Rela
tive
Volu
me
Dist
ribut
ion
(Vol
%)
Droplet Diameter (µm)
OB Oil alone C9500 II
OB Oil alone C9500
OB Oil alone Dasic NS II
OB Oil alone Dasic NS
OB Oil alone OSR-52 II
OB Oil alone OSR-52
OB D250 C9500 SIT
OB D250 Dasic NS SIT
OB D250 OSR-52 SIT
0
2
4
6
8
10
12
14
16
18
4,48
5,29
6,24
7,36
8,69
10,2
12,1
14,3
16,8
19,9
23,5
27,7
32,7
38,5
45,5
53,7
63,3
74,7
88,2
104
122
144
170
201
237
280
331
390
460
Rela
tive
Volu
me
Dist
ribut
ion
(Vol
%)
Droplet Diameter (µm)
OB Oil alone C9500
OB Oil alone Dasic NS
OB Oil alone OSR-52
OB D100 C9500 SIT
OB D100 Dasic NS SIT
OB D100 OSR-52 SIT
0
2
4
6
8
10
12
14
16
18
4,48
5,29
6,24
7,36
8,69
10,2
12,1
14,3
16,8
19,9
23,5
27,7
32,7
38,5
45,5
53,7
63,3
74,7
88,2
104
122
144
170
201
237
280
331
390
460
Rela
tive
Volu
me
Dist
ribut
ion
(Vol
%)
Droplet Diameter (µm)
OB Oil alone C9500
OB Oil alone Dasic NS
OB Oil alone OSR-52
OB D50 C9500 SIT
OB D50 Dasic NS SIT
OB D50 OSR 52 SIT
DOR: 1:50 (2%)
DOR: 1:100 (1%)
DOR: 1:250 (0.25%)
170 µm
104 µm
122 µm
280 µm

PROJECT NO. 10200 4780
REPORT NO. A26541
VERSION Final
27 of 58
Figure 6.2: Oseberg – Upstream: Relative droplet size distribution (volume %) for oil alone and as a
function of DORs (1:250, 1:100 and 1:50) dispersants; C9500, Finasol OSR 52 and Dasic NS. Peak droplet sizes or median volume diameters (d50) are indicated for DOR 1:100.
0
2
4
6
8
10
12
14
16
18
4,48
5,29
6,24
7,36
8,69
10,2
12,1
14,3
16,8
19,9
23,5
27,7
32,7
38,5
45,5
53,7
63,3
74,7
88,2
104
122
144
170
201
237
280
331
390
460
Rela
tive
Volu
me
Dist
ribut
ion
(Vol
%)
Droplet Diameter (µm)
OB Oil alone C9500
OB Oil alone Dasic NS
OB Oil alone OSR-52
OB D250 C9500 Up
OB D250 Dasic NS Up
OB D250 OSR-52 Up
0
2
4
6
8
10
12
14
16
18
4,48
5,29
6,24
7,36
8,69
10,2
12,1
14,3
16,8
19,9
23,5
27,7
32,7
38,5
45,5
53,7
63,3
74,7
88,2
104
122
144
170
201
237
280
331
390
460
Rela
tive
Volu
me
Dist
ribut
ion
(Vol
%)
Droplet Diameter (µm)
OB Oil alone C9500
OB Oil alone Dasic NS
OB Oil alone OSR-52
OB D100 C9500 Up
OB D100 Dasic NS Up
OB D100 OSR-52 Up
0
2
4
6
8
10
12
14
16
18
4,48
5,29
6,24
7,36
8,69
10,2
12,1
14,3
16,8
19,9
23,5
27,7
32,7
38,5
45,5
53,7
63,3
74,7
88,2
104
122
144
170
201
237
280
331
390
460
Rela
tive
Volu
me
Dist
ribut
ion
(Vol
%)
Droplet Diameter (µm)
OB Oil alone C9500
OB Oil alone Dasic NS
OB Oil alone OSR-52
OB D50 C9500 Up
OB D50 Dasic NS Up
OB D50 OSR 52 Up
DOR: 1:50 (2%)
DOR: 1:100 (1%)
DOR: 1:250 (0.25%)
280 µm 237 µm
237 µm 237 µm

PROJECT NO. 10200 4780
REPORT NO. A26541
VERSION Final
28 of 58
Table 6.1: Oseberg - Tabular presentation of Median Volume Diameter (MVD or d50) from droplet distributions in Figure 6.1 (SIT) and Figure 6.2 (Upstream).
SIT C9500 OSR52 Dasic NS
Oil alone 280 280 280 1:250 144 201 201 1:100 104 122 170 1:50 88 104 122
Figure 6.3: Oseberg: Median volume diameter (d50 - µm), from Table 6.1 for oil alone and as a function of
DOR with both SIT and upstream injection, for all three dispersants.
0
50
100
150
200
250
300
Oil alone 1:250 1:100 1:50
Mea
n Vo
lum
e Di
amet
er (V
MD
-µm
)
Type of dispersant and DOR
C9500
OSR52
Dasic NS
SITOseberg
0
50
100
150
200
250
300
Oil alone 1:250 1:100 1:50
Mea
n Vo
lum
e Di
amet
er (V
MD
-µm
)
Type of dispersant and DOR
C9500
OSR52
Dasic NS
UpstreamOseberg
Upstream C9500 OSR52 Dasic NS
Oil alone 280 280 280 1:250 237 280 237 1:100 237 237 237 1:50 201 237 170

PROJECT NO. 10200 4780
REPORT NO. A26541
VERSION Final
29 of 58
Figure 6.4: Kobbe - SIT: Relative droplet size distribution (volume %) for oil alone and as a function of
DORs (1:250, 1:100 and 1:50), dispersants; C9500, Finasol OSR 52 and Dasic NS. Peak droplet sizes or median volume diameters (d50) are indicated for DOR 1:100.
0
2
4
6
8
10
12
14
16
18
4,48
5,29
6,24
7,36
8,69
10,2
12,1
14,3
16,8
19,9
23,5
27,7
32,7
38,5
45,5
53,7
63,3
74,7
88,2
104
122
144
170
201
237
280
331
390
460
Rela
tive
Volu
me
Dis
trib
utio
n (V
ol%
)
Droplet Diameter (µm)
OB Oil alone C9500 II
OB Oil alone C9500
OB Oil alone Dasic NS II
OB Oil alone Dasic NS
OB Oil alone OSR-52 II
OB Oil alone OSR-52
Kobbe D250 C9500 SIT
Kobbe D250 Dasic NS SIT
Kobbe D250 OSR-52 SIT
0
2
4
6
8
10
12
14
16
18
20
4,48
5,29
6,24
7,36
8,69
10,2
12,1
14,3
16,8
19,9
23,5
27,7
32,7
38,5
45,5
53,7
63,3
74,7
88,2
104
122
144
170
201
237
280
331
390
460
Rela
tive
Volu
me
Dis
trib
utio
n (V
ol%
)
Droplet Diameter (µm)
Kobbe Oil alone C9500
Kobbe Oil alone Dasic NS
Kobbe Oil alone OSR-52
Kobbe D100 C9500 SIT
Kobbe D100 Dasic NS SIT
Kobbe D100 OSR-52 SIT
0
2
4
6
8
10
12
14
16
18
4,48
5,29
6,24
7,36
8,69
10,2
12,1
14,3
16,8
19,9
23,5
27,7
32,7
38,5
45,5
53,7
63,3
74,7
88,2
104
122
144
170
201
237
280
331
390
460
Rela
tive
Volu
me
Dis
trib
utio
n (V
ol%
)
Droplet Diameter (µm)
OB Oil alone C9500
OB Oil alone Dasic NS
OB Oil alone OSR-52
Kobbe D50 C9500 SIT
Kobbe D50 Dasic NS SIT
Kobbe D50 OSR 52 SIT
DOR: 1:50 (2%)
DOR: 1:100 (1%)
DOR: 1:250 (0.25%)
140 µm
88 µm
88 µm
280 µm
PROJECT NO. 10200 4780
REPORT NO. A26541
VERSION Final
30 of 58
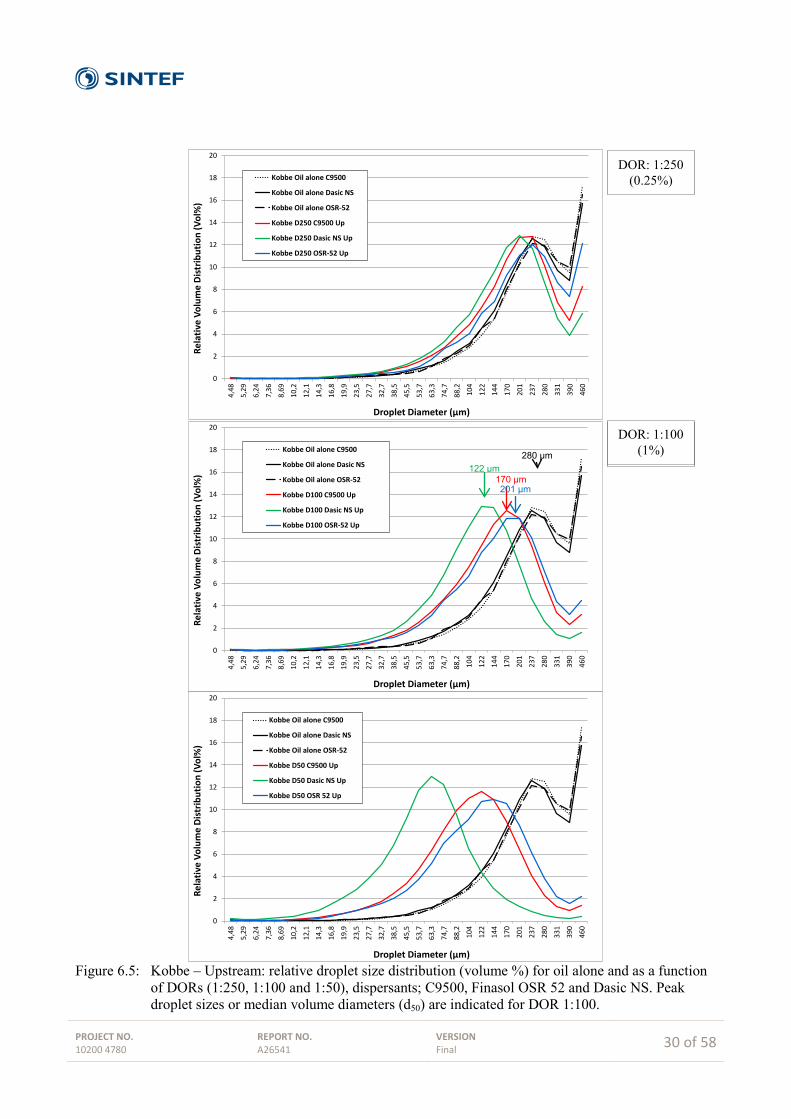
Figure 6.5: Kobbe – Upstream: relative droplet size distribution (volume %) for oil alone and as a function
of DORs (1:250, 1:100 and 1:50), dispersants; C9500, Finasol OSR 52 and Dasic NS. Peak droplet sizes or median volume diameters (d50) are indicated for DOR 1:100.
0
2
4
6
8
10
12
14
16
18
20
4,48
5,29
6,24
7,36
8,69
10,2
12,1
14,3
16,8
19,9
23,5
27,7
32,7
38,5
45,5
53,7
63,3
74,7
88,2
104
122
144
170
201
237
280
331
390
460
Rela
tive
Volu
me
Dis
trib
utio
n (V
ol%
)
Droplet Diameter (µm)
Kobbe Oil alone C9500
Kobbe Oil alone Dasic NS
Kobbe Oil alone OSR-52
Kobbe D250 C9500 Up
Kobbe D250 Dasic NS Up
Kobbe D250 OSR-52 Up
0
2
4
6
8
10
12
14
16
18
20
4,48
5,29
6,24
7,36
8,69
10,2
12,1
14,3
16,8
19,9
23,5
27,7
32,7
38,5
45,5
53,7
63,3
74,7
88,2
104
122
144
170
201
237
280
331
390
460
Rela
tive
Volu
me
Dis
trib
utio
n (V
ol%
)
Droplet Diameter (µm)
Kobbe Oil alone C9500
Kobbe Oil alone Dasic NS
Kobbe Oil alone OSR-52
Kobbe D100 C9500 Up
Kobbe D100 Dasic NS Up
Kobbe D100 OSR-52 Up
0
2
4
6
8
10
12
14
16
18
20
4,48
5,29
6,24
7,36
8,69
10,2
12,1
14,3
16,8
19,9
23,5
27,7
32,7
38,5
45,5
53,7
63,3
74,7
88,2
104
122
144
170
201
237
280
331
390
460
Rela
tive
Volu
me
Dis
trib
utio
n (V
ol%
)
Droplet Diameter (µm)
Kobbe Oil alone C9500
Kobbe Oil alone Dasic NS
Kobbe Oil alone OSR-52
Kobbe D50 C9500 Up
Kobbe D50 Dasic NS Up
Kobbe D50 OSR 52 Up
DOR: 1:50 (2%)
DOR: 1:100 (1%)
DOR: 1:250 (0.25%)
280 µm
170 µm 122 µm
201 µm

PROJECT NO. 10200 4780
REPORT NO. A26541
VERSION Final
31 of 58
Table 6.2: Kobbe - Tabular presentation of Median Volume Diameter (MVD or d50) from droplet distributions in Figure 6.1 (SIT) and Figure 6.2 (Upstream).
SIT C9500 OSR52 Dasic NS
Oil alone 237 237 237 1:250 144 144 170 1:100 88 88 144 1:50 63 75 75
Figure 6.6: Kobbe: Median volume diameter (d50 - µm) from Table 6.1 for oil alone and as a function of
DOR with both SIT and upstream injection, for all three dispersants.
0
50
100
150
200
250
Oil alone 1:250 1:100 1:50
Mea
n Vo
lum
e Di
amet
er (V
MD
-µm
)
Type of dispersant and DOR
C9500
OSR52
Dasic NS
SITKobbe
0
50
100
150
200
250
Oil alone 1:250 1:100 1:50
Mea
n Vo
lum
e Di
amet
er (V
MD
-µm
)
Type of dispersant and DOR
C9500
OSR52
Dasic NS
UpstreamKobbe
Upstream C9500 OSR52 Dasic NS
Oil alone 237 237 237 1:250 237 237 201 1:100 170 201 122 1:50 122 144 63

PROJECT NO. 10200 4780
REPORT NO. A26541
VERSION Final
32 of 58
Figure 6.7: Grane - SIT: Relative droplet size distribution (volume %) for oil alone and as a function of
DORs (1:250, 1:100 and 1:50), dispersants; C9500, Finasol OSR 52 and Dasic NS. Peak droplet sizes or median volume diameters (d50) are indicated for DOR 1:100.
0
2
4
6
8
10
12
14
16
18
20
4,48
5,29
6,24
7,36
8,69
10,2
12,1
14,3
16,8
19,9
23,5
27,7
32,7
38,5
45,5
53,7
63,3
74,7
88,2
104
122
144
170
201
237
280
331
390
460
Rela
tive
Volu
me
Dist
ribut
ion
(Vol
%)
Droplet Diameter (µm)
Grane Oil alone C9500
Grane Oil alone Dasic NS
Grane Oil alone OSR-52
Grane D250 C9500 SIT
Grane D250 Dasic NS SIT
Grane D250 OSR-52 SIT
0
2
4
6
8
10
12
14
16
18
20
4,48
5,29
6,24
7,36
8,69
10,2
12,1
14,3
16,8
19,9
23,5
27,7
32,7
38,5
45,5
53,7
63,3
74,7
88,2
104
122
144
170
201
237
280
331
390
460
Rela
tive
Volu
me
Dist
ribut
ion
(Vol
%)
Droplet Diameter (µm)
Grane Oil alone C9500
Grane Oil alone Dasic NS
Grane Oil alone OSR-52
Grane D100 C9500 SIT
Grane D100 Dasic NS SIT
Grane D100 OSR-52 SIT
0
2
4
6
8
10
12
14
16
18
20
4,48
5,29
6,24
7,36
8,69
10,2
12,1
14,3
16,8
19,9
23,5
27,7
32,7
38,5
45,5
53,7
63,3
74,7
88,2
104
122
144
170
201
237
280
331
390
460
Rela
tive
Volu
me
Dist
ribut
ion
(Vol
%)
Droplet Diameter (µm)
Grane Oil alone C9500
Grane Oil alone Dasic NS
Grane Oil alone OSR-52
Grane D50 C9500 SIT
Grane D50 Dasic NS SIT
Grane D50 OSR 52 SIT
DOR: 1:50 (2%)
DOR: 1:100 (1%)
DOR: 1:250 (0.25%)
254 µm
220 µm
243 µm
280 µm

PROJECT NO. 10200 4780
REPORT NO. A26541
VERSION Final
33 of 58
Figure 6.8: Grane – Upstream: relative droplet size distribution (volume %) for oil alone and as a function
of DORs (1:250, 1:100 and 1:50), dispersants; C9500, Finasol OSR 52 and Dasic NS. Peak droplet sizes or median volume diameters (d50) are indicated for DOR 1:100.
0
2
4
6
8
10
12
14
16
18
20
4,48
5,29
6,24
7,36
8,69
10,2
12,1
14,3
16,8
19,9
23,5
27,7
32,7
38,5
45,5
53,7
63,3
74,7
88,2
104
122
144
170
201
237
280
331
390
460
Rela
tive
Volu
me
Dist
ribut
ion
(Vol
%)
Droplet Diameter (µm)
Grane Oil alone C9500
Grane Oil alone DasicNSGrane Oil alone OSR-52
Grane D250 C9500 Up
Grane D250 Dasic NS Up
0
2
4
6
8
10
12
14
16
18
20
4,48
5,29
6,24
7,36
8,69
10,2
12,1
14,3
16,8
19,9
23,5
27,7
32,7
38,5
45,5
53,7
63,3
74,7
88,2
104
122
144
170
201
237
280
331
390
460
Rela
tive
Volu
me
Dist
ribut
ion
(Vol
%)
Droplet Diameter (µm)
Grane Oil alone C9500
Grane Oil alone Dasic NS
Grane Oil alone OSR-52
Grane D100 C9500 Up
Grane D100 Dasic NS Up
Grane D100 OSR-52 Up
0
2
4
6
8
10
12
14
16
18
20
4,48
5,29
6,24
7,36
8,69
10,2
12,1
14,3
16,8
19,9
23,5
27,7
32,7
38,5
45,5
53,7
63,3
74,7
88,2
104
122
144
170
201
237
280
331
390
460
Rela
tive
Volu
me
Dist
ribut
ion
(Vol
%)
Droplet Diameter (µm)
OB Oil alone C9500
Grane Oil alone Dasic NS
Grane Oil alone OSR-52
Grane D50 C9500 Up
Grane D50 Dasic NS Up
Grane D50 OSR 52 Up
DOR: 1:50 (2%)
DOR: 1:100 (1%)
DOR: 1:250 (0.25%)
280 µm
244 µm
310 µm
56 µm

PROJECT NO. 10200 4780
REPORT NO. A26541
VERSION Final
34 of 58
Table 6.3: Grane -Tabular presentation of Median Volume Diameter (MVD or d50) from droplet distributions in Figure 6.1 (SIT) and Figure 6.2 (Upstream).
SIT C9500 OSR52 Dasic NS
Oil alone 280 293 293 1:250 243 270 281 1:100 220 243 254 1:50 161 233 233
Figure 6.9: Grane: Median volume diameter (d50 - µm) from Table 6.1 for oil alone and as a function of
DOR with both SIT and upstream injection, for all three dispersants.
0
50
100
150
200
250
300
350
Oil alone 1:250 1:100 1:50
Mea
n Vo
lum
e Di
amet
er (V
MD
- µm
)
Type of dispersant and DOR
C9500
OSR52
Dasic NS
SITGrane
0
50
100
150
200
250
300
350
Oil alone 1:250 1:100 1:50
Mea
n Vo
lum
e Di
amet
er (V
MD
-µm
)
Type of dispersant and DOR
C9500
OSR52
Dasic NS
UpstreamGrane
Upstream C9500 OSR52 Dasic NS
Oil alone 282 294 294 1:250 72 250 308 1:100 56 244 310 1:50 97 237 300

PROJECT NO. 10200 4780
REPORT NO. A26541
VERSION Final
35 of 58
Figure 6.10: Norne - SIT: Relative droplet size distribution (volume %) for oil alone and as a function of
DORs (1:250, 1:100 and 1:50), dispersants; C9500, Finasol OSR 52 and Dasic NS.
0
2
4
6
8
10
12
14
4,48
5,29
6,24
7,36
8,69
10,2
12,1
14,3
16,8
19,9
23,5
27,7
32,7
38,5
45,5
53,7
63,3
74,7
88,2
104
122
144
170
201
237
280
331
390
460
Rela
tive
Volu
me
Dist
ribut
ion
(Vol
%)
Droplet Diameter (µm)
Norne Oil alone C9500
Norne Oil alone Dasic NS
Norne Oil alone OSR-52
Norne D250 C9500 SIT
Norne D250 Dasic NS SIT
Norne D250 OSR-52 SIT
0
2
4
6
8
10
12
14
4,48
5,29
6,24
7,36
8,69
10,2
12,1
14,3
16,8
19,9
23,5
27,7
32,7
38,5
45,5
53,7
63,3
74,7
88,2
104
122
144
170
201
237
280
331
390
460
Rela
tive
Volu
me
Dist
ribut
ion
(Vol
%)
Droplet Diameter (µm)
Norne Oil alone C9500
Norne Oil alone Dasic NS
Norne Oil alone OSR-52
Norne D100 C9500 SIT
Norne D100 Dasic NS SIT
Norne D100 OSR-52 SIT
0
2
4
6
8
10
12
14
4,48
5,29
6,24
7,36
8,69
10,2
12,1
14,3
16,8
19,9
23,5
27,7
32,7
38,5
45,5
53,7
63,3
74,7
88,2
104
122
144
170
201
237
280
331
390
460
Rela
tive
Volu
me
Dist
ribut
ion
(Vol
%)
Droplet Diameter (µm)
Norne Oil alone C9500
Norne Oil alone Dasic NS
Norne Oil alone OSR-52
Norne D50 C9500 SIT
Norne D50 Dasic NS SIT
Norne D50 OSR 52 SIT
DOR: 1:50 (2%)
DOR: 1:100 (1%)
DOR: 1:250 (0.25%)

PROJECT NO. 10200 4780
REPORT NO. A26541
VERSION Final
36 of 58
Figure 6.11: Norne – Upstream: relative droplet size distribution (volume %) for oil alone and as a function
of DORs (1:250, 1:100 and 1:50), dispersants; C9500, Finasol OSR 52 and Dasic NS.
-1
1
3
5
7
9
11
13
15
4,48
5,29
6,24
7,36
8,69
10,2
12,1
14,3
16,8
19,9
23,5
27,7
32,7
38,5
45,5
53,7
63,3
74,7
88,2
104
122
144
170
201
237
280
331
390
460
Rela
tive
Volu
me
Dis
trib
utio
n (V
ol%
)
Droplet Diameter (µm)
Norne Oil alone C9500
Norne Oil alone DasicNSNorne Oil alone OSR-52
Norne D250 C9500 Up
Norne D250 Dasic NS Up
-1
1
3
5
7
9
11
13
15
4,48
5,29
6,24
7,36
8,69
10,2
12,1
14,3
16,8
19,9
23,5
27,7
32,7
38,5
45,5
53,7
63,3
74,7
88,2
104
122
144
170
201
237
280
331
390
460
Rela
tive
Volu
me
Dis
trib
utio
n (V
ol%
)
Droplet Diameter (µm)
Norne Oil alone C9500
Norne Oil alone Dasic NS
Norne Oil alone OSR-52
Norne D100 C9500 Up
Norne D100 Dasic NS Up
Norne D100 OSR-52 Up
-1
1
3
5
7
9
11
13
15
4,48
5,29
6,24
7,36
8,69
10,2
12,1
14,3
16,8
19,9
23,5
27,7
32,7
38,5
45,5
53,7
63,3
74,7
88,2
104
122
144
170
201
237
280
331
390
460
Rela
tive
Volu
me
Dis
trib
utio
n (V
ol%
)
Droplet Diameter (µm)
Norne Oil alone C9500
Norne Oil alone Dasic NS
Norne Oil alone OSR-52
Norne D50 C9500 Up
Norne D50 Dasic NS Up
Norne D50 OSR 52 Up
DOR: 1:50 (2%)
DOR: 1:100 (1%)
DOR: 1:250 (0.25%)

PROJECT NO. 10200 4780
REPORT NO. A26541
VERSION Final
37 of 58
6.1.1 Upstream versus SIT injection The shift in droplets sizes as a function of dispersant injection show a significant difference between upstream injection (premixing) and SIT, for example, for Oseberg in Figure 6.1 (SIT), Figure 6.2 (Upstream) and Figure 6.3 (combined). The same trends are also seen for the other oil types. With upstream injection, dispersant is injected 1000 release diameters (D) before the nozzle (0.5 mm). With a flow rate of 100 ml/min and a nozzle diameter of 0.5 mm this gives a mixing time of 600 milliseconds. With SIT, dispersant is injected only 6 D before the nozzle. This gives a mixing time of 3.6 milliseconds. To illustrate the difference between these two injection techniques, the droplet sizes (d50 µm) as a function of injection distance are presented in Figure 6.12 below. The injection distance was varied from 1000 D (Upstream) to 6 D (SIT).
Figure 6.12: MVD or d50 for volume droplet size distributions as a function of upstream injection distance expressed both in release diameters and milliseconds. Experiments were performed with different dispersant DORs with Oseberg oil. Release conditions: 0.5 mm, 0.10 L/min and Corexit 9500 in the SINTEF MiniTower (from Brandvik et al., 2014d).
0 100 200 300 400 500 600
50
100
150
200
250
300
0 100 200 300 400 500 600 700 800 900 1000
Time from injectionpoint to nozzle (milliseconds)
Oil
drop
let s
izes -
Volu
me
Med
ium
Dia
met
er (V
MD
-µm
)
Distance for injectionpoint to nozzle (nozzle diameters)
DOR: 1:250
DOR: 1:100
DOR: 1:50
Oil alone (reference)
Corexit 9500

PROJECT NO. 10200 4780
REPORT NO. A26541
VERSION Final
38 of 58
6.2 Different turbulence level testing To simulate different release conditions with different turbulence levels, experiments were performed with different oil flow rates (see chapter 3.2 for details). The droplets generated at reduced turbulence were up to several millimetres and too large to be characterised with the LISST 100X (<500 microns). For this reason the droplets where quantified with the LIST-HOLO in these experiments.
Figure 6.13: Low turbulence testing: Relative droplet size distribution (volume %) for Oseberg blend with
three dispersants Corexit 9500, Finasol OSR 52 and Dasic NS. DOR 1:100.
Figure 6.14: Low turbulence testing: Relative droplet size distribution (volume %) for Kobbe with the three
dispersants Corexit 9500, Finasol OSR 52 and Dasic NS. DOR 1:100.
0
10
20
30
40
50
60
Rela
tive
Volu
me
Dist
ribut
ion
(Vol
%)
Droplet Diameter (µm)
Oseberg Oil alone (C9500)
Oseberg Oil alone (OSR-52)
Oseberg Oil alone (Slickgone NS)
Oseberg C9500
Oseberg OSR-52
Oseberg Slickgone NS
0
5
10
15
20
25
30
35
40
Rela
tive
Volu
me
Dist
ribut
ion
(Vol
%)
Droplet Diameter (µm)
Kobbe Oil alone (C9500)
Kobbe Oil alone (OSR-52)
Kobbe Oil alone (Slickgone NS)
Kobbe C9500
Kobbe OSR-52
Kobbe Slickgone NS

PROJECT NO. 10200 4780
REPORT NO. A26541
VERSION Final
39 of 58
Figure 6.15: Low turbulence testing: Relative droplet size distribution (volume %) for Grane with the three
dispersants Corexit 9500, Finasol OSR 52 and Dasic NS. DOR 1:100.
Figure 6.16: Low turbulence testing: Relative droplet size distribution (volume %) for Norne with the three
dispersants Corexit 9500, Finasol OSR 52 and Dasic NS. DOR 1:100.
0
10
20
30
40
50
60
70
Rela
tive
Volu
me
Dist
ribut
ion
(Vol
%)
Droplet Diameter (µm)
Grane Oil alone (C9500)
Grane Oil alone (OSR-52)
Grane Oil alone (Slickgone NS)
Grane C9500
Grane OSR-52
Grane Slickgone NS
0
10
20
30
40
50
60
Rela
tive
Volu
me
Dis
trib
utio
n (V
ol%
)
Droplet Diameter (µm)
Norne Oil alone (C9500)
Norne Oil alone (OSR-52)
Norne Oil alone (Slickgone NS)
Norne C9500
Norne OSR-52
Norne Slickgone NS

PROJECT NO. 10200 4780
REPORT NO. A26541
VERSION Final
40 of 58
6.3 Re-dispersion testing The objective with this part of the project was to study re-dispersion of a surface oil slick containing dispersants after sub-surface dispersant injection. In the case of dispersant injection, most of the oil is expected to be dispersed in the water column, but in some cases thicker surface oil slicks might be formed. This could be caused by;
1. Under-dosage of dispersant, 2. Inefficient dispersant injection, 3. High oil viscosity or 4. Low oil & gas release rates (low turbulence).
All these factors could lead to reduced subsea dispersion effectiveness and formation of large droplets (millimetre range). These large droplets could surface within a limited area and form a thick oil slick with sufficient thickness to emulsify and form a persistent slick with possible long life times at sea. It is important to note that this study of re-dispersion is not aiming towards thin surface oil sheens (<< 1 micro meter), which can be formed even during successful subsea injections due to small surfacing oil droplets (e.g. in a surfacing buoyant plume). These sheens do not have the necessary thickness to emulsify, have a very high degree of natural dispersion and hence a very short lifetime. The experimental procedure is described in section 5.7. In short, this is done by mounting a modified IFP test on top of the MiniTower to disperse a thick surface layer. To create this layer, treated oil is released through a larger nozzle to create mm sized droplets that rise and form a surface oil layer. The droplet size distributions after re-dispersing for ten minutes (operating the beater ring just under the surface) are presented in the next four figures. The effectiveness represented with the amount of oil dispersed into the water column is also calculated. These calculations are based on the amount of oil released and average concentration in the minitower after re-dispersion and homogenisation of the oil concentration in the minitower. Further details are given in section 5.7.

PROJECT NO. 10200 4780
REPORT NO. A26541
VERSION Final
41 of 58
Figure 6.17: Oseberg - Droplet size distribution (ppm) for re-dispersed Oseberg blend after operating the
beater for 10 minutes. Calculated dispersion effectiveness' are also given. Dispersants; C9500, Finasol OSR 52 and Dasic NS (DOR 1:100).
Figure 6.18: Kobbe - Droplet size distribution (ppm) for re-dispersed Kobbe after operating the beater for
10 minutes. Calculated dispersion effectiveness' are also given. Dispersants; C9500, Finasol OSR 52 and Dasic NS (DOR 1:100).
0,0
0,5
1,0
1,5
2,0
2,5
3,0
3,54,
485,
296,
247,
368,
6910
,212
,114
,316
,819
,923
,527
,732
,738
,545
,553
,763
,374
,788
,210
412
214
417
020
123
728
033
139
046
0
Volu
me
Dist
ribut
ion
(ppm
per
bin
)
Droplet Diameter (µm)
OB Redisp C9500
OB Redisp Dasic NS
OB Redisp OSR-52
36 %
62 %
15 %
0,0
0,1
0,1
0,2
0,2
0,3
0,3
0,4
0,4
4,48
5,29
6,24
7,36
8,69
10,2
12,1
14,3
16,8
19,9
23,5
27,7
32,7
38,5
45,5
53,7
63,3
74,7
88,2
104
122
144
170
201
237
280
331
390
460
Volu
me
Dist
ribut
ion
(ppm
per
bin
)
Droplet Diameter (µm)
Kobbe Redsisp C9500
Kobbe Redisp Dasic NS
Kobbe Redisp OSR-5236 %
19 %
19 %

PROJECT NO. 10200 4780
REPORT NO. A26541
VERSION Final
42 of 58
Figure 6.19: Grane - Droplet size distribution (ppm) for re-dispersed Grane after operating the beater for 10
minutes. Calculated dispersion effectiveness' are also given. Dispersants; C9500, Finasol OSR 52 and Dasic NS (DOR 1:100).
Figure 6.20: Norne - Droplet size distribution (ppm) for re-dispersed Norne blend after operating the beater
for 10 minutes. Calculated dispersion effectiveness' are also given. Dispersants; C9500, Finasol OSR 52 and Dasic NS (DOR 1:100).
0,0
0,1
0,1
0,2
0,2
0,3
0,3
0,4
0,44,
485,
296,
247,
368,
6910
,212
,114
,316
,819
,923
,527
,732
,738
,545
,553
,763
,374
,788
,210
412
214
417
020
123
728
033
139
046
0
Volu
me
Dist
ribut
ion
(ppm
per
bin
)
Droplet Diameter (µm)
Grane Redisp C9500
Grane Redisp Dasic NS
Grane Redisp OSR-52
31 %
36 %
57 %
0,0
0,1
0,1
0,2
0,2
0,3
0,3
0,4
0,4
0,5
0,5
4,48
5,29
6,24
7,36
8,69
10,2
12,1
14,3
16,8
19,9
23,5
27,7
32,7
38,5
45,5
53,7
63,3
74,7
88,2
104
122
144
170
201
237
280
331
390
460
Volu
me
Dist
ribut
ion
(ppm
per
bin
)
Droplet Diameter (µm)
Norne Redispersion
Norne Redispersion
Norne Redispersion
<5%<5% <5%
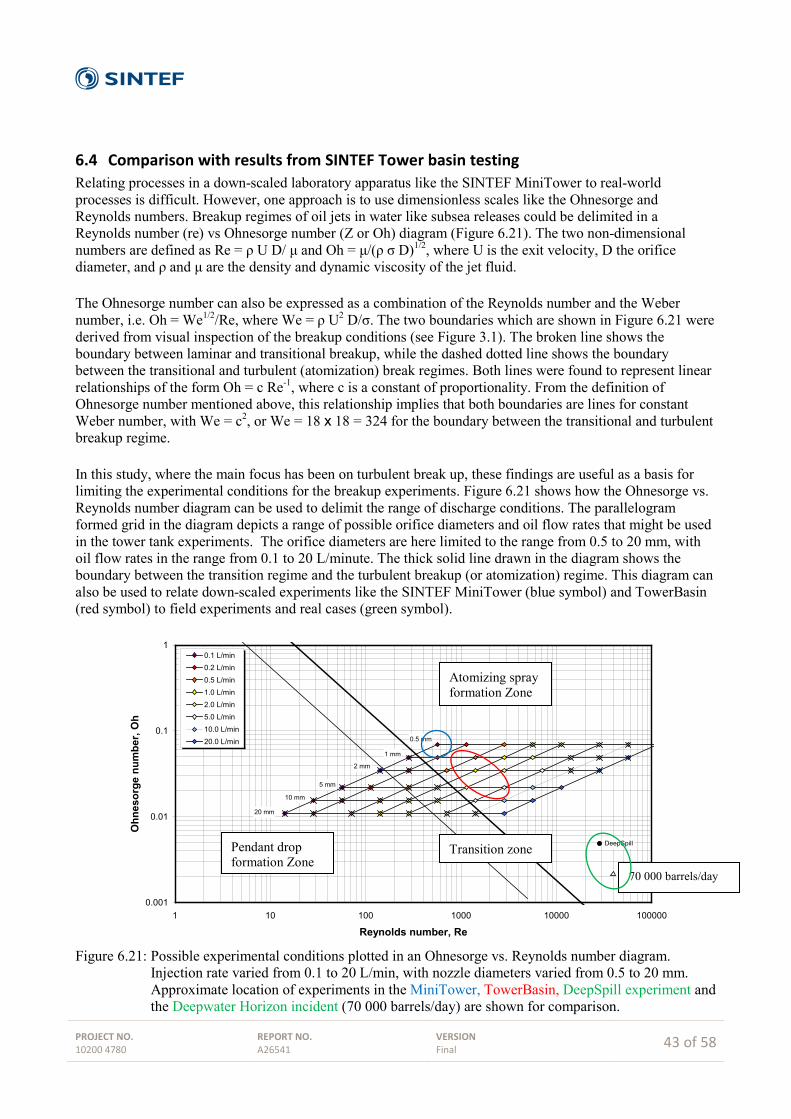
PROJECT NO. 10200 4780
REPORT NO. A26541
VERSION Final
43 of 58
6.4 Comparison with results from SINTEF Tower basin testing Relating processes in a down-scaled laboratory apparatus like the SINTEF MiniTower to real-world processes is difficult. However, one approach is to use dimensionless scales like the Ohnesorge and Reynolds numbers. Breakup regimes of oil jets in water like subsea releases could be delimited in a Reynolds number (re) vs Ohnesorge number (Z or Oh) diagram (Figure 6.21). The two non-dimensional numbers are defined as Re = ρ U D/ μ and Oh = μ/(ρ σ D)1/2, where U is the exit velocity, D the orifice diameter, and ρ and μ are the density and dynamic viscosity of the jet fluid. The Ohnesorge number can also be expressed as a combination of the Reynolds number and the Weber number, i.e. Oh = We1/2/Re, where We = ρ U2 D/σ. The two boundaries which are shown in Figure 6.21 were derived from visual inspection of the breakup conditions (see Figure 3.1). The broken line shows the boundary between laminar and transitional breakup, while the dashed dotted line shows the boundary between the transitional and turbulent (atomization) break regimes. Both lines were found to represent linear relationships of the form Oh = c Re-1, where c is a constant of proportionality. From the definition of Ohnesorge number mentioned above, this relationship implies that both boundaries are lines for constant Weber number, with We = c2, or We = 18 x 18 = 324 for the boundary between the transitional and turbulent breakup regime. In this study, where the main focus has been on turbulent break up, these findings are useful as a basis for limiting the experimental conditions for the breakup experiments. Figure 6.21 shows how the Ohnesorge vs. Reynolds number diagram can be used to delimit the range of discharge conditions. The parallelogram formed grid in the diagram depicts a range of possible orifice diameters and oil flow rates that might be used in the tower tank experiments. The orifice diameters are here limited to the range from 0.5 to 20 mm, with oil flow rates in the range from 0.1 to 20 L/minute. The thick solid line drawn in the diagram shows the boundary between the transition regime and the turbulent breakup (or atomization) regime. This diagram can also be used to relate down-scaled experiments like the SINTEF MiniTower (blue symbol) and TowerBasin (red symbol) to field experiments and real cases (green symbol).
Figure 6.21: Possible experimental conditions plotted in an Ohnesorge vs. Reynolds number diagram.
Injection rate varied from 0.1 to 20 L/min, with nozzle diameters varied from 0.5 to 20 mm. Approximate location of experiments in the MiniTower, TowerBasin, DeepSpill experiment and the Deepwater Horizon incident (70 000 barrels/day) are shown for comparison.
0.5 mm
1 mm
2 mm
5 mm
10 mm
DWH
DeepSpill
20 mm
0.001
0.01
0.1
1
1 10 100 1000 10000 100000
Reynolds number, Re
Ohn
esor
ge n
umbe
r, O
h
0.1 L/min0.2 L/min0.5 L/min1.0 L/min2.0 L/min5.0 L/min10.0 L/min20.0 L/min
Pendant drop formation Zone
Atomizing spray formation Zone
Transition zone
70 000 barrels/day

PROJECT NO. 10200 4780
REPORT NO. A26541
VERSION Final
44 of 58
Figure 6.22: Oseberg - Comparison of droplet size distribution data from MiniTower (80 L) and the larger TowerBasin (42 000 L) for oil alone and at DOR 1:100, dispersants; C9500, Finasol OSR 52 and Dasic NS. SIT was used as the injection method in both cases.
0
2
4
6
8
10
12
14
16
184,
485,
296,
247,
368,
6910
,212
,114
,316
,819
,923
,527
,732
,738
,545
,553
,763
,374
,788
,210
412
214
417
020
123
728
033
139
046
0
Rela
tive
Volu
me
Dis
trib
utio
n (V
ol%
)
Droplet Diameter (µm)
OB Oil alone C9500
OB Oil alone Dasic NS
OB Oil alone OSR-52
OB D100 C9500 SIT
OB D100 Dasic NS SIT
OB D100 OSR-52 SIT
0
2
4
6
8
10
12
4,485,296,247,368,6910,212,114,316,819,923,527,732,738,545,553,763,374,788,2104122144170201237280331390460
OB 1:100 Finasol 52OB 1:100 Dasic NSOB 1:100 Corexit 9500 24.05OB No disp 21.03
Rela
tive
Volu
me
Dist
ribut
ion
(Vol
%)
Droplet Diameter (µm)
MiniTower (80 L)
TowerBasin (42 000 L)

PROJECT NO. 10200 4780
REPORT NO. A26541
VERSION Final
45 of 58
Figure 6.23: Norne- Comparison of droplet size distribution data from MiniTower (80 L) and the larger TowerBasin (42 000 L) for oil alone and at DOR 1:100, dispersants; C9500, Finasol OSR 52 and Dasic NS. SIT was used as the injection method in both cases.
-1
1
3
5
7
9
11
13
154,
485,
296,
247,
368,
6910
,212
,114
,316
,819
,923
,527
,732
,738
,545
,553
,763
,374
,788
,210
412
214
417
020
123
728
033
139
046
0
Rela
tive
Volu
me
Dis
trib
utio
n (V
ol%
)
Droplet Diameter (µm)
Norne Oil alone C9500
Norne Oil alone Dasic NS
Norne Oil alone OSR-52
Norne D100 C9500 SIT
Norne D100 Dasic NS SIT
Norne D100 OSR-52 SIT
0
2
4
6
8
10
12
1 2 3 4 5 6 7 8 9 10 11 12 13 14 15 16 17 18 19 20 21 22 23 24 25 26 27 28 29
Norne 1:100 Dasic NS
Norne 1:100 Corexit 9500
Norne No disp 30.04
Norne 1:100 Finasol 52
Rela
tive
Volu
me
Dist
ribut
ion
(Vol
%)
Droplet Diameter (µm)
MiniTower (80 L)
TowerBasin (42 000 L)

PROJECT NO. 10200 4780
REPORT NO. A26541
VERSION Final
46 of 58
Figure 6.24: Kobbe - Comparison of droplet size distribution data from MiniTower (80 L) and the larger TowerBasin (42 000 L) for oil alone and at DOR 1:100, dispersants; C9500, Finasol OSR 52 and Dasic NS. SIT was used as the injection method in both cases.
0
2
4
6
8
10
12
14
16
18
204,
485,
296,
247,
368,
6910
,212
,114
,316
,819
,923
,527
,732
,738
,545
,553
,763
,374
,788
,210
412
214
417
020
123
728
033
139
046
0
Rela
tive
Volu
me
Dis
trib
utio
n (V
ol%
)
Droplet Diameter (µm)
Kobbe Oil alone C9500
Kobbe Oil alone Dasic NS
Kobbe Oil alone OSR-52
Kobbe D100 C9500 SIT
Kobbe D100 Dasic NS SIT
Kobbe D100 OSR-52 SIT
0
2
4
6
8
10
12
4,485,296,247,368,6910,212,114,316,819,923,527,732,738,545,553,763,374,788,2104122144170201237280331390460
Kobbe 1:100 Finasol 52
Kobbe 1:100 Dasic NS
Kobbe 1:100 Corexit 9500
Kobbe No disp 30.04
Rela
tive
Volu
me
Dist
ribut
ion
(Vol
%)
Droplet Diameter (µm)
MiniTower (80 L)
TowerBasin (42 000 L)

PROJECT NO. 10200 4780
REPORT NO. A26541
VERSION Final
47 of 58
Figure 6.25: Oseberg - Comparison of droplet size distribution data from MiniTower (80 L) and the larger TowerBasin (42 000 L) for oil alone and at DOR 1:100, dispersants; C9500, Finasol OSR 52 and Dasic NS. SIT was used as the injection method in both cases.
0
2
4
6
8
10
12
14
16
18
204,
485,
296,
247,
368,
6910
,212
,114
,316
,819
,923
,527
,732
,738
,545
,553
,763
,374
,788
,210
412
214
417
020
123
728
033
139
046
0
Rela
tive
Volu
me
Dis
trib
utio
n (V
ol%
)
Droplet Diameter (µm)
Grane Oil alone C9500
Grane Oil alone Dasic NS
Grane Oil alone OSR-52
Grane D100 C9500 SIT
Grane D100 Dasic NS SIT
Grane D100 OSR-52 SIT
0
1
2
3
4
5
6
7
8
9
10
4,485,296,247,368,6910,212,114,316,819,923,527,732,738,545,553,763,374,788,2104122144170201237280331390460
Grane 1:100 Finasol 52
Grane 1:100 Dasic NS
Grane 1:100 Corexit 9500
Grane No disp 24.05 (1.2 L/min)
Rela
tive
Volu
me
Dist
ribut
ion
(Vol
%)
Droplet Diameter (µm)
MiniTower (80 L)
TowerBasin (42 000 L)

PROJECT NO. 10200 4780
REPORT NO. A26541
VERSION Final
48 of 58
6.5 Using SINTEF MiniTower for subsea dispersant screening Oil companies operating in Norway have already requested screening studies to rank possible surfactants for subsea injection. SINTEF has used the MiniTower for several such studies (0.5 mm nozzle, 0.1 L/min flow and SIT injection). The following figures are from a study for Wintershall Norge AS (Andersen et al., 2013).
Figure 6.26: Example of screening testing of the Marte oil for Wintershall Norge (Andersen et al., 2013) as a
function of DORs (1:1000 - 1:50) with A: Relative droplet size distribution (volume %) for oil alone and dispersant injection (Finasol OSR 52 and SIT injection). B: Summary of dispersant injection effectiveness for four dispersants presented as relative shift in d50 (1 – (d50(reference) – d50(treated oil))/d50(reference)).
0,0
2,0
4,0
6,0
8,0
10,0
12,0
14,0
16,0
5,29
6,24
7,36
8,69
10,2
12,1
14,3
16,8
19,9
23,5
27,7
32,7
38,5
45,5
53,7
63,3
74,7
88,2
104
128
157
186
219
259
293
332
391
462Re
lativ
e Vo
lum
e Di
strib
utio
n
Droplet size (µm)
oil only
1:1000
1:500
1:250
1:100
1:50
0,0
0,1
0,2
0,3
0,4
0,5
0,6
0,7
0,8
0,9
1,0oil only 1:1000 1:500 1:250 1:100 1:50
Rela
tive
shift
in M
ean
Volu
me
Diam
eter
Dispersant to oil ratio
Corexit 9500
Dasic NS
Finasol OSR 52
Superdispersant 25
Effectiveness vs.
dosage
Effectiveness vs. dosage &
dispersant type

PROJECT NO. 10200 4780
REPORT NO. A26541
VERSION Final
49 of 58
Figure 6.27: Comparison of dispersant ranking from screening testing. A: Subsea injection (MiniTower, SIT
injection) and B: Standard dispersant testing for surface application (IFP testing) with the Marte oil for Wintershall Norge (Andersen et al., 2013).
0
10
20
30
40
50
60
70
80
90
100
Corexit 9500 Dasic NS Finasol OSR-62 Superdispersant 25
Disp
ersa
nt e
ffect
iven
ess (
IFP%
)
Dispersant products
2
1
4
3

PROJECT NO. 10200 4780
REPORT NO. A26541
VERSION Final
50 of 58
7 Discussion The discussions of the results presented in the previous chapter are divided into the following subchapters:
7.1 General design SINTEF has for the last years performed several studies for individual oil companies and for API studying oil droplet sizes from subsea releases as a function of oil properties, release conditions (nozzle sizes and flow rates) and dispersant injection (injection techniques, dispersant types and dosage). Results from these studies are available as publications (Brandvik et al., 2013, Johansen et al., 2013 and Brandvik et al., 2014a) and project reports (API Phase-I: Brandvik et al., 2014b and API Phase-II: Brandvik et al., 2014c). Most of these studies are performed in the SINTEF Tower Basin, which is six meters high and contains 42 000 Litres of natural sea water, but others are based on work performed in the MiniTower (Andersen, 2013). The idea and design behind the SINTEF MiniTower (80 Litres) are based on the experience of these previous studies. The most important single feature or improvement is probably that the MiniTower can be operated continuously. Due to the down-scaled dimensions, a continuous flow of natural sea water (5-100 Litres/min) can be maintained as long it is needed (5-60 minutes). This continuous flow of water is used to flush out oil, prevent increased oil concentration and increase operational time. This feature makes it possible to monitor droplet sizes in a continuous rising plume of oil and water. Being able to monitor droplet sizes in a continuous plume of oil and water is important since the initial phase of the release usually is needed to establish a constant/stable flow of oil (1-5 seconds) and building up a constant plume of oil and entrained water (5-10 seconds). To reduce uncertainty from this initial phase, droplet size monitoring is initiated 30 seconds after the oil release is started or one of the settings (oil type, dispersant or dosage) is changed. The continuous release and flow-through system of sea water enable in-situ monitoring of droplet sizes in a fully developed plume of oil and water. A LISST system (100X or HOLO) is inserted directly into the rising plume of oil. This in-situ approach eliminates possible changes of droplets due to sampling or transfer of these unstable dispersions for external quantification.
7.2 Testing of Settling and coalescence Initial testing and theoretic considerations quickly revealed that the short rising times in this bench-scale apparatus were not suited for studying coalescence for untreated and treated oil droplets. Earlier work in the TowerBasin, has showed that coalescence of rising droplets is very limited even with a 6 meter height and a rising time larger than 30 seconds (API Phase-II report, Brandvik et al., 2014c). After discussions with IPIECA, SINTEF has for this reason delivered a project proposal for using a modified system where coalescence can be studied as a function of turbulence level, oil properties and dispersant treatment. For this reason, coalescence is not further discussed in this study.
7.2.1 Injection techniques for dispersants Two different injection techniques are used in this study. Upstream injection, initially meant to simulate premixed dispersant, where the dispersant is injected into the oil line under turbulent conditions to optimize mixing before the oil reach the release nozzle. In this case, the dispersant is injected 1000 release diameters or 600 milliseconds before the nozzle. With Simulated Insertion Tool (SIT) dispersant is injected close to the nozzle to simulate an injection tool being inserted into the open orifice releasing the oil. In this study, the dispersant is injected 6 release diameters or 4 milliseconds before the nozzle. When comparing the results from these two injection methods we observe a general trend that both the effectiveness and the ability to differentiate between the different dispersants are significantly better for SIT
PROJECT NO. 10200 4780
REPORT NO. A26541
VERSION Final
51 of 58
compared to upstream injection. This reduced effectiveness for upstream injection can be observed in Figure 6.12 where d50 is presented as a function of dispersant mixing ranging from 600 milliseconds (Upstream injection) to 4 milliseconds (SIT). This dependency of mixing time could probably be explained with the behaviour of the surfactants in the oil phase. The type of surfactants used in these dispersants form micelles or aggregates in non-polar solvent like mineral oil. The long mixing times with the upstream injection enable the surfactants to form such aggregates reducing the concentration of active monomers in the oil. The rate constant for micelle formation is mainly diffusion controlled and depends little on surfactant properties and micelle size, while the rate constant for increasing the concentration of active monomers is strongly dependant on surfactant and micelle properties like chain lengths, polarity and micelle size. Earlier experimental studies have shown that the rate of micelle disintegration could be in the millisecond range. The time available for the surfactants to influence droplet formation after the oil is released is very limited only a few milliseconds in the turbulent jet up to 10-15 release diameters after the nozzle. The trends in Figure 6.12 show clearly that injecting the dispersant as close as possible to the nozzle is beneficial, probably due to reduced aggregate formation and higher concentrations of active surfactants in the released oil. This tendency of forming aggregates, and their disintegration rate, will be different for the various surfactant types used in the dispersant (e.g. sorbitanesters, etoxylated sorbitanesters and AOT). This could probable change the relative composition of the active surfactants in the oil phase and change/reduce the effectiveness. More details regarding surfactant behaviour and injection techniques are available in Brandvik et al., 2014d.
7.3 Testing of dispersant effectiveness as a function of oil type, dispersant and dosage The four oil types selected for this study span out a large variation in oil properties. From the paraffinic Oseberg, via the light condensate Kobbe, the asphaltenic Grane to the very waxy Norne blend. The span in properties (especially pour point, viscosity and density) is important to show both the potential and limitations in the proposed design.
7.3.1 Oil type Oseberg blend forms droplets in the 300 micron range for untreated oil and droplets 88-144 micron range for treated oil (Corexit 9500, DOR 1:250 - 1:50). No operational problems were observed during the testing with this paraffinic oil. The Kobbe condensate showed the same tendency as Oseberg with slightly smaller droplets for both untreated and treated oil, mainly due to the lower viscosity. No operational problems were observed with this oil. The asphaltenic Grane showed a different behaviour due to its increased viscosity. The droplets sizes are generally larger, especially for the treated oil, due to the increased viscosity. However, an increase in smaller droplets is observed resulting in a broader distribution of the treated oil. The Waxy Norne blend with a pour point of 21 ºC was the most challenging of the tested oils. The cold water in the apparatus (8-10 ºC) caused the oil to semi-solidify during the release resulting in plume consisting of a mixture of larger oil "lumps" and smaller droplets as shown in Figure 5.2. The performed testing with Norne gave for this reason results that were difficult to interpret.
7.3.2 Dispersant type Three different dispersant were tested, Corexit 9500, Dasic NS and Finasol OSR 52. They are all approved for use in many countries, stored in large quantities and implemented in operational oil spill contingency.

PROJECT NO. 10200 4780
REPORT NO. A26541
VERSION Final
52 of 58
Their effectiveness with the four oil types are presented as graphs (droplet size distributions), tables (Median volume diameters) and bar charts illustrating the d50 as a function of dosage. The presented results from the MiniTower testing show that this approach is capable of differentiating between the three products when SIT is used as the injection method. The differences are not very large and a statistical analysis of the significance level was not performed. However, the general trend is that C9500 is slightly more effective than OSR-52, which is slightly better than Dasic NS. Using upstream injection, the difference between the dispersants was smaller, less systematic and it was not possible to identify any trend regarding dispersant screening.
7.4 Testing of effectiveness at reduced turbulence To show the span in turbulence level available with the proposed design, a series of experiments with a reduced level of turbulence was performed (see section 5.5 for details). These experiments gave generally large droplets, several millimetres for untreated oil and several hundred microns for treated oil. These droplet sizes are outside the range for the laser scattering instrument (LISST-100X), so a holographic approach was used to quantify the droplets (LISST HOLO). The size distributions are presented for all four oil types with the three dispersants in Figure 6.13 to Figure 6.16. The main difference, compared to the high turbulence experiments discussed above, are the larger variation in untreated replicates and the lack of differentiation between the three dispersants. The main reason for these deviations from the high turbulence experiments is probably the lower number of droplets recorded during the low turbulence experiments. The experimental period was enlarged from 30 seconds to 5 minutes to collect more data (observe/quantify more droplets), but this was probably not sufficient to observe similar trends as seen with the high turbulence experiments.
7.5 Testing of re-dispersion of surfaced treated oil The main objective with the re-dispersion experiments is to simulate formation of a surface oil slick resulting from a subsea release that is treated with dispersant injected into the release. The effectiveness of the dispersant injection could be low (resulting in large droplets rising to the surface) due to oil properties, inefficient dispersant injection or too low of a dispersant dosage. Incorporating an IFP beater mechanism into the MiniTower design was intended as more representative than removing an aliquot of the surface oil to a standard dispersant effectiveness test like the IFP or similar test. The results in Figure 6.17, Figure 6.18, Figure 6.19 and Figure 6.20 show different effectiveness for different oil and dispersant combinations. We know from earlier studies that premixed fresh oils are very dispersible and this design should generally give high dispersant effectiveness. The selected approach with operating the beater for only 10 minutes, were generally too short to observe such a high dispersant effectiveness and significant differences between the oil-dispersant combinations. The observed differences are probably reflecting differences in dispersion kinetics. If the beater had been operated for a longer period, e.g. for 2 hours (like in the original IFP test), we expect the effectiveness for all dispersant to be very high. The only significant result was that the waxy Norne solidified on the surface and showed no surface dispersibility.

PROJECT NO. 10200 4780
REPORT NO. A26541
VERSION Final
53 of 58
7.6 Comparison with large-scale results One of the advantages of selecting such a scalable design (continuous turbulent jet) is the ability to compare such experiment at different scales. Figure 6.21 shows the relationship between experiments in the MiniTower (0.5 mm nozzle - 80 L), TowerBasin (1-10 mm, 42 000 L) and the DeepSpill experiment in 2000 (120 mm, 940 meters depth) and the DWH incident in 2010 (300 mm and 1500 depth). To compare the ability to screen dispersants (C9500, OSR-52 and Dasic NS), droplets size distributions from the MiniTower and Tower Basin are compared for the four different oil types as presented in Figure 6.22 to Figure 6.25. The trends in discriminating between the three dispersants are not completely identical, but for most of the experiments, the sequence of dispersants is C9500, OSR-52 and Dasic NS (in order of decreasing effectiveness) for both test systems.
7.7 Example of using the MiniTower for operational dispersant screening Oil companies implementing subsea injection of dispersants in their oil spill contingency need to screen dispersants to compare effectiveness and possible dosages. This is similar to established procedures for use of dispersant on surface oil slicks. SINTEF has used the basic facilities of the MiniTower to perform such dispersant screening in several occasions. One possible way of calculating expected effectiveness of different products as a function of dosage is presented in Figure 6.26. We find the figure presenting relative reduction in droplet sizes for different products as a function of dosage most informative (Figure 6.26B). The figure shows that three products reduce VMD or d50 to 25% of the original size (C9500, OSR-52 and Superdispersant 25). However, C9500 and OSR-52 were more effective at low dosages and Dasic NS has generally a lower effectiveness on this oil type. Figure 6.27 shows the difference between ranking based on Subsea injection testing (MiniTower-SIT) and surface testing (IFP%) and the ranking of the products are significantly different. These differences are expected since applying a dispersant on weathered emulsified surface oil is more challenging (penetrating into, breaking emulsion and then dispersing the oil) compared to being injected directly into the fresh oil at relatively high turbulent conditions. The first should be more challenging for the surfactant mixture and solvent package in the dispersant compared to the latter case.

PROJECT NO. 10200 4780
REPORT NO. A26541
VERSION Final
54 of 58
8 Conclusions This bench-scale testing is based on down-scaled experiments and the droplet sizes are a function of the experimental conditions (nozzle sizes, flow rates and oil/dispersant properties). Interpretations of absolute droplet sizes (larger/smaller than 100 µm etc.) will only be valid for this apparatus and the specific conditions used. However, up-scaling of the obtained droplet sizes to a larger experimental facility (SINTEF Towerbasin) or real field conditions is possible trough modelling, for example using modified Weber scaling (Johansen et al., 2013). General design
• A realistic turbulence regime (turbulent jet break up) is important when studying fundamental processes regarding subsea releases of oil.
• The turbulence level must be characterised based on established physical principles, in this case a turbulent jet of oil in water.
• The effectiveness of dispersant injection should be based on the shift in droplets sizes compared to untreated oil (quantified by MVD or d50)
• Monitoring droplet sizes on a continuous release of oil is important since; the first 1-5 seconds are used to ramp up the flow and establish a stable oil flux and the next 5-15 seconds are used to establish a reproducible rising plume of oil & water.
• Droplet sizes are monitored 30 seconds after start-up when equilibrium is established with a stable rising plume of oil & water.
• A flow-through system of natural sea water enables operating over a large range of optical densities (concentration and droplets sizes).
Injection techniques
• Dispersant should be injected in a reproducible and realistic manner into the oil flow as close as possible to the nozzle.
• Simulated Insertion Tool (SIT) is recommended due to its simplicity, reproducibility and realism. • SIT was used during the DWH and is implemented as a part of operational subsea injection systems,
e.g. the SWRP system. • Upstream injection should be avoided since surfactant aggregates formed in the oil lower
concentrations of monomer surfactants and reduce dispersant effectiveness. Dispersant dosage
• Dispersant dosage is of large operational importance since availability and supply of dispersants could be a limiting factor in a large-scale blow-out situation. Dosage is varied (DOR 1.1000 to 1:25) to illustrate differences in performance between different dispersants.
Quantification of effectiveness • Droplet sizes are measured in-situ in the plume to avoid bias in droplet sizes due sampling and
external droplet quantification. • Droplet sizes should be averaged over a certain period with stable conditions (continuous plume). 30
seconds with the LISST 100X gives 300 individual measurements over 32 bin sizes (2 – 500 microns).

PROJECT NO. 10200 4780
REPORT NO. A26541
VERSION Final
55 of 58
Oil types • Testing should preferably be done on the actual oil type(s) that could potentially be released. If they
are not available, surrogate oil with similar properties could be used. • Oils with high viscosities (> 200 cSt/shear rate 10 s-1 at 10 ºC) and high pour point (10-15 ºC above
test temperature) could be an operative challenge for this proposed design. • Testing with high wax/pour point oils can be performed in the meso-scale SINTEF TowerBasin (6 m
water height).
Scaling • Results obtained with the suggested design can be compared and up-scaled to realistic conditions
using algorithms in existing operational models (Johansen et al., 2013).

PROJECT NO. 10200 4780
REPORT NO. A26541
VERSION Final
56 of 58
9 Recommendations for further work Developing a standardised bench-scale effectiveness test for subsea dispersant injection was the main objective for this study. Based on the obtained results the following recommendations are given for further work:
1. The design proposed and documented in this study satisfy the main criteria for a bench-scale effectiveness test for subsea dispersant injection:
a. Realistic dispersant injection b. Realistic turbulence level and droplet formation c. Scalable to meso-scale laboratory tests, large-scale field experiments and real cases. d. Measurement in a realistic continuous rising plume e. Averaging droplet sizes over 30 seconds reduce experimental variation e.g due to
inhomogeneity in the turbulent plume and improve statistical significance and should be used as the basis for a new standardised effectiveness test.
2. Studies of droplet settling and coalescence are very difficult with the suggested bench-scale design
due to the limited height and rising time. For this reason, it is not recommended to include measurements of droplet coalescence in the proposed test. SINTEF has for this reason and on request from IPIECA, delivered an additional project proposal (no: 12004780 of 7. Oct. 2013) to study possible coalescence in more detail in a modified apparatus.
3. The re-dispersion option offers little operationally significant information (premixed fresh oils are
generally very dispersible). The formation of surface slicks is not very realistic in this apparatus (very short rising time (5-10 seconds), large droplets, and very limited leakage of water soluble component or surfactants from the rising droplets). For this reason, it is not recommended to include measurements of re-dispersion in the proposed test.
4. Some heating capacity for the oil could be added to reduce operational challenges from high oil
viscosity and waxy oils with high pour point. The tubing and nozzle inside the MiniTower should also be isolated to avoid heat loss to the water. An alternative option could be to standardise heating and use an oil injection temperature of 60 ºC as standard.
5. The existing procedure to quantify droplets for low turbulence testing using the LISST HOLO
(0.5 image per second) has limited ability to differentiate between the different dispersants. This is probably due to the low number of droplets per size bin (too noisy data). Another monitoring strategy should be selected to improve droplets statistics for example using a silhouette camera acquiring 50-100 images per second.

PROJECT NO. 10200 4780
REPORT NO. A26541
VERSION Final
57 of 58
10 Literature Andrews, S., Nover, D. and Schladow, S.G., 2010: Using laser diffraction data to obtain accurate particle
size distributions: the role of particle composition. Limnol. Oceanogr.: Methods 8, 2010, 507–526. Brandvik, P.J., Johansen, Ø., Leirvik, F., Farooq, U., and Daling, P.S. 2013. Droplet breakup in sub-surface
oil releases – Part 1: Experimental study of droplet breakup and effectiveness of dispersant injection. Mar. Pollut. Bull. 2013 Volume 73, Issue 1, 15 2013, pp. 319-326.
Brandvik, P.J., Johansen, Ø. and Farooq, 2014a: Sub-surface oil releases – Experimental study of droplet distributions and different dispersant injection techniques. A scaled experimental approach using the SINTEF Tower basin. SINTEF report no: A24447. Trondheim Norway 2014. ISBN: 9788214055405.
Brandvik, P.J., Johansen, Ø., Farooq, U., Angell G., and Leirvik, F. 2014b: Subsea release of oil & gas – a downscaled laboratory study focused on initial droplet formation and the effect of dispersant injection. In proceedings from the International Oil Spill Conference, Savannah, USA, 2014.
Brandvik, P.J., Johansen, Ø., Farooq, U., Davies, E. Leirvik, F. and Krause, D. 2014c: Subsurface oil releases – Experimental study of droplet size distributions Phase-II. A scaled experimental approach using the SINTEF Tower basin. Phase-II Draft SINTEF report no: 102001616. Trondheim Norway 2014.
Brandvik, P.J., Johansen, Ø., Leirvik, F., Krause, D. and Daling, P.S. 2014d: Subsea injection of dispersants, effectiveness of different dispersant injection techniques – An experimental approach (In preparation).
Hinze, J.O., 1955. Fundamentals of the hydrodynamic mechanism of splitting in dispersion processes. A.I.Ch.E. Journal, 1, 289-295.
Hu S, R.C. Kintner, 1955. The fall of single liquid drops through water. A.I.C.E Journal vol. 1, pp. 42-48. Johansen, Ø., 2003. Development and verification of deep-water blowout models. Marine Pollution Bulletin,
47, 360-368. Johansen, Ø., Rye H. and Cooper C., 2003. Deep Spill – Field Study of a simulated oil and gas blow-out in
deep water. Spill Science & technology Bulletin, 8, 433-443. Johansen, Ø., Brandvik, P.J., and Farooq, U. 2013. Droplet breakup in sub-surface oil releases – Part 2:
Predictions of droplet size distributions with and without injection of chemical dispersants. Mar. Pollut. Bull. 2013 Volume 73, Issue 1, 15 2013, pp. 327-335.
Karp-Boss, L., Azevedo, L. and Boss, E. 2007: LISST-100 measurements of phytoplankton size distribution: Evaluation of the effects of cell shape. Limnol. Oceanogr.: Methods 5, 2007, 396–406.
Masutani, S.M. and E.E. Adams, 2000: Experimental study of multiphase plumes and application to deep ocean oil spills. Final report to the U.S. Department of Interior, Minerals Management Service, contract No. 1435-01-98-CT-30946.
Mikkelsen, O.A., Milligan, T.G., Hill, P.S., Chant, R.J., Jago, C.F., Jones, S.E., Krivtsov, V. and Mitchelson-Jacob, G. 2008: The influence of schlieren on in situ optical measurements used for particle characterization. Limnol. Oceanogr.: Methods 6, 2008, 133–143.
Neto, I.E.L, Zhu, D.Z., and Rajaratnam, N., 2008: Bubbly jets in stagnant water. International Journal of Multiphase Flow. 34, 1130-1141.
Tang L., and S.M. Masutani, 2003: Laminar and Turbulent Flow Liquid-liquid Jet Instability and Breakup. Proceedings of the Thirteenth International Offshore and Polar Engineering Conference, Honolulu, Hawaii, USA, pp. 317-324.

Technology for a better society www.sintef.no