Final Report - DAV 11677 - VRO | Agriculture...
44
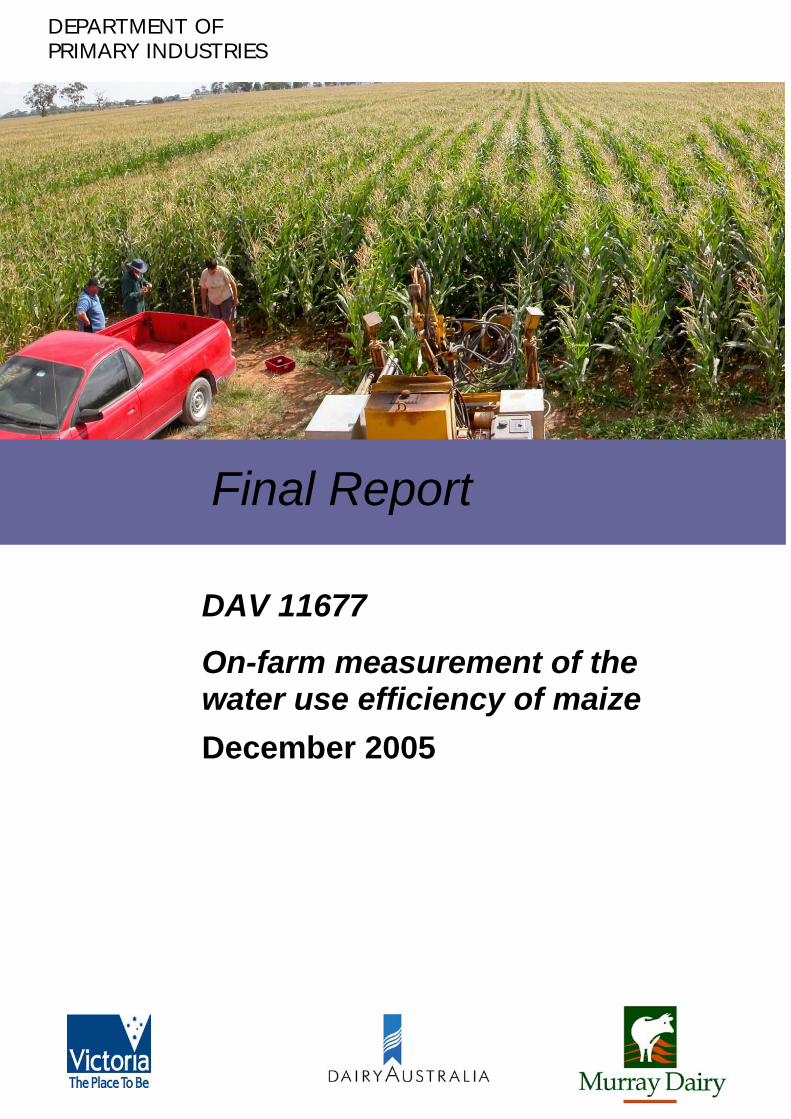
DEPARTMENT OF PRIMARY INDUSTRIES DAV 11677 On-farm measurement of the water use efficiency of maize December 2005 Final Report
Transcript of Final Report - DAV 11677 - VRO | Agriculture...
DEPARTMENT OFPRIMARY INDUSTRIES
DAV 11677
On-farm measurement of thewater use efficiency of maizeDecember 2005
Final Report

Final ReportOn-farm measurement of thewater use efficiency of maize
Final report to Dairy Australiaon DAV 11677
Kerry Greenwood, Geoff Mundy,and Kevin Kelly
Department of Primary Industries, Kyabram
December 2005

Published by the Victorian Government Department of Primary Industries
Melbourne, (December, 2005)
© The State of Victoria Department of Primary Industries 2005
This publication is copyright. No part may be reproduced by any process except in accordance withthe provisions of the Copyright Act 1968.
Authorised by the Victorian Government, 120 Cooma Road, Kyabram, Victoria 3620.
Printed by Department of Primary Industries, 120 Cooma Road, Kyabram, Victoria 3620.
For more information contact: Kerry Greenwood at DPI Kyabram on (03) 5852 0500 or [email protected]
CONTENTS
Executive summary................................................................................................................................ i
Introduction............................................................................................................................................i
The research .........................................................................................................................................i
Project milestones ............................................................................................................................... iii
Achievement of objectives................................................................................................................... iii
Industry implications ............................................................................................................................iv
Future research ....................................................................................................................................v
Intellectual property .............................................................................................................................vi
Communication....................................................................................................................................vi
Recommendations...............................................................................................................................vi
Acknowledgments ...............................................................................................................................vi
Introduction............................................................................................................................................ 1
Methodology .......................................................................................................................................... 2
Crop location and management .......................................................................................................... 2
Monitoring design ................................................................................................................................ 4
Climatic data........................................................................................................................................ 4
Crop measurements ............................................................................................................................ 4
Soil chemical analyses ........................................................................................................................ 5
Water use measurements ................................................................................................................... 6
Water use efficiency calculations ........................................................................................................ 9
Statistical analyses ...............................................................................................................................9
Results.................................................................................................................................................. 10
Soil chemical properties .................................................................................................................... 10
Crop growth and yield ....................................................................................................................... 11
Irrigation management....................................................................................................................... 13
Water use .......................................................................................................................................... 15
Water use efficiency .......................................................................................................................... 23
MaizeMan .......................................................................................................................................... 24
Discussion ........................................................................................................................................... 25
Soil chemistry .................................................................................................................................... 25
Growth and DM production ............................................................................................................... 25
Water use and irrigation scheduling.................................................................................................. 26
Water use efficiency .......................................................................................................................... 27
Conclusions ......................................................................................................................................... 28
References ........................................................................................................................................... 28

Final Report on DAV 11677—December 2005 i
Executive summary
Introduction
The DAV 11677 project commenced in November 2003, as a 2 year project, jointly funded by Murray
Dairy, through Dairy Australia, and the Department of Primary Industries (Victoria). Contracts for the
project were finalised in May 2004.
On-farm measurement of the water use efficiency of maize (defined as the dry matter produced per
unit water use as rainfall plus irrigation plus change in soil water content) was one area of potential
research highlighted in a review of opportunities to improve the water use efficiency of irrigated
forages for dairying in northern Victoria (Greenwood 2003). Another area of research highlighted in
the review—measurement of the water use efficiency of a range of perennial and annual forages—is
currently being undertaken by researchers at the Department of Primary Industries at Kyabram. This
second area of work is funded by a State Government Initiative.
This research was undertaken because maize, as a C4 species, is likely to have a much higher water
use efficiency than many other forages suitable for dairying in northern Victoria. However, there have
been no actual measurements made of the water use of maize in this environment (Greenwood 2003).
Also, with some farmers irrigating maize using pressurised systems, such as centre pivots, information
on the crop’s water requirements in relation to weather conditions would be useful to assist irrigation
scheduling.
The research
This research aimed to measure components of the water balance under 3 commercial maize crops
grown for silage. The Spray 1 crop was grown using centre pivot irrigation in 2003/04 and the Spray 2
crop was grown at the same site in 2004/05. The Flood crop was irrigated using the border check
system in 2004/05. The farmers were experienced maize growers and undertook all the management
of the crop.
Routine monitoring of the growth and water use of each crop was undertaken at 6 sites within each
crop. In addition, the irrigation water applied to the whole crop was measured, and local weather
conditions were recorded by an automatic weather station adjacent to each crop.
The yields, water use and water use efficiency of each crop are presented in Table I. The crop yields
were considered above average for the district. Total water use by each crop was within the range
expected for maize, under the prevailing weather conditions.
ii Final Report on DAV 11677—December 2005
Table I. Yield, water use and water use efficiency of the monitored crops.
Spray 1 Spray 2 Flood
Irrigation method Centre pivot Centre pivot Border check
Year 2003/04 2004/05 2004/05
Potentialevapotranspiration duringcrop growth (mm)
768 742 656
Yield (t DM/ha) 22 22 19
Irrigation applied (mm) 660 380 470
Total water use (irrigation,rainfall plus change in soilwater content)
762 650 640
Water use efficiency (kgDM/ha.mm)
29 34 29
Water use efficiency (kgDM/ha.mm irrigation only)
33 58 40
The large differences in water use between the crops can be attributed to different weather conditions,
different sowing dates and crop varieties, losses due to drainage below the rootzone and runoff, and
differing amounts of water stress imposed by the irrigation management. Note that the between-crop
variability in water use efficiency, calculated using total water use, is much less than that calculated
using irrigation water applied.
Modelling of crop evapotranspiration using FAO 56 (Allen et al. 1998) was used to estimate crop
evapotranspiration, crop transpiration and direct evaporation from the soil surface. These estimates
are shown in Table II. Comparison of the estimated with the actual measured increase in soil water
content indicated that the assumptions in the model were appropriate to local conditions. Further
comparison of modelled soil water deficits with measured soil water deficits also indicated that the
model was working satisfactorily.
We conclude from this research that the FAO 56 model, including crop coefficients with adjustments
as described by Allen et al. (1998), can be used for predicting maize water use and scheduling
irrigation of maize crops in northern Victoria. We also conclude that maize has a high water use
efficiency of about 30 kg DM/ha.mm, but this water use efficiency will vary depending on climatic
factors and yeild. The irrigation water requirements of maize can be quite variable depending mainly
on the amount of rainfall and evaporation during crop growth.
Final Report on DAV 11677—December 2005 iii
Table II. Modelled components of the water balance.
Spray 1 Spray 2 Flood
Monitoring period 21/11/03–20/4/04 15/11/04–23/3/05 16/11/04–17/4/05Potential evapotranspiration during monitoringperiod
868 756 761
Pre-sowing irrigation + rainfall (net) (mm) 96 0 80Rainfall (mm) 56 234 173Irrigation (mm) 630 379 388Estimated water losses including drainagebelow rootzone and runoff from rainfall (mm)
0 122 51
Evaporation (mm) 288 198 184Transpiration (mm) 477 351 399
Evapotranspiration (mm) 765 549 583Estimated increase in soil water content (mm) 17 -58 7
Actual increase in soil water content (mm) 19 -40 1
Market research undertaken by Ambrosio and Linehan (2005) indicated that use of alternative forages
(including maize) on dairy farms in the Shepparton Irrigation Region fell into 2 main segments:
(i) predominantly perennial pasture-based enterprises and (ii) “larger” enterprises including forage
crops. Most farmers in the latter segment were originally pasture-based, and changed their feedbase in
response to factors such as increased farm size and greater requirements for brought-in feed. The
market research indicated that, as there is a trend for dairy farms and cow numbers to increase in size,
more dairy farmers will use alternative forages (i.e. forages other than perennial ryegrass/white clover)
in the future. To assist with their decision, these farmers will primarily require objective information
on yield and nutritive value. While saving water was an issue, it was not the primary driver for
change.
Project milestonesGreenwood K, Mundy G, Kelly K (2004) On-farm measurement of the water use efficiency of maize.
Milestone report for DAV 11677. (Department of Primary Industries: Kyabram).
Greenwood K, Mundy G, Kelly K (2005) On-farm measurement of the water use efficiency of maize.
Final report for DAV 11677. (Department of Primary Industries: Kyabram).
Achievement of objectives
Objective 1. Quantification of the water use efficiency of maize at a paddock scale.
Outcome: The water use efficiency of maize, in this study, ranged between 33 and 58 kg DM/ha.mm
for irrigation water use, and 29 and 34 kg DM/ha.mm for total water use. The large variation in
irrigation water use was due to the large differences in rainfall between crop growing seasons.
iv Final Report on DAV 11677—December 2005
Amounts of rainfall, irrigation, evaporation, transpiration and other components of the water balance
are shown above in Table II.
Objective 2. Relationships between maize water use, crop growth stages and weather conditions.
Outcome: Maize water use was modelled using the dual crop coefficient approach of FAO 56 (Allen
et al. 1998). Comparison with measured soil water deficits indicated that the model adequately
predicted crop water use. Water use by a maize crop can potentially be greater than the reference crop
evapotranspiration, measured using the modified Penman-Monteith method (Allen et al. 1998).
However, for the 3 monitored crops, the actual evapotranspiration, based on our modelling, was less
than reference crop evapotranspiration (see Figure 4 in the main body of the report). During the initial
stage of the crop, until about 60 days after sowing, evaporation from the soil surface is greater than
transpiration. After this time, most water use is via crop transpiration. During the mid-season stages
of the crop, water use was greater than reference crop evapotranspiration. Water use declined slightly
as the crop approached maturity.
Objective 3. Crop coefficients for maize, at different growth stages, in the Goulburn and Murray
valleys.
Outcome: Standard basal crop coefficients for maize are tabulated by Allen et al. (1998). Due to the
height of maize crops, and the low relative humidity often experienced in the Goulburn and Murray
valleys, slightly higher crop coefficients are applicable in this environment (Table III).
Table III. Basal crop coefficients used to estimate evapotranspiration for each crop. The standard
crop coefficients were increased for the monitored crops due to the height of the maize crop and lower
mid-season minimum relative humidity (Allen et al. 1998).
Season Standard Spray 1 Spray 2 Flood
Initial 0.15 0.15 0.15 0.15Mid 1.15 1.24 1.19 1.19End 0.50 0.59 0.54 0.54
For typical summers in the Goulburn and Murray valleys, the crop coefficients used for the Spray 1
crop would be most appropriate. For relatively cooler, wet summers, as experienced in 2004/05, the
lower crop coefficients used for the Spray 2 and Flood crops would be more appropriate.
Industry implications
This research has shown that the water requirements of maize in the Goulburn and Murray valleys can
vary between 550–800 mm (5.5–8.0 ML/ha), with the lower water use only occurring in very “cool”
summers. Irrigation water requirements will be lower than the crop’s total water requirements,
Final Report on DAV 11677—December 2005 v
depending on rainfall during the crop’s growth. Assuming a water requirement of 750 mm and
average rainfall of 100 mm, then typical irrigation water requirements would be about 650 mm.
Crop water requirements can be predicted using the dual crop coefficient procedure described in FAO
56 (Allen et al. 1998). This procedure may be useful for farmers, using centre pivots or other
pressurised irrigation systems, to schedule their irrigation of maize. This procedure may be easier, and
more reliable, than scheduling based on soil water content. However, as it takes considerable time
(days) to become familiar with the procedure, and to collect the required data in real time, this sort of
scheduling may be best used by service providers or consultants. The growers of the crops monitored
in this study were achieving good yields using their knowledge of the crop’s growth and frequent
monitoring of the crop environment.
The water use efficiency for maize, determined by this research, was about 30 kg DM/ha.mm. This
value is much higher than the 10–20 kg DM/ha.mm likely for perennial pastures in a similar
environment (Greenwood 2003). However, the costs of growing maize are high and specialised
agronomic knowledge is required to achieve high yields. Maize therefore remains an alternative
source of feed for dairy farmers, provided they are willing to accept the additional risks and challenges
of growing the crop.
Future research
This research was one module of a larger, planned research program addressing the current and future
needs of the irrigated dairy industry to justify, and optimise, its use of irrigation water. Currently,
another module of this program is comparing the water use efficiency of annual and perennial plant
systems under grazing, with management of irrigation, fertiliser and grazing optimised for each
species. This research is quantifying the water use efficiency of irrigated dairy forages and identifying
plant systems which produce more dry matter per megalitre of irrigation water. This comparison of
annual and perennial forages is funded by state government initiatives.
Funding is currently being sought to make on-farm measurements of the water used in the initial
irrigation of annual pastures. These data are crucial to enable modelling of water use efficiencies of
annual pastures under a range of climatic conditions.
The modelling, for which new funding is also being sought, would be an important tool, enabling data,
collected and verified over limited seasonal conditions, to be extended to a range of climatic
conditions. The long-term modelling would enable probabilities to be associated with different
irrigation water requirements for a range of forage crops.
The research outputs from this project, and the comparison of the water use efficiency of annual and
perennial pastures, are planned to be used in a desk-top study. The study, which recently commenced,
vi Final Report on DAV 11677—December 2005
is determining the optimum mix of forages systems from a resource efficiency and economic
perspective. It is funded by the Department of Primary Industries.
Intellectual property
No intellectual property has been developed from this project other than technical information relating
to the objectives of the project.
Communication
A limited number of communication activities have been undertaken during the project, as the project
did not officially commence until May 2004. However, the results of the project will continue to be
promoted through inclusion of the results in on-going and future research communications.
Communication activities for this project included 3 science reference group meetings, 3 printed
media articles, 3 conference papers (including 2 to be presented in February 2006), and 3 papers
accepted for publication in refereed journals (prior work by members of the project team). In addition,
the project team have presented and discussed implications of the research with 4 industry groups (~65
participants), and in 2 seminars (35 participants).
The project team anticipate that 1 paper will be submitted to a scientific journal as a direct result of the
project. This paper would cover the technical content described in the remainder of this report.
Recommendations
The findings from this research should, and will be, publicised extensively throughout the Goulburn
and Murray valleys, particularly through service providers and through incorporation into ongoing and
future research.
The high water use efficiency of maize does not necessarily imply that it has a high profitability and
low risk. Many other agronomic, economic and management factors need to be considered by dairy
farmers before deciding whether to include maize in their feed system. However, this research has
derived accurate estimates of the water use of maize, and these data can be applied to a wide range of
weather conditions using the techniques validated in this study.
Acknowledgments
We thank Rob Reid and Ian Hamono for their helpful cooperation in allowing us to monitor their
crops. Mark Wood and Tony Cook are thanked for providing some additional data on soil water
content and water application by the centre pivot for the Spray 1 crop.

Final Report on DAV 11677—December 2005 vii
We also thank Stuart Austin, Daryl Wilson, Richard Dabrowski and Graeme Phyland who provided
excellent technical assistance with our measurements during the monitoring of the crop. We are
grateful to Alister Lawson for his assistance with data collection.
The science reference group (Bill Fulkerson, James Neal, Peter Beale, Graeme Ward, Mark Callow,
Bruce Sutton, Lindsay Campbell and Alister Lawson) are thanked for their constructive discussions
about water use efficiency.

Final Report on DAV 11677—December 2005 1
Introduction
Dairying is the largest irrigated industry in northern Victoria, in terms water used, irrigated area and
revenue generated (Meyer 2005). However, irrigation water available to the dairy industry for
growing pastures and forages is likely to be reduced in the next 5 years. There is little comparative
data available on the water use efficiency of forages for dairy production. These data would be useful
to dairy farmers aiming to optimise their forage production under conditions of limited water
availability.
Maize, as a C4 species, is likely to use water more efficiently than the perennial ryegrass and white
clover pastures typically grown for dairy cows in northern Victoria. C4 plants generally have higher
growth rates, particularly at high light levels and high temperatures, due to a different leaf anatomy
which enables them to increase their carbon dioxide exchange without additional loss of water vapour
(Begg and Turner 1976; Stanhill 1986). In southern NSW, the water use efficiency of maize, in terms
of dry matter produced from rainfall and irrigation, was estimated to be 34 and 23 kg DM/ha.mm in
two years of measurement (Edraki et al. 2003). However, in northern Victoria, only estimates of
water use are available. Given the high costs of maize production, more information about the water
requirements and water use efficiency of maize is required for confident decision making by farmers.
Irrigation management for maize under border-check or furrow irrigation is relatively simple
(Pritchard 1995) as only the timing of irrigation is determined by the grower, and the amount of water
applied is dependent on the soil conditions and irrigation design. However, increasing numbers of
maize growers in northern Victoria are using centre pivot, linear move or other spray irrigation
systems. These growers need to determine not only the timing of irrigation but also the amount to
apply. While soil moisture monitoring can be very useful for assisting irrigation scheduling, it would
be less expensive for growers to schedule maize irrigation based on crop water requirements
calculated from crop coefficients and weather data (Allen et al. 1998). The usefulness of this method
needs to be confirmed for the northern Victorian environment.
Drainage beyond the rootzone of crops and pastures in the irrigated regions of northern Victoria, and
elsewhere in southern Australia, is a major concern as it is associated with rising water tables and
salinity (Meyer 2005). Edraki et al. (2003) measured water uptake by maize of 176 mm in a year
when the water table was between the surface and 1 m deep, while deep drainage, which was unable to
be quantified, occurred when the water table was below 1 m. Additional quantitative estimates of
deep drainage would be useful for validating water balance models (Humphreys et al. 2003).
To address these issues, this research measured components of the water balance of commercial maize
crops in northern Victoria in 2003/04 and 2004/05. The aims were to directly measure the water
2 Final Report on DAV 11677—December 2005
requirements of maize and compare these data with estimates based on weather data, measure the
water use efficiency of maize and estimate the amount of deep drainage from irrigated maize.
Methodology
Crop location and management
A total of 3 maize crops, grown on dairy farms, were monitored. In 2003/04, the selected crop
(hereafter call Spray 1) was grown under centre pivot irrigation, about 8 km north of Kyabram. In
2004/05, two crops were monitored: one (Spray 2) on the same site as in 2003/04 and another crop
(Flood) grown under border-check irrigation, about 11 km south of Kyabram (36°20’S, 145°04’E).
The centre pivot irrigation system was 400 m long, with 7 spans each about 58 m wide. An impact
sprinkler at the end of the pivot’s arm allowed an extra 20 m wide area to be irrigated at the perimeter.
The system normally irrigated a 200° sector of a circle, but for the maize crop grown in 2003/04, only
a sector of 110° arc was irrigated (17.0 ha). In 2004/05, the maximum irrigable area of 30.4 ha was
sown. To our knowledge, the paddock had never been graded for flood irrigation. The eastern edge of
the paddock sloped to the east while the remainder of the paddock drained to the south-west. Slopes
varied between 1:300 and 1:50. The crop area covered 3 soil types—Shepparton fine sandy loam,
Lemnos loam and Type 2 soils—as mapped by Skene and Poutsma (1962). Monitoring sites were
located in the area of the Shepparton fine sandy loam, which is a red-brown earth (Stace et al. 1968),
also known as a red sodosol (Isbell 1996).
The border-check irrigation system was divided into 8 bays, each about 54 m wide and 360 m long.
Irrigation water was supplied to the top of each bay from a farm channel through a 300 or 400 mm
diameter PVC outlet by gravity. The bays were laser graded in 1999 to a slope of 1 in 650. In
practice, 2 bays were irrigated at a time, with the whole paddock being irrigated in about 28–40 hours.
Runoff from the bays was collected by a drainage system into the farm’s reuse dam. The soil was also
a Shepparton fine sandy loam.
All management, including irrigation, of the crops was by the co-operating farmer. Agronomic details
are given in Table 1.
Final Report on DAV 11677—December 2005 3
Table 1. Agronomic details of the monitored maize crops.
Spray 1 Spray 2 Flood
Irrigation method Centre pivot Centre pivot Border check
Year 2003/04 2004/05 2004/05
Crop area (ha) 17.0 30.4 15.2
Previous crop Barley grown for silageand harvested 15/11/03
Barley grown for silageand harvested 5/11/04
Annual ryegrass pasture.Sprayed with Roundup +Surpass on 12/11/04 thengrazed and topped
Soil ameliorants 2.5 t.ha gypsum spreadon 21/11/03
2.0 t/ha gypsum spreadon 15/11/04
Pre-sowing cultivation Chisel ploughed to 0.15 mon 24/11/03
Surface cultivation forseed bed on 25/11/03
Surface cultivation forweed control on 7/12/03
Chisel ploughed to 0.2 mon 17/11/04
Surface cultivation forseed bed on 17/11/04
Chisel ploughed to 0.15 mon 16/11/04
Disc and power harrowed
Smudge to level surface22/11/04
Variety Hycorn 75 (CRMA 117)(1.1 ha)
Pioneer 31H50 (CRMA
118) (remainder)
Pioneer 36H36 (CRMA
100)Pioneer 3395IR (CRMA
111)
Sowing date 8–9/12/03 17/11/04 3/12/04
Sowing rate (seeds/ha) 85 000 95 000 86 000
Fertiliser applications 140 kg N/ha as urea pre-sowing
50 kg N/ha and 56 kgP/ha as DAP at sowing
128 kg N/ha (total) asEasyN with irrigation on 5dates
125 kg K/ha as potash on10/11/04
129 kg N/ha as urea pre-sowing
31 kg N/ha and 59 kgP/ha as Granulock 10Z(1% Zn) at sowing
84 kg N/ha (total) asEasyN with irrigation on 3dates
120 kg K/ha as potash on15/11/04
115 kg N/ha as urea pre-sowing on 16/11/04
35 kg N/ha and 60 kgP/ha as Granulock 10Z(1% Zn) at sowing
222 kg N/ha (total) asurea with irrigation on 4dates
Herbicides andinsecticides B
Primextra Gold as apreemergentFastac Duo for cutworms
Primextra Gold as apreemergentFastac Duo for cutworms
Primextra Gold + Dual asa preemergentFastac Duo for cutworms
Irrigation (see resultssection for details)
Twice pre-sowing, 28times after sowing
18 times after sowing Once pre-sowing, 6 timesafter sowing
Harvest date 20/4/04 21/3/05 17/4/05
A CRM—cumulative relative maturityB All herbicides and insecticides were used according to label recommendations.
4 Final Report on DAV 11677—December 2005
Monitoring design
For the Spray crops, six monitoring sites, about 5 m by 5 m, were established along a transect from the
centre to the edge of the centre pivot. The sites were located to represent equal areas of the crop, and
were located 81, 200, 260, 307, 339 and 383 m from the centre. For the Flood crop, a monitoring site
was located in each of the six central bays, about 100 m from the top of the bay and about 10 m from
the check bank. All crop, soil and water measurements (except irrigation volumes) were undertaken
within these monitoring sites.
Climatic data
At each crop location, an automatic weather station was used to measure rainfall, air temperature,
humidity, radiation, and wind speed and direction at 15 minute intervals. The weather station was
located as close to the crop as practical, but at least 20 m from the crop. The data were used to
calculate the reference crop evapotranspiration (ET0), on a daily time interval, using the modified
Penman-Monteith method (Allen et al. 1998).
Any missing data (<5%) caused by equipment failure or operator error were substituted by data
collected from a similar weather station at the Department of Primary Industries (DPI), Kyabram.
Crop measurements
Establishment counts
Counts of seedlings in 6 x 2.0 m lengths of row at each monitoring site were recorded. These data
were used to calculate the number of established seedlings per hectare.
Crop growth and yield
At each monitoring site, the average developmental stages were recorded every 7–14 days (Table 2)
(Ritchie et al. 1997). The number of leaf tips was also recorded every 7–14 days on the same 10
plants per site using the method of Hodges and Evans (1992). These plants were tagged by tying
flagging tape loosely around the stem between the fifth and sixth leaves, so that senesced leaves were
counted (Hodges and Evans 1992).
Final Report on DAV 11677—December 2005 5
Table 2. Vegetative and reproductive stages of a maize plant (Ritchie et al. 1997)
Vegetative stages Reproductive stages
VE emergence R1 silking
V1 first leaf R2 blister
V2 second leaf R3 milk
V3 third leaf R4 dough
Vn nth leaf R5 dent
VT tasselling R6 physiological maturity
Intermediate maize yields were determined at the V5–V8 and tasselling stages by cutting to ground
level, 3 x 1.5 m lengths of row (3 x 1.0 m lengths of row for Spray 2) within each monitoring site.
Dry matter yields were determined as described below.
The final maize yield, when cut for silage, was determined by cutting at harvest height (est. 0.15 m), 3
x 1.5-m lengths of row (3 x 1.0-m lengths of row for Spray 2) at each site. The residual stover were
cut to ground level to estimate the total yield Maize cobs, including the husks, were separated from
the stems. The maize components from each monitoring site were dried at 100 ºC for at least 72 hrs to
determine the dry matter content. A contractor harvested and transported the maize in trucks to the
silage stacks. Each truck of maize (Spray crops) or every tenth truck (Flood crop) was weighed to
determine the total fresh yield of the crop. This yield was obtained from the grower and the DM yield
was calculated .
Forage quality
Samples (5–10) from each crop were collected as the crop was harvested for silage. These samples
were dried at 60 ºC for 72 hrs, then sent to FEEDTEST® Services, Department of Primary Industries,
Hamilton. Samples of the silage (Spray 1 and Spray 2) were taken after the stacks had been opened
and were also analysed by FEEDTEST® for determination of dry matter digestibility (DMD),
metabolisable energy (ME) and crude protein (CP—nitrogen x 6.25) content. Values were estimated
for all samples using near infrared spectroscopy.
Soil chemical analyses
Bulked soil samples (0–15 cm) for chemical analyses were collected from each crop (10 x 20 mm
cores bulked from within each monitoring site) prior to sowing and fertiliser application. Analyses
included pHwater (1:5 soil:water), pHCaCl2 (1:5 soil:0.01M CaCl2), electrical conductivity (EC, 1:5
soil:water), total nitrogen (Leco N), extractable phosphorus (Olsen P, 0.5M NaHCO3), extractable
sulfur (CPC S), total carbon (Leco C), and exchangeable cations (Tucker, 1M NH4Cl; calcium (Ca),
magnesium (Mg), potassium (K) and sodium (Na)). Samples were analysed at DPI Werribee,
according to methods described by Rayment and Higginson (1992).
6 Final Report on DAV 11677—December 2005
Also, single samples at depths of 0–0.1, 0.1–0.2, 0.2–0.4, 0.4–0.6, 0.6–0.8 and 0.8–1.0 m were
collected at each monitoring site and bulked across the whole paddock. These samples were analysed
for available N (nitrate and ammonium) and the suite of chemical properties determined for the 0–0.15
m depth. Soil texture was estimated by hand.
Water use measurements
Water application and runoff
For the Spray crops, the volume of water applied at each irrigation was measured by an in-line meter
on the supply pipe to the pump. In 2003/04, runoff from the crop did not occur. However, in
2004/05, some runoff did occur but the amount of runoff was not measured.
For the Flood crop, the volume of water supplied to the channel was measured by two 450 mm
diameter magnetic flow meters, in parallel. The volume of water remaining in the channel at the end
of irrigation was estimated from channel dimensions to be 0.2 ML, and this volume was subtracted
from the amount of water applied at each irrigation. The volume of runoff from the paddock, due to
both irrigation and rainfall, was measured by another 450 mm diameter magnetic flow meter.
Soil moisture content monitoring
The initial soil water content, prior to the first irrigation for seedbed preparation, was determined
gravimetrically at each monitoring site. Samples were collected from 0–0.05 m, then at 0.1 m
intervals to 1.45 m with the deepest sample from 1.45–1.65 m. Samples were dried at 105 ºC for at
least 48 hours to determine the gravimetric moisture content. These data were converted to volumetric
water contents using soil bulk density data collected as part of the neutron probe calibration (Spray
crops) or using data from a similar soil type from DPI Kyabram, supplemented by bulk density data
collected at depths of 0.1 and 0.2 m on site.
Neutron probes were used to monitor the soil water content in the Spray 1 and Flood crops only. After
the maize crop was sown, aluminium access tubes were installed into a slightly oversize hole to 1.70 m
(Spray 1) or 1.30 m (Flood) with access tubes sealed using a kaolin:cement slurry (Prebble et al.
1981). There were two access tubes at each site—one between plants within a row and the other mid-
way between rows.
For the Spray 1 crop, soil water content was measured at least weekly. Post-irrigation measurements
were undertaken the morning after overnight irrigation. For the Flood crop, soil water content was
measured immediately prior to irrigation using a neutron probe, but not until 2–3 days after irrigation,
due to poor trafficability. Measurements were made at depths of 0.1, 0.2, 0.3, 0.4, 0.5, 0.6, 0.8, 1.0,
and 1.2 m (Spray 1 and Flood), and 1.4 and 1.6 m (Spray 1 only) with a 16-second count time used.
Final Report on DAV 11677—December 2005 7
The neutron probe was calibrated at 4 locations in an area adjacent to the Spray 1 crop. At each
location, after 64-second counts were made at the measurement depths to 1.4 m, 3 intact cores were
collected for determination of volumetric water content from a backhoe pit dug adjacent to the access
tube. Calibration was done over a range of water contents from about 0.1 to 0.4 m3/m3.
For the Flood crop, the neutron probe was calibrated using 64-second counts and gravimetric water
contents measured to 1.2 m at 3 locations at the edge of the crop. The gravimetric water contents were
converted to volumetric water contents using measured bulk densities (at 0.1 and 0.2 m depths) and
bulk densities from a similar soil type in the subsoil.
The relationship between neutron probe counts and the volumetric water content of the soil was
determined by linear regression. Separate calibration equations were derived for the 0.1 and 0.2 m
depths, while a single calibration equation was used for all deeper depths.
The Probe software (Research Services New England 1998) was used to manage the data collected
using the neutron probes. For each access tube in the Spray 1 crop, a full point was determined from
the soil water content measured on 8 January 2004, less than 1 hour after irrigation. For the Flood
crop, the full point was determined as the soil water content measured on 8 February 2005 plus 20 mm
(the calculated evapotranspiration from 5 February, after rain resulting in 23 mm runoff, to 8 February
2005). The soil water deficit was calculated as the difference between the total profile water (to 1.7 m
(Spray 1) or 1.3 m (Flood)) at the full point and at the date of interest.
Water tables
The depth of the local groundwater table was measured using testwells installed as soon as possible
after sowing, to a depth of 2.5 m, with the PVC pipe slotted 1.5 m from the bottom. In the Spray 1
crop, a testwell was installed at each monitoring site. Two of these testwells were fitted with pressure
sensors connected to data loggers recording the water height at 15-min intervals. The remaining
testwells were read manually whenever neutron probe water content data was collected. In the Spray 2
and Flood crops, testwells were installed at monitoring sites 1, 3 and 5. Testwells in the Spray 2 crop
were fitted with similar pressure sensors until 21 December 2004 when they were re-located to the
Flood crop. When pressure sensors were not installed, the depth to the water table was recorded
manually every 7–14 days.
Estimation of evapotranspiration
The FAO 56 method (Allen et al. 1998) calculates crop evapotranspiration by multiplying the
reference crop evapotranspiration by a crop coefficient (Kc). Daily reference evapotranspiration was
collected by the automatic weather station. Crop coefficients for different stages of maize crop growth
are provided by Allen et al. (1998). These crop coefficients need to be adjusted for the frequency of
wetting of the soil surface, and local weather conditions (mainly wind speed and relative humidity).
8 Final Report on DAV 11677—December 2005
The FAO 56 procedure has provision for using either single or dual crop coefficients. The dual crop
coefficient procedure, where there are separate transpiration and evaporation coefficients, is
recommended for daily calculations of crop evapotranspiration for specific fields of crops for specific
years. We used the spreadsheet provided in Annex 8 of Allen et al. (1998) to estimate the daily
evapotranspiration for each maize crop. Soil water deficits calculated by this spreadsheet were
compared with those measured by the neutron probe, for the Spray 1 and Flood crops.
Estimation of deep drainage
Deep drainage is defined as drainage of water below the root zone of the crop.
1. Change in water table height
Increases in water table height following irrigation or rainfall can be used to estimate the amount of
deep drainage by multiplying the increase in water table height by the specific yield of the soil at the
depth of the water table. Specific yield is the difference in volumetric soil water content, at the depth
of the water table rise, before and after the rise in water table height. In practice, it is probably equal
to the difference in volumetric water content between field capacity and saturation. Edraki et al.
(2003) assumed a specific yield of 2% for a red-brown earth at Finley. The major source of error, with
this method of drainage estimation, is the estimate of specific yield, which could be ±100%.
2. Water balance calculations
Deep drainage (D) was estimated, using the water balance equation, from measured values of rainfall
(P), irrigation (I), surface runoff (R) and change in soil water content (∆S), with evapotranspiration
(ET) estimated using the dual crop coefficient:
D = P + I – (ET + ∆S + R)
Lateral flow is assumed to be negligible for maize crops in this region.
The error (∂) in the deep drainage term can be estimated by:
∂D = √((∂P)2 + (∂I)2 + (∂ET)2 + (∂∆S)2 + (∂R)2)
(Ward et al. 1998). Using estimates of error for each of these terms provided by Ward et al. (1998),
the expected quantity of deep drainage is likely to be of a similar order of magnitude to the errors in
the other terms. However, this approach should at least provide an upper and lower boundary on the
amount of deep drainage from the crop.
Final Report on DAV 11677—December 2005 9
Water use efficiency calculations
Water use efficiency (kg DM/ha.mm) for the crop was calculated from the measured DM yield and the
total water applied (including rainfall), and adding any change in soil water storage, from site
preparation until harvest. Water use efficiency was also separately calculated for the irrigation water
applied.
Statistical analyses
The average and standard deviation of DM yield, leaf tip counts, soil water content and soil water
deficits, at any particular time, were calculated for each crop from the average of data collected at each
monitoring site.
10 Final Report on DAV 11677—December 2005
Results
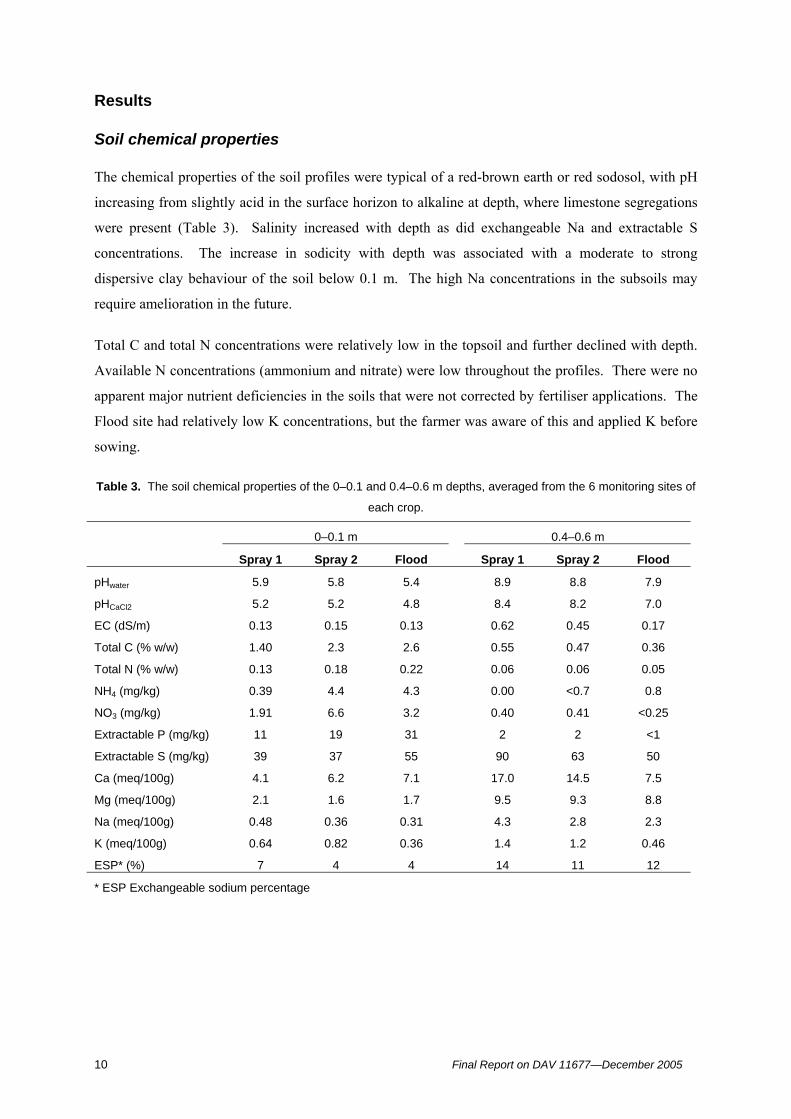
Soil chemical properties
The chemical properties of the soil profiles were typical of a red-brown earth or red sodosol, with pH
increasing from slightly acid in the surface horizon to alkaline at depth, where limestone segregations
were present (Table 3). Salinity increased with depth as did exchangeable Na and extractable S
concentrations. The increase in sodicity with depth was associated with a moderate to strong
dispersive clay behaviour of the soil below 0.1 m. The high Na concentrations in the subsoils may
require amelioration in the future.
Total C and total N concentrations were relatively low in the topsoil and further declined with depth.
Available N concentrations (ammonium and nitrate) were low throughout the profiles. There were no
apparent major nutrient deficiencies in the soils that were not corrected by fertiliser applications. The
Flood site had relatively low K concentrations, but the farmer was aware of this and applied K before
sowing.
Table 3. The soil chemical properties of the 0–0.1 and 0.4–0.6 m depths, averaged from the 6 monitoring sites of
each crop.
0–0.1 m 0.4–0.6 m
Spray 1 Spray 2 Flood Spray 1 Spray 2 Flood
pHwater 5.9 5.8 5.4 8.9 8.8 7.9
pHCaCl2 5.2 5.2 4.8 8.4 8.2 7.0
EC (dS/m) 0.13 0.15 0.13 0.62 0.45 0.17
Total C (% w/w) 1.40 2.3 2.6 0.55 0.47 0.36
Total N (% w/w) 0.13 0.18 0.22 0.06 0.06 0.05
NH4 (mg/kg) 0.39 4.4 4.3 0.00 <0.7 0.8
NO3 (mg/kg) 1.91 6.6 3.2 0.40 0.41 <0.25
Extractable P (mg/kg) 11 19 31 2 2 <1
Extractable S (mg/kg) 39 37 55 90 63 50
Ca (meq/100g) 4.1 6.2 7.1 17.0 14.5 7.5
Mg (meq/100g) 2.1 1.6 1.7 9.5 9.3 8.8
Na (meq/100g) 0.48 0.36 0.31 4.3 2.8 2.3
K (meq/100g) 0.64 0.82 0.36 1.4 1.2 0.46
ESP* (%) 7 4 4 14 11 12
* ESP Exchangeable sodium percentage
Final Report on DAV 11677—December 2005 11
Crop growth and yield
The growth and yield of each crop is summarised in Table 4. The Spray 1 and Flood crops were both
sown in early December and harvested in mid-April, while Spray 2 was sown mid-November and
harvested in mid-March. Establishment counts of the Spray 2 were higher than the other crops, and
also higher than the farmer’s reported sowing rate.
Table 4. Yield and growth data for each crop (numbers are the averages of all monitoring sites ± the standard
deviation of the monitoring site averages)
Spray 1 Spray 2 Flood
Planting date 8–9/12/03 17/11/04 3/12/04Establishment count(1000 seedlings/ha)
71±6.3 102±5.1 76±9.0
First harvestDate 6/1/04 23/12/04 5/1/05Growth stage V5 V8 V7Yield (t DM/ha) 0.3±0.08 1.4±0.20 0.9±0.22Growth rate (kgDM/ha.day)
12 39 26
Second harvestDate 27/2/04 25/1/05 14/2/05Growth stage R1 VT VTYield (t DM/ha) 11.8±1.34 9.7±1.87 6.7±1.05Growth rate sinceprevious harvest (kgDM/ha.day)
221 251 141
Final harvestDate 15/4/04 18/3/05 15/4/05Growth stage R5 R5 R5Yield
Cob (t DM/ha) 10.4±1.08 13.1±1.38 11.8±1.73Stover (t DM/ha) 10.2±1.16 8.0±2.14 6.7±1.07Stubble (t DM/ha) 1.0±0.13 0.8±0.14 0.9±0.12
Total (t DM/ha) 21.6±1.76 21.9±3.29 19.4±2.80Growth rate sinceprevious harvest (kgDM/ha.day)
204 235 212
Farmer’s harvestDate 20/4/04 21/3/05 17/4/05Yield (t DM/ha) 20 18 18DM (%) 34 41 37
Yields of the two Spray crops averaged 22 t DM/ha, when cut to ground level from the monitoring
sites, while the Flood crop yielded 19 t DM/ha. The whole paddock yields reported by the farmers
were 1–4 t DM/ha lower. These differences would be mainly due to stubble left on the field by the
harvester, site variability and differences in weighing technique.
12 Final Report on DAV 11677—December 2005
Figure 1 shows the growth of the 3 crops in terms of the increase in the number of leaf tips over time.
The Spray 1 and Flood crops had about 20 leaf tips/plant at maturity, while Spray 2 had about 18 leaf
tips/plant. Leaf appearance rate was approximately linear with time, and ceased at tasselling.
No.
of l
eaf t
ips
0
5
10
15
20
25
DM
yie
ld (t
/ha)
0
5
10
15
20
25
30
No.
of l
eaf t
ips
0
5
10
15
20
25
DM
yie
ld (t
/ha)
0
5
10
15
20
25
30
Days from sowing
0 20 40 60 80 100 120 140
No.
of l
eaf t
ips
0
5
10
15
20
25
DM
yie
ld (t
/ha)
0
5
10
15
20
25
30
Cob yield
Plant yield
Stubble yield
Cob yield
Plant yield
Stubble yield
Cob yield
Plant yield
Stubble yield
Spray 1
Spray 2
Flood
Figure 1. Leaf tip numbers and DM yield of 3 maize crops
Final Report on DAV 11677—December 2005 13
The nutritive value of the crops at harvest is shown in Table 5. The nutritive value of the silage from
the stacks of the Spray crops is also included.
Table 5. Nutritive value of the green chop (± the standard deviation) from each crop and silage from the Spray
crops.
Spray 1 Spray 2 Flood
Green chopCP content (%) 7.0±0.37 7.3±0.61 6.9±0.48DMD (%) 70.9±2.15 72.4±3.55 71.7±1.87ME (MJ/kg DM) 11.0±0.36 11.1±0.53 11.1±0.30
SilageCP content (%) 7.3 7.4DMD (%) 67.9 74.2ME (MJ/kg DM) 10.6 10.8
Irrigation management
Spray 1
In 2003/04, the paddock was irrigated twice before sowing due to the dry soil conditions. There was
96 mm applied as irrigation and rainfall. From sowing until harvest, the crop received a further 28
irrigations, that were usually applied twice per week while the crop was actively growing. The
frequency of irrigation was reduced from mid-March 2004 as the crop matured and evapotranspiration
declined. The final irrigation was applied on 10 April. The average amount of water applied per
irrigation was 22 mm but ranged from 10 to 44 mm (Figure 2).
Spray 2
In 2004/05, there was about 18 mm of rain in the week before sowing (on 17 November) and the first
irrigation (18 mm) was on 28 November. A follow up irrigation (19 mm) was applied 7 days later.
With over 120 mm of rain falling during mid-December, irrigation was delayed until 25 December.
Subsequent irrigations were scheduled every 3–4 days until early February 2005 when about 90 mm of
rain occurred, delaying irrigation until 20 February. With the crop maturing, subsequent irrigations
were scheduled about weekly until the last irrigation in mid-March. There were 18 irrigations applied
during the growth of the maize and the average depth of water applied by each irrigation was 21 mm
(Figure 2).
14 Final Report on DAV 11677—December 2005
Figure 2. The depth of water applied at each irrigation and rainfall event for the 3 maize crops
Flood
The first irrigation was applied on 25 November 2004, prior to sowing, to provide a moist seedbed for
the maize. The net amount of irrigation applied was 76 mm. A further 6 irrigations were applied
during the growth of the maize. Regular scheduling of irrigation was disrupted by 2 major rainfall
events in mid-December (82 mm) and early February (125 mm) (Figure 2). Either side of the rainfall
events, irrigations were applied at 10 to 14 day intervals with the last irrigation occurring on 17 March
Wat
er (m
m)
0
20
40
60
80
IrrigationRainfall
Spray 1
Wat
er (m
m)
0
20
40
60
80Spray 2
01-Nov 01-Dec 01-Jan 01-Feb 01-Mar 01-Apr 01-May
Wat
er (m
m)
0
20
40
60
80 Flood
Final Report on DAV 11677—December 2005 15
to allow the crop to use stored water in the profile during maturation. The average depth of water
applied by each irrigation, less runoff, was 66 mm. All surface runoff after irrigation was collected in
a re-use sump and the average runoff was 17% of the applied water.
Water use
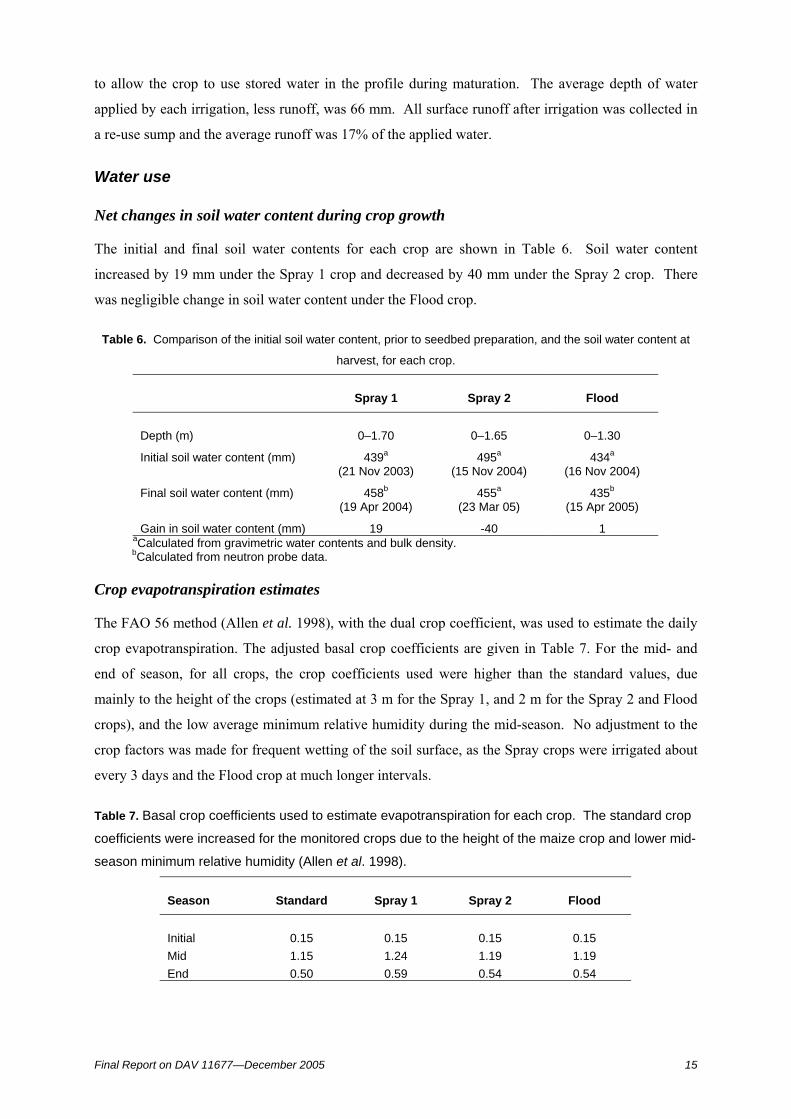
Net changes in soil water content during crop growth
The initial and final soil water contents for each crop are shown in Table 6. Soil water content
increased by 19 mm under the Spray 1 crop and decreased by 40 mm under the Spray 2 crop. There
was negligible change in soil water content under the Flood crop.
Table 6. Comparison of the initial soil water content, prior to seedbed preparation, and the soil water content at
harvest, for each crop.
Spray 1 Spray 2 Flood
Depth (m) 0–1.70 0–1.65 0–1.30
Initial soil water content (mm) 439a
(21 Nov 2003)495a
(15 Nov 2004)434a
(16 Nov 2004)
Final soil water content (mm) 458b
(19 Apr 2004)455a
(23 Mar 05)435b
(15 Apr 2005)
Gain in soil water content (mm) 19 -40 1aCalculated from gravimetric water contents and bulk density.bCalculated from neutron probe data.
Crop evapotranspiration estimates
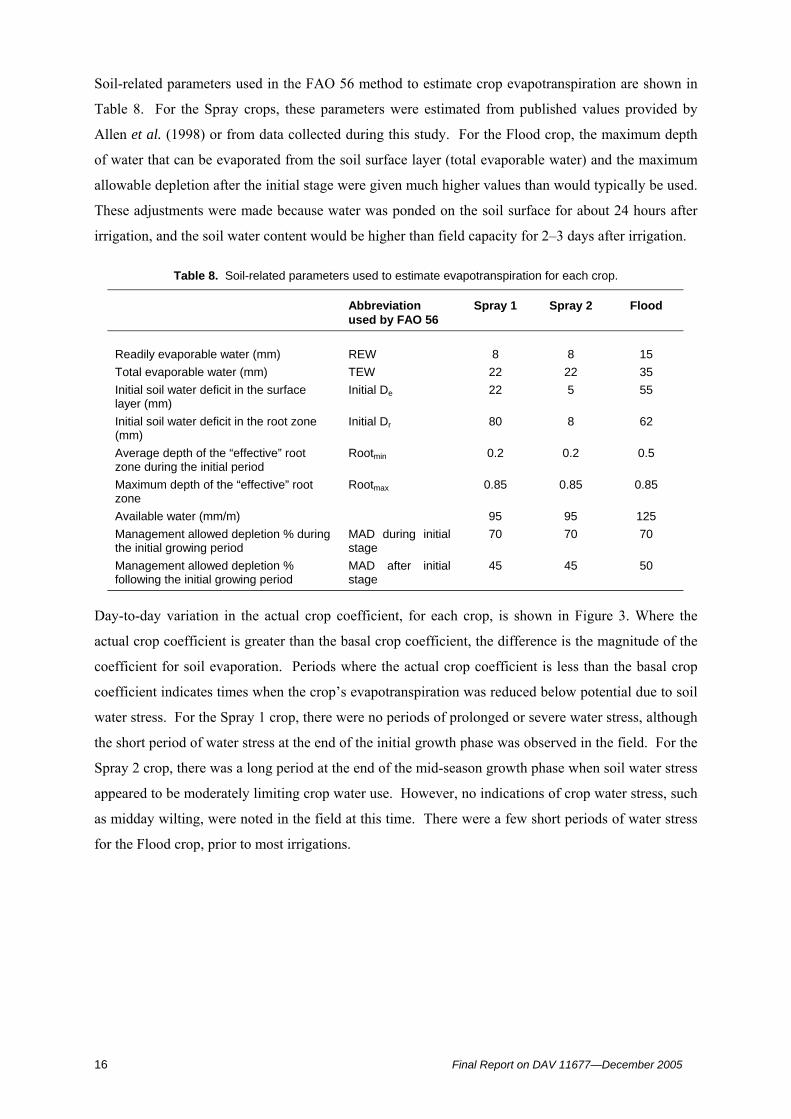
The FAO 56 method (Allen et al. 1998), with the dual crop coefficient, was used to estimate the daily
crop evapotranspiration. The adjusted basal crop coefficients are given in Table 7. For the mid- and
end of season, for all crops, the crop coefficients used were higher than the standard values, due
mainly to the height of the crops (estimated at 3 m for the Spray 1, and 2 m for the Spray 2 and Flood
crops), and the low average minimum relative humidity during the mid-season. No adjustment to the
crop factors was made for frequent wetting of the soil surface, as the Spray crops were irrigated about
every 3 days and the Flood crop at much longer intervals.
Table 7. Basal crop coefficients used to estimate evapotranspiration for each crop. The standard crop
coefficients were increased for the monitored crops due to the height of the maize crop and lower mid-
season minimum relative humidity (Allen et al. 1998).
Season Standard Spray 1 Spray 2 Flood
Initial 0.15 0.15 0.15 0.15Mid 1.15 1.24 1.19 1.19End 0.50 0.59 0.54 0.54
16 Final Report on DAV 11677—December 2005
Soil-related parameters used in the FAO 56 method to estimate crop evapotranspiration are shown in
Table 8. For the Spray crops, these parameters were estimated from published values provided by
Allen et al. (1998) or from data collected during this study. For the Flood crop, the maximum depth
of water that can be evaporated from the soil surface layer (total evaporable water) and the maximum
allowable depletion after the initial stage were given much higher values than would typically be used.
These adjustments were made because water was ponded on the soil surface for about 24 hours after
irrigation, and the soil water content would be higher than field capacity for 2–3 days after irrigation.
Table 8. Soil-related parameters used to estimate evapotranspiration for each crop.
Abbreviationused by FAO 56
Spray 1 Spray 2 Flood
Readily evaporable water (mm) REW 8 8 15Total evaporable water (mm) TEW 22 22 35Initial soil water deficit in the surfacelayer (mm)
Initial De 22 5 55
Initial soil water deficit in the root zone(mm)
Initial Dr 80 8 62
Average depth of the “effective” rootzone during the initial period
Rootmin 0.2 0.2 0.5
Maximum depth of the “effective” rootzone
Rootmax 0.85 0.85 0.85
Available water (mm/m) 95 95 125Management allowed depletion % duringthe initial growing period
MAD during initialstage
70 70 70
Management allowed depletion %following the initial growing period
MAD after initialstage
45 45 50
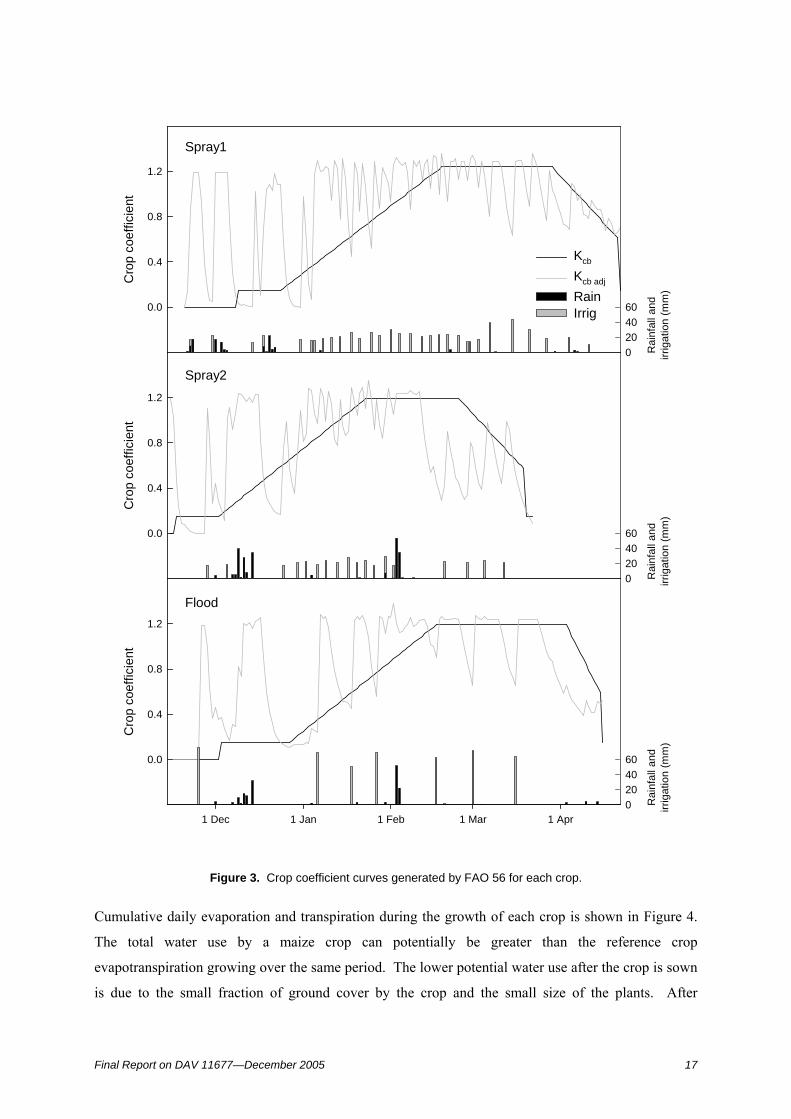
Day-to-day variation in the actual crop coefficient, for each crop, is shown in Figure 3. Where the
actual crop coefficient is greater than the basal crop coefficient, the difference is the magnitude of the
coefficient for soil evaporation. Periods where the actual crop coefficient is less than the basal crop
coefficient indicates times when the crop’s evapotranspiration was reduced below potential due to soil
water stress. For the Spray 1 crop, there were no periods of prolonged or severe water stress, although
the short period of water stress at the end of the initial growth phase was observed in the field. For the
Spray 2 crop, there was a long period at the end of the mid-season growth phase when soil water stress
appeared to be moderately limiting crop water use. However, no indications of crop water stress, such
as midday wilting, were noted in the field at this time. There were a few short periods of water stress
for the Flood crop, prior to most irrigations.
Final Report on DAV 11677—December 2005 17
Cro
p co
effic
ient
0.0
0.4
0.8
1.2
Rai
nfal
l and
irrig
atio
n (m
m)
0204060
Kcb
Kcb adj
Rain Irrig
Spray1C
rop
coef
ficie
nt
0.0
0.4
0.8
1.2
Rai
nfal
l and
irrig
atio
n (m
m)
0204060
1 Dec 1 Jan 1 Feb 1 Mar 1 Apr
Cro
p co
effic
ient
0.0
0.4
0.8
1.2
Rai
nfal
l and
irrig
atio
n (m
m)
0204060
Spray2
Flood
Figure 3. Crop coefficient curves generated by FAO 56 for each crop.
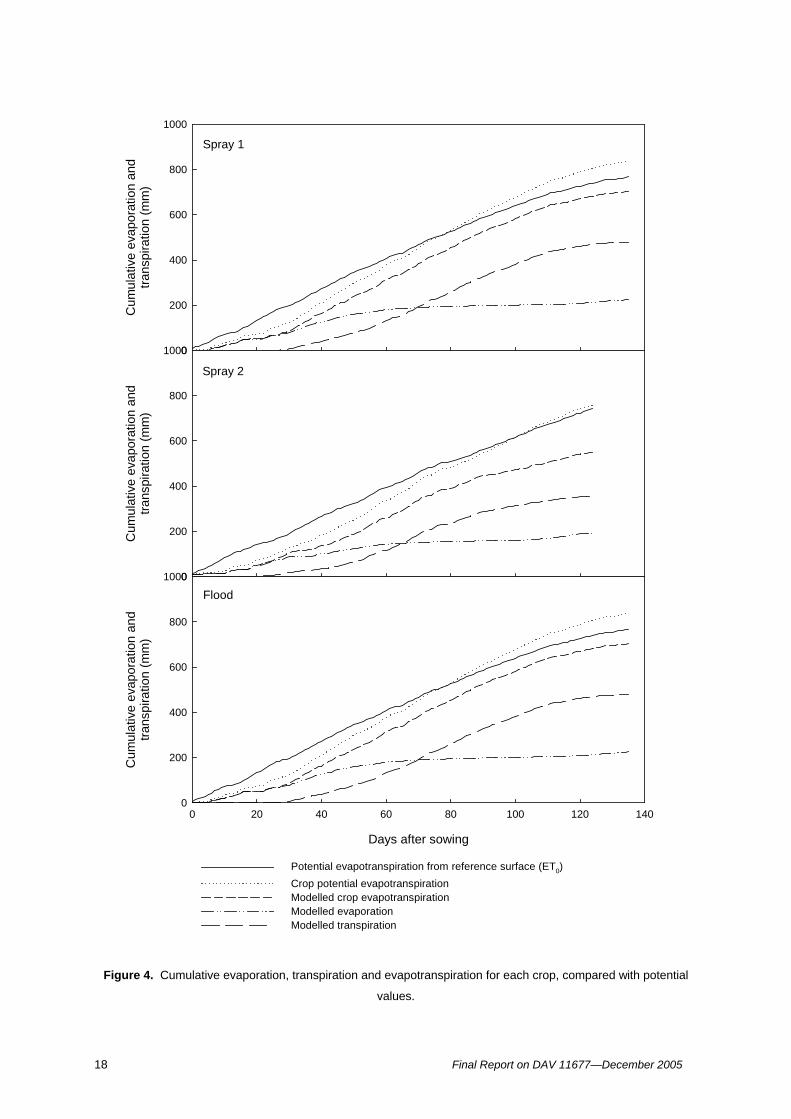
Cumulative daily evaporation and transpiration during the growth of each crop is shown in Figure 4.
The total water use by a maize crop can potentially be greater than the reference crop
evapotranspiration growing over the same period. The lower potential water use after the crop is sown
is due to the small fraction of ground cover by the crop and the small size of the plants. After
18 Final Report on DAV 11677—December 2005
Cum
ulat
ive
evap
orat
ion
and
trans
pira
tion
(mm
)
0
200
400
600
800
1000
Spray 1C
umul
ativ
e ev
apor
atio
n an
dtra
nspi
ratio
n (m
m)
0
200
400
600
800
1000
Spray 2
Days after sowing
0 20 40 60 80 100 120 140
Cum
ulat
ive
evap
orat
ion
and
trans
pira
tion
(mm
)
0
200
400
600
800
1000
Potential evapotranspiration from reference surface (ET0) Crop potential evapotranspirationModelled crop evapotranspirationModelled evaporationModelled transpiration
Flood
Figure 4. Cumulative evaporation, transpiration and evapotranspiration for each crop, compared with potential
values.
Final Report on DAV 11677—December 2005 19
about 30 days after sowing, however, potential water use by maize is greater than that by a reference
crop, mainly due to its greater height.
For all 3 crops monitored in this study, the actual water use by the crop was less than the potential
water use of maize, as indicated by the crop coefficient curves. The difference between actual and
potential maize crop evapotranspiration was 119 mm for the Spray 1 crop, 208 mm for Spray 2 and 74
mm for the Flood crop. Evaporation from the soil for each crop ranged between 180–290 mm, with
most of this loss occurring within 60 days after sowing, when the proportion of soil surface covered by
vegetation (as observed from overhead) was less than 70%. After 60 days after sowing, daily rates of
evaporation averaged 0.6 mm for Spray 1, 0.8 mm for Spray 2 and 0.4 mm for the Flood crop. Greater
evaporation from the Spray crops was due to more frequent wetting of the soil surface.
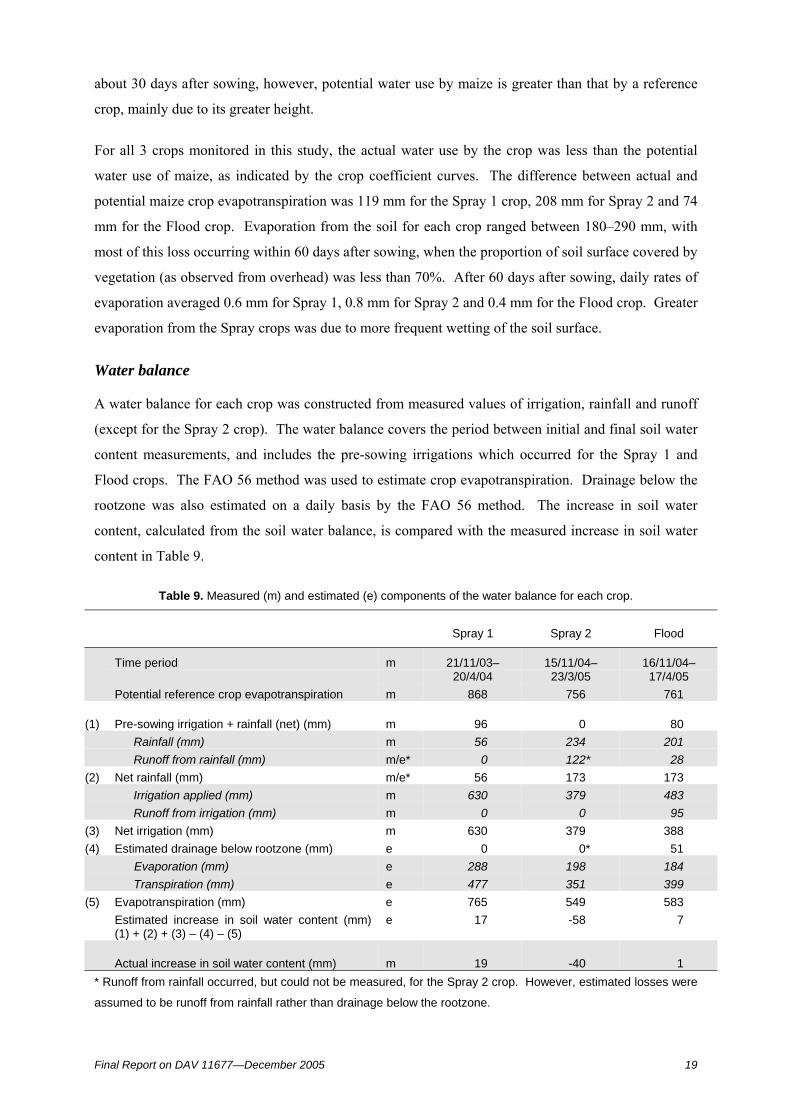
Water balance
A water balance for each crop was constructed from measured values of irrigation, rainfall and runoff
(except for the Spray 2 crop). The water balance covers the period between initial and final soil water
content measurements, and includes the pre-sowing irrigations which occurred for the Spray 1 and
Flood crops. The FAO 56 method was used to estimate crop evapotranspiration. Drainage below the
rootzone was also estimated on a daily basis by the FAO 56 method. The increase in soil water
content, calculated from the soil water balance, is compared with the measured increase in soil water
content in Table 9.
Table 9. Measured (m) and estimated (e) components of the water balance for each crop.
Spray 1 Spray 2 Flood
Time period m 21/11/03–20/4/04
15/11/04–23/3/05
16/11/04–17/4/05
Potential reference crop evapotranspiration m 868 756 761
(1) Pre-sowing irrigation + rainfall (net) (mm) m 96 0 80Rainfall (mm) m 56 234 201Runoff from rainfall (mm) m/e* 0 122* 28
(2) Net rainfall (mm) m/e* 56 173 173Irrigation applied (mm) m 630 379 483Runoff from irrigation (mm) m 0 0 95
(3) Net irrigation (mm) m 630 379 388(4) Estimated drainage below rootzone (mm) e 0 0* 51
Evaporation (mm) e 288 198 184Transpiration (mm) e 477 351 399
(5) Evapotranspiration (mm) e 765 549 583Estimated increase in soil water content (mm)(1) + (2) + (3) – (4) – (5)
e 17 -58 7
Actual increase in soil water content (mm) m 19 -40 1* Runoff from rainfall occurred, but could not be measured, for the Spray 2 crop. However, estimated losses were
assumed to be runoff from rainfall rather than drainage below the rootzone.
20 Final Report on DAV 11677—December 2005
There was good agreement between the measured and estimated changes in soil water content (Table
9). However, good agreement does not necessarily mean that each component, whether measured or
estimated, is accurate. The rainfall measurements probably have an error less than 5%, as would the
irrigation applied and irrigation runoff measurements. Each measured soil water content may have
errors of about 10 mm, giving a possible total error of 20 mm for the change in soil water content.
Estimated evapotranspiration probably has an error of 10% (Allen 2000). Therefore, the error
associated with the estimate of drainage (including for the Spray 2 crop) is about ± 50 mm.
The largest error in these water balances, however, is the estimated drainage below the rootzone for
the Spray 2 crop and losses due to runoff. We observed that there was runoff from this crop after large
rainfalls in mid-December and early February, however, the amount of runoff could not be measured.
Testwell observations (see below) indicated that drainage below the rootzone was negligible.
Therefore, the 122 mm of water not accounted for by evapotranspiration or change in soil water
storage was assumed to be runoff after rainfall rather than drainage below the rootzone. It should also
be noted that under the Spray 1 and Spray 2 crops, the FAO 56 model indicated that no deep drainage
occurred during or immediately after irrigation events.
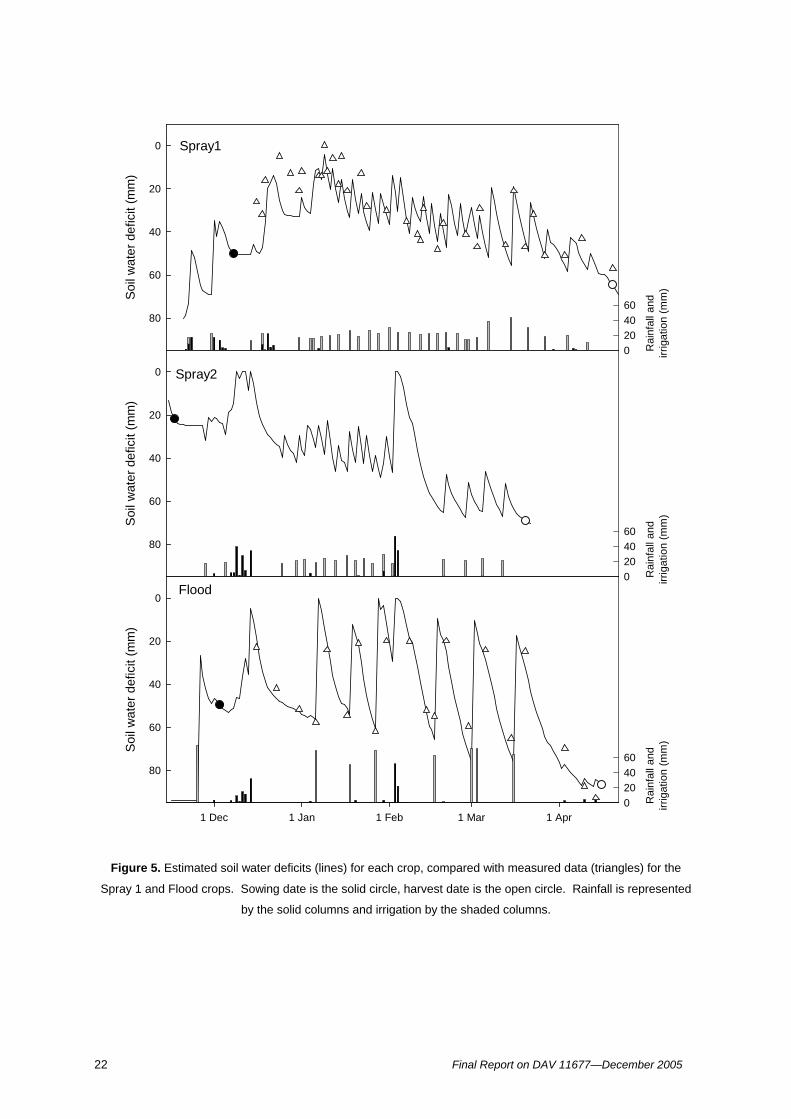
Changes in soil water content
The FAO 56 model was used to estimate daily soil water deficits for each crop (Figure 5). Soil water
deficits measured by the neutron probe in the Spray 1 and Flood crops are also shown in Figure 5.
Frequent irrigation of the Spray 1 crop ensured that the soil water deficit was rarely greater than 50
mm. Also, the soil water deficit was usually greater than about 20 mm. This irrigation management
ensured that the crop was rarely water stressed, but there was also some “buffer” to store rainfall
events of up to 20 mm. At the end of the growing season, the crop was irrigated less frequently to
allow it to dry before harvesting, and use more of the moisture stored in the soil profile.
Irrigation of the Spray 2 crop was complicated by the two large rainfall events in mid-December and
early February. As for the previous crop, the soil water deficit was kept within a narrow range of 20–
50 mm, until mid-February. After this time, during the grain filling period, the soil water deficit
fluctuated between about 50 and 70 mm. Prior to the large rainfall event in mid-December, the soil
water deficit was 20 mm, and in early February, the deficit before rainfall was 30 mm. By managing
the irrigation to always maintain the soil water deficits drier than 20 mm, a total of about 50 mm of the
two large rainfall events during the crop’s growth were able to be stored by the soil.
Soil water deficits under the Flood crop fluctuated between 0 and 70 mm. With flood irrigation, it is
expected that the soil water deficit will be 0 mm immediately after each irrigation. The modelled soil
water deficits shown in Figure 5, were greater than 0 mm after three irrigation events indicating errors
with the modelled data. The soil water deficits prior to the large rainfall events, were 53 mm in mid-
Final Report on DAV 11677—December 2005 21
December and 29 mm in early February, enabling about 82 mm of the rain to be stored by the soil.
Under flood irrigation, the amount of rainfall able to be stored by the soil will vary between about 0
and 60 mm, depending on the time since the previous irrigation. Irrigation managers have no control
over the amount of water applied, but can possibly delay irrigation if rain is imminent.
Soil water content monitoring of the crops provided an opportunity to check the accuracy of the crop
evapotranspiration and water balance estimates from the FAO 56 model for these crops. Figure 5
shows that, for the Spray 1 crop, the model overestimated the soil water deficit during the first month,
but gave reasonably good predictions after that. For the Flood crop, the model predictions were
satisfactory except for the mid-season crop growth period (mid-February to mid-March) when the
model over-estimated crop water use.
Runoff and deep drainage
In the Spray 1 crop, all 6 testwells remained dry at 2.5 m until 30 January, 2004, when water first
appeared at 2.4 m in the testwell at monitoring site 2. On 6 February, water was observed at 2.46 m in
the testwell at site 3. At site 2, the depth to the water table decreased, peaking at about 2 m and
remained at this depth until the crop was harvested in April. The water table depth at site 3 was deeper
than at site 2 and remained between 2.3 and 2.4 m throughout the growth of the crop. The remaining 4
testwells remained dry throughout the growth of the crop.
In the Spray 2 crop, no water was evident in any of the 3 testwells.
At the Flood site, the depth to the water table was logged from 21 December 2004 until harvest
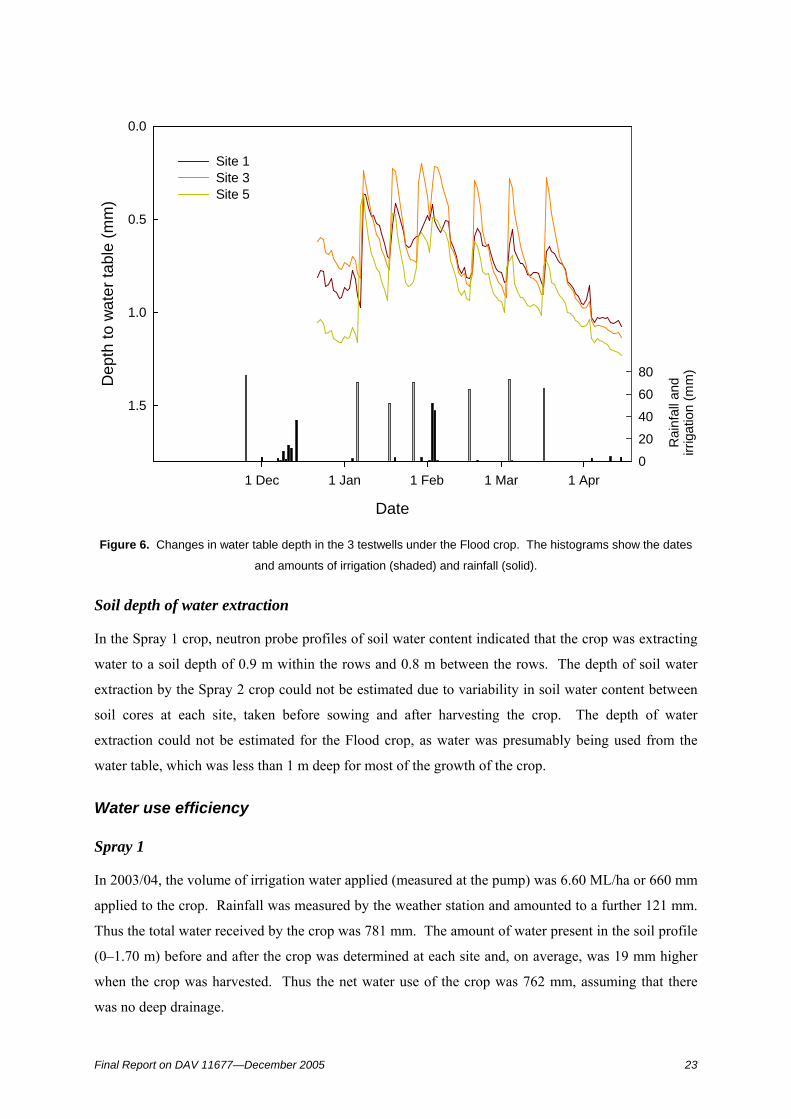
(Figure 6). From 6 January, after the first irrigation post-sowing, until April, the water table at all sites
was less than 1 m from the soil surface. After each irrigation, the water table rose by about 0.2–0.5 m,
then gradually fell by at least the same amount until the next irrigation. The water table dropped below
1 m depth during April, prior to harvest.
Assuming an increase of water table height of 0.3 m at each irrigation, and a specific yield of 2%,
approximately 6 mm of water reached the water table at each irrigation. Between irrigations, most of
this water would be transpired by the maize crop, however there would also be some loss of water to
the regional groundwater table. Assuming a regional groundwater table depth of 2.5 m, a water table
depth of 1.1 m when the crop was harvested, and a specific yield of 2%, then about 28 mm of water, or
4.26 ML for the whole crop, has been “lost” as deep drainage.
22 Final Report on DAV 11677—December 2005
Soil
wat
er d
efic
it (m
m)
0
20
40
60
80
Rai
nfal
l and
irrig
atio
n (m
m)
0204060
Spray1S
oil w
ater
def
icit
(mm
)
0
20
40
60
80
Rai
nfal
l and
irrig
atio
n (m
m)
0204060
1 Dec 1 Jan 1 Feb 1 Mar 1 Apr
Soil
wat
er d
efic
it (m
m)
0
20
40
60
80
Rai
nfal
l and
irrig
atio
n (m
m)
0204060
Spray2
Flood
Figure 5. Estimated soil water deficits (lines) for each crop, compared with measured data (triangles) for the
Spray 1 and Flood crops. Sowing date is the solid circle, harvest date is the open circle. Rainfall is represented
by the solid columns and irrigation by the shaded columns.
Final Report on DAV 11677—December 2005 23
Figure 6. Changes in water table depth in the 3 testwells under the Flood crop. The histograms show the dates
and amounts of irrigation (shaded) and rainfall (solid).
Soil depth of water extraction
In the Spray 1 crop, neutron probe profiles of soil water content indicated that the crop was extracting
water to a soil depth of 0.9 m within the rows and 0.8 m between the rows. The depth of soil water
extraction by the Spray 2 crop could not be estimated due to variability in soil water content between
soil cores at each site, taken before sowing and after harvesting the crop. The depth of water
extraction could not be estimated for the Flood crop, as water was presumably being used from the
water table, which was less than 1 m deep for most of the growth of the crop.
Water use efficiency
Spray 1
In 2003/04, the volume of irrigation water applied (measured at the pump) was 6.60 ML/ha or 660 mm
applied to the crop. Rainfall was measured by the weather station and amounted to a further 121 mm.
Thus the total water received by the crop was 781 mm. The amount of water present in the soil profile
(0–1.70 m) before and after the crop was determined at each site and, on average, was 19 mm higher
when the crop was harvested. Thus the net water use of the crop was 762 mm, assuming that there
was no deep drainage.
Date
1 Dec 1 Jan 1 Feb 1 Mar 1 Apr
Dep
th to
wat
er ta
ble
(mm
)
1.5
1.0
0.5
0.0
Rai
nfal
l and
irrig
atio
n (m
m)
0
20
40
60
80
Site 1Site 3Site 5
24 Final Report on DAV 11677—December 2005
The WUE for irrigation water applied was 32.7 kg/ha.mm, whereas the WUE was 28.3 kg/ha.mm for
irrigation plus rainfall less change in soil profile water.
Spray 2
In 2004/05, the crop received 379 mm as irrigation and 234 mm as rain resulting in 613 mm of water
received by the crop. As the average change in soil profile water (0–1.65 m) was measured as -40
mm, the total water used by the crop, assuming there was no runoff or deep drainage, was increased to
653 mm.
The WUE for irrigation water applied was 58 kg/ha.mm, whereas the WUE was 34 kg/ha.mm for
irrigation plus rainfall less change in soil profile water.
Flood
The border-check irrigated maize received 465 mm irrigation water and 180 mm of rain, a total of 644
mm. The volumetric water content (0–1.30 m) of the soil was essentially unchanged (1 mm drier at
harvest). The total water used in growing the crop was 643 mm, not allowing for any deep drainage.
The WUE for irrigation water applied was 42 kg/ha.mm, whereas the WUE was 30 kg/ha.mm for
irrigation plus rainfall less change in soil profile water.
MaizeMan
CSIRO Land and Water have developed a computer software package to assist maize growers when
making management decisions, especially on time of sowing, irrigation and nitrogen management.
The program MaizeMan uses the Swagman Destiny model for crop and water relations. The data from
the Spray 1 crop was tested with a version of the program. The program indicated that the nutrient and
water management of the crop did not limit the growth of the maize. The program predicted that final
DM yield of the crop would be about 20 t DM/ha which was in agreement with our yield
measurements. A new version of the program has been released, but we have not had the opportunity
to test it with our data.
Final Report on DAV 11677—December 2005 25
Discussion
Soil chemistry
In northern Victoria, N, P and S are the most likely nutrients that could limit the growth of maize.
Nitrogen was banded before sowing and applied again during the critical stages of each crop’s
development. All the P and S were applied before sowing. It was apparent that the nutrient
requirements (including N) of the crops were adequately met with the fertiliser management used by
the growers (Pritchard 1995). The Flood paddock appeared to have a ‘low’ soil K status that was
increased with K fertiliser before sowing. There were no obvious signs of K deficiency in the crop.
The overall management of the crops by the growers was more than adequate. Therefore, it was
unlikely that nutrient availability had any major influence on the growth and final DM yield of the
crops.
Growth and DM production
The 3 maize crops were sown at recommended seed rates and the established seedling densities were
within the recommended range to obtain high yields for varieties with cumulative relative maturities
(CRM) ranging from 100 (Spray 2) to 118 (Spray 1) days. The short season variety (Spray 2) was
sown at a higher seed rate than the long season variety (Spray 1) in an attempt to increase the cob
weight relative to vegetative weight.
The almost linear increase in the number of leaf tips up to tasselling of each crop indicated that the
growth of maize was not subject to any major setback during the vegetative development. The DM
yields of the 3 maize crops (about 20 DM t/ha) were probably above the average of local farm DM
yields. Pritchard (1995) suggested that well managed maize can produce 20 to 30 t DM/ha in northern
Victoria. In southern NSW, Edraki et al (2003) reported that maize grown on beds, under furrow
irrigation, produced 24.4 and 20.5 t DM/ha over 2 years. Under border-check irrigation, maize grown
on the flat can suffer substantial yield loss (5–8 t DM/ha) due its susceptibility to waterlogging
(Mason et al. 1987). However, with adequate slope and good surface drainage, maize can be grown
using border-check irrigation, albeit with slightly lower DM yields compared with maize grown on
raised beds or hill and furrows. Many farmers prefer to grow maize using border-check irrigation for
easier irrigation and also to reduce cultivation costs before and after the crop. The yield of the border-
check irrigated crop was less the maize grown under centre pivot irrigation, but the yield penalty was
small.
There was a fairly good agreement between the average DM yield of the monitoring sites and that
harvested for silage. Although the average DM yields were reasonably high, there were areas in the
crops that yielded much lower or higher than the average DM yield. The reasons for the differences in
growth at the centre pivot irrigation site, especially in 2003/04, may have included variability in water
26 Final Report on DAV 11677—December 2005
application and/or infiltration. The paddock had a sloping topography that caused water to run ahead
of the centre pivot. Soil tests indicated that the soil was susceptible to slaking and dispersion that
suggests that increasing soil organic matter and additional gypsum application may assist in treating
the structural problem. Spray 2 (a shorter season variety) was more uniform in height. It was
interesting that the 2 crops grown with spray irrigation had very similar total biomass yields despite a
difference of 18 days in CRM and a large difference in cob:stover ratios. There would be a number of
factors that contributed to this outcome, including differences in temperature and other weather
conditions, cultivar characteristics, plant density and irrigation management. At the border-check
irrigation site, the crop was uniform in height and any variation in biomass between sites could have
been due to differences in plant density.
The nutritive value of the maize at harvest, was at the top end of the expected values (Moran et al.
1990, Stockdale and Beavis 1994), indicating that the crops were harvested at the correct time. The
small differences in the nutritive value of the maize sampled at different times during the harvest
means that the maize was a relatively consistent product for ensiling. There was only a small decrease
in DMD of the harvested material following ensiling which is a positive feature of maize.
Water use and irrigation scheduling
The good agreement between the FAO 56 model and measured soil water deficit data indicate that the
basal crop coefficients provided, and adjusted for local weather conditions as described by Allen et al
(1998), are suitable for predicting crop water use (evapotranspiration) in northern Victoria. It should
also be noted, however, that the crops we studied had excellent irrigation management despite the
grower’s using only their (substantial) experience of irrigating maize and “knowledge” of the
prevailing weather conditions. The growers, while not measuring potential evapotranspiration, had the
advantage of frequently observing their crops for signs of water stress.
The irrigation management of the two Spray crops was a sensible compromise between minimising
evaporation from the soil, maintaining the soil water deficit within a range which should be optimal
for crop growth, minimising the operating costs of the irrigation pump and maintaining some “buffer”
to store rainfall.
Irrigation management of the Flood crop was simpler, as only the timing of irrigation could be readily
controlled by the grower. The 10 to 14-day irrigation interval used by this grower seemed appropriate
as the estimated periods of crop stress prior to irrigation were short. However, the high water table
under this crop probably contributed to the crop’s water use and enabled a longer irrigation interval.
Shorter irrigation intervals may be required to maintain crop water use where the groundwater table is
lower.
Final Report on DAV 11677—December 2005 27
The water balance data for the 3 crops indicated that despite excellent irrigation management, losses
from surface runoff (which may be captured by an irrigation re-use system) and drainage below the
rootzone do occur. For the Spray 2 crop, these losses were only associated with the 2 large rainfall
events. For the Flood crop, losses to the water table were an unavoidable consequence of the
irrigation method, and rainfall. Using the FAO 56 model, the estimated drainage below the rootzone
of the Flood crop was 51±50 mm, whereas the testwell data roughly indicate losses of 28 mm, with at
least the same error. Clearly, there was drainage below the rootzone at this site and this is potentially
a concern for the grower.
Water use efficiency
The maize crops grown under the centre pivot irrigation system (Spray 1 and 2) had water applied
frequently (twice each week), often about 20 mm per irrigation. In 2003/04, 6.6 ML/ha of irrigation
was used to grow the crop, whereas in the following year, Spray 2 received only 3.8 ML/ha irrigation
water, but 1.1 ML/ha more as rainfall. Although the yields of the 2 crops were similar, the WUE of
Spray 2 was higher because about 1.1 ML/ha less water (irrigation and rainfall) was used to grow the
crop. The lower water use was possibly due to the slightly lower evaporative demand in 2004/05 than
2003/04 and the shorter growing season of maize 36H36 that required less irrigations to reach
maturity. The flood-irrigated maize received about 0.9 ML/ha more irrigation water than Spray 2 and
its slightly lower WUE was due to the higher water use and its lower biomass yield.
There are few reports in which water use by maize has been measured directly. However, Davies et
al. (2002) suggests that 7.15 ML/ha should be sufficient to grow maize 4 out 5 years in NSW. Edraki
et al. (2003) reported that maize received 6.3 and 8.2 ML/ha as irrigation in 2 consecutive years, but
the total field water use was 7.2 and 9.1 ML and a proportion of the water use was from upflow due to
the shallow water tables. In our study, total water use was 7.6, 6.5 and 6.4 ML/ha for Spray 1, Spray 2
and Flood, respectively. Therefore, it is likely that there will be differences in crop water use
(requirement) from year to year, mainly depending on rainfall and potential evapotranspiration.
Edraki et al. (2003) found that the WUE of those crops were 34 and 23 kg DM/ha.mm for irrigation
plus rain for the 2 years. The difference in WUE between years was due to DM yield differences and
water use. Similarly, the 3 crops in the current study had a range in WUE from 28 to 34 kg
DM/ha.mm total water. The WUE of irrigation water ranged from 33 to 58 kg DM/ha.mm. The
higher WUE of irrigation can be misleading in years when the crop receives unusually high amounts
of summer rainfall. Compared to the reported WUE of other forages (10–20 kg DM/ha.mm,
Greenwood 2003), maize has a high WUE, with both spray and border-check irrigation, when high
yields (about 20 t DM/ha) are obtained.
28 Final Report on DAV 11677—December 2005
Conclusions
The water use efficiency of maize, in this study, ranged between 33 and 58 kg DM/ha.mm for
irrigation water use and 28 and 34 kg DM/ha.mm for total water use. The large variation in irrigation
water use was due to the large differences in rainfall between growing seasons. As expected, crop DM
yields were slightly higher under spray irrigation (22 t DM/ha) compared with flood irrigation (19 t
DM/ha). Even with excellent irrigation management, losses of water below the rootzone probably
occurred under at least 1 of the 3 crops.
The dual crop coefficient approach of FAO 56 (Allen et al. 1998) was able to adequately predict soil
water deficits measured under the crops, indicating that the basal crop coefficients, and adjustments,
provided by this model are appropriate for use in northern Victoria. Use of this model would enable
growers using pressurised irrigation systems, to schedule the timing and amount of irrigation for maize
for optimum growth. However, with considerable experience, and frequent observation of the crop
environment, growers are able to schedule irrigation to minimise crop stress without any special tools.
References
Allen RG (2000) Using the FAO-56 dual crop coefficient method over an irrigated region as part of anevapotranspiration intercomparison study. Journal of Hydrology 229, 27-41.
Allen RG, Pereira LS, Raes D, Smith M (1998) 'Crop Evapotranspiration: Guidelines for ComputingCrop Water Requirements.' FAO Irrigation and Drainage Paper No. 56 (FAO: Rome)
Ambrosio C, Linehan C (2005) Adoption of Alternative Forage Crops in the Irrigated Dairy Industry.Our Rural Landscapes milestone report. (Department of Primary Industries: Tatura).
Begg JE, Turner NC (1976) Crop water deficits. Advances in Agronomy 28, 161-217.
Davies L, Griffiths N, Pope L (2002) 'Comparing feed options in the 2002 drought-Maize silage isoften cheaper.' Agnote DAI 285. (NSW Agriculture: Dubbo)
Edraki M, Humphreys E, O'Connell N, Smith DJ (2003) 'Determination of irrigation efficiency anddeep drainage for irrigated maize with a shallow watertable.' CSIRO Land and Water TechnicalReport 30/03. (CSIRO Land and Water: Griffith)
Greenwood K (2003) 'Opportunities to Improve the Water Use Efficiency of Irrigated Forages forDairying in Northern Victoria: A Review.' Final report to DRDC on DAV 11176. (Department ofPrimary Industries: Kyabram)
Hodges T, Evans DW (1992) Leaf emergence and leaf duration related to thermal time calculations inCERES-Maize. Agronomy Journal 84, 724-730.
Final Report on DAV 11677—December 2005 29
Humphreys E, Edraki M, Bethune M (2003) 'Deep drainage & crop water use for irrigated annualcrops & pastures in Australia—a review of determinations in fields & lysimeters.' CSIRO Landand Water Technical Report 14/03. (CSIRO Land and Water: Griffith)
Isbell RF (1996) 'The Australian Soil Classification.' (CSIRO Publishing: Melbourne)
Mason WK, Pritchard KE, Small DR (1987) Effects of early season waterlogging on maize growthand yield. Australian Journal of Agricultural Research 38, 27-35.
Meyer WS (2005) 'The Irrigation Industry in the Murray and Murrumbidgee Basins.' CRC forIrrigation Futures Technical Report No. 03/05. (CSIRO)
Moran JB, Kaiser A, Stockdale CR (1990) The role of maize silage in milk and meat production fromgrazing cattle in Australia. Outlook on Agriculture 19, 171-177.
Prebble RE, Forrest JA, Honeysett JL, Hughes MW, McIntyre DS, Schrale G (1981) Field installationand maintenance. In 'Soil Water Assessment by the Neutron Method'. (Ed. EL Greacen) pp. 82-98. (CSIRO: Australia)
Pritchard K (1995) 'Irrigated summer fodder crops 4: Maize.' Agriculture Notes AG0229. (Departmentof Natural Resources and Environment: Kyabram)
Rayment GE, Higginson FR (1992) 'Australian Laboratory Handbook of Soil and Water ChemicalMethods.' (Inkata Press: Melbourne)
Research Services New England (1998) 'Probe for Windows: Irrigation scheduling and cropmanagement.' User Guide. (Research Services New England: Balmain)
Ritchie SW, Hanway JJ, Benson GO (1997) 'How a Corn Plant Develops.' Special Report No. 48.(Iowa State University of Science and Technology Cooperative Extension Service: Ames, Iowa)
Skene JKM, Poutsma TJ (1962) 'Soils and Land Use in Part of the Goulburn Valley, Victoria.'Technical Bulletin No. 14. (Department of Agriculture: Victoria)
Stace HCT, Hubble GD, Brewer R, Northcote KH, Sleeman JR, Mulcahy MJ, Hallsworth EG (1968)'A Handbook of Australian Soils.' (Rellim Technical Publications: Glenside, S.A.)
Stanhill G (1986) Water use efficiency. Advances in Agronomy 39, 53-85.
Stockdale CR, Beavis GW (1994) Nutritional evaluation of whole plant maize ensiled at three choplengths and fed to lactating dairy cows. Australian Journal of Experimental Agriculture 34, 709-716.

30 Final Report on DAV 11677—December 2005
Ward PR, Dunin FX, Micin SF, Williamson DR (1998) Evaluating drainage responses in duplex soilsin a Mediterranean environment. Australian Journal of Soil Research 36, 509-523.