Final Report Baseline Hydrogeological Evaluation of ... Hydrogeological... · Final Report Baseline...
35
1 Final Report Baseline Hydrogeological Evaluation of Central Mackenzie Valley Oil and Gas Exploration Areas Sahtu Region, Northwest Territories THE GOVERNMENT OF THE NORTHWEST TERRITORIES Minister of Environment and Natural Resources June 2016 Prepared by: David L. Rudolph, Ph.D., P.Eng., University of Waterloo A. R. (Tony) Lotimer, M.Sc., P.Geo., ARL Groundwater Resources Ltd. James F. Barker, Ph.D., P.Geo., Waterloo Hydrogeology Advisors Inc.
Transcript of Final Report Baseline Hydrogeological Evaluation of ... Hydrogeological... · Final Report Baseline...

1
Final Report
Baseline Hydrogeological Evaluation of Central Mackenzie Valley
Oil and Gas Exploration Areas
Sahtu Region, Northwest Territories
THE GOVERNMENT OF THE NORTHWEST TERRITORIES
Minister of Environment and Natural Resources
June 2016
Prepared by:
David L. Rudolph, Ph.D., P.Eng., University of Waterloo
A. R. (Tony) Lotimer, M.Sc., P.Geo., ARL Groundwater Resources Ltd.
James F. Barker, Ph.D., P.Geo., Waterloo Hydrogeology Advisors Inc.

2
Table of Contents
1.0 INTRODUCTION…………………………………………………………..………..4
1.1 Challenges of a Baseline Hydrologic Study………………………………...5
1.2 Progress on a Baseline Monitoring Program………………………...…….6
1.3 Objectives of the Current Study…………………………………………….6
2.0 BACKGROUND (EXISTING) INFORMATION…………………………….…….7
3.0 REGIONAL CLIMATE, HYDROLOGY AND PERMAFROST…………….......8
4.0 GEOLOGIC SETTING………………………………………………………..….…9
4.1 Surficial Unconsolidated Sediments………………………………..………9
4.2 Bedrock Geology……………………………………………….……………9
5.0 GROUNDWATER - RELATED FIELD INVESTIGATIONS………….………12
5.1 Western Part of the Study Area (License EL470)………………….…….12
5.2 Central Part of the Study Area (Licenses 462 and 463)………………….12
5.3 Eastern Part of the Study Area (License 466B)……………………….….13
6.0 HYDROGEOLOGY……………………………………………………………..…..14
6.1 Interpretations from AMEC (July 2014)…………………………………14
6.2 Additional Hydrogeological Interpretation……………………………….16
6.2.1 Overburden Sediments………………………………………..….….....16
6.2.2 Bedrock Hydrogeology……………………………………………..….18
6.2.3 Groundwater Geochemistry……………………………………..…..19
6.2.4 Groundwater Recharge………………………………………………...25
6.2.5 Pathways for Vertical Groundwater Migration………………….…….26
7.0 DATA GAPS IN THE HYDROGEOLOGY……………………………………….26
8.0 BASELINE GROUNDWATER MONITORING STRATEGY……………….…27
LIST OF REFERENCES……………………………………………………..……………..28

3
List of Figures
1. Figure 1. Regional study site plan. (from AMEC, 2014, Figure 1)……………………………………..4
2. Figure 2. Stratigraphic Column, post Silurian to Tertiary (modified after Golder, 2015, Table 3 - 8)..10
3. Figure 3. Bedrock geology and regional structural geology of the study site (from AMEC, 2014, Figure
4)………………………………………………………………………………………………………….11
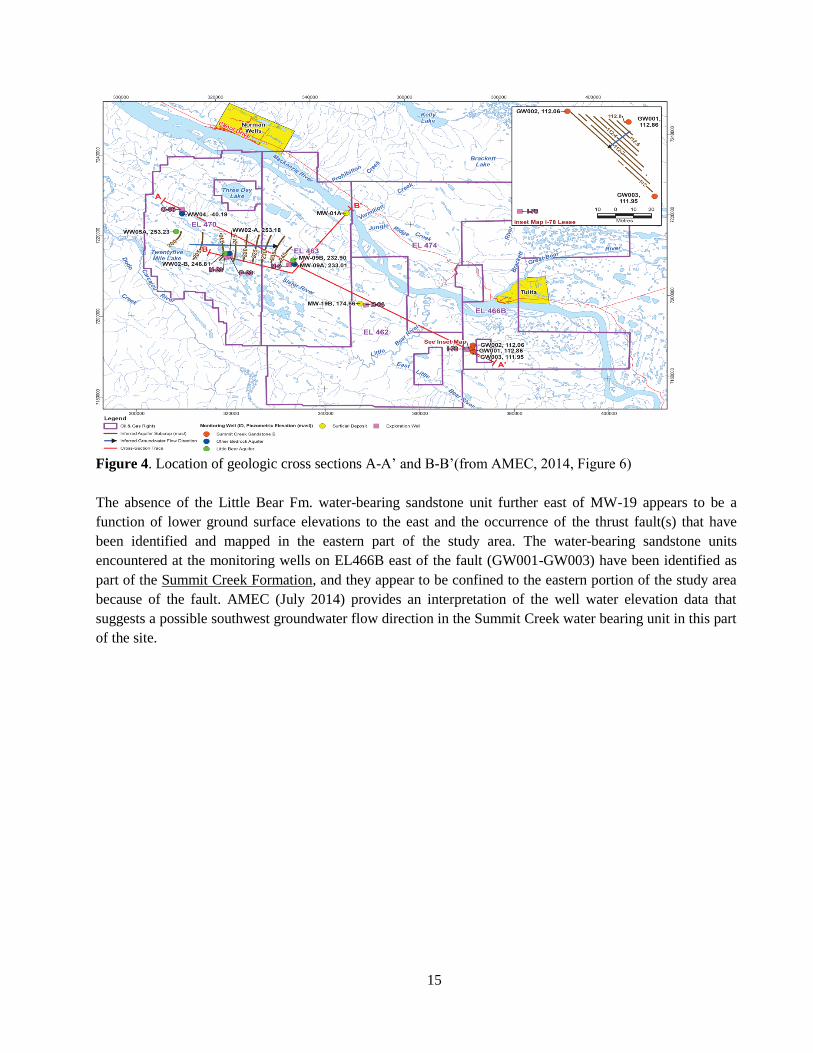
4. Figure 4. Location of geologic cross sections A-A’ and B-B’(from AMEC, 2014, Figure 6)…………..15
5. Figure 5. Geologic cross section A-A’ along with hydraulic head data in monitoring wells used to
construct the cross section (fromAMEC, 2014, Figure 7a)……………………………………………...16
6. Figure 6. Theoretical conceptual diagram of the relationship between the hydrologic cycle and the
existence and distribution of permafrost (from Golder, 2015, Figure 1-2)………………………………18
7. Figure 7. A Piper Plot of relative major ion concentrations (meq/L). Groundwater with similar chemistry
are expected to plot in similar positions in the cation and anion triangles and combined parallelogram.21
8. Figure 8. Plots of groundwater chloride concentration and TDS relative to depth of the sampling
location…………………………………………………………………………………………………22
9. Figure 9. Plots of the ratio of concentrations of chloride and fluoride in groundwater samples…23
10. Figure 10. Plot of the stable hydrogen (2H/1H) versus the stable oxygen isotope (18O/16O) ratios of the
Mackenzie River and groundwater samples. Data from AMEC, 2014. The local meteoric water line
(MWL) for Ft. Smith is shown………………………………………….………………………………24
List of Tables
Table 1. Average annual climatic conditions within the study area (after Golder, 2015)……………………8
Table 2. Major ion chemistry of groundwater samples collected from monitoring wells
(after AMEC 2014)…………………………………………………………………………………………..20
List of Appendices
APPENDIX A – List of Reports and Other Sources of Information Provided by the Government of the
Northwest Territories…………………………………………………………………………………………30
APPENDIX B - Proposed Potential Field Work Prior to the Decommissioning of the ConocoPhillips
Groundwater Wells EL 470 Lease, Sahtù Region, NWT…………………………………………………….31
APPENDIX C – Stratigraphic Sequence within the Study Area…………………………………………….35

4
1.0 INTRODUCTION
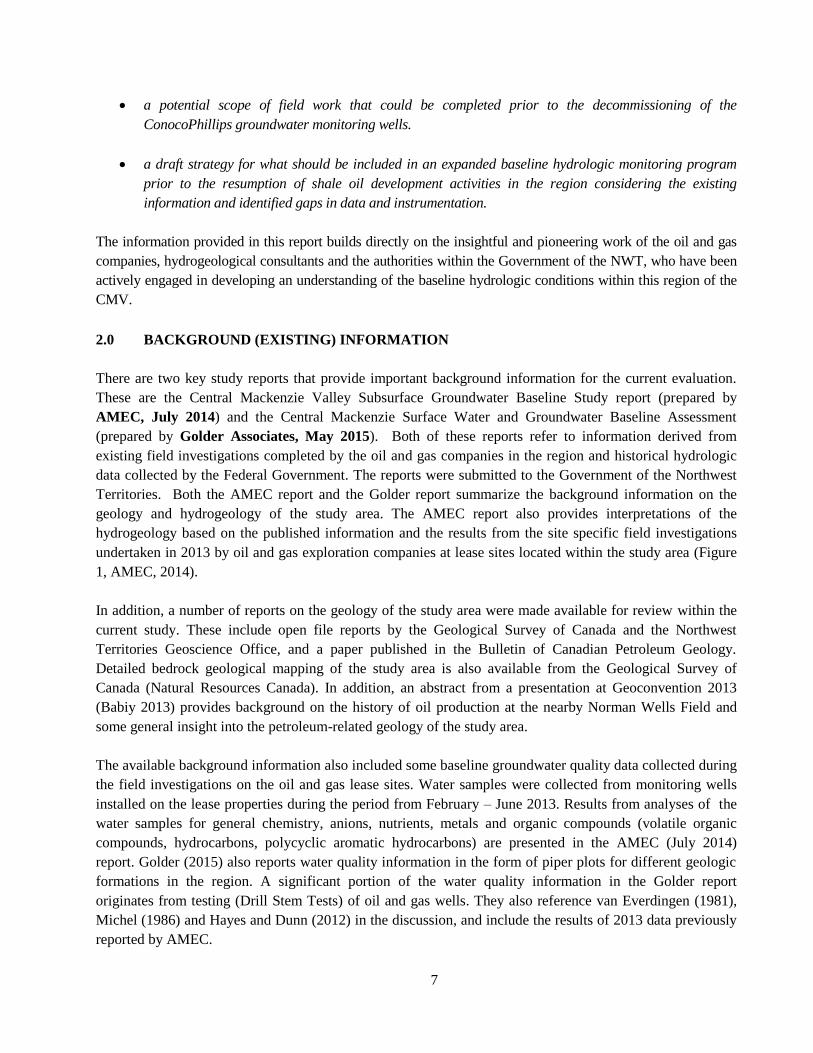
Interest and activity associated with the development of conventional and unconventional oil and gas
resources in the Sahtu Settlement Area (SSA) of the Central Mackenzie Valley (CMV) in the Northwest
Territories (NWT) has evolved over many decades. Recent years has seen a heightened focus on evaluating
the potential for oil and gas production from the Canol Formation, a Devonian petroliferous shale (AMEC,
2014). One area of active exploration has been established along the Mackenzie River between Tulita and
Norman Wells in the NWT (Figure 1, AMEC, 2014). Initial exploration of production potential from the
Canol oil shale formation has commenced at several sites within this general region. In concert with these
initial exploration actives, oil and gas companies have engaged in a series of regional and local scale studies
related to the baseline hydrologic conditions in the area. These studies have involved the installation of
groundwater monitoring wells and the establishment of surface water monitoring locations in the vicinity of
specific oil and gas leases. The main objectives of these baseline hydrologic studies have been to determine
groundwater resource potential and flow characteristics within the sediments and rocks underlying the lease
areas and to document baseline water levels and geochemical characteristics of the groundwater and surface
water. These data represent reference values that can be used to assess the potential occurrence and
magnitude of any changes in the local hydrologic conditions associated with future development of the shale
oil resources within the Canol Formation in this area.
Figure 1. Regional study site plan. (from AMEC, 2014, Figure 1)
5 0 5 1
0 Kilometre
s 1:475,00
0

5
1.1 Challenges of a Baseline Hydrologic Study
There are several unique aspects of both the physical setting in the CMV and the nature of the environmental
concerns associated with shale oil development that influence the design of an appropriate hydrologic
baseline study. Of specific concern is the potential impact on water quality and quantity in the region from
the shale oil development activities that may involve hydraulic fracturing of the Canol Formation deposits.
The shale oil development process has the potential to enhance the upward migration of naturally occurring
hydrocarbons and chemical constituents used in hydraulic fracturing. The baseline hydrologic program
would include water quality monitoring of groundwater and surface water resources with a focus on the
unique chemical constituents associated with the natural hydrocarbons and any fluids introduced in the
development process. Water quality protocols should be clearly specified with these constituents in mind.
The extraction of groundwater resources for operational purposes related to shale oil development may
influence the natural groundwater flow system and water levels and flow rates in surface water features. The
monitoring of surface and subsurface water levels both spatially and temporally represents another primary
component of the baseline study.
The resources are located in remote terrain within the NWT with exceptionally challenging access
limitations and climatic conditions. This significantly influences the installation of monitoring equipment
and the data collection process. The near surface environment is influenced by the presence of discontinuous
permafrost varying considerably in spatial occurrence and thickness and impacting the dynamics of the
hydrologic cycle within the surface and subsurface environments. The permafrost conditions add additional
monitoring challenges that must be considered within the scope of the baseline program.
An additional consideration in the design of a baseline hydrologic monitoring program is the geologic
conditions. The terrain is covered by a thin and highly variable mantle of glacial overburden sediments,
which is highly influenced by permafrost. These characteristics make the shallow environment especially
difficult to effectively instrument and monitor. The bedrock geologic sequence overlying the Canol
Formation is highly variable in nature and thickness and includes very low permeability shale deposits and
permeable water-bearing sandstones that may represent regional aquifer units. The distribution of these units
is influenced by structural geology features including major faults, further complicating the distribution of
subsurface monitoring targets. In some locations these targets are fairly deep, which is an additional
challenge for instrumentation and monitoring.
A final point of consideration is the distribution of natural hydrocarbon constituents throughout the
subsurface environment. The petroliferous strata within the geologic sequence are natural sources of
hydrocarbons that may migrate and become distributed throughout neighboring rock units or even be
released at ground surface. For example, there are historical references to naturally occurring surface oil
seeps at or near the Mackenzie River near Norman Wells. Indeed, the Norman Wells Field, situated to the
west of the study area could represent an additional source of hydrocarbons within the groundwater system
should there have been any fugitive releases through existing wells or exploration wells in that area. The
presence, characteristics and concentrations of these naturally occurring chemical constituents within the
groundwater system should be documented through the baseline study as they may represent some of the
critical target species that will be tracked as part of the long term environmental monitoring associated with
the development of the shale oil resources. As noted above, the Norman Wells Field, situated to the west of
6
the study area could represent another source of hydrocarbons within the groundwater system should there
have been any fugitive releases through existing wells or exploration wells. The presence, characteristics and
concentrations of naturally occurring chemical constituents within the groundwater system should be
considered as part of the baseline study as they may represent some of the critical target species that will be
tracked as part of the long term environmental monitoring associated with the development of the shale oil
resources.
1.2 Progress on a Baseline Monitoring Program
Over the last several years, oil and gas companies working in this region of the NWT have initiated a series
of baseline monitoring programs that have yielded valuable information regarding the hydrologic nature of
the surface and subsurface environments. ConocoPhillips Canada, Husky Oil Operations Ltd. and MGM
Energy Corp. have begun exploration of the Canol Formation in this region and have established
environmental monitoring programs on their respective leases. These site specific programs have been
pioneering in the sense that there are no specific guidelines as to how these types of baseline environmental
monitoring programs should be designed. The data derived from these studies have provided information
regarding the surface and subsurface hydrology of the region including the occurrence of bedrock aquifer
units, regional structural geology and groundwater geochemistry. The government of the Northwest
Territories has employed several consulting companies to provide an interpretation of the combined
information derived from the existing baseline hydrologic studies that have been completed in the area.
These studies have provided excellent advice concerning the hydrogeologic conditions in the vicinity of the
different lease sites and have identified potential gaps in current knowledge that could inform the continued
evolution of the baseline monitoring program. The data and knowledge provided in these combined
investigations form the main reference material in support of the current study.
1.3 Objectives of the Current Study
Recently, activities associated with the exploration of the Canol Formation oil shale resource have been
temporarily reduced within this region of the CMV for a variety of reasons. Authorities within both the
Government of the NWT and the oil and gas companies have recognized this temporary hiatus in exploration
activity as an excellent opportunity to continue the development of a comprehensive baseline hydrologic
monitoring program in support of the future potential development of the Canol Formation. To this end the
NWT have commissioned the current study with the following initial objectives:
Complete a desk top survey of hydrogeological reports and current groundwater information within the
vicinity of several oil and gas lease sites in the Canol Shale area selected by the study team.
Develop a conceptual model of regional groundwater flow conditions in the vicinity of the selected field
study sites through the integration of all existing data with in-depth hydrogeological evaluation.
Following an initial evaluation of the available information, imminent plans to decommission a set of
groundwater monitoring wells at one of the lease sites and through discussions with Government of NWT
personnel, the objectives of the study were extended to include:
7
a potential scope of field work that could be completed prior to the decommissioning of the
ConocoPhillips groundwater monitoring wells.
a draft strategy for what should be included in an expanded baseline hydrologic monitoring program
prior to the resumption of shale oil development activities in the region considering the existing
information and identified gaps in data and instrumentation.
The information provided in this report builds directly on the insightful and pioneering work of the oil and gas
companies, hydrogeological consultants and the authorities within the Government of the NWT, who have been
actively engaged in developing an understanding of the baseline hydrologic conditions within this region of the
CMV.
2.0 BACKGROUND (EXISTING) INFORMATION
There are two key study reports that provide important background information for the current evaluation.
These are the Central Mackenzie Valley Subsurface Groundwater Baseline Study report (prepared by
AMEC, July 2014) and the Central Mackenzie Surface Water and Groundwater Baseline Assessment
(prepared by Golder Associates, May 2015). Both of these reports refer to information derived from
existing field investigations completed by the oil and gas companies in the region and historical hydrologic
data collected by the Federal Government. The reports were submitted to the Government of the Northwest
Territories. Both the AMEC report and the Golder report summarize the background information on the
geology and hydrogeology of the study area. The AMEC report also provides interpretations of the
hydrogeology based on the published information and the results from the site specific field investigations
undertaken in 2013 by oil and gas exploration companies at lease sites located within the study area (Figure
1, AMEC, 2014).
In addition, a number of reports on the geology of the study area were made available for review within the
current study. These include open file reports by the Geological Survey of Canada and the Northwest
Territories Geoscience Office, and a paper published in the Bulletin of Canadian Petroleum Geology.
Detailed bedrock geological mapping of the study area is also available from the Geological Survey of
Canada (Natural Resources Canada). In addition, an abstract from a presentation at Geoconvention 2013
(Babiy 2013) provides background on the history of oil production at the nearby Norman Wells Field and
some general insight into the petroleum-related geology of the study area.
The available background information also included some baseline groundwater quality data collected during
the field investigations on the oil and gas lease sites. Water samples were collected from monitoring wells
installed on the lease properties during the period from February – June 2013. Results from analyses of the
water samples for general chemistry, anions, nutrients, metals and organic compounds (volatile organic
compounds, hydrocarbons, polycyclic aromatic hydrocarbons) are presented in the AMEC (July 2014)
report. Golder (2015) also reports water quality information in the form of piper plots for different geologic
formations in the region. A significant portion of the water quality information in the Golder report
originates from testing (Drill Stem Tests) of oil and gas wells. They also reference van Everdingen (1981),
Michel (1986) and Hayes and Dunn (2012) in the discussion, and include the results of 2013 data previously
reported by AMEC.

8
This report draws specifically from the AMEC (July 2014) report and, to a lesser extent, the Golder (2015)
report as they present relevant information on the geology and hydrogeology of the study area, and they
provide a detailed account of the progress made so far on the baseline groundwater monitoring program. No
additional field work or data collection were completed within the scope of this current study.
3.0 REGIONAL CLIMATE, HYDROLOGY AND PERMAFROST
Golder (2015) characterizes the study area as a subarctic climate (based on the work of Rouse et. al. 1997),
with mean annual air temperatures below 00 C. They provide the following data from Environment Canada
for the Norman Wells and Tulita climate stations for the period from 1943 – 2012:
Table 1. Average annual climatic conditions within the study area (after Golder, 2015)
AMEC (2014) also provides information on the climate of the study area and notes that mean annual
precipitation averages 291 mm/year, with rainfall at 166 mm and snowfall at 153.4 cm. AMEC also notes an
increase in temperature from the long term mean during the period from 1970 -2010.
The Mackenzie River is the major drainage feature in the area, flowing northwest and eventually discharging
to the Arctic Ocean. Mapping in the AMEC and Golder reports indicates that several tributary rivers also
occur in the study area including the Great Bear River, Little Bear River, Slater River and Carcajou River.
Numerous lakes, both large (Three Day Lake, Brackett Lake) and small, also occur in the area and appear to
connect with the Mackenzie River by an intricate network of smaller tributaries and wetlands.
In the Golder (2015) report, permafrost is defined as "soil, rock, or sediment that remains at or below 00 C
for at least two consecutive years (Smith 2011)". Further, Golder notes that "permafrost may contain pore
ice, ice lenses, ice wedges and other types of ice structures". Information in the Golder report indicates that
permafrost is discontinuous in the CMV including the oil exploration area between Norman Wells and
Tulita. Mapping of permafrost extent and ice content based on data obtained from Natural Resources Canada
and the National Snow & Ice Data Center shows that ice content within the permafrost is also variable,
described as anywhere from 'nil' (sporadic) to 'moderate to high' (discontinuous) (Golder, 2015).
AMEC (2014) notes that the study area is located within a transition zone between extensive discontinuous
permafrost (where permafrost is present beneath 50-90% of the land surface) and intermediate-discontinuous
permafrost (where permafrost occurs beneath 35-65% of the land surface). This observation is supported by
mapping in their report (AMEC, 2014; based on information reportedly obtained from Heginbottom and
Radburn 1992; Spatial Data Warehouse Ltd.; Geological Survey of Canada). AMEC notes that permafrost
thickness varies from 50 – 143 m in the Norman Wells area, and that local variations in permafrost thickness
Station Norman Wells Tulita**
Average annual mean air temperatures -5.70 C -5.30 C
Average annual rainfall (mm) 181.0 193.5
Average annual snowfall (cm) 151.8 114.9

9
and occurrence result from a variety of factors. They note that unfrozen ground typically occurs near surface
water bodies such as major lakes and rivers. Bedrock and coarse-grained sediments (sand and gravel)
typically have relatively low permafrost ice content whereas organic deposits and fine-grained sediments
have higher permafrost ice contents.
4.0 GEOLOGIC SETTING
4.1 Surficial Unconsolidated Sediments
Beneath a thin cover (0.5 – 1 m) of organic material (peat, muskeg, organic soils), AMEC (2014) notes that
the surficial geology of the study area has been mapped by the Geological Survey of Canada (Duk-Rodkin
2002, 2004), and provides a useful map of the surficial geology in their report (AMEC, 2014). The map
indicates that most of the study area is underlain at surface by glacial till, with areas of fine-grained
glaciolacustrine deposits near the Mackenzie River. Coarser grained surficial sediments (sand, gravel) appear
to be very localized or confined to relatively thin zones along the major rivers (i.e. alluvial deposits adjacent
to the Mackenzie River; glaciofluvial and alluvial sediments adjacent to the Little Bear and Carcajou Rivers).
AMEC reports that the overburden is relatively thin (typically 0 – 10 m in thickness), with thicknesses up to
30 m in some areas. These thicknesses are consistent with the logs for the various monitoring wells and
boreholes drilled as part of the field investigations on the oil and gas exploration leases. However, an isopach
map of the overburden thickness would be helpful in understanding the occurrence and nature of the surficial
sediments within the study area.
4.2 Bedrock Geology
Although complicated, the bedrock geology of the area appears to be reasonably well understood through the
work of the oil and gas companies and the Geological Survey of Canada (Fallas et. al. 2013a,b,c,d; Hannigan
et. al. 2011; Mossop et. al. 2004). Both AMEC (July 2014) and Golder (May 2015) provide good
descriptions and maps of the bedrock geology in the area. Information in Golder (May 2015) shows that
much of the study area is located within the Northern Foreland Belt (part of a fold and thrust belt of the
Eastern Cordillera). The Northern Foreland Belt (NFB) includes 3 sedimentary provinces, from west to east
as follows: Mackenzie Mountains, Mackenzie Plain, Franklin Mountains. The Great Bear Plain (part of the
Interior Plains) occurs northeast of the NFB.
The stratigraphy of the sedimentary rock sequence in the study area is shown in Figure 2 (Golder, 2015). An
alternative version of the stratigraphic sequence from the AMEC (2014) report is included in Appendix C.
Using geological mapping by the GSC (Fallas and others, 2013), AMEC also prepared a bedrock geology
map for the study area (Figure 3, AMEC, 2014). The map shows the location of a syncline (Twenty Five
Mile Lake Syncline) in the western part of the study area and the location of two faults (Norman Range
thrust fault and the Gambill reverse fault) in the eastern part of the study area. Review of the geological
mapping by the GSC also shows the presence of an anticline (Loon Creek Anticline), running parallel to the
syncline, between Three Day Lake and the Mackenzie River. These structural features are important controls
on the occurrence of the bedrock formations relevant to the baseline groundwater evaluation.

10
Period &
Epoch
Formation
(Group) Lithology
Max.
Thick-
ness
(m)
Potential
Regional
Bedrock
Aquifer
Late
Cretaceous to
Tertiary
Summit
Creek
Conglomerate,
sandstone, coal 400 YES
Late
Cretaceous
East Fork
Shale shale 500 NO
Unconformity
Late
Cretaceous
Little Bear sandstone, coal 560 YES Slatter
River
shale,
sandstone 400 ??
Unconformity
Early
Cretaceous
Mahony
Lake sandstone,
siltstone, shale
--- ??
Sans Sault
Member 100 ??
Artic Red shale,
sandstone 300 ??
Martin
House
sandstone,
siltstone 100 YES
Unconformity
Late
Devonian Imperial
shale, siltstone,
sandstone,
limestone
400 ??
Middle to
Late
Devonian
Canol
(Horn
River)
black shale,
siltstone 180 NO
Middle
Devonian
Kee Scarp-
Ramparts
limestone,
siltstone, black
shale
200 YES
Horn River
Group
shale,
limestone -- ??
Hare Indian
(Horn
River)
shale, black
shale, siltstone 185 ??
Hume limestone,
shale 300 YES
Early to
Middle
Devonian
Landry
(Bear
Rock)
limestone 20
YES
Arnica
(Bear
Rock)
dolostone 50
Fort
Norman
(Bear
Rock)
gypsum,
anhydrite 400
Figure 2. Stratigraphic Column, post Silurian to Tertiary (modified after Golder, 2015, Table 3 - 8).
It is understood that the main oil and gas exploration target in the study area at the present time is the Canol
Formation shale. Based on the work by the GSC, AMEC describes the Canol Formation shale as a

11
Devonian petroliferous shale that forms part of the Horn River Group. It is overlain by marine shales of the
Imperial Formation and Cretaceous sandstone/shale formations. AMEC reports that oil exploration well I-78
(located on the east side of the thrust fault in lease EL466B), intersected the Canol Formation shale at depths
of 1819 – 1919 m below surface. AMEC also notes that the Canol Formation shale shows up on the bedrock
geology map as one of the subcrop units in the vicinity of Norman Wells.
Figure 3. Bedrock geology and regional structural geology of the study site (from AMEC, 2014, Figure 4)
At the Norman Wells oil well field to the northwest, it is understood that most of the oil production wells are
located on one or more man-made islands in the Mackenzie River, adjacent to Norman Wells. According to Babiy
(2013), the hydrocarbon reservoir at the well field is a Mid-Late Devonian carbonate reef complex, with a top
elevation that varies from approximately 320 – 650 m.
The Geological Survey of Canada (2013) prepared a series of isopach maps of the Cretaceous formation
thicknesses based on an updated interpretation of Cretaceous strata in the study area. The isopach maps
included (a) the Lower Cretaceous units (Martin House and Arctic Red formations in Figure 2), (b) Slater
River Fm., (c) Little Bear Fm., (d) East Fork Fm. and (e) the Summit Creek Fm. The maps were prepared in
late 2012, prior to the drilling and installation of the monitoring wells on the oil and gas lease sites. The

12
maps indicate that the East Fork Fm. and the Summit Creek Fm. are essentially confined to the east part of
the study area (east of the major thrust faults seen in Figure 3). The isopach maps support the AMEC (2014)
interpretations showing the Canol Formation subcropping near Norman Wells, while at the same time
occurring at depths of more than 1800 m at oil exploration well I-78 (on lease EL466B), approximately 40 –
50 km to the southeast.
5.0 GROUNDWATER - RELATED FIELD INVESTIGATIONS
Detailed information on the hydrogeology appears to be limited to the field investigations performed in 2013
on the oil and gas exploration lease properties noted above. A summary of that work, based on information
in the AMEC report (AMEC, July 2014), is provided as follows. Refer to Figure 1 (AMEC 2014) for the
well locations.
5.1 Western Part of the Study Area (License EL470)
Four monitoring wells were constructed in the western part of the study area by ConocoPhillips Canada
during the period January – March 2013. The wells were drilled using water and mud rotary methods and the
drill holes were logged with neutron, electrical resistivity and natural gamma instruments. The geophysical
logs, lithologic descriptions of the materials encountered during drilling and the well completion details are
provided in the AMEC (2014) report. Geological formation names are not identified on the logs.
Three of the monitoring wells (WW02-A, WW02-B, WW05-A) were reported by AMEC (2014) as being
completed in water bearing sandstone units of the Little Bear Formation, with reported screen depth settings
of 196-202 m (WW02A), 87-96 m (WW02B) and 92-107 m (WW05-A). The fourth well (WW04-A) was
deeper, extending to a total depth of 473 m. In the fourth well (WW04-A), the well casing was perforated
over the depth interval from 399-408 m, which according to the information provided by AMEC, is in the
Martin House Formation.
Hydraulic or aquifer testing was not performed at these wells. However, water samples were collected and
tested for general chemistry. Water level information for the monitoring wells is provided in the AMEC
report (AMEC, 2014 - Table 2, Figure 6, Figures 7a and 7b, Borehole Logs).
5.2 Central Part of the Study Area (Licenses 462 and 463)
Four monitoring wells were constructed in the central part of the study area by Husky Oil Operations Ltd. in
February 2013. The wells were drilled using mud rotary methods and the drill holes were logged with a
gamma tool. The geophysical logs, lithologic descriptions of the materials encountered during drilling and
the well completion details were prepared by Waterline Resources Inc. and are provided in the AMEC
(2014) report. Geological formation names are not identified on the logs.
Two of the monitoring wells (MW-09A, MW-09B) were constructed in the west portion of this area and
were reported as being completed in water bearing sandstone units of the Little Bear Formation, with screen
depth settings of 109-120 m (MW-09A) and 80-90 m (MW-09B). One shallow monitoring well (MW-19B)
was constructed in the central portion of this area, with a screen depth setting from 6.4 – 8.9 m. The

13
completion zone sediments at MW-19B were reported as clay, siltstone and shale (indicating a completion
across the overburden-bedrock surface contact), with the first observation of unfrozen water at a depth of 8.3
m. An additional shallow monitoring well (MW-01A; screen depth setting from 6.1-10 m) was constructed at
a location adjacent to the Mackenzie River. The completion zone sediments were reported as frozen sand and
sandy silt (overburden) at the time of drilling and the well was dry. Logs for a fifth test hole (MW-19A near
monitoring well MW-19B) drilled to a depth of 145 m are also provided in the report, but the logs indicate
that the drill hole was cemented and abandoned.
Pumping tests were reported for two of the Husky monitoring wells. MW-09A was tested for 3 days and
MW-09B was tested separately for 0.6 days. According to AMEC (AMEC, July 2014), both wells were
tested at a flow rate of 600 m3/day. However, on cross-section B-B' in the report it shows the test flow rates
to be 41.7 L/min (60 m3/day). The pumping test data were analyzed using the Jacob method to produce
transmissivity estimates in the range of 150 – 1000 m2/day, but according to AMEC the analyses were
affected by late time response in the drawdown trend that may have been related to boundary conditions or
other factors. Long term sustainable yields from the 2 wells were estimated at 941 and 1,220 m3/day,
respectively.
A bail test was undertaken at the shallow monitoring well MW-19B (located in the central portion of the
area). Analysis of the bail test data using the Bouwer and Rice method reportedly yielded a hydraulic
conductivity estimate of 8 x 10⁻⁶ m/s.
Water samples were collected from the 3 monitoring wells and tested for general chemistry. Water level
information for the monitoring wells is provided in the AMEC report (AMEC, 2014 - Table 2, Figure 6,
Figures 7a and 7b, Borehole Logs).
Borehole logs are also available for a series of thermistor sensors installed on the license property using
hollow and solid stem augers. The boreholes vary in depth from approximately 2 – 30 m and include
descriptions of the overburden sediments encountered during drilling. The borehole logs report that most of
the overburden sediments were frozen.
5.3 Eastern Part of the Study Area (License 466B)
Three monitoring wells were constructed in the eastern part of the study area by MGM Energy in January-
February 2013. All three monitoring well completions are in close proximity to MGM exploratory well I-78.
All of the wells were logged with gamma, SP, caliper and resistivity tools. Two of the wells were also logged
with a sonic tool. From the logs it is inferred that the wells were drilled using mud rotary methods. The
geophysical logs, descriptions of the materials encountered during drilling and the well completion details
were compiled by AECOM and are provided in the AMEC (2014) report. Geological formation names are
not identified on the logs. AMEC (2014) reports that all well completions are in sandstone units of the
Summit Creek Formation (GW001 was screened from depths of 66- 74 m; GW002 was screened from 67-74
m; GW003 was screened from 67-72 m). A number of other sandstone layers above and below the well
completion intervals were noted from the drill hole logs; these appear to also be part of the Summit Creek
Formation.

14
A 24 hour pumping test was performed at GW003 with the well operating at a reported flow rate of 54.4
m3/day. Specific capacity at the end of the test was approximately 5 L/min/m. AMEC reports that the test
results were analyzed using the Theis (1935) and Hantush and Jacob (1955) methods, resulting in
transmissivity estimates of 14 – 18 m2/day and storativity estimates of 6.7 x 10⁻⁵ – 1.5 x 10⁻⁴. The results
indicated a confined aquifer response, and the theoretical long term well yield was estimated at 167 m3/day.
Water samples were collected from the monitoring wells and tested for general chemistry, metals, organic
parameters (volatile organic compounds, polycyclic aromatic hydrocarbons, petroleum hydrocarbons) and a
number of specific isotopes. Water level information for the monitoring wells is provided in the AMEC
report (AMEC, 2014 - Table 2, Figure 6, Figures 7a and 7b, Borehole Logs).
6.0 HYDROGEOLOGY
6.1 Interpretations from AMEC (July 2014)
AMEC (July 2014) provides an interpretation of the limited groundwater elevation data available from the
above referenced wells for the Little Bear Formation in the western part of the study area. The interpretation
indicates a flow direction from the west to the east. AMEC also provides an interpretation of the lateral
continuity of the Little Bear Formation and Summit Creek water bearing sandstone units (aquifers) in two
cross-sections (Figure 4) in their report. The cross-sections show that the water-bearing sandstone units in
the Little Bear Formation (screened/tested by the various monitoring wells described above) are continuous
in the western part of the study area. Cross-section A-A' (Figure 5) shows that the units appear to terminate
at some point to the west of MW-19(A,B) in the central part of the study area (EL 462). Sandstone was only
encountered in the upper 20 m of the deep test hole MW-19A (with shale reported on the logs from about 20
- 145 m). The cross-section indicates that ground surface elevation is lower at MW-19 (A,B), and that the
upper sandstone encountered in MW-19A may represent a relatively near surface occurrence of the Little
Bear Formation water bearing unit, with possible groundwater discharge occurring from that unit in this part
of the study area (AMEC, 2014). The stratigraphy and occurrence/nature of permafrost conditions are
important factors to consider in determining the significance of groundwater discharge from the Little Bear
Fm. in this area.
15
Figure 4. Location of geologic cross sections A-A’ and B-B’(from AMEC, 2014, Figure 6)
The absence of the Little Bear Fm. water-bearing sandstone unit further east of MW-19 appears to be a
function of lower ground surface elevations to the east and the occurrence of the thrust fault(s) that have
been identified and mapped in the eastern part of the study area. The water-bearing sandstone units
encountered at the monitoring wells on EL466B east of the fault (GW001-GW003) have been identified as
part of the Summit Creek Formation, and they appear to be confined to the eastern portion of the study area
because of the fault. AMEC (July 2014) provides an interpretation of the well water elevation data that
suggests a possible southwest groundwater flow direction in the Summit Creek water bearing unit in this part
of the site.

16
Figure 5. Geologic cross section A-A’ along with hydraulic head data in monitoring wells used to construct
the cross section (fromAMEC, 2014, Figure 7a).
6.2 Additional Hydrogeological Interpretation
The work presented by AMEC (July 2014), provides a good basis for a conceptual understanding of the
hydrogeological conditions in the CMV study area. Based on the available data and the hydrogeologic
interpretations provided by the previous consultants, the local hydrogeologic conditions that may influence a
hydrologic baseline monitoring program in the region are discussed below. For clarity, the physical and
chemical hydrogeology is discussed separately and the combined observations are considered in developing
additional advice on the nature of subsequent field investigations and the baseline monitoring.
6.2.1 Overburden Sediments
The surficial overburden sediments are relatively thin (0-30 m) and appear to consist mostly of lower
hydraulic conductivity sediments (glacial till, silt-clay), except locally (i.e. at WW04A with 25 m of mostly
sand) and adjacent to the Mackenzie River (i.e. MW-01 with 9.5 m of silt and silty sand). Subsurface
definition of the overburden sediments within the study area is very limited due to the sparse density of
detailed drill log information. However, available information provides little, if any, evidence of significant
or laterally extensive aquifers in the overburden sediments. As noted above, there are isolated units within
the glacial overburden that are higher permeability and could be highly conductive of groundwater
depending on the extent of the feature. Overall the overburden sediments likely represent a barrier to upward

17
migration of deeper groundwater in the region and as such will influence the surface expression of any
potential contaminants associated with oil and gas development in the future. More detailed mapping of the
nature and thickness (isopach) of the overburden sediments would be of value.
Most of the overburden sediments encountered at the monitoring wells and boreholes was reported as frozen
so permafrost has an important influence on groundwater flow in the overburden. Frozen sediments, if close
to being water saturated, can function as a very low permeability layer separating the deeper groundwater
flow system from the near surface environment. Breaches in the continuity of the permafrost may represent
preferential pathways for groundwater flow. It has been suggested (Golder, 2015 and others) that there may
be potential for unfrozen soil conditions beneath and in the vicinity of surface water features (rivers, streams,
lakes, wetlands) (Figure 6). Although this would be consistent with observations in other locations where
discontinuous permafrost exists, this condition was not observed in the shallow monitoring well located next
to the Mackenzie River (MW-01A), the most significant surface water feature in the area. Approximately 10
m of frozen sediment was encountered at this monitoring well, illustrating the uncertainty associated with the
occurrence of permafrost conditions in this environment. There are many surface water features within the
study area ranging from a major river to various size lakes and wetlands. To date there appears to be no
conclusive evidence of the persistence and depth of permafrost near the surface water features; however, it
still remains possible that the presence of the surface water influences the occurrence of permafrost. For
example, Michel (1986, p. 402) in reference to springs along the Mackenzie River, suggests: “Permafrost
does not appear to form a significant barrier to the discharge of regional flow systems. Water temperatures
are sufficiently high that taliks can be maintained with little difficulty.” In addition, springs and discharge
into surface water bodies are mentioned in the traditional knowledge section within the Golder (2015) report
(section 2.5.4) providing additional evidence of active groundwater-surface water interaction. It should be
noted that the conceptual diagram presented in Figure 6 is very generalized in nature and does not reflect the
current understanding of the hydrologic conditions within the overburden sediments within the study area. It
does, however, illustrate some of the subsurface variability that can be related to different permafrost
conditions and the influence on the interaction between groundwater and surface water.

18
Figure 6. Theoretical conceptual diagram of the relationship between the hydrologic cycle and the existence
and distribution of permafrost (from Golder, 2015, Figure 1-2).
An additional observation related to the surface water system is that many of the smaller streams tend to flow
in very straight and rectilinear orientations both parallel and perpendicular to the axis of the anticline
structure and the Mackenzie River itself. This may indicate the presence of a larger scale joint pattern within
the subsurface that is influencing the surface water drainage patterns. The distribution of permafrost within
the overburden sediments in the study area remains as a critical factor controlling shallow groundwater flow
and groundwater surface water interaction and merits further consideration in subsequent studies.
6.2.2 Bedrock Hydrogeology
Two bedrock aquifers have been identified and correlated within the study area. These are the Little Bear
Formation aquifer unit in the west part and the Summit Creek Formation aquifer unit in the east part.
Both units are sandstone and interbedded sandstone/shale, and may consist of one or more intervals of water
bearing/transmitting bedrock separated by intervals that are less permeable or essentially impermeable. The
two aquifers appear to be separated in the central part of the study area by the Slater Formation shales that
subcrop in that area. The two aquifers appear to be the only significant water-bearing units above the main
oil and gas target horizon (the Canol shale, a unit of the Horn River Group, Figure 2, adapted from Golder,
2015). AMEC (2014) reports that one of the groundwater monitoring wells in the western part of the study
area (WW04-A in EL 470) was completed in the Martin House Fm. Hydraulic testing information is not
available for the well to support an interpretation of whether it should be considered as a potential aquifer. It

19
is possible that relatively thin sandstone interbeds or layers within the shale sequence of the Martin House
Fm. may have some aquifer characteristics, perhaps on a local scale.
The Little Bear Fm. aquifer appears to occur as a series of sandstone intervals between elevations 120 – 210
m (above sea level). There is an interval (approximately 10 – 15 m in thickness) that appears to be laterally
continuous in the western part of the study area. Evidence from the GSC isopach maps would suggest that
the Little Bear Fm. aquifer also exists east of the major thrust fault at depths of about 600 m. The Summit
Creek Fm. aquifer (approximately 20 m or more in thickness) appears to occur between elevations 70 – 125
m (above sea level) in the eastern part of the study area; it is not present in the western part of the study area
(due to erosion).
Groundwater elevation data appear to be limited to a few measurements recorded at the monitoring wells and
reported on the well logs and cross-sections provided in the AMEC (2014) report. It is unclear when these
water levels were recorded but it is assumed that these measurements were done following initial completion
of the wells. Groundwater flow directions within the aquifer units based on the monitoring well data is
described above but due to the low number on subsurface measurement points the overall groundwater flow
system remains poorly defined. The same is true for the nature of any groundwater/surface water interaction
in the study area and additional field investigations could be a valuable component of subsequent baseline
activities. There is some evidence to suggest that groundwater levels in the bedrock units are lower than the
surface water levels, which are a reasonable indication of the water table level in the shallow subsurface.
This suggests the potential for downward groundwater flow, although the nature of the hydraulic connection
between the bedrock and the near surface sediments is unclear. In general, we would expect the Mackenzie
River to be a regional groundwater discharge boundary, but there is insufficient data to make this conclusion.
Information in the AMEC report provides some evidence of possible groundwater discharge from the Little
Bear Fm. aquifer in the central part of the study area, where topographic elevations are lower. As this
geologic unit is anticipated to be one of the more active zones of groundwater flow, it represents a potential
travel pathway for deeper bedrock fluids to migrate to the near surface environment and would be of interest
in further baseline studies.
A major geologic feature that could have potential implications for the upward mobility of deeper bedrock
groundwater is the large thrust fault that has been identified in the eastern section of the study area (Figure 3,
AMEC, 2014). On the one hand it could be a zone of very low permeability that separates the west and east
parts of the study area. On the other hand, it could be a potential pathway with higher permeability created
by rock displacement that could represent a potential pathway for vertical fluid movement. There may also
be the potential to initiate further seismic activity along the fault under high pressure fracking.
6.2.3 Groundwater Geochemistry
AMEC (July 2014) provides the water chemistry obtained from 10 of the monitoring wells installed in the
study area. The major ion chemistry is summarized below.

20
Well Fm. Cl HCO3 CO3 SO4 Na Ca Mg K Alk TDS pH
mg/L mg/L mg/L mg/L mg/L mg/L mg/L mg/L mg/L mg/L
MW-19B Quaternary 2.5 753 0.2 125 0.8 159 57.7 10 617 754 7.61
GW001 Summit
Ck. 2 284 34 26 136 2.2 < 0.2 < 0.6 290 340 9.25
GW002 Summit
Ck. 1 300 30 24 134 2.1 < 0.2 < 0.6 295 338 9.23
GW003 Summit
Ck. 1 293 34 22 136 2.1 < 0.2 < 0.6 296 339 9.24
MW-09A Little Bear 43 295 2 196 184 23 8.6 5.3 242 609 8.18
MW-09B Little Bear 39 285 2 198 188 28 10.4 7.3 234 611 8.17
WW02-A Little Bear 28 117 64 127 136 30 7.2 7.8 203 458 9.77
WW02-B Little Bear 17 34 25 50 48 8.3 2.1 8.7 70 177 10
WW05-A Little Bear 105 2 73 45 113 142 < 0.2 31.4 391 671 11.5
WW04-A Martin
House 1230 1530 2 6 1140 5.1 3 26.7 1550 3340 9.02
Table 2. Major ion chemistry of groundwater samples collected from monitoring wells (after AMEC 2014)
The pH of the sample from WW05-A is unusually high, suggesting either cement contamination or
measurement error.
The major ions were plotted on a Piper Plot (below) to identify groundwater groups with similar chemistry.
The relative proportion of major ions (as meq/L) were plotted; the cations in the lower left triangle and the
anions in the lower right. Then the points are projected into the upper parallelogram. Groundwater with
similar chemistry will be grouped in the upper diagram.
As expected, the sample from MW-19B (screened in the Quaternary) was unique, with essentially a Ca-Mg-
HCO3 chemistry. The samples from the Summit Creek aquifer (GW001 – GW003) plot as a coherent group
whose chemistry is dominated by Na–HCO3. The groundwater from the Little Bear aquifer is Na-HCO3-
SO4 water and also forms a coherent group (MW-09A, MW-09B, WW02A, WW02B), except for an outlier,
WW05A, which has a greater proportion of Cl and SO4. The one groundwater sample from the deeper
Martin House Fm. is Na-HCO3-Cl type water. It is most similar to that of the Little Bear aquifer as it lies
between the group and the outlier of the Little Bear samples. However, the Martin House Fm. groundwater
sample has the highest Cl concentration, but the lowest SO4 concentration, in the set. It is also the deepest,
by far, of the groundwater samples.
Seepage of deeper Martin House groundwater into the shallower Summit Ck. Aquifer would be evident in
the Piper Plot, while seepage into the Little Bear would not be apparent.

21
++
+++++ +
+
+
19B
++
+
+
++
001002003
04A
++
+++
+
+
05A
02B02A, 09A09B
Quarternary
Summit Ck.Little Bear
Martin House
+
Figure 7. A Piper Plot of relative major ion concentrations (meq/L). Groundwater with similar chemistry are
expected to plot in similar positions in the cation and anion triangles and combined parallelogram.
The chloride (Cl) and total dissolved solids concentrations (TDS) are variable over depth in the shallow
groundwater (above 80 m amsl), but much higher in the one deeper sample from the Martin House Fm. (see
plots below Figure 8, 9 and 10). This suggests that, in the future, deeper groundwater intrusion into the
shallow aquifers may be evident from increase in Cl or TDS concentrations, a simple analytic.

22
Figure 8. Plots of groundwater chloride concentration and TDS relative to depth of the sampling location.
Additional characterization of the various groundwaters could be made using ratios of dissolved ions, for
example, the ratio of fluoride (F) to chloride (Cl). Below is a plot of the F concentration, multiplied by 100
for convenient plotting, versus Cl, plotted on a log scale again for convenience. The somewhat higher
concentration of F in the Summit Creek groundwater may be a useful indicator of groundwater from that
aquifer.
-150
-100
-50
0
50
100
150
200
250
0 200 400 600 800 1000 1200 1400
Cl (mg/L) versus depth (m) to top of screenD
epth
, m
Cl (mg/L)
-150
-100
-50
0
50
100
150
200
250
0 1000 2000 3000 4000
TDS (mg/L) versus depth (m) to top of screen
Dep
th, m
TDS (mg/L)

23
Figure 9. Plots of the ratio of concentrations of chloride and fluoride in groundwater samples.
Analyses of metals are summarized in Table 4 of the AMEC (2014) report. It appears that natural
groundwater is commonly in exceedance of the guidelines. Certainly this information is critical baseline
information, but it seems difficult to utilize metals for defining the ingress of deeper groundwaters into
shallow systems or surface waters.
Petroleum hydrocarbons in groundwaters were only detected twice above 1 ug/L: WW04A (26-Jun-13) – 7.4
ug/L; WW05A (26-Jan-13) – 10 ug/L. Interestingly, WW04-A is from the deepest well (Martin House Fm.),
suggesting there might be a useful tracer of the influx of deeper groundwaters upwards using BTEX.
However, monoaromatic hydrocarbons are likely ubiquitous in organic-rich sedimentary rocks (for example
Barker and Slaine, 1990) and as such it may be challenging to identify a specific source.
The AMEC (2014) report (Table 5) summarizes the available stable and radiogenic isotope analyses of
groundwaters. The Martin House Fm. (WW04-A) and some of the Little Bear Fm. aquifer wells were not
analyzed. The following figure plots the stable hydrogen (2H/1H) versus the stable oxygen isotope (18O/16O)
ratios of the water (Figure 10). These are presented in the delta (δ) notation.
River water was distinct from groundwater, and the groundwater from the shallowest Quaternary sediments
(MW-19B) was most similar to Mackenzie River water. This suggests the Quaternary sediments have some
component of recently recharged meteoric water. Deeper aquifers have a signature of meteoric water
recharged under different conditions, with the deeper Little Bear aquifer most removed down the MWL from
current meteoric river water. The formations hosting the groundwater were differentiated in the isotope plot.
It appears that the hydrogen and oxygen stable isotopes may be useful to distinguish injection fluid (if
derived from the river) from natural groundwater, at least in the deeper formations. The GW00x wells were
sampled both before and after fracturing in 2013. No significant difference was found.
0
10
20
30
40
1 10 100 1000
100 x F Versus Cl1
00
F (
mg/
L)
Cl (mg/L))
MW-19B
GW001
GW002
GW003
MW-09AMW-09B
wW02-A
WW02-B WW05-AWW04-A
Little Bear
Martin House
Summit Creek

24
Figure 10. Plot of the stable hydrogen (2H/1H) versus the stable oxygen isotope (18O/16O) ratios of the
Mackenzie River and groundwater samples. Data from AMEC, 2014. The local meteoric water line (MWL)
for Ft. Smith is shown.
A potential monitoring approach could include assessment of spring discharge and chemistry as an indication
of the source of discharging groundwater. Certainly springs and spring-fed surface water in the CMV are
identified as part of the Traditional Knowledge (section 2.5.4 of the Golder, 2015 report). Studies of springs
are also reported in the technical literature (Michel, 1986 and references therein). Michel (1986) attributes
the source of saline springs on the east side of the Mackenzie River to deeper aquifers, including the Early to
Middle Devonian Bear Rock aquifer. Less saline springs are often attributed to shallow groundwater flow
with recent (< 50 year) recharge.
Michel (1986) also noted that discordant 3H and 14C ages of discharging water often result from mixing of
waters from different flow systems. A likely example is reported in Table 6 of the AMEC, 2014 report. Ages
were interpreted for groundwater in the surficial sediment/top of bedrock sampled from well MW-19B using
both 3H and 14C. The presence of 3T (5.2 TU) suggested a component of recently recharged water (< 10
years), while the reduced 14C content of 15.8 % modern suggested a component of much older groundwater
(recharged perhaps 5000+ years).
Dating groundwater using 14C seems of less use given the complexity of processes affecting dissolved
carbonate. Certainly 3T could be a useful tracer of leakage of surface-water-derived injected fluids into the
sub-Quaternary aquifers which are free of “modern” water (3T < 0.8 TU). All injected fluids should be
-200
-180
-160
-140
-120
-28 -26 -24 -22 -20 -18 -16 -14
δ2
H
δ18O
River
MW-19B
MW-09B
MW-09A
MW-09A
GW002GW002
GW001
GW001GW003
GW003
Summit Creek
Little Bear

25
analyzed for 3T. If the source of the water is surficial (or perhaps shallow groundwater), it will contain
tritium and so can be contrasted with the “3T-free” in situ groundwater found in the sub-Quaternary aquifers.
6.2.4 Groundwater Recharge
As noted earlier, the annual average precipitation in this region of the Central Mackenzie Valley is relatively
low (~ 300 mm/year). Considering the low permeability of the overburden sediments and the existence of
permafrost conditions within the study area, it is anticipated that the annual average groundwater recharge
within the area of the leases considered for this project is also likely fairly low. However, there is limited
available data to support this conclusion and it is perhaps more appropriate to say that the nature of
groundwater recharge is poorly understood. The hydraulic head data collected from the existing monitoring
well network does suggest a downward component of flow between the overburden sediments and the
bedrock, as mentioned above, which suggests that recharge conditions prevail although it is not clear whether
the surface water bodies are gaining or losing features in the area. It would be of value to have more frequent
or continuous measurements of the groundwater levels in the monitoring wells to be able to determine the
seasonal fluctuations, which can be helpful in quantifying recharge. Groundwater from the shallowest
monitoring wells (e.g. MW-19B) (glacial overburden) appears to be the most similar to surface waters as
noted above suggesting there may be active mixing between surface water and shallow groundwater in some
locations, which is another indication of active recharge. Additional groundwater instrumentation,
geochemical analysis and measurement in the vicinity of the major surface water bodies would be required to
determine the nature of the groundwater-surface water interaction in the area.
Recharge to the bedrock including the aquifer units (Little Bear and Summit Creek) is also poorly
understood and is confounded by the complex structural geology in this region of the CMV. Geochemical
and isotopic evidence suggests that the groundwater is relatively old and distinct from the near-surface
waters. It is probable that the bedrock receives a component of recharge where the units outcrop in the lateral
uplands and where the individual units subcrop beneath the overburden sediments. Michel (1986) shows a
conceptual flow system in the bedrock in the CMV with dominant regional flow westward from the
mountains in the east to and a bit beyond the Mackenzie River. Information contained within the Golder
(2015) report also suggests that there is eastward flow towards the Mackenzie River from the mountains to
the west. Again, additional instrumentation and field study would be required to more confidently define the
nature of groundwater recharge to the bedrock system.
Quantification of groundwater recharge spatially and temporally would be important in developing a
reasonable water balance for the groundwater flow system beneath the lease areas and would be a critical
component of any predictive modeling efforts. The occurrence and distribution of permafrost is not well
understood and will play a significant role in controlling the interaction between the surface hydrology and
the groundwater system, including the mobility of any potential contaminant species associated with oil and
gas development activities. In addition, as noted above, the geochemical and isotopic composition of the near
surface (springs, seeps, surface water and groundwater) and deeper groundwater is distinct, and additional
analysis of these different water quality characteristics would be valuable in determining the source of the
groundwater and any changes that may occur as oil and gas development proceeds in the region.

26
6.2.5 Pathways for Vertical Groundwater Migration
In consideration of the continued expansion of a baseline hydrologic monitoring program within the study
area, it may be of value to attempt to identify natural potential preferential pathways for the vertical mobility
of groundwater. This does not include the potential for leakage along new hydrocarbon production wells or
enhanced rock permeability that could potentially arise from the unconventional hydrocarbon production
practices. The list provided below is not intended to be exhaustive but includes some of the pathways that
may be of interest in long term monitoring:
Natural fractures and joints within the bedrock sequence associated with the tectonic history of the
region, including the major thrust fault identified in the eastern region of the leases.
Existing or abandoned oil and gas wells and exploration wells in the immediate vicinity of the leases
including those associated with the shallow Norman Wells play to the west.
Unfrozen sections in the surficial permafrost.
Significant high permeability sediments in the glacial overburden.
Locations where the bedrock aquifer units subcrop below the glacial overburden permitting potential
discharge of deeper groundwater to the near surface environment.
Other pathways may become obvious as additional baseline information is compiled in the region.
7.0 DATA GAPS IN THE HYDROGEOLOGY
Golder (May 2015) provides an assessment of data gaps in the scientific investigations of hydrology,
hydrogeology and permafrost for a much larger study area than the area of the leases considered in our
review. They note that the hydrogeology and permafrost investigations are mainly limited to the corridor
along the Mackenzie River. A lack of temporal records associated with the groundwater and permafrost data
are noted as a major gap. Other gaps include a lack of data on the deeper bedrock (which they indicate
include "deeper regional aquifers") and the total extent of permafrost. They indicate that there are insufficient
data to characterize the surficial aquifer systems and their potential connections with the deeper aquifer
systems.
Although data gaps exist, we note that some good hydrogeological information is available to support a
baseline hydrogeological understanding of the area where the future oil and gas activity is expected to occur.
The key data gaps that we see are as follows.
Limited subsurface data and mapping of the overburden sediments within the study area (limited
geographic distribution of drill holes and monitoring wells).
Very limited record of groundwater levels available for the existing monitoring well locations and
specifically temporal variations in groundwater levels during the course of the year.
Sparce spatial distribution of groundwater monitoring locations in the study area to define the
groundwater flow system.
The occurrence and extent of permafrost within the study area is not known in enough detail.

27
Little data spatially on the hydraulic properties and continuity of the bedrock aquifer units above the
Canol Fm. within the study area.
Limited groundwater chemistry data available to characterize natural groundwater quality,
particularly with respect to variations in time at existing monitoring well locations.
The geochemical and isotopic fingerprint of the existing hydrocarbon sources in the area including
the Canol formation and the Norman Wells reservoir is not well known.
8.0 BASELINE GROUNDWATER MONITORING STRATEGY
The conceptual hydrogeological interpretation indicates that (a) the shallow groundwater/surface water
environment and (b) the two aquifers (Little Bear Fm. aquifer and Summit Creek Fm. aquifer) should be
targets for the baseline groundwater monitoring strategy in the CMV. Excellent initial baseline investigations
and characterizations have been completed by the oil and gas companies and the consultants contracted by
the Government of the North West Territories, as explained in some detail above. Based on the existing data
and the subsequent hydrogeologic analysis associated with the current study, additional baseline information
might be considered near and longer term as follows:
Equip some of the existing groundwater monitoring wells with automated water level recording
systems to provide a longer term record of groundwater level variations than what is currently
available.
Collect additional groundwater chemistry and isotopic data from existing monitoring wells to be
able to establish a consistent characterization of groundwater quality throughout the subsurface
environment.
Consider adding additional groundwater monitoring wells at strategic locations to:
o improve mapping of overburden characteristics/thickness and bedrock aquifer distribution
o enhance the distribution of groundwater level measurements to better define regional and
local groundwater flow fields
Further investigate the occurrence and depth of permafrost within the lease areas.
Continue to explore Traditional Knowledge and mapping to locate springs and seeps associated with
discharge of groundwater. Monitor ?critical indicators of such discharges to ascertain the likely
subsurface source.
Conduct additional mapping of the overburden sediments in the area.
Install shallow clusters of groundwater monitoring wells near and below (if possible) major surface
water features in the vicinity of the oil and gas leases to measure transient vertical hydraulic
gradients, groundwater quality and to investigate groundwater-surface water interactions.
Establish the chemical and isotopic finger print (δ13C and δ2H) of all potential hydrocarbon sources
in the vicinity of the leases through sampling and analysis of these sources.
Establish groundwater monitoring locations in the vicinity of the major thrust fault to investigate its
influence on regional groundwater flow and quality.
Establish groundwater monitoring locations in the vicinity of the anticipated locations where the
Little Bear aquifer and the Canol formation subcrop beneath the shallow overburden.

28
As the baseline investigations and monitoring proceed, there may be additional data that will become
apparent as being of significant value in effective site characterization and the program should be designed to
be adaptive over time. One approach to evaluating the value and utility of the baseline measurements would
be to establish a pilot-scale project at one to the leases. A detailed instrumentation and monitoring program
could be developed, specifically designed for the conditions encountered at that location in order to assess
the difficulties in installing the instrumentation and collecting the field data, and the relative costs and value
of the collected information in establishing an acceptable and complete baseline monitoring strategy. The
existing baseline studies and the information that has already been collected provide valuable insight and
direction for development of such a pilot-scale study.
LIST OF REFERENCES
Central Mackenzie Valley Subsurface Groundwater Baseline Study. Submitted to the Northwest Territories
Geoscience Office, Government of the Northwest Territories. AMEC Environment & Infrastructure; July
2014.
Central Mackenzie Surface Water and Groundwater Baseline Assessment. Report 1: Technical State of
Knowledge. Submitted to Bruce Hanna, Regional Science Coordinator, Government of the Northwest
Territories. Golder Associates; May 21, 2015.
Fallas, K.M., Hadlan, T., and B.C. MacLean (2013a). Geology, Carcajou Canyon (Northeast), Northwest
Territories. Geological Survey of Canada, Canadian Geoscience Map 95.
Fallas, K.M., MacLean, B.C., and T. Hadlan (2013b). Geology, Mahoney Lake (Southwest), Northwest
Territories. Geological Survey of Canada, Canadian Geoscience Map 91.
Fallas, K.M., MacLean, B.C., and T. Proks (2013c). Geology, Fort Norman (Northwest), Northwest
Territories. Geological Survey of Canada, Canadian Geoscience Map 92.
Fallas, K.M. and R. B. McNaughton (2013d). Geology, Norman Wells (Southeast), Northwest Territories.
Geological Survey of Canada, Canadian Geoscience Map 100.
Norman Wells Field – a long history of oil production in the Central Mackenzie Valley. R. Babiy
(Imperial Oil Resources), Calgary, Alberta. Presentation at GeoConvention 2013: Integration.
Barker, J. F. and Slaine, D. D., 1990. The Detection of Naturally Occurring BTX During a Hydrogeologic
Investigation. Groundwater Monitoring & Remediation, 10(2), 89-94.
Status Report on ConocoPhillips Canada Groundwater Investigation Program Chinook EL470. Submitted to
ConocoPhillips Canada. Hobbit Environmental; September 30, 2013.
Groundwater and Surface Water Monitoring Plan Exploration License EL470, Norman Wells, Northwest
Territories, Canada. Prepared for ConocoPhillips by MWH. December 2012.

29
Formation tops and isopach maps of Cretaceous Strata of Mackenzie Plain and parts of Peel Plain, Northwest
Territories. (T. Hadlari et al.) Geological Survey of Canada Open File 7326. 2013.
Preliminary shallow marine sedimentology of the Cretaceous Martin House Formation, Peel Plateau and
Plain, NWT. (T. Hadlari and W.G. Zantvoort). NWT Open Report 2007-010.
Hannigan, P.K., D.K. Morrow and B.C. MacLean. 2011. Petroleum Resource Potential of the Northern
Mainland of Canada (Mackenzie Corridor). Geological Survey of Canada, Open File 6757.
Hayes, J.R. and J. Dunn. 2012. Deep Subsurface Saline Aquifer Characterization, Central Mackenzie
Valley, Northwest Territories. NWT Geoscience Office, NWT Open File 2012-07.
Michel, F.A. 1986. Hydrogeology of the Central Mackenzie Valley. Journal of Hydrology 85.3. p.379-405.
Mossop, G.D., K.E. Wallace-Dudley, G.G. Smith and J.C. Harrison. 2004. Sedimentary Basins of
Canada. GSC Open File 4673.
Rouse, W.R., R.L. Bello and P.M. Lafleur. 1997. The Low Arctic and Subarctic. In W.G. Bailey, T. Oke,
and R. Rouse (ed.). The Surface Climates of Canada. McGill Queen's University Press. p. 198-211. ISBN: 0-
7735-0925-9.
van Everdingen, R.O. 1981. Morphology, Hydrology and Hydrochemistry of Karst in Permafrost Terrain
near Great Bear Lake, Northwest Territories. National Hydrology Research Institute Paper 11.

30
APPENDIX A
LIST OF REPORTS AND OTHER SOURCES OF INFORMATION
PROVIDED BY THE
GOVERNMENT OF THE NORTHWEST TERRITORIES
Central Mackenzie Valley Subsurface Groundwater Baseline Study. Submitted to the Northwest Territories
Geoscience Office, Government of the Northwest Territories. AMEC Environment & Infrastructure; July
2014.
Central Mackenzie Surface Water and Groundwater Baseline Assessment. Report 1: Technical State of
Knowledge. Submitted to Bruce Hanna, Regional Science Coordinator, Government of the Northwest
Territories. Golder Associates; May 21, 2015.
Status Report on ConocoPhillips Canada Groundwater Investigation Program Chinook EL470. Submitted to
ConocoPhillips Canada. Hobbit Environmental; September 30, 2013.
Groundwater and Surface Water Monitoring Plan Exploration License EL470, Norman Wells, Northwest
Territories, Canada. Prepared for ConocoPhillips by MWH. December 2012.
Formation tops and isopach maps of Cretaceous Strata of Mackenzie Plain and parts of Peel Plain, Northwest
Territories. (T. Hadlari et al.) Geological Survey of Canada Open File 7326. 2013.
Preliminary shallow marine sedimentology of the Cretaceous Martin House Formation, Peel Plateau and
Plain, NWT. (T. Hadlari and W.G. Zantvoort). NWT Open Report 2007-010.
Analytical Results from Cretaceous and Devonian Studies in Mackenzie Plain. (L.J. Pyle and L.P. Gal).
NWT Open Report 2014-006.
Cretaceous stratigraphy in the subsurface of Great Slave Plain, southern Northwest Territories. James Dixon.
Bulletin of Canadian Petroleum Geology. June 1997.

31
APPENDIX B
PROPOSED WORK PLAN FOR TESTING OF WELLS AT EL 470
December 15, 2015
Mr. Bruce Hanna
Regional Science Coordinator
Government of the Northwest Territories
P.O. Box 1320
Yellowknife, NT
X1A 2L9
Re: Proposed Potential Field Work Prior to the Decommissioning of the Conoco Phillips Groundwater
Wells EL 470 Lease, Sahtù Region, NWT
Dear Mr. Hanna,
As outlined in our scope of work for the Initial Development of Hydrogeologic Investigations Sahtu Area,
NWT, we have prepared suggestions for potential field work that could be completed prior to the
decommissioning of the Conoco Phillips Groundwater Wells on the EL 470 Lease during the early winter of
2016. During a conference call with personnel from your offices and the collaborating Oil and Gas industrial
partners held on December 7, 2015, several optional work plans were discussed between the group members.
Although there was not specific consensus as to what additional work might be feasible during the period
when the Conoco Phillips groundwater monitoring wells were being decommissioned in January and
February of 2016, several alternatives were considered.
The potential field activities are associated with the groundwater sampling campaign that has been planned
for the wells and also for hydraulic testing of the wells. Details on the potential approach to the hydraulic
testing are contained in the attached memo. Recommendations for the final round of groundwater sampling
and analysis are contained below.
Final Round of Groundwater Sampling of the Conoco Phillips Groundwater Wells
The previous geochemical analyses conducted on the groundwater samples collected from the 4 Conoco
Phillips Groundwater Wells on the EL 470 Lease was very comprehensive and should be followed again for
the final sampling campaign in the winter of 2016. If possible, it is recommended that methane analysis be
added to the suite of organic species. In addition, if methane is detected, it would be valuable to measure the
isotopic signature of the carbon and the hydrogen in the methane as this will help to understand its source. In
addition, the groundwater isotopes of hydrogen (2H) and oxygen (18O) would also be useful in understanding
regional groundwater flow and potential changes that may occur after production begins. The sampling
protocol for all of these additional species is not onerous and can be obtained from the analytical lab where
the samples will be sent for analysis. We are also prepared to provide that detailed information if required.
Additional Hydraulic Testing of the Groundwater Wells
Our review to date of the background information indicates that there is no formation hydraulic test data (i.e.

32
pumping test or aquifer test data) available for the four bedrock monitoring wells (WW02-A, WW02-B,
WW04-A, WW05-A) located on Conoco Phillips EL 470 lease property. According to the logs and reports,
the four wells are completed in sandstone formations that may be important aquifers in the area. The
completion zones for the four wells have been reported as follows:
Groundwater
Well
Completion Depth
and Type Formation
WW02-A 196-202 m; well
screen
Little Bear Fm.
(sandstone)
WW02-B 87-96 m; well
screen
Little Bear Fm.
(sandstone)
WW04-A
399-408 m;
perforated well
casing
Shale and
sandstone
WW05-A 92-107 m; well
screen
Little Bear Fm.
(sandstone)
It would be very useful to the baseline hydrogeological evaluation if a pumping test program was undertaken
prior to abandoning the groundwater wells. Following interpretation of the results, such a testing program
would yield additional information on the characteristics of the Little Bear Formation sandstones as an
aquifer, and could provide important information on the vertical connectivity between water bearing units at
different depths, and the horizontal connectivity between different well locations.
The 2013 status report on the Conoco Phillips investigation (Hobbit Environmental, September 30, 2013)
indicates that the four wells were equipped with low flow capacity submersible pumps in 2013. The pumps
were used to collect groundwater samples from the four wells in June 2013. Problems with operating the
pumps in at least 2 of the wells are noted in the report, but details are not provided. Additional information
related to the sampling protocols used at the time is not evident in the status report. The existing submersible
pumps, if they are still installed in the wells, may still be useful for groundwater sampling purposes but they
are not of sufficient capacity to support a meaningful pumping test program as recommended in this memo.
Recommendations for Pumping Test Program
Overall Objective
Obtain information on physical characteristics of the hydrogeologic units using constant rate pumping
tests at one or more well locations on the Conoco Phillips Lease EL 470.
If the existing submersible pumps are still in the four wells, perform a short test on each well pump to
confirm operational condition/performance and capacity. If the well pump condition/performance and
capacity are satisfactory for sampling purposes, use the pumps to collect groundwater samples from the wells
according to the sampling protocols to be provided elsewhere in the recommended work plan.
Testing of Groundwater Well WW02A
1. Remove the existing submersible pump at WW02A. Install a replacement submersible pump capable of
producing approximately 11.4 L/s (150 Igal/min; 180 US gal/min);
33
- submersible pump size and discharge piping to be suitable for the well casing ID
(OD reported as 178 mm on the well logs) and head to overcome (well water level reported as 33 m
in March 2013);
- pump motor likely will require 3 phase power and a 600 V generator
- install one access tube (approximately 1 inch ID) in the well for manual water level monitoring
purposes during the testing
- set up submersible pump discharge equipment at surface with flow monitoring using a calibrated
flow meter and/or combination orifice weir/manometer tube
- water quality test results from 2013 (Hobbit Environmental, September 2013) suggest that
discharge water during the pumping tests can be discharged at surface without the need to contain and
remove off-site; to be confirmed with NWT and related regulatory authorities
2. Remove the existing submersible pump at WW02B. Install two water level access tubes (approximately 1
inch ID as indicated above), one for manual water level measurements and one for a datalogger (such as a
Level Troll series 300 or 500 from In-Situ Inc.).
3. Perform a preliminary variable rate test (often referred to as a step test) at WW02A. Attempt to operate the
pump at flow rates of approximately 3.8, 7.6 and 11.4 L/s (60, 120, 180 US gal/min) for approximately one
hour at each flow rate; monitor water levels at both WW02A and WW02B during the test.
4. Review the results from item 4. Select flow rate for a 24 to 72 hour constant rate pumping test based on
results of the step test.
5. Perform the constant rate pumping test at WW02A with water level monitoring at both WW02A, WW02B
and WW05. Include water level recovery monitoring after the pumping test ends. Remove pumping
equipment from the well.
Testing of Groundwater Well WW05
1. Remove the existing submersible pump at WW05. Install a replacement submersible pump capable of
producing approximately 11.4 L/s (150 Igal/min; 180 US gal/min);
- submersible pump size and discharge piping to be suitable for the well casing ID
(OD reported as 178 mm on the well logs) and head to overcome (well water level reported as 39.5
m in March 2013);
- pump motor likely will require 3 phase power and a 600 V generator
- install one access tube (approximately 1 inch ID) in the well for manual water level monitoring
purposes during the testing
- set up submersible pump discharge equipment at surface with flow monitoring using a calibrated
flow meter and/or combination orifice weir/manometer tube
- water quality test results from 2013 (Hobbit Environmental, September 2013) suggest that
discharge water during the pumping tests can be discharged at surface without the need to contain and
remove off-site; to be confirmed with NWT and related regulatory authorities
34
2. Perform a preliminary variable rate test (often referred to as a step test) at WW05. Attempt to operate the
pump at flow rates of approximately 3.8, 7.6 and 11.4 L/s (60, 120, 180 US gal/min) for approximately one
hour at each flow rate; monitor water levels at both WW02A and WW02B during the test.
3. Review the results from item 4. Select flow rate for a 24 to 72 hour constant rate pumping test based on
results from the step test.
4. Perform the constant rate pumping test at WW05 with water level monitoring at WW05 and the WW02
site (both WW02A and WW02B). Include water level recovery monitoring after the pumping test ends.
Remove pumping equipment from the well.
An Alternative Testing Option
If it is not possible to undertake the pumping test program described above, an alternative approach using the
existing well pump installations (reported in Hobbit Environmental, 2013) could be considered. The
approach would involve an individual pumping test on each of the four wells (WW02A, WW02B, WW05,
WW04) at the maximum constant flow rate available from the existing well pumps (5 – 10 USgpm; <1 L/s).
Water level monitoring (manual and possibly automated with a datalogger) would occur during the tests. The
individual well tests would ideally run until a stable water level is reached in the well. The main limitation
with this approach is the low flow rates available from the well pumps, which limit the ability to stress the
aquifer and detect the effects of pumping at one location on water level response at other locations.
Sincerely,
David L. Rudolph, Hydrogeologist A.R. (Tony) Lotimer, Hydrogeologist Jim Barker, Hydrogeologist
Waterloo Hydrogeology Advisors ARL Groundwater Resources Ltd Waterloo Hydrogeology Advisors

35
APPENDIX C
STRATIGRAPHIC SEQUENCE WITHIN THE STUDY AREA (AMEC, 2014)