Final Report ASSESSMENT OF THERMAL POLLUTION …€¦ · Final Report ASSESSMENT OF THERMAL...
41
Final Report ASSESSMENT OF THERMAL POLLUTION ASSOCIATED RIPARIAN CANOPY CLEARING: Part II Prepared by Daniel E. Line, PE NC State University Biological and Agricultural Engineering Dept. Box 7625, 3110 Faucette Drive Raleigh, NC 27695 September 10, 2015
Transcript of Final Report ASSESSMENT OF THERMAL POLLUTION …€¦ · Final Report ASSESSMENT OF THERMAL...

Final Report
ASSESSMENT OF THERMAL POLLUTION ASSOCIATED RIPARIAN CANOPY CLEARING: Part II
Prepared by
Daniel E. Line, PE
NC State University Biological and Agricultural Engineering Dept.
Box 7625, 3110 Faucette Drive Raleigh, NC 27695
September 10, 2015

2
TECHNICAL REPORT DOCUMENTATION PAGE 1. Report No. FHWA/NC/2014-19
2. Government Accession No.
3. Recipient’s Catalog No.
4. Title and Subtitle Assessment of Thermal Pollution Associated With Riparian Canopy Clearing: Part II
5. Report Date Sep. 10, 2015
6. Performing Organization Code
7. Author(s)
Daniel E. Line
8. Performing Organization Report No.
9. Performing Organization Name and Address NCSU Biological & Agricultural Engineering Dept. NC State University Box 7625, 3110 Faucette Dr. Room 200B Raleigh, NC 27695
10. Work Unit No. (TRAIS)
11. Contract or Grant No.
12. Sponsoring Agency Name and Address North Carolina Department of Transportation Research and Analysis Group 104 Fayetteville Street Raleigh, NC 27601
13. Type of Report and Period Covered Final Report 8/16/13-8/15/15
14. Sponsoring Agency Code RP 2014-19
15. Supplementary Notes
16. Abstract Water temperature is an important factor in the vitality and growth of aquatic organisms, especially trout. Removing trees that shade streams can increase the water temperature. The magnitude of the temperature increase is a function of many factors including the amount of canopy removed, how much and how long was the canopy shading the stream, stream discharge and width/depth ratio, and stream gradient/velocity. The purpose of this project was to continue, for 2 years, water temperature monitoring at 9 stream sites begun under RP 2011-14. The sites encompassed varying stream sizes and lengths, tree canopies, and road improvement activities. Results for the two large streams (drainage area >10,000 ac) showed that the mean overall temperature increased significantly from upstream to downstream for the one stream and decreased significantly for the other, albeit both changes were much less than the reported measurement accuracy of the temperature sensors (0.36 °F). Hence, while there was no way to ascertain definitively whether removing a few trees from the riparian area during road improvement had any effect on the water temperatures, because the changes were so small it is unlikely the tree removal had any effect on the water temperature in two large streams. Monitoring of four medium-sized streams (drainage area 600-900 acres) along which road improvements had occurred documented increases for three of the streams reaches and a decrease for one in overall mean temperatures. Two of the increases and the decrease were greater than the measurement accuracy (0.36 °F) of the temperature sensors. For the two small streams (drainage area 100 to 400 acres) one had a decrease in overall mean temperature from upstream to downstream and the other had an increase. For the stream site with the increase, tree removal for road improvement had not even occurred yet. Data from this site highlight the need for pre-road improvement monitoring to add confidence to the results. Monitoring at this site is continuing, therefor the data was not included in this report. 17. Key Words water temperature, riparian clearing, road improvement
18. Distribution Statement
19. Security Classif. (of this report)
unclassified
20. Security Classif. (of this page)
unclassified
21. No. of Pages 41
22. Price
Form DOT F 1700.7 (8-72) Reproduction of completed page authorized

3
ACKNOWLEDGEMENTS
This project was funded by the NC Department of Transportation. The guidance and
assistance of members of the steering and implementation committee, especially Heath Slaughter, toward the completion of the project was much appreciated.
Additionally, monitoring help from NCSU personnel including James Blackwell was invaluable toward the completion of this project.
DISCLAIMER
The contents of this report reflect the views of the author(s) and not necessarily the views of the University. The author(s) are responsible for the facts and the accuracy of the data presented herein. The contents do not necessarily reflect the official views or policies of either the North Carolina Department of Transportation or the Federal Highway Administration at the time of publication. This report does not constitute a standard, specification, or regulation.

4
SUMMARY Water temperature is an important component of habitat for many aquatic organisms. The
temperature of stream discharge has been shown to increase significantly in some cases when the riparian tree canopy is removed. The magnitude of the temperature increase is a function of many factors including length of reach with no canopy, discharge, stream width/depth ratio, and stream gradient/velocity. This project monitored stream water temperatures at 9 sites (5 intensive monitoring and 4 less intensive) that included several combinations of the factors listed above. Results showed that for the two large streams (drainage area >10,000 ac) the mean overall temperature increased from upstream to downstream on one stream and decreased for the other, albeit both changes were much less than the reported measurement accuracy of the temperature sensors. Monitoring of four medium-sized streams (drainage area 600-900 acres) along which road improvements had occurred documented increases for three of the streams reaches and a decrease for one in overall mean temperatures. Two of the increases and the decrease were greater than the measurement accuracy (0.36 °F) of the temperature sensors. Thus, for the medium-sized streams the data were inconclusive as to whether there were increases in temperature in the monitored reach following road improvement. For the two small streams (drainage area 100 to 400 acres) one had a decrease in overall mean temperature from upstream to downstream and the other had an increase. For the stream with the increase, tree removal for road improvement had not even occurred yet. Thus, overall the monitoring data were inconclusive as to whether tree removal at the monitored sites resulted in an increase in temperature in the adjacent stream reach.

5
TABLE OF CONTENTS
Contents
Contents TECHNICAL REPORT DOCUMENTATION PAGE .................................................................. 2 DISCLAIMER ................................................................................................................................ 3 SUMMARY .................................................................................................................................... 4 TABLE OF CONTENTS ................................................................................................................ 5 INTRODUCTION .......................................................................................................................... 7 METHODOLOGY AND PROCEDURES ..................................................................................... 8 RESULTS ....................................................................................................................................... 9
Beaver Creek site ........................................................................................................................ 9 Little Windfall Branch site........................................................................................................ 10 Raccoon Creek site ................................................................................................................... 11 SR1169-trib ............................................................................................................................... 12 SR1169 Site (West Fork Pine Swamp) ..................................................................................... 12 Brummetts Creek Site ............................................................................................................... 13 Wallace Branch Site .................................................................................................................. 14 Cranberry Creek Site................................................................................................................. 15 Bear Wallow Site ...................................................................................................................... 17 Comparisons Between Sites ...................................................................................................... 19
SUMMARY AND CONCLUSIONS ........................................................................................... 20 CITED REFERENCES ................................................................................................................. 21 LIST OF TABLES ........................................................................................................................ 22
Table 1. Location Coordinates and Watershed Characteristics for the 9 Sites. ........................ 22 Table 2. Monitoring Data for Beaver Creek and Little Windfall Branch. ................................ 23 Table 3. Statistical Comparison Between Stations for the 9 Sites ............................................ 25 Table 4. Monitoring Data for Raccoon Creek and Little Windfall Branch. ............................. 26 Table 5. Atmospheric and Monitoring Data for SR1169. ......................................................... 27 Table 6. Atmospheric and Monitoring Data for Brummett’s Creek. ........................................ 29 Table 7. Atmospheric and Monitoring Data for Wallace Branch. ............................................ 30 Table 8. Monitoring Data for Cranberry Creek. ....................................................................... 32 Table 9. Atmospheric and Monitoring Data at the Bear Wallow Site ...................................... 33 Table 10. Summary Data for the 9 Sites ................................................................................... 35
LIST OF FIGURES ...................................................................................................................... 36 Figure 1. Locations of the stream sites. .................................................................................... 36 Figure 2. Beaver Creek (left) and boxplot of temperature data (right). .................................... 37 Figure 3. Little Windfall Branch (left) and Raccoon Creek (right). ......................................... 37 Figure 4. Monitored stream reach for SR1169-trib. ................................................................. 38 Figure 5. Monitored reach for SR1169 site (left) and boxplot of data (right). ......................... 38 Figure 6. Brummett’s Creek tree clearing (left) and boxplot of data (right). ........................... 39 Figure 7. Wallace Branch near upstream station (left) and mid station in 2011 (right). .......... 39

6
Figure 8. Wallace Branch at downstream station (left) and boxplot of data (right). ................ 39 Figure 9. Cranberry Creek near downstream (left) and mid (right) stations. ........................... 40 Figure 10. Cranberry Creek example of sediment inundation (left) and boxplot (right). ......... 40 Figure 11. Bear Wallow stream near middle of reach (left) and at downstream station (right).................................................................................................................................................... 41 Figure 12. Bear Wallow road at the downstream station on 12/9/14 (left) and boxplot of data (right). ....................................................................................................................................... 41

7
INTRODUCTION
The removal of trees during road improvement projects is often necessary, especially in mountainous areas of North Carolina where forests dominate the land. Because many of the roads are located along streams, the tree removal often occurs within the riparian corridor of a stream. Since many of the streams are trout supporting or are tributaries to designated trout waters, the question of whether the removal of trees from the riparian corridor results in an increase in water temperature becomes important.
Stream water temperature is a major factor in the distribution and abundance of many aquatic organisms, especially cold water salmonids such as trout. Trout, and other salmonids, often receive special attention because of their economic importance and their sensitivity to water temperature changes (Jones and Hunt, 2009). Macroinvertebrates have also been shown to be adversely affected by increases in water temperature (Sweeney, 1993). Although water temperature at a given location varies naturally due to diurnal and seasonal factors, anthropogenic changes can skew natural variability significantly. For example, several studies have shown that the removal of a large area of trees during logging resulted in increases in the temperature of streams located within the logged area (Beschta and Taylor, 1988; Holtby, 1988; Swift and Messer, 1971). However, few, if any, studies have documented the effects on stream temperature of removing selected or a small number of trees from within the riparian area such as would be done for road improvement projects.
Many factors affect the extent of thermal heating resulting from limited clearing of the tree canopy including stream flow rate, ambient air and water temperature, extent of clearing relative to total riparian corridor, width and depth of the water column, and possibly turbidity/solids concentration of the stream/waterbody. Studies of Pacifica and Alaskan streams have shown increases in stream temperature resulting from removing trees from riparian zones in some cases; however, they have also shown that the water temperature in small streams (<1 cfs) decreases relatively quickly downstream to the 'natural' temperature if the tree canopy is restored. Thus, there is a need to document under what conditions riparian canopy removal has a significant effect on stream temperature.
This 2-year project was a continuation of a previous 3-year project designed to document water temperature in mountain streams that have had tree removal in their riparian corridor as a result of road improvement. Streams of varying discharge rate, bed slope, and tree canopy were monitored as well as streams with vary extents of tree removal. In order to provide the most comprehensive analysis, data from all 5 years of monitoring will be included in this report.

8
METHODOLOGY AND PROCEDURES
This project included continuous temperature monitoring of 9 stream reaches in Ashe and Mitchell Counties of North Carolina (fig. 1). The 9 reaches were selected from a list of 12 identified by the NC Department of Transportation (NC DOT). Several of the reaches were on unnamed tributaries; hence, the names of reaches/sites used in this report may be the name of the road located adjacent to the tributary/stream. Location coordinates and watershed characteristics for the 9 stream sites/reaches are shown in Table 1. The drainage areas for the sites range from 85 to 16,064 acres. Given that the sites were in the mountains the elevations, average slope, and proportion of forested land use were high for North Carolina watersheds. Land use was determined from the USGS StreamStats website (http://water.usgs.gov/osw/streamstats/). Also, pasture was included in the cultivated land use. For the SR1169 and SR1169-trib sites the distance between the upstream and downstream station was relatively short; thus, the characteristics for both sites are the same.
Of the 9 stream reaches five were intensively monitored (Bear Wallow, Brummetts Creek, Cranberry Creek, Wallace Branch, and SR1169) and four less intensively monitored (Beaver Creek, Little Windfall, Raccoon Creek, and SR1169-trib). All of the stream reaches, except Bear Wallow, were along roads that had been improved in the recent past, which required the removal of some trees within 50ft of the stream. The Bear Wallow reach was monitored prior to and during a road improvement project. The 5 intensively monitored reaches included a variety of stream sizes and tree canopy extents to provide data for determining when an increase in temperature might be an issue. The intensive monitoring included continuous measurement of water depth/stage and temperature along with occasional measurements of water depth above the temperature sensor, solar radiation, and stream cross section. Air temperature was also monitored continuously at about 2-3 ft above the ground surface at several of these sites using the same types of sensors that were used to monitor water temperature. A stream staff gage and an automated pressure transducer were installed at each discharge monitoring site to provide continuous water stage measurements and a reference for recalibrating the sensors and developing stage-discharge rating tables. Because the pressure transducers were installed under water they measured the sum of the atmospheric and water pressure; thus, the atmospheric pressure had to be measured or otherwise determined and subtracted from the measurements to obtained water depth. Water depth measurements were then correlated to the staff gage to compute stage measurements. The stage measurements were converted to discharge using stage-discharge rating tables. The stage-discharge rating tables were developed from at least 5 manual measurements of discharge encompassing a range of stages. For most sites, the range of stages encompassed at least 70% of the range of stages actually measured. The manual measurements of discharge were conducted using standard stream gaging equipment and techniques.
For the 4 less intensively monitored sites water temperature was also monitored continuously at upstream and downstream locations. However, only instantaneous discharge measurements were made occasionally to document current conditions and no solar radiation measurements were made.
All water and air temperature sensors had continuous measurement capability (20-30 minute interval). They were installed at shaded locations, when possible, to prevent direct solar radiation on the sensor itself. For several sites shaded locations could not be found, so the sensor was placed inside a white PVC pipe (white pipe reflects heat to minimize local heating) to shade it from the sun. Although, the water in most streams appeared to be well-mixed, temperature

9
sensors were installed in areas of flow where the measured temperature was representative of the entire stream cross section, except in low flow streams where finding a place with sufficient water depth to submerge the sensor took priority. In small streams sensors were installed on the stream bed to help insure that they were submerged; however, this made them vulnerable to sediment inundation. In fact, several sensors were found to be covered with sediment during visits to the site. When it was obvious from changes in the trends of the data that the sensor was inundated with sediment, these data were deleted. However, this happened for less than 2% of the data because it was difficult to be sure the sensor was inundated. Atmospheric pressure was monitored at Bear Wallow and Wallace Branch during some of the duration of the project. Solar radiation measurements to document shading from nearby trees and other vegetation were also made. Photos of monitoring sites, roads, and tree canopy were also taken to document current conditions.
Because of the variable nature of climatic conditions, more than 4.5 years of data were collected to attempt to establish long-term relationships/trends as opposed to short-term trends caused by unusual climatic and/or other conditions. The temperature data collected upstream and downstream of stream reaches affected by highway improvements could be analyzed in at least 2 ways: paired t-tests and analysis of covariance (ANCOVA). Paired t-tests were used to determine if differences between upstream and downstream temperatures were statistically significant. The ANCOVA and LS means tests were used at some sites to confirm the paired t-test and quantify the differences between stations. Unless otherwise stated all paired t-tests and ANCOVA used 0.05 as the level of significance. Also because the upstream and downstream data was needed to perform the paired t-test, if temperature data was missing from one station, the data from the other station was deleted so that all of the data used in the analysis was paired. The potential impact of water temperatures on trout populations was assessed by comparing water temperatures to 70 °F (21 °C), the temperature at which Coutant (1977) reported that trout begin to experience thermal stress.
RESULTS Because of the amount of temperature and discharge data only summaries will be
presented in this report, except for graphical representations, which will often use all of the data. The statistical analysis depended on a comparison between upstream and downstream stations; therefore, when data was missing at one station, the data for that point in time was deleted from the other station(s) at the site as the statistical test required the data to be paired. To focus on the effect of riparian canopy, data collected from May to September (M-S) for each stream site were isolated and analyzed separately the reason being that the canopy should have the greatest effect during this period of vegetative growth.
Beaver Creek site
The Beaver Creek site was located along Mash Road (SR1182). This site was a less intensively monitored site, so temperature only sensors were installed. The monitored stream reach began with the stream channel at the base of a large and steep road embankment and continued about 750ft downstream to the downstream monitoring station where the channel was nearly at the same elevation as the road and within 50ft of the road. The drainage area to the upstream station was 10,500 acres most of which was forested (Table 1). The drainage area to
10
the downstream station was nearly the same as no tributaries of any size entered the stream between the stations. The stream channel had at least 25ft of undisturbed well-established tree canopy on both sides with only the outlying 10-15ft of trees removed on the one side for the road improvement. The width of the stream channel was 24-30ft with discharge at upstream and downstream measured on one occasion during relatively low flow conditions at 11 cfs. Hence, this site was a relatively large stream that had tree removal for road improvement outside of 25ft from the stream.
Mean monthly temperatures for Beaver Creek are shown in Table 2. For November, 2010 to July, 2012 differences in mean monthly temperatures from upstream to downstream were slight with the greatest increase being 0.18 °F and the greatest decrease 1.19 °F. Between July and September, 2012 the downstream temperature sensor was lost due to an unknown reason; hence, data collection at this station ended.
For the period of monitoring at both stations (10/15/10 to 6/20/12), the overall mean at the downstream station was 51.71 °F, which was 0.04 °F less than at the upstream station (Table 3). For the May-Sep (M-S) period, the mean (Table 3) and median (figure 2, right) water temperatures were greater than the overall mean and median at both stations. The mean at the downstream station (64.20 °F) was 0.01°F less than the upstream station, which was significant (Pvalue<0.05) according to a paired t-test. However, this 0.01°F difference was less than the resolution (0.04 °F) and measurement accuracy of the temperature sensors (0.36 °F) indicating that the overall decrease from upstream to downstream may not be a real difference. As indicated by the top of the whisker on all box plots, there were temperature measurements of greater than 70 °F. In fact there were 1616 and 1726 measurements at the upstream and downstream stations, respectively that were greater than 70 °F. As expected these all occurred during the growing season (M-S).
While there was only 20 months of data collected from both stations (Table 3), the data was consistent, in that, 14 out of 20 months the mean downstream temperature was less than the upstream. Further, the significant decrease in the overall and the M-S mean temperatures from upstream to downstream and the absence of significant inflow between the monitoring stations documented that the remaining tree canopy was still effective at shading the stream so that the water temperature in the reach between the monitoring stations did not increase. Hence, the data indicated that the removal of trees along the outside of the riparian buffer had little, if any, measureable effect on stream temperatures.
Little Windfall Branch site
The Little Windfall Branch site was located along SR1358 in Ashe County (figure 1). The monitored stream reach was about 3,500ft long and was within 50ft of the road for the whole reach. The stream descends 160 ft over the reach for an average slope of 4.6%. For the first several hundred feet of the reach, the stream was located between the road and a beef cow pasture (figure 3). The tree canopy over the stream was mixed with some stretches of trees on the banks, some stretches with woods (full canopy) on one-side, and some stretches with no tree canopy. The drainage area to the upstream station was 173 ac with 56.9% of the land classified as forested and 37.4% cultivated, although the vast majority of the land classified as cultivated appeared to be in pasture (Table 1). There was a small pond about 300ft upstream of the upstream monitoring station. The drainage area of the creek between the stations was about the same as to the upstream station. The width of the stream during visits varied from 1-3ft depending on discharge and location and the depth 0.2-0.5ft during baseflow. Discharge was

11
0.06 cfs measured on one occasion. Hence, Little Windfall Branch was a small mountain stream with continuous, but low flow.
Mean monthly temperatures for Little Windfall are shown in Table 2. For the months in which both stations were operational (3/24/11 to 3/7/12) except May, 2011 mean monthly downstream temperature was less than the upstream. This was unexpected as there was a considerable length of stream between the stations in which tree canopy was sparse. The reason for the decrease in temperature from upstream to downstream was unknown, but for the summer months at least, it may have been due to the heating of water in the pond upstream of the upstream station and/or to the influx of cooler groundwater between the monitoring stations. When both stations were operational, the overall mean at the upstream station was 53.98 °F, which was 1.12 °F greater than the downstream mean (52.86 °F). The mean temperature for all of the upstream data (through 7/13/15) was 52.50 °F. The reason for the relatively high temperature through 3/7/12 was unknown, but the summer of 2011 was unusually hot.
Using all of the ~11 months paired data, the mean temperature at the downstream station was significantly less than the upstream according to a paired t-test (Table 3). The difference (1.12 °F) was greater than the resolution (0.04 °F) and measurement accuracy of the temperature sensors (0.36 °F) indicating that the overall decrease from upstream to downstream was real. Considering only the M-S period, the mean upstream temperature (62.18 °F) was also significantly greater than the downstream mean of 61.54 °F indicating that the lack of full riparian canopy did not result in an increase in the temperature between the stations. This result highlights the fact that changes in stream water temperature are not directly related to changes in riparian tree canopy along the stream. Having monitoring data prior to the removal of the riparian canopy during road construction would have been critical to understanding the thermal dynamics of this site.
Raccoon Creek site
The Raccoon Creek site was located along SR1311 in Mitchell County. The monitored stream reach was about 3,000 ft long and basically is within 50ft of the road for the whole reach (figure 3). The tree canopy over the stream is sparse until the last 100-200ft before the downstream station where there is a good tree riparian buffer with canopy. The drainage area to the upstream station was 634 ac with 67.1% of the land classified as forested and 24.9% cultivated, although the vast majority of the land classified as cultivated appeared to be in pasture (Table 1). There was 70 acres draining to the creek between the stations. The width of the stream water was 3-5 ft depending on discharge and location and the depth 0.25-0.5 ft during baseflow. Discharge was 0.35 cfs and 0.74 cfs measured on two occasions. Hence, this section of Raccoon Creek was slightly larger than Little Windfall Branch, but was still a small mountain stream.
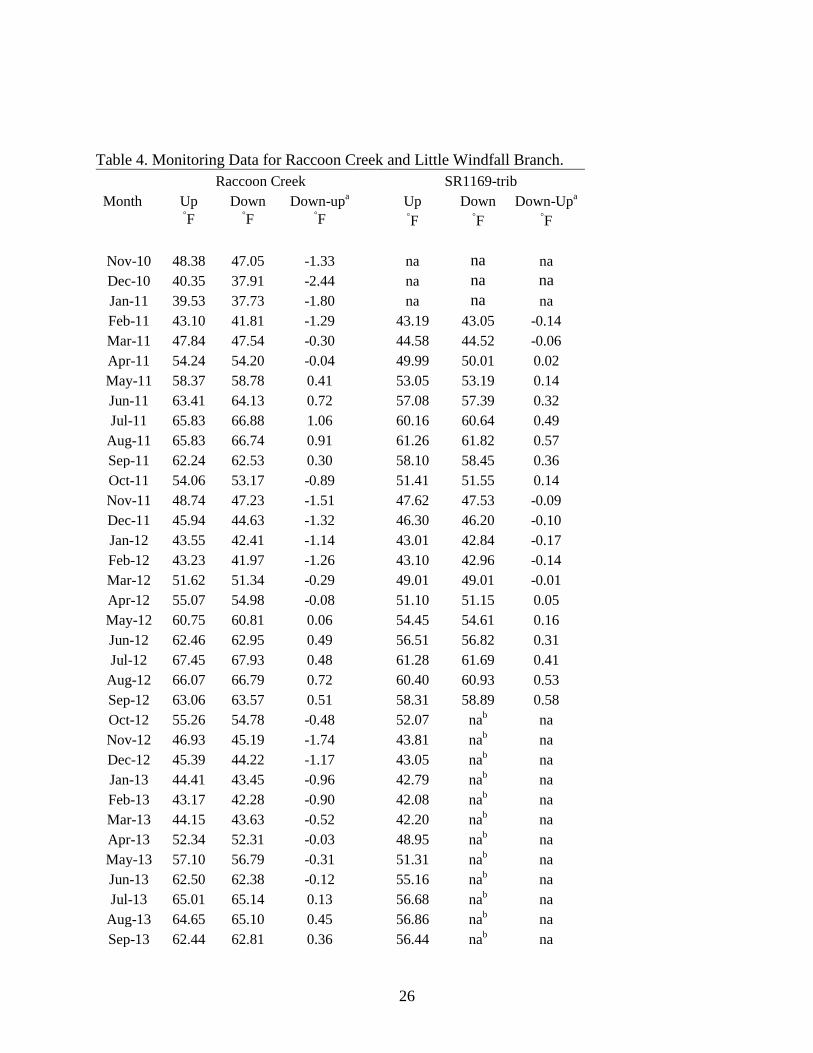
Mean monthly temperatures for Raccoon Creek are shown in Table 4. For the months from July-September the mean temperature at the downstream station was always greater than at the upstream whereas for December-February the opposite was the case. The increase during the May-September period was expected given that the tree canopy was sparse for a considerable length, but the reason for the decrease from upstream to downstream during the winter months was unknown. There was a relatively large tributary feeding Raccoon Creek between the stations which had what appeared to be a greenhouse along it but it is unknown how much or even if the greenhouse released water. Discharge measured on 12/10/14 was 0.34 cfs at the upstream station and 0.74 cfs at the downstream station documenting that the discharge more than doubled between the stations.

12
For the ~48 months when data from both stations were collected, the overall mean at the downstream station was 53.49 °F, which was 0.37 °F less than the upstream station (Table 3). The mean temperature at the downstream station was significantly less than the upstream according to a paired t-test (Table 3). The difference was greater than the resolution (0.04 °F) and measurement accuracy of the temperature sensors (0.36 °F) indicating that the overall decrease from upstream to downstream was real. When the May-Sep data was parsed and analyzed, there was a statistically significant increase in overall mean temperature of 0.50 °F from upstream to downstream according to a paired t-test. Because the discharge was not measured during the summer months, the effect of the tributary feeding into the Creek between the stations could not be documented; hence, the effect of changes in the riparian canopy cannot be determined with any certainty.
SR1169-trib
The SR1169-trib site was located along SR1169 in southern Ashe County. The monitored stream reach was about 70 ft long about 30 ft of which was a culvert, and basically is within 50 ft of the road for the whole reach (figure 4). There was no tree canopy over the stream in the reach. The drainage area to the upstream station was 85 ac with 99.9% of the land classified as forested and 0.1% developed (Table 1). There was less than 1 acre draining to the creek between the stations. The width of the stream water was 0.5-1.5 ft depending on discharge and location and the depth was 0.1-0.3 ft during baseflow. Discharge was 0.03 cfs measured on one occasion. Hence, this is a very small first order stream.
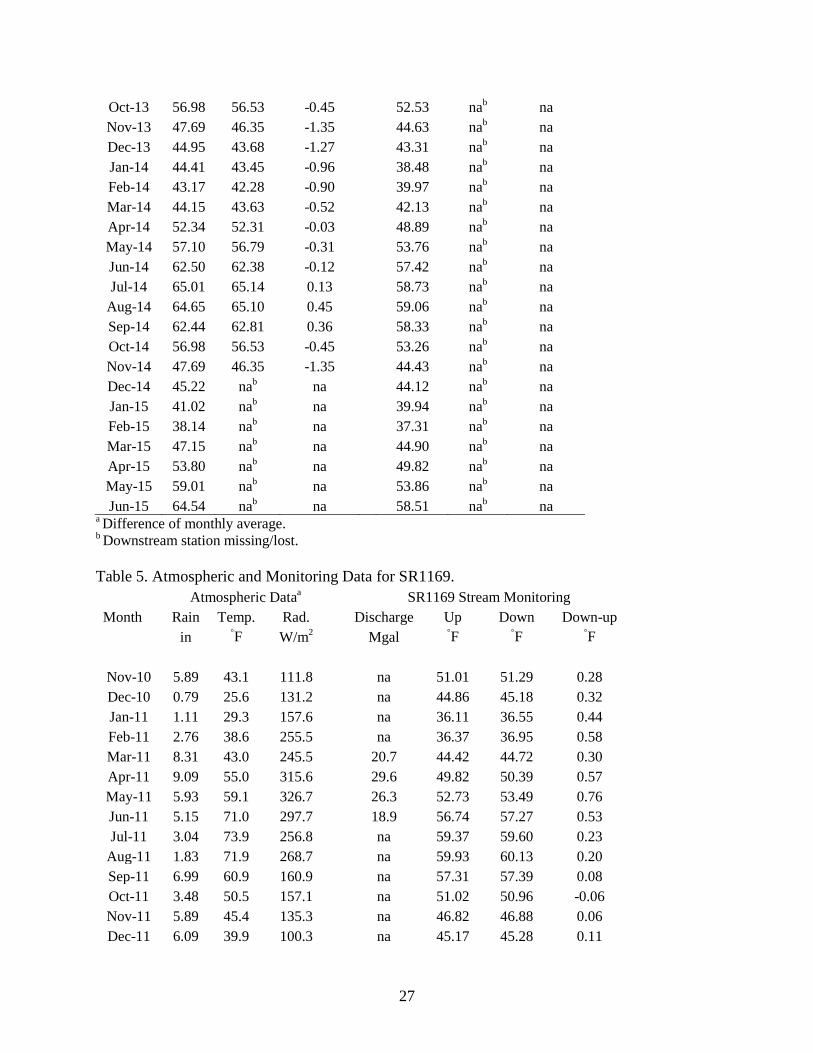
Mean monthly temperatures for SR1169-trib are shown in Table 4. For the November through March period the downstream temperature was less than upstream. This decrease was unexpected given that even during winter months there was still solar radiation with no riparian canopy present to prevent heating. For the period of paired upstream and downstream data (Table 3), the average temperature at the downstream station (52.87 °F) was significantly greater than at the upstream station (52.70 °F) according to a paired t-test. Analyzing only data collected during the May-Sep months, also resulted in a significantly greater mean temperature at the downstream station (58.50 °F) compared to upstream (58.13 °F). These data indicate that in even a relatively short reach (<50 ft) of a small stream the water temperature can significantly increase when no tree canopy is present. Because there was no pre-road improvement data, there was no way to determine if tree removal for road improvement contributed to the increased water temperature from upstream to downstream.
SR1169 Site (West Fork Pine Swamp)
The SR1169 site was located along SR1169 in southern Ashe County. The monitored stream reach was about 220 ft long, with 50 ft consisting of a culvert, and was within 50 ft of the road for the whole reach. There was no tree canopy over the stream in the reach (figure 5). The drainage area to the upstream station was 531 ac with 91.9% of the land classified as forested and 4.1% cultivated (Table 1). The area of forested land decreased during the monitoring period as clearing of trees upstream of the monitored reach was observed. There was only 1-2 acres draining to the creek between the stations. The width of the stream water was 3-6 ft depending on discharge and location and the depth 0.25-0.5 ft during baseflow. Discharge ranged from 0.46 to 6.03 cfs measured on 8 occasions. A stage discharge rating table was developed for this site, although a debris jam and changes in the stream channel after about a year of monitoring made
13
the rating subject to greater than acceptable error. Continued changes in the stream channel cross section negated the use of an updated stage-discharge rating table
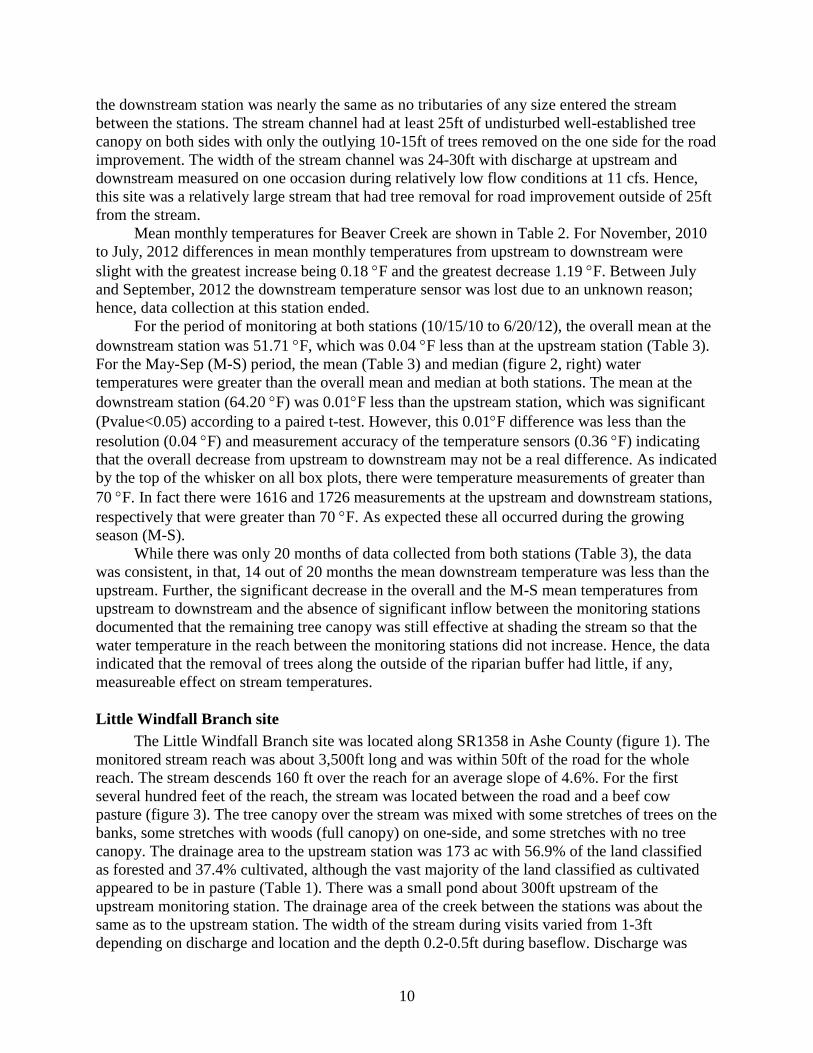
Mean monthly temperatures for the SR1169 site along with atmospheric data collected at Laurel Springs, NC are shown in Table 5. Monthly discharge volumes, computed from continuous stage measurements, are shown for March to June, 2011 along with monthly mean temperatures for all months of the monitoring project. Observations during visits in June 2012 and December 2013 documented that the upstream and downstream sensors were covered by sediment; thus data for the previous two months were deleted. Differences in monthly means between the stations were sometimes positive and sometimes negative with no consistent seasonal trend apparent. The overall mean at the downstream station (49.03 °F) was 0.18 °F greater than that of the upstream station which was statistically significant according to a paired t-test. During May-Sep, the mean at the downstream station (56.83 °F) was 0.03 °F less than that of the upstream station, which was also statistically significant. An increase in temperature from upstream to downstream during the growing season was expected given that there was no tree canopy over the stream channel and inflow between the stations was minimal. The decrease may be attributed to the effect of the culvert, which made up about 23% of the length of the monitored reach. The culvert likely shaded, and maybe cooled, the incoming water during the M-S months thereby decreasing the water temperature. In addition large shrubs along the bank may have provided some shading during the summer (figure 5) in the monitored reach. While the median temperatures during the M-S were greater than the medians for all of the data (fig. 5 right), there were no water temperatures greater than 70 °F recorded. In fact the highest water temperature was 65.44 °F measured at the upstream station. Thus, the significant decrease in temperature from upstream to downstream during the growing (M-S) season indicated that the road improvement did not increase water temperature, on the contrary, it may have decreased water temperature due to the effect of the culvert (if a longer culvert was installed there would be more shading), but pre-improvement data would be needed to confirm this. In many cases culverts are lengthened for the road improvement as was the case here where the pre-improvement culvert was 41 feet long, while the post-improvement culvert was 50 ft long.
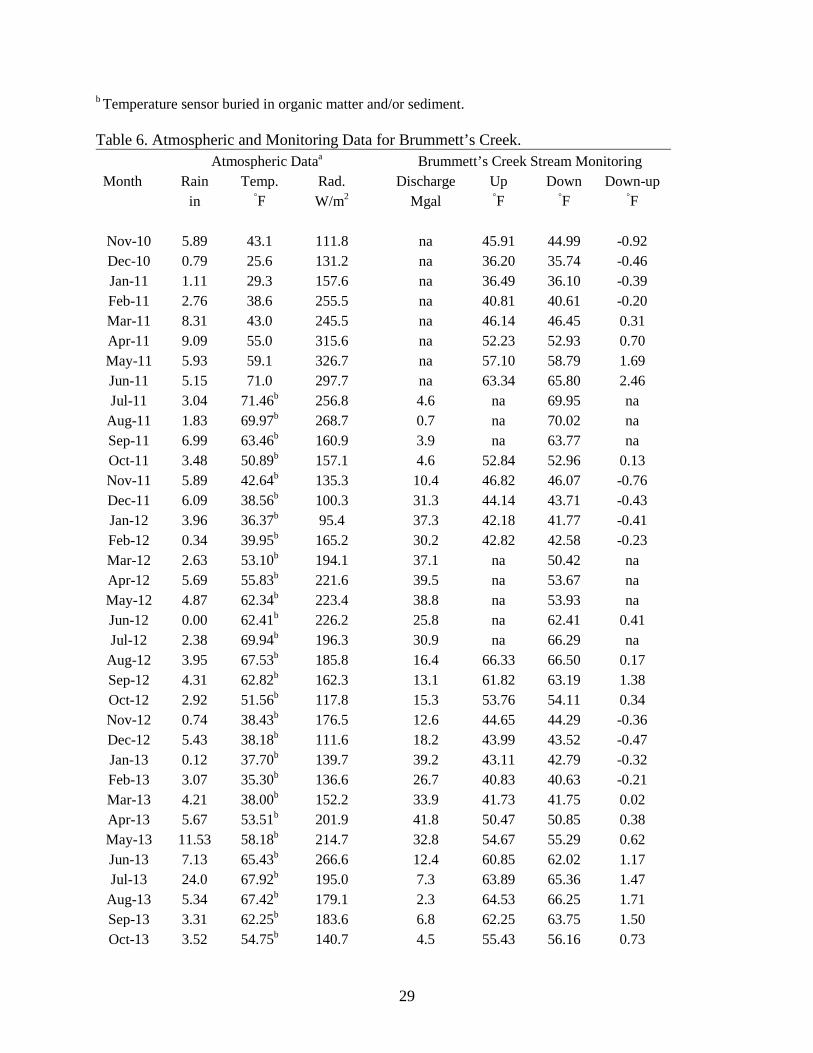
Brummetts Creek Site
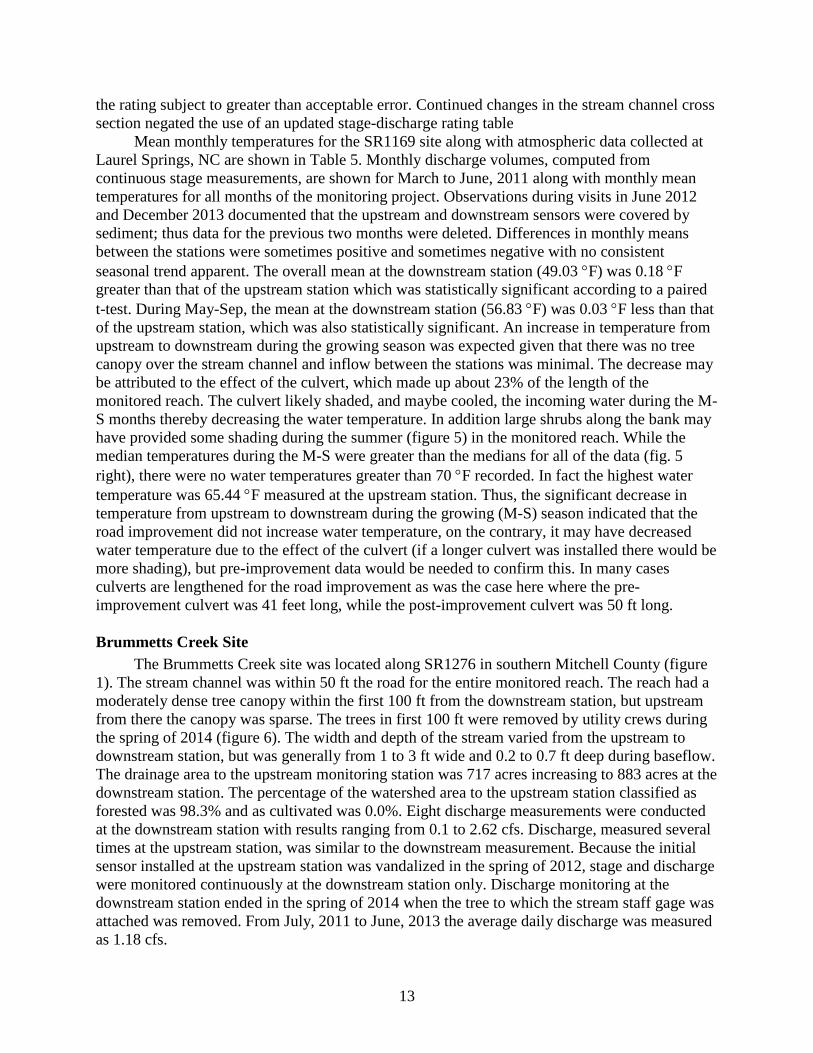
The Brummetts Creek site was located along SR1276 in southern Mitchell County (figure 1). The stream channel was within 50 ft the road for the entire monitored reach. The reach had a moderately dense tree canopy within the first 100 ft from the downstream station, but upstream from there the canopy was sparse. The trees in first 100 ft were removed by utility crews during the spring of 2014 (figure 6). The width and depth of the stream varied from the upstream to downstream station, but was generally from 1 to 3 ft wide and 0.2 to 0.7 ft deep during baseflow. The drainage area to the upstream monitoring station was 717 acres increasing to 883 acres at the downstream station. The percentage of the watershed area to the upstream station classified as forested was 98.3% and as cultivated was 0.0%. Eight discharge measurements were conducted at the downstream station with results ranging from 0.1 to 2.62 cfs. Discharge, measured several times at the upstream station, was similar to the downstream measurement. Because the initial sensor installed at the upstream station was vandalized in the spring of 2012, stage and discharge were monitored continuously at the downstream station only. Discharge monitoring at the downstream station ended in the spring of 2014 when the tree to which the stream staff gage was attached was removed. From July, 2011 to June, 2013 the average daily discharge was measured as 1.18 cfs.
14
Mean monthly temperature data for the two stations are shown in Table 2. Observation on 9/23/11 documented that the sensor at the upstream station was covered with sediment; hence data from 7/11 (last visit before) to 9/11 were not reported for these periods. Also, the upstream sensor was stolen and became partially out of the water on occasion resulting in the loss of data (July, 2012). Mean monthly temperatures consistently increased from upstream to downstream during the May to September months and were mixed the other months. Increases during May-September were expected given that there was sparse to no tree canopy over much of the reach between the stations and the discharge rate was low.
Overall mean temperature for the downstream station (52.47 °F) was 0.51 °F greater than the upstream station (Table 3), while for the M-S months, the average downstream temperature was 1.52 °F greater than the upstream. Both of these differences were statistically significant according to paired t-tests. Also, the differences were greater than the resolution (0.04 °F) and measurement accuracy of the temperature sensors (0.36 °F) indicating that the overall increase from upstream to downstream was real. At the upstream station 2,761 measurements were greater than 70 °F, while at the downstream station 6,233 were greater. These data indicate that the road improvement may have raised temperatures in the stream; however, without pre-improvement data this could not be determined with any certainty. It is also important to note that most of the trees directly over the stream were removed by the electric utility than were removed for the road.
Wallace Branch Site
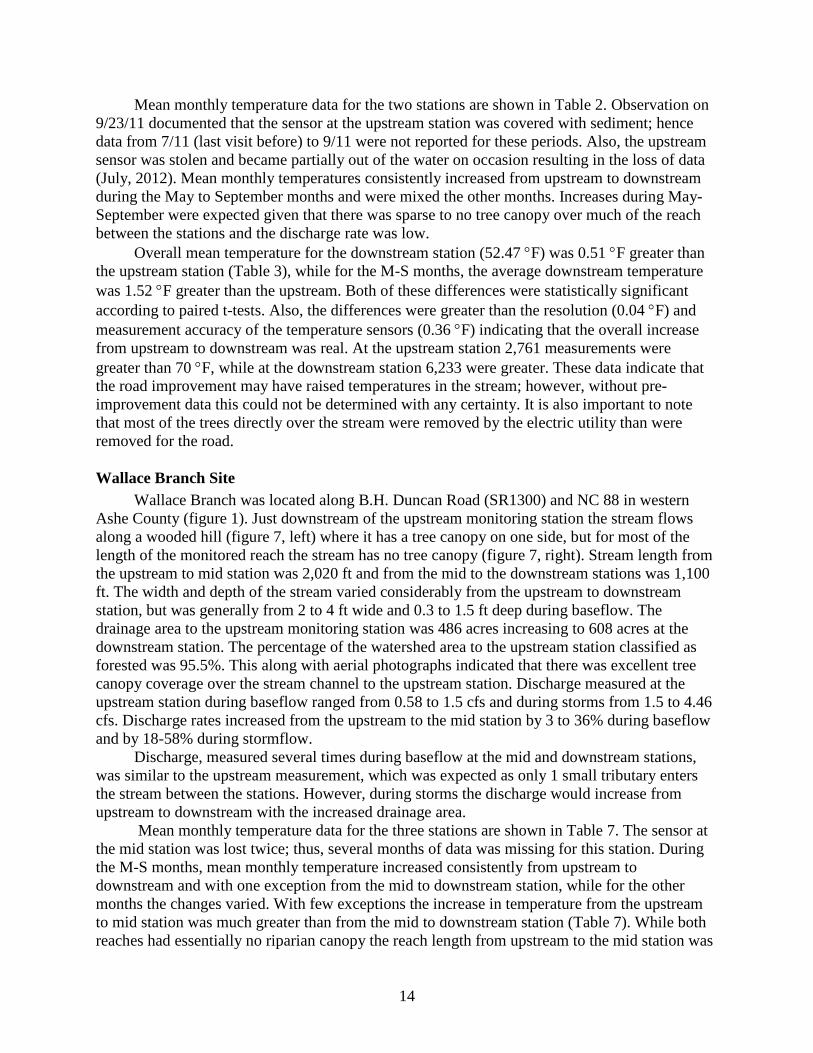
Wallace Branch was located along B.H. Duncan Road (SR1300) and NC 88 in western Ashe County (figure 1). Just downstream of the upstream monitoring station the stream flows along a wooded hill (figure 7, left) where it has a tree canopy on one side, but for most of the length of the monitored reach the stream has no tree canopy (figure 7, right). Stream length from the upstream to mid station was 2,020 ft and from the mid to the downstream stations was 1,100 ft. The width and depth of the stream varied considerably from the upstream to downstream station, but was generally from 2 to 4 ft wide and 0.3 to 1.5 ft deep during baseflow. The drainage area to the upstream monitoring station was 486 acres increasing to 608 acres at the downstream station. The percentage of the watershed area to the upstream station classified as forested was 95.5%. This along with aerial photographs indicated that there was excellent tree canopy coverage over the stream channel to the upstream station. Discharge measured at the upstream station during baseflow ranged from 0.58 to 1.5 cfs and during storms from 1.5 to 4.46 cfs. Discharge rates increased from the upstream to the mid station by 3 to 36% during baseflow and by 18-58% during stormflow.
Discharge, measured several times during baseflow at the mid and downstream stations, was similar to the upstream measurement, which was expected as only 1 small tributary enters the stream between the stations. However, during storms the discharge would increase from upstream to downstream with the increased drainage area.
Mean monthly temperature data for the three stations are shown in Table 7. The sensor at the mid station was lost twice; thus, several months of data was missing for this station. During the M-S months, mean monthly temperature increased consistently from upstream to downstream and with one exception from the mid to downstream station, while for the other months the changes varied. With few exceptions the increase in temperature from the upstream to mid station was much greater than from the mid to downstream station (Table 7). While both reaches had essentially no riparian canopy the reach length from upstream to the mid station was

15
about twice the length from the mid to downstream station. In addition, there were pools and at least one intermittent tributary feeding the stream between the upstream and mid station, but it was a mostly straightened (ditched) channel from the mid to downstream station. These factors may explain at least some of the difference in temperature between the stations.
For all of the paired data from the upstream and downstream stations (Table 3), the downstream overall mean (51.13 °F) was significantly greater than the upstream (50.30 °F). For the M-S months the mean temperatures were more than 10 °F greater and the increase in mean temperature from upstream to downstream was greater (0.12 to 0.24 °F). This was also the case for the medians which are shown in figure 8 (right). These increases were expected given that there was no riparian canopy in the reach between the stations and the stream was relatively small.
Comparisons using the mid station included less data as the station was lost from 11/1/10 to 3/23/11, from 10/1/12 to 4/18/13, and from 12/8/13 to 3/31/14. Using the remaining paired data, the mean temperature increased significantly from the upstream (51.92 °F) to the mid (52.65 °F) station and from the mid to downstream (53.01 °F) station. The increase from the upstream to mid (0.73 °F) was more than twice the increase from the mid to downstream (0.36 °F) to downstream station. These data confirm the observation in the monthly means as discussed above.
Regarding individual measurements, no measurements of greater than 70 °F were recorded at the upstream station, in fact the highest temperature was 66.02 °F, while at the downstream station 2,146 measurements were greater than 70 °F with the greatest being 77.57 °F, which occurred on 8/11/11. There were 1,103 measurements at the mid station for which temperature was greater than 70 °F. High temperature measurements from the mid station are comparable because few were missed during the May to September months.
These data along with the mean data from the previous paragraphs confirm that significant heating of small streams to the point of limiting trout populations can occur when a riparian canopy is not present. The effect of removing a few trees for road improvement from the last ~100 ft of the reach from the upstream to mid station cannot be determined, because the water temperature prior to the tree removal was unknown.
Cranberry Creek Site
The Cranberry Creek site was located along Upper Cranberry Creek Road (SR1609) in eastern Ashe County (figure 1). The stream channel was within 50 ft of the road for the entire 1525 ft monitored reach. The upstream and downstream stations were equipped with temperature and pressure sensors along with staff gages in order to measure discharge. A temperature only sensor was installed at the mid station about 875 ft downstream from the upstream station. From the mid to downstream station (650 ft) the stream had almost no tree canopy (figure 9, left), while from the mid to upstream station a moderately dense tree canopy over the stream was present with mature trees on both banks (figure 9, right). The tree removal for road improvement occurred between the upstream and mid stations and did not include any trees on the streambank. On the left bank (looking downstream) over the entire monitored reach a field started about 20-40 ft from the bank so only trees on the stream bank were shading the stream. The channel slope from the mid to downstream section was relatively flat resulting in slow-moving, deeper water. The depth of the stream varied considerably from the upstream to downstream station, but was generally from 0.6 to 3 ft deep during baseflow with the width being 20-40 ft. The drainage area to the upstream monitoring station was 15,808 acres increasing to 16,064 acres at the

16
downstream station. The percentage of the watershed area to the upstream station classified as forested was 60.1% and as cultivated was 29.3%. Ten discharge measurements at the downstream station ranged from 15 to 143 cfs. Discharge, measured several times at the mid and upstream stations, was similar to the downstream measurement, which was expected as only 2 small tributary enters the stream between the stations. Because the stream cross section at the upstream station varied for several months due to a fallen tree, only continuous discharge measured at the downstream station was considered accurate enough to be reported.
The sensor at the mid station was lost sometime before March 2011 and another one was installed on 3/23/11. Observation on 3/6/12 documented that the sensor was covered with sediment; hence data from last visit before 3/12) to 3/12 and prior to 3/11 was not reported for these periods. The upstream station was covered with >1 ft of sediment 4/19/13 due to a fallen tree lodging near the station and causing sediment deposition. Temperature data from 1/31/13 was deleted as it is obvious diurnal variability decreased dramatically on this date (figure 10, left), which was assumed to be caused by sediment inundating the upstream sensor resulting in temperature buffering. The tree was cut and the temperature sensor uncovered on 4/26/13, which is when the use of temperature data resumed.
Mean monthly temperature data for the three stations are shown in Table 8. Mean monthly temperatures increased from upstream to downstream during most of the May to September months and were mixed during the other months. The greatest increase (1.02 °F) occurred during November 2013, which was somewhat unexpected given the cooler air temperature and lower solar radiation level. However, the tree canopy was likely gone and the discharge was relatively low, which could contribute to greater heating. Also, there may have been some remnant sediment remaining over the senor which would have buffered the temperature. The temperature graph (not shown) showed evidence of this as following the large storm 11/27/13 the upstream and downstream temperatures began to track nearly the same.
Comparing temperature increases from upstream to mid and mid to downstream during the May-September period for each year shows no consistent trend; for some months there was a greater increase from upstream to mid and for other months the increase from mid to downstream was greater. This was unexpected as the greatest increase in temperature was expected to occur from mid to downstream where the stream had no canopy and was slow-moving. It is also important to remember the differences in temperature between these stations was relatively small (<0.21 °F) when compared to the accuracy of the sensors (0.36 °F), the mid station had 10 months of missing data, and there was a problem with sediment deposition at the mid station, which may have been dynamic (varying depending on discharge) during the periods between visits (observations).
Using all of the data from 10/15/10 to 7/13/15, the mean downstream temperature was significantly greater than the upstream according to a paired t-test (Table 3). The median temperature at the downstream station was also greater than the upstream (figure 10, right). However, the difference in the overall means (0.12 °F) and medians were small. The difference in means was greater than the resolution (0.04 °F), but was much less than the reported measurement accuracy of the temperature sensors (0.36 °F) indicating that the decrease from upstream to downstream was within the range of measurement uncertainty. For the May-September data, the downstream mean was 0.24 °F greater than the upstream, which was also statistically significant according to a paired t-test, but was still less than the reported measurement accuracy of the sensor.
17
For comparisons with the mid station, the data set was missing from 11/1/10 to 3/31/11 and from 9/1/13 to 12/31/13 because two sensors were lost during those periods. For the remaining data, the mean temperature at the mid station was significantly greater (0.07 °F) than the upstream station and significantly less (0.04 °F) than the downstream station. The greater increase in mean temperature from upstream to mid compared to mid to downstream was unexpected as the section from upstream to mid had a tree canopy over it whereas the section from mid to the downstream station had no canopy and was slower moving water. Using data from only the May-September months, the mean at the mid station is still significantly greater (0.125 °F) than the upstream station and less (0.122 °F) than the downstream station, but the differences are almost equal. These data indicate that tree canopy shading, or the lack thereof, may not be directly related to changes in stream temperature. The upstream to mid station section had many more riffles causing greater interaction between air and water, while the mid to downstream section had tranquil and relatively deep water. Thus, heating by interaction with the air may have been just as important as heating by solar radiation on this large stream. Also, both reaches had at least one tributary entering the stream which could have introduced enough colder or warmer water to contribute significantly to the relatively small changes in temperature observed.
Stream discharge was monitored continuously at the downstream station as the stream channel remained stable downstream of the station during the project. The mean discharge for the monitoring period was 53.8 cfs. Discharge had an effect on water temperature in that higher stream discharge tended to lower mean temperatures by reducing the diurnal peaks in temperatures as illustrated by the lack of diurnal variation in water temperature during the storm of 1/30/13-2/1/13, which is shown in figure 10 (left). However, the effect appeared to be the same for all three stations, so it should not affect comparisons between stations.
Thus, given the small increases in temperature from upstream to downstream and the measurement accuracy of the sensors, it cannot be said with reasonable confidence that there was a real increase in temperature from upstream to downstream, let alone if it was caused by any tree removal as a result of road improvement activities.
Bear Wallow Site
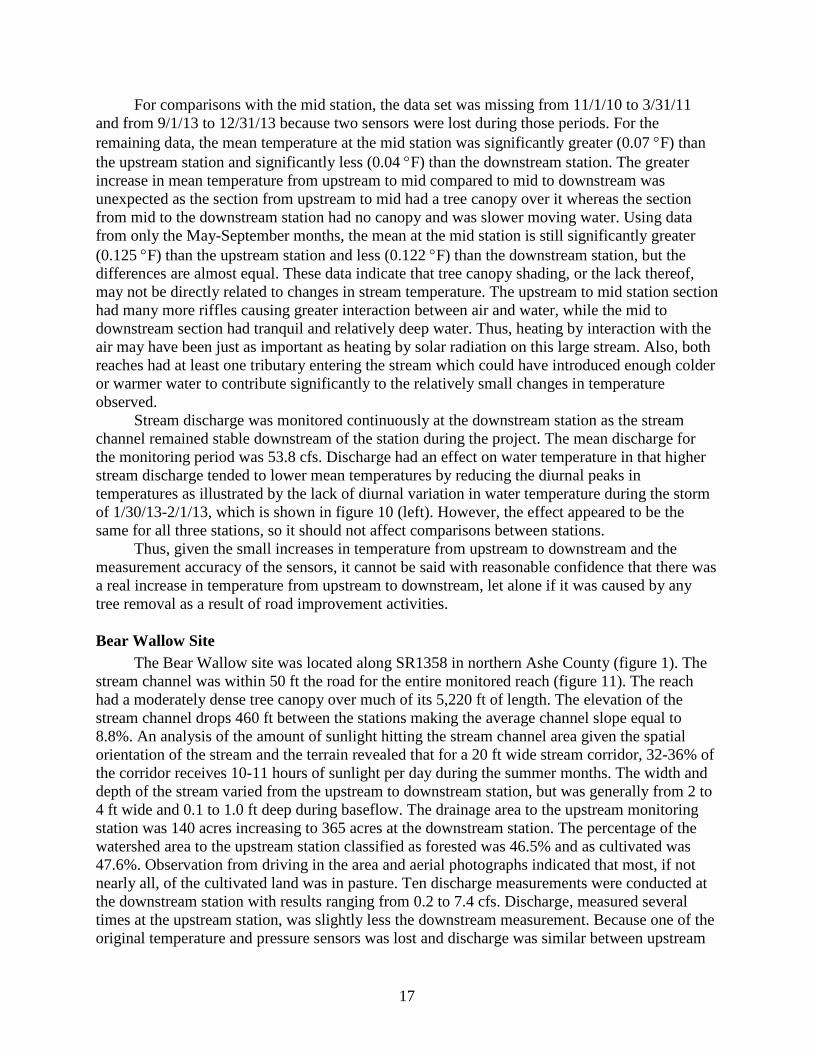
The Bear Wallow site was located along SR1358 in northern Ashe County (figure 1). The stream channel was within 50 ft the road for the entire monitored reach (figure 11). The reach had a moderately dense tree canopy over much of its 5,220 ft of length. The elevation of the stream channel drops 460 ft between the stations making the average channel slope equal to 8.8%. An analysis of the amount of sunlight hitting the stream channel area given the spatial orientation of the stream and the terrain revealed that for a 20 ft wide stream corridor, 32-36% of the corridor receives 10-11 hours of sunlight per day during the summer months. The width and depth of the stream varied from the upstream to downstream station, but was generally from 2 to 4 ft wide and 0.1 to 1.0 ft deep during baseflow. The drainage area to the upstream monitoring station was 140 acres increasing to 365 acres at the downstream station. The percentage of the watershed area to the upstream station classified as forested was 46.5% and as cultivated was 47.6%. Observation from driving in the area and aerial photographs indicated that most, if not nearly all, of the cultivated land was in pasture. Ten discharge measurements were conducted at the downstream station with results ranging from 0.2 to 7.4 cfs. Discharge, measured several times at the upstream station, was slightly less the downstream measurement. Because one of the original temperature and pressure sensors was lost and discharge was similar between upstream

18
and downstream, continuous discharge measurement was only performed at the downstream station. Changes in sediment levels in the culvert just downstream of the downstream station altered the stag-discharge rating table thereby preventing continuous measurement of discharge at this station.
This site was unique in that monitoring was conducted before, during, and after (post) road improvement. This provided the best opportunity to document effects of riparian canopy removal on the water temperature of an adjacent stream; however, because the road improvement was completed in stages, it was difficult to delineate when the improvement/construction started and when it was completed. For analysis purposes the before or pre-improvement period ended with the beginning of tree clearing in the monitored reach on about 12/1/13. This date was chosen because during the site visit on 12/5/13 tree clearing and other construction activities were observed downstream of the upstream station. For the beginning of the post-improvement period the final completion date on the contract (5/27/15) could be used; however, that would leave a very short post-improvement period (June to July, 2015) whereas using the time that the end of clearing (6/1/14) was observed would leave a little more than a year post-improvement period. The problem with using the end of clearing was that even though the change in the riparian canopy was complete, construction activities could affect the temperature of stream. Thus, a date near the end of construction seemed more appropriate. This date was chosen as 12/1/14 because observation on 12/9/14 documented that construction of the road was completed to the downstream station (figure 12, left).
Mean monthly temperature data for the two stations are shown in Table 9. Temperature data for the downstream station was missing from March, 2011 through August, 2011; from April, 2013 through August 2013; and from December, 2014 through May, 2015 due to sediment inundation or the loss of the sensor. Mean monthly temperatures showed no consistent seasonal trend, except that downstream temperatures were greater during February and March of each year. The largest monthly increase in water temperature from upstream to downstream (0.99 °F) occurred during June, 2014, which also had the second highest monthly mean air temperature (64.33 °F).
Analyzing all of the pre-improvement data combined showed that the mean temperature at the downstream station was significantly greater than at the upstream station (Table 3) according to a paired t-test. For data collected during the M-S months, the means and medians (figure 12, right) were more than 10 °F greater than for all of the data combined. For the M-S data the mean temperature at the downstream station was also significantly greater than the upstream according to a paired t-test. The increase in means for all of the data (0.10 °F) was nearly the same as for the M-S only data (0.11 °F). During July, 2012 there were several measurements greater than 76 °F at the upstream station, which were 5-12 °F greater than those at the downstream station. While given that just upstream of the upstream station the stream was totally exposed in an open cow pasture, the temperatures seemed suspiciously high. It may have been possible that the sensor was out of the water and exposed directly to the air or that the cows in the stream raised the water temperature. Further, there were 2,236 measurements of greater than 70 °F at the upstream station and only 798 at the downstream station. This was unlike any other site and also casts suspicion on the upstream data.
The mean temperature at the downstream station was significantly greater than at the upstream station for all data collected during the post-improvement period as shown in Table 3. The same was true for the relatively small number of data collected during the M-S months as
19
well. There are too few data collected during the post-improvement period to warrant drawing any conclusions about the effect of riparian clearing on the water temperatures of this stream.
Comparisons Between Sites
Comparisons between sites provide insight into the temperature data. Comparing differences between upstream and downstream overall mean temperatures, the data shows that greatest decrease in temperature occurred for Little Windfall Branch followed by Raccoon Creek (Table 10). For the Little Windfall site, the decrease may be due to the fact that there was only 11 months of paired data or that the drainage area to the upstream station had a small pond and large cattle pasture in it thereby increasing the upstream water temperature. In fact, the mean at the upstream station (53.98 °F) was the highest for any site. Similar to Little Windfall, the mean upstream temperature for Raccoon Creek was more than 1 °F greater than any other stations. The reason for the elevated temperature was unknown, but could be related to the fact that Raccoon Creek runs through the town of Tipton Hill before reaching the upstream station. Curiously, the mean temperature increased considerably from upstream to downstream during the M-S months. The reason for this was unknown, but could have been due to the influx of water from the relatively large tributary entering the Creek between the stations. Beaver Creek was the only other site for which the mean overall temperature decrease from upstream to downstream, but for this site the upstream mean was similar to other sites and the decrease was small (0.04 °F). Thus for these three sites, because temperatures overall decreased from upstream to downstream, it would be hard to make a case that tree removal as a result of road improvement between the stations caused thermal pollution during the monitoring period.
Among post-road improvement sites (excluding Bear wallow) with an increase in temperature from upstream to downstream, Cranberry Creek had the least (0.12 °F). The fact that it was a large stream (mean discharge was 53 cfs for 10/1/11 to 7/1/15), much of the monitored reach had a continuous tree canopy, and the road improvement did not affect the near-stream (within 20 ft of the bank) canopy suggested that there would be no increase in temperature; however, unlike Beaver Creek, Cranberry Creek had a 650 ft reach of stream channel near the downstream station with no tree canopy, which would suggest an increase in temperature. The relatively small increase in mean overall and M-S temperatures suggest that there was no effect of tree removal associated with the road improvement at this site. Of course the confidence level in this statement is relatively low as pre-improvement temperature monitoring data would be needed to provide the confidence.
The SR1169 site also had a relatively small increase in mean overall temperature (0.16 °F) from upstream to downstream, which was expected given its medium size (drainage area 500-900 acres) and the relatively short distance (220 ft) between monitoring stations. What was unexpected is that unlike any other site, the mean temperature for the M-S months decreased from upstream to downstream, especially given that the upstream mean temperature was the lowest of any site. The presence of the 70 ft long culvert may explain this anomaly as it helped reduce the temperature during the M-S months by shading the stream for 32% of the monitored reach and likely helped increase temperature in the winter months by remaining near underground temperatures. Thus, these data indicate that, in some cases, a culvert may actually reduce water temperature in streams.
Wallace Branch and Brummetts Creek, both medium-sized streams (drainage areas 500-900 acres), had considerable increases in overall mean temperatures from upstream to downstream and greater increases in the M-S months. Overall temperatures in both streams

20
increased nearly 0.25 °F/1,000ft of monitored stream length (Table 10). The increase was even greater during the M-S months (0.67-0.76 °F/1000 ft). This was not surprising considering that both streams had little tree canopy over the channel during most of the monitoring period. The increase in temperatures cannot be attributed to tree removal for road improvement as it is likely that the temperature increased from upstream to downstream prior to the road improvement.
Bear Wallow was a small stream (drainage area=100 to 400 acres) with an increase in overall and M-S mean temperature from upstream to downstream. This site was unique in that this monitoring occurred mostly prior to road improvement activities. Even before tree clearing for road improvement the temperature increase in from upstream to downstream by about 0.02 °F/1,000 ft during both overall and during the M-S months, which was the lowest rate of change among the sites.
The SR1169 site was the smallest stream with a drainage area of only 85 acres. Water temperature increased at the rate of more than 2.4 °F/ 1,000 ft in the 70 ft reach during the overall monitoring period. This was expected as there was no tree canopy over the stream channel and the discharge was low. Given the small discharge of the stream even a considerable increase in temperature would likely have little effect downstream as the tributary empties into a much larger stream.
SUMMARY AND CONCLUSIONS In summary, temperature upstream and downstream of a section of 9 streams of various
sizes was monitored for 4+ years during this and a previous project. On 5 of the 9 streams, discharge was also monitored continuously for at least a portion of the monitoring period. For the two large streams (drainage area >10,000 ac) the overall temperature decreased from upstream to downstream for one and increased for the other. Although not definitive without pre-road improvement monitoring data, the data showed that the few trees removed from the outer riparian areas (> 20ft from the streambank) during road improvement were unlikely to have raised the water temperature in either monitored reach. Monitoring of four medium-sized streams (drainage area 600-900 acres) documented three increases and one decrease in overall mean temperatures from upstream to downstream of a reach where road improvements had occurred. Two of the increases and the decrease were greater than the measurement accuracy (0.36 °F) of the temperature sensors. Thus, for the medium-sized streams the data were inconclusive as to whether there were increases in temperature in the monitored reach following road improvement. For the two small streams (drainage area 100 to 400 acres) one had a decrease in overall mean temperature from upstream to downstream and the other had an increase. For the stream with the increase, tree removal for road improvement had not even occurred yet. While not definitive the data suggested the following conclusions:
• Removing trees that were not directly shading a reach on a large stream (drainage area > 10,000 ac) did not result in a ‘real’ measurable increase in water temperature. This suggests that removing trees that do not directly shade the stream channel will have a negligible effect on water temperature of the stream.
• For one of the large streams (drainage area >10,000 ac), there was only a 0.04 °F increase in water temperatures in a 650 ft long reach with no tree canopy. This indicated that
21
removing 10 maybe even 20% of the trees directly shading a large stream should not increase the stream temperature.
• For medium-sized streams (drainage area = 600-900 acres) overall mean water temperature can increase 0.16 °F over a reach as short as 220 ft that has no tree canopy.
• In at least one small stream, air temperature seemed to influence the change in stream temperature as much, if not more, than solar radiation; however, additional research and data analysis are required to confirm this.
• Mean water temperature during the May-September months was 8-13 °F higher than during the October-April months for all streams.
• Great care must be taken to locate temperature sensors where they will not be inundated with sediment or exposed to the air and/or sun, especially for streams in which the channel is narrow and/or shallow.
• Additional research is needed where stream temperature is monitored before, during, and after road improvement to more definitively document the effects of riparian tree canopy reductions on stream temperatures.
CITED REFERENCES
Beschta, R.L. and R.L. Taylor. 1988. Stream Temperature Increases and Land Use in a Forested Oregon Watershed. Water Resources Bulletin, Journal of the American Water Resources Association 24(1):19-25.
Coutant, C.C. 1977. Compilation of temperature preference data. J. Fish. Res. Board Can. 34(5):739-745.
Holtby, L.B. 1988. Effects of Logging on Stream Temperatures in Carnation Creek, British Columbia, and Associated Impacts on the Coho Salmon (Oncorhynchus kisutch). Canadian Journal of Fisheries and Aquatic Sciences 45:502-515.
Jones, M.P. and W.F. Hunt. 2009. Bioretention impact on runoff temperature in trout sensitive waters. Journal of Environmental Engineering 135(8):577-585.
Sweeney, B.W. 1993. Effect of Streamside Vegetation on Macroinvertebrate Communities of White Clay Creek in Eastern North America. Proceedings of the Academy of Natural Sciences of Philadelphia 144:291-340.
Swift, L.W. and J. Messer. 1971. Forest Cuttings Raise Temperatures of Small Streams in the Southern Appalachians. J. Soil and Water Conservation 26(3):111-116.

22
LIST OF TABLES
Table 1. Location Coordinates and Watershed Characteristics for the 9 Sites. Site Lat Long Area1 Elev.1 Reach Cultivated1 Developed1 Forested1
Deg. Deg. ac ft ft % % %
Beaver Creek up 36.34 81.43 10496 3230 - 31.4 10.3 54.7 down 36.33 81.43 10560 3230 750 31.4 10.3 54.7 Raccoon Creek up 36.03 82.27 634 2580 - 24.9 6.0 67.1 down 36.03 82.27 704 2560 3000 23.1 6.0 68.5 Little Windfall up 36.56 81.56 173 3570 - 37.4 5.0 56.9 down 36.56 81.55 371 3420 3500 21.1 3.7 74.6 SR1169-trib up 36.26 81.48 85 3668 - 0.0 0.1 99.9 down 36.26 81.48 85 3668 70 0.0 0.1 99.9 SR1169 up 36.26 81.48 531 3660 - 4.1 2.2 91.9 down 36.26 81.48 531 3660 220 4.1 2.2 91.9 Wallace Branch up 36.38 81.71 486 3590 - 2.5 1.2 95.5 mid 36.38 81.71 595 3540 2200 6.9 1.9 88.5 down 36.39 81.71 608 3540 1100 7.4 2.5 87.5 Brummetts Creek up 36.06 82.27 717 3160 - 0.0 1.1 98.3 down 36.06 82.27 883 3080 2000 0.3 1.2 97.4 Bear Wallow up 36.58 81.54 141 3580 - 47.6 4.9 46.5 down 36.56 81.54 371 3400 5220 36.5 4.7 75.4 Cranberry Creek
up 36.42 81.29 15808 3110 - 29.3 6.3 60.1 mid 36.42 81.29 15872 3110 875 29.4 6.3 60.0 down 36.42 81.29 16064 3110 650 29.6 6.3 59.8
1 Drainage area, mean elevation, and land use (based on 2006 data) from USGS StreamStats website.

23
Table 2. Monitoring Data for Beaver Creek and Little Windfall Branch. Beaver Creek Little Windfall Branch Month Up Down Down-Upa
Up Down Down-Up
◦F ◦F ◦F
◦F ◦F ◦F
Nov-10 44.92 44.69 -0.23 49.89 nab na Dec-10 35.13 34.87 -0.26 37.93 nab na Jan-11 36.23 36.01 -0.22 37.77 nab na Feb-11 40.52 40.48 -0.04
43.89 nab na
Mar-11 46.31 46.30 -0.01
46.00 nab na Apr-11 54.14 54.18 0.04
51.44 51.43 -0.01
May-11 60.00 59.95 -0.05
55.51 55.56 0.05 Jun-11 65.58 65.62 0.04
62.06 61.48 -0.58
Jul-11 68.46 68.51 0.05
66.31 65.30 -1.01 Aug-11 68.38 68.36 -0.02
65.70 64.73 -0.98
Sep-11 62.92 62.81 -0.11
60.94 60.25 -0.69 Oct-11 53.44 53.32 -0.12 53.59 51.58 -2.02 Nov-11 46.73 46.67 -0.05 48.20 45.72 -2.48 Dec-11 43.26 43.24 -0.01 45.42 43.74 -1.67 Jan-12 41.46 40.27 -1.19 43.65 42.02 -1.64 Feb-12 41.99 42.06 0.07 43.91 42.51 -1.40 Mar-12 50.61 50.79 0.18 49.85 nab na Apr-12 54.85 54.80 -0.05 51.85 nab na May-12 61.07 61.11 0.04 56.42 nab na Jun-12 62.49 62.38 -0.11 59.77 nab na Jul-12 69.19 nab na 65.37 nab na
Aug-12 67.12 nab na 64.38 nab na Sep-12 62.89 nab na 61.13 nab na Oct-12 53.76 nab na 53.56 nab na Nov-12 42.62 nab na 44.42 nab na Dec-12 41.13 nab na 43.95 nab na Jan-13 40.86 nab na 43.62 nab na Feb-13 39.54 nab na 41.99 nab na Mar-13 40.76 nab na 42.68 nab na Jan-13 43.06 nab na 49.48 nab na Feb-13 41.49 nab na 53.02 nab na Mar-13 41.91 nab na 59.02 nab na Apr-13 nab nab na 60.45 nab na May-13 nab nab na 60.50 nab na Jun-13 nab nab na 59.78 nab na Jul-13 nab nab na 54.39 nab na
Aug-13 nab nab na 46.49 nab na

24
Sep-13 nab nab na 43.18 nab na Oct-13 nab nab na 39.65 nab na Nov-13 nab nab na 41.04 nab na Dec-13 nab nab na 43.06 nab na Jan-14 nab nab na 49.14 nab na Feb-14 nab nab na 55.58 nab na Mar-14 nab nab na 59.96 nab na Apr-14 nab nab na 63.15 nab na May-14 nab nab na 63.01 nab na Jun-14 nab nab na 61.48 nab na Jul-14 nab nab na 54.65 nab na
Aug-14 nab nab na 43.70 nab na Sep-14 nab nab na 43.90 nab na Oct-14 nab nab na 39.52 nab na Nov-14 nab nab na 37.02 nab na Dec-14 nab nab na 45.14 nab na Jan-15 nab nab na 50.25 nab na Feb-15 nab nab na 56.36 nab na Mar-15 nab nab na 62.39 nab na Apr-15 nab nab na 49.89 nab na May-15 nab nab na 37.93 nab na Jun-15 nab nab na 37.77 nab na
a Difference in monthly means. b Temperature sensor was lost.

25
Table 3. Statistical Comparison Between Stations for the 9 Sites. Site Begin End Dur.a Count Up Mid Down Pvalue
months no. °F °F °F
Beaver Creek all paired data 10/17/10 6/20/12 20 44,248 51.75 na 51.71 0.000 May-Sep (M-S) 5/1/11 6/20/12 7 14,663 64.21 na 64.20 0.000 Little Windfall all paired data 3/24/11 3/7/12 11 25,108 53.98 na 52.86 0.000 May-Sep (M-S) 5/1/11 9/30/11 5 11,016 62.18 na 61.54 0.000 up only data 3/24/11 7/13/15 50 113,180 52.50 na na na Raccoon Creek all paired data 10/15/10 12/10/14 48 109,182 53.86 na 53.49 0.000 May-Sep (M-S) 5/1/11 9/30/14 20 44,055 63.04 na 63.53 0.000 SR1169-trib all paired data 2/15/11 9/15/12 18 41,428 52.70 na 52.87 0.000 May-Sep (M-S) 5/1/11 9/15/12 10 20,874 58.13 na 58.50 0.000 SR1169 all paired 11/1/10 6/9/15 54 121,015 49.14 na 49.30 0.000 May-Sep (M-S) 5/1/11 6/9/15 21 46,868 56.75 na 56.71 0.000 Brummetts Creek all paired data 10/16/10 7/16/15 51 117,237 51.96 na 52.47 0.000 May-Sep (M-S) 5/1/11 7/16/15 20 45,840 63.10 na 64.62 0.000 Wallace Branch all paired up vs down 11/1/10 7/12/15 51 122,889 50.30 na 51.13 0.000 May-Sep (M-S) 5/1/11 7/12/15 22 49,307 58.86 na 61.07 0.000 all paired up vs mid 11/1/10 7/11/15 35 99,943 51.92 52.65 na 0.000 all paired mid vs down 11/1/10 7/11/15 35 99,943 na 52.65 53.01 0.000 Cranberry Creek all paired up vs down 10/15/10 7/13/15 53 124,663b 51.33 na 51.45 0.000 May-Sep (M-S) 5/1/11 7/13/15 22 49,356b 61.93 na 62.17 0.000 all paired up vs mid 3/24/11 7/13/15 46 106,200b 52.47 52.54 na 0.000 May-Sep (M-S) 5/1/11 7/13/15 21 47,089 62.04 62.17 na 0.000 all paired mid vs down 3/24/11 7/1315 46 106,200b na 52.54 52.58 0.000 May-Sep (M-S) 5/1/11 7/13/15 21 47,089 na 62.17 62.29 0.000 Bear Wallow: pre up vs down 10/16/10 12/1/13 40 61,622 49.71 na 49.81 0.000 May-Sep (M-S) 9/1/11 9/30/13 7 15,371 61.54 na 61.65 0.000 Bear Wallow: post up vs down 12/1/14 7/13/15 1 2,882 59.81 na 60.79 0.000 May-Sep (M-S) 5/26/15 7/13/15 1 2,305 63.38 na 64.46 0.000
a Includes only months when both stations were operational. b Does not include data collected when sensor under sediment.
26
Table 4. Monitoring Data for Raccoon Creek and Little Windfall Branch. Raccoon Creek SR1169-trib Month Up Down Down-upa Up Down Down-Upa ◦F ◦F ◦F ◦F ◦F ◦F
Nov-10 48.38 47.05 -1.33 na na na Dec-10 40.35 37.91 -2.44 na na na Jan-11 39.53 37.73 -1.80 na na na Feb-11 43.10 41.81 -1.29
43.19 43.05 -0.14
Mar-11 47.84 47.54 -0.30
44.58 44.52 -0.06 Apr-11 54.24 54.20 -0.04
49.99 50.01 0.02
May-11 58.37 58.78 0.41
53.05 53.19 0.14 Jun-11 63.41 64.13 0.72 57.08 57.39 0.32 Jul-11 65.83 66.88 1.06 60.16 60.64 0.49
Aug-11 65.83 66.74 0.91 61.26 61.82 0.57 Sep-11 62.24 62.53 0.30 58.10 58.45 0.36 Oct-11 54.06 53.17 -0.89 51.41 51.55 0.14 Nov-11 48.74 47.23 -1.51 47.62 47.53 -0.09 Dec-11 45.94 44.63 -1.32 46.30 46.20 -0.10 Jan-12 43.55 42.41 -1.14 43.01 42.84 -0.17 Feb-12 43.23 41.97 -1.26 43.10 42.96 -0.14 Mar-12 51.62 51.34 -0.29 49.01 49.01 -0.01 Apr-12 55.07 54.98 -0.08 51.10 51.15 0.05 May-12 60.75 60.81 0.06 54.45 54.61 0.16 Jun-12 62.46 62.95 0.49 56.51 56.82 0.31 Jul-12 67.45 67.93 0.48 61.28 61.69 0.41
Aug-12 66.07 66.79 0.72 60.40 60.93 0.53 Sep-12 63.06 63.57 0.51 58.31 58.89 0.58 Oct-12 55.26 54.78 -0.48 52.07 nab na Nov-12 46.93 45.19 -1.74 43.81 nab na Dec-12 45.39 44.22 -1.17 43.05 nab na Jan-13 44.41 43.45 -0.96 42.79 nab na Feb-13 43.17 42.28 -0.90 42.08 nab na Mar-13 44.15 43.63 -0.52 42.20 nab na Apr-13 52.34 52.31 -0.03 48.95 nab na May-13 57.10 56.79 -0.31 51.31 nab na Jun-13 62.50 62.38 -0.12 55.16 nab na Jul-13 65.01 65.14 0.13 56.68 nab na
Aug-13 64.65 65.10 0.45 56.86 nab na Sep-13 62.44 62.81 0.36 56.44 nab na
27
Oct-13 56.98 56.53 -0.45 52.53 nab na Nov-13 47.69 46.35 -1.35 44.63 nab na Dec-13 44.95 43.68 -1.27 43.31 nab na Jan-14 44.41 43.45 -0.96 38.48 nab na Feb-14 43.17 42.28 -0.90 39.97 nab na Mar-14 44.15 43.63 -0.52 42.13 nab na Apr-14 52.34 52.31 -0.03 48.89 nab na May-14 57.10 56.79 -0.31 53.76 nab na Jun-14 62.50 62.38 -0.12 57.42 nab na Jul-14 65.01 65.14 0.13 58.73 nab na
Aug-14 64.65 65.10 0.45 59.06 nab na Sep-14 62.44 62.81 0.36 58.33 nab na Oct-14 56.98 56.53 -0.45 53.26 nab na Nov-14 47.69 46.35 -1.35 44.43 nab na Dec-14 45.22 nab na 44.12 nab na Jan-15 41.02 nab na 39.94 nab na Feb-15 38.14 nab na 37.31 nab na Mar-15 47.15 nab na 44.90 nab na Apr-15 53.80 nab na 49.82 nab na May-15 59.01 nab na 53.86 nab na Jun-15 64.54 nab na 58.51 nab na
a Difference of monthly average. b Downstream station missing/lost. Table 5. Atmospheric and Monitoring Data for SR1169. Atmospheric Dataa SR1169 Stream Monitoring Month Rain Temp. Rad. Discharge Up Down Down-up in ◦F W/m2 Mgal ◦F ◦F ◦F
Nov-10 5.89 43.1 111.8
na 51.01 51.29 0.28
Dec-10 0.79 25.6 131.2
na 44.86 45.18 0.32 Jan-11 1.11 29.3 157.6
na 36.11 36.55 0.44
Feb-11 2.76 38.6 255.5
na 36.37 36.95 0.58 Mar-11 8.31 43.0 245.5
20.7 44.42 44.72 0.30
Apr-11 9.09 55.0 315.6
29.6 49.82 50.39 0.57 May-11 5.93 59.1 326.7
26.3 52.73 53.49 0.76
Jun-11 5.15 71.0 297.7 18.9 56.74 57.27 0.53 Jul-11 3.04 73.9 256.8 na 59.37 59.60 0.23
Aug-11 1.83 71.9 268.7 na 59.93 60.13 0.20 Sep-11 6.99 60.9 160.9 na 57.31 57.39 0.08 Oct-11 3.48 50.5 157.1 na 51.02 50.96 -0.06 Nov-11 5.89 45.4 135.3 na 46.82 46.88 0.06 Dec-11 6.09 39.9 100.3 na 45.17 45.28 0.11

28
Jan-12 3.96 36.9 95.4 na 42.44 42.57 0.13 Feb-12 0.34 39.3 165.2 na 43.22 43.19 -0.03 Mar-12 2.63 51.5 194.1 na 49.16 49.03 -0.13 Apr-12 5.69 52.7 221.6 na nab nab na May-12 4.87 61.7 223.4 na nab nab na Jun-12 0.00 64.8 226.2 na nab nab na Jul-12 2.38 70.7 196.3 na 60.55 60.49 -0.06
Aug-12 3.95 66.2 185.8 na 59.48 59.48 0.00 Sep-12 4.31 60.9 162.3 na 57.34 57.48 0.14 Oct-12 2.92 50.5 117.8 na 51.21 51.57 0.37 Nov-12 0.74 40.1 176.5 na 43.08 43.79 0.71 Dec-12 5.43 39.2 111.6 na 42.50 43.07 0.57 Jan-13 0.12 37.7 139.7 na 41.66 42.01 0.35 Feb-13 3.07 33.6 136.6 na 40.87 41.07 0.19 Mar-13 4.21 35.2 152.2 na 41.33 41.55 0.22 Apr-13 5.67 49.0 201.9 na 49.04 49.01 -0.02 May-13 11.53 56.4 214.7 na 51.62 51.68 0.06 Jun-13 7.13 66.9 266.6 na 55.27 55.22 -0.05 Jul-13 24.0 67.6 195.0 na 56.69 56.69 0.00
Aug-13 5.34 66.2 179.1 na 56.38 56.08 -0.30 Sep-13 3.31 60.7 183.6 na 55.85 55.64 -0.21 Oct-13 3.52 52.8 140.7 na nab nab na Nov-13 4.30 39.1 147.3 na nab nab na Dec-13 6.54 38.0 115.5 na 42.50 42.84 0.34 Jan-14 2.17 26.5 168.7 na 37.26 37.72 0.46 Feb-14 2.45 35.3 168.8 na 39.56 40.12 0.56 Mar-14 3.19 39.7 173.5 na 41.97 42.11 0.14 Apr-14 5.99 52.0 204.1 na 48.96 48.74 -0.22 May-14 5.39 61.2 260.9 na 54.33 54.01 -0.32 Jun-14 3.70 67.0 245.8 na 57.58 57.38 -0.20 Jul-14 3.35 66.0 228.6 na 58.45 58.23 -0.22
Aug-14 5.25 65.9 190.4 na 58.68 58.33 -0.35 Sep-14 5.01 61.8 155.9 na 57.90 57.85 -0.05 Oct-14 6.83 53.2 138.0 na 52.45 52.54 0.09 Nov-14 4.35 37.9 115.5 na 42.69 43.33 0.64 Dec-14 2.70 38.9 73.7 na 43.22 43.44 0.22 Jan-15 1.96 32.8 101.3 na 39.13 39.52 0.39 Feb-15 2.15 26.8 132.2 na 36.58 37.02 0.45 Mar-15 2.69 45.2 165.1 na 44.96 44.94 -0.02 Apr-15 11.96 52.7 174.6 na 50.16 49.94 -0.22 May-15 1.79 61.5 258.8 na nab nab na Jun-15 8.64 68.4 258.8 na nab nab na
a Data from NC State Climate Office weather station at Laurel Springs, NC.
29
b Temperature sensor buried in organic matter and/or sediment. Table 6. Atmospheric and Monitoring Data for Brummett’s Creek. Atmospheric Dataa Brummett’s Creek Stream Monitoring Month Rain Temp. Rad. Discharge Up Down Down-up in ◦F W/m2 Mgal ◦F ◦F ◦F Nov-10 5.89 43.1 111.8
na 45.91 44.99 -0.92
Dec-10 0.79 25.6 131.2
na 36.20 35.74 -0.46 Jan-11 1.11 29.3 157.6
na 36.49 36.10 -0.39
Feb-11 2.76 38.6 255.5
na 40.81 40.61 -0.20 Mar-11 8.31 43.0 245.5
na 46.14 46.45 0.31
Apr-11 9.09 55.0 315.6
na 52.23 52.93 0.70 May-11 5.93 59.1 326.7
na 57.10 58.79 1.69
Jun-11 5.15 71.0 297.7
na 63.34 65.80 2.46 Jul-11 3.04 71.46b 256.8 4.6 na 69.95 na
Aug-11 1.83 69.97b 268.7 0.7 na 70.02 na Sep-11 6.99 63.46b 160.9 3.9 na 63.77 na Oct-11 3.48 50.89b 157.1 4.6 52.84 52.96 0.13 Nov-11 5.89 42.64b 135.3 10.4 46.82 46.07 -0.76 Dec-11 6.09 38.56b 100.3 31.3 44.14 43.71 -0.43 Jan-12 3.96 36.37b 95.4 37.3 42.18 41.77 -0.41 Feb-12 0.34 39.95b 165.2 30.2 42.82 42.58 -0.23 Mar-12 2.63 53.10b 194.1 37.1 na 50.42 na Apr-12 5.69 55.83b 221.6 39.5 na 53.67 na May-12 4.87 62.34b 223.4 38.8 na 53.93 na Jun-12 0.00 62.41b 226.2 25.8 na 62.41 0.41 Jul-12 2.38 69.94b 196.3 30.9 na 66.29 na
Aug-12 3.95 67.53b 185.8 16.4 66.33 66.50 0.17 Sep-12 4.31 62.82b 162.3 13.1 61.82 63.19 1.38 Oct-12 2.92 51.56b 117.8 15.3 53.76 54.11 0.34 Nov-12 0.74 38.43b 176.5 12.6 44.65 44.29 -0.36 Dec-12 5.43 38.18b 111.6 18.2 43.99 43.52 -0.47 Jan-13 0.12 37.70b 139.7 39.2 43.11 42.79 -0.32 Feb-13 3.07 35.30b 136.6 26.7 40.83 40.63 -0.21 Mar-13 4.21 38.00b 152.2 33.9 41.73 41.75 0.02 Apr-13 5.67 53.51b 201.9 41.8 50.47 50.85 0.38 May-13 11.53 58.18b 214.7 32.8 54.67 55.29 0.62 Jun-13 7.13 65.43b 266.6 12.4 60.85 62.02 1.17 Jul-13 24.0 67.92b 195.0 7.3 63.89 65.36 1.47
Aug-13 5.34 67.42b 179.1 2.3 64.53 66.25 1.71 Sep-13 3.31 62.25b 183.6 6.8 62.25 63.75 1.50 Oct-13 3.52 54.75b 140.7 4.5 55.43 56.16 0.73

30
Nov-13 4.30 38.64b 147.3 5.5 44.20 43.51 -0.68 Dec-13 6.54 41.74b 115.5 na 42.19 41.74 -0.46 Jan-14 2.17 25.05b 168.7 na 35.46 35.04 -0.42 Feb-14 2.45 35.11b 168.8 na 39.04 38.79 -0.25 Mar-14 3.19 41.87b 173.5 na 42.72 42.91 0.19 Apr-14 5.99 54.58b 204.1 na 50.47 50.85 0.38 May-14 5.39 63.47b 260.9 na 54.67 55.29 0.62 Jun-14 3.70 na 245.8 na 64.55 66.41 1.86 Jul-14 3.35 67.38b 228.6 na 65.15 67.00 1.84
Aug-14 5.25 67.75b 190.4 na 65.33 67.59 2.25 Sep-14 5.01 65.13b 155.9 na 64.21 65.93 1.72 Oct-14 6.83 52.79b 138.0 na 55.30 55.72 0.42 Nov-14 4.35 35.82b 115.5 na 42.82 42.03 -0.78 Dec-14 2.70 39.02b 73.7 na 43.19 42.77 -0.42 Jan-15 1.96 32.32b 101.3 na 38.52 37.99 -0.53 Feb-15 2.15 27.63b 132.2 na 35.80 35.43 -0.37 Mar-15 2.69 46.18b 165.1 na 45.72 45.85 0.13 Apr-15 11.96 55.07b 174.6 na 52.02 52.50 0.48 May-15 1.79 62.21b 258.8 na 58.99 60.27 1.28 Jun-15 8.64 68.99b 258.8 na 65.42 67.41 1.99
a Data from NC State Climate Office weather station at Laurel Springs, NC. b Measured at downstream station. Table 7. Atmospheric and Monitoring Data for Wallace Branch. **** Atmospheric Data1 **** ******* Stream/water Data ********* Month Rain Temp. Rad. Up Mid Down Down-Up Down-Mid in ◦F W/m2 ◦F ◦F ◦F ◦F
◦F
Nov-10 5.89 43.09 111.8 44.81 na 45.28 0.47 na Dec-10 0.79 25.60 131.2 35.65 na 35.60 -0.05 na Jan-11 1.11 29.32 157.6 35.56 na 35.76 0.20 na Feb-11 2.76 38.59 255.5 39.77 na 40.39 0.62 na Mar-11 8.31 42.98 245.5 45.03 45.17 45.37 0.34 0.20 Apr-11 9.09 55.27b 315.6 51.39 51.83 52.27 0.88 0.44 May-11 5.93 58.47b 326.7 54.55 55.85 56.42 1.87 0.57 Jun-11 5.15 64.57b 297.7 59.43 61.64 62.38 2.95 0.74 Jul-11 3.04 68.16b 256.8 61.40 64.86 65.65 4.25 0.79
Aug-11 1.83 66.34b 268.7 61.73 65.20 65.77 4.04 0.56 Sep-11 6.99 60.69b 160.9 59.01 60.87 61.25 2.24 0.38 Oct-11 3.48 49.99b 157.1 53.20 51.90 52.13 -1.07 0.23 Nov-11 5.89 43.55b 135.3 47.78 46.00 46.19 -1.59 0.19 Dec-11 6.09 40.08b 100.3 43.35 42.81 43.21 -0.13 0.40 Jan-12 3.96 37.49b 95.4 41.62 40.86 41.49 -0.14 0.63
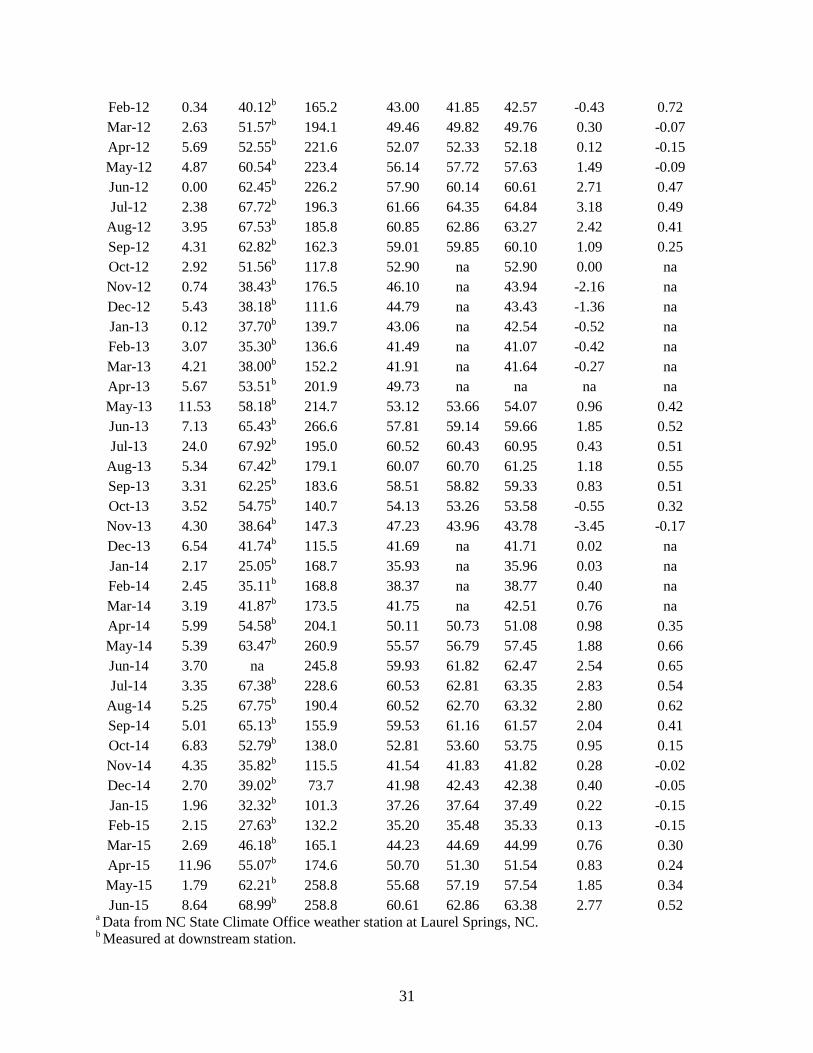
31
Feb-12 0.34 40.12b 165.2 43.00 41.85 42.57 -0.43 0.72 Mar-12 2.63 51.57b 194.1 49.46 49.82 49.76 0.30 -0.07 Apr-12 5.69 52.55b 221.6 52.07 52.33 52.18 0.12 -0.15 May-12 4.87 60.54b 223.4 56.14 57.72 57.63 1.49 -0.09 Jun-12 0.00 62.45b 226.2 57.90 60.14 60.61 2.71 0.47 Jul-12 2.38 67.72b 196.3 61.66 64.35 64.84 3.18 0.49
Aug-12 3.95 67.53b 185.8 60.85 62.86 63.27 2.42 0.41 Sep-12 4.31 62.82b 162.3 59.01 59.85 60.10 1.09 0.25 Oct-12 2.92 51.56b 117.8 52.90 na 52.90 0.00 na Nov-12 0.74 38.43b 176.5 46.10 na 43.94 -2.16 na Dec-12 5.43 38.18b 111.6 44.79 na 43.43 -1.36 na Jan-13 0.12 37.70b 139.7 43.06 na 42.54 -0.52 na Feb-13 3.07 35.30b 136.6 41.49 na 41.07 -0.42 na Mar-13 4.21 38.00b 152.2 41.91 na 41.64 -0.27 na Apr-13 5.67 53.51b 201.9 49.73 na na na na May-13 11.53 58.18b 214.7 53.12 53.66 54.07 0.96 0.42 Jun-13 7.13 65.43b 266.6 57.81 59.14 59.66 1.85 0.52 Jul-13 24.0 67.92b 195.0 60.52 60.43 60.95 0.43 0.51
Aug-13 5.34 67.42b 179.1 60.07 60.70 61.25 1.18 0.55 Sep-13 3.31 62.25b 183.6 58.51 58.82 59.33 0.83 0.51 Oct-13 3.52 54.75b 140.7 54.13 53.26 53.58 -0.55 0.32 Nov-13 4.30 38.64b 147.3 47.23 43.96 43.78 -3.45 -0.17 Dec-13 6.54 41.74b 115.5 41.69 na 41.71 0.02 na Jan-14 2.17 25.05b 168.7 35.93 na 35.96 0.03 na Feb-14 2.45 35.11b 168.8 38.37 na 38.77 0.40 na Mar-14 3.19 41.87b 173.5 41.75 na 42.51 0.76 na Apr-14 5.99 54.58b 204.1 50.11 50.73 51.08 0.98 0.35 May-14 5.39 63.47b 260.9 55.57 56.79 57.45 1.88 0.66 Jun-14 3.70 na 245.8 59.93 61.82 62.47 2.54 0.65 Jul-14 3.35 67.38b 228.6 60.53 62.81 63.35 2.83 0.54
Aug-14 5.25 67.75b 190.4 60.52 62.70 63.32 2.80 0.62 Sep-14 5.01 65.13b 155.9 59.53 61.16 61.57 2.04 0.41 Oct-14 6.83 52.79b 138.0 52.81 53.60 53.75 0.95 0.15 Nov-14 4.35 35.82b 115.5 41.54 41.83 41.82 0.28 -0.02 Dec-14 2.70 39.02b 73.7 41.98 42.43 42.38 0.40 -0.05 Jan-15 1.96 32.32b 101.3 37.26 37.64 37.49 0.22 -0.15 Feb-15 2.15 27.63b 132.2 35.20 35.48 35.33 0.13 -0.15 Mar-15 2.69 46.18b 165.1 44.23 44.69 44.99 0.76 0.30 Apr-15 11.96 55.07b 174.6 50.70 51.30 51.54 0.83 0.24 May-15 1.79 62.21b 258.8 55.68 57.19 57.54 1.85 0.34 Jun-15 8.64 68.99b 258.8 60.61 62.86 63.38 2.77 0.52
a Data from NC State Climate Office weather station at Laurel Springs, NC. b Measured at downstream station.
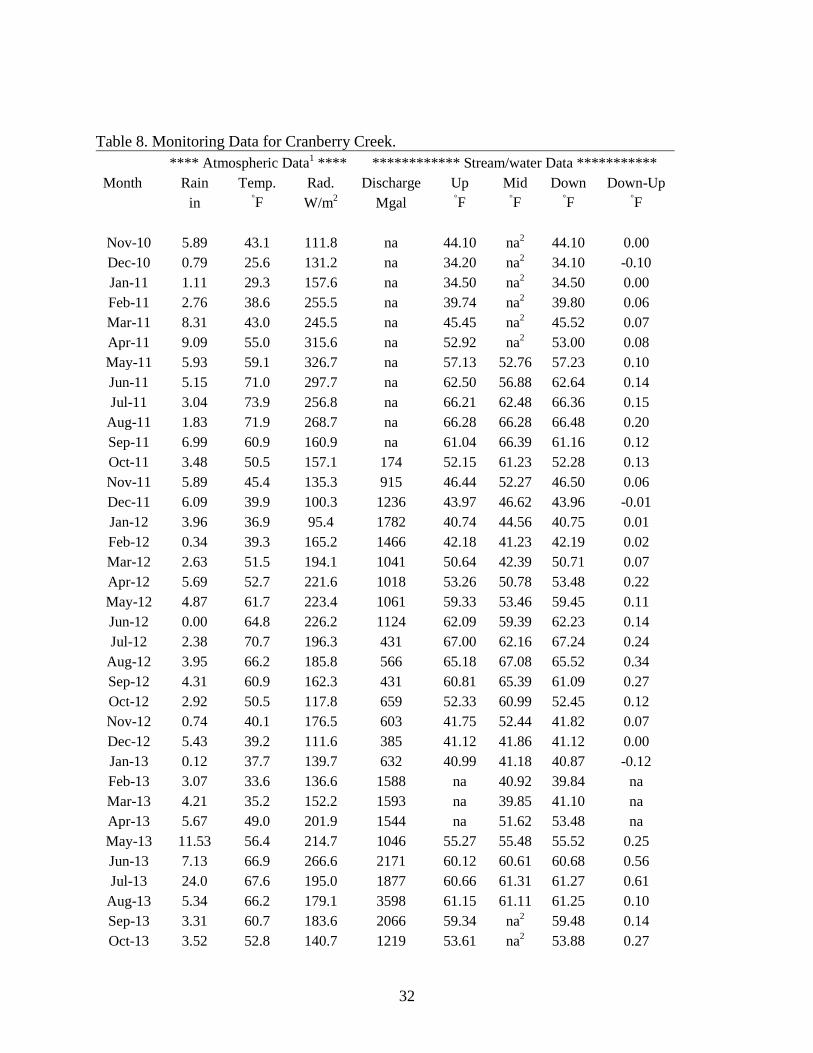
32
Table 8. Monitoring Data for Cranberry Creek. **** Atmospheric Data1 **** ************ Stream/water Data *********** Month Rain Temp. Rad. Discharge Up Mid Down Down-Up in ◦F W/m2 Mgal ◦F ◦F ◦F ◦F
Nov-10 5.89 43.1 111.8 na 44.10 na2 44.10 0.00 Dec-10 0.79 25.6 131.2 na 34.20 na2 34.10 -0.10 Jan-11 1.11 29.3 157.6 na 34.50 na2 34.50 0.00 Feb-11 2.76 38.6 255.5 na 39.74 na2 39.80 0.06 Mar-11 8.31 43.0 245.5 na 45.45 na2 45.52 0.07 Apr-11 9.09 55.0 315.6 na 52.92 na2 53.00 0.08 May-11 5.93 59.1 326.7 na 57.13 52.76 57.23 0.10 Jun-11 5.15 71.0 297.7 na 62.50 56.88 62.64 0.14 Jul-11 3.04 73.9 256.8 na 66.21 62.48 66.36 0.15
Aug-11 1.83 71.9 268.7 na 66.28 66.28 66.48 0.20 Sep-11 6.99 60.9 160.9 na 61.04 66.39 61.16 0.12 Oct-11 3.48 50.5 157.1 174 52.15 61.23 52.28 0.13 Nov-11 5.89 45.4 135.3 915 46.44 52.27 46.50 0.06 Dec-11 6.09 39.9 100.3 1236 43.97 46.62 43.96 -0.01 Jan-12 3.96 36.9 95.4 1782 40.74 44.56 40.75 0.01 Feb-12 0.34 39.3 165.2 1466 42.18 41.23 42.19 0.02 Mar-12 2.63 51.5 194.1 1041 50.64 42.39 50.71 0.07 Apr-12 5.69 52.7 221.6 1018 53.26 50.78 53.48 0.22 May-12 4.87 61.7 223.4 1061 59.33 53.46 59.45 0.11 Jun-12 0.00 64.8 226.2 1124 62.09 59.39 62.23 0.14 Jul-12 2.38 70.7 196.3 431 67.00 62.16 67.24 0.24
Aug-12 3.95 66.2 185.8 566 65.18 67.08 65.52 0.34 Sep-12 4.31 60.9 162.3 431 60.81 65.39 61.09 0.27 Oct-12 2.92 50.5 117.8 659 52.33 60.99 52.45 0.12 Nov-12 0.74 40.1 176.5 603 41.75 52.44 41.82 0.07 Dec-12 5.43 39.2 111.6 385 41.12 41.86 41.12 0.00 Jan-13 0.12 37.7 139.7 632 40.99 41.18 40.87 -0.12 Feb-13 3.07 33.6 136.6 1588 na 40.92 39.84 na Mar-13 4.21 35.2 152.2 1593 na 39.85 41.10 na Apr-13 5.67 49.0 201.9 1544 na 51.62 53.48 na May-13 11.53 56.4 214.7 1046 55.27 55.48 55.52 0.25 Jun-13 7.13 66.9 266.6 2171 60.12 60.61 60.68 0.56 Jul-13 24.0 67.6 195.0 1877 60.66 61.31 61.27 0.61
Aug-13 5.34 66.2 179.1 3598 61.15 61.11 61.25 0.10 Sep-13 3.31 60.7 183.6 2066 59.34 na2 59.48 0.14 Oct-13 3.52 52.8 140.7 1219 53.61 na2 53.88 0.27
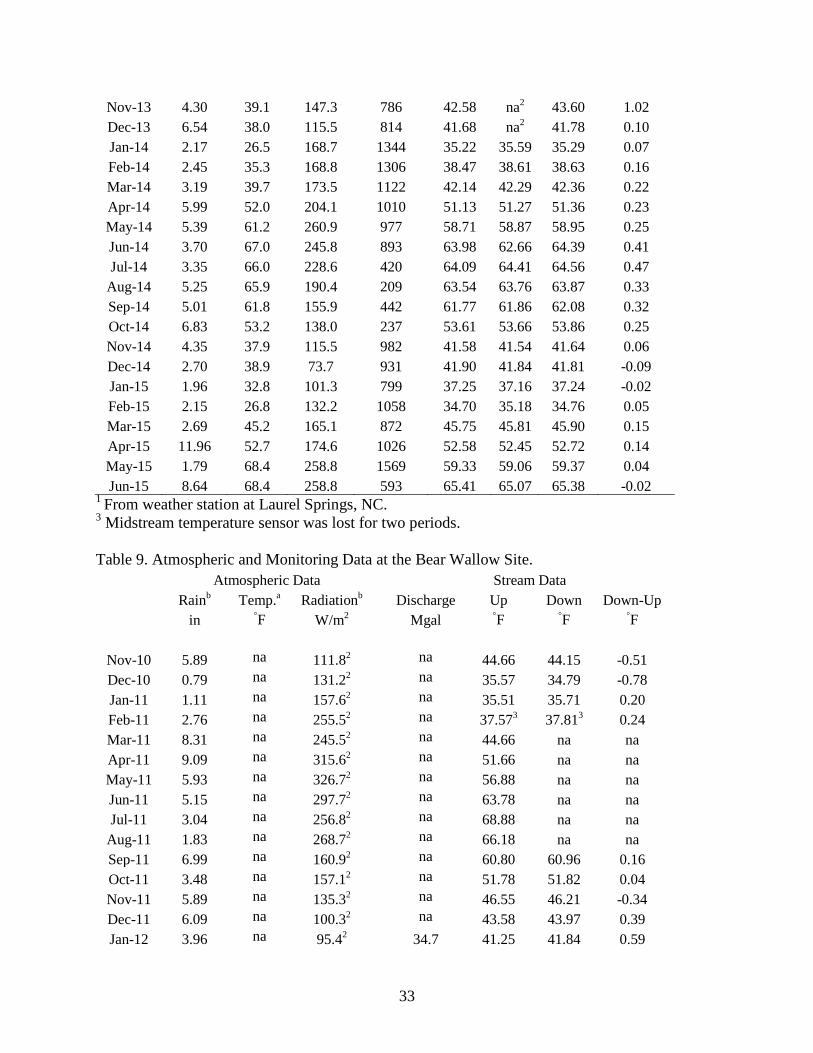
33
Nov-13 4.30 39.1 147.3 786 42.58 na2 43.60 1.02 Dec-13 6.54 38.0 115.5 814 41.68 na2 41.78 0.10 Jan-14 2.17 26.5 168.7 1344 35.22 35.59 35.29 0.07 Feb-14 2.45 35.3 168.8 1306 38.47 38.61 38.63 0.16 Mar-14 3.19 39.7 173.5 1122 42.14 42.29 42.36 0.22 Apr-14 5.99 52.0 204.1 1010 51.13 51.27 51.36 0.23 May-14 5.39 61.2 260.9 977 58.71 58.87 58.95 0.25 Jun-14 3.70 67.0 245.8 893 63.98 62.66 64.39 0.41 Jul-14 3.35 66.0 228.6 420 64.09 64.41 64.56 0.47
Aug-14 5.25 65.9 190.4 209 63.54 63.76 63.87 0.33 Sep-14 5.01 61.8 155.9 442 61.77 61.86 62.08 0.32 Oct-14 6.83 53.2 138.0 237 53.61 53.66 53.86 0.25 Nov-14 4.35 37.9 115.5 982 41.58 41.54 41.64 0.06 Dec-14 2.70 38.9 73.7 931 41.90 41.84 41.81 -0.09 Jan-15 1.96 32.8 101.3 799 37.25 37.16 37.24 -0.02 Feb-15 2.15 26.8 132.2 1058 34.70 35.18 34.76 0.05 Mar-15 2.69 45.2 165.1 872 45.75 45.81 45.90 0.15 Apr-15 11.96 52.7 174.6 1026 52.58 52.45 52.72 0.14 May-15 1.79 68.4 258.8 1569 59.33 59.06 59.37 0.04 Jun-15 8.64 68.4 258.8 593 65.41 65.07 65.38 -0.02
1 From weather station at Laurel Springs, NC. 3 Midstream temperature sensor was lost for two periods. Table 9. Atmospheric and Monitoring Data at the Bear Wallow Site. Atmospheric Data Stream Data
Rainb Temp.a Radiationb
Discharge Up Down Down-Up
in ◦F W/m2
Mgal ◦F ◦F ◦F
Nov-10 5.89 na 111.82
na 44.66 44.15 -0.51
Dec-10 0.79 na 131.22
na 35.57 34.79 -0.78 Jan-11 1.11 na 157.62
na 35.51 35.71 0.20
Feb-11 2.76 na 255.52
na 37.573 37.813 0.24 Mar-11 8.31 na 245.52
na 44.66 na na
Apr-11 9.09 na 315.62
na 51.66 na na May-11 5.93 na 326.72
na 56.88 na na
Jun-11 5.15 na 297.72 na 63.78 na na Jul-11 3.04 na 256.82 na 68.88 na na
Aug-11 1.83 na 268.72 na 66.18 na na Sep-11 6.99 na 160.92 na 60.80 60.96 0.16 Oct-11 3.48 na 157.12 na 51.78 51.82 0.04 Nov-11 5.89 na 135.32 na 46.55 46.21 -0.34 Dec-11 6.09 na 100.32 na 43.58 43.97 0.39 Jan-12 3.96 na 95.42 34.7 41.25 41.84 0.59

34
Feb-12 0.34 na 165.22 20.9 41.94 42.29 0.35 Mar-12 2.63 na 194.12 29.2 49.38 49.55 0.17 Apr-12 5.69 na 221.62 28.8 51.93 51.87 -0.07 May-12 4.87 na 223.42 15.0 58.27 58.32 0.04 Jun-12 0.00 na 226.22 6.2 61.50 60.93 -0.57 Jul-12 2.38 na 196.32 10.01 66.48 66.46 -0.02
Aug-12 3.95 na 185.82 10.92 64.05 64.10 0.04 Sep-12 4.31 na 162.32 16.27 60.12 60.24 0.11 Oct-12 2.92 48.83 117.82 16.65 51.47 51.83 0.36 Nov-12 0.74 38.18 176.52 20.49 42.43 42.64 0.20 Dec-12 5.43 37.53 111.62 25.26 41.75 41.93 0.18 Jan-13 0.12 36.52 139.72 132.7 41.13 41.76 0.63 Feb-13 3.07 33.12 136.62 51.83 38.83 39.67 0.84 Mar-13 4.21 34.38 152.22 51.93 39.82 40.76 0.95 Apr-13 5.67 48.48 201.9 na 49.01 na na May-13 11.53 54.38 214.7 na 53.53 na na Jun-13 7.13 62.28 266.6 na 59.72 na na Jul-13 24.0 64.07 195.0 na 61.17 na na
Aug-13 5.34 63.01 179.1 na 61.33 na na Sep-13 3.31 59.00 183.6 na 59.27 60.22 0.96 Oct-13 3.52 51.62 140.7 na 53.31 53.42 0.12 Nov-13 4.30 38.28 147.3 na 43.19 42.50 -0.70 Dec-13 6.54 36.15 115.5 24.18 41.73 41.68 -0.05 Jan-14 2.17 36.52 168.7 39.76 36.13 35.87 -0.26 Feb-14 2.45 33.12 168.8 13.04 38.04 38.38 0.34 Mar-14 3.19 39.82 173.5 14.52 41.37 41.68 0.30 Apr-14 5.99 48.48 204.1 13.65 49.61 49.87 0.26 May-14 5.39 49.78 260.9 11.26 56.70 57.10 0.40 Jun-14 3.70 64.33 245.8 6.59 62.62 63.61 0.99 Jul-14 3.35 63.66 228.6 6.39 63.15 63.95 0.79
Aug-14 5.25 63.24 190.4 7.62 62.97 63.53 0.55 Sep-14 5.01 61.24 155.9 6.91 61.18 61.87 0.69 Oct-14 6.83 51.61 138.0 11.55 53.56 53.55 -0.01 Nov-14 4.35 36.61 115.5 na 42.26 41.75 -0.51 Dec-14 2.70 38.22 73.7 na 42.30 na na Jan-15 1.96 31.61 101.3 na 37.35 na na Feb-15 2.15 26.62 132.2 na 35.36 na na Mar-15 2.69 42.65 165.1 na 44.21 na na Apr-15 11.96 50.32 174.6 na 50.57 na na May-15 1.79 58.37 258.8 na 57.34 na na Jun-15 8.64 65.02 258.8 na 63.57 64.54 0.96
a Daily mean air temperature measured at the downstream station. b From weather station at Laurel Springs, NC.
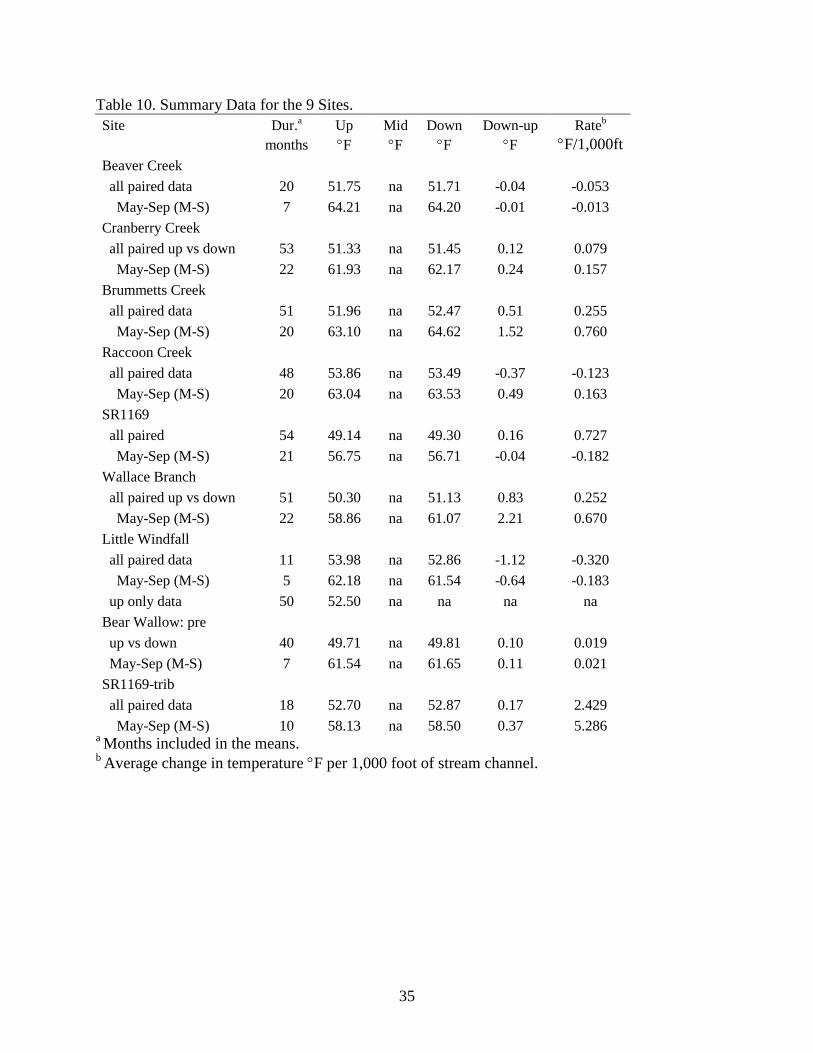
35
Table 10. Summary Data for the 9 Sites. Site Dur.a Up Mid Down Down-up Rateb
months °F °F °F °F °F/1,000ft
Beaver Creek all paired data 20 51.75 na 51.71 -0.04 -0.053 May-Sep (M-S) 7 64.21 na 64.20 -0.01 -0.013 Cranberry Creek all paired up vs down 53 51.33 na 51.45 0.12 0.079 May-Sep (M-S) 22 61.93 na 62.17 0.24 0.157 Brummetts Creek all paired data 51 51.96 na 52.47 0.51 0.255 May-Sep (M-S) 20 63.10 na 64.62 1.52 0.760 Raccoon Creek all paired data 48 53.86 na 53.49 -0.37 -0.123 May-Sep (M-S) 20 63.04 na 63.53 0.49 0.163 SR1169 all paired 54 49.14 na 49.30 0.16 0.727 May-Sep (M-S) 21 56.75 na 56.71 -0.04 -0.182 Wallace Branch all paired up vs down 51 50.30 na 51.13 0.83 0.252 May-Sep (M-S) 22 58.86 na 61.07 2.21 0.670 Little Windfall all paired data 11 53.98 na 52.86 -1.12 -0.320 May-Sep (M-S) 5 62.18 na 61.54 -0.64 -0.183 up only data 50 52.50 na na na na Bear Wallow: pre up vs down 40 49.71 na 49.81 0.10 0.019 May-Sep (M-S) 7 61.54 na 61.65 0.11 0.021 SR1169-trib all paired data 18 52.70 na 52.87 0.17 2.429 May-Sep (M-S) 10 58.13 na 58.50 0.37 5.286
a Months included in the means. b Average change in temperature °F per 1,000 foot of stream channel.
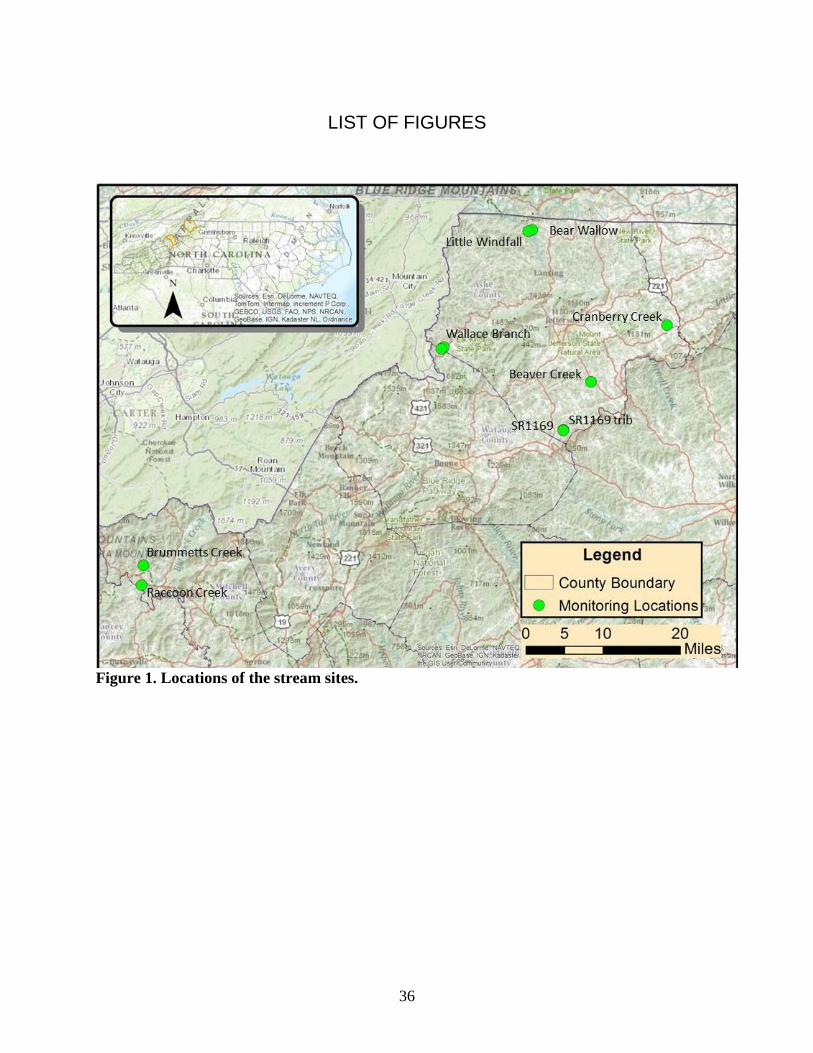
36
LIST OF FIGURES
Figure 1. Locations of the stream sites.

37
Figure 2. Beaver Creek (left) and boxplot of temperature data (right).
Figure 3. Little Windfall Branch (left) and Raccoon Creek (right).

38
Figure 4. Monitored stream reach for SR1169-trib.
Figure 5. Monitored reach for SR1169 site (left) and boxplot of data (right).

39
Figure 6. Brummett’s Creek tree clearing (left) and boxplot of data (right).
Figure 7. Wallace Branch near upstream station (left) and mid station in 2011 (right).
Figure 8. Wallace Branch at downstream station (left) and boxplot of data (right).
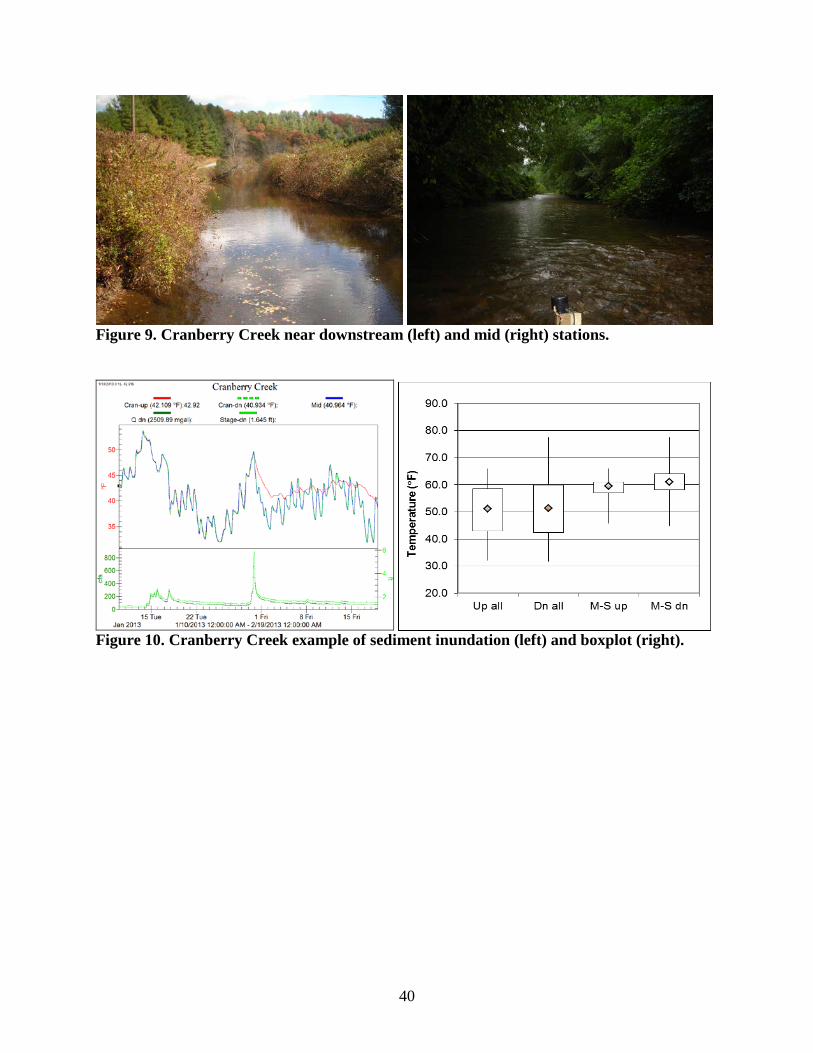
40
Figure 9. Cranberry Creek near downstream (left) and mid (right) stations.
Figure 10. Cranberry Creek example of sediment inundation (left) and boxplot (right).

41
Figure 11. Bear Wallow stream near middle of reach (left) and at downstream station (right).
Figure 12. Bear Wallow road at the downstream station on 12/9/14 (left) and boxplot of data (right).