FINAL REPORT As Required by THE ENDANGERED SPECIES PROGRAM TEXAS
24
FINAL REPORT As Required by THE ENDANGERED SPECIES PROGRAM TEXAS Grant No. E – 68-R Endangered and Threatened Species Conservation MARK-RECAPTURE STUDY OF Eurycea rathbuni AT THREE SITES IN SAN MARCOS, TEXAS Prepared by: Jean Krejca Robert Cook Executive Director Matt Wagner Mike Berger Program Director, Wildlife Diversity Division Director, Wildlife 2 April 2007
Transcript of FINAL REPORT As Required by THE ENDANGERED SPECIES PROGRAM TEXAS

FINAL REPORT
As Required by
THE ENDANGERED SPECIES PROGRAM
TEXAS
Grant No. E – 68-R
Endangered and Threatened Species Conservation
MARK-RECAPTURE STUDY OF Eurycea rathbuni AT THREE SITES IN SAN MARCOS, TEXAS
Prepared by:
Jean Krejca
Robert Cook Executive Director
Matt Wagner Mike Berger Program Director, Wildlife Diversity Division Director, Wildlife
2 April 2007

FINAL REPORT
STATE: ____Texas_______________ GRANT NUMBER: ___E – 68-R___________
PROJECT TITLE: Mark-Recapture Study of Eurycea Rathbuni at Three Sites in San Marcos, Texas
REPORTING PERIOD: ____8/01/05 to 9/30/06__ OBJECTIVE(S): The goal of this study will be to acquire estimates of population size, birth-death rates, and individual migration of Eurycea rathbuni at three sites in San Marcos, Texas over a one year period. Significant Deviation: None. Summary Of Progress: Please see Attachment A (.pdf document) Location: Hays County, Texas Cost: __________________________________________________________________ Prepared by: _Craig Farquhar_____________ Date: 2 April 2007 Approved by: ______________________________ Date:_______________________ Neil (Nick) E. Carter

118 W. Goforth Road Buda, Texas 78610
512-294-8636 www.zaraenvironmental.com
MARK-RECAPTURE STUDY OF Eurycea rathbuni AT TWO SITES IN SAN MARCOS, TEXAS
Prepared for:
Texas Parks and Wildlife Department 3000 S IH-35, Ste. 100 Austin, Texas 78704
Prepared by:
Jean K. Krejca, Ph.D. and Andrew G. Gluesenkamp, Ph.D.
31 March 2007

Contact information for principal investigators: Jean K. Krejca, Ph.D. Zara Environmental LLC 118 W. Goforth Rd. Buda, TX, 78610 512-294-8636 [email protected] Andrew G. Gluesenkamp, Ph.D. 700 Billie Brooks Drive Driftwood, TX, 78619 512-799-1095 [email protected]
2
Abstract A year of bi-monthly mark recapture events at Ezell’s Cave in Hays County, Texas, yielded a population estimate of 19 Eurycea rathbuni individuals, with a range of 10 to 93 individuals at the 95% confidence interval. Mark recapture was performed at a second site, Rattlesnake Cave, but no individuals were recaptured. Salamander densities at these sites were 0.0026 per m2 and 2.08 per m2, respectively. The lower density estimate for Ezell’s Cave may be due to logistic differences in SCUBA versus surface surveys, historic over collecting, and lower nutrient input at that site relative to Rattlesnake Cave. Total length of individuals captured averaged 67.73 mm. An individual with a total length of 16 mm encountered in December indicated a recent hatching event. Invertebrate diversity and abundance were much higher at Ezell’s Cave, with six taxonomic orders recorded versus two at Rattlesnake Cave. Water levels during the entire study were low, and water temperatures were normal and comparable between the two sites. Introduction The Texas Blind Salamander, Eurycea rathbuni, is known from eight sites in San Marcos, Texas (Figure 1). One of the sites, Ezell’s Cave, has changed ownership many times in the past, and lack of management has lead to salamander decline. Population declines since the 1940’s have been attributed to over collecting, heavy visitor traffic, and extirpation of the resident Myotis velifer population between 1962 and 1967 (Davis 1971, Elliott and Veni 1994, Russell 1976). Another site, Rattlesnake Cave, has had less attention but also suffered from illegal collecting of salamanders (Figure 2). At this time, there are no records of salamander or invertebrate densities or any other in situ biological studies. Nothing is known about individual movement among or within populations, though some molecular analysis has been performed (Chippendale et al. 2000). Hydrogeologic studies suggest that there are significant groundwater connections among most known sites (Ogden et al. 1986, Russell 1976). This report provides information on two salamander populations including estimates of population size for Ezell’s Cave. Mark-recapture data can provide important information on population size, birth-death, and individual migration rate. In combination with molecular genetics studies these data may provide a comprehensive understanding of demographics and genetics, including accurate estimates of the relationship between census numbers and demography (Trenham el al. 2000). The groundwork laid by this study serves as a baseline for future mark-recaptures studies of this species in addition to providing a dataset that is independent and complimentary to molecular genetics studies. Methods Mark and recapture of Eurycea rathbuni salamanders was performed at two caves in San Marcos, Hays County, Texas: Ezell’s Cave and Rattlesnake Cave. Salamander populations were sampled 10 and 13 times, respectively, at bi-monthly intervals, between February 2006 and February 2007. Multiple attempts were made to gain permission to sample a third population, Primer’s Well, but the property manager refused to grant access.
3

Sampling at Ezell’s Cave was conducted by SCUBA transect surveys of the entire main pool to a depth of 12 m. The use of cave SCUBA techniques (Prosser and Grey, 1992) provided access to a much larger area than would be available simply by snorkeling or open water diving (Figure 3). Sampling at Rattlesnake Cave consisted of sampling the pool at the bottom of the entrance slope using dip nets and a telescoping pole net designed specifically for this site. Despite the fact that the pool has a small surface area and offers only a limited view into the top of the Edwards Aquifer, several individual salamanders were often present (Figure 4). This is in striking contrast to observations at Ezell’s Cave where, despite the pool’s much larger surface area, salamanders were rarely observed from shore. During surveys, numbers of individual salamanders and invertebrates encountered were recorded. Salamanders were collected using dip nets. Caving clothing and equipment were cleaned between visits and site-dedicated nets and capture equipment were used to avoid contamination among sites. In Ezell’s Cave, captured salamanders were transported in plastic centrifuge tubes with perforated lids to avoid decompression issues. Measurements and photographs were taken at the water surface. In Rattlesnake Cave, individuals were transported to the surface immediately outside of the cave in large plastic bags to minimize trauma during handling. Individual salamanders were marked with unique color codes using biocompatible fluorescent elastomers. Marks were made by placing salamanders in sterile Whirl-Pak® bags with a small amount of water, gently pressing their dorsal side against the edge of the bag, and using a sterile 28 gauge insulin needle to inject elastomer through the plastic bag and underneath the skin (Figure 5). Marked individuals were held for 5 – 10 minutes to insure they were behaving normally before being released. Marks were made at 1 – 4 locations on the body, including the right and left side, dorsal to insertion of forelimb, and the right and left side, dorsal to insertion of hindlimb. Marks were “read” left-to-right and anterior-to-posterior. No mark at a given position was indicated with the letter “n” and mark color, yellow, red, orange and green, was indicated with the letters “Y”, “R”, “O” or “G” respectively. During each sampling event, the following data were recorded: search time, total number of individuals observed, number of recaptures, description of new marks, location of the individual in the cave (with water depth), total length, presence of other fauna, turbidity and water temperature. For mark-recapture analysis, population was treated as closed because of the short duration of the study with respect to the life history of the species (long-lived, low reproductive rate). The Schnabel (1938) method was chosen as a simple estimate of population size, using the following formulas: Population estimation formula: Ň = ∑ CtMt / ∑ Rt Variance estimation formula: V(1/ Ň) = ∑ Rt / (∑CtMt)2
95% confidence interval formula: (1/ Ň) ±1.96 √ V(1/ Ň)
4
Results Successful recapture of healthy individuals demonstrates that the M-RC method chosen is appropriate for this species. Marks were clearly evident in recaptured individuals and no adverse effects of marking or recapture on individual health were detected (Figure 6). Estimated population size for Ezell’s Cave using the dataset in Table 1 was 18.5, with a 95% confidence interval ranging from 10.28 to 92.58. In terms of whole numbers, we estimate a population size in the main pool of 19 individuals, with a range of 10 to 93 individuals. The average number of individuals observed per visit was 2.10 and the average number of salamanders observed per minute of search effort was 0.05 (minutes of search effort given in Table 2). The search area, estimated from the cave map, was approximately 800 m2, thus the salamander density averaged 0.0026 salamanders per m2. Calculation of estimated population size for Rattlesnake Cave was not possible due to the lack of recaptures (Table 1). The average number of individuals observed per visit was 2.08 and the average number of salamanders observed per minute of search effort was 0.13 (minutes of search effort given in Table 2). The search area was approximately 1 m2, thus the salamander density averaged 2.08 salamanders per m2. Salamanders were difficult to catch because of the small surface area of the pool and awkward access to it (typically requiring the searcher to perform a “head stand” over a narrow water-filled crevice). In the future at this site we recommend using traps and checking them daily to ensure a higher capture rate. Table 3 shows the marking pattern and size (TL) of each individual captured. All but one individual captured were marked. The single unmarked individual was too small, with a total length (TL) of only 16 mm (Figure 7). In the captive population at the Federal Fish Hatchery in San Marcos, individuals of this size had hatched approximately 50 days prior (Joe Fries, pers. comm.). Most likely the wild population would experience slower growth rates, but this gives an estimation of mid October for a possible hatching event. The size distribution of fifteen measured individuals is given in Figure 8. Average TL was 67.73 mm. At Ezell’s Cave, salamanders were found scattered at various depths throughout the search area (Figure 3). All individuals captured were encountered motionless on sediment, rock, or wood substrates. Most loose rock and wood in the cave is covered with a light dusting of sediment. Therefore, strictly speaking, all individuals were found on nearly horizontal sediment-covered surfaces. In a few cases, this included wall ledges that were not on the floor of the passage but were horizontal or nearly so. One individual was found under a large breakdown block. During one survey event, an attempt was made to turn rocks in search of salamanders, but this greatly increased turbidity and no salamanders were found. The ubiquitous covering of fine sediment that covered nearly all surfaces in the pool tended to reduce visibility and make the entire searching process less effective. On a few occasions, a salamander was observed but escaped by swimming into a silt cloud when the searcher approached and attempted to capture. Most of the area searched had a chalky ceiling that caused percolation when the diver’s bubbles hit the ceiling, causing low visibility in the surrounding area. In Rattlesnake Cave, salamanders were typically observed just below the surface of the pool. Most salamanders observed evaded capture by swimming out of sight or to
5
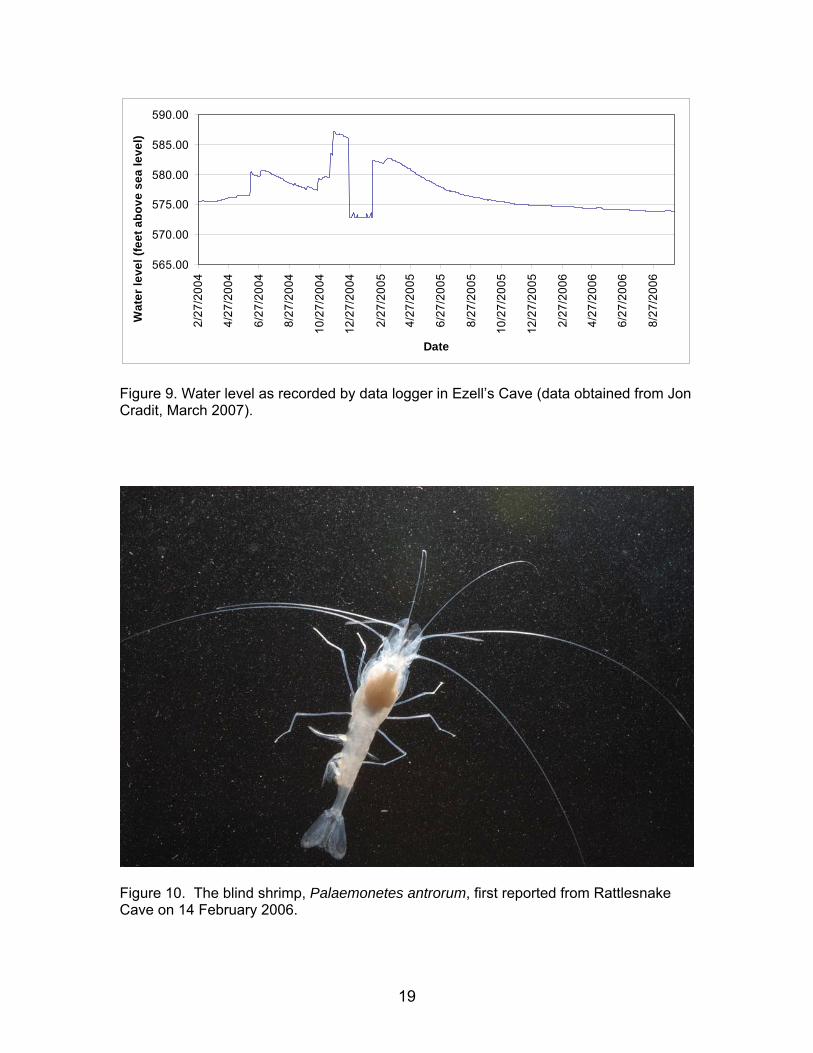
deeper areas beyond what could be reached from the surface. During a SCUBA dive in Rattlesnake Cave, salamanders were seen throughout the submerged passage but no attempt was made to inspect them for marks because of the very short window of time available before visibility was lost due to percolation problems. Invertebrate counts were made in both caves, and those data along with the search effort, water level and water temperatures are given in Table 2. Figure 9 shows a recent data logger history of water levels adjusted for height above mean sea level for Rattlesnake Cave (data from Jon Cradit, March 2007). The data logger was not functioning after 8 October 2006, but there were no significant rains for the remainder of the sampling period. Overall water levels were very low at both sites. Turbidity was low during all sampling events, except for 31 January 2007 at Rattlesnake Cave, which had high turbidity. We observed the blind shrimp Palaemonetes antrorum in Rattlesnake Cave, representing a new locality record for this species (Figure 10). All invertebrates were identified in the field and, while some specimens were collected for further study, these identifications should be considered as tentative field observations. In addition to aquatic sampling, some terrestrial invertebrates were collected during the course of this study. Ezell’s Cave is the type locality for Texoreddellia texensis, and some specimens were collected to assist with an ongoing genetic study. Also, an undescribed species of Rhadine beetle collected in Ezell’s Cave represents a new locality record for the species (Figure 11). Discussion The population estimate, density, and observations of salamanders per search effort for Ezell’s Cave was low. These data match qualitative observations reported by other authors (Davis 1971, Elliott and Veni 1994, Russell 1976). The dataset in this study, however, is also small and should be interpreted carefully. First, only 12 individuals were marked and there were only four recapture events, producing a wide margin of error in the population estimate. More data points would greatly enhance the population estimate. Second, a very simple closed population estimation model was used. A longer study would have the benefit of more observations that would help support an open model with allowances for immigration, birth-death, survival rates, etc. Considering that dye injected in Ezell’s Cave has traveled to another known salamander locality, San Marcos Springs, in three days or less, these two populations probably have opportunities for migration and it may be more appropriate to consider the populations as open. At Rattlesnake Cave, density and observations of salamanders per search effort was high. The numbers of individuals recorded match qualitative observations reported by Russell (1976). Recaptures, and therefore population estimation, at this site in the future would be possible with the use of traps that are checked every 24 hours. The contrast between salamander densities at these sites is possibly attributable to differences in nutrient concentration. In Ezell’s Cave, the pool is far from the entrance in a location that infrequently receives energy directly from the surface in the form of leaf litter, scat from trogloxenes (cave crickets, bats), or accidentals. The area appears sterile, with bare breakdown blocks covered with very fine, high clay content sediment (Figure 12). Nutrients may arrive sparsely only during periods of high groundwater flow. At Rattlesnake Cave, the pool is immediately down slope of the entrance sinkhole, where leaf litter and nutrient rich soil continually slide into the water (Figure 13). A
6

population of cave crickets (Ceuthophilus secretus) resides on the ceiling not far from the pool, and they are known to be significant contributors of nutrients to cave ecosystems. Russell (1976) noted catfish in the pool, indicating that accidentals may end up in the pool and die (but possibly only after preying on resident salamanders). Salamander population decline in Ezell’s Cave has not actually been quantified, but it is quite plausible that the extensive collecting reported by multiple authors would have a lasting effect on this slowly reproducing species. Once this trend is corrected, however, the expectation is that the population would recover. However the over collecting occurred in the 1940’s through 1960’s, and then the bat colony was extirpated in 1962. This latter impact probably represents a much more severe long-term problem for the population. At least one other example in Texas includes the extirpation of a bat colony (and alteration of flood regime) in Valdina Farms Sinkhole and the subsequent extirpation of that salamander population. As a final note, in addition to the baseline data gathered herein, this study helped draw attention to Rattlesnake Cave and provide extremely important protection for it through installation of a cave gate. Acknowledgements Field assistance was provided by Joe Furman, Randy Gibson (USFWS), Paige Najavar (USFWS), Nathan Parker and Patrick Rhoades. Site access was made possible by the generous help from Jon Cradit (EAA) and Mike Forstner (TSU). Jon Cradit also provided water level data for Ezell's Cave for this report. Funding was provided by Texas Parks and Wildlife through the Endangered Species Act Section 6 grant program of the U.S. Fish and Wildlife Service. In particular, Craig Farquhar (TPWD) did an outstanding job taking care of the administration of these funds. Literature Cited Chippindale, P. T., A. H. Price, J. J. Wiens, and D. M. Hillis. 2000. Phylogenetic relationships of central Texas hemidactyliine plethodontid salamanders, genus Eurycea, and a taxonomic revision of the group. Herpetological Monographs 14:1-80. Davis, W. K. 1971. Ezell’s Cave: 1870-1970. Pages 94-99 in Natural History of Texas Caves, Lundelius, E. L. and B. H. Slaughter, eds. Gulf Natural History, Dallas, Texas. 174 pp. Elliott, W. R. and G. Veni, 1994. The Caves and Karst of Texas: a Guidebook for the 1994 Convention of the National Speleological Society with Emphasis on the Southwestern Edwards Plateau. 324 pages. National Speleological Society, 2813 Cave Avenue, Huntsville, Alabama 35810-4431. Ogden, A. E., Quick, R. A., Rothermel 1986. Hydrochemistry of the Comal, Hueco, and San Marcos Springs, Edwards Aquifer, Texas. In The Balcones Escarpment, Abbott, Patrick L, and Woodruff, C.M., eds. San Antonio: Geological Society of America, pp. 51-54.
7

Russell, W. H., 1976 Distribution of troglobitic salamanders in the San Marcos Area, Hays County, Texas. BITE Report 7601. Texas Association for Biological Investigations of Troglobitic Eurycea. P.O. Box 7672, Austin, Texas 78712. Schnabel, Z.E. 1938. The estimation of a total fish population in a lake. American Mathmatical Monthly 45: 342-358. Trenham, P. C., H. B. Shaffer, and W. D. Koenig, and M. R. Stromberg. 2000. Life history and demographic variation in the California tiger salamander (Ambystoma californiense). Copeia 2000: 365-377.
8

Table 1. Raw recapture data for two populations of Eurycea rathbuni. Date (t) Total number
observed (C) Recaptures (R)
Newly marked
Total number marked (M)
Ezell’s Cave 13-Feb-06 1 0 1 0 14-Feb-06 2 0 2 1 31-May-06 2 2 0 3
1-Jun-06 3 1 2 3 28-Sep-06 2 0 1 5 29-Sep-06 0 0 0 6 16-Dec-06 5 1 3 6 17-Dec-06 2 2 0 9 13-Feb-07 0 0 0 9 14-Feb-07 4 0 3 9
End of study 12
Rattlesnake Cave
13-Feb-06 4 0 0 0 14-Feb-06 2 0 1 0 15-Feb-06 1 0 0 1 30-May-06 3 0 0 1 31-May-06 2 0 0 1
1-Jun-06 2 0 2 1 28-Sep-06 4 0 1 3 29-Sep-06 2 0 0 4 16-Dec-06 2 0 0 4 17-Dec-06 3 0 0 4 31-Jan-07 0 0 0 4 13-Feb-07 1 0 0 4 14-Feb-07 1 0 0 4
End of study 4
9

Table 2. Invertebrate fauna observed during salamander searching, water depth on gauge, water temperature, and total minutes of search effort for all fauna during all visits.
Pal
aem
onet
es
antro
rum
Am
phip
oda
Ciro
lani
des
texe
nsis
Sph
allo
plan
a m
ohri
Aqu
atic
ol
igoc
haet
e
Mon
odel
la
texa
na
Dep
th g
auge
re
adin
g
Wat
er
tem
pera
ture
Min
utes
of
sear
ch e
ffort
Ezell’s Cave 13-Feb-06 2 10 15 0 2 0 2.94 22.1 70 14-Feb-06 NR NR NR NR NR NR NR NR NR 31-May-06 1 7 4 6 0 2 2.45 21.9 65
1-Jun-06 NR NR NR NR NR NR NR 21.4 51 28-Sep-06 4 3 3 1 2 1 NR NR 28 29-Sep-06 6 4 9 9 2 1 2.14 21.1 31 16-Dec-06 0 7 11 2 1 0 2.12 21.7 38 17-Dec-06 1 6 14 3 3 2 2.12 21.7 42 13-Feb-07 0 5 0 4 7 2 NR 22 44 14-Feb-07 1 9 18 3 4 1 4.28 22 52
Semi total and averages 15 51 74 28 21 9 2.68 21.74 46.78
Rattlesnake
Cave
13-Feb-06 0 0 0 0 0 0 3.12 20.8 14 14-Feb-06 2 0 0 0 0 0 NR 21.1 28 15-Feb-06 0 0 0 0 0 0 NR NR NR 30-May-06 0 0 0 0 0 0 NR 21.7 25 31-May-06 0 0 0 0 0 0 NR 21.9 10
1-Jun-06 0 0 0 0 0 0 NR 21.7 17 28-Sep-06 0 0 0 0 0 0 NR 21.7 20 29-Sep-06 0 0 0 0 0 0 NR 21.7 15 16-Dec-06 0 0 0 0 0 0 NR 21.7 32 17-Dec-06 0 0 0 0 0 0 NR 21.7 11 31-Jan-07 0 0 0 0 0 0 4.92 NR 12 13-Feb-07 0 0 0 0 0 0 4.62 21 20 14-Feb-07 0 1 0 0 0 0 4.6 22 12
Semi total and averages 2 1 4.32 21.54 16.61
Grand Total and averages 17 52 74 28 21 9 NA 21.64 31.70
10

Table 3. Information on all captured individuals. ND = not determined; TL = total length; juv = juvenile. One individual was not marked (indicated by “not” in the mark column) because it was too small. An asterisk after the total length indicates the measurement was interpreted from a photo in a graduated cylinder that was later measured, so the accuracy may be less than other measurements. Mark Date
marked Date of first recapture
Dates of subsequent recaptures
Sex Lifestage TL (mm) at time of mark
Ezell’s Cave Ynnn 13-Feb-06 ND juv 49*
nnYY 14-Feb-06 31-May-061 Jun 06; 16 Dec 06; 17 Dec 06 ND adult 89*
nnnY 14-Feb-06 31-May-06 ND adult 83* nnRn 1-Jun-06 male adult 71 nnnR 1-Jun-06 female adult 66 nOnn 28-Sep-06 ND adult ND nnnO 16-Dec-06 ND juv 50 nnOn 16-Dec-06 17-Dec-06 ND juv 47 nnOO 16-Dec-06 female adult 82 Not 16-Dec-06 ND juv 16 nGnG 14-Feb-07 ND adult 76 GnGn 14-Feb-07 ND ND 41 nGGG 14-Feb-07 ND adult 76 Rattlesnake Cave nYnn 14-Feb-06 ND ND 81* Rnnn 1-Jun-06 ND ND 81 nRnn 1-Jun-06 female adult 109 Onnn 28-Sep-06 male? juv ND
11

Figure 1. Distribution of Eurycea rathbuni. Localities sampled are indicated by red circles (Rattlesnake Cave and Ezell’s Cave). Wells and springs are indicated by green squares (San Marcos Springs, Artesian Well, Federal Fish Hatchery Well, and Primer’s Well). Defunct localities are indicated by blue stars (Wonder Cave, Johnson’s Well).
12
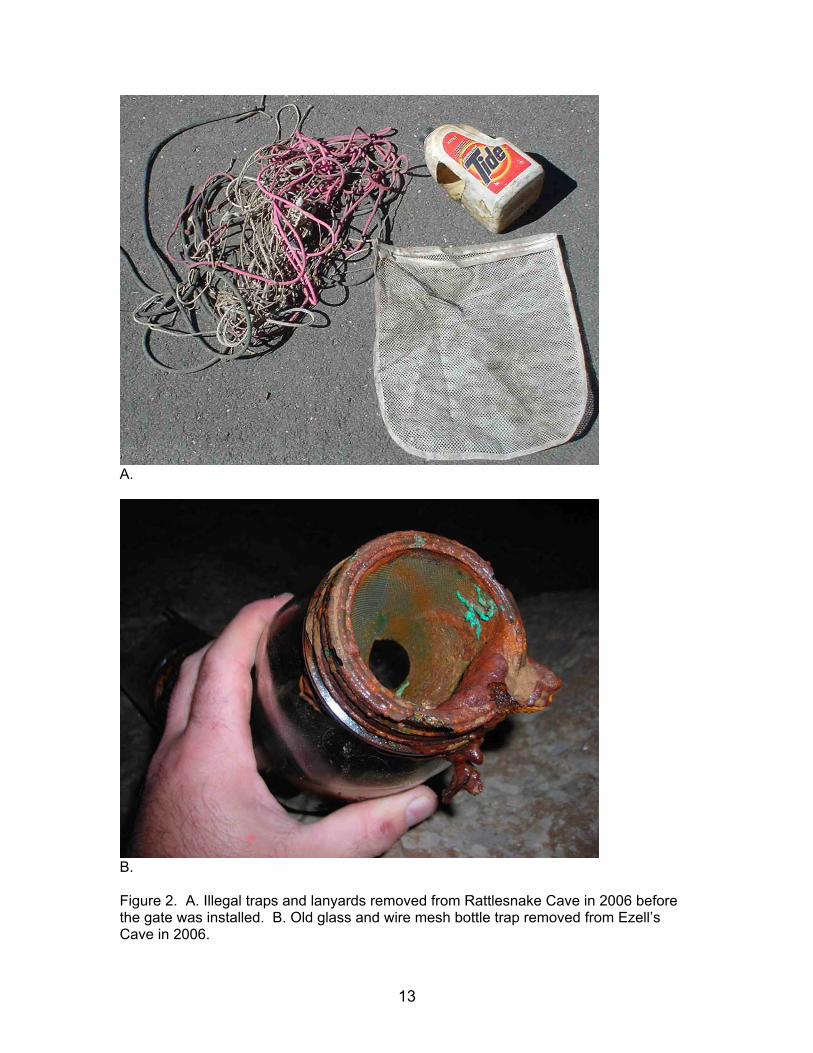
A.
B. Figure 2. A. Illegal traps and lanyards removed from Rattlesnake Cave in 2006 before the gate was installed. B. Old glass and wire mesh bottle trap removed from Ezell’s Cave in 2006.
13

14

Figure 3 (previous page). Map of Ezell’s Cave. Blue indicates areas that were searched for salamanders, red dots indicate salamander locations. A = 13 Feb 2006; B = 31 May 2006; C = 1 June 2006; D = 28 Sep 2006; F = 16 Dec 2006; G = 17 Dec 2006; H = 14 Feb 2007.
Figure 4. Map of Rattlesnake Cave.
15

Figure 5. Marking technique.
16
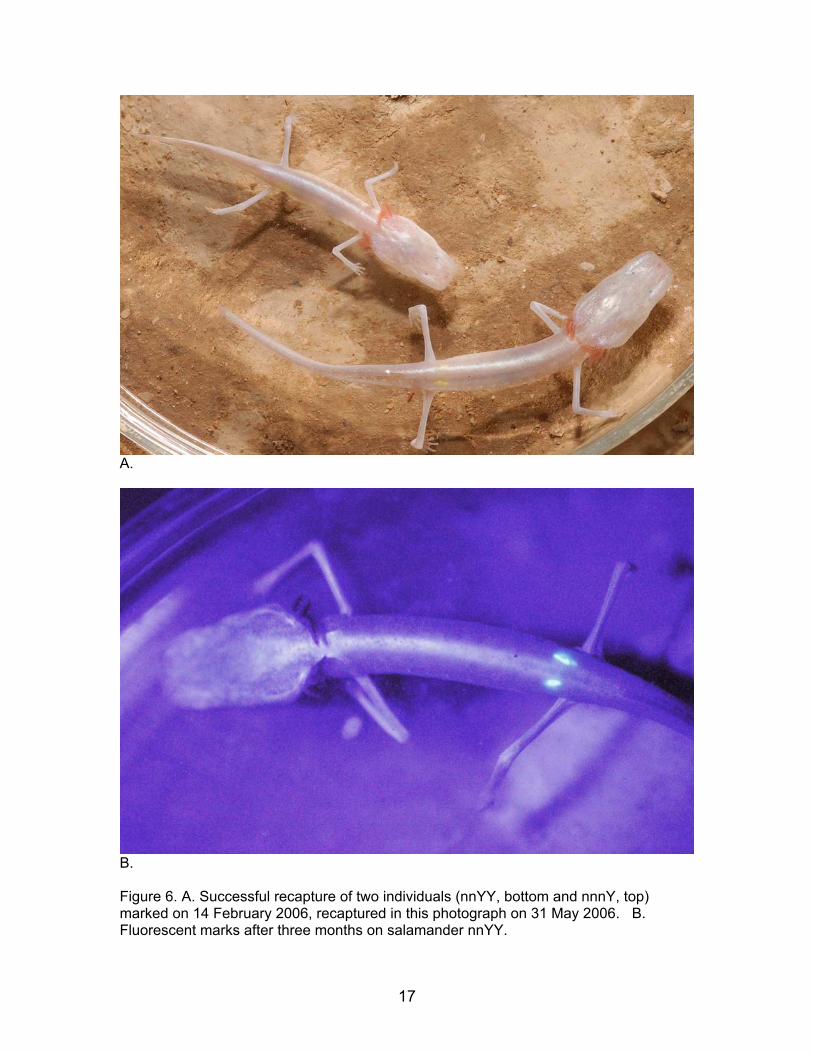
A.
B. Figure 6. A. Successful recapture of two individuals (nnYY, bottom and nnnY, top) marked on 14 February 2006, recaptured in this photograph on 31 May 2006. B. Fluorescent marks after three months on salamander nnYY.
17

Figure 7. At Ezell’s Cave a 16 mm TL individual was captured, suggesting hatching may have occurred in October 2006.
0
20
40
60
80
100
120
1 2 3 4 5 6 7 8 9 10 11 12 13 14 15
Individual Salamanders
Tota
l Len
gth
(mm
)
Figure 8. Distribution of total length for the fifteen salamanders that were captured and measured. The average size was 67.73 mm.
18
565.00
570.00
575.00
580.00
585.00
590.00
2/27
/200
4
4/27
/200
4
6/27
/200
4
8/27
/200
4
10/2
7/20
04
12/2
7/20
04
2/27
/200
5
4/27
/200
5
6/27
/200
5
8/27
/200
5
10/2
7/20
05
12/2
7/20
05
2/27
/200
6
4/27
/200
6
6/27
/200
6
8/27
/200
6
Date
Wat
er le
vel (
feet
abo
ve s
ea le
vel)
Figure 9. Water level as recorded by data logger in Ezell’s Cave (data obtained from Jon Cradit, March 2007).
Figure 10. The blind shrimp, Palaemonetes antrorum, first reported from Rattlesnake Cave on 14 February 2006.
19

A.
B. Figure 11. Two terrestrial invertebrates from Ezell’s Cave, a. an undescribed species of Rhadine beetle (new record) and b. Texoreddellia texensis (type locality).
20

Figure 12. Pool area of Ezell’s Cave.
21

Figure 13. The entrance area of Rattlesnake Cave. Note the leaf litter and soil on the ground that steeply slopes toward the pool (pool not visible in photo).
22