Final Report and Recommendations - Queen's University Belfast
246
1 Modiolus Restoration Research Project: Final Report and Recommendations (20 th May 2011) Prepared by: D Roberts, L Allcock, J M Fariñas-Franco, E Gorman, C A Maggs, A M Mahon, D Smyth, E Strain, and C D Wilson
Transcript of Final Report and Recommendations - Queen's University Belfast

1
Modiolus Restoration Research Project:
Final Report and Recommendations
(20th May 2011)
Prepared by:
D Roberts, L Allcock, J M Fariñas-Franco, E
Gorman, C A Maggs, A M Mahon, D Smyth, E
Strain, and C D Wilson
2
Contents
Executive Summary ............................................................................................................ 8
Summary of key findings ............................................................................................................... 10
Changes in the distribution, density and condition of M. modiolus reefs in Strangford Lough
(Undertakings 1, 2 and 7) .............................................................................................................. 10
Small-scale temporal and spatial variability in ‘good’ and ‘poor’ M. modiolus reefs (Undertakings
4 and 5) ......................................................................................................................................... 10
Potential for natural recovery of M. modiolus reefs (Undertaking 6) .......................................... 11
Identifying suitable sites for restoration: habitat suitability modelling for Modiolus modiolus, in
Strangford Lough (Undertakings 9 and 10) ................................................................................... 12
Intervention (Undertakings 11, 12 & 13) ...................................................................................... 13
Projection for recovery of ‘Favourable Conservation Status’ (Undertaking 8)............................. 15
Recommendations (Undertaking 3) ............................................................................................. 20
PROTECTION ................................................................................................................................. 20
INTERVENTION .............................................................................................................................. 21
MONITORING ................................................................................................................................ 22
1.0 Introduction ........................................................................................................... 25
1.1 The Modiolus Restoration Research Project ................................................................ 25
1.2 Background ........................................................................................................................ 28
1.3 Rationale ............................................................................................................................ 31
TECHNICAL REPORTS ..................................................................................................... 34
2.0 Changes in the distribution, density and condition of Modiolus modiolus
communities in Strangford Lough (Undertakings 1, 2 and 7) ........................................ 35
2.1 Summary ............................................................................................................................ 35
2.2 Introduction ........................................................................................................................ 36
2.3 Methods .............................................................................................................................. 37
2.3.1 Remotely Operated Vehicle surveys (2008-2010) .......................................................... 37
2.3.2 Dive surveys (2008-2010) ................................................................................................ 38

3
2.3.3 Ultra Short Baseline acoustic surveys (2008-2010)......................................................... 39
2.3.4 Historical records (1954-2007) ........................................................................................ 40
2.3.5 Analyses ........................................................................................................................... 42
2.4 Results ................................................................................................................................ 45
2.4.1 Distribution of M. modiolus ............................................................................................ 45
2.4.2 Condition of M. modiolus communities .......................................................................... 49
2.3.3 Percentage cover of dead M. modiolus .......................................................................... 52
2.3.4 Historical trends in M. modiolus distribution and densities in Strangford Lough .......... 54
2.4 Discussion .......................................................................................................................... 55
2.5 Conclusions ....................................................................................................................... 57
3.0 Small-scale temporal and spatial variability in ‘good’ and ‘poor’ M. modiolus
reefs (Undertakings 4 and 5) ............................................................................................ 58
3.1 Summary ............................................................................................................................ 58
3.2 Introduction ........................................................................................................................ 59
3.3 Methods .............................................................................................................................. 60
3.3.1 Site characteristics .......................................................................................................... 60
3.3.2 Sampling strategy ............................................................................................................ 62
3.3.3 Monitoring of M. modiolus and epifauna: in situ counts and photo quadrats ............... 62
3.3.4 Monitoring of M. modiolus epifauna, crevice and sediment infauna: core sampling .... 62
3.3.5 Analyses ........................................................................................................................... 63
3.4 Results ................................................................................................................................ 64
3.4.1 Density of M. modiolus ................................................................................................... 64
3.4.2 Photo quadrat monitoring of epifauna ........................................................................... 65
3.4.3 Core sampling .................................................................................................................. 71
3.5 Discussion .......................................................................................................................... 76
4.0 Potential for natural recovery of M. modiolus communities (Undertaking 6).... 78
4.1 Summary ............................................................................................................................ 78
4.2 Introduction ............................................................................................................................... 79

4
4.3 Methods .............................................................................................................................. 80
4.3.1 Transect surveys – Changes in frequency of occurrence of M. modiolus between 2003
and 2010 ....................................................................................................................................... 80
4.3.2 Transect surveys – Changes in M. modiolus abundance and communities between 2003
and 2007 ....................................................................................................................................... 81
4.3.3 Removal quadrats – Changes in M. modiolus densities and communities between 2003
and 2010 ....................................................................................................................................... 82
4.3.4 Analyses ........................................................................................................................... 83
4.4 Results ................................................................................................................................ 85
4.4.1 Transect surveys – Changes in frequency of occurrence of M. modiolus between 2003
and 2010 ....................................................................................................................................... 85
4.3.3 Removal quadrats – Changes in density of M. modiolus between 2003 and 2010 ........ 92
4.4.3 Epifauna, and crevice and sediment infauna in quadrats ............................................... 94
4.5 In situ observations ......................................................................................................... 102
4.5.1 North Basin (SS.SBR.SMus.ModCvar) ............................................................................ 102
4.5.2 South basin (SS.SBR.SMus.Mod.HAs) ............................................................................ 102
4.5.3 Historical sites within the range of M. modiolus in Strangford Lough .......................... 103
4.6 Discussion ........................................................................................................................ 104
4.7 Conclusions ..................................................................................................................... 105
5.0 Identifying suitable sites for restoration: habitat suitability modelling for M.
modiolus, in Strangford Lough (Undertakings 9 and 10) ............................................. 106
5.1 Summary .......................................................................................................................... 106
5.2 Introduction ...................................................................................................................... 108
5.3 Methods ............................................................................................................................ 110
5.3.1 Landscape parameterization ......................................................................................... 110
5.3.2 Statistical analyses ........................................................................................................ 113
5.4 Results .............................................................................................................................. 114
5.4.1 SS.SBR.SMus.ModCvar .................................................................................................. 114
5.4.2 SS.SBR.SMus.ModHAs/ModT ........................................................................................ 114

5
5.4.3 Both basins .................................................................................................................... 115
5.5 Discussion ........................................................................................................................ 119
6.0 Intervention action .............................................................................................. 121
6.1 Translocation or restructuring of scattered, un-clumped adult Modiolus
modiolus and subsequent monitoring (Undertaking 11) .............................................. 122
6.1.1 Summary .......................................................................................................................... 122
6.1.2 Introduction ...................................................................................................................... 124
6.1.3 Aims and objectives ........................................................................................................ 125
6.1.4 Materials and Methods ................................................................................................... 125
6.1.4.1 Site selection ............................................................................................................. 125
6.1.4.2 Survey methodology ................................................................................................. 127
6.1.4.3 Site selection survey results...................................................................................... 128
6.1.4.4 Artificial reef experimental design............................................................................ 129
6.1.4.5 Deployment of cultch ............................................................................................... 130
6.1.4.6 Translocation of adult Modiolus modiolus ............................................................... 133
6.1.4.7 Monitoring ................................................................................................................ 134
6.1.4.8 Additional clumping behaviour experiment ............................................................. 136
6.1.5 Results .............................................................................................................................. 136
6.1.5.1 Epifaunal community succession .............................................................................. 136
6.1.5.2 Effect of relief on M. modiolus survival .................................................................... 141
6.1.6 Discussion ........................................................................................................................ 142
6.1.7 Conclusions ..................................................................................................................... 144
6.2 Provision of suitable substrata for spat settlement and subsequent monitoring
(Undertaking 12) .............................................................................................................. 145
6.2.1 Summary .......................................................................................................................... 145
6.2.2 Introduction ...................................................................................................................... 146
6.2.3 Materials and methods ................................................................................................... 146
6.2.3.1 Natural recruitment .................................................................................................. 147

6
6.2.3.2 Shell aging methods .................................................................................................. 147
6.2.3.3 Spat settlement ......................................................................................................... 149
6.2.4 Results .............................................................................................................................. 153
6.2.4.1 Population structure and natural recruitment ......................................................... 153
6.2.4.2 Growth and age-frequency distributions.................................................................. 156
6.2.4.3 Spat settlement ......................................................................................................... 157
6.2.4.4 Spat settlement ......................................................................................................... 159
6.2.5 Discussion ........................................................................................................................ 160
6.2.5.1 Population structure and natural recruitment ......................................................... 160
6.2.5.2 Substrate preference ................................................................................................ 161
6.3 Pilot Modiolus modiolus hatchery cultivation (Undertaking 13) ...................... 163
6.3.1 Summary .......................................................................................................................... 163
6.3.2 Introduction ...................................................................................................................... 164
6.3.3 Materials and Methods ................................................................................................... 165
6.3.3.1 Production of micro-algae. ....................................................................................... 166
6.3.3.2 Conditioning of brood-stock and induction of broodstock spawning ...................... 168
6.3.3.3 Larval husbandry ....................................................................................................... 169
6.3.3.4 Intermediate cultivation ........................................................................................... 172
6.3.4 Results .............................................................................................................................. 172
6.3.4.1 Broodstock size frequency ........................................................................................ 172
6.3.4.2 Broodstock response to supplemental algal diet ..................................................... 173
6.3.4.3 Description of spawning and the larval cycle ........................................................... 174
6.3.4.4 Effect of diet in larval growth and survival ............................................................... 176
6.3.4.5 Settlement ................................................................................................................ 178
6.3.5 Discussion ........................................................................................................................ 179
6.3.5.1 Hatchery cultivation of M. modiolus ........................................................................ 179
6.3.5.2 Economics of seed mussel production ..................................................................... 181

7
6.3.6 Conclusions ................................................................................................................... 182
7. Projection for recovery of ‘Favourable Conservation status’ (Undertaking 8) .... 183
7.1 Summary .......................................................................................................................... 183
7.2 Introduction ...................................................................................................................... 184
7.3 Current conservation status ................................................................................................. 184
8 Recommendations (Undertaking 3) ........................................................................ 189
8.1 Options .................................................................................................................................... 189
8.2 Recommendations ................................................................................................................. 189
8.2.1 PROTECTION ...................................................................................................................... 189
8.2.2 INTERVENTION .............................................................................................................. 190
8.2.3 MONITORING ................................................................................................................ 191
9.0 References ........................................................................................................... 195
10.0 Appendices .......................................................................................................... 207

8
Executive Summary
In 2004, following formal complaints (2003/5272 & 2004/4112) to the European
Commission, the UK government became exposed to a very serious risk of infraction
for alleged breaches of Articles 2 and 6 of the Habitats Directive. At that time
government stated that ‘appropriate regulatory action under Article 6.2 of the
Habitats Directive has been undertaken in an attempt to prevent deterioration
of the Modiolus reefs’ and undertook ‘to comply with obligation in Article 2.2 of
the directive to restore the Modiolus reefs to favourable conservation status.’
The Strangford Lough Management Scheme 2005-2010 (Environment and
Heritage Service 2001) identified actions required by the competent authorities, the
Departments of the Environment (DOE) and Agriculture and Rural Development
(DARD), to address the restoration of Modiolus Biogenic Reefs in Strangford Lough.
Consequently, DOE and DARD approved The Strangford Lough M. modiolus
biogenic reef restoration plan (MRP) (Anon 2005). Short-term objectives of the MRP
were: to introduce total protection for the remaining reefs and to assess whether
conditions in appropriate areas are favourable for restoration using pilot translocation
experiments. The medium-term objective was to monitor the rate of natural recovery
over a five-year period. The plan also aimed to investigate potential intervention
techniques that would be needed if natural recovery was not occurring. The ultimate,
long-term objective of the plan is ‘to restore the Strangford Lough Modiolus
biogenic reef feature to Favourable Conservation Status’ (Anon 2005). To help
deliver the plan, DOE and DARD established The Modiolus Restoration Research
Group Project in February 2008.
Terms of Reference: MRRG delivered technical aspects of the Modiolus biogenic
reef restoration plan (MRP) through specific undertakings (Table 1).
Carried out over 3 years between February 2008 and February 2011 the project
was delivered by three academic, six research and two technical staff. Field surveys
involved deployment of 276 Remotely Operated Vehicle (ROV) drops and over 448
dives (Appendices 1 & 2). Laboratory research included preparation for field surveys,
analysis of field samples and over 880 days in a hatchery dedicated to the project.
An artificial reef experiment was established to investigate the potential for
restoration involving translocation of mussels onto cultch. This involved deploying 10

9
tonnes of weathered scallop shells in an experimental array and „seeding‟ this with
6000 Modiolus modiolus broodstock. In addition, a Modiolus researchers‟ conference
was hosted by MRRG to initiate networking with specialists in the field (Appendix 3).
Table 1. The Modiolus Restoration Research Group Project: Delivering technical
aspects of the The Strangford Lough Modiolus biogenic reef restoration plan (MRP).
MRP objectives Undertakings of the Modiolus Restoration Research Group Project
1. Reef Mapping: to identify, map and introduce total protection for the remaining M. modiolus biogenic reef sites within 1 year of adoption of this plan: damaged biogenic reefs will also be identified and protected from further damage
U1: Map areas of remaining „pristine‟ M. modiolus
U2: Identify and map areas of damaged M. modiolus
U3: Provide scientific advice for the implementation of restoration and protection of both pristine and damaged areas
2. Monitoring natural recovery: to show, using appropriate reference and control sites, evidence of recovery of the M. modiolus biogenic reef feature towards ‘Unfavourable Condition, Recovering’ within 5 years of initiation of this proposed plan
U4: Monitor temporal trends in „pristine‟ reefs
U5: Investigate the potential for natural recovery - damaged reef
U6: Investigate the potential for natural recovery - historical range
U7: Investigate changes in the distribution of „pristine‟ and damaged M. modiolus reefs
U8: Generate projections when „Favourable Conservation Status‟ might be achieved
3. Identify suitable sites for restoration: to assess whether conditions in appropriate areas within Strangford Lough are currently favourable for restoration using pilot scale translocation experiments
U9: Define conditions favourable for M. modiolus in Strangford Lough
U10: Map the suitability of current condition for M. modiolus in Strangford Lough
4. Potential intervention strategies: to restore the Strangford Lough M. modiolus biogenic reef feature to ‘Favourable Conservation Status’
U11: Translocate M. modiolus and monitor recovery
U12: Investigate ways to increase provision of suitable substrata for spat settlement
U13: Culture M. modiolus for reseeding
This section of the report summarises the key findings of the Modiolus Restoration
Research Group [MRRG] project and, based on these, provides recommendations
whereby the competent authorities (DOE and DARD) might achieve their objectives
as stated in the Modiolus Restoration Plan [MRP].

10
Summary of key findings
Changes in the distribution, density and condition of M. modiolus reefs
in Strangford Lough (Undertakings 1, 2 and 7)
Until the mid 1970s M. modiolus beds were found extensively throughout
Strangford Lough. The current distribution, density, and condition of M. modiolus
communities in the Lough were assessed and mapped. For the purposes of the
present study, „good‟ condition M. modiolus reefs in Strangford Lough were defined
as sites with ≥ 5 individuals, and ≥ 1 clump per m-2 and „poor‟ condition M. modiolus
reefs were defined as sites with < 5 individuals, and < 1 clump per m-2. M. modiolus
beds have declined substantially in distribution, extent, condition and density.
Between 1975 and 1995 the distributional extent of M. modiolus in Strangford Lough
declined by over 40%. This decline has continued in some areas but at a slower rate.
Although densities were not recorded widely or at the same sites over time, density
data, where available, reflect the trends seen in distributional data.
M. modiolus beds can now be found in an area between Castle Island and
Gransha Point in the north and Taggart Island and Kate‟s Pladdy in the south (Figure
1.0). Beds considered in „good‟ condition can be found at Craigyouran and Round
Island Pinnacle (Figure 1.0). Remaining beds are fragmented and patchy.
Small-scale temporal and spatial variability in ‘good’ and ‘poor’ M.
modiolus reefs (Undertakings 4 and 5)
This part of the study aimed to monitor short-term trends in „good‟ and „poor‟
condition M. modiolus communities in Strangford Lough to determine whether they
are improving or deteriorating over time. Monitoring included in situ counts of M.
modiolus, photography of 0.25m2 quadrats and total removal sampling using 10 cm
diameter cores. M. modiolus densities were generally higher in the north basin good
and poor sites than in south basin good and poor sites respectively and did not
change through time.
The mean numbers of epifaunal species in photo-quadrats of good and poor sites
in the north basin were generally higher than those of good and poor sites
respectively in the south basin. Non-metric multidimensional scaling of photo-quadrat

11
data showed that epifauna in the good condition sites in both the north and south
basins and in the poor condition site in the north remained relatively stable through
time whereas epifauna in the poor condition site in the south basin varied through
time.
Univariate analysis of core samples revealed no clear temporal trends. However,
there were significant differences between the numbers and abundances of species
in core-samples from good and poor sites, from the north and south basins, and the
different sampling times. Multivariate analysis of core samples suggested little
temporal change in communities in good sites in both the north and south basins and
in those from poor sites in the north basin. However, communities in the core
samples from poor M. modiolus beds in the south showed a distinctive shift in MDS
space after 6 months which reflects the significant effects of time and time-related
interactions seen in univariate analysis.
This part of the study suggests that short-term monitoring is of limited value in
following temporal trends because there are significant interactions amongst
variables and that future monitoring should be carried out no more frequently than
annually to minimise this variability.
Potential for natural recovery of M. modiolus reefs (Undertaking 6)
In 2003, the M. modiolus communities in Strangford Lough were surveyed by
video transects and by quadrat removal sampling in sites north (northern basin) and
south (southern basin) of the Long Sheelah (SLECI, Roberts et al., 2004). Sites were
selected to sample the historical range of the M. modiolus with Chlamys varia,
sponges, hydroids and bryozoans biotope (code SS.SBR.SMus.ModCvar) and the
M. modiolus with hydroids and large solitary ascidians (SS.SBR.SMus.ModHAs)
biotope, in the north and south basins respectively. To determine the long term
potential for natural recovery of impacted M. modiolus communities repeat surveys
were carried out at the same sites and using the same methodology as in 2003 , as
far as was possible. In the north basin sites there have been further declines in the
density and frequency of occurrence of M. modiolus, relative to the 2003 SLECI
surveys. In the south basin there have been further declines in the density of M.
modiolus, but increases in its frequency of occurrence suggesting greater
12
fragmentation of the biotope. There was a decrease in the mean number of species
and Shannon‟s and Pielou‟s diversity indices between 2003 and 2010 in the north
basin. There was an increase in the mean number of species but no clear
differences in Shannon‟s and Pielou‟s diversity indices between 2003 and 2010 in
the south basin.
This part of the study suggests that the biotope in the north basin has continued to
decline in condition since SLECI, whereas the biotope in the south basin appears to
show increased fragmentation although some good condition sites remain.
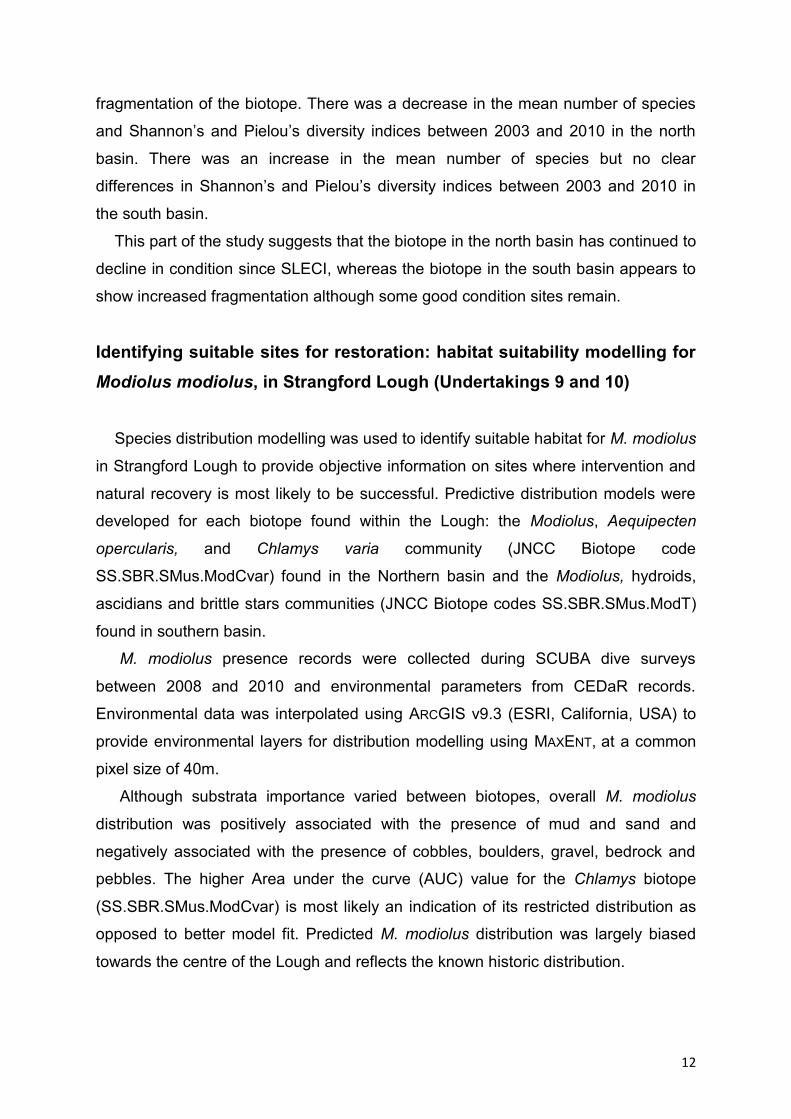
Identifying suitable sites for restoration: habitat suitability modelling for
Modiolus modiolus, in Strangford Lough (Undertakings 9 and 10)
Species distribution modelling was used to identify suitable habitat for M. modiolus
in Strangford Lough to provide objective information on sites where intervention and
natural recovery is most likely to be successful. Predictive distribution models were
developed for each biotope found within the Lough: the Modiolus, Aequipecten
opercularis, and Chlamys varia community (JNCC Biotope code
SS.SBR.SMus.ModCvar) found in the Northern basin and the Modiolus, hydroids,
ascidians and brittle stars communities (JNCC Biotope codes SS.SBR.SMus.ModT)
found in southern basin.
M. modiolus presence records were collected during SCUBA dive surveys
between 2008 and 2010 and environmental parameters from CEDaR records.
Environmental data was interpolated using ARCGIS v9.3 (ESRI, California, USA) to
provide environmental layers for distribution modelling using MAXENT, at a common
pixel size of 40m.
Although substrata importance varied between biotopes, overall M. modiolus
distribution was positively associated with the presence of mud and sand and
negatively associated with the presence of cobbles, boulders, gravel, bedrock and
pebbles. The higher Area under the curve (AUC) value for the Chlamys biotope
(SS.SBR.SMus.ModCvar) is most likely an indication of its restricted distribution as
opposed to better model fit. Predicted M. modiolus distribution was largely biased
towards the centre of the Lough and reflects the known historic distribution.

13
These findings, if combined with larval dispersal modelling, could be used to
predict areas of the lough where recovery is more likely and to inform the selection of
optimum sites for restoration.
Intervention (Undertakings 11, 12 & 13)
The Modiolus Restoration Plan requires methodologies to restore the M. modiolus
reef feature in the event of natural recovery not being observed. This part of the
project used pilot field and laboratory studies to investigate the potential for three
intervention techniques:
1) Translocation or restructuring of scattered, un-clumped adult Modiolus
modiolus and subsequent monitoring
2) Provision of suitable substrata for spat settlement and subsequent monitoring
3) Pilot Modiolus modiolus hatchery cultivation.
Translocation or restructuring of scattered, un-clumped adult Modiolus
modiolus and subsequent monitoring
An artificial reef was constructed south east of Brown Rocks using weathered
King Scallop (Pecten maximus) as cultch for 6000 re-laid adult M. modiolus (Figure
1.0). The experimental design incorporated elevated and flattened artificial reefs.
Mussels were also relaid directly on the seabed. The purpose of the experiment was
to assess if either cultch or elevation increased survival of the translocated mussels.
After 6 months, survival in all treatments was high and differences in mortality
rates between treatments were not significant. The number of faunal species
associated with the constructed reef increased greatly over six months. This was
interpreted as a reflection of the natural reef forming process by M. modiolus.
Spat collectors deployed near the cultch site indicate natural recruitment of M.
modiolus spat from sources in the surrounding area. Regular monitoring of the
artificial M. modiolus reef is required. This should include monitoring the effects of
reef elevation and structure on adult mussel survival, natural M. modiolus spat
recruitment and diversity of the associated reef community.
This experiment has demonstrated that translocation of adult horse mussels on to
purposely built artificial reefs consisting of shell cultch is likely to enhance recovery

14
and natural recruitment providing additional brood-stock to damaged areas. The
present experiment was conducted within the southern basin of Strangford Lough
where the M. modiolus typically belongs to the SS.SBR.SMus.ModHAs/ModT
biotope. A similar trial should be conducted at a suitable site in the northern basin to
stimulate recovery of the M. modiolus/Chlamys varia (SS.SBR.SMus.ModCvar)
biotope.
Provision of suitable substrata for spat settlement and subsequent monitoring
The Modiolus Restoration Plan proposed the use of suitable substrata to enhance
natural recruitment as a potential restoration strategy. The Modiolus Restoration
Research Group (MRRG) tested this proposed intervention action by investigating
natural recruitment patterns of M. modiolus and spat settlement on different collector
materials at several locations representative of its distribution range in Strangford
Lough. Natural recruitment was very poor in damaged areas north of the Long
Sheelah (ModCvar biotope) but was very high in the southern distribution range
(ModHAs biotope), which may be self-sustaining.
Settlement rarely occurs outside the matrix created by live adult M. modiolus, and
was significantly better among clumps of live mussels than on other materials. Spat
settlement was very poor on artificial spat collectors and loose M. modiolus and
Pecten maximus shells. The use of artificial blue mussel spat collectors for
cultivation of M. modiolus is not a viable restoration approach. The use of seabed
cultch techniques to enhance natural recruitment of M. modiolus should be
supplemented with translocation of clumps of live M. modiolus.
Pilot Modiolus modiolus hatchery cultivation
The Modiolus reef Restoration Plan contemplates the production of young M.
modiolus for experimental reseeding if natural recruitment is not observed. To meet
this objective the Modiolus Restoration Research Group (MRRG) set up the first
dedicated M. modiolus hatchery in Europe. Horse mussel spat was successfully
produced from local broodstock. The majority of mussels remained ripe throughout
the period of study and consequently conditioning was not necessary. Partial
15
desiccation effectively triggered spawning in broodstock mussels. The full larval
cycle from fertilized eggs to settled pediveligers takes approximately 38 days at
ambient summer water temperatures for Strangford Lough. No significant differences
were observed in larval survival and growth using single or mixed algal diets.
Pediveligers preferred settling among live mussels than on artificial substrata. Spat
up to 1.5mm long were obtained after 4 months in an upwelling system. The main
obstacles to producing sufficient quantities of spat for reseeding were: 1) lengthy
developmental cycle; 2) slow larval and spat growth; 3) poor survival rates; and 4)
very specific settlement requirements.
The high costs associated with running the hatchery operations compared to the
poor return in seed means hatchery production of M. modiolus is not a viable
restoration option at this stage.
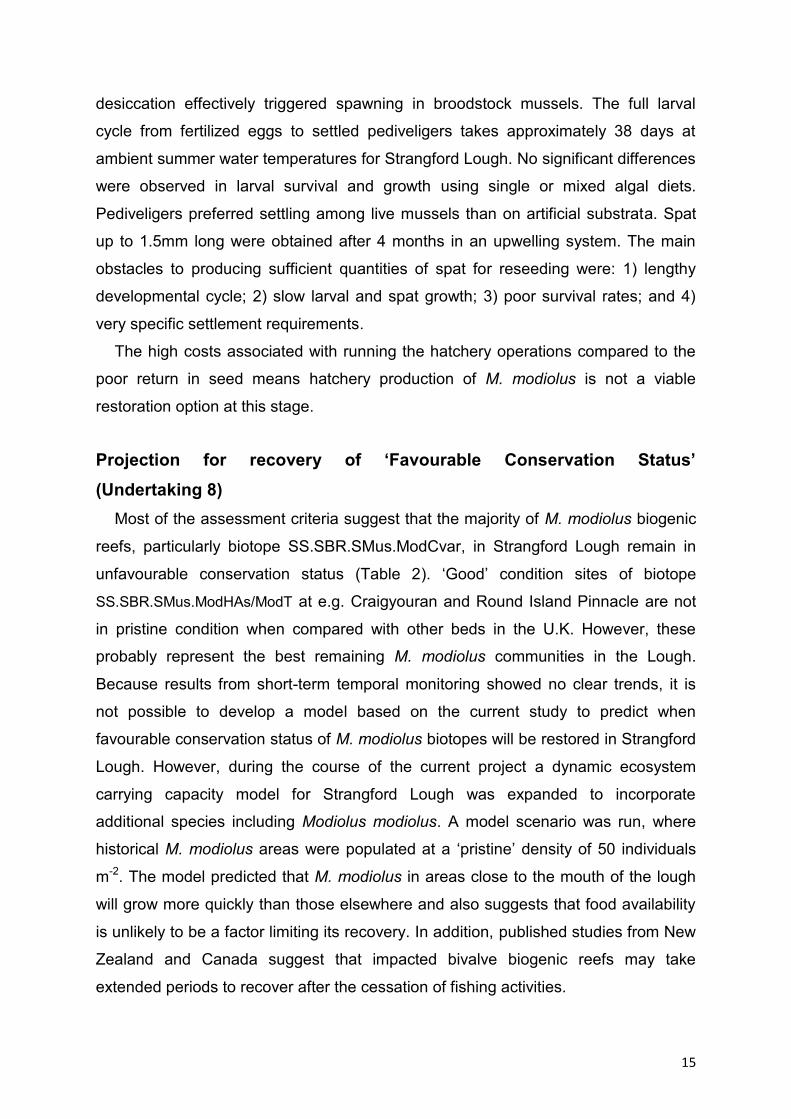
Projection for recovery of ‘Favourable Conservation Status’
(Undertaking 8)
Most of the assessment criteria suggest that the majority of M. modiolus biogenic
reefs, particularly biotope SS.SBR.SMus.ModCvar, in Strangford Lough remain in
unfavourable conservation status (Table 2). „Good‟ condition sites of biotope
SS.SBR.SMus.ModHAs/ModT at e.g. Craigyouran and Round Island Pinnacle are not
in pristine condition when compared with other beds in the U.K. However, these
probably represent the best remaining M. modiolus communities in the Lough.
Because results from short-term temporal monitoring showed no clear trends, it is
not possible to develop a model based on the current study to predict when
favourable conservation status of M. modiolus biotopes will be restored in Strangford
Lough. However, during the course of the current project a dynamic ecosystem
carrying capacity model for Strangford Lough was expanded to incorporate
additional species including Modiolus modiolus. A model scenario was run, where
historical M. modiolus areas were populated at a „pristine‟ density of 50 individuals
m-2. The model predicted that M. modiolus in areas close to the mouth of the lough
will grow more quickly than those elsewhere and also suggests that food availability
is unlikely to be a factor limiting its recovery. In addition, published studies from New
Zealand and Canada suggest that impacted bivalve biogenic reefs may take
extended periods to recover after the cessation of fishing activities.

16
Factors affecting successional regeneration of bivalve biogenic reefs include the
period of non-disturbance, proximity of propagule sources and hydrodynamic
influences on propagule dispersal. In Strangford Lough, much of the degraded M.
modiolus habitat lies within 10-15 km of sources of propagules from the remaining
beds; this suggests that signs of natural recovery might be expected within 20 years
in Strangford Lough, provided there is no further disturbance.

17
Table 2. Assessment of the current conservation status of M. modiolus biotopes in
Strangford Lough (December 2010)
Definitions of ‘Favourable Conservation Status’
Biotopes
Natural Habitat SS.SBR.SMus.ModCvar SS.SBR.SMus.ModHAs/ModT
Its natural range is stable or increasing.
Continuing to decline in distribution and condition.
At some sites this biotope shows increasing fragmentation. „Good‟ condition sites at e.g. Craigyouran and West of Round Island Pinnacle are not in pristine condition when compared with other beds in the U.K. However, these probably represent the best remaining M. modiolus communities in the Lough.
The specific structure and functions necessary for its long-term maintenance exist and are likely to continue for the foreseeable future.
Because there has been continued contraction in the range of its „foundation‟ species, M modiolus, this condition is not met.
This condition is only met at a small number of sites.
The conservation status of its typical species is favourable.
Although many species recorded in previous surveys are still present and presumably self-maintaining, species diversity has declined between 2003 and 2010. In addition, key species for this biotope (Chlamys varia and Aequipecten opercularis) are missing or under-represented.
Most species recorded in previous surveys are still present and presumably self-maintaining. Species diversity has not declined between 2003 and 2010.
Species (Modiolus modiolus)
Population dynamics indicate it is maintaining itself on a long-term basis as part of its natural habitat.
Natural recruitment is very poor.
Natural recruitment is high.
Its natural range is not declining or likely to decline in the foreseeable future.
Most of the recent (since 2003) contraction in range has been in the northern basin.
Range contraction (since 2003) less evident than in the northern basin.
There is a sufficiently large habitat to maintain it on a long-term basis.
Based mainly on substratum characteristics, MAXENT modelling suggests that suitable habitat exists over much of its historical range.
Based mainly on substratum characteristics, MAXENT modelling suggests that suitable habitat exists over much of its historical range.
18
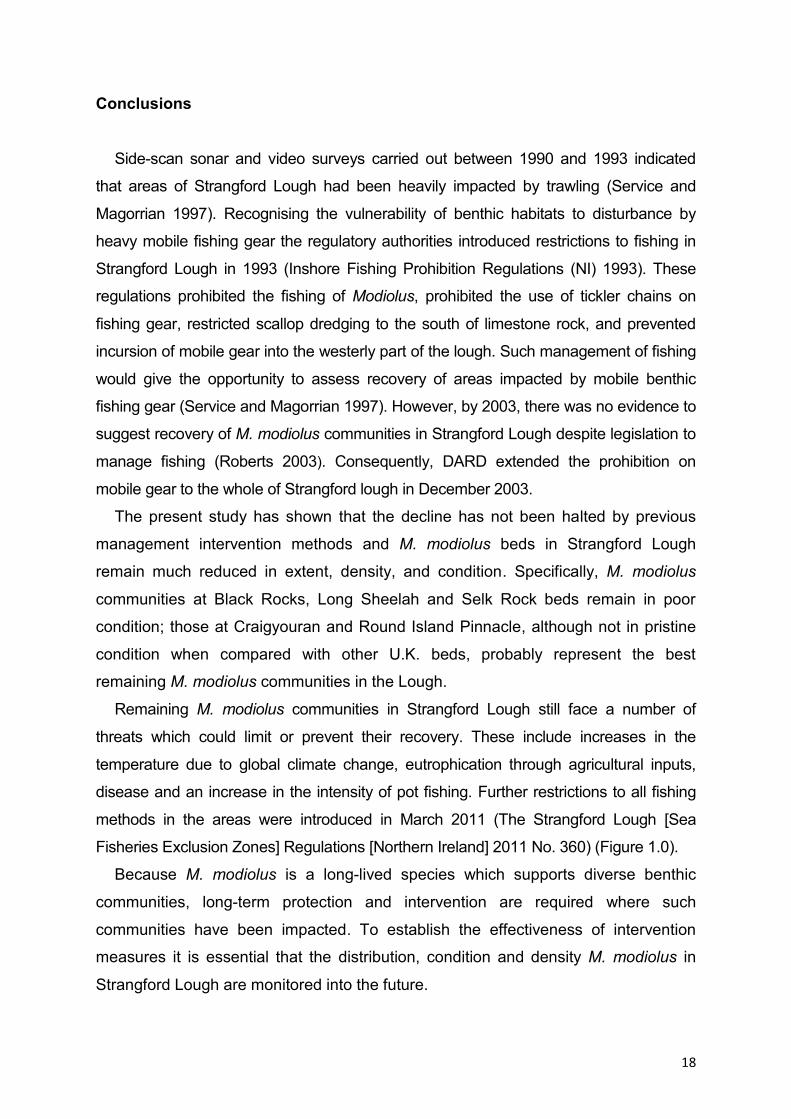
Conclusions
Side-scan sonar and video surveys carried out between 1990 and 1993 indicated
that areas of Strangford Lough had been heavily impacted by trawling (Service and
Magorrian 1997). Recognising the vulnerability of benthic habitats to disturbance by
heavy mobile fishing gear the regulatory authorities introduced restrictions to fishing in
Strangford Lough in 1993 (Inshore Fishing Prohibition Regulations (NI) 1993). These
regulations prohibited the fishing of Modiolus, prohibited the use of tickler chains on
fishing gear, restricted scallop dredging to the south of limestone rock, and prevented
incursion of mobile gear into the westerly part of the lough. Such management of fishing
would give the opportunity to assess recovery of areas impacted by mobile benthic
fishing gear (Service and Magorrian 1997). However, by 2003, there was no evidence to
suggest recovery of M. modiolus communities in Strangford Lough despite legislation to
manage fishing (Roberts 2003). Consequently, DARD extended the prohibition on
mobile gear to the whole of Strangford lough in December 2003.
The present study has shown that the decline has not been halted by previous
management intervention methods and M. modiolus beds in Strangford Lough
remain much reduced in extent, density, and condition. Specifically, M. modiolus
communities at Black Rocks, Long Sheelah and Selk Rock beds remain in poor
condition; those at Craigyouran and Round Island Pinnacle, although not in pristine
condition when compared with other U.K. beds, probably represent the best
remaining M. modiolus communities in the Lough.
Remaining M. modiolus communities in Strangford Lough still face a number of
threats which could limit or prevent their recovery. These include increases in the
temperature due to global climate change, eutrophication through agricultural inputs,
disease and an increase in the intensity of pot fishing. Further restrictions to all fishing
methods in the areas were introduced in March 2011 (The Strangford Lough [Sea
Fisheries Exclusion Zones] Regulations [Northern Ireland] 2011 No. 360) (Figure 1.0).
Because M. modiolus is a long-lived species which supports diverse benthic
communities, long-term protection and intervention are required where such
communities have been impacted. To establish the effectiveness of intervention
measures it is essential that the distribution, condition and density M. modiolus in
Strangford Lough are monitored into the future.

19
While Table 2 may appear to paint a bleak picture for the potential recovery of the
M. modiolus biogenic reef feature in Strangford Lough, experience in New Zealand
(Cranfield et al. 2004) suggests that biogenic reefs comprising Tiostrea (Ostrea)
chilensis and Modiolus areolatus may recover over long periods if undisturbed. In
addition, a number of positive elements have emerged from the current project. First,
species richness remains high at a number of sites. Second, there is evidence of low
levels of natural recruitment in the north basin and higher levels of recruitment in the
south basin. Third, intervention involving translocation of M. modiolus onto cultch
shows a great potential to kick start the regeneration process. These positive
elements of the study form the basis of the recommendations below.

20
Recommendations (Undertaking 3)
Recommendations below follow the three essential elements of the DARD/DOE
Modiolus Restoration plan.
PROTECTION
Maintain the ban on the use of mobile fishing gear
MRRG recommend that a totalprotection zone is established below the 10m
contour line between: Castle Island to Gransha Point in the North and the
Southern tip of Island Taggart to Kate‟s Pladdy in the South (Fig 1.0).
Rationale:
1. The recommendation meets the first objective of the the Modiolus Restoration
Plan agreed by DOE and DARD: „to identify, map and introduce total
protection for the remaining Modiolus biogenic reef sites within one
year of the adoption of this plan; damaged biogenic reefs will also be
identified and protected from further damage‟.
2. The proposed total-protection zone:
Contains the bulk of remaining M. modiolus communities
Contains the experimental restoration cultch site
Includes a significant proportion of habitat suitable for M. modiolus biotopes
(ModCvar and ModHAs/ModT) based on habitat suitability models
Issues:
Impacts on current stakeholder activities
This issue is without the scope of this report and fall within the responsibilities of
the competent authorities, DOE and DARD

21
INTERVENTION
Establish at least one new artificial reef within the proposed total-protection
zone using weathered cultch. The reef site(s) should be selected on the basis
of habitat suitability and larval dispersal modelling, and be located within the
historical distribution of the Modiolus modiolus beds with Chlamys varia,
sponges, hydroids and bryozoans (SS.SBR.SMus.ModCvar) biotope.
Ideally large numbers of adult mussels should be translocated onto cultch in
the area(s) selected for translocation. Based on preliminary results from the
current study, which found no significant difference in survival of mussels
translocated on to elevated or flattened cultch or onto unmodified substrate
the use of cultch may be redundant. However, sourcing and deployment of
cultch should be budgeted into any further intervention efforts. In addition,
because sourcing mussels for translocation remains a problem (see below)
the best approach might be to concentrate existing mussels into larger
patches. This would stabilise mussel patches due to the clumping behaviour
of mussels and overcome Allee effects whereby reproductive success
decreases with population density.
Rationale:
Experimental trials in current project show that:
Artificial reefs stabilise quickly
Translocated mussels show high survival
Reefs are rapidly colonised by epifauna
Issues:
The key issue involving translocation of mussels is that of acquiring sufficient
quantities of mussels to increase the chances of success. This would
necessitate collecting mussels from outside Strangford Lough for this purpose.
This was considered when the pilot reef experiment was initiated during the
present project. The proposal was rejected on the grounds that 1) M. modiolus
beds in the western Irish sea (the nearest source stocks) are themselves
already under threat (Goodwin et al. 2011); 2) there would be a risk of

22
introducing pathogens and alien species; 3) introduced mussels might not be
genetically compatible with populations in Strangford Lough (see for example
Maggs 2008). However, because this project has successfully translocated
mussels in small-scale trials, the potential risks and benefits of such
intervention should be re-evaluated with a view to undertaking translocation on
a large scale.
Cost
MONITORING
Establish an annual programme to monitor:
status of natural biogenic reefs
recruitment & succession on established experimental reef
recruitment & succession on proposed experimental reef
selected historical sites where M. modiolus no longer occurs
Rationale:
Longer time frame is required to demonstrate:
positive or negative changes in natural reefs (natural recovery)
effectiveness of artificial reefs
Issues:
Cost

23
Figure 1.0 Distribution of Modiolus modiolus in Strangford Lough in 2010 based on surveys
conducted by the Modiolus Restoration Research Group (Inset). M. modiolus reefs were
recorded at 123 of 442 sites surveyed and is the basis of the recommendation to establish a
total protection zone below the 10m depth contour, between Castle Island to Gransha Point in
the North and the Southern tip of Island Taggart to Kate‟s Pladdy in the South (Main figure). The
recommendation aims to meet the first objective of the Modiolus Restoration Plan agreed by
DOE and DARD: „to identify, map and introduce total protection for the remaining
Modiolus biogenic reef sites within 1 year of the adoption of this plan‟.
The map also indicates:
The position of „good‟ condition sites, at Craigyouran and Round Island Pinnacle
The experimental cultch site
Strangford Lough (Sea Fisheries Exclusion Zones) Regulations (Northern
Ireland) 2011 No. 36, Introduced 14th March 2011 are also illustrated.

24
Sea Fisheries Exclusion Zones March 2011
Proposed M. modiolus protected area
Experimental M. modiolus reef site
MRRG survey records (2008-2010)
M. modiolus present M. modiolus absent
ARDS
PENINSULA
STRANGFORD
LOUGH
IRISH
SEA

25
1.0 Introduction
1.1 The Modiolus Restoration Research Project
This report describes the findings of the Modiolus Restoration Research Group
[MRRG] Project set up to deliver technical aspects of the MRP through specific
undertakings (Table 1.1) and to recommend a strategy whereby the competent
authorities might achieve these objectives. Carried out over 3 years between
February 2008 and February 2011 the project was delivered by three academic, six
research and two technical staff. Field surveys involved deployment of 276 Remotely
Operated Vehicle (ROV) drops and over 448 dives (896 hours, each diver clocking
over 112 hours of diving bottom time) (Appendices 1 & 2). Laboratory research
included preparation for field surveys, analysis of field samples and over 880 days in
a hatchery dedicated to the project. An artificial reef experiment was established to
investigate the potential for restoration involving translocation of mussels onto cultch.
This involved deploying 10 tonnes of weathered scallop shells in an experimental
array and „seeding‟ this with 6000 Modiolus modiolus broodstock. In addition, a
Modiolus researchers‟ conference was hosted by MRRG to initiate networking with
specialists in the field (Appendix 3).

26
Table 1.1 The Modiolus Restoration Research Group Project: Delivering technical
aspects of the The Strangford Lough Modiolus biogenic reef restoration plan (MRP)
MRP objectives Undertakings of the Modiolus Restoration Research Group Project
1. Reef Mapping: to identify, map and introduce total protection for the remaining M. modiolus biogenic reef sites within 1 year of adoption of this plan: damaged biogenic reefs will also be identified and protected from further damage
U1: Map areas of remaining „pristine‟ M. modiolus
U2: Identify and map areas of damaged M. modiolus
U3: Provide scientific advice for the implementation of restoration and protection of both pristine and damaged areas
2. Monitoring natural recovery: to show, using appropriate reference and control sites, evidence of recovery of the M. modiolus biogenic reef feature towards ‘Unfavourable Condition, Recovering’ within 5 years of initiation of this proposed plan
U4: Monitor temporal trends in „pristine‟ reefs
U5: Investigate the potential for natural recovery - damaged reef
U6: Investigate the potential for natural recovery - historical range
U7: Investigate changes in the distribution of „pristine‟ and damaged M. modiolus reefs
U8: Generate projections when „Favourable Conservation Status‟ might be achieved
3. Identify suitable sites for restoration: to assess whether conditions in appropriate areas within Strangford Lough are currently favourable for restoration using pilot scale translocation experiments
U9: Define conditions favourable for M. modiolus in Strangford Lough
U10: Map the suitability of current condition for M. modiolus in Strangford Lough
4. Potential intervention strategies: to restore the Strangford Lough M. modiolus biogenic reef feature to ‘Favourable Conservation Status’
U11: Translocate M. modiolus and monitor recovery
U12: Investigate ways to increase provision of suitable substrata for spat settlement
U13: Culture M. modiolus for reseeding
As information and experience developed during the course of the project it was
necessary to make slight changes to the methodology proposed in the tender to
deliver undertakings listed above; these are documented in the relevant sections
below. Some minor regrouping of the undertakings has also been made to improve
clarity.
27
The report provides the rationale and objectives of the project followed by a series
of technical reports detailing the main findings:
1. Introduction: Background; Rationale; Objectives (this Section)
TECHNICAL REPORTS
2. Changes in the distribution, density and condition of M. modiolus reefs in
Strangford Lough (Undertakings 1, 2 and 7)
3. Temporal trends in M. modiolus communities in Strangford Lough
(Undertakings 4 & 5)
4. Potential for natural recovery of M. modiolus communities in Strangford Lough
(Undertaking 6)
5. Identifying suitable sites for restoration: habitat suitability modelling for M.
modiolus in Strangford Lough (Undertakings 9 & 10)
6. Intervention (Undertakings 11, 12 & 13)
7. Projection for recovery of „Favourable Conservation status‟ (Undertaking 8)
8. Recommendations (Undertaking 3)

28
1.2 Background
1.2.1 Strangford Lough
Covering over 15000 ha Strangford Lough is the largest sea inlet in Britain and
Ireland. It has a narrow inlet from the Irish Sea which has resulted in a unique
hydrography. This unique hydrography, together with its glacial origin, has created a
wide range of habitats supporting a high diversity of marine communities with more
than 2000 recorded species (Environment and Heritage Service 2001). Strangford
Lough was designated as Northern Ireland's first Marine Nature Reserve and has
been identified as a pilot Marine Protected Area (MPA) (Cork 2006). It is listed as a
NATURA 2000 area [UK0016618] (JNCC 2011). A key feature in this designation is
the presence of biogenic reefs including Modiolus modiolus reefs.
1.2.2 The importance of bivalve biogenic reefs
Complex habitats in the marine environment, such as sea-grass beds, coral reefs
and other invertebrate biogenic reefs support high biodiversity (Cranfield et al. 2004;
Holt et al. 1998), which provide important ecosystem services. Oysters and mussels
in particular provide a wide range of ecological services such as seston filtration,
benthic-pelagic coupling, feeding and structural habitat for mobile species as well as
hard surfaces for attachment of sessile species (Coen et al. 2007) and stabilising the
seabed (Jones 1952; Rees 2009). When such habitats are compromised these
features and services are reduced or lost and may either recover slowly or not at all
without intervention.
Biogenic reefs formed by bivalves such as oysters are one of the most
endangered habitats on earth; on a global scale it is estimated that up to 85% of
oyster reefs have been lost since the 19th century as a result of overfishing and
coastal degradation and many may be functionally extinct (Beck et al. 2009). Most
studies on impacted oyster reefs to date, including those on habitat restoration
(Cranfield et al. 2004; Trimble et al. 2009) have focused on commercial aspects.
However, there is an increasing awareness that it is essential to take an ecosystem
approach to ensure that fisheries are managed sustainably in a way that protects
29
habitats and conserves biodiversity in the marine environment (Beck et al. 2009;
Palumbi et al. 2009).
Mussels, the second major reef-building bivalve taxon after oysters, support high
biodiversity because they increase habitat complexity (Koivisto and Westerbom
2010). Species such as Mytilus californianus can form biogenic structures up to
40cm deep (Seed & Suchanek 1992); the horse mussel (Modiolus modiolus) can
develop a complex undulating topography with amplitudes over 1m in the UK (Rees
et al. 2008) and up to 3m in the Bay of Fundy (Wildish et al. 1998). In addition,
complex biogenic reefs including both oysters (Tiostrea (=Ostrea) chilensis) and
mussels (Modiolus areolatus) have been reported from conditions of strong tidal
currents in the Foveaux Strait, New Zealand (Cranfield et al. 2004 and references
therein).
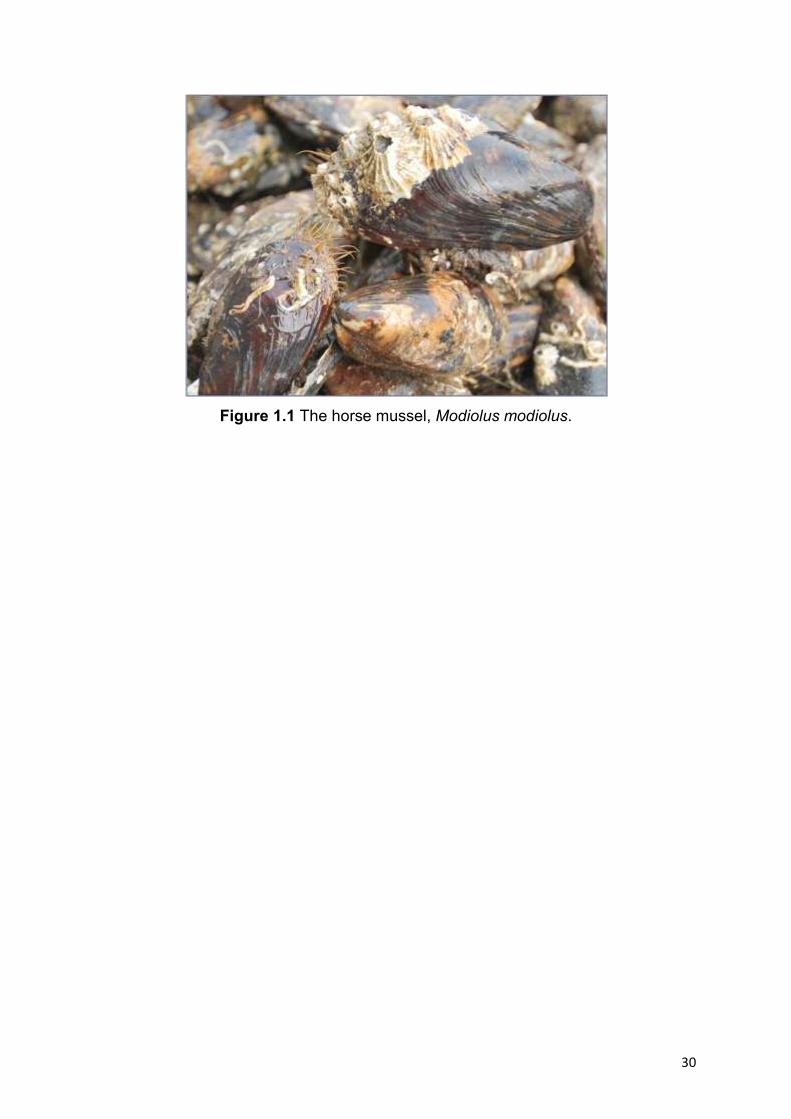
The horse mussel (Figure 1.1) is a widely distributed boreal species, which can
grow up to 200mm and may live up to 100 years old (Anwar et al. 1990). M.
modiolus communities occur from the low intertidal (Davenport & Kjørsvik 1982) to
over 100m depth (Tendel & Dinesen 2005). Mair et al. (2000) categorized literature
dealing with different aspects of the biology of M. modiolus.
M. modiolus can be regarded as a „keystone‟ or „foundation‟ species for four
habitat types currently recognized in Europe (Connor et al. 2004; Rees 2009; EUNIS
2011):
1. Modiolus modiolus beds with hydroids and red seaweeds on tide-swept
circalittoral mixed substrata (EUNIS Code: A5.621; JNCC 04.05 code:
SS.SBR.SMus.ModT)
2. Modiolus modiolus beds on open coast circalittoral mixed sediment (EUNIS
Code:A5.622; JNCC 04.05 code: SS.SBR.SMus.ModMx)
3. Modiolus modiolus beds with fine hydroids and large solitary ascidians on
very sheltered circalittoral mixed substrata (EUNIS Code: A5.623; JNCC
04.05 code: SS.SBR.SMus.ModHAs)
4. Modiolus modiolus beds with Chlamys varia, sponges, hydroids and
bryozoans on slightly tide-swept very sheltered circalittoral mixed substrata
(EUNIS Code: A5.624; JNCC 04.05 code: SS.SBR.SMus.ModCvar)
30
Figure 1.1 The horse mussel, Modiolus modiolus.
31
1.3 Rationale
Modiolus modiolus has been documented in Strangford Lough since the mid-
nineteenth century and was known to form widely distributed beds or reefs in the
Lough in the 1970s. The first attempts to map the full extent of these beds were
conducted in the 1990s by which time it was evident that some of the beds had
already been significantly impacted by trawling (Service and Magorrian 1997).
Up to three of the known M. modiolus biotopes occur in Strangford Lough
(Roberts et al. 2004): EUNIS Codes A5.621; A5.623; A5.624. One of these habitat
types (A5.624) was included, because of its relative rareness, as one of the key
features listed as a selection feature under Annex 1 of the Habitats Directive in the
designation of the Lough in 2002 as a Special Area of Conservation (SAC) (JNCC
2011). EUNIS habitat type A5.624 occurs on mixed substrata in very sheltered
slightly tide-swept conditions and is characterised by Chlamys varia, sponges,
hydroids and bryozoans on M. modiolus beds with (JNCC 04.05 biotope code:
SS.SBR.SMus.ModCvar).
Following concerns raised by various Non-Governmental Organisations (NGOs) and
others that the designated feature (A5.624) was not in favourable conservation
status, the Department of the Environment (DoE) commissioned the Strangford
Lough Ecological Change Investigation (SLECI) in 2003 to investigate ecological
changes in the Lough. A major element of this broader study was to investigate both
the current status of M. modiolus biogenic reefs and identify probable causes of their
decline. SLECI reported a severe decline in the reefs with reference to surveys
carried out in the 1970s and 1980s and confirmed that the reefs were not in
favourable conservation status (Roberts et al. 2004). An interim report by SLECI in
November 2003 identified trawling as the single most likely cause of reef decline. As
a result, the Department of Agriculture and Rural Development (DARD) introduced a
total ban on all mobile fishing gear within Strangford Lough in December 2003. This
ban is still in place.
In 2004, following formal complaints (2003/5272 & 2004/4112) to the European
Commission, the UK government became exposed to a very serious risk of infraction

32
for breaches of Articles 2 and 6 of the Habitats Directive. At that time government
stated that ‘appropriate regulatory action under Article 6.2 of the Habitats
Directive has been undertaken in an attempt to prevent deterioration of the
Modiolus reefs’ and undertook ‘to comply with obligation in Article 2.2 of the
directive to restore the Modiolus reefs to favourable conservation status’.
The Strangford Lough Management Scheme 2005-2010 (Environment and Heritage
Service 2001) identified actions required by the competent authorities, the
Departments of the Environment (DOE) and Agriculture and Rural Development
(DARD), to address the restoration of Modiolus Biogenic Reefs in Strangford Lough.
Consequently, DOE and DARD approved The Strangford Lough M. modiolus
biogenic reef restoration plan (MRP) (Anon 2005). The purpose of the MRP is to
establish mechanisms whereby the Competent Authorities within Northern Ireland
might attempt to restore Strangford Lough Special Area of Conservation (SAC) to
Favourable Conservation Status (FCS). The MRP aimed to ensure maximum
protection for the remaining reefs and sites where M. modiolus had recently been
recorded, while monitoring the rate of natural recovery over a five-year period. The
plan also aimed to pilot potential intervention techniques that would be needed if
natural recovery was not occurring.
The plan identifies three prime objectives:
“The short term objectives are:
to identify, map and introduce total protection for the remaining M.
modiolus biogenic reef sites within 1 year of adoption of this plan:
damaged biogenic reefs will also be identified and protected from
further damage
to assess whether conditions in appropriate areas within Strangford
Lough are currently favourable for restoration using pilot scale
translocation experiments
The medium term objective is:

33
to show, using appropriate reference and control sites, evidence of
recovery of the M. modiolus biogenic reef feature towards „Unfavourable
Condition, Recovering‟ within 5 years of initiation of this proposed plan.
The long-term objective is:
to restore the Strangford Lough M. modiolus biogenic reef feature to
„Favourable Conservation Status‟.”

34
TECHNICAL REPORTS

35
2.0 Changes in the distribution, density and condition of
Modiolus modiolus communities in Strangford Lough
(Undertakings 1, 2 and 7)
2.1 Summary
Until the mid 1970s M. modiolus was found extensively throughout Strangford
Lough.
This study aimed to identify areas of M. modiolus beds and assess the
changes in their distribution, density, and condition in Strangford Lough since
the 1970s.
The current survey found that M. modiolus beds have declined substantially in
distribution, extent, condition and density.
M. modiolus beds can now be found in an area between Castle Island to
Gransha Point in the north and Island Taggart to Kate‟s Pladdy in the south.
Beds considered in „good‟ condition can be found at Craigyouran and west of
Round Island Pinnacle; however, in other areas the beds are fragmented and
patchy.
Between 1975 and 1995 the distributional extent of M. modiolus in Strangford
Lough declined by over 40%. This decline has continued in some areas but at
a slower rate.
Although densities were not recorded widely or at the same sites over time,
density data, where available, reflect the trends seen in distributional data.
The present data suggest that at the current rate of decline, M. modiolus
could be become regionally extinct in Strangford Lough without intervention.

36
2.2 Introduction
M. modiolus is a long lived marine bivalve found in a wide range of habitats and
locations throughout the UK (Rees 2009). Although M. modiolus is a widespread and
common species, horse mussel beds (areas with ≥ 30 % of mussel m-2) are only
found in a limited number of locations (Rees 2009). M. modiolus beds consist of the
mussels themselves and the accumulation of shell and faecal deposits (Sanderson
et al. 2008; Rees et al. 2008). Mapping and monitoring the distribution and densities
of M. modiolus beds is crucial for drawing conclusions about their population trends
and conservation status.
Previous efforts to map the distribution and monitor the densities of M. modiolus in
Strangford Lough have included diver-based surveys (Roberts 1975; Erwin et al.
1986; Brown 1989; Erwin et al. 1990;; Roberts et al. 2004), and surveys involving
remotely operated vehicles (Service 1990; Service 1998) and Acoustic Ground
Discriminate Systems (AGDS) (Service and Magorrian 1997; Magorrian and Service
1998; Magorrian et al. 1995; Mitchell & Service 2003; Roberts et al. 2004). Where
possible these surveys were used to determine the historical distribution and
condition of M. modiolus communities.
The aim of this part of the project was to document temporal trends in the extent
and condition of M. modiolus communities in Strangford Lough.
Specific objectives were to:
Map areas of remaining good M. modiolus communities. (Undertaking 1)
Identify areas of poor M. modiolus communities. (Undertaking 2)
Identify changes in the distribution of good and poor M. modiolus
communities. (Undertaking 7)

37
2.3 Methods
2.3.1 Remotely Operated Vehicle surveys (2008-2010)
The broad-scale mapping of the distribution of live and dead M. modiolus in
Strangford Lough involved the use of a Remotely Operated Vehicle (ROV;
VideoRay®) (Figure 2.1), which was deployed at 276 sites between 2008 to 2010
(Appendix 1).
Figure 2.1 VideoRay® Remotely Operated Vehicle.
Sites surveyed were selected using a grid baseline overlaid on admiralty chart
data for Strangford Lough. This survey was extended to include a higher resolution
investigation of the seabed within and around current and historical M. modiolus
beds at five sites only (Long Sheelah, Hadd Rock, Black Rocks, Round Island
Pinnacle and Craigyouran).
At each survey site, the ROV was flown for 5 minutes on a weighted tether 9 m
long, in a circle (approximate circumference 55 m). The presence, condition and
clump size of live and dead M. modiolus, associated epifauna and substratum type

38
was recorded in the field. In the laboratory, the footage was carefully inspected by
two members of staff to augment the field notes. Because the ROV has a very
limited field of view and operators are unable to examine mussels in detail, dives
were conducted at 105 sites to ground truth these data (see section 2.3.2 below for
details).
2.3.2 Dive surveys (2008-2010)
To ground truth the ROV surveys, dives were conducted at 105 sites, selected
randomly to cover a wide range of sites in both the north and south basins (Appendix
2). Divers recorded the presence, condition (section 2.3.5.1) and clump size of live
and dead M. modiolus at the beginning and end of each dive.
To monitor the densities of M. modiolus through time the divers collected all
mussels from replicated 0.25 x 0.25 m quadrats, at four sites. These sites Bird Island
Passage (n = 3), Brown Rocks (n = 8), Long Sheelah (n = 12), and west of Round
Island Pinnacle (n = 8), (fig. 2.2) were chosen based on historical samples (Roberts
1975; Erwin et al. 1990; Roberts et al. 2004).

39
Figure 2.2 Location of the 0.25 x 0.25 m removal quadrat sites in the historical sites
(Bird Island Passage, Black Rocks, Long Sheelah and Round Island Pinnacle) in
Strangford Lough.
2.3.3 Ultra Short Baseline acoustic surveys (2008-2010)
To map the boundary of the M. modiolus communities, two divers equipped with
SCOUT® USBL (Ultra Short Baseline) acoustic referencing systems (Sonardyne
Ltd.) swam the edges of M. modiolus communities, using DPV (Diver Propulsion
Vehicles). The USBL system provides an accurate positioning for the divers, which
when integrated with a dGPS string, compass/transducer heading and PC can be
imported into ArcGIS.
Two divers entered the water at a designated USBL point and travelled using
DPVs until a recognisable M. modiolus bed edge was found. The divers advised top-
side on commencement of the bed mapping. The divers travelled the bed edge using
compass directions to maintain a zig-zag search pattern (Figure 2.3). The zig-zag
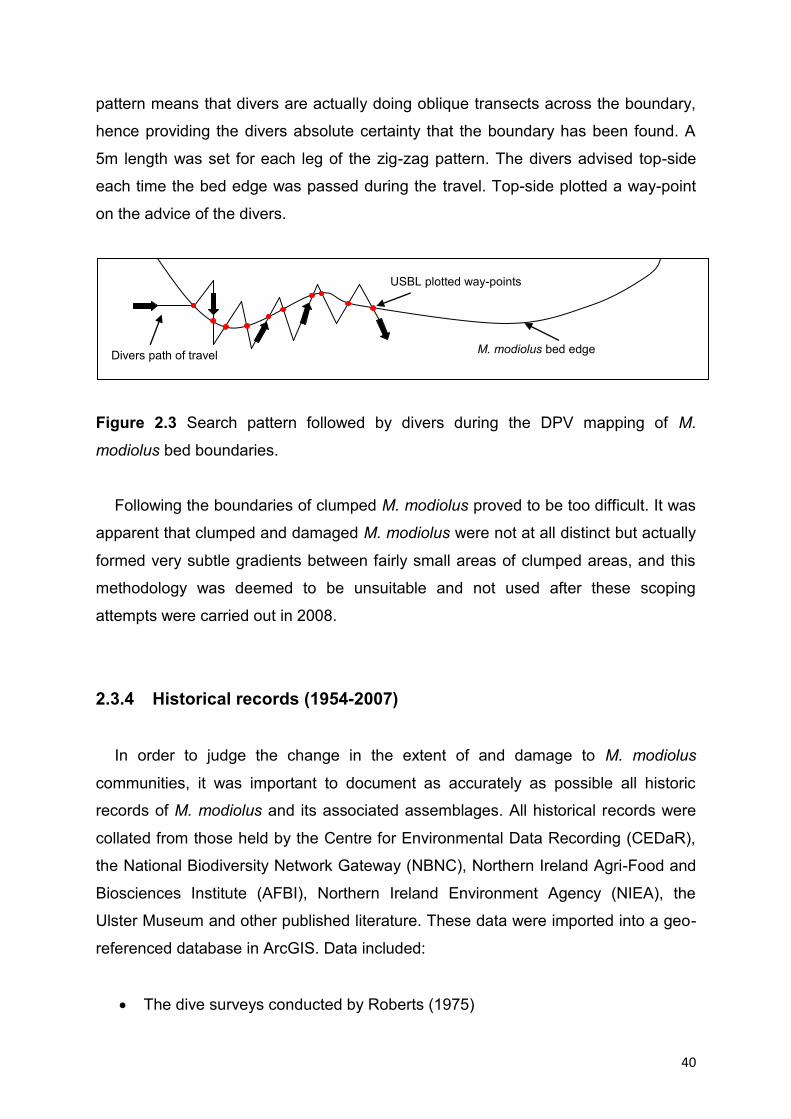
40
pattern means that divers are actually doing oblique transects across the boundary,
hence providing the divers absolute certainty that the boundary has been found. A
5m length was set for each leg of the zig-zag pattern. The divers advised top-side
each time the bed edge was passed during the travel. Top-side plotted a way-point
on the advice of the divers.
Figure 2.3 Search pattern followed by divers during the DPV mapping of M.
modiolus bed boundaries.
Following the boundaries of clumped M. modiolus proved to be too difficult. It was
apparent that clumped and damaged M. modiolus were not at all distinct but actually
formed very subtle gradients between fairly small areas of clumped areas, and this
methodology was deemed to be unsuitable and not used after these scoping
attempts were carried out in 2008.
2.3.4 Historical records (1954-2007)
In order to judge the change in the extent of and damage to M. modiolus
communities, it was important to document as accurately as possible all historic
records of M. modiolus and its associated assemblages. All historical records were
collated from those held by the Centre for Environmental Data Recording (CEDaR),
the National Biodiversity Network Gateway (NBNC), Northern Ireland Agri-Food and
Biosciences Institute (AFBI), Northern Ireland Environment Agency (NIEA), the
Ulster Museum and other published literature. These data were imported into a geo-
referenced database in ArcGIS. Data included:
The dive surveys conducted by Roberts (1975)
Divers path of travel
USBL plotted way-points
M. modiolus bed edge

41
The dive surveys reported in Seed & Brown (1977; 1978)
The dive surveys (1973 to 1977) conducted by the Ulster Museum (Erwin
1986)
The Northern Ireland Sublittoral Survey (NISS; 1982-1985) conducted by the
Ulster Museum (Erwin et al. 1990)
The dive and grabs surveys (1989-2007) conducted by the Ulster Museum
(Brown 1989, Nunn 1994)
The ROV, grabs and video surveys (1990 to 2003) conducted by AFBI
(Service 1990, Magorrian 1995, Magorrian & Service 1998)
The dive and grabs surveys (1997 onwards) conducted by NIEA
The Strangford Lough Ecological Change Investigation dive and video
surveys conducted by Queens University, AFBI, and the Ulster Museum
(Roberts et al. 2004)
The Sublittoral Survey of Northern Ireland dive surveys (2007) conducted by
the Ulster Museum and NIEA
The dredging surveys by Williams (1954) and AGDS surveys by Magorrian et al.
(1995), Mitchell & Service (2003) and Roberts et al. (2004) were also collected for
the geo-referenced GIS database. However, these records were not used in the
subsequent analyses because of methodological difficulties in identifying M.
modiolus beds using the AGDS (Magorrian & Service 1998; Mitchell & Service 2003;
Roberts et al. 2004) and the limited number records in the dredging surveys
(Williams 1954).

42
2.3.5 Analyses
2.3.5.1 Distribution and condition of M. modiolus communities
All historical and current surveys of Strangford Lough were converted to
presence/absence records of live M. modiolus, percentage cover of dead M.
modiolus and condition of M. modiolus communities, and biotope types. The
condition of M. modiolus communities was defined using dive descriptions and
SACFOR categories (as per JNCC website) for historical data and counts for the
current project (Table 2.1). The percentage cover of dead M. modiolus was also
estimated for the current project (Table 2.2). The historical and current
presences/absence records of live M. modiolus and condition of M. modiolus
communities, the biotope types and the current percentage cover of dead M.
modiolus were then plotted onto maps using ARCGIS v9.2 (ESRI, California, USA).
Table 2.1 Definitions used to assign conditions to live M. modiolus communities
using historical and current surveys. These colour codes are depicted on figure 2.5
M. modiolus condition Grade
Continuous clumps (> 5 Ind. clump-1) or > 1 clump m-2, super
abundant, abundant, dense, continuous, bed, thick, frequent 1
Discrete clumps (> 3 Ind. clump-1) < 1 clump m-2 , frequent,
occasional, patchy, damaged, clumps 2
Present ( 0 – 3 Ind. clump -1) < 1 clump m -2, rare, present 3
Absent 4

43
Table 2.2 Definitions used to assign categories to percentage cover of dead M.
modiolus in the current surveys. These colour codes are depicted on figure 2.6.
Categories of dead M. modiolus
Continuous coverage (> 70%) 1
40 - 70% 2
20 - 40% 3
0 - 20% 4
2.3.5.2 Projected trends in M. modiolus populations
Historical surveys were largely based on different sampling scales and replication
and thus cannot be used definitively to establish the distribution and extent of M.
modiolus in Strangford Lough at a single point in time. Therefore, to „hindcast‟ its
likely historical distribution all records, including current records of M. modiolus were
added cumulatively to the earliest records of the species. The condition of M.
modiolus communities was similarly „hindcast‟ based on contemporary descriptions
to generate Figure 2.5a below. This methodology adopts the approach used by
Wilson and Roberts (2011) to establish historical distribution patterns of Margaritifera
margaritifera in the UK and Ireland, and is based on the assumption that M. modiolus
is a long lived sessile species that is highly unlikely to colonise a new site in a short
period of time. In addition, the survey effort for M. modiolus in Strangford Lough has
increased through time, and any apparent decline in this species is unlikely to be
caused by under recording. The number of 0.5 km grid squares occupied by M.
modiolus was then plotted against time.
In addition to the distributional data, changes in the density of M. modiolus
through time from 0.25 x 0.25 m removal quadrats were also plotted. These data
were obtained from four sites in Strangford Lough (Bird Island Passage, Black

44
Rocks, Long Sheelah, and Round Island Pinnacle) from surveys between 1975 and
2010.

45
2.4 Results
2.4.1 Distribution of M. modiolus
Historically, M. modiolus was found extensively throughout Strangford Lough
(Figure 2.4a). The present study (2008-2010) shows that the distribution of M.
modiolus in the Lough is much less extensive than it was previously (Figures 2.4b &
2.7). M. modiolus beds with C. varia, sponges, hydroids and bryozoans (Biotope
code SS.SBR.SMus.ModCvar) historically recorded from the northern part of the
Lough (Figure 2.5c), are now reduced to a very small area around Long Sheelah. M.
modiolus beds with hydroids and large solitary ascidians (Biotope code
SS.SBR.SMus.ModHAs) and M. modiolus beds with hydroids and red seaweeds on
(Biotope code SS.SBR.SMus.ModT) historically recorded from the southern part of
the Lough (Figure 2.5c) are now reduced to four main areas: Black/Brown rocks,
Craigyouran, Selk Rocks and Round Island Pinnacle.

46
Figure 2.4a The historic distribution of M. modiolus in Strangford Lough, Northern
Ireland. Open circles represent negative records, solid circles represent positive
records.
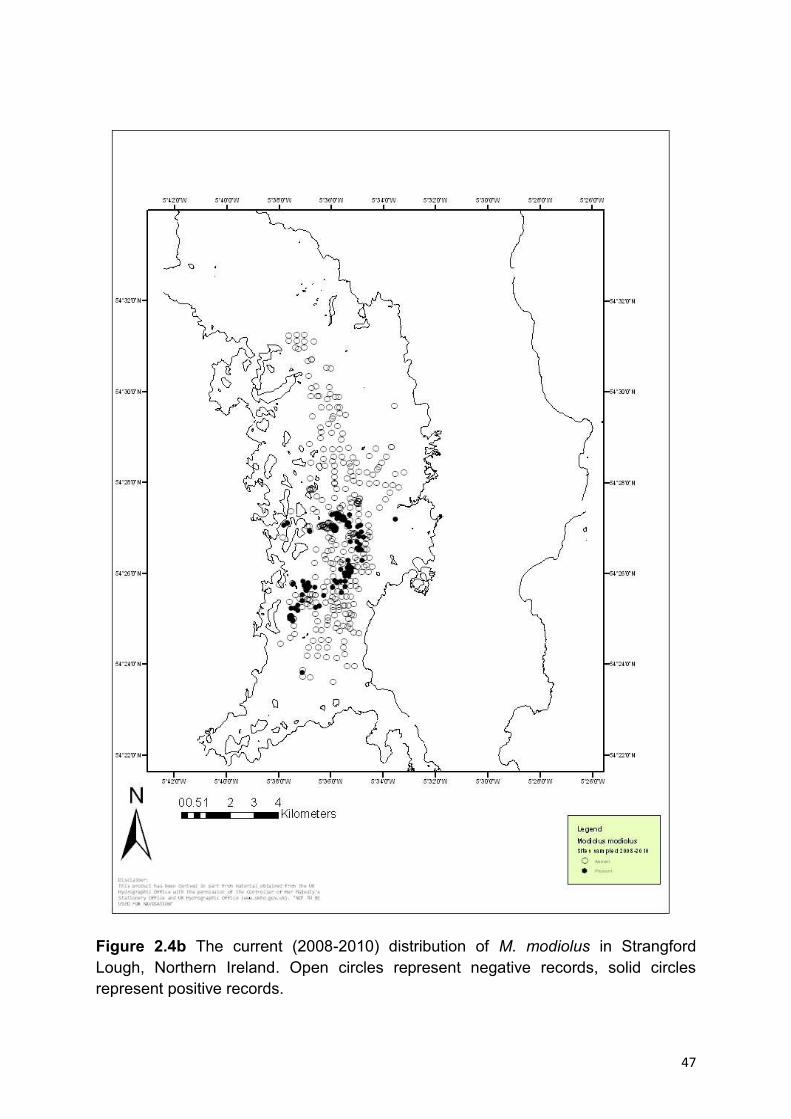
47
Figure 2.4b The current (2008-2010) distribution of M. modiolus in Strangford
Lough, Northern Ireland. Open circles represent negative records, solid circles
represent positive records.

48
Figure 2.4c. Projected hindcast of the historical distribution of M. modiolus biotopes
in Strangford Lough based on data sources listed in section 2.3.4.
49
2.4.2 Condition of M. modiolus communities
Historically, „good‟ condition M. modiolus communities, consisting of continuous
clumps, were found widely in Strangford Lough (Figure 2.5a). The current survey
found that such good condition communities are now restricted to two remaining
areas, Craigyouran and west of Round Island Pinnacle (Figure 2.5b). The M.
modiolus communities at Long Sheelah, Black Rocks and Selk Rock are no longer in
good condition (category 2, Table 2.1). The remaining M. modiolus communities in
other areas have become increasingly fragmented or have disappeared (Figures
2.5a,b).

50
Figure 2.5a Historic (1975-2007) condition of M. modiolus communities in Strangford Lough. Each
colour code represents the condition of M. modiolus communities, where 1) red = continuous clumps,
2) orange = discrete clumps, 3) yellow = present and 4) green = absent.

51
Figure 2.5b The current (2008-2010) condition of M. modiolus communities in Strangford Lough,
Northern Ireland. Each colour code represents the condition of M. modiolus communities, where 1)
red = continuous clumps, 2) orange = discrete clumps, 3) yellow = present and 4) green = absent.

52
2.3.3 Percentage cover of dead M. modiolus
The current survey found that dead M. modiolus can be found extensively
throughout Strangford Lough (Figure 2.6). In both the historic and current sites the
cover of dead M. modiolus ranged between 20-70%.The cover of dead M. modiolus
was highest in sites with living M. modiolus in the centre of the Lough and lowest in
the historical sites (Figure 2.6). The presence of dead M. modiolus can be used to
indicate its historical range and potential sites for restoration.
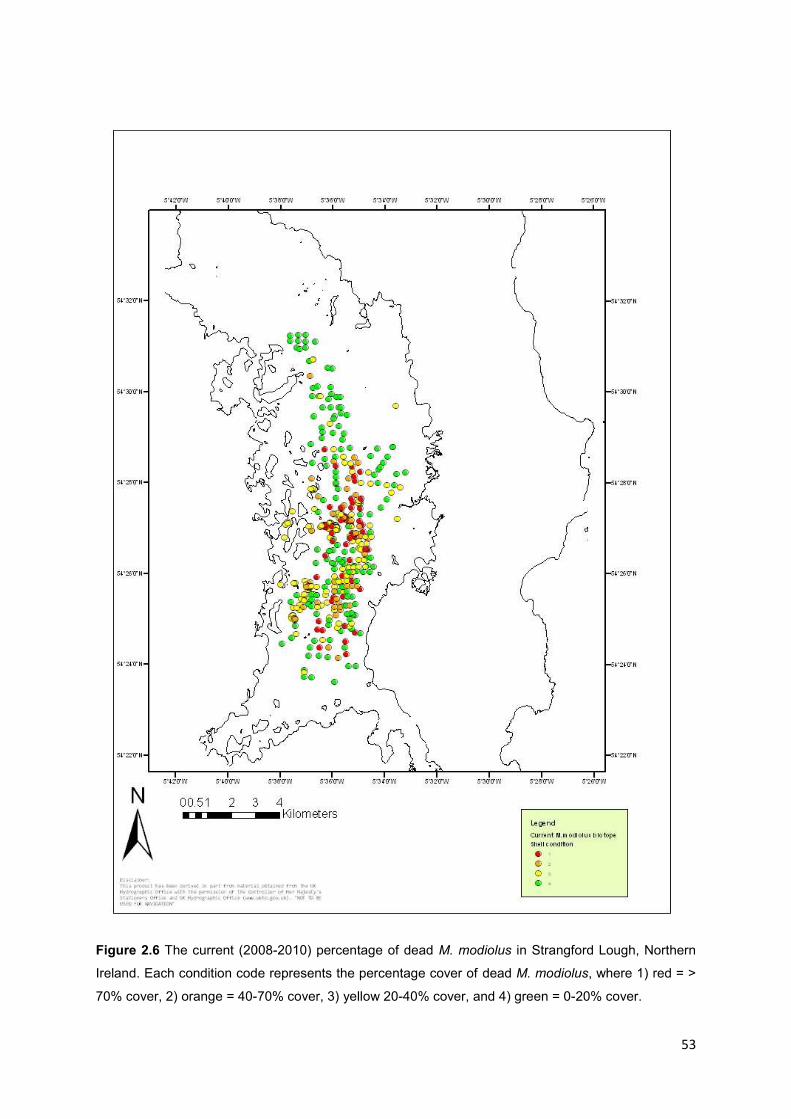
53
Figure 2.6 The current (2008-2010) percentage of dead M. modiolus in Strangford Lough, Northern
Ireland. Each condition code represents the percentage cover of dead M. modiolus, where 1) red = >
70% cover, 2) orange = 40-70% cover, 3) yellow 20-40% cover, and 4) green = 0-20% cover.

54
2.3.4 Historical trends in M. modiolus distribution and densities in
Strangford Lough
The distribution (based on occurrence in 0.5 km grid squares) and the densities of
M. modiolus (mussel m-2 at selected sites) in Strangford Lough have substantially
declined through time (Figures 2.4, 2.7 & 2.8). There appears to have been a major
decline in distribution in the mid 1970s followed by a continuing gradual decline
between 1975 and 1995. Between 1975 and 1995 the distributional extent of M.
modiolus in Strangford Lough declined by over 40%. Distributional records showed
little change between 1995 and 2003 and a slight decline between 2003 and 2010.
Although densities were not recorded at the same sites over time, density data were
available for four sites at different dates (Figure 2.8). Densities at these sites
declined substantially between 1975 and 2003 and further until 2010 (Figure 2.8).
Figure 2.7 Rate of decline of M. modiolus distribution through time. Historical trends
were derived by hindcasting each data set to the previous earlier records showing a
wider distribution. This approach is based on the assumption that a record at a site
at any time forms part of its historical range (Wilson and Roberts 2011) and
generates the plateaus seen in the plot. Diamonds represent the number of 0.5 km
grid squares occupied by M. modiolus.

55
Figure 2.8 The changes in the mean (± SE) number of M. modiolus from 1970 to
2010 (years) at four sites (Bird Island Passage, Black Rocks, Long Sheelah and
West Round Island Passage) in Strangford Lough. The number of quadrats varied
through time (1975 n = 17, 2003 n = 26, 2010 n = 30).
2.4 Discussion
M. modiolus beds in Strangford Lough are well documented (Seed & Brown 1977;
Brown 1984; Erwin et al. 1990; Magorrian & Service 1998; Roberts et al. 2004). In
the mid 1970s M. modiolus beds were found extensively throughout Strangford
Lough (Erwin 1970; Erwin et al. 1986; Erwin et al. 1990). These beds were recorded
at depths between 10 and 40 m, with an average number of 134 individuals per m-2,
and were either continuous (50% cover m-2) or aggregated into discrete clumps (3-6
m-2).
The current research confirms previous reports (Roberts et al. 2004) that the M.
modiolus communities have declined extensively in distribution, density and
condition in Strangford Lough. Over 40 % of the decline occurred between 1975 and
1995, possibly as a result of trawling impact (Service and Magorrian 1997). Current
populations of M. modiolus are largely confined to the centre of Strangford Lough.

56
The average number of M. modiolus has now declined to 3.8 individuals per m2,
which aggregate to form 1-2 discrete clumps m-2. The present data suggest that at
the current rate of decline, this species could become regionally extinct in Strangford
Lough without intervention.
M. modiolus beds can be divided into several community types or biotopes
(Connor et al. 2004). At least three of these biotopes are found in Strangford Lough.
The current research suggests that the M. modiolus beds in the Northern basin
(SS.SBR.SMus.ModCvar biotope) are now confined to the Long Sheelah area, and
are no longer in good condition. Beds of the M. modiolus biotopes
SS.SBR.SMus.ModHAs and SS.SBR.SMus.ModT in the Southern basin are reduced
to four main areas: Black Rock, Craigyouran, Selk Rock, and Round Island Pinnacle.
The Black Rock and Selk Rock areas are also not in good condition. Surveys carried
out by MRRG suggest that the M. modiolus beds in Round Island Pinnacle and
Craigyouran, although not in pristine condition when compared with other U.K. beds,
probably represent the best remaining M. modiolus communities in the Lough.
M. modiolus has been defined as a key indicator species in a number of long term
studies on the impacts of mobile fisheries both in the UK and Canada (Bradshaw et
al. 2002; Kenchington et al. 2007). Side scan sonar surveys in Strangford Lough in
the 1990s suggested that the M. modiolus beds in the Northern basin were
extensively damaged through trawling and dredging for queen scallops (Aequipecten
opercularis) (Service and Magorrian 1997; Magorrian & Service 1998). These
fisheries commenced in the early 1900s but peaked in activity throughout the mid
1980s to late 1990s (Roberts et al. 2004). Impacts of mobile fishing gear include
death or damage of individuals through contact with the gear, or direct removal,
fragmentation of clumps resulting in increased risk of predation (Veale et al. 2000;
Kenchington et al. 2007). Video surveys were used by Service and Magorrian (1997)
to categorise the impact of trawling on M. modiolus communities in Strangford Lough
on a scale from 1 (intact M. modiolus communities showing no impact of trawling) to
5 (heavily impacted). Using this method trawling impact was evident in over 80% and
70% of the areas surveyed in 1990 and 1993 respectively (Service and Magorrian
1997). The categories described by Service and Magorrian (1997) were developed
further in Magorrian and Service (1998) who reported separation of habitat types
using cluster and detrended correspondence analysis. The current study focused on
documenting separately the distribution of areas of different categories of live and

57
dead M. modiolus where natural recovery might be predicted in the medium to longer
term.
Mobile fisheries in Strangford Lough were banned in December 2003. As early as
1997, Service and Magorrian had pointed out that such management of fishing
would give the opportunity to assess recovery of areas impacted by mobile benthic
fishing gear. The current study found no evidence of recovery of M. modiolus
communities. The remaining M. modiolus populations are extensively fragmented in
many areas and still face a number of threats which could limit or prevent their
recovery. These include increases in the temperature due to global climate change,
eutrophication through agricultural inputs, disease and an increase in the intensity of
pot fishing. The current research suggests that M. modiolus populations are still
declining in some areas and further intervention is required.
2.5 Conclusions
The current research has confirmed that M. modiolus beds in Strangford Lough
remain much reduced in extent, density, and condition and suggest that the decline
has not been halted by previous intervention methods. The present study indicates
that the M. modiolus communities at Black Rocks, Long Sheelah and Selk Rock
beds remain in poor condition whereas those at Craigyouran and Round Island
Pinnacle are in good condition. Because M. modiolus is a long-lived species long-
term protection and intervention are required. It is also essential that an annual
monitoring programme is established to record the presence, condition and density
M. modiolus at predetermined locations.

58
3.0 Small-scale temporal and spatial variability in ‘good’
and ‘poor’ M. modiolus reefs (Undertakings 4 and 5)
3.1 Summary
This part of the study aimed to monitor short-term trends in „good‟ and
„poor‟ condition Modiolus modiolus communities in Strangford Lough to
determine whether they are improving or deteriorating over time.
Monitoring included in situ counts of M. modiolus, photography of 0.5 x
0.5m quadrats and total removal sampling using 10 cm diameter cores.
Analysis of in situ counts revealed significantly higher densities of M.
modiolus in„good‟ relative to „poor‟ condition sites.
M. modiolus densities were generally higher in the north basin good and
poor sites than in south basin good and poor sites respectively and did not
change through time.
Analysis of photo-quadrats revealed that, the mean numbers of epifaunal
species in the good and poor sites in the north basin were generally higher
than good and poor sites respectively in the south basin.
Non-metric multidimensional scaling (nMDS) of photo-quadrat data
showed that epifauna in the good condition sites in both the north and
south basins and in the poor condition site in the north remained relatively
stable through time whereas epifauna in the poor condition site in the
south basin varied through time.
Univariate analysis of core samples revealed no clear temporal trends.
However, there were significant differences between the numbers and
abundances of species in core-samples from good and poor sites, from
the north and south basins, and the different sampling times
This part of the study suggests that short-term monitoring is of limited
value in following temporal trends because there are significant interaction
effects and that future monitoring should be carried out no more frequently
than annually to minimise this variability.

59
3.2 Introduction
Modiolus modiolus communities are species rich (Holt et al. 1998; Roberts et al.
2004; Rees et al. 2008; Sanderson et al. 2008) and have a limited distribution in the
UK (Holt et al. 1998). These communities are comprised of the mussels themselves,
the epifauna attached to the mussels, infauna in the interconnecting byssal network,
and in biogenic sediments generated by the mussels, vagile epifauna and predators
(Roberts 1975; Brown 1989). Because of their high biodiversity (Roberts 1975; Mair
et al. 2000; Roberts et al. 2004; Moore et al. 2006; Rees et al. 2008; Sanderson et
al. 2008) Modiolus communities have been identified as important features in Special
Areas of Conservation and as a priority habitat by the Oslo Paris Commission
(OSPAR). However, some M. modiolus beds have been degraded or destroyed by
mobile fishing gear (Service & Magorrian 1997; Veale et al. 2001; Roberts et al.
2004).
The M. modiolus beds in Strangford Lough, Northern Ireland have a high diversity
of associated fauna (>270 taxa) (Roberts 1975; Erwin et al. 1990; Roberts et al.
2004). Three M. modiolus biotopes are found in Strangford Lough (Section 2.4).
Surveys in the 1990s and 2000s suggested that M. modiolus beds in Strangford
Lough were extensively damaged by mobile fishing gear, particularly in the northern
basin (Service & Magorrian 1997). To address this problem the Department of
Agriculture and Rural Development of Northern Ireland (DARD) introduced a ban on
the use of mobile fishing gear in Strangford Lough in 2004.
The aim of this part of the project was to monitor the temporal trends in „good‟ and
„poor‟ condition M. modiolus sites (Figure 3.1) in the north and south basins after the
introduction of the ban.
Specific objectives were to:
Monitor the temporal trends in „good‟ condition M. modiolus reefs.
(Undertaking 4)
Assess the potential for natural recovery within poor condition M. modiolus
reefs. (Undertaking 5)

60
Figure 3.1 Photographs of (A) north poor condition site (B), north good condition site
(C), south poor condition site and (D) south good condition site from January 2010.
3.3 Methods
3.3.1 Site characteristics
Photographic and core samples were used to monitor short-term temporal trends
in good and poor condition M. modiolus communities, in the north and south basin of
Strangford Lough. The sites chosen for the surveys in the north basin were north
east of Long Sheelah and for the south basin the area east of Black Rocks (Figure
3.2).
For the purposes of the present study in Strangford Lough, „good‟ condition M.
modiolus reefs were defined as sites with ≥ 5 individuals, and ≥ 1 clump m-2 and
„poor‟ condition M. modiolus reefs were defined as sites with < 5 individuals, and < 1
clump m-2. Locating the good condition M. modiolus sites proved very difficult and
time consuming and hence sampling times differed at the survey sites (see section
3.3.2. below for details). Because of the patchy nature of the M. modiolus
communities, quadrats without live individuals of M. modiolus but within its historical
range in the good and poor condition sites were also monitored during the surveys.
A
C D
B
B

61
Sites were characterised by soft substrata with varying proportions of shell
fragments. The sampling was conducted at 20-28 metres depth. During the survey
period the sea surface temperature, salinity and turbidity varied between 3 - 18° C,
26 - 34 PSU (Practical Salinity Units) and 0 - 0.8 FTU (Formazin Turbidity Unit )
respectively in the northern basin (AFBI Station ID SL03) (AFBI 2011).
Figure 3.2 Location of the good and poor condition sites in the north basin and south
basins in Strangford Lough. The sites chosen for the surveys in the north basin were
north east of Long Sheelah and for the south basin the area east of Black Rocks. NG
= north good site; NP = north poor site; SG = south good site; SP = south poor site.
62
3.3.2 Sampling strategy
At each survey site, permanent markers were established using surface and sub-
surface buoys. A 30 x 30 m area around these markers was sampled, using a
randomly generated table of fin kicks and compass bearings. The divers were guided
from the buoys to these positions using through water communications and the
Sonardyne Ultra Shortwave Baseline Location (USBL) beacon relay.
Monitoring of the sites involved both photo quadrats and removal sampling using
cores.
3.3.3 Monitoring undisturbed communities and densities of M.
modiolus: photo quadrats and in situ counts
To sample the undisturbed communities at each survey site divers took 15
replicate overhead photographs of 0.5 x 0.5 m quadrats using a Nikon D60, Nikkor
12-24 mm lens and 2 x Ikelite D125 strobes and where possible oblique photographs
were also taken. The numbers of live adult M. modiolus (≥ 5 cm) in each quadrat
were then counted in situ. The macrofauna present in undisturbed photoquadrats
were identified from notes in the field and photo analyses in the laboratory. All photo
analyses were checked by a second observer. The good condition, north basin; poor
condition, north basin; and poor condition south basin; were surveyed on four
occasions, (June 2008, January 2009, June 2009, January 2010), and the good
condition, south basin site was surveyed on three occasions (January 2009, June
2009, January 2010).
3.3.4 Monitoring of M. modiolus epifauna, crevice and sediment
infauna: core sampling
To undertake more detailed sampling of the epifauna and crevice and sediment
infauna, divers hammered a plastic corer of 10 cm diameter, 10-15 cm into the
sediment, in the centre of the 0.5 x 0.5 m quadrat. The contents of the core were
carefully transferred into a plastic bag. All samples were returned to the laboratory,
washed, sieved (1 mm mesh), identified and counted. Fifteen core samples were
C D C D

63
taken from all sites surveyed in January 2009 and from good and poor condition
sites in the north basin in June 2009. However, due to time constraints, the number
of replicates was reduced to 10 core samples in the good and poor condition south
basin sites in June 2009.
3.3.5 Analyses
The changes in the density of M. modiolus and the number and abundances of
species in the good and poor condition reefs through time were analysed using 3-
way ANOVAs. The model included the main effects of condition (fixed, 2 levels =
good and poor), basin (fixed, 2 levels = north basin and south basin) and time (fixed,
4 levels = June 08, January 09, June 09 and January 10 months for photographs or
2 levels = January 09 and June 09 months for cores). Boxcox plots were used to
determine the appropriate transformation to stabilize variances, and transformed
data were checked for both normality (using normal probability plots) and
homoscedasticity. Variables that were transformed are expressed in terms of the
untransformed variable Y. All univariate statistical analyses and graphics and
multivariate graphics were produced using the R statistical software (www.R-
project.org). The changes in benthic community structure in the good and poor
condition sites through time were analysed using a 3-way PERMANOVA calculated
from a Bray-Curtis similarity matrix based on species presence/absence. These data
were plotted using non-metric multidimensional scaling (nMDS) ordinations. Where
significant differences were found, similarity percentage (SIMPER) analyses were
used to see which taxa contributed the most to the dissimilarity. All multivariate
statistical analyses were undertaken using the Primer 6.0 software with the
PERMANOVA extension (Clarke & Warwick 2001; Anderson et al. 2008).

64
3.4 Results
3.4.1 Density of M. modiolus: in situ counts
The mean densities of M. modiolus were significantly higher in the good condition
sites than the poor condition sites through time (Table 3.1& Figure 3.3). With the
exception of surveys conducted in January 2009, mean densities of M. modiolus in
the good and poor condition north basin sites were higher through time than in good
and poor condition sites respectively in the south basin (Table 3.1& Figure 3.3).
There were no significant temporal differences in the densities of M. modiolus in
good and poor sites in either basin and no significant interaction effects (Table 3.1).
Table 3.1 Results of 3-way ANOVA testing the effect of condition and area on the
density of M. modiolus through time from in situ counts (n = 15) in Strangford Lough.
Significant p-values are shown in bold.
Factors df Mean squares f-value p-value
Condition 1 215.88 435.12 <0.001
Basin 1 22.86 46.4 <0.001
Time 3 0.77 1.56 >0.05
Condition x Basin 1 6.36 12.92 <0.001
Condition x Time 1 1.18 2.39 >0.05
Basin x Time 3 0.70 1.43 >0.05
Condition x Time x Basin 3 0.14 0.29 >0.05
Error 42 0.49

65
Figure 3.3 Mean density (±SE) of M. modiolus through time (months) based on in
situ counts in 0.25 x 0.25 m quadrats (n = 15). Codes are: GN = good condition,
north basin; PN = poor condition, north basin; GS = good condition, south basin; PS
= poor condition, south basin.
3.4.2 Photo quadrat monitoring of undisturbed communities
In total 25 epifaunal species were identified from the photo quadrat analysis and
field notes. Mean numbers of epifauna recorded in photo quadrats showed
significant differences between good and poor sites, between the north and south
basins and through time (Table 3.2 and Figure 3.4). In general, the mean numbers of
epifaunal species in the good and poor sites in the north basin were higher than
good and poor sites respectively in the south basin (Figure 3.4).
0
2
4
6
8
10
12
14
16
18
20
0 6 12 18
GN
PN
GS
PS
Me
an
num
ber
of M
. m
odio
lus (
± S
E)
Jun-08 Jan-09 Jun-09 Jan-10

66
Table 3.2 Results of 3-way ANOVA testing the differences in the number of
macrofauna in good and poor sites in the north and south basin through time in
Strangford Lough, using photoquadrats (n = 15). Significant p-values are shown in
bold.
Factors df Mean squares f-value p-value
Condition 1 5.678 21.389 <0.001
Basin 1 44.213 166.555 <0.001
Time 3 3.260 12.281 <0.001
Condition x Basin 1 4.175 15.723 <0.001
Condition x Time 3 0.785 2.846 > 0.05
Basin x Time 3 1.624 6.118 <0.001
Condition x Time x Area 3 0.365 1.376 >0.05
Error 210 0.265
Figure 3.4 Mean (±SE) numbers of epifaunal species through time (months) based
on 0.5 x 0. 5 m photo quadrats (n = 15). Codes are: GN = good condition, north
basin; PN = poor condition, north basin; GS = good condition, south basin; PS = poor
condition, south basin.
There were significant differences in epifaunal species composition between
communities in the good and poor sites, between the north and south basins, and
through time (Table 3.3 and Figure 3.5). The nMDS plot showed that the epifauna in
the good condition sites in both the north and south basins and in the poor condition
site in the north remained relatively stable through time. In contrast, the epifauna in
0
1
2
3
4
5
6
1 2 3 4
Me
an
num
be
r of
spe
cie
s (
±S
E)
Time (months)
GN
GS
PN
PS
Jun-08 Jan-09 Jun-09 Jan-10

67
the poor condition site in the south basin showed no predictable patterns through
time (Figure 3.5).
Table 3.3 Results of 3-way PERMANOVA testing the differences in the macrofauna
community structure between good and poor sites, in the north and south basin and
through time using 0.5 x 0.5 m photo quadrats (n=15). Significant p-values are
shown in bold.
Factors df Mean squares f-value p-value
Condition 1 25098 20.565 0.001
Basin 1 36565 58.026 0.001
Time 3 11362 9.310 0.001
Condition x Basin 1 9474.7 7.764 0.001
Condition x Time 3 7597.8 6.226 0.001
Basin x Time 3 868.74 0.712 >0.05
Condition x Time x Basin 3 2383.5 3.7825 0.014
Error 153 630.14
B
B

68
Figure 3.5. A) nMDS ordination of the temporal changes in epifauna recorded in 0.5
x 0.5 m photo quadrats in good and poor M. modiolus reefs (n = 15) in Strangford
Lough, Northern Ireland. Codes are: upright green triangles (1) = June 08, downward
dark blue triangles (2) = January 09, light blue squares (3) = June 09, red diamonds
(4) = January 10; GN = good condition, north basin; PN = poor condition, north
basin; GS = good condition, south basin; PS = poor condition, south basin. The
analysis is based on a Bray-Curtis matrix of presence/absence data. Sites from the
poor condition sites show greatest spread on this nMDS plot. The encircled area in
the centre of the plot contains the tightly clumped good condition sites. The cloud
has been expanded and is represented in image B); Codes are: upright green
triangles = north basin; downward blue triangles = south basin; (1) = June 08, (2) =
January 09, (3) = June 09, (4) = January 10. The analysis is based on a Bray-Curtis
matrix of presence/absence data.

69
A
B

70
SIMPER analysis showed that 6 species contributed most to the differences
observed between good and poor sites in the north and south basins (Table 3.3).
The north and south basin good condition sites were characterised by a high
frequency of occurrence of Antedon bifida, Ophiocomina nigra, and Thyone spp.
relative to the poor condition sites (Table 3.4). There was higher frequency of
occurrence of all macrofauna in both the good and poor condition sites in the north
basin than either site in the south basin (table 3.4).
Table 3.4 SIMPER analyses showing the macro-epifauna species contributing to
70% of the dissimilarity within and between the good and poor condition sites in the
north and south basins of Strangford Lough, using 0.5 x 0.5 m photo quadrats (n =
15).
North basin: Good vs Poor condition Average similarity = 55.48
Good condition Average frequency of occurrence
Poor condition Average frequency of occurrence
Cumulative (%)
Modiolus modiolus 0.97 0.53 18.47
Ophiocomina nigra 0.69 0.63 34.33
Antedon bifida 0.69 0.82 49.70
Ascidiella aspersa 0.29 0.07 63.47
Crisia spp. 0.25 0.07 63.47
Thyone spp. 0.20 0.10 70.19
South basin: Good vs. Poor Average dissimilarity = 72.72
Good condition Average frequency of occurrence
Poor condition Average frequency of occurrence
Cumulative (%)
Modiolus modiolus 0.85 0.38 32.67
Antedon bifida 0.39 0.32 47.62
Ophiocomina nigra 0.39 0.32 61.10
Ascidiella aspersa 0.24 0.05 66.80
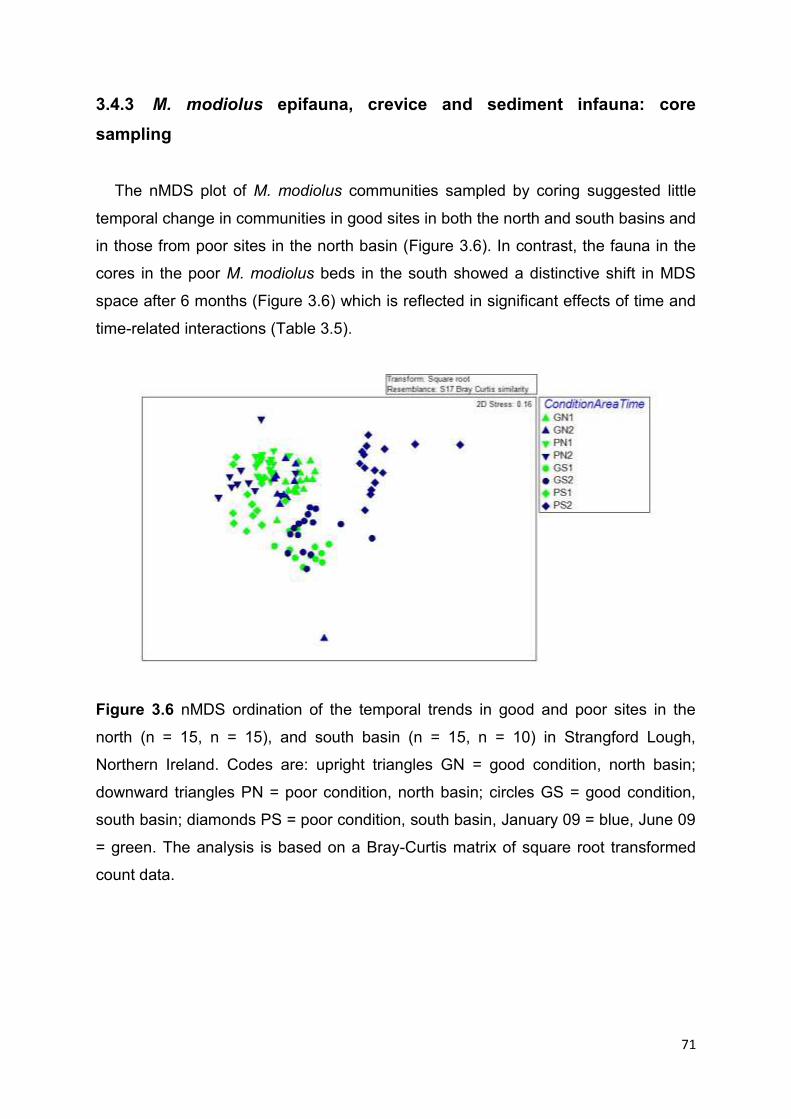
71
3.4.3 M. modiolus epifauna, crevice and sediment infauna: core
sampling
The nMDS plot of M. modiolus communities sampled by coring suggested little
temporal change in communities in good sites in both the north and south basins and
in those from poor sites in the north basin (Figure 3.6). In contrast, the fauna in the
cores in the poor M. modiolus beds in the south showed a distinctive shift in MDS
space after 6 months (Figure 3.6) which is reflected in significant effects of time and
time-related interactions (Table 3.5).
Figure 3.6 nMDS ordination of the temporal trends in good and poor sites in the
north (n = 15, n = 15), and south basin (n = 15, n = 10) in Strangford Lough,
Northern Ireland. Codes are: upright triangles GN = good condition, north basin;
downward triangles PN = poor condition, north basin; circles GS = good condition,
south basin; diamonds PS = poor condition, south basin, January 09 = blue, June 09
= green. The analysis is based on a Bray-Curtis matrix of square root transformed
count data.
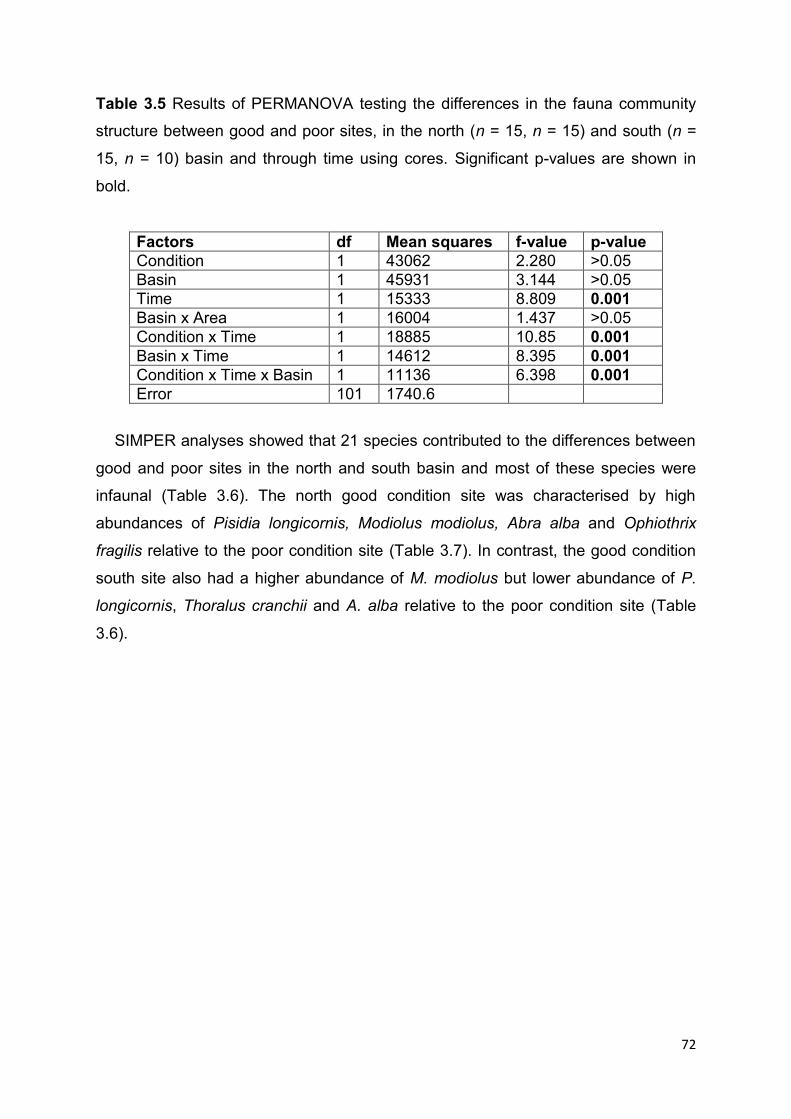
72
Table 3.5 Results of PERMANOVA testing the differences in the fauna community
structure between good and poor sites, in the north (n = 15, n = 15) and south (n =
15, n = 10) basin and through time using cores. Significant p-values are shown in
bold.
Factors df Mean squares f-value p-value
Condition 1 43062 2.280 >0.05
Basin 1 45931 3.144 >0.05
Time 1 15333 8.809 0.001
Basin x Area 1 16004 1.437 >0.05
Condition x Time 1 18885 10.85 0.001
Basin x Time 1 14612 8.395 0.001
Condition x Time x Basin 1 11136 6.398 0.001
Error 101 1740.6
SIMPER analyses showed that 21 species contributed to the differences between
good and poor sites in the north and south basin and most of these species were
infaunal (Table 3.6). The north good condition site was characterised by high
abundances of Pisidia longicornis, Modiolus modiolus, Abra alba and Ophiothrix
fragilis relative to the poor condition site (Table 3.7). In contrast, the good condition
south site also had a higher abundance of M. modiolus but lower abundance of P.
longicornis, Thoralus cranchii and A. alba relative to the poor condition site (Table
3.6).
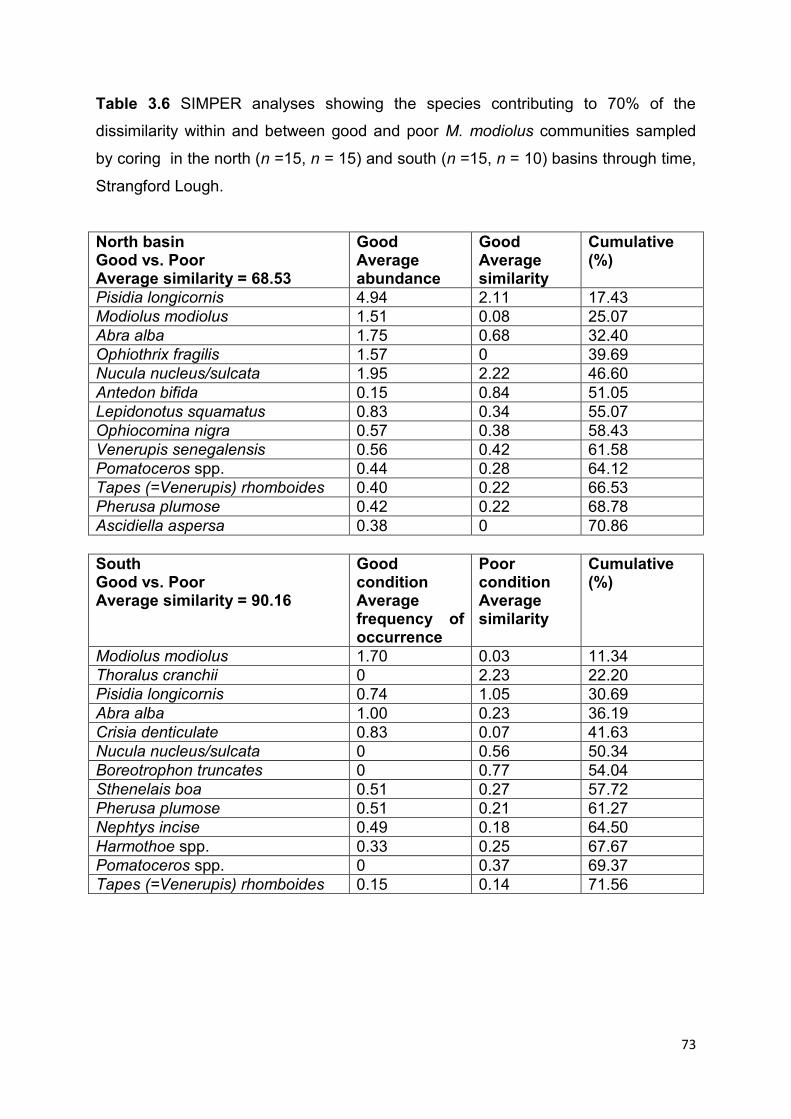
73
Table 3.6 SIMPER analyses showing the species contributing to 70% of the
dissimilarity within and between good and poor M. modiolus communities sampled
by coring in the north (n =15, n = 15) and south (n =15, n = 10) basins through time,
Strangford Lough.
North basin Good vs. Poor Average similarity = 68.53
Good Average abundance
Good Average similarity
Cumulative (%)
Pisidia longicornis 4.94 2.11 17.43
Modiolus modiolus 1.51 0.08 25.07
Abra alba 1.75 0.68 32.40
Ophiothrix fragilis 1.57 0 39.69
Nucula nucleus/sulcata 1.95 2.22 46.60
Antedon bifida 0.15 0.84 51.05
Lepidonotus squamatus 0.83 0.34 55.07
Ophiocomina nigra 0.57 0.38 58.43
Venerupis senegalensis 0.56 0.42 61.58
Pomatoceros spp. 0.44 0.28 64.12
Tapes (=Venerupis) rhomboides 0.40 0.22 66.53
Pherusa plumose 0.42 0.22 68.78
Ascidiella aspersa 0.38 0 70.86
South Good vs. Poor Average similarity = 90.16
Good condition Average frequency of occurrence
Poor condition Average similarity
Cumulative (%)
Modiolus modiolus 1.70 0.03 11.34
Thoralus cranchii 0 2.23 22.20
Pisidia longicornis 0.74 1.05 30.69
Abra alba 1.00 0.23 36.19
Crisia denticulate 0.83 0.07 41.63
Nucula nucleus/sulcata 0 0.56 50.34
Boreotrophon truncates 0 0.77 54.04
Sthenelais boa 0.51 0.27 57.72
Pherusa plumose 0.51 0.21 61.27
Nephtys incise 0.49 0.18 64.50
Harmothoe spp. 0.33 0.25 67.67
Pomatoceros spp. 0 0.37 69.37
Tapes (=Venerupis) rhomboides 0.15 0.14 71.56

74
In total, 79 species were recorded in the core samples. Species numbers and
abundances were highly variable and showed no clear patterns. Overall there were
significant differences between the numbers and abundances of species in core-
samples from good and poor sites, from the north and south basins, and the different
sampling times (Figures 3.7 & 3.8 and Tables 3.7 & 3.8).
The mean numbers of species in both the good and poor condition sites in the
north basin were lower in June 2009 than in January 2009, (fig. 3.7). In contrast, the
mean numbers of species in both the good and poor condition sites in the south
basin were lower in January 2009 than in June 2009 (fig. 3.7). These differences
could partly be explained by the high spatial seasonal variability in infaunal species.
Figure 3.7 Mean number (±SE) of fauna in good and poor condition sites in north (n
=15, n =15) and south basins (n =15, n =10) in cores through time (months). Codes
are: GN = good condition, north basin; PN = poor condition, north basin; GS = good
condition, south basin; PS = poor condition, south basin.
0
2
4
6
8
10
12
14
6
Me
an
nu
mb
er
of sp
ecie
s
(± S
E)
Time (months)
GN
PN
GS
PS
Jan-09 Jun-09

75
Table 3.7 Results of 3-way ANOVA testing the differences in the number of fauna in
cores in good and poor M. modiolus reefs in the north (n =15, n =15) and south basin
(n =15, n =10) through time in Strangford Lough. Significant p-values are shown in
bold.
Factors df Mean squares f-value p-value
Condition 1 4.1532 17.8990 <0.001
Basin 1 1.9298 8.3167 <0.001
Time 1 0.2086 0.8988 >0.05
Condition x Basin 1 0.8068 3.4771 >0.05
Condition x Time 1 0.1321 0.5693 >0.05
Basin x Time 1 7.1427 30.7826 <0.001
Condition x Time x Basin 1 0.0066 0.0284 >0.05
Error 101 0.2320
There were significantly lower mean abundances of species in good condition
sites in the north basin and both the good and poor condition sites in the south basin
in January 2009 than in June 2009, (Figure 3.8 and Table 3.8). In contrast, the mean
abundances of species were significantly higher in the poor condition site in the north
in January 2009 than in June 2009 (Figure 3.8 and Table 3.8).
Figure 3.8 Mean abundances (± SE) of fauna in cores in good and poor condition
sites in the north (n = 15, n = 15) and south basins (n =15, n = 10) through time
(months). Codes are: GN = good condition, north basin; PN = poor condition, north
basin; GS = good condition, south basin; PS = poor condition, south basin.
0
10
20
30
40
50
60
70
6 Me
an
ab
un
da
nce
s o
f sp
ecie
s
(± S
E)
Time (months)
GN
PN
GS
PS
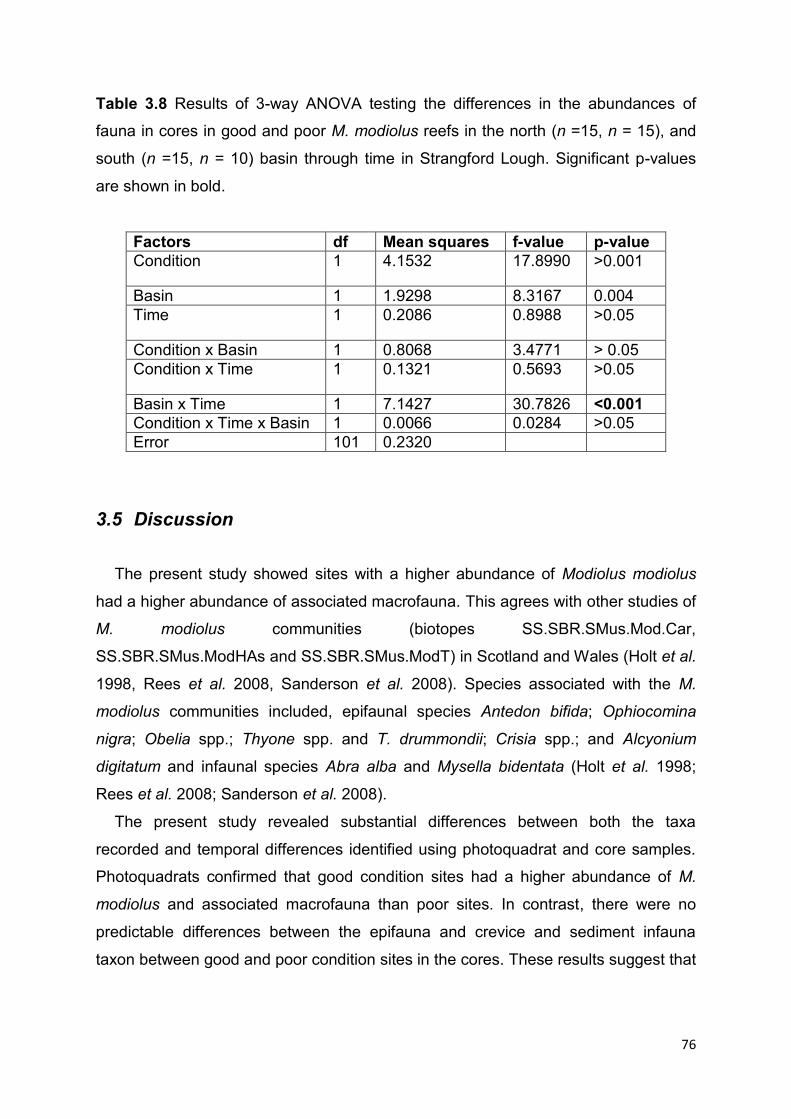
76
Table 3.8 Results of 3-way ANOVA testing the differences in the abundances of
fauna in cores in good and poor M. modiolus reefs in the north (n =15, n = 15), and
south (n =15, n = 10) basin through time in Strangford Lough. Significant p-values
are shown in bold.
Factors df Mean squares f-value p-value
Condition 1 4.1532 17.8990 >0.001
Basin 1 1.9298 8.3167 0.004
Time 1 0.2086 0.8988 >0.05
Condition x Basin 1 0.8068 3.4771 > 0.05
Condition x Time 1 0.1321 0.5693 >0.05
Basin x Time 1 7.1427 30.7826 <0.001
Condition x Time x Basin 1 0.0066 0.0284 >0.05
Error 101 0.2320
3.5 Discussion
The present study showed sites with a higher abundance of Modiolus modiolus
had a higher abundance of associated macrofauna. This agrees with other studies of
M. modiolus communities (biotopes SS.SBR.SMus.Mod.Car,
SS.SBR.SMus.ModHAs and SS.SBR.SMus.ModT) in Scotland and Wales (Holt et al.
1998, Rees et al. 2008, Sanderson et al. 2008). Species associated with the M.
modiolus communities included, epifaunal species Antedon bifida; Ophiocomina
nigra; Obelia spp.; Thyone spp. and T. drummondii; Crisia spp.; and Alcyonium
digitatum and infaunal species Abra alba and Mysella bidentata (Holt et al. 1998;
Rees et al. 2008; Sanderson et al. 2008).
The present study revealed substantial differences between both the taxa
recorded and temporal differences identified using photoquadrat and core samples.
Photoquadrats confirmed that good condition sites had a higher abundance of M.
modiolus and associated macrofauna than poor sites. In contrast, there were no
predictable differences between the epifauna and crevice and sediment infauna
taxon between good and poor condition sites in the cores. These results suggest that

77
the structure of M. modiolus clumps can have very different influences on epifauna
and infauna.
Like other studies on M. modiolus communities (Rees et al. 2008; Sanderson et
al. 2008) the present study found high spatial and temporal variability in the fauna
recorded from photoquadrats and cores. In general, good condition sites remained
much more stable through time relative to poor condition sites. The poor condition
site in the south basin, which had the lowest density of M. modiolus and mean
number of epifaunal species, showed the greatest variability in community structure
through time. The variation in fauna probably reflects the high variation in the
differences between samples with and without M. modiolus clumps within the plots.
Epifaunal diversity was significantly higher in the north than in the south basin.
This difference reflects differences between M. modiolus biotopes,
SS.SBR.SMus.ModCvar in the north is characteristically more species rich than and
SS.SBR.SMus.ModHAs and SS.SBR.SMus.ModT in the south. These differences
reflect environmental differences between the two basins (Roberts et al. 2004).
The number of macrofaunal taxa recorded in the present study using photo
quadrats was similar to that reported by Magorrian and Service (1998). The major
difference was the complete absence of Chlamys varia and Aequipecten opercularis
and the lower abundances of Alcyonium digitatum in our photographs compared with
those taken in previous surveys by Erwin et al. (1986) and Magorrian & Service
(1998). These differences indicate that the impacted communities, even at the better
sites, have not yet fully recovered.
During the present study there were no detectable changes in the densities of M.
modiolus or its associated fauna in either good or poor condition sites which
suggests that temporal monitoring during this project has not been carried out long
enough for changes to be picked up. Studies on Modiolus communities in New
Zealand and Canada suggest they may take decades to recovery from
anthropogenic impacts (Cranfield et al. 2004; Kenchington et al. 2007). To better
understand natural recovery rates and species succession in M. modiolus
communities future monitoring should be carried out on targeted sites and no more
frequently than at annual intervals, to minimise seasonal variability.

78
4.0 Potential for natural recovery of M. modiolus
communities (Undertaking 6)
4.1 Summary
In 2003, the Modiolus modiolus communities in Strangford Lough were
surveyed in various historical sites in the north and south basins to sample the
M. modiolus with Chlamys varia, biotope (code SS.SBR.SMus.ModCvar) and
the M. modiolus with hydroids biotope (SS.SBR.SMus.ModHAs) in the north
and south basins respectively. Samples were compared using dive and video
transects and by detailed analysis of samples removed from 0.25m2 quadrats.
In this part of the current project surveys were repeated in 2010 using the
same methodology and at the same sites, as far as was possible, to
determine the long term potential for natural recovery of M. modiolus
communities.
In the north basin sites there have been further declines in the density and
frequency of occurrence of M. modiolus, relative to 2003 surveys.
In the south basin there have been further declines in the density of M.
modiolus, but increases in the frequency of occurrence of M. modiolus
suggesting greater fragmentation of the biotope, relative to 2003 surveys.
There was a decrease in the mean number of species and Shannon‟s and
Pielou‟s diversity indices between 2003 and 2010 in the north basin.
There was an increase in the mean number of species but no clear
differences in Shannon‟s and Pielou‟s diversity indices between 2003 and
2010 in the south basin.
This part of the study suggests that the biotope in the north basin continues to
decline in condition, whereas the biotope in the south basin appears to show
increased fragmentation although some good condition sites remain.

79
4.2 Introduction
In the 1950s, M. modiolus was reported to be „commonly dredged in many
localities in the Lough‟ (Williams 1954). The M. modiolus communities in Strangford
Lough were first described in the early 1970s and 1980s (Roberts 1975; Erwin
1986). Surveys and removal sampling during this time identified two main
communities, Modiolus modiolus with Chlamys varia, sponges, hydroids and
bryozoans biotope (code SS.SBR.SMus.ModCvar) in the north basin with 90
associated species (Brown and Seed, 1977; Erwin et al. 1990) and M. modiolus with
hydroids and large solitary ascidians in the south basin (SS.SBR.SMus.ModHAs),
with 84 associated species (Roberts 1975; Erwin et al. 1990). The focus of these
surveys was to document the dominant species on the M. modiolus communities in
Strangford Lough (Roberts 1975) and to map their distribution (Erwin et al. 1990).
Side scan sonar surveys in the 1990s suggested that M. modiolus communities in
Strangford Lough had been damaged by mobile fishing gear (Magorrian et al. 1995;
Service and Magorrian 1997; Magorrian and Service 1998). However, surveys and
removal sampling of M. modiolus communities in 2003 recorded higher numbers of
species in the SS.SBR.SMus.ModCvar biotope than previous surveys and similar
numbers on the SS.SBR.SMus.ModHAs biotope (Roberts 1975; Roberts et al.
2004). These differences are likely to be explained by a number of factors including
improved taxonomic skills, and increased sampling effort. The use of mobile fishing
gear in Strangford Lough was banned by DARD in 2003. Because the decline in the
distribution and density of M. modiolus has continued in some areas (Section 2) and
communities showed no clear short-term trends (Section 3) the current frequency of
occurrence and density of M. modiolus and species composition of M. modiolus
biotopes was compared with those recorded in 2003 during the Strangford Lough
Environmental Change Investigation (SLECI). During the current project, surveys
were repeated at the same sites sampled by SLECI in 2003. Data were also
compared with surveys undertaken in 2007 at other sites by NIEA and the Ulster
Museum. It was considered that this gave the greatest opportunity to pick up
potential recovery of M. modiolus communities after the trawling ban was introduced
in December 2003.

80
The aim of this part of the project was to assess the potential for natural recovery
of impacted M. modiolus communities in Strangford Lough by comparing data from
MRRG surveys with those reported in SLECI (Roberts et al. 2004). Specific objective
were to:
Investigate changes in the frequency of occurrence of M. modiolus between
2003 and 2010, using video surveys.
Investigate changes in community structure in M. modiolus biotopes, between
2003 and 2007, using video surveys.
Investigate changes in the density of mussels and community structure in M.
modiolus biotopes between 2003 and 2010, using removal quadrat sampling.
4.3 Methods
4.3.1 Transect surveys – Changes in frequency of occurrence of M.
modiolus between 2003 and 2010
In 2010, 100 m transect surveys were undertaken by divers to monitor the
temporal changes in the frequency of occurrence of M. modiolus. The surveys were
conducted at 10 sites previously surveyed in 2003 (Roberts et al. 2004; Figure 4.1):
Green Island, Jane‟s Rock, south Hadd Rock 1, south Hadd Rock 2, south Hadd
rock 3, north west Long Sheelah, Scott‟s Hole, Black Rocks, west Round Island
Pinnacle and Slave Rock (Figure 4.1). At each site, a lead line transect rope was
deployed using concrete blocks and shot lines. Two divers descended the shotline;
one diver took notes on presence and absence of live M. modiolus at 5 m intervals
along the transect, while the other diver took photographs. All photos were viewed by
a minimum of two observers to ensure consistency of species identification and
estimates of abundances. Due to differences in methodology these surveys of
epifauna were only used to make in situ observations. Three replicates were taken at
each site in 2010; in 2003 surveys were not replicated. This was essentially the
same sampling strategy used in 2003 except that the current surveys involved
greater replication.
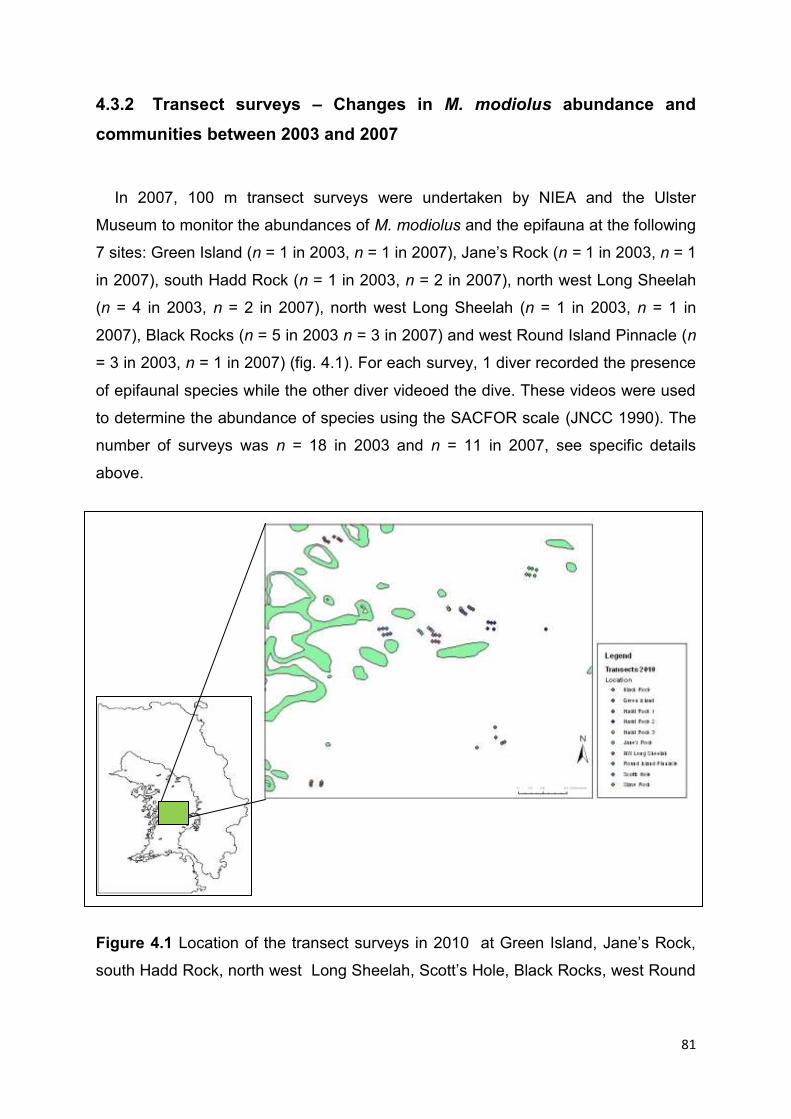
81
4.3.2 Transect surveys – Changes in M. modiolus abundance and
communities between 2003 and 2007
In 2007, 100 m transect surveys were undertaken by NIEA and the Ulster
Museum to monitor the abundances of M. modiolus and the epifauna at the following
7 sites: Green Island (n = 1 in 2003, n = 1 in 2007), Jane‟s Rock (n = 1 in 2003, n = 1
in 2007), south Hadd Rock (n = 1 in 2003, n = 2 in 2007), north west Long Sheelah
(n = 4 in 2003, n = 2 in 2007), north west Long Sheelah (n = 1 in 2003, n = 1 in
2007), Black Rocks (n = 5 in 2003 n = 3 in 2007) and west Round Island Pinnacle (n
= 3 in 2003, n = 1 in 2007) (fig. 4.1). For each survey, 1 diver recorded the presence
of epifaunal species while the other diver videoed the dive. These videos were used
to determine the abundance of species using the SACFOR scale (JNCC 1990). The
number of surveys was n = 18 in 2003 and n = 11 in 2007, see specific details
above.
Figure 4.1 Location of the transect surveys in 2010 at Green Island, Jane‟s Rock,
south Hadd Rock, north west Long Sheelah, Scott‟s Hole, Black Rocks, west Round

82
Island Pinnacle, and Slave Rock Strangford Lough. Sites were originally surveyed in
SLECI 2003 and in 2007 by NIEA and the Ulster Museum.
4.3.3 Removal quadrats – Changes in M. modiolus densities and
communities between 2003 and 2010
To investigate changes in the densities of M. modiolus and community structure in
M. modiolus biotopes, 2 divers collected all mussels and underlying sediment
samples from 5 randomly thrown 0.5 x 0.5 m quadrats in M. modiolus communities,
at 4 sites: south Hadd Rock, north west Long Sheelah, Black Rocks and west Round
Island Pinnacle (Figure 4.2). These sites were chosen based on sites sampled in
2003 (Figure 4.2, Roberts et al. 2004) and to include both SS.SBR.SMus.ModCvar
and SS.SBR.SMus.ModT) biotopes.
All samples were collected by shovelling the mussels and sediment (~100 mm
depth) into 1 mm mesh bags. These bags were sent to the surface using lift bags
and transported to the laboratory in seawater. At the laboratory, the samples were
fixed in 4% formalin for 48h, after which they were washed through a 1mm sieve.
Fauna were sorted into major phyla and preserved in 70% ethanol. All taxa were
identified to species level where possible and counted. All these samples have been
retained as a voucher collection which will be retained by Queen‟s University until
they can be accessioned to the Ulster Museum collections.

83
Figure 4.2 Location of the removal quadrats at south Hadd Rock, north east Long
Sheelah, Black Rocks and west of Round Island Pinnacle in Strangford Lough
surveyed during the present study.
4.3.4 Analyses
4.3.4.1 Transect surveys – Changes in frequency of occurrence of M. modiolus
between 2003 and 2010
The presence live M. modiolus at 5 m intervals were converted to percentage
occurrence of mussels along the 100 m transects. Differences in frequency of
occurrence of M. modiolus between 2003 and 2010 were analysed using a 2-way
ANOVA. The model included the main effects of time (fixed, 2 levels = 2003 and
2010), and site (fixed, 10 levels = Green Island, Jane‟s Rock, south Hadd Rock 1,
south Hadd Rock 2, south Hadd rock 3, north west Long Sheelah, Scott‟s Hole,
Black Rocks, west Round Island Pinnacle and Slave Rock).

84
4.3.4.2 Transect surveys – Changes in community structure in M.
modiolus biotopes between 2003 and 2007
The SACFOR estimates of M. modiolus and epifaunal abundances along the 100
m transect were converted to numbers using the mean from the JNCC SACFOR
tables. These data were log10(x+1) transformed to minimise the errors introduced by
estimating abundances. Changes in the mean abundances and number of epifaunal
taxa were analysed using 2-way ANOVAs. The model included the main effects of
time (fixed, 2 levels = 2003 and 2007) and site (fixed, 2 levels = north basin
SS.SBR.SMus.ModCvar and south basin SS.SBR.SMus.ModHAs). The changes in
the epifaunal communities through time were analysed using PERMANOVA (model
details above) calculated from a Bray-Curtis similarity matrix. All rare species found
in < 1% of the samples were excluded from the analyses, and all species difficult to
identify were pooled to the level of genera. These data were plotted using non-metric
multidimensional scaling (nMDS) ordinations. Where significant differences were
found similarity percentage (SIMPER) analyses were used to see which taxa
contributed the most to the dissimilarity.
4.3.4.3 Removal quadrats – Changes in M. modiolus densities and
communities between 2003 and 2010
Differences in the density of M. modiolus, and numbers of epifaunal, crevice and
sediment infaunal taxa at different sampling times were analysed using 2-way
ANOVAs. The model included the main effects of time (fixed, 2 levels = 2003 and
2010), and sites (fixed, 4 levels = south Hadd Rock, north west Long Sheelah, Black
Rocks and west Round Island Pinnacle). Temporal changes in communities were
analysed using PERMANOVA (model details above) calculated from a Bray-Curtis
similarity matrix based on species presence/absence data. All rare species found in
< 1% of the samples were excluded from the analyses and all species difficult to
identify in the field were pooled to the level of genera. These data were plotted using
non-metric multidimensional scaling (nMDS) ordinations. Where significant
differences were found similarity percentage (SIMPER) analyses were used to see
which taxa contributed the most to the dissimilarity.

85
For all univariate analyses, boxcox plots were used to determine the appropriate
transformation to stabilize variances, and transformed data were checked for both
normality (using normal probability plots) and homoscedasticity (homogeneous
variance). Variables that were transformed are expressed in terms of the
untransformed variable Y. Univariate statistical analyses and graphics were
produced using the R statistical software (www.R-project.org). Multivariate statistical
analyses and graphics were undertaken using the Primer 6.0 software with the
PERMANOVA extension (Clarke & Warwick 2001; Anderson et al. 2008).
4.4 Results
4.4.1 Transect surveys – Changes in frequency of occurrence of M.
modiolus between 2003 and 2010
Of the 10 sites surveyed, there were significant declines in the frequency of
occurrence of M. modiolus between 2003 and 2010 at 6 sites: south Hadd Rock 1,
south Hadd Rock 2, south Hadd Rock 3, north west Long Sheelah, Scott‟s Hole, and
Green Island between 2003 and 2010 (Figure 4.3 and Table 4.1). At 2 sites, Black
Rocks and west Round Island Pinnacle, there was an increase in the frequency of
occurrence of M. modiolus between 2003 and 2010 (Figure 4.3 and Table 4.1). At
the 2 remaining sites, Jane‟s Rock and Slave Rock no mussels were recorded on
either date (Figure 4.3 and Table 4.1).
Table 4.1 Results of 2-way ANOVA testing the changes in the frequency of
occurrence of M. modiolus between 2003 (n = 1) and 2010 (n = 3) at 10 sites in
Strangford Lough. Significant p-values are shown in bold.
Factors df Mean Square f-value p-value
Time 1 59.895 18.734 < 0.001
Site 8 90.323 28.251 < 0.001
Time x Site 8 12.641 3.954 < 0.001
Error 18 3.197

86
Figure 4.3 Changes in the mean (± SE) frequency of occurrence of M. modiolus at
10 sites in Strangford Lough between 2003 (n =1) and 2010 (n = 3).
d) NW Long Sheelah
% o
f M
. m
odio
lus a
long 1
00
m tra
nse
cts
(± S
E)
Time (years)
Time (years)
e) Scott’s Hole f) Jane’s Rock
f) Scott’s Hole
g) Slave Rock
f) Scott’s Hole
h) Black Rocks
f) Scott’s Hole
i) W Round
Island Pinnacle
f) Scott’s Hole
j) Green Island

87
4.4.2 Transect surveys – Changes in community structure in M.
modiolus biotopes between 2003 and 2007
In total 120 species were identified in the transect surveys in 2007. There were no
significant differences in the mean numbers of species of epifauna between north
and south basin or through time (Figure 4.4 and Table 4.2). However, epifaunal
communities showed significant differences through time and between basins
(Figure 4.5 and Table 4.3). The nMDS plot shows the separation between the north
and south basins, in 2003 and 2007.
Figure 4.4 Changes in the (± SE) mean number of epifauna along 100 m transects
between 2003 and 2007 in the north and south basin in Strangford Lough (n = 18,
2003, n = 11, 2007).
Table 4.2 Results of 2-way ANOVA testing the differences in the mean number of
epifauna along 100 m transects between 2003 and 2007 in the north and south basin
sites in Strangford Lough (n = 18, 2003, n = 11, 2007).
Factors Mean Square f-value p-value
Year 1 81.000 0.6705 > 0.05
Basin 6 917.200 0.356 > 0.05
Year x Basin 6 141.161 0.620 > 0.05
Error 16 227.985
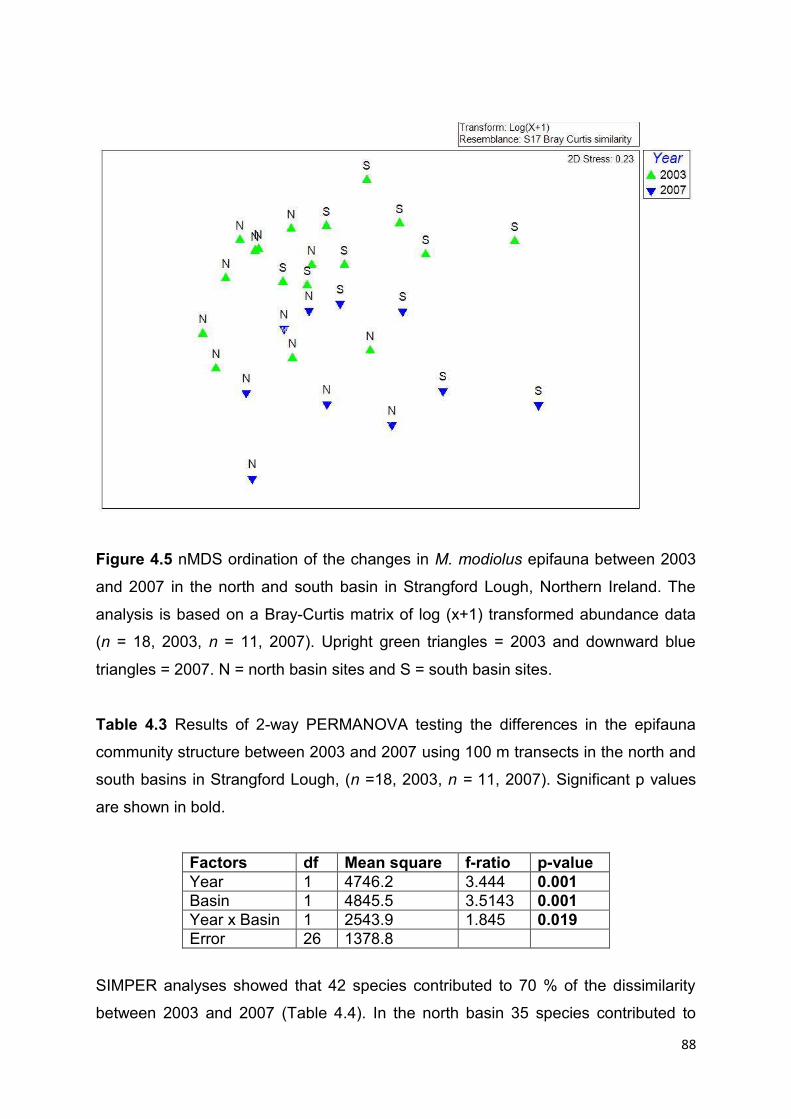
88
Figure 4.5 nMDS ordination of the changes in M. modiolus epifauna between 2003
and 2007 in the north and south basin in Strangford Lough, Northern Ireland. The
analysis is based on a Bray-Curtis matrix of log (x+1) transformed abundance data
(n = 18, 2003, n = 11, 2007). Upright green triangles = 2003 and downward blue
triangles = 2007. N = north basin sites and S = south basin sites.
Table 4.3 Results of 2-way PERMANOVA testing the differences in the epifauna
community structure between 2003 and 2007 using 100 m transects in the north and
south basins in Strangford Lough, (n =18, 2003, n = 11, 2007). Significant p values
are shown in bold.
Factors df Mean square f-ratio p-value
Year 1 4746.2 3.444 0.001
Basin 1 4845.5 3.5143 0.001
Year x Basin 1 2543.9 1.845 0.019
Error 26 1378.8
SIMPER analyses showed that 42 species contributed to 70 % of the dissimilarity
between 2003 and 2007 (Table 4.4). In the north basin 35 species contributed to

89
70% of the dissimilarity between 2003 and 2007. There were significant declines in
the abundances of Chlamys varia, Aequipecten opercularis, Ascidiella aspersa,
Obelia dichotoma, Halecium halecinum, Kirchenpaueria pinnata between 2003 and
2007. In the south basin 48 species contributed to 70 % of the dissimilarity between
2003 and 2007. There were significant declines in the abundances of Ascidiella
aspersa and increases in the abundances of Ophiura albida and Halecium
halecinum between 2003 and 2007.
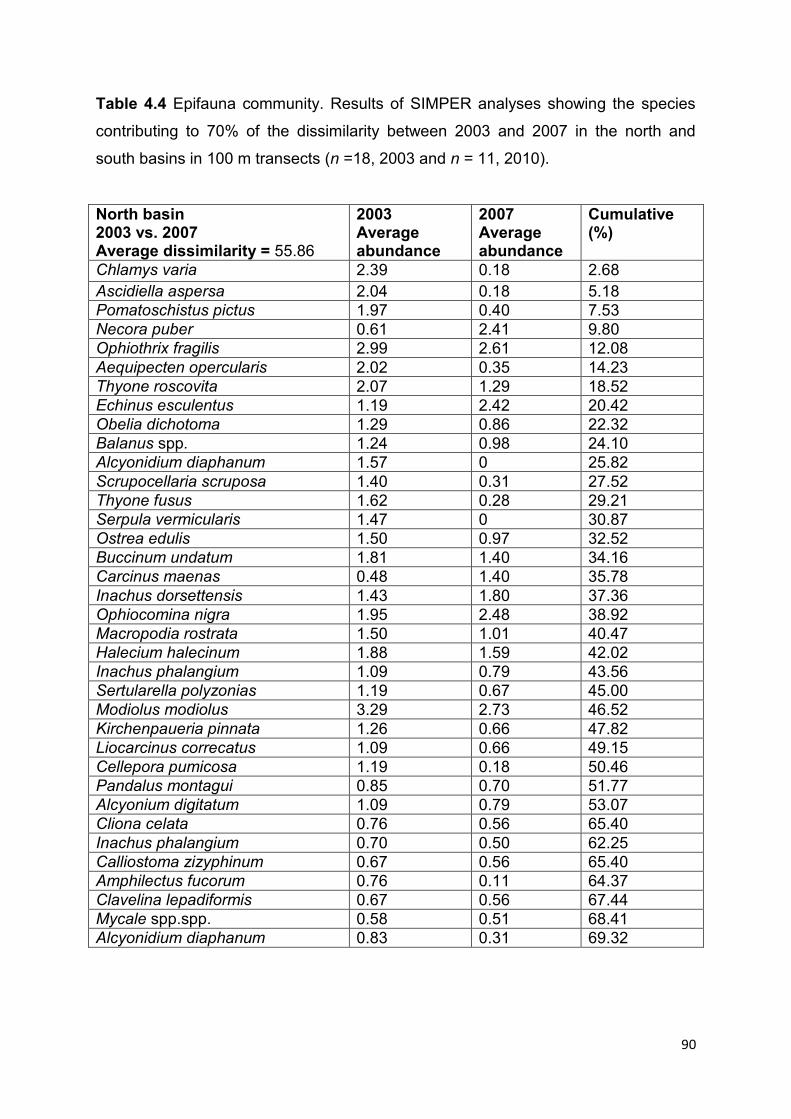
90
Table 4.4 Epifauna community. Results of SIMPER analyses showing the species
contributing to 70% of the dissimilarity between 2003 and 2007 in the north and
south basins in 100 m transects (n =18, 2003 and n = 11, 2010).
North basin 2003 vs. 2007 Average dissimilarity = 55.86
2003 Average abundance
2007 Average abundance
Cumulative (%)
Chlamys varia 2.39 0.18 2.68
Ascidiella aspersa 2.04 0.18 5.18
Pomatoschistus pictus 1.97 0.40 7.53
Necora puber 0.61 2.41 9.80
Ophiothrix fragilis 2.99 2.61 12.08
Aequipecten opercularis 2.02 0.35 14.23
Thyone roscovita 2.07 1.29 18.52
Echinus esculentus 1.19 2.42 20.42
Obelia dichotoma 1.29 0.86 22.32
Balanus spp. 1.24 0.98 24.10
Alcyonidium diaphanum 1.57 0 25.82
Scrupocellaria scruposa 1.40 0.31 27.52
Thyone fusus 1.62 0.28 29.21
Serpula vermicularis 1.47 0 30.87
Ostrea edulis 1.50 0.97 32.52
Buccinum undatum 1.81 1.40 34.16
Carcinus maenas 0.48 1.40 35.78
Inachus dorsettensis 1.43 1.80 37.36
Ophiocomina nigra 1.95 2.48 38.92
Macropodia rostrata 1.50 1.01 40.47
Halecium halecinum 1.88 1.59 42.02
Inachus phalangium 1.09 0.79 43.56
Sertularella polyzonias 1.19 0.67 45.00
Modiolus modiolus 3.29 2.73 46.52
Kirchenpaueria pinnata 1.26 0.66 47.82
Liocarcinus correcatus 1.09 0.66 49.15
Cellepora pumicosa 1.19 0.18 50.46
Pandalus montagui 0.85 0.70 51.77
Alcyonium digitatum 1.09 0.79 53.07
Cliona celata 0.76 0.56 65.40
Inachus phalangium 0.70 0.50 62.25
Calliostoma zizyphinum 0.67 0.56 65.40
Amphilectus fucorum 0.76 0.11 64.37
Clavelina lepadiformis 0.67 0.56 67.44
Mycale spp.spp. 0.58 0.51 68.41
Alcyonidium diaphanum 0.83 0.31 69.32

91
South basin 2003 vs. 2007 Average dissimilarity = 59.87
2003 Average abundance
2007 Average abundance
Cumulative (%)
Ascidiella aspersa 2.63 0 3.30
Ophiura albida 0 2.61 6.57
Pomatoceros spp.spp. 0.27 1.92 8.87
Cerianthus lloydii 0.42 2.30 11.12
Sagartia troglodytes 0 1.61 13.19
Thyone roscovita 2.38 1.55 15.24
Pomatoschistus pictus 1.61 0.86 17.26
Halecium halecinum 1.23 2.46 19.06
Ophiothrix fragilis 1.42 1.23 20.77
Echinus esculentus 2.27 1.23 22.44
Balanus spp. 2.17 2.09 24.10
Mycale spp. 0.61 1.23 25.10
Urticina eques 0.80 1.47 27.22
Pecten maximus 1.57 0.85 28.73
Cancer pagurus 0.54 1.38 30.23
Necora puber 1.23 1.54 31.66
Doto spp. 0 1.23 33.09
Antedon bifida 2.60 2.57 34.49
Leptasterias muelleri 1.15 0.54 35.89
Carcinus maenas 0.80 1.07 37.25
Pagurus bernhardus 0.54 1.07 38.59
Pomatoschistus minutus 0 1.01 39.93
Nemertesia antennina 1.42 1.61 41.27
Ophiocomina nigra 0.88 0.69 42.59
Alcyonium digitatum 0.96 1.07 43.90
Amphilectus fucorum 1.07 0.31 45.21
Sertularella polyzonias 0.80 1.07 46.51
Suberites carnosus 0.88 0.85 47.80
Pandalus montagui 1.07 0.54 49.09
Buccinum undatum 1.07 0.54 50.37
Inachus dorsettensis 1.42 1.78 51.64
Scrupocellaria scruposa 0.54 0.69 52.86
Calliostoma zizyphinum 0.96 0.54 54.08
Macropodia rostrata 1.34 1.61 55.30
Obelia dichotoma 0.80 0.54 56.46
Crossaster papposus 1.76 1.76 57.61
Chlamys varia 1.07 0 58.77
Gobius niger 0 0.94 59.71
Henricia oculata 1.49 1.61 61.05
Cliona celata 0 0.85 62.18
Nephrops norvegicus 0 0.85 63.31
Pholis gunnellus 0.85 0.63 64.37
Alcyonidium diaphanum 0 0.85 64.37
Callionymus lyra 0.58 0.54 65.40
Clavelina lepadiformis 0.54 0.54 66.42
Rhizocaulus verticillatus 0.35 0.69 68.41
Kirchenpaueria pinnata 0.27 0.69 69.38
Cliona celata 0.54 0.54 70.34

92
4.3.3 Removal quadrats – Changes in density of M. modiolus between
2003 and 2010
There was a significant decline in the density of M. modiolus at north east Long
Sheelah, south Hadd Rock and west of Round Island Pinnacle between 2003 and
2010 (Table 4.5 and Figure 4.6). In 2003, the average density of M. modiolus was
360, 288, and 318 mussels m-2, at north east Long Sheelah, south Hadd Rock and
west Round Island Pinnacle, respectively. In 2010, the average density of M.
modiolus had declined to 16, 136, and 37 mussels m-2, at north east Long Sheelah,
south Hadd Rock and west of Round Island Pinnacle. In contrast, at the Black Rocks
site there were no detectable changes in the density of M. modiolus, 16 mussels m-2,
in 2003 and 2010 (Table 4.5 and Figure 4.6).
Table 4.5 Results of 2-way ANOVA testing the differences in the density of M.
modiolus in 0.25 x 0.25 quadrats between 2003 and 2010 at 4 sites in Strangford
Lough (north east Long Sheelah n = 4 in 2003, n = 5 in 2010, south Hadd Rock n = 4
in 2003, n = 5 in 2010, Black Rocks n = 5 in 2003, n =5 in 2010 and west Round
Island Pinnacle n =7 in 2003, n = 5 in 2010). Significant p-values are shown in bold.
Factors df Mean Square f-value p-value
Year 1 118.984 18.268 <0.001
Site 3 25.395 3.899 0.018
Year x Site 3 79.091 12.143 <0.001
Error 32 6.513

93
Figure 4.6 Changes in the (± SE) mean number of M. modiolus in 0.25 x 0.25 m
quadrats between 2003 and 2010 at four sites in Strangford Lough (north east Long
Sheelah n = 4 in 2003, n = 5 in 2010, south Hadd Rock n = 4 in 2003, n = 5 in 2010,
Black Rocks n = 5 in 2003, n =5 in 2010 and west Round Island Pinnacle n =7 in
2003, n = 5 in 2010).
Time (years)
Me
an
de
nsity o
f M
. m
odio
lus in
0.5
x 0
.5 m
qua
dra
ts (
± S
E)
2010
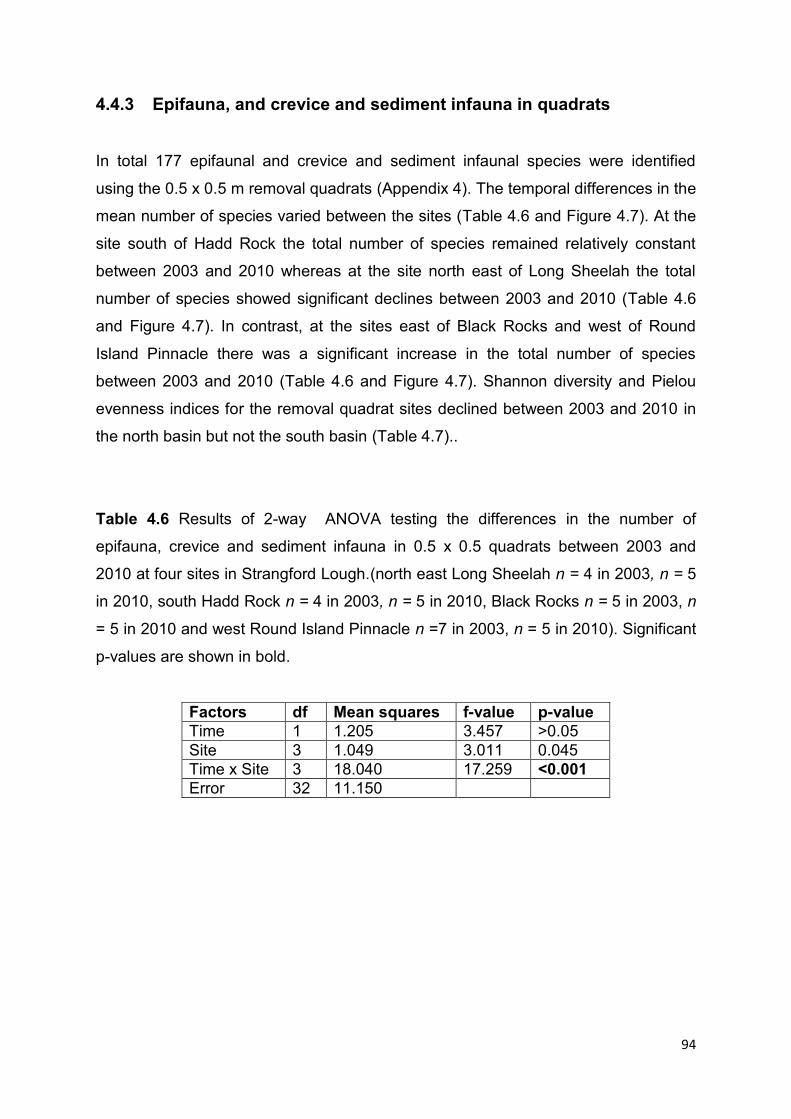
94
4.4.3 Epifauna, and crevice and sediment infauna in quadrats
In total 177 epifaunal and crevice and sediment infaunal species were identified
using the 0.5 x 0.5 m removal quadrats (Appendix 4). The temporal differences in the
mean number of species varied between the sites (Table 4.6 and Figure 4.7). At the
site south of Hadd Rock the total number of species remained relatively constant
between 2003 and 2010 whereas at the site north east of Long Sheelah the total
number of species showed significant declines between 2003 and 2010 (Table 4.6
and Figure 4.7). In contrast, at the sites east of Black Rocks and west of Round
Island Pinnacle there was a significant increase in the total number of species
between 2003 and 2010 (Table 4.6 and Figure 4.7). Shannon diversity and Pielou
evenness indices for the removal quadrat sites declined between 2003 and 2010 in
the north basin but not the south basin (Table 4.7)..
Table 4.6 Results of 2-way ANOVA testing the differences in the number of
epifauna, crevice and sediment infauna in 0.5 x 0.5 quadrats between 2003 and
2010 at four sites in Strangford Lough.(north east Long Sheelah n = 4 in 2003, n = 5
in 2010, south Hadd Rock n = 4 in 2003, n = 5 in 2010, Black Rocks n = 5 in 2003, n
= 5 in 2010 and west Round Island Pinnacle n =7 in 2003, n = 5 in 2010). Significant
p-values are shown in bold.
Factors df Mean squares f-value p-value
Time 1 1.205 3.457 >0.05
Site 3 1.049 3.011 0.045
Time x Site 3 18.040 17.259 <0.001
Error 32 11.150

95
Figure 4.7 Changes in the (± SE) mean number of epifauna crevice and sediment
infauna in 0.25 x 0.25 m quadrats between 2003 and 2010 at four sites in Strangford
Lough (north east Long Sheelah n = 4 in 2003, n = 5 in 2010, south Hadd Rock n = 4
in 2003, n = 5 in 2010, Black Rocks n = 5 in 2003, n =5 in 2010 and west Round
Island Pinnacle n =7 in 2003, n = 5 in 2010).
Table 4.7 The average Shannon diversity Pielou evenness indices in removal
quadrats at 4 sites in Strangford Lough (north basin: north east Long Sheelah n = 4
in 2003, n = 5 in 2010, south Hadd Rock; south basin: n = 4 in 2003, n = 5 in 2010,
Black Rocks n = 5 in 2003, n =5 in 2010 and west Round Island Pinnacle n =7 in
2003, n = 5 in 2010). Indices values were calculated using (log2) on counted species
only.
Indices Shannon diversity Pielou evenness
Site 2003 2010 2003 2010
North basin
South Hadd Rock 2.677 1.219 0.759 0.566
North east Long Sheelah 2.759 1.452 0.749 0.484
South basin
East Black Rock 2.568 2.873 0.767 0.741
West Round Island Pinnacle 2.571 3.012 0.759 0.843

96
M. modiolus communities identified in the removal quadrats in 2003 and 2010
showed significant temporal and spatial differences (Table 4.8). In 2003, the M.
modiolus communities in the north basin (SS.SBR.SMus.ModCvar), (south Hadd
Rock and Long Sheelah) in the south basin (SS.SBR.SMus.Mod.HAs) (east of Black
Rocks and west Round Island Pinnacle) showed distinct separation in MDS space
(Figure 4.8). In contrast, in 2010 the distinction between the M. modiolus
communities in the north and south basins was not as clear (Figure 4.8). In 2010, the
sites with the greatest separation in MDS space were north east Long Sheelah and
west Round Island Pinnacle (Figure 4.8).
Table 4.8 Results of PERMANOVA testing the differences in the sediment and
crevice infauna community structure between 2003 and 2010 using removal
quadrats at 4 sites in Strangford Lough (north east Long Sheelah n = 4 in 2003, n =
5 in 2010, south Hadd Rock n = 4 in 2003, n = 5 in 2010, Black Rocks n = 5 in 2003,
n =5 in 2010 and west Round Island Pinnacle n =7 in 2003, n = 5 in 2010).
Significant p-values are shown in bold.
Factors Df Mean squares f-value p-value
Time 1 25099 27.451 <0.001
Site 3 4514 4.937 0.001
Time x Site 3 3741 4.0916 0.001
Error 32 914.32
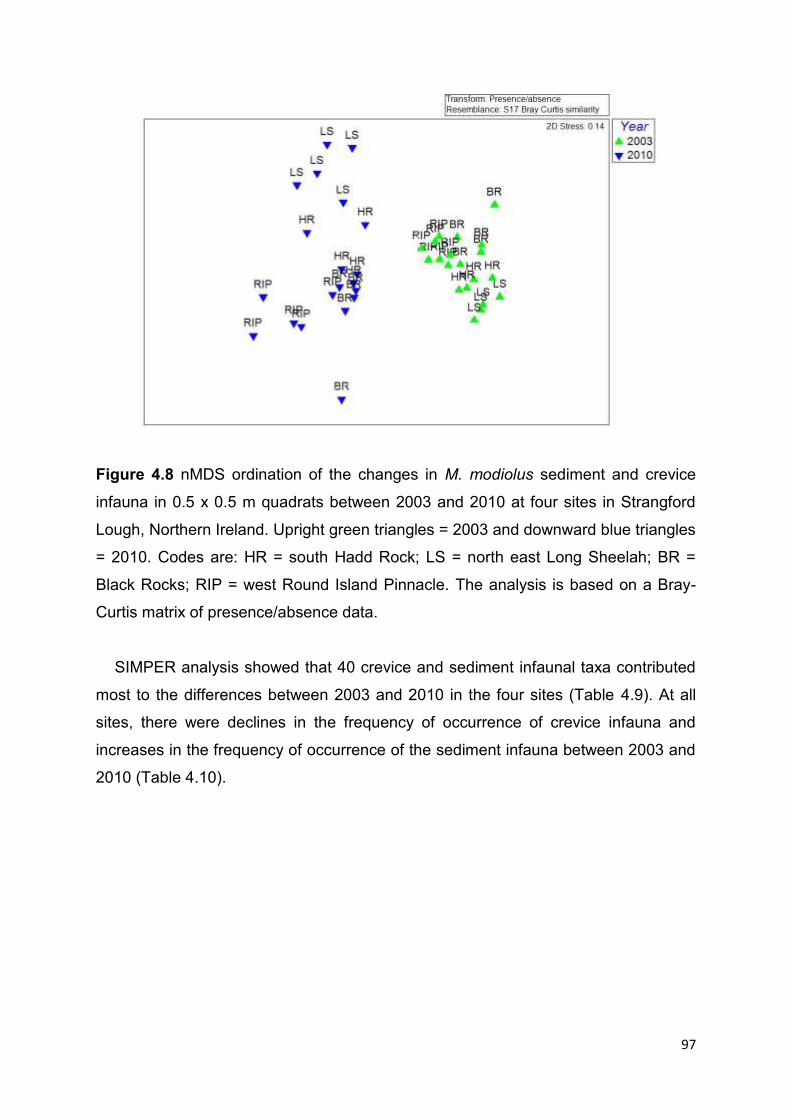
97
Figure 4.8 nMDS ordination of the changes in M. modiolus sediment and crevice
infauna in 0.5 x 0.5 m quadrats between 2003 and 2010 at four sites in Strangford
Lough, Northern Ireland. Upright green triangles = 2003 and downward blue triangles
= 2010. Codes are: HR = south Hadd Rock; LS = north east Long Sheelah; BR =
Black Rocks; RIP = west Round Island Pinnacle. The analysis is based on a Bray-
Curtis matrix of presence/absence data.
SIMPER analysis showed that 40 crevice and sediment infaunal taxa contributed
most to the differences between 2003 and 2010 in the four sites (Table 4.9). At all
sites, there were declines in the frequency of occurrence of crevice infauna and
increases in the frequency of occurrence of the sediment infauna between 2003 and
2010 (Table 4.10).
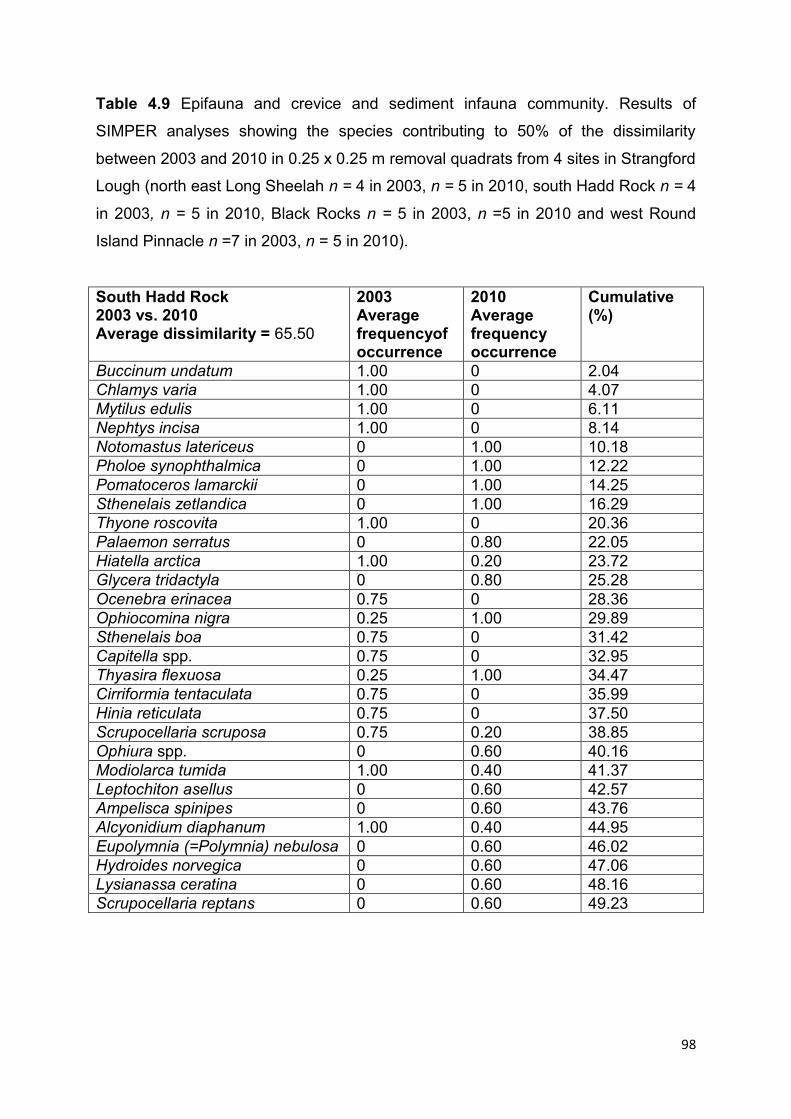
98
Table 4.9 Epifauna and crevice and sediment infauna community. Results of
SIMPER analyses showing the species contributing to 50% of the dissimilarity
between 2003 and 2010 in 0.25 x 0.25 m removal quadrats from 4 sites in Strangford
Lough (north east Long Sheelah n = 4 in 2003, n = 5 in 2010, south Hadd Rock n = 4
in 2003, n = 5 in 2010, Black Rocks n = 5 in 2003, n =5 in 2010 and west Round
Island Pinnacle n =7 in 2003, n = 5 in 2010).
South Hadd Rock 2003 vs. 2010 Average dissimilarity = 65.50
2003 Average frequencyof occurrence
2010 Average frequency occurrence
Cumulative (%)
Buccinum undatum 1.00 0 2.04
Chlamys varia 1.00 0 4.07
Mytilus edulis 1.00 0 6.11
Nephtys incisa 1.00 0 8.14
Notomastus latericeus 0 1.00 10.18
Pholoe synophthalmica 0 1.00 12.22
Pomatoceros lamarckii 0 1.00 14.25
Sthenelais zetlandica 0 1.00 16.29
Thyone roscovita 1.00 0 20.36
Palaemon serratus 0 0.80 22.05
Hiatella arctica 1.00 0.20 23.72
Glycera tridactyla 0 0.80 25.28
Ocenebra erinacea 0.75 0 28.36
Ophiocomina nigra 0.25 1.00 29.89
Sthenelais boa 0.75 0 31.42
Capitella spp. 0.75 0 32.95
Thyasira flexuosa 0.25 1.00 34.47
Cirriformia tentaculata 0.75 0 35.99
Hinia reticulata 0.75 0 37.50
Scrupocellaria scruposa 0.75 0.20 38.85
Ophiura spp. 0 0.60 40.16
Modiolarca tumida 1.00 0.40 41.37
Leptochiton asellus 0 0.60 42.57
Ampelisca spinipes 0 0.60 43.76
Alcyonidium diaphanum 1.00 0.40 44.95
Eupolymnia (=Polymnia) nebulosa 0 0.60 46.02
Hydroides norvegica 0 0.60 47.06
Lysianassa ceratina 0 0.60 48.16
Scrupocellaria reptans 0 0.60 49.23

99
North east Long Sheelah 2003 vs. 2010 Average dissimilarity = 77.81
2003 Average frequency of occurrence
2010 Average frequency of occurrence
Cumulative (%)
Alcyonidium diaphanum 1 0 1.93
Amphipholis squamata 1 0 3.87
Chlamys varia 1 0 5.80
Hinia reticulata 1 0 7.73
Lepidonotus squamatus 1 0 9.67
Maera othonis 0 1 11.60
Modiolus modiolus 1 0.25 13.53
Mytilus edulis 1 0 15.47
Obelia dichotoma 1 0 17.40
Pododesmus (=Monia) patelliformis 1 0 19.33
Scrupocellaria scruposa 1 0 21.27
Scypha ciliata 1 0 23.20
Sphaerodorum flavum 0 1 25.13
Tubificoides spp. 1 1 27.07
Ascidiella aspersa 1 0.20 28.64
Mediomastus fragilis 1 0.80 30.21
Thyasira flexuosa 0 0.80 31.77
Modiolarca tumida 0.75 0 33.26
Ocnus brunneus 0.75 0 34.75
Anomia ephippium 0.75 0 36.21
Crisia ramosa 0.75 0 37.67
Sthenelais boa 0;.75 0 39.13
Terebellida spp 0.75 0 40.59
Boreotrophon truncata 0.75 0 42.02
Crisia eburnea 0.75 0 43.48
Hiatella arctica 0.75 0 44.92
Cellepora pumicosa 0.75 0 46.32
Chlamys distorta 0.75 0 46.32
Hymendesmia brondstedi 0.75 0 47.73
Kirchenpaueria pinnata 0.75 0 49.14

100
Black Rocks 2003 vs. 2010 Average dissimilarity = 77.81
2003 Average frequency of occurrence
2010 Average frequency of occurrence
Cumulative (%)
Balanus balanus 0 1 1.86
Calyptraea chinensis 0 1 3.72
Hydroides norvegica 0 1 5.58
Leptasterias muelleri 1 0 7.44
Pholoe synophthalmica 0 1 9.30
Sthenelais zetlandica 0 1 11.16
Caulleriella zetlandica 0 0.80 12.64
Eteone spp. 0 0.80 141.3
Melinna palmata 0 0.80 15.62
Notomastus latericeus 0 0.80 17.11
Palaemon serratus 0 0.80 18.59
Pherusa plumosa 0 0.80 20.08
Scrupocellaria reptans 0 0.80 21.57
Lucinoma borealis 0 0.60 23.05
Membranipora membranacea 0 0.80 24.53
Anomia ephippium 0.20 0.80 25.78
Lumbrineris latreilli 0 0.60 26.91
Semibalanus balanoides 0 0.60 26.91
Nephtys histricis 0 0.60 28.05
Venerupis saxatilis 0 0.60 31.39
Pista cristata 0 0.60 32.50
Tapes (=Venerupis) rhomboides 0.60 0 33.60
Euchone southernii 0 0.60 34.71
Platynereis dumerilii 0 0.60 35.81
Pomatoceros triqueter 0 0.60 36.91
Chlamys varia 0.60 0.00 38.01
Cirriformia tentaculata 0.60 0.00 39.11
Amphipholis squamata 1.00 0.40 40.18
Kefersteinia cirrata 0 0.60 41.26
Apseudes talpa 0.40 0.80 42.33
Capitella spp. 0.60 0 43.40
Terebellida spp. 0.60 0 44.47
Owenia fusiformis 0.40 0.80 45.33
Thyasira flexuosa 0.40 0.80 46.58
Sertularia argentea 0.20 0.60 47.62
Sagartia elegans 0.60 0.20 48.66
Lysianassa ceratina 0.40 0.80 49.70

101
West Round Island Pinnacle 2003 vs. 2010 Average dissimilarity = 71.51
2003 Average frequency of occurrence
2010 Average frequency of occurrence
Cumulative (%)
Antedon bifida 1 0 1.80
Cirriformia tentaculata 1 0 3.61
Lumbrineris latreilli 0 1 5.41
Melinna palmata 0 1 7.22
Pomatoceros lamarckii 0 1 9.02
Semibalanus balanoides 0 1 10.82
Hiatella arctica 0.86 0 12.38
Sthenelais boa 0.86 0 13..91
Mya truncata 0.86 0 15.43
Ampelisca typica 0 0.80 16.93
Asterias rubens 0 0.80 18.43
Glycera tridactyla 0 0.80 19.93
Nephtys histricis 0 0.80 21.43
Scalibregma celticum 0 0.80 24.41
Callochiton achatinus 0 0.80 25.84
Eumida spp. 0 0.80 27.82
Golfingia vulgaris 0 0.80 28.71
Notomastus latericeus 0 0.80 30.14
Scrupocellaria reptans 0 0.80 31.55
Pista cristata 0 0.80 32.95
Balanus spp. 0 0.80 32.95
Membranipora membranacea 0 0.80 34.32
Myriochele heeri 0 0.80 35.74
Leptasterias muelleri 0.71 0 37.01
Nephtys incisa 0.71 0 38.27
Ophiocomina nigra 0.71 0 39.53
Lepidonotus squamatus 1.00 0.40 40.71
Pododesmus (=Monia) patelliformis 1.00 0.40 41.88
Abra alba 1.00 0.40 43.05
Ophiothrix fragilis 1.00 0.40 44.14
Sthenelais zetlandica 0 0.60 45.23
Amphipholis squamata 0.86 0.40 46.32
Timoclea ovata 0.43 1.0 47.38
Hydroides norvegica 0 0.60 48.43
Cirratulus spp. 0.57 0 49.43

102
4.5 In situ observations
4.5.1 North Basin (SS.SBR.SMus.ModCvar)
During the surveys in 2003, a small area between Long Sheelah and Hadd Rock
was identified as the best example of the Modiolus modiolus with Chlamys varia,
biotope (SS.SBR.SMus.ModCvar). The current survey suggests that the biotope in
this area has declined in condition (Figure 4.8). There were declines in the
abundances of M. modiolus, C. varia, Kirchenpaueri pinnata, and Halecium
halecium, between 2003 and 2010. The sponges Spanioplan aramatutram and
Iophon hyndmani, which are common on M. modiolus and C. varia shell (B. Picton
per obs SLECI) remained absent between 2003 and 2010. There were also no
detectable differences in the abundances of the bivalves, Pecten maximus and
Ostrea edulis and the sponge M. similaris between 2003 and 2007.
Figure 4.8 Photo of M. modiolus communities in the area between south Hadd Rock
and north east of Long Sheelah in 2010
4.5.2 South basin (SS.SBR.SMus.Mod.HAs)
Surveys in 2003 identified the areas east of Black Rock and West of Round Island
Pinnacle as the best examples of the M. modiolus with hydroids and ascidians
biotope (SS.SBR.SMus.ModHAs). The M. modiolus communities in these areas

103
showed very little changes between 2003 and 2010 (Figure 4.9). In both areas, there
were declines in the density of M. modiolus but increases in the frequency of
occurrence of M. modiolus between 2003 and 2010. There were also declines in the
abundances of the bivalve C. varia, but very little changes in the abundances of
Antedon bifida, Ophiothrix fragilis and Ophiocomina nigra between 2003 and 2010.
H. halecinum, C. celata and Pomatoceros triqueter also appear too have increased
in abundances in some areas between 2003 and 2010.
Figure 4.9 Photo of M. modiolus communities in the area west of Round Island
Pinnacle in 2010.
4.5.3 Historical sites within the range of M. modiolus in Strangford
Lough
The current study also surveyed the areas Green Island, Scott‟s Hole, Jane‟s
Rock and Selk Rock, which formed part of the historical range of the M. modiolus
communities. In the Scott‟s Hole and Jane‟s Rock areas, M. modiolus and its
associated community showed a decrease in abundance between 2003 and 2010.
The Green Island area remains unchanged over this period with little or no live M.
modiolus but some associated epifauna. The Selk Rock area also remains
unchanged with scattered clumps of M. modiolus and some red algae.

104
4.6 Discussion
This part of the current study aimed to assess the potential for natural recovery of
impacted M. modiolus communities in Strangford Lough by comparing data from
MRRG surveys in 2010 with those reported in SLECI (Roberts et al. 2004). Video
and photo-transect surveys and quadrat removal sampling of the Modiolus biotope
SS.SBR.SMus.ModCvar in the north basin suggest that the abundances and
frequency of occurrence of several key species, including Modiolus modiolus itself,
the bivalves Chlamys varia, and Aequipecten opercularis and the hydroids
Kirchenpaueri pinnata and Halecium halecium , continued to decline between 2003
and 2010. Similar surveys and quadrat removal sampling of
biotopeSS.SBR.SMus.ModHAs in the south basin demonstrated significant
decreases in the abundances of M. modiolus over the same period. However, the
frequency of occurrence of Ophiothrix fragilis and Antedon bifida, Kirchenpaueri
pinnata, H. halecium and Ascidiella aspersa were unchanged between 2003 and
2010. These results suggest that many of the characteristic species of the M.
modiolus communities, particularly in the north basin, remained absent or in reduced
numbers in 2010.
The current survey also demonstrated that the diversity of the M. modiolus
communities in the north basin had declined relative to surveys in 2003. Video, photo
and quadrat surveys of the M. modiolus biotope in the north basin
(SS.SBR.SMus.ModCvar) showed that between 2003 and 2010 there were declines
in the average density of M. modiolus, the mean number of species, and the
Simpson‟s and Pielou indices. In contrast, sampling of the M. modiolus communities
in the south basin (SS.SBR.SMus.ModHAs) showed that although there were
significant declines in the density of M. modiolus between 2003 and 2010, the mean
number of species increased, and there were no clear changes in the Simpson‟s and
Pieolu indicesover the same period. These results suggest that despite the total ban
on trawling introduced in 2003, M. modiolus communities in the north basin are
declining more rapidly than those in the south basin.
Using quadrat sampling methods, the current study identified a total of 151
species on M. modiolus communities, with 109 species in the north basin and 117
species in the south basin. The total number of species identified in 2010 was similar
to that in the 2003 surveys (Roberts et al. 2004). However, the number of species
105
identified on horse mussel communities in Strangford Lough is lower than total
numbers of species on other M. modiolus beds in the UK. Surveys in North Wales,
Northern Scotland and the Isle of Man have identified 230 species, 160 species and
270 species, in M. modiolus communities, respectively using removal sampling
methods (Mair et al. 2000; Rees et al. 2008; Holt & Shalla unpublished data). The
beds at these other sites are classified as a mixture between the
SS.SBR.SMus.ModCvar and SS.SBR.SMus.ModHAs communities (Mair et al. 2000;
Rees et al. 2008; Holt & Shalla unpublished data) which might explain their higher
species richness.
4.7 Conclusions
This part of the MRRG project suggests that the M. modiolus communities in the
north and south basin remain very much reduced in their characteristic species. The
M. modiolus communities in the north basin showed further decline rather than
recovery relative to the surveys in 2003. In contrast, the M. modiolus communities in
the south basin showed slight recovery in terms of an increase in mean number of
species, but showed little changes in species diversity relative to 2003. These results
contrast with the previous section (3) which found that, based on photo quadrat
sampling, there was a higher diversity of epifauna in the north basin relative to south
basin, in the good condition sites. These results are probably explained by the
differences in sampling methods and the patchy and fragmented nature of the M.
modiolus communities in both the north and south basins. Future sampling should
focus on annual, photo quadrat and removal sampling of fixed points in M. modiolus
communities in the north and south basins to determine their potential for and rates
of natural recovery.

106
5.0 Identifying suitable sites for restoration: habitat
suitability modelling for M. modiolus, in Strangford Lough
(Undertakings 9 and 10)
5.1 Summary
Species restoration requires an understanding of the relationship between
species and the environment before conservation programs involving habitat
protection, habitat restoration and captive breeding and release, can be fully
implemented.
This study uses species distribution modelling to identify suitable habitat for
the declining marine bivalve, M. modiolus, within Strangford Lough, and
provide objective information on sites where intervention and natural recovery
will be most successful and likely.
Species distribution models were developed for each biotope found within the
Lough: the M. modiolus with Chlamys varia, sponges, hydroids and bryozoans
(SS.SBR.SMus.ModCvar) in the northern basin and the mixture of M.
modiolus with hydroids and large solitary ascidians (SS.SBR.SMus.ModHAs)
and M. modiolus with hydroids and red seaweeds (SS.SBR.SMus.ModT)
found in the south basin.
M. modiolus presence records were collected during SCUBA dive surveys
between 2008 and 2010 and environmental parameters from Centre for
Environmental Data and Recording (CEDaR) records. Environmental data
was interpolated using ARCGIS v9.3 (ESRI, California, USA) to provide
environmental layers for distribution modelling using MAXENT, at a common
pixel size of 40m.
Although substrata importance varied between biotopes, overall M. modiolus
distribution was positively associated with the presence of mud and sand and
negatively associated with the presence of cobbles, boulders, gravel, bedrock
and pebbles.
The higher AUC value for the SS.SBR.SMus.ModCvar biotope is most likely
an indication of its restricted distribution as opposed to better model fit.

107
Predicted M. modiolus distribution was largely biased towards the centre of
the Lough and reflects the known historic distribution.

108
5.2 Introduction
Subtle changes in the environment are highly influential in determining an animal‟s
distribution (Strayer 2008) and understanding the relationships between an animal
and its habitat is required when attempting to restore a declining species. Using a
tool that gives an understanding of the variation of the quality of an organism‟s
habitat enables the prioritization of areas for conservation (e.g. Wilson et al. 2011)
and is important in reducing effort and cost required to manage rare or threatened
species (Olsson & Rogers 2009).
Habitat suitability mapping is frequently used to identify areas in need of
restoration or preservation (Gibson et al. 2004), or identify candidate areas in
species reintroduction programs (Olsson & Rogers 2009). Predictive species-specific
landscape favourability models, based on Geographic Information Systems (GIS),
have become the favoured method in defining species habitat requirements (Guisan
& Zimmerman 2000; Wilson et al. 2011). For example, Wilson et al. (2011) employed
Species Distribution Modelling (SDM) using the opensource software MAXENT to
identify population augmentation and reintroduction sites within rivers in Northern
Ireland for the globally endangered freshwater bivalve, Margaritifera margaritifera
(L.).
In biogeographical studies it is generally considered that a species is most
abundant in the centre of its range (Hochburg & Ives 1999), and therefore in the
centre of the environmental range of variables which it occurs. This is the „abundant
centre‟ distribution model (Sagarin & Gaines 2002). Although it may be argued that
predictive distribution studies based on a declining species may be biased if they are
developed when a species is no longer found throughout its historic range, they
should still indicate key elements of its niche. This is because chronic changes in
environmental conditions are likely to have a greater impact on those individuals at
the edge of the range than those in the centre (Wilson et al. 2011).
Conservation measures to enhance the recovery of a species after a period of
decline should first involve total protection followed by habitat restoration. However,
captive breeding and release is frequently used as a major conservation strategy,
but is in reality the option of last resort (Wilson & Roberts 2011). There are concerns
that releasing captive-bred animals into the wild is less successful than translocating

109
individuals from other wild, healthy populations (Griffith et al. 1989; Wolf et al. 1996).
Nonetheless, a clear understanding of the species-specific habitat niche allows the
identification of potential release sites with the maximum chance of post-release
survival, often demonstrating a need for habitat restoration prior to reintroduction.
Consequently conservationists are increasingly emphasizing the integration of
distribution models with reintroduction and population augmentation programs
(Seddon et al. 2007; Sergio et al. 2007).
M. modiolus beds are classified as three biotopes within Strangford Lough: the M.
modiolus with Chlamys varia, sponges, hydroids and bryozoans
(SS.SBR.SMus.ModCvar) in the northern basin and the mixture of M. modiolus with
hydroids and large solitary ascidians (SS.SBR.SMus.ModHAs) and M. modiolus with
hydroids and red seaweeds (SS.SBR.SMus.ModT) found in the south basin. M.
modiolus has declined throughout the Lough since the 1970s (Magorrian & Service
1998; Service 1998; Section 2, this report). A key element of the current project was
to develop intervention methods to arrest this decline (Section 6). These methods,
based on experience gained in major oyster restoration projects in the USA (Mann &
Evans 2004; Schulte et al. 2009) include translocation of healthy individuals from
wild populations to unmodified sites or sites where shell cultch has been laid, or the
release of captive-bred animals. This part of the current project was therefore
undertaken to identify sites where such intervention techniques are likely to have
greatest chance of success.
The aim of this section (undertakings 9 & 10), was to develop predictive
distributional maps using habitat favourability models based on interpolated
environmental variables for M. modiolus in different biotopes and throughout
Strangford Lough. These maps will identify areas of high conservation value for each
basin which can be used to select non-disturbance areas and sites for restoration
involving the use of cultch, captive-bred or translocated mussels (Section 6).

110
5.3 Methods
5.3.1 Landscape parameterization
During the current project M. modiolus was recorded at 124 locations in
Strangford Lough by ROV and SCUBA diving surveys conducted between 2008 and
2010 (Figure 5.1). Environmental parameters, as percentage cover of substrata,
have been documented by CEDaR and are shown in Table 5.1. Depth data was
excluded from the analysis because of the potential for bias to sampling areas within
diving and ROV depth limits, which would exclude deeper areas of the Lough.
Although many historical records exist for M. modiolus in Strangford Lough, it was
decided to limit the species presence records to the most up-to-date distributional
data because its presence may influence substrata composition. Consequently,
because the loss of M. modiolus may cause a change in substratum characteristics,
using historical data may be less biological relevant to current conditions within the
Lough and the selection of restoration sites.
Point data on substratum type and percentage cover, derived from SCUBA diving,
containing habitat variables were interpolated using the Inverse Distance Weighted
(IDW) interpolation tool in the Spatial Analysis toolbox in ARCGIS v9.3 (ESRI,
California, USA). ArcGIS v9.3 was used to extract habitat variables on a landscape
scale resampled to a common pixel size of 40m throughout Strangford Lough.
Table 5.1 Substrata recorded during SCUBA diving and used in MAXENT model.
Variable name Unit Description
Bedrock % Coverage of bedrock derived from interpolated dive data Boulders % Coverage of boulders derived from interpolated dive data Cobbles % Coverage of cobbles derived from interpolated dive data Mud % Coverage of mud derived from interpolated dive data Pebbles % Coverage of pebbles derived from interpolated dive data Sand % Coverage of sand derived from interpolated dive data

111
Figure 5.1 Locations of M. modiolus biotopes in Strangford Lough, Northern Ireland,
UK. Purple shaded areas represent estimated historical distribution of
SS.SBR.SMus.ModCvar (Chlamys varia) biotope; green shaded areas represent
estimated historical distribution of SS.SBR.SMus.ModHAs / SS.SBR.SMus.ModT
(Ophiothrix sp.) biotopes (Connor et al. 2004). Blue dots represent M. modiolus
records found in SS.SBR.SMus.ModCvar (n = 46), red dots represent M. modiolus
records found in SS.SBR.SMus.ModHAs / SS.SBR.SMus.ModT biotopes (n = 51)
during MRRG dive surveys, used in MAXENT modelling.

112

113
5.3.2 Statistical analyses
MAXENT 3.2.1a (Phillips et al. 2006; Phillips & Dudlík 2008) was used to predict
the probability of species occurrence at a pixel size of 40 m. Due to the restricted
range of M. modiolus it was hypothesised that the species‟ habitat associations
would occupy a narrow band of tolerance and, therefore, not display linear
relationships. Consequently, model flexibility was maximised by considering
quadratic, product, threshold, hinged and discrete functions for all habitat parameters
(Phillips & Dudlík 2008). Jack-knife resampling analysis was used to determine a
heuristic estimate of the relative contribution of each variable based on the
performance of the global model (known as test gain) without the variable of interest
compared to the influence of that variable in isolation (derived from a univariate
model only). Global model performance was judged using the area under the curve
(AUC) in the receiver operating characteristic (ROC) analysis (Liu et al. 2005). Model
significance was tested using a one-tailed binomial test of omission (the fraction of
test occurrence falling outside the prediction) under the null hypothesis of random
prediction, given the same fractional predicted area. Marginal response curves of the
predicted probability of species occurrence were graphed for each explanatory
variable that contributed substantially to the global model. A map of habitat
favourability for M. modiolus was generated to reflect the predicted probability of
species occurrence using ARCGIS v9.3.
Because of limitations on species presence records the one-tailed binomial test of
omission was only conducted for the model containing both biotope records. Model
testing was also carried out for MAXENT model containing species presence records
for both biotopes using a test set of 25% of presence records. The fit of the model to
the test data is the real test of the model‟s predictive power using the AUC value.
In the original tender contract, other variables were to be included into the habitat
suitability model as predictor variables for M. modiolus distribution modelling.
However, depth was not included in the model because dive depths and ROV
sampling for M. modiolus did not occur deeper than approximately 40m, so there is
the possibility of sampling bias.
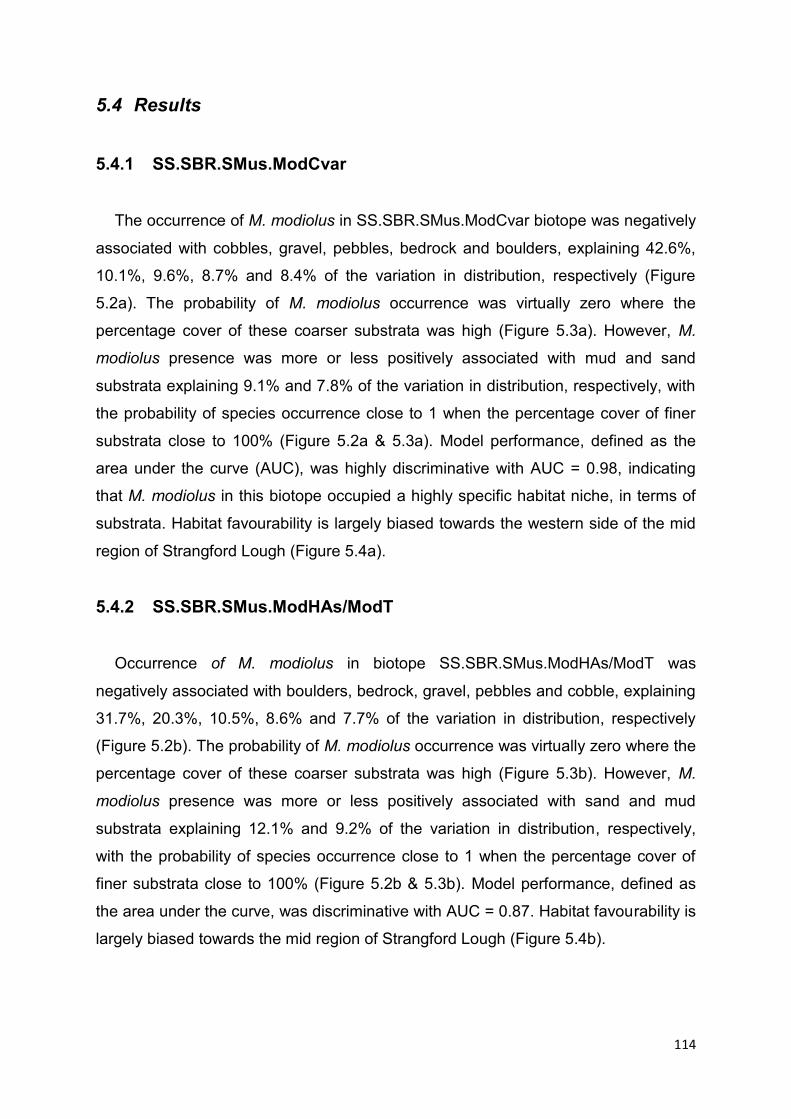
114
5.4 Results
5.4.1 SS.SBR.SMus.ModCvar
The occurrence of M. modiolus in SS.SBR.SMus.ModCvar biotope was negatively
associated with cobbles, gravel, pebbles, bedrock and boulders, explaining 42.6%,
10.1%, 9.6%, 8.7% and 8.4% of the variation in distribution, respectively (Figure
5.2a). The probability of M. modiolus occurrence was virtually zero where the
percentage cover of these coarser substrata was high (Figure 5.3a). However, M.
modiolus presence was more or less positively associated with mud and sand
substrata explaining 9.1% and 7.8% of the variation in distribution, respectively, with
the probability of species occurrence close to 1 when the percentage cover of finer
substrata close to 100% (Figure 5.2a & 5.3a). Model performance, defined as the
area under the curve (AUC), was highly discriminative with AUC = 0.98, indicating
that M. modiolus in this biotope occupied a highly specific habitat niche, in terms of
substrata. Habitat favourability is largely biased towards the western side of the mid
region of Strangford Lough (Figure 5.4a).
5.4.2 SS.SBR.SMus.ModHAs/ModT
Occurrence of M. modiolus in biotope SS.SBR.SMus.ModHAs/ModT was
negatively associated with boulders, bedrock, gravel, pebbles and cobble, explaining
31.7%, 20.3%, 10.5%, 8.6% and 7.7% of the variation in distribution, respectively
(Figure 5.2b). The probability of M. modiolus occurrence was virtually zero where the
percentage cover of these coarser substrata was high (Figure 5.3b). However, M.
modiolus presence was more or less positively associated with sand and mud
substrata explaining 12.1% and 9.2% of the variation in distribution, respectively,
with the probability of species occurrence close to 1 when the percentage cover of
finer substrata close to 100% (Figure 5.2b & 5.3b). Model performance, defined as
the area under the curve, was discriminative with AUC = 0.87. Habitat favourability is
largely biased towards the mid region of Strangford Lough (Figure 5.4b).

115
5.4.3 Both biotopes
Overall, the occurrence of M. modiolus was negatively associated with cobbles,
boulders, gravel, bedrock and pebbles, explaining 30.9%, 18.9%, 14.6%, 9.6% and
4.7% of the variation in distribution, respectively (Figure 5.2c). The probability of M.
modiolus occurrence was virtually zero where the percentage cover of these coarser
substrata was high (Figure 5.2c & 5.2b). However, M. modiolus presence was more
or less positively associated with mud and sand substrata explaining 13% and 8.2%
of the variation in distribution, respectively, with the probability of species occurrence
close to 1 when the percentage cover of finer substrata close to 100% (Figure 5.2c &
5.2b). Habitat favourability is largely biased towards the mid region of Strangford
Lough (Figure 5.4c). The one-tailed binomial test was significant (P < 0.01),
indicating the model successfully predicts occurrence records significantly better
than random (Anderson et al. 2003). Model performance, defined as the area under
the curve, was highly discriminative with AUC = 0.92. Test AUC was 0.83 ± 0.052
(standard deviation) indicating a good model fit.
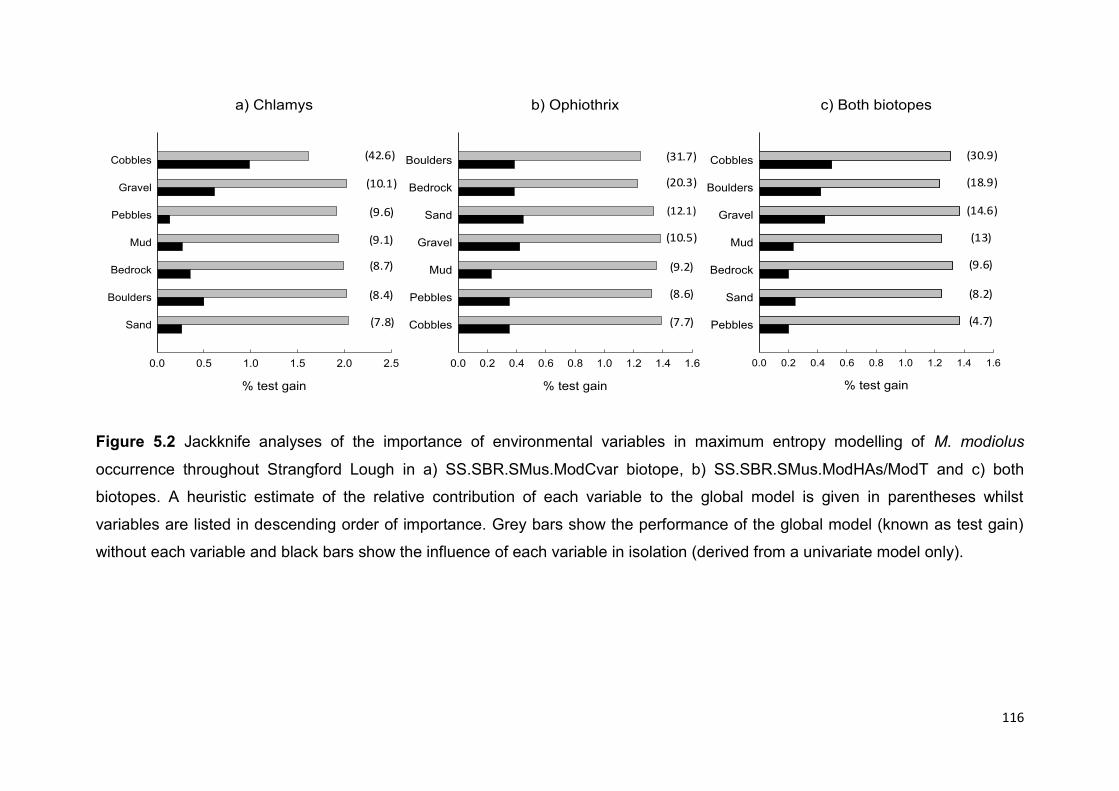
116
c) Both biotopes
% test gain
0.0 0.2 0.4 0.6 0.8 1.0 1.2 1.4 1.6
Cobbles
Boulders
Gravel
Mud
Bedrock
Sand
Pebbles
b) Ophiothrix
% test gain
0.0 0.2 0.4 0.6 0.8 1.0 1.2 1.4 1.6
Boulders
Bedrock
Sand
Gravel
Mud
Pebbles
Cobbles
a) Chlamys
% test gain
0.0 0.5 1.0 1.5 2.0 2.5
Cobbles
Gravel
Pebbles
Mud
Bedrock
Boulders
Sand (4.7)
(30.9)
(18.9)
(14.6)
(13)
(9.6)
(8.2)
(7.7)
(10.5)
(8.6)
(12.1)
(9.2)
(31.7)
(20.3)
(7.8)
(9.1)
(8.4)
(9.6)
(8.7)
(42.6)
(10.1)
Figure 5.2 Jackknife analyses of the importance of environmental variables in maximum entropy modelling of M. modiolus
occurrence throughout Strangford Lough in a) SS.SBR.SMus.ModCvar biotope, b) SS.SBR.SMus.ModHAs/ModT and c) both
biotopes. A heuristic estimate of the relative contribution of each variable to the global model is given in parentheses whilst
variables are listed in descending order of importance. Grey bars show the performance of the global model (known as test gain)
without each variable and black bars show the influence of each variable in isolation (derived from a univariate model only).

117
a)
b)
c)
Figure 5.3 Marginal response curves of the predicted probability of M. modiolus
occurrence throughout Strangford Lough in: a) SS.SBR.SMus.ModCvar biotope, b)
SS.SBR.SMus.ModHAs/ModT biotope and c) both biotopes for explanatory variables
that contributed substantially to the global maximum entropy model. The x-axis
represents percentage cover for each substratum type; the y-axis represents
probability of species occurrence.
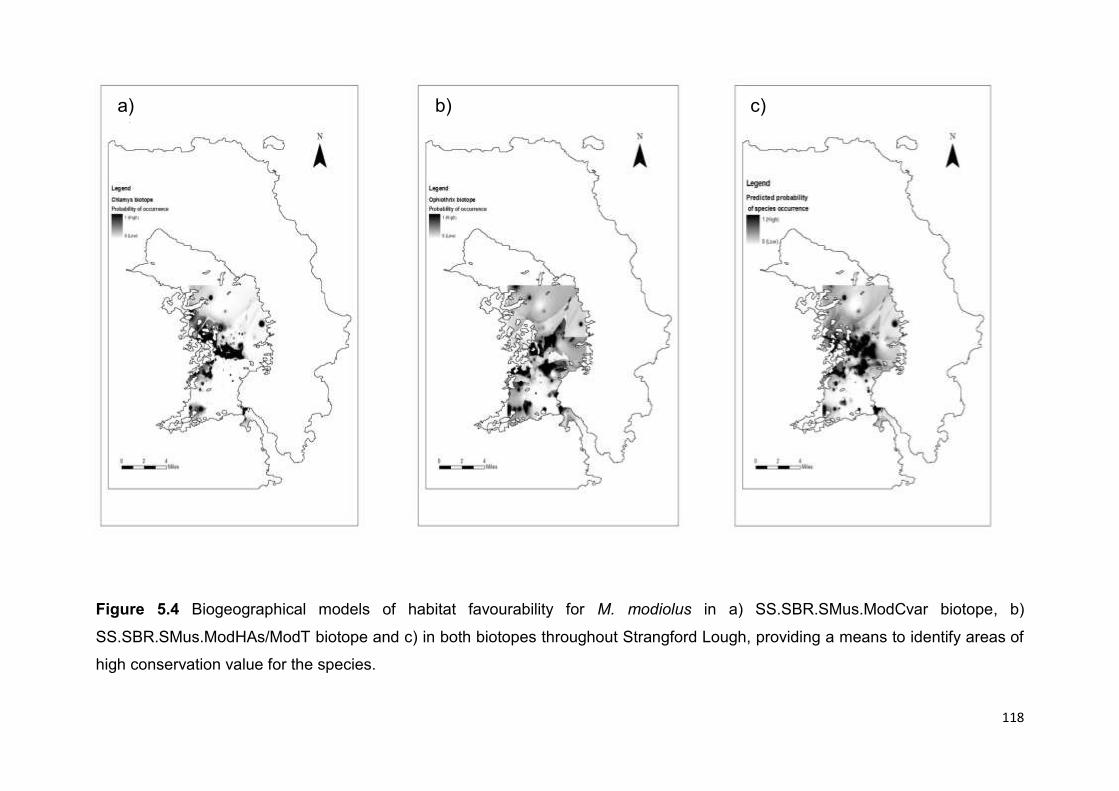
118
Figure 5.4 Biogeographical models of habitat favourability for M. modiolus in a) SS.SBR.SMus.ModCvar biotope, b)
SS.SBR.SMus.ModHAs/ModT biotope and c) in both biotopes throughout Strangford Lough, providing a means to identify areas of
high conservation value for the species.
a) b)
c) b) a)
b)
119
5.5 Discussion
This study aimed to provide objective information for conservation management
about sites where intervention, i.e. translocation or captive breeding and release,
and natural recovery is potentially most likely for M. modiolus within Strangford
Lough. This is the first study to examine the relationships between M. modiolus and
substrata suitability. Currently, the most favourable habitat for M. modiolus is in the
mid region of Strangford Lough. M. modiolus distribution is quite restricted with the
probability of occurrence peaking within narrow bands of the spectrum of variability
available within most environmental parameters. Although the model revealed slight
differences in the relative importance of different substrata in explaining the
distribution of each biotope, in general M. modiolus was positively associated with
softer finer substrata and negatively associated with coarse substrata (Figure 5.3).
The model predicted that the probability of occurrence of M. modiolus, was very high
where softer finer substrata, such as mud and sand, predominated and virtually zero
in areas dominated by coarser substrata, such as cobbles, boulders, gravel and
bedrock.
Overall, the distribution of M. modiolus predicted by the model reflected the known
historic distribution (Section 2). The model was also able to identify discrete areas
well outside the current distribution as being suitable for M. modiolus. Chiefly, the
northern end of „The Narrows‟, the north, east and south west perimeter of the
distribution model, and the western perimeter of the Strangford Lough basin.
The relationship between M. modiolus and substrata can be explained by wave
exposure, current and sedimentation. The entrance to Strangford Lough has a high
current speed during ebb and flow tides. Because of current speed in this region,
there is a lower likelihood of sedimentation. That is, M modiolus spat would be less
likely to fall and settle in areas with greater tidal or current velocity. Therefore, the
positive association observed with sand and mud may reflect areas of the Lough that
permits spat to settle on the sea bed. A higher model AUC value for the
SS.SBR.SMus.ModCvar (northern) biotope than the SS.SBR.SMus.ModHAs/ModT
southern biotopes indicates a much narrower habitat niche, in terms of substrata. As
substrata are most likely highly collinear with current speed and sedimentation, we
feel that they are robust variables. Time did not permit the inclusion of other

120
variables held by AFBI, such as Chlorophyll α (Chl α); the potential for the inclusion
of such data should be investigated further.
The habitat suitability map supports the proposal for a total protection zone within
the mid region of the Lough (Section 8) and will inform the selection of potential
restoration sites (Section 6.1).

121
6.0 Intervention actions
The long term objective of the Modiolus reef Restoration Plan (MRP) is “to restore
the Strangford Lough Modiolus biogenic reef feature to Favourable Conservation
Status”. If natural recovery is not observed, active restoration approaches are
needed. The main aim of this part of the project was to investigate and develop
intervention methodologies to restore M. modiolus reefs in Strangford Lough. The
specific methodologies tested by the Modiolus Restoration Research Group (MRRG)
are based on restoration protocols and guidelines for other bivalve species (Caddy &
Defeo 2003; Brumbaugh et al. 2006).
This section of the report deals with the following intervention approaches:
6.1 Translocation of natural M. modiolus reefs (Undertaking 11).
6.2 Provision of substrate to create favourable sites and enhance natural
recruitment (Undertaking 12).
6.3 Culturing M. modiolus in a dedicated hatchery, re-seed beds and
monitor recovery (Undertaking 13).

122
6.1 Translocation or restructuring of scattered, un-
clumped adult Modiolus modiolus and subsequent
monitoring (Undertaking 11)
6.1.1 Summary
The Modiolus Restoration Plan requires development of methodologies to
restore the Modiolus modiolus reef feature in the event of natural recovery not
being observed.
Translocation of adult M. modiolus into degraded sites is one of the options
tested to assess if M. modiolus biotic conditions improve.
An artificial reef was constructed using king scallop, Pecten maximus, as
cultch for 6000 relaid adult M. modiolus to determine survival of translocated
mussels, as well as assess the effect of elevation.
The present experiment was conducted within the southern basin of
Strangford Lough where the M. modiolus community typically belongs to a
mixture of M. modiolus with hydroids and large solitary ascidians
(SS.SBR.SMus.ModHAs) and M. modiolus with hydroids and red seaweeds
(SS.SBR.SMus.ModT) biotopes .
The experimental design incorporated elevated and flattened artificial reefs,
and mussels relaid directly on the seabed.
Survival in all treatments was high and no significant difference in mortality
occurred between treatments.
Numbers of species associated with the constructed reef increased with
greater habitat complexity of the reef structure. This was interpreted as a
reflection of the natural reef forming process by M. modiolus.

123
Spat collectors deployed near the cultch site indicate natural recruitment of M.
modiolus spat from sources in the surrounding area.
Regular monitoring of the artificial M. modiolus reef is advised. The monitoring
should include adult mussel survival, reef elevation and structure, natural
M.modiolus spat recruitment and diversity of the associated reef community.
This experiment has demonstrated that translocation of adult horse mussels
onto purpose-built artificial reefs consisting of shell cultch is likely to enhance
recovery and natural recruitment providing additional brood-stock to damaged
areas.
It is recommended that a similar trial is conducted at a suitable site in the
northern basin to stimulate recovery of the SS.SBR.SMus.ModCvar biotope.

124
6.1.2 Introduction
Translocation of shellfish stocks to enhance natural populations in depleted or
damaged areas is known as restocking (Caddy & Defeo 2003). Restocking has been
used to enhance natural shellfish populations of scallops (Peterson et al. 1996),
oysters (Mann & Evans 2004) and clams (Rice et al. 2000). Restocking activities
often involve and may require a combination of habitat manipulation (addition of
settlement substratum or „cultch‟) and hatchery production in order to restore the
population (Caddy & Defeo 2003). Loss of relief (elevation above the seabed) is a
common feature of all damaged biogenic reefs (Schulte et al. 2009) and as a result,
construction of 3-dimensional reefs has become a widely used approach, particularly
in the USA. These elevated reefs also enhance the recruitment and survival of, for
example, oysters and their associated reef communities providing interstitial space
within the reef matrix and increasing the survival of spat (Bartol & Mann 1997).
Few, if any of the remaining M. modiolus beds in Strangford Lough are elevated.
In addition, many of the remaining animals are in scattered clumps. The loss of
elevation has several important repercussions for the reef which include 1) the
reduction in the water flow around the reef and hence food supply, 2) greater
sedimentation on the reef via re-suspension from the seabed and natural settlement
of particles, 3) increased disease dynamics and 4) reduced dispersal of gametes and
larvae because of reduced water flow. Some of the effects are probably habitat-
specific, but all studies to date indicate enhanced bivalve performance with
increased elevation above the seabed as a result of increased food flux, reduced
sedimentation and/or reduced low oxygen stress (Schulte et al. 2009). The
deployment of cultch has proved highly successful in the regeneration of biogenic
reefs formed by different bivalve species worldwide (Uttting 1988; Héral 1990; Leard
et al. 1999; Wesson et al. 1999; Cranfield et al. 2001; Smyth 2007).
Within Strangford Lough, intervention based on concentrating scattered M.
modiolus into viable reef clumps will need to assess the required relief yet minimise
the translocation of locally collected cultch and live M. modiolus. As a result of these
requirements a medium-scale experiment was designed involving the deployment of
cultch at one site South East of the Brown Rocks (Figure 6.1.1). It is hypothesised
that the deployment of this shell cultch will create a more suitable area for the

125
translocation of wild adult and hatchery reared M. modiolus. The cultch deployed will
also increase the availability of natural settlement substratum for wild M. modiolus
spat thus enhancing natural recruitment.
The artificial reefs will also increase habitat complexity therefore increasing the
biodiversity in the associated faunal assemblages (Cranfield et al. 2004).
6.1.3 Aims and objectives
The overall aims of this part of the current project were to develop field techniques
to deploy cultch at experimental sites and to evaluate the use of cultch as a long-
term strategy for the restoration of M. modiolus biotopes in Strangford Lough.
Specific objectives were to:
1) Determine if survival and expansion of translocated clumped M. modiolus are
enhanced on elevated cultch plots when compared to flattened cultch and
unmodified substratum.
2) Establish baseline data for future investigations into biological community
change through succession that may result from deployment of cultch.
3) Investigate the natural settlement of M. modiolus spat on cultch plots.
6.1.4 Materials and Methods
6.1.4.1 Site selection
The main considerations to select a suitable site for shellfish restoration include:
1) the proposed site must be within the historic distribution range of the species in
question; 2) seabed condition must be suitable to support the addition of shell cultch
and translocated stocks; 3) the area should ideally be a „sink‟ area for larvae
transported from a „source‟ area; 4) currents should be sufficient to deliver food and
oxygenated water; and 5) avoid areas where threats to shellfish stocks still exist
(Brumbaugh et al. 2006).
Two cultch deployment sites within the historic distribution range of M. modiolus in
Strangford Lough were initially proposed 1) South East of Sand Rock (54°
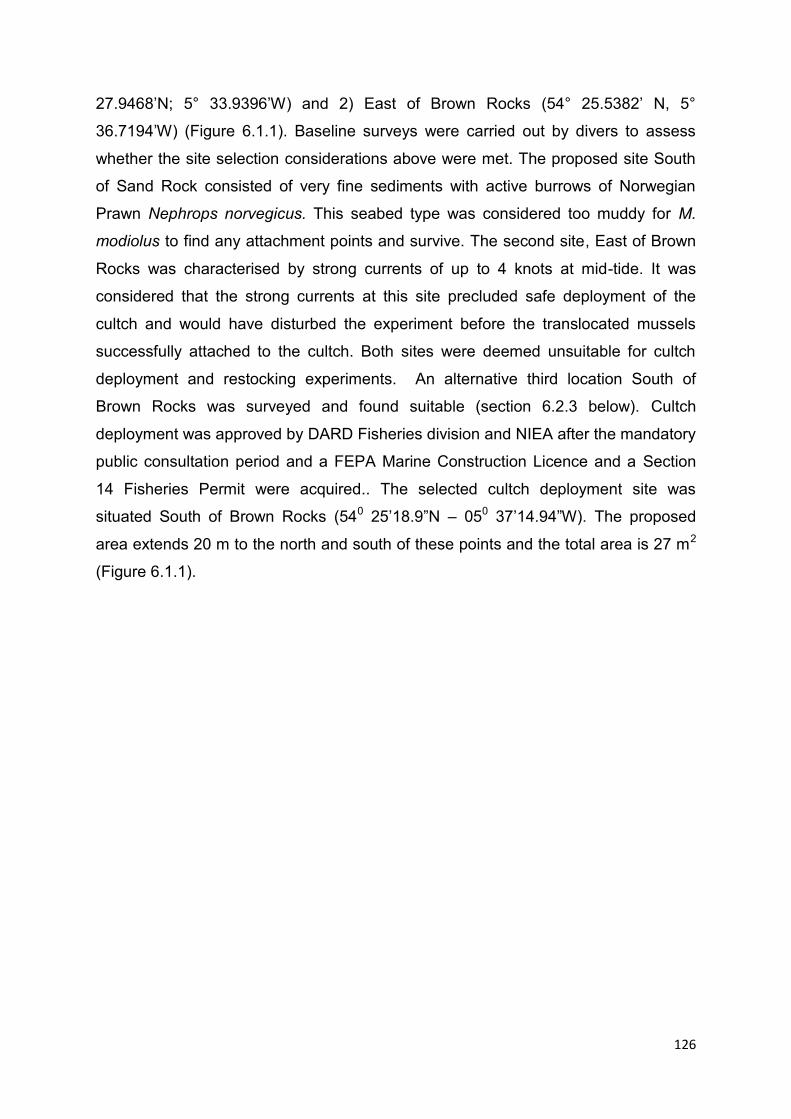
126
27.9468‟N; 5° 33.9396‟W) and 2) East of Brown Rocks (54° 25.5382‟ N, 5°
36.7194‟W) (Figure 6.1.1). Baseline surveys were carried out by divers to assess
whether the site selection considerations above were met. The proposed site South
of Sand Rock consisted of very fine sediments with active burrows of Norwegian
Prawn Nephrops norvegicus. This seabed type was considered too muddy for M.
modiolus to find any attachment points and survive. The second site, East of Brown
Rocks was characterised by strong currents of up to 4 knots at mid-tide. It was
considered that the strong currents at this site precluded safe deployment of the
cultch and would have disturbed the experiment before the translocated mussels
successfully attached to the cultch. Both sites were deemed unsuitable for cultch
deployment and restocking experiments. An alternative third location South of
Brown Rocks was surveyed and found suitable (section 6.2.3 below). Cultch
deployment was approved by DARD Fisheries division and NIEA after the mandatory
public consultation period and a FEPA Marine Construction Licence and a Section
14 Fisheries Permit were acquired.. The selected cultch deployment site was
situated South of Brown Rocks (540 25‟18.9”N – 050 37‟14.94”W). The proposed
area extends 20 m to the north and south of these points and the total area is 27 m2
(Figure 6.1.1).

127
Figure 6.1.1 MRRG proposed and amended cultch deployment sites.
6.1.4.2 Survey methodology
A buoyed shot line was dropped in the centre of the site. Two transects were
surveyed from the north east to the south west and from the south east to the north
west of the proposed sites. Four spot searches using a circular search pattern were
also carried out at 10 m and 20 m intervals (Figure 6.1.2). Photographs were taken
every 10 m along transects (Figure 6.1.3) and species occurrence and abundances
were recorded (Table 6.1.1).
128
Figure 6.1.2 Schematic of survey strategy carried out at potential cultch deployment
sites.
6.1.4.3 Site selection survey results
The third proposed site was located within the South Basin M. modiolus
distribution range. M. modiolus beds have been mapped by the MRRG in close
proximity to the site. Seabed composition consisted of fine sand with overlying
broken mixed shell (mostly M. modiolus), with few pebbles and cobbles (Figure
6.1.3). This substrate type is characteristic of the sublittoral biotopes
SS.SBR.SMus.ModHAs/ModT (Connor et al. 2004) found in Strangford Lough‟s
South Basin. The faunal assemblage observed is typical for this substratum type and
it is not regarded as rare. Phyla recorded included sponges, cnidarians, tunicates,
bryozoans and echinoderms. The tunicate Ascidiella aspersa and the crinoid
Antedon bifida were the most frequently recorded species (Table 6.1.1). The
proposed site is also considered a „sink‟ for M. modiolus larvae as spat collector and
population structure analysis (Section 6.2) documented high recruitment levels in the
area. The location South of Brown Rocks met the main pre-requisites to attempt the
cultch deployment and translocation experiment.
Transect lines
Circular survey lines
Centre of surveyed areas

129
Figure 6.1.3 Seabed surface at the cultch site area pre-cultch deployment. The
tunicate Ascidiella aspersa and the burrowing anemone Cerianthus lloydii (left
photograph) were some of the species recorded.
Table 6.1.1 Species associated with cultch site South of Brown Rocks (*SACFOR
scale abundance codes)
Species Abundance*
Suberites carnosus O Cerianthus lloydii C Antedon bifida F Echinus esculentus O Asterias rubens F Ophiocomina nigra F Ophiura albida O Flustra foliacea O Ascidiella aspersa F
6.1.4.4 Artificial reef experimental design
Four randomly allocated plots were established for each treatment: elevated,
flattened and „off-cultch‟ (Figure 6.1.4).

130
Figure 6.1.4 Position of randomly allocated cultch plots south of Brown Rocks.
6.1.4.5 Deployment of cultch
Approximately 10 tonnes of weathered scallop shell were sourced from a local
shellfish processing plant at Portavogie, Co. Down. Aging of the shells used in
shellfish restoration programs is recommended to avoid transmission of parasites or
pathogens (Bushek et al. 2004).
The shell was bagged into 0.5 tonne lots using polypropylene sacks for
transportation and ease of deployment. A Manitou© crane was used to load the
bagged shell onto two 11 x 6 m barges (Figure 6.1.5a). The deployment barge was
equipped with a HiAb© crane and when on-site, a 1 tonne mooring block was
lowered to act as anchor for the support vessels and attachment point for a Ultra
Short Baseline (USBL) acoustic beacon and Odyssey® data loggers (Figure 6.1.6).
Once on-site the deployment barge used the crane to lower the first bag to a depth
of 1m below the surface to allow trapped air to escape from the bagged shell (Figure
6.1.5b). Once the bag was negatively buoyant it was un-hitched from the crane and
lowered to the seabed on a buoyed shackled deployment rope. Using a strap and
shackle the second bag was attached to the deployment rope. When negatively
131
buoyant, the strap was released and the bag was sent down the rope. This process
was repeated until all the remaining bags for the plot were in position. This
procedure was carried out at the seven remaining sample stations until all 10 tonnes
were on-site.
Once the bagged shell was in-situ and the barges were off-station, divers working
in teams of two descended the buoyed deployment ropes (Figure 6.1.5 c & d) to
connect the cultch deposits using guide lines. The deployment ropes were
unshackled by the divers thereby leaving no obvious sign of the sample plots on the
surface.
The bagged shell was left on the seabed for 1 month to ensure it was firmly in
place, allowing any air pockets trapped between the scallop valves time to disperse
from the sacks. Divers working in teams of two descended a shot line, using the
guide line to find the individual plots. The sacks were removed using a rope and
lifting strap which was passed through all four of the lifting loops (Figure 6.1.7). Diver
1 remained in-situ on the top of the sack while Diver 2 cut three sides. The divers
then ascended with the rope. Once the divers were out of the water, the rope was
made fast and the sack was dragged clear and retrieved. The procedure was
repeated at the seven remaining sample stations. The plots at each sample station
were prepared by the divers to match the four elevated and four flat configurations of
the experimental design. The divers flattened 4 of the cultch plots and built up the 4
elevated plots to a height of approximately 2m. All experimental plots were marked
sublittorally with a numbered flag (Figure 6.1.8). The plots were then left for a further
two weeks to allow the cultch to stabilise before translocation of M. modiolus
commenced.

132
Figure 6.1.5 Cultch deployment procedures: a) Unloading bagged shell from
Manitou© crane and b) HIAB® bag transfer to deployment barge, c) dive team
prepares to enter water, d) divers descend deployment rope.
a)
a) b)
c) d)
C) d)
a) b)

133
Figure 6.1.6 Deployment of bagged shell from anchored barges.
Figure 6.1.7 Sack retrieval and shell deployment.
6.1.4.6 Translocation of adult Modiolus modiolus
One of the options considered at the beginning of the project was to source ca.
800 kg of adult M. modiolus from the beds located in Donaghadee Sound for
deployment in suitable areas in Strangford Lough. The use of non-local populations
in shellfish restocking programs is not recommended as the newly introduced
population might not adapt to the local environmental conditions (Caddy et al. 2003).
The use of local broodstock also minimizes the risk of introducing alien species that
Crane Deployment barge
Bagged shell
Lifting strap leading to surface
Attached sack loops
Cut sides

134
can adversely affect the local communities. Therefore the M. modiolus stocks used
in the translocation experiments were collected from Strangford Lough populations.
The MRRG dive team carried out collection dives on two fragmented beds located
near the cultch six weeks prior to the cultch deployment. This resulted in a total
translocation sample of approximately 6000 M. modiolus. The sample was bagged
into polypropylene mesh sacks at 40 individual mussels per sack and left in running
seawater tanks in Queen‟s University Marine Laboratory for over two months in
preparation for deployment. Once the cultch plots were positioned, the mesh sacks
were deposited on the seabed and attached to a mooring block where they remained
for 4 weeks. Previous observations from Roberts et al. (2004) suggested that
mortality among adult M. modiolus by Asterias rubens will be significantly reduced in
a clumped structure. This procedure maximised byssal attachment between the
individual mussels allowing the formation of tightly bound clumps. Once the cultch
plots were stabilised and the M. modiolus had formed clumps, ca.500 mussels were
placed on each experimental treatment (Figure 6.1.8).
6.1.4.7 Monitoring
In-situ environmental monitoring began after translocation of broodstock mussels
concluded on the second week of March 2010. Parameters recorded included
bottom temperature and irradiance by means of data loggers attached to the
mooring block. Odyssey® data-loggers were set to record data every 10 minutes
from March to November. Current profiling was carried out on the second week of
May while chlorophyll levels were monitored monthly from May to November 2010.
Spat collectors were also deployed nearby to monitor natural spat recruitment levels.
Replicate design and natural recruitment results at the experimental cultch site are
described in section 6.2.
A baseline survey was carried out in April 2010 using digital video and still
photography. The survey documented the structural conditions of the experimental
plots immediately after deployment also documenting any marine fauna attracted to
the site.
Divers returned to the cultch experiment in September 2010. One diver
photographed replicate 0.0625m2 quadrats in each treatment plot while the second
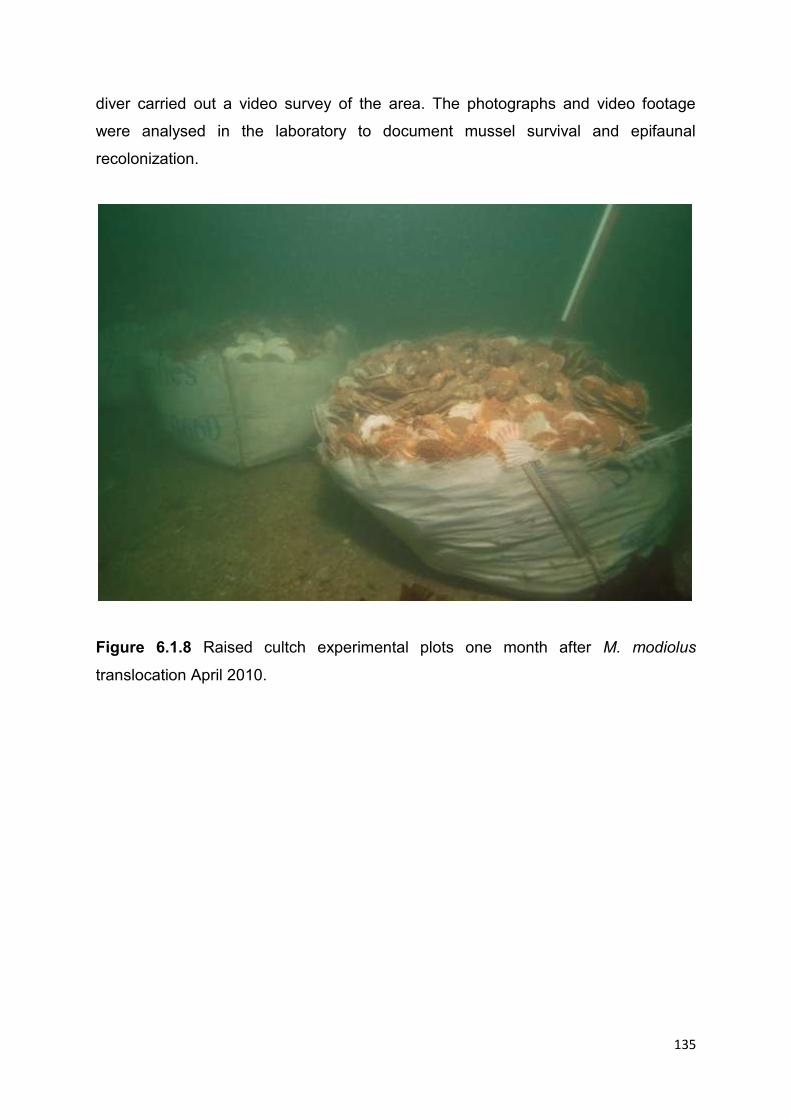
135
diver carried out a video survey of the area. The photographs and video footage
were analysed in the laboratory to document mussel survival and epifaunal
recolonization.
Figure 6.1.8 Raised cultch experimental plots one month after M. modiolus
translocation April 2010.

136
6.1.4.8 Additional clumping behaviour experiment
Clumping in M. modiolus was studied in a field experiment using different
quantities of dead shell to assess if viable clumps can be generated using fewer
mussels. Live M. modiolus were mixed with 25%, 50 and 75% M. modiolus shells
and placed in biodegradable bags (Table 6.1.2). Divers randomly positioned a total
28 bags in a location within the Scott‟s Hole site leased to Queen‟s University Belfast
by the Crown Estates. The location proved unsuitable as high mortalities occur
probably due to the soft muddy sand substrate and current regimes that
characterises it.
Table 6.1.2 Treatments for the re-clumping experiment.
Treatment
Live M. modiolus/shell mixture 100% 66% 33% 0%
Replicates per site 7 7 7 7
M. modiolus per bag 45 30 15 0
Shell per bag 0 30 60 90
Total treatment M. modiolus 315 210 105 0
Total Modiolus for a site 630 630 630 630
6.1.5 Results
6.1.5.1 Epifaunal community succession
6.1.5.1.1 Baseline survey
A survey was carried out 1 month after the experimental lay-out was completed
and 2 weeks after the all M .modiolus had been translocated and relaid on all
treatments. Opportunistic taxa such as echinoderms and crustaceans were common
on the plots and adjacent area. The starfish Asterias rubens and the sea urchin
Echinus esculentus were common on the flattened and unmodified substratum plots

137
but absent from the raised plots. Other echinoderm species included the starfish,
Henricia oculata, and the sun star, Crossaster paposus. Crustaceans common in all
plot types included the velvet swimming crab, Necora puber, the hermit crab,
Pagurus bernhardus, and the brown crab, Cancer pagurus (in order of abundance).
The spider crab, Macropodia rostrata, and the green crab, Carcinus maenas, were
also present. Fish species were attracted to the artificial reefs early after deployment.
The most commonly recorded species were the two-spotted goby, Gobiusculus
flavescens and goldsinny wrasse, Ctenolabrus rupestris. Benthic fish species such
as the black goby, Gobius niger and the butterfish, Pholis gunnellus, were also
recorded among the scallop shells and in the crevices left between the sacks.
6.1.5.1.2 Follow-up 6-month survey
There was a dramatic increase in the numbers and abundances of species
documented by divers during the survey carried out 6 months after the start of the
translocation experiment. Mobile species appeared to be using the artificial reef for
food and refuge while sessile species such as hydroids and tunicates had colonized
the entire substrate, making mussel mortality counts difficult. A total 39 different
species belonging to 8 different phyla were recorded during the the monitoring dives
and included 7 Porifera, 4 Cnidaria, 1 Polychaeta, 9 Crustacea, 7 Echinodermata, 1
Tunicata, 2 Bryozoa and 7 Osteychties (Bony Fish) (Table 6.1.3; Figures 6.1.10-12).
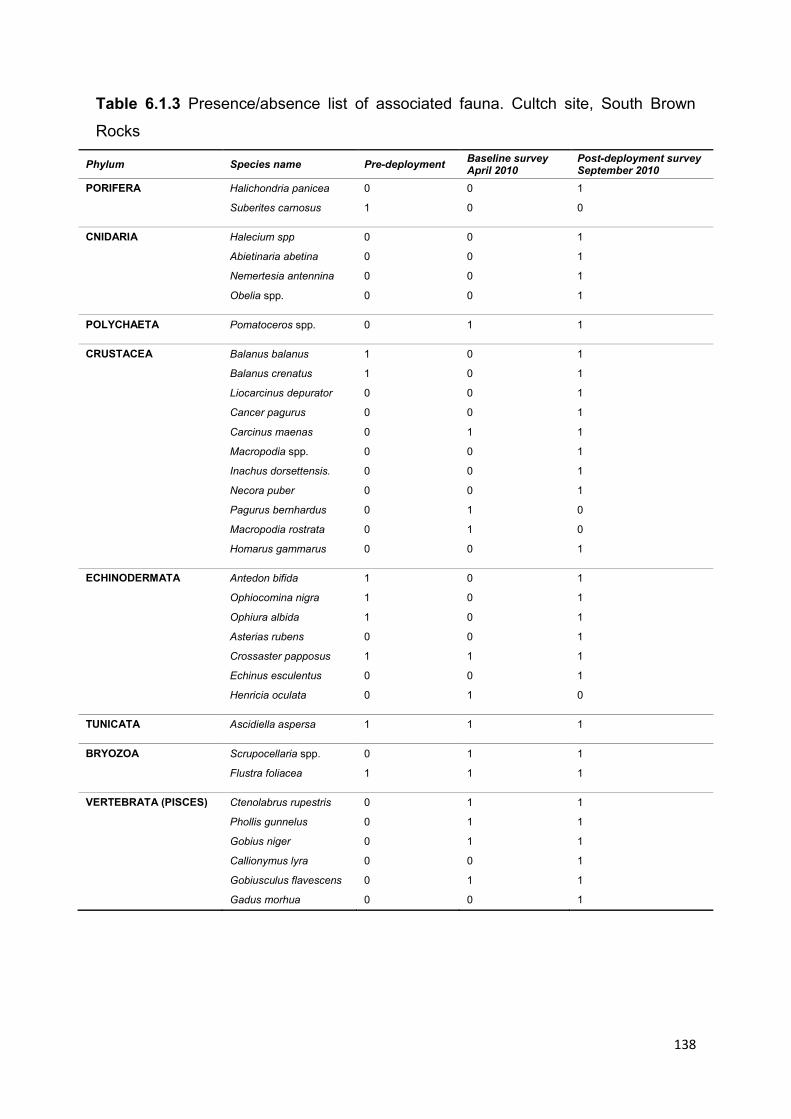
138
Table 6.1.3 Presence/absence list of associated fauna. Cultch site, South Brown
Rocks
Phylum Species name Pre-deployment Baseline survey April 2010
Post-deployment survey September 2010
PORIFERA Halichondria panicea 0 0 1
Suberites carnosus 1 0 0
CNIDARIA Halecium spp 0 0 1
Abietinaria abetina 0 0 1
Nemertesia antennina 0 0 1
Obelia spp. 0 0 1
POLYCHAETA Pomatoceros spp. 0 1 1
CRUSTACEA Balanus balanus 1 0 1
Balanus crenatus 1 0 1
Liocarcinus depurator 0 0 1
Cancer pagurus 0 0 1
Carcinus maenas 0 1 1
Macropodia spp. 0 0 1
Inachus dorsettensis. 0 0 1
Necora puber 0 0 1
Pagurus bernhardus 0 1 0
Macropodia rostrata 0 1 0
Homarus gammarus 0 0 1
ECHINODERMATA Antedon bifida 1 0 1
Ophiocomina nigra 1 0 1
Ophiura albida 1 0 1
Asterias rubens 0 0 1
Crossaster papposus 1 1 1
Echinus esculentus 0 0 1
Henricia oculata 0 1 0
TUNICATA Ascidiella aspersa 1 1 1
BRYOZOA Scrupocellaria spp. 0 1 1
Flustra foliacea 1 1 1
VERTEBRATA (PISCES) Ctenolabrus rupestris 0 1 1
Phollis gunnelus 0 1 1
Gobius niger 0 1 1
Callionymus lyra 0 0 1
Gobiusculus flavescens 0 1 1
Gadus morhua 0 0 1

139
Figure 6.1.10 Chart showing the clear increase in marine life diversity since the
deployment of the artificial M. modiolus reef in the South Brown Rocks area in
March 2010.
Figure 6.1.11 Chart showing the temporal changes in biodiversity of the faunal
assemblage associated with the cultch plots
0
1
2
3
4
5
6
7
8
9
10
Baseline 3 months 6 months
Tota
l nu
mb
er
of
spe
cie
s p
er
taxo
n
Porifera
Cnidaria
Polychaeta
Crustacea
Echinodermata
Tunicata
Bryozoa
Pisces
0
2
4
6
8
10
12
Baseline 3 months 6 months
Me
an n
um
be
r o
f sp
eci
es
±SD
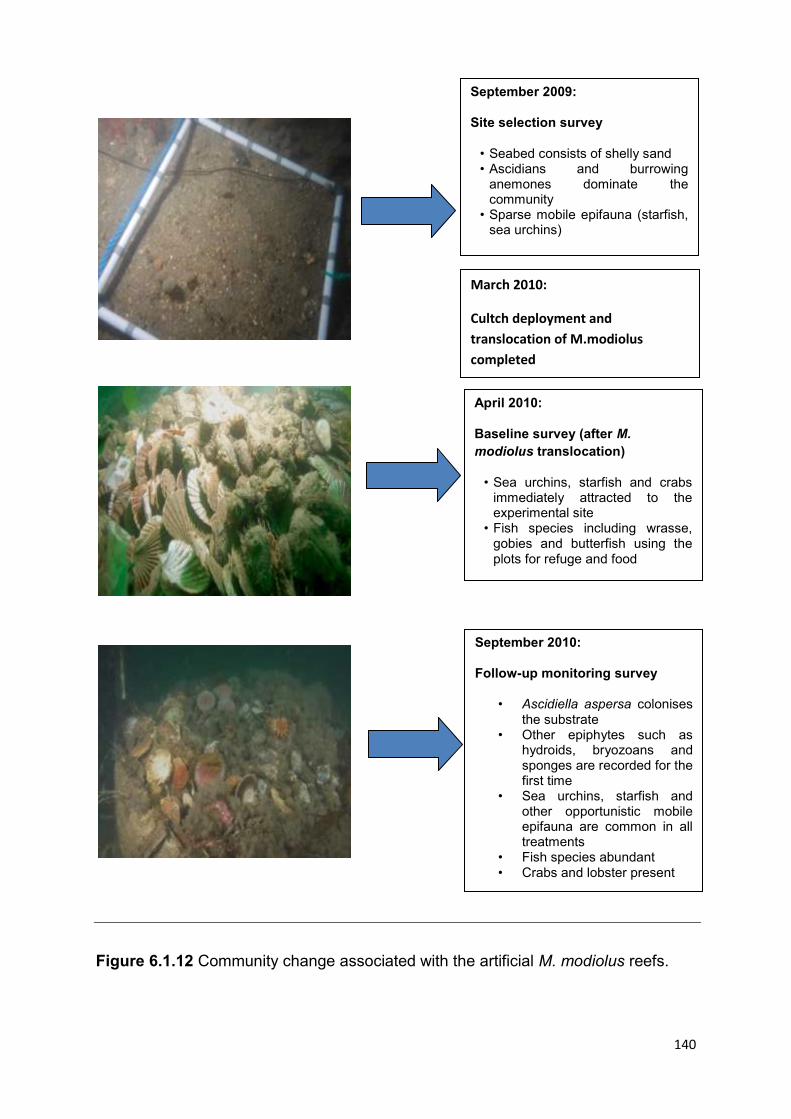
140
Figure 6.1.12 Community change associated with the artificial M. modiolus reefs.
September 2009:
Site selection survey
• Seabed consists of shelly sand • Ascidians and burrowing
anemones dominate the community
• Sparse mobile epifauna (starfish, sea urchins)
April 2010:
Baseline survey (after M.
modiolus translocation)
• Sea urchins, starfish and crabs immediately attracted to the experimental site
• Fish species including wrasse, gobies and butterfish using the plots for refuge and food
September 2010:
Follow-up monitoring survey
• Ascidiella aspersa colonises the substrate
• Other epiphytes such as hydroids, bryozoans and sponges are recorded for the first time
• Sea urchins, starfish and other opportunistic mobile epifauna are common in all treatments
• Fish species abundant • Crabs and lobster present
March 2010:
Cultch deployment and
translocation of M.modiolus
completed

141
6.1.5.2 Effect of relief on M. modiolus survival
Individual M. modiolus clumped fast and remained attached to the substratum and
the cultch structure was intact 6 months after deployment.
Divers initially suggested that elevated plots offered more protection against
mobile predators such as starfish, Asterias rubens, green crab, Carcinus maenas
and sea urchin, Ecinus esculentus, which were common on the flattened cultch plots
and untreated substratum plots. Mobile scavengers including some A. rubens
feeding on M. modiolus were recorded in all treatments during the 6-month follow-up
survey. However, survival rates were high in all treatments (Figure 6.1.13): 1)
Raised=92%; 2) Flattened=79%; and 3) Substratum= 82%. Overall, mortalities of
translocated mussels were slightly higher on untreated substratum and flattened
cultch plots but survival was not significantly better on elevated cultch plots (ANOVA:
F(1,24)=0.831; p>0.05).
Figure 6.1.13 Graph showing differences in M. modiolus survival in each treatment
6 months after deployment (± standard deviations).

142
6.1.6 Discussion
Substratum type and hydrodynamic conditions at the artificial M. modiolus reef
site were initially regarded as suitable and the results obtained during the baseline
and follow-up surveys confirmed the experiment had been established successfully.
Mussel survival was also high in all treatments with no significant advantages from
reef elevation. The natural elevation of M. modiolus reefs in relatively undamaged
conditions, such as the Craigyouran and Round Island Pinnacle beds, is not higher
than 50 cm (MRRG divers, pers. obs.). It is possible that reef elevation is not critical
in a species reported to range from epifaunal (Davenport & Kjørsvik 1982) to semi-
infaunal (Meadows & Shand 1989) or infaunal (Holt et al. 1998) in its life habits. It is
too soon to reject the hypothesis that substratum elevation provides significantly
better survival conditions for M. modiolus and further surveys will be necessary.
The translocated mussels rapidly attached themselves to the scallop shell and
formed tight clumps, replicating their natural clumping behaviour. The constructed
reef attracted a large number of mobile, largely opportunistic species soon after
deployment. Sessile epifauna re-colonized the shell surfaces of the translocated
mussels; hydroids, bryozoans and sponges usually associated with horse mussel
beds were observed by divers during the follow-up survey six months after
deployment. Pseudofaeces and sediment accumulated in the spaces between the
mussel clumps and the scallop shell increasing habitat complexity and attracting
polychaetes, amphipods and other small macroinvertebrates. Habitat complexity
increases the niches available for different species in the habitat recolonization
process. Cranfield et al. (2004) reported differences in the macrofaunal assemblage
of sites of different levels of habitat complexities in the Foveaux Straits, New
Zealand, after oyster dredging operations ceased. The range of habitats included
badly impacted reef areas and localized regenerated patches in the dredged
seafloor. Cranfield et al. (2004) postulated a model of macrofaunal succession of
increasing complexity during the habitat regeneration process. The first stage after
impact included re-colonization by bivalves and encrusting bryozoans followed by
mussels, Modiolus areolatus, and oysters, Ostrea chilensis, which attracted
gastropods and served as settlement substrata for tunicates and mussel and oyster
spat. As provision of suitable substrata increases so does the complexity of the

143
community with polychaetes, sponges and bryozoans forming the last stages of the
biogenic reef and the assemblage succession (Cranfield et al. 2004).
The assemblage succession recorded in the brief period between the completion
of the reef construction and the first monitoring survey six months later probably
reflects the natural reef forming process by M. modiolus communities. All the species
recorded are common in the SS.SBR.SMus.ModHAs/ModT biotope typical of
Strangford Lough‟s South Basin.
In any shellfish restoration program the concept of larval sources and sinks for
stock replenishment is important. Source populations have frequent recruitment and
a good representation of different size classes (Caddy et al. 2003). Natural
recruitment studies were carried out by the MRRG and the results are described in
Section 6.2. (Figures 6.1.7 and 6.1.8). Size and age-frequency histograms were
bimodal with over 50% of the population consisting of sizes less than 20mm or
mussels less than 10 years of age indicating a high degree of larvae settlement in
the South Basin area. The other age class consisted of adult mussels of ages
ranging from 20 to 45 years. Spat collectors positioned within the artificial reef from
April to July 2010 also yielded some M. modiolus spat (Section 6.2; Figure 6.1.10),
suggesting natural recruitment in the area adjacent to the cultch is occurring. The
horse mussel beds in close proximity to the experimental M. modiolus reef (Brown
Rocks, Selk Rock) are potential „sources‟ of M. modiolus spat. However, alternative
sources of larvae may include areas outside Strangford Lough as the south basin
experiences greater water exchange with the Irish Sea (Boyd 1973). This question
would best be addressed by a hydrodynamic study involving particle tracking
modelling and population genetics. It will also be necessary to carry out small-scale
removal sampling to assess if the translocated mussels are also enhancing natural
recruitment to the experimental M. modiolus reef.
Work to develop a full larval dispersal model specifically tailored for M. modiolus in
Strangford Lough is well underway. The model incorporates the hydrodynamic
effects of the islands and pladdies while adding larval development data obtained
during the pilot aquaculture trials (section 6.3). When completed, the model could be
used to select optimal sites for restoration involving cultch deployment and
translocation of M. modiolus in future.

144
6.1.7 Conclusions
The cultch deployment and M. modiolus translocation experiment was an
operational success. Monitoring to date revealed no significant differences in M.
modiolus survival between elevated cultch, flattened cultch and untreated
substratum. The results from the follow-up monitoring survey were also very positive.
Soon after deployment there were signs of a natural M. modiolus succession
underway. The increased habitat complexity attracted numerous species to an
otherwise barren area within the historic range of the species. There were also high
survival rates in the translocated mussels which rapidly clumped together. The
potential for natural recruitment enhancement needs to be tested but preliminary
spat collection experiments and population structure data shows abundant supply of
larvae from M. modiolus beds. The substratum experiments in section 6.2 indicate
that settlement of M. modiolus larvae is directly enhanced by the presence of adults
on the seafloor therefore a combination of cultch provision and broodstock
translocation, similar to the described pilot M. modiolus reef constructed by the
MRRG, is the recommended restoration approach.
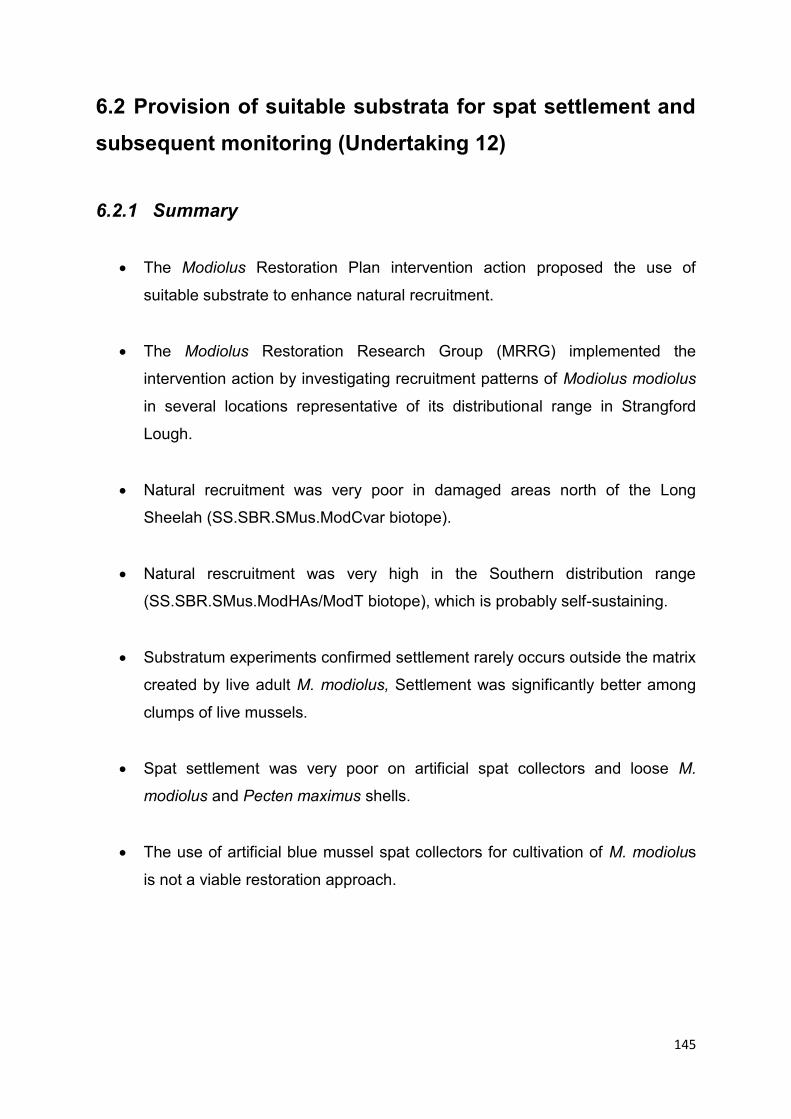
145
6.2 Provision of suitable substrata for spat settlement and
subsequent monitoring (Undertaking 12)
6.2.1 Summary
The Modiolus Restoration Plan intervention action proposed the use of
suitable substrate to enhance natural recruitment.
The Modiolus Restoration Research Group (MRRG) implemented the
intervention action by investigating recruitment patterns of Modiolus modiolus
in several locations representative of its distributional range in Strangford
Lough.
Natural recruitment was very poor in damaged areas north of the Long
Sheelah (SS.SBR.SMus.ModCvar biotope).
Natural rescruitment was very high in the Southern distribution range
(SS.SBR.SMus.ModHAs/ModT biotope), which is probably self-sustaining.
Substratum experiments confirmed settlement rarely occurs outside the matrix
created by live adult M. modiolus, Settlement was significantly better among
clumps of live mussels.
Spat settlement was very poor on artificial spat collectors and loose M.
modiolus and Pecten maximus shells.
The use of artificial blue mussel spat collectors for cultivation of M. modiolus
is not a viable restoration approach.

146
6.2.2 Introduction
The second intervention action element of the Modiolus Reef Restoration Plan
involves testing sites within Strangford Lough that may be favourable to Modiolus
modiolus spat settlement by deploying artificial hard substrata (shell cultch) and spat
collectors. Provision of additional artificial substrata to promote natural recruitment is
a key element in shellfish restoration programs (Beck et al. 2009). For example,
placement of shell or shell fragments increases recruitment of hard clams
Mercenaria mercenaria (Kraeuter 2003) and oysters Crassostrea virginea (Powers et
al. 2009).
This section investigates ways to increase the provision of such substrata. This
undertaking has two experimental sections:
1) Investigation of M. modiolus spat recruitment. Data on larval fluctuation
will be gathered using spat collectors and population structure information at
different locations representative of the two distinct M. modiolus biotopes
found in Strangford Lough.
2) Studies on the quality of the cultch as refugia for settled M. modiolus
spat
The aim was to produce an analysis of the settlement and recruitment data
recorded along with an analysis and the costs and benefits of collecting M. modiolus
spat in the context of restoration.
6.2.3 Materials and methods
Population structure and recruitment results were compared between the two
basins within Strangford Lough (Connor et al. 2004; Roberts et al. 2004). These
biotopes are: 1) “Modiolus modiolus beds with Chlamys varia, sponges, hydroids and
bryozoans on slightly tide-swept very sheltered circalittoral substrata
(SS.SBR.SMus.ModCvar)”, recorded exclusively in the North Basin; 2) the mixture of
M. modiolus with hydroids and large solitary ascidians (SS.SBR.SMus.ModHAs) and
M. modiolus with hydroids and red seaweeds (SS.SBR.SMus.ModT) which is

147
recorded mainly in the South Basin, although there is an overlap into the North Basin
(Ringhaddy Sound, Craigyouran).
6.2.3.1 Natural recruitment
Natural recruitment of M. modiolus spat was recorded by means of population
structure sampling and purposely built spat collectors.
Adult horse mussels were collected from 6 different locations representative of the
two M. modiolus biotopes present in Strangford Lough (Figure 6.2.1). The
SS.SBR.SMus.ModCvar biotope present north of the Long Sheelah is in poor
condition and very reduced in extension (Roberts et al. 2004; MRRG surveys),
therefore sampling was limited to just two locations, South of Hadd Rock and North
West of Long Sheelah. The SS.SBR.SMus.ModHAs/ModT biotope is more
widespread and the extent and condition is not considered as heavily damaged as
theSS.SBR.SMus.ModCvar biotope. A total of 4 different locations representative of
this biotope were sampled: South of Craigyouran (new M. modiolus bed found by the
MRRG in 2008), West of Round Island Pinnacle, East of Black Rock and off Selk
Rock. Samples consisting of 150 mussels from each population were collected by
divers using randomly positioned 0.25m2 area quadrats. The contents from each
quadrat were removed in its entirety and placed into 1mm mesh bags. Upon return to
the laboratory all M. modiolus clumps were carefully checked for spat. All spat
(<20mm) was graded into different sizes using a set of metallic sieves of different
mesh size. Adult and young mussels (>20mm) were counted and their length, height
and width measured to the nearest millimetre for use in population structure
analyses.
6.2.3.2 Shell aging methods
A total of 30 mussels representative of the size range were selected from the
population structure samples to study growth rate and age structure for each
biotope. In the laboratory all mussels were cleaned of epifauna, the M. modiolus spat
(<20 mm) was counted, measured and the winter bands counted to estimate the
age. The soft tissues from horse mussels bigger than 20 mm in length were removed
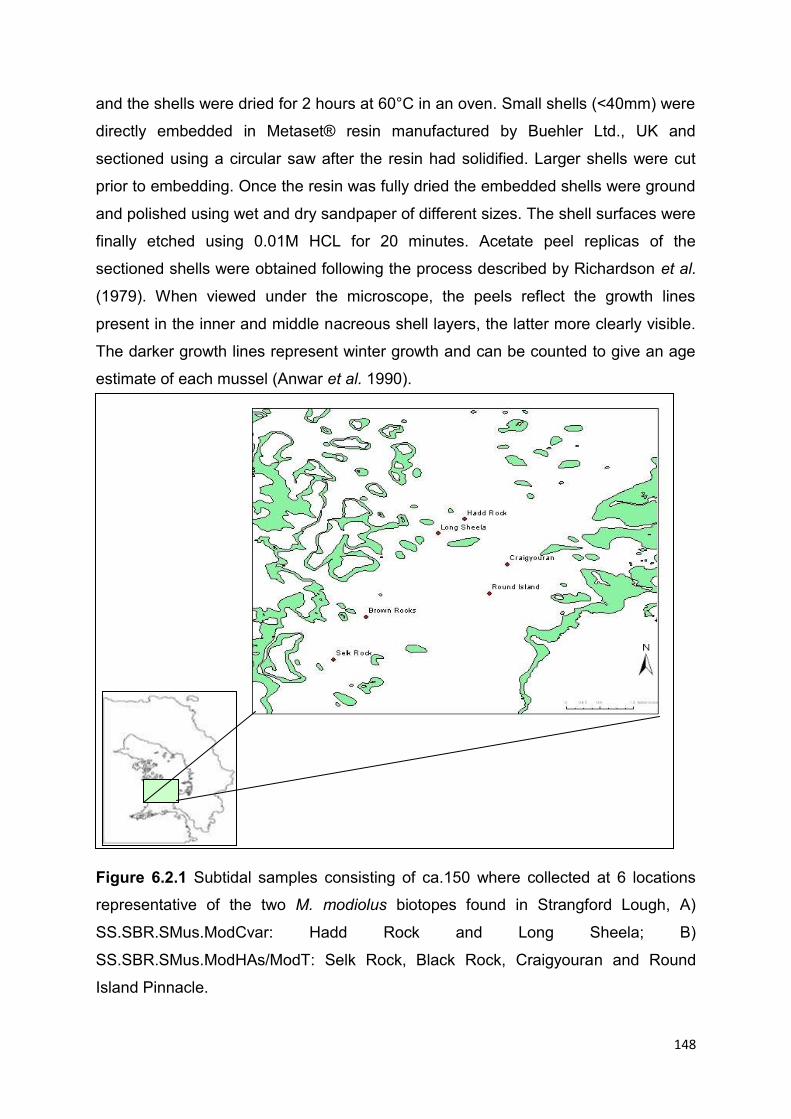
148
and the shells were dried for 2 hours at 60°C in an oven. Small shells (<40mm) were
directly embedded in Metaset® resin manufactured by Buehler Ltd., UK and
sectioned using a circular saw after the resin had solidified. Larger shells were cut
prior to embedding. Once the resin was fully dried the embedded shells were ground
and polished using wet and dry sandpaper of different sizes. The shell surfaces were
finally etched using 0.01M HCL for 20 minutes. Acetate peel replicas of the
sectioned shells were obtained following the process described by Richardson et al.
(1979). When viewed under the microscope, the peels reflect the growth lines
present in the inner and middle nacreous shell layers, the latter more clearly visible.
The darker growth lines represent winter growth and can be counted to give an age
estimate of each mussel (Anwar et al. 1990).
Figure 6.2.1 Subtidal samples consisting of ca.150 where collected at 6 locations
representative of the two M. modiolus biotopes found in Strangford Lough, A)
SS.SBR.SMus.ModCvar: Hadd Rock and Long Sheela; B)
SS.SBR.SMus.ModHAs/ModT: Selk Rock, Black Rock, Craigyouran and Round
Island Pinnacle.

149
6.2.3.3 Spat settlement
Three different treatments were tested for use in spat collection and substratum
preference experiments: king scallop Pecten Maximus shell, M. modiolus shell, and
live adult M. modiolus. A tray without contents was included as a control. The
weight/volume/surface area of the cultch was standardised before deployment. Each
treatment was set up in an oyster tray (51cm x 51cm) and the four trays were joined
together with cable ties (Figure 6.3.3).
In addition, scrubbing pads and two types of commercially available mussel spat
collecting materials used in blue mussel (Mytilus edulis) cultivation were deployed
simultaneously on the same rigs: Christmas rope and Swedish band (Figure 6.2.4).
A 50 cm length of each spat-collector material was attached to the cultch unit.
The experiment was replicated five times; each experimental rig was pegged out
to the seafloor at 3 experimental sites: Hadd Rock, Scott‟s Hole and Brown Rocks
(Figure 6.2.2). These units remained in place from June 2009 to October 2010.
Supplementary spat collectors where deployed near the artificial M. modiolus reef
constructed by the MRRG Southwest of the Brown Rocks (Section 4.1). The spat
collectors consisted of monofilament net and M. modiolus shells joined by rubber
bands, to simulate the surfaces where M. modiolus spat are usually found in natural
conditions (M. modiolus byssus threads and empty bivalve shells and hydroids and
periostracal hairs). The collectors were replicated 5 times, placed inside mesh bags
and positioned inside sections of plastic pipes of 15 cm diameter (Figure 6.2.5). The
pipes served as protection against scavengers and also helped to fix the spat
collectors to the seabed at the same time. The spat collectors were deployed in April
2010 and retrieved in August 2010.

150
Figure 6.2.2 Map showing the location of the cultch units and spat collectors
deployed by the MRRG in both the SS.SBR.SMus.ModCvar and
SS.SBR.SMus.ModHAs/ModT biotopes (north and south basins respectively).

151
Figure 6.2.3 Diagram of the cultch units used in the recruitment experiments.
MRRG, November 2008.
Scallop
shell
Modiolus
modiolus
shell
Live
Modiolus
modiolus
Control
SPAT COLLECTOR:
X-MAS TREE ROPE
SPAT COLLECTOR:
SWEDISH BAND
51 cm
51 cm
50 cm
OYSTER TRAYS
MARKER BUOY

152
Figure 6.2.4 Spat collectors used in the experiment: 1) Swedish band and 2)
Christmas tree rope.
Figure 6.2.5 Spat collectors placed on the seabed near the experimental M.
modiolus reef. Pipe tubing was used to protect the experiment from predators.
1) 2)

153
On return to the laboratory all spat collectors and cultch experiments were
submerged in 5% Sodium Hypochlorite to separate the mussels (Beduschi et al.
2009) and carefully checked for M. modiolus spat under a stereomicroscope. All M.
modiolus juveniles were counted and the attached epifauna identified, counted, fixed
in 4% Formaldehyde and finally preserved in 70% Ethanol.
Two-way ANOVA analysis with replication was carried out to compare recruitment
in each treatment and identify between the different locations studied.
6.2.4 Results
6.2.4.1 Population structure and natural recruitment
Population structure of M. modiolus is represented by a bimodal size frequency
distribution, particularly distinctive in the SS.SBR.SMus.ModHAs/ModT biotope
populations (Figure 6.2.6). Peaks of abundance for SS.SBR.SMus.ModCvar (Hadd
Rock sampling station) are 5 to 10mm and 80 to 85mm; Mode = 80.7; Mean ± SD =
80 ± 7.3 max. length = 100 mm. Medium size mussels between 20 and 60 mm were
absent from the sampled population. In the SS.SBR.SMus.ModHAs/ModT biotope
(represented by the Round Island Pinnacle M. modiolus bed) the peaks are 1 to 5
mm and 85 to 90 mm; Mode = 86.7; Mean ± SD = 86.7 ± 11.06; max length =
162mm. Medium size adults between 20 and 60 mm were found but in very low
numbers representing just 3% of the total sample population. The M. modiolus
population sampled in 2003 by Roberts et al. (2004) was similar, with slightly smaller
modal peaks of length between 70 and 80mm in the North Basin
(SS.SBR.SMus.ModCvar) populations and 75 to 80 mm in the South Basin
(SS.SBR.SMus.ModHAs/ModT). In 2003, the largest mussel from North of the Long
Sheelah was 96.3 mm in length while the largest from the Southern Basin (Black
Rock) was 113.5 mm, all smaller than the mussels recorded during the sampling
carried out by the MRRG in 2009 and 2010.

154
Figure 6.2.6 Length-frequency histograms in 5mm groupings of M. modiolus
collected from the two biotopes recorded in Strangford Lough: In blue
SS.SBR.SMus.ModCvar (poor quality M. modiolus beds, North Basin) and in red
SS.SBR.SMus.ModHAs/ModT (undamaged beds, South Basin). Samples were
randomly collected by divers in 2009 and 2010.
Recruitment was higher in the South Basin SS.SBR.SMus.ModHAs/ModT biotope,
where M.modiolus spat represented 53% of the total 1391 mussels sampled. The
SS.SBR.SMus.ModCvar M. modiolus community by contrast was clearly dominated
by older individuals with seed horse mussels accounting for less than 5% of the total
sample (N=341). Natural recruitment levels are displayed in Table 6.2.1 and Figure
6.2.7.
0
5
10
15
20
25
30
35
40
45
Fre
qu
en
cy (
%)
Shell Length (mm)
SS.SBR.SMus.ModCvar (N=341)
SS.SBR.SMus.ModHAS (N=1391)

155
Table 6.2.1 Modiolus modiolus spat (Length <20 mm) frequencies recorded from 6
sites in Strangford Lough during June 2009 and 2010 Long Sheelah and Hadd Rock
represent the SS.SBR.SMus.ModCvar biotope (North Basin) while the remaining
stations are all within the SS.SBR.SMus.ModHAs/ModT biotope (South Basin)
Figure 6.2.7 Comparative chart of natural recruitment levels of M. modiolus spat
sampled from 6 distinct beds in Strangford Lough. Colours represent biotopes: blue=
SS.SBR.SMus.ModCvar; red= SS.SBR.SMus.ModHAs/ModT.
Modiolus population Adults Spat Total Recruitment
Long Sheela 176 10 186 5.38%
Hadd Rock 154 7 161 4.35%
Craigyouran 261 205 466 43.99%
Round Island Pinnacle 167 175 342 51.17%
Black Rock 107 203 310 65.48%
Holm Bay 113 161 274 58.76%

156
6.2.4.2 Growth and age-frequency distributions
Estimated growth rates were compared using shell age estimation data recorded
from samples representative of each biotope (SS.SBR.SMus.ModCvar: N = 30;
SS.SBR.SMus.ModHAs/ModT: N = 71). The length at age data was fitted to the von
Bertalanffy growth equation using estimation methods described by King (1995). The
von Bertalanffy equation in terms of length is Lt = L∞ (1 – e–kt
) where L∞ is the length
at age t, L∞ is the theoretical maximum length the population of M. modiolus will
reach if it lived indefinitely and k is the measure of the growth rate. The parameters
L∞ and k were estimated by the Ford-Walford method (King 2003).
TheSS.SBR.SMus.ModCvar population sampled had the highest growth rate and
lower maximum predicted shell length (k = 0.082 and L∞ = 90.51 mm) whereas
mussels from theSS.SBR.SMus.ModHAs/ModTbiotope reached larger sizes at a
slower rate (k = 0.074; L∞ = 116.2 mm).
Figure 6.2.8 Estimated Von Bertalanffy growth curves for M. modiolus from
theSS.SBR.SMus.ModCvar (blue) andSS.SBR.SMus.ModHAs/ModT (red) biotopes.
Data points represent mean length calculated for each age value.
0
20
40
60
80
100
120
140
0 10 20 30 40 50 60
She
ll Le
ngt
h (m
m)
Age

157
Young mussels were recorded in both biotopes indicating recruitment occurs in
both albeit at very different frequencies. The age-frequency distributions show also a
bi-modal distribution. The SS.SBR.SMus.ModCvar biotope shows <10% of the total
population are young mussels (<5 years) while the percentage in the southern
SS.SBR.SMus.ModHAs/ModTbiotope in as high as 60%. The overall trend for older
mussels in both populations is to have a majority of mussels aged 20-30 years old.
The oldest mussels in the SS.SBR.SMus.ModCvar community were 40 years old.
The age distribution in the SS.SBR.SMus.ModHAs/ModT community is more spread
with a higher proportion of older specimens of 40 and 45 years of age.
Figure 6.2.9 Age-frequency histograms for M. modiolus collected from each biotope.
Blue=North Basin‟s M. modiolus and C. varia biotope (N = 62); red = South Basin‟s
M. modiolus with hydroids and ascidians (N = 294)
6.2.4.3 Spat settlement
Artificial spat collectors attached to the cultch experimental trays yielded no
results for M. modiolus spat. Settlement of M. modiolus spat on the monofilament
and joined M. modiolus shell collectors was low when compared to the cultch
experiments (Figures 6.2.10 and 6.2.12). A total 35 spat less than 1cm in length
were recovered from the monofilament net treatments while only 13 were found on
horse mussel shells. Statistical analysis of the results showed monofilament net was
0
10
20
30
40
50
60
70
5 10 15 20 25 30 35 40 45
Fre
qu
en
cy (
%)
Age (yr)
SS.SBR.Smus.ModCvar
SS.SBR.Smus.ModHAS
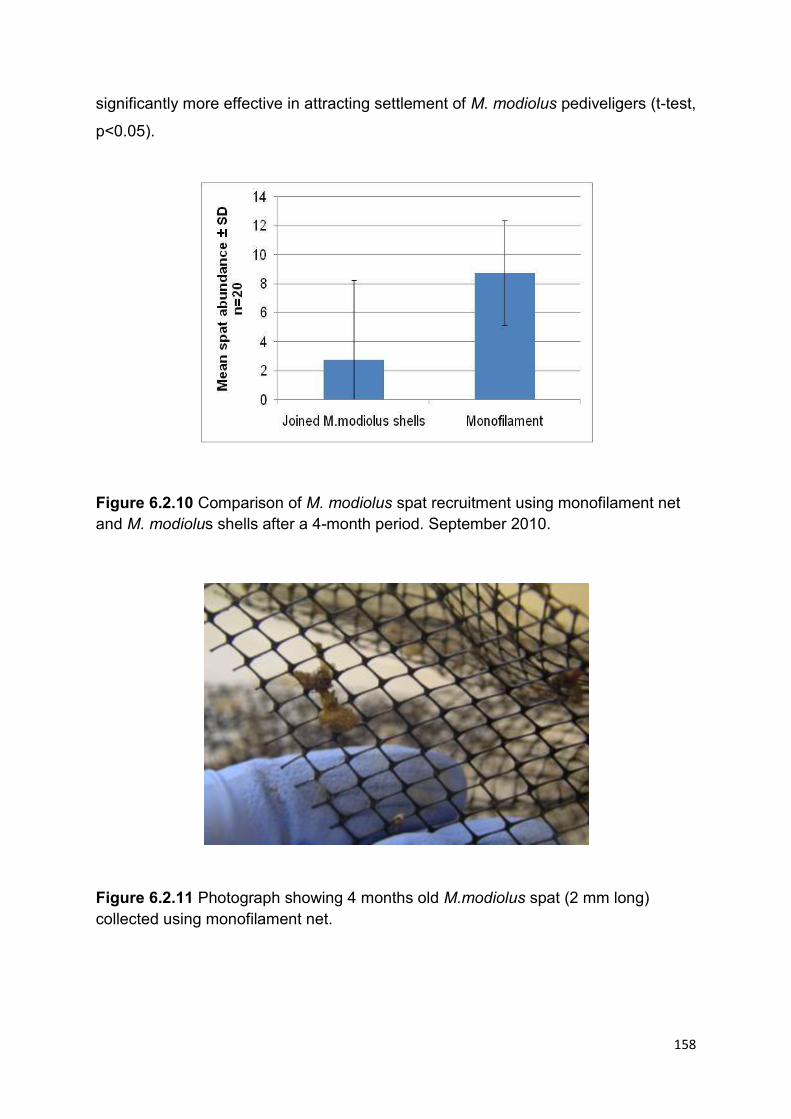
158
significantly more effective in attracting settlement of M. modiolus pediveligers (t-test,
p<0.05).
Figure 6.2.10 Comparison of M. modiolus spat recruitment using monofilament net
and M. modiolus shells after a 4-month period. September 2010.
Figure 6.2.11 Photograph showing 4 months old M.modiolus spat (2 mm long)
collected using monofilament net.

159
6.2.4.4 Spat settlement
One year after deployment all trays were removed and the spat and associated
fauna counted and preserved. Natural settlement of M. modiolus spat was
significantly higher in the South Basin live-clump treatments while it was almost
negligible for both the North Basin and the remaining treatments (Figure 6.2.12).
Presence of M. modiolus spat was limited almost exclusively to the clumps of live M.
modiolus (F(3,32) = 11.87; p < 0.001). The differences in settlement of M. modiolus
were noticeable between the South and North Basins. After one year left on the
seabed the live clumps from the South Basin trays yielded significantly higher
numbers of M. modiolus spat than the mussels from the North Basin experiments
(F(1,32) = 12.1; p < 0.01).
Figure 6.2.12 Histogram showing substrate preference results as mean abundance
of Modiolus modiolus spat per treatment and geographical location.

160
6.2.5 Discussion
6.2.5.1 Population structure and natural recruitment
In Strangford Lough previous studies described a M. modiolus population
dominated by mature individuals where spatfall was usually poor. Mussels less than
20mm accounted for a small proportion of the population (Seed & Brown 1975;
Roberts et al. 2004). The size-frequency histograms showed the bi-modal
distribution typical of the species with the highest peak of abundance around 90mm
shell length. M. modiolus with similar population structurehave also been reported
from some parts of Scotland; poor recruitment rates puts the viability of such M.
modiolus populations into question (Comely 1978). Comely (1981) also recorded few
if any spat from samples collected in Shetland voes. This bi-modal population
structure is believed to reflect the „escape through growth‟ life history strategy of M.
modiolus. Young mussels are subjected to intense predation when young so energy
is initially directed to growth but once individuals reach a size that is too large to be
eaten by their major predators (mostly crabs) they re-direct energy to reproduction
(Roberts 1975; Seed & Brown 1978). Population structure analysis carried out in
2009 and 2010 by the MRRG show natural recruitment of M. modiolus occurring in
Strangford Lough with significant differences between the 2 different biotopes. The
results are comparable to those from 2004 as regards to presence of M. modiolus
spat (<20mm) from sampling sites north of the Long Sheelah (ModCvar biotope).
Here seed mussel accounts for only 5% of the total population. The M. modiolus and
C. varia biotope SS.SBR.SMus.ModCvar therefore is damaged not only in quality
and extent but it may no longer be self sustaining anymore.
The histograms from populations south of the Long Sheelah (ModHAS biotope)
show spat frequencies of almost 70% in some locations (Craigyouran, Round Island
Pinnacle). Recruitment from these beds is not only much higher than in the
SS.SBR.SMus.ModCvar biotope but it is also substantially higher than the
recruitment rates reported from the same beds in 2004 (Roberts et al. 2004); at this
time spat only accounted for 20% of the Black Rock population and it was less than
5% of the M. modiolus population sampled west of Round Island Pinnacle. This
increase in recruitment since 2004 could be a result of recent spatfall events

161
although monthly sampling carried out from 2008 to 2010 showed consistent high
spat frequencies in clumps collected from the SS.SBR.SMus.ModHAs/ModT biotope.
The medium sizes (20 to 60mm) are clearly underrepresented in
theSS.SBR.SMus.ModHAs/ModT histogram but not absent like in
theSS.SBR.SMus.ModCvar populations indicating that the population might be self-
sustaining with enough animals reaching the „refuge‟ size of 40-50mm (Roberts
1975)
In shell-length frequency distributions for short-lived species like Mytilus edulis
each modal peak usually indicates different year classes (Seed 1969). In slow
growing and long lived bivalves each size group is a combination of different year
classes, particularly in the bigger mussels. The smaller size classes may contain just
a proportion of young mussels, as has been reported for the freshwater pearl mussel
Margaritifera margaritifera (Hastie et al. 2010). The age frequency distribution data
obtained from the shell-aging data correlates to the size-frequency histograms with
two distinct groups found in each population. Young mussels (<10 years of age) still
represent a very small fraction of the damaged SS.SBR.SMus.ModCvar biotope
while the majority of the population consists of old adult mussels between 20 and 45
years of age. In theSS.SBR.SMus.ModHAs/ModTbiotope some adults from the
bigger size class are younger than expected from the size-frequency histogram
therefore it is clear that a fraction of young mussels is underrepresented in the size-
frequency data.
Larval dispersal models are currently being developed by Queen‟s University
Belfast oceanographers and engineers. This hydrodynamic model includes tri-
dimensional aspects of the current regimes within Strangford Lough providing vital
information on dispersal behaviour to supplement the natural recruitment findings. It
is suspected that current regimens along with the decrease in size of the source
population in the North Basin are partly responsible for the low recruitment rates
observed by the MRRG during the 2009-10 periods.
6.2.5.2 Substratum preference
The results obtained from spat collectors were poor for M. modiolus spat.
Previous use of artificial spat collectors to record natural recruitment (Roberts et al.
2004) also yielded very low numbers of M. modiolus spat after a few months.

162
Considering the very high spatfall levels recorded from wild clump samples and live
mussel clumps during the tray experiments it is evident that spat collectors grossly
underestimate natural recruitment.
Cultivation of the blue mussel Mytilus edulis is based in the collection and growing
of naturally settled spat (Galley et al. 2010). The collection of naturally settled
Modiolus modiolus spat using artificial blue mussel spat collectors was also tested to
ascertain if enough seed could be collected for transferring to out-growing
aquaculture facilities. As spat was not naturally attracted to the artificial spat
collectors placed on the experimental trays this approach is discounted as a viable
option for collection of M .modiolus seed for restoration.
Horse mussels are gregarious bivalves, forming clumps that rise above the
seabed providing refuge not only to a diverse array of infaunal and epifaunal species
but also to their own juveniles. M.modiolus spat prefer to settle among conspecifics;
successful recruitment or spat survival seldom occurs outside the microhabitat
created by the adult live M.modiolus (Rees 2005; MRRG observations). The results
obtained from the substrate experiments also showed a highly significant preference
to settle on live adult mussels. This behaviour suggests that deployment of inert
cultch as a method to enhance natural recruitment is not a sufficient method if not
supplemented with translocated mussels. The presence of live adult mussel appears
to be crucial to triggering settlement in the horse mussel larvae.
It is worth pointing out that, although poor when compared with live clumps,
settlement on monofilament net was higher than on other materials. This may reflect
the preference of M. modiolus pediveligers to settle primarily on filamentous
substrata such as hydroids commonly recorded on the shells of live adult M.
modiolus to later migrate to the interstitial spaces. These associations of recently
settled mussels with filamentous substrata have been reviewed by Bayne (1965) and
Seed (1969). Mytilus edulis plantigrades are known for settling on hydroids and
algae and not directly onto the mussel beds.

163
6.3 Pilot Modiolus modiolus hatchery cultivation
(Undertaking 13)
6.3.1 Summary
The Modiolus reef Restoration Plan contemplates the production of young M.
modiolus for experimental reseeding if natural recruitment is not observed. To
meet this objective the Modiolus Restoration Research Group (MRRG) set up
a dedicated M. modiolus hatchery.
Horse mussel spat was successfully produced from local broodstock.
Conditioning was not necessary. Partial desiccation effectively triggered
spawning in broodstock mussels.
The full larval cycle from fertilized eggs to settled pediveligers takes
approximately 38 days at ambient summer water temperatures for Strangford
Lough.
No significant differences were observed in larval survival and growth using
single or mixed algal diets.
Pediveligers preferred settling among live mussels than on artificial substrata.
1.5mm spat were obtained after four months in an upwelling system.
The main obstacles to produce enough quantities of spat for reseeding were:
1) lengthy developmental cycle; 2) slow larval and spat growth; 3) poor
survival rates; and 4) very specific settlement requirements
The high costs associated with running the hatchery operations compared to
the poor return in seed means hatchery production of M. modiolus is not a
viable restoration option at this stage.

164
6.3.2 Introduction
The use of hatchery produced M. modiolus spat to enhance natural recruitment is
one of the intervention action elements listed in the restoration plan. Successful
hatchery production of M. modiolus seed requires an in-depth knowledge of the
reproductive and larval cycle (Roberts et al. 2004) but there has been little effort to
cultivate M .modiolus because of its low commercial value.
The breeding cycle of M. modiolus varies between populations within its
distribution range (Brown 1984). Spawning may occur annually (Comely 1978;
Brown 1984; Jasim & Brand 1989; Kaufman 1977 in Flyachinskaya & Naumov 2003)
or intermittently with intervals of up to 5 years between spawning events (Lilleskare
1905; Wiborg 1946; Rowell 1967). In Strangford Lough the reproductive cycle of M.
modiolus appears to be different than other populations. Brown and Seed (1977)
concluded that the reproductive cycle in the Strangford Lough subtidal M. modiolus
population lacks any seasonality. During this 3-year study Brown and Seed (1977)
reported a constant presence of both ripe mussels and settled spat therefore
concluding that the broodstock population releases a trickle of gametes throughout
the year.
There are few published examples of spawning induction of M. modiolus in the
laboratory are rare (Williamson 1907; Schweinitz & Lutz 1976; Jasim 1986).
Jørgensen (1946) measured the eggs of M. modiolus and described and compared
larval morphology to Mytilus edulis. Rees (1950) concluded that the smallest veligers
of M .modiolus and M. edulis are similar in shape although the former has a less
pointed narrow end. Schweinitz & Lutz (1976) described for the first time the full
larval cycle of M. modiolus from fertilized egg to pediveliger larva using broodstock
from Maine (USA). The first pediveligers were recorded 19 days from fertilization
while the larvae remained in the water column for about a month. Flyachinskaya &
Naumov (2003) were not successful in triggering spawning in aquarium-kept M.
modiolus broodstock from the White Sea but obtained fertilized eggs after
spontaneous spawning events and documented all larval stages from fertilized egg
to metamorphosed pediveliger. Unfortunately, the appearance and duration of each
embryonic phase was not reported.

165
The pilot hatchery set up by the Modiolus Restoration Research Group aimed to
produce large numbers of settled spat for use in experimental reseeding trials.
Objectives were 1) induce spawning of broodstock M. modiolus collected from
Strangford Lough; 2) obtain viable eggs and fertilize them; 3) grow the larvae to
pediveliger stage documenting the developmental cycle; and 4) obtain settled spat
for use in the experimental re-seeding.
6.3.3 Materials and Methods
To produce M. modiolus spat the MRRG set up an M. modiolus hatchery using
Queen‟s University Belfast Marine Laboratory aquaculture facilities. The facility has a
constant reliable supply of good quality sea water, algal culturing rooms and is not
far from the M. modiolus beds used to provide the broodstock used in the
experiments.
The pilot M. modiolus hatchery followed standard bivalve mollusc hatchery
techniques (Helm et al. 2004):
1) Production of micro-algae for provision of food;
2) Conditioning brood-stock;
3) Induction of spawning and husbandry of larvae to settlement;
4) Intermediate cultivation (Figure 6.3.1).

166
Figure 6.3.1 M. modiolus hatchery operation scheme (adapted from Utting &
Spencer 1991)
6.3.3.1 Production of micro-algae.
Four different algal species were tested as food for the M. modiolus larvae: the
diatom Chaetoceros calcitrans; and the flagellates Nannochloris atomus, Isochrysis
galbana (clone T-Iso) and Tetraselmis suecica. A batch culture system was used to
rear the species to adequate quantities (Figure 6.3.2). Algae stocks obtained from
Queen‟s University Marine Laboratory and the Scottish Association of Marine
Science (SAMS) algal culturing facilities in Oban (Scotland) were used to inoculate
500 mL starter cultures. The starter cultures were used to inoculate scaled-up
cultures containing sterilized seawater diluted with distilled freshwater and added F/2
media (Helm et al. 2004 for composition) and silica (Si). The cultures were aerated to
provide a carbon source for photosynthesis and constantly illuminated by a battery of
fluorescent lights (Helm et al. 2004). Once algae grew to the point where cell density
inhibited light penetration (judged by colour) cultures were scaled-up to intermediate
cultures of 3, 5, and 10 L in volume. Once the 10 L cultures reached critical density
they were transferred to 100 L polyethylene bags. These 100 L cultures were used

167
as food for the M. modiolus larvae (Figure 6.3.2). Due to their small cell sizes, C.
calcitrans, N. atomus and I. galbana are most suitable for the early veliger stages of
M. modiolus while the bigger cells of T. suecica can only be assimilated by
pediveligers and juveniles.
In 2008 mixed results growing microalgae meant that only C. calcitrans and T.
suecica could be used, because cultures of I. galbana T-ISO repeatedly crashed
before reaching harvestable volumes. In 2009 all three algal species were
satisfactorily grown in enough quantities to feed the M. modiolus larvae during the
embryonic and settlement phases. The success in the production of live algae
allowed the set up of an experiment to find the best feeding regime. A total of six
different algal diet combinations were used to test the effect on mean size, survival
and development of the larvae (Table 6.3.1). N. atomus was the only algal species
grown in sufficient quantities to guarantee a steady supply during the 2010 trials. A
single-species diet using N. atomus was tested with positive results. Some studies
report successful results when partially substituting live algae diets with
microencapsulated diets (Laing 1987). The use of commercially available
microencapsulated dry diet supplement (MySpat® manufactured by INVE Ltd.) was
also planned in an effort to reduce the quantities of cultured microalgae needed in
the hatchery.
Figure 6.3.2 Microalgae batch culturing facilities at Queen‟s University Marine
Laboratory, Portaferry. Left microalgal stock cultures and right, 100 L culture
bags.

168
6.3.3.2 Conditioning of brood-stock and induction of broodstock
spawning
The M. modiolus broodstock used in the pilot hatchery was sourced from
Strangford Lough North and South Basin populations. The mussels were cleaned of
epifauna to minimise contamination of the gametes and held in tanks with a constant
supply of running sea water (running to waste and not re-circulated) at ambient
temperatures (between 13°C and 15°C).
Broodstock subsamples were taken to assess gonad ripeness. Both male and
female specimens had full or near full gonads in all cases therefore the conditioning
phase was skipped. These observations on gonad ripeness match those of Seed &
Brown (1977).
Spawning induction is the method in which mature bivalves are induced to liberate
their gametes in response to applied stimuli (Utting & Spencer 1991).
Induction methods tested included:
1. Thermal cycling. Broodstock was transferred to shallow trays (Figure 6.3.3) and
submerged in heated sea water at 25 °C for 30 to 40 minutes with added
microalgae to induce filtration activity. The warm water was replaced by running
sea water at ambient temperature (15 °C) for one hour. The cycle was repeated
four times.
2. Addition of gametes. Some mussels were also dissected to check gonad
ripeness. These gonads were added to two of the conditioning tanks in the 2008
experiments. During the 2009 hatchery work sperm and ova was added to the
water if spawning was unsuccessful after the 3rd warm-cold water cycle. The
gametes were released close to the inhalant siphons using a Pasteur pipette
(Figure 6.3.3)
3. Air exposure. In 2008 a spontaneous spawning event was recorded after the
holding tanks were accidentally drained overnight. A controlled air exposure
treatment was used during the 2009 and 2010 trials (Figure 6.3.3). Spawning was
recorded in all events in less than 24 hours after refilling the spawning trays.

169
All broodstock was returned to the collection areas in Strangford Lough once
spawning was achieved.
Figure 6.3.3 Spawning trays with M. modiolus broodstock under spawning induction
treatments: being subjected to air exposure (left) and addition of gametes (right).
6.3.3.3 Larval husbandry
Male and female broodstock were not kept separately and fertilization occurred in
the holding tanks after spawning.
All fertilized oocytes and early larval stages already formed were gently washed
into a plastic beaker using UV filtered seawater through a 45 μm sieve. Subsamples
were taken and total numbers of fertilized eggs estimated using a Coulter counter.
Representative samples were taken and preserved in 4% formaldehyde. The beaker
contents were placed in separate 85 L semiconical PVC tanks filled with UV filtered
sea water and constantly aerated at a low flow rate to avoid damage (Figure 6.3.4).
Cultures were diluted to achieve densities of 10 to 15 larvae mL-1 to avoid
overcrowding.
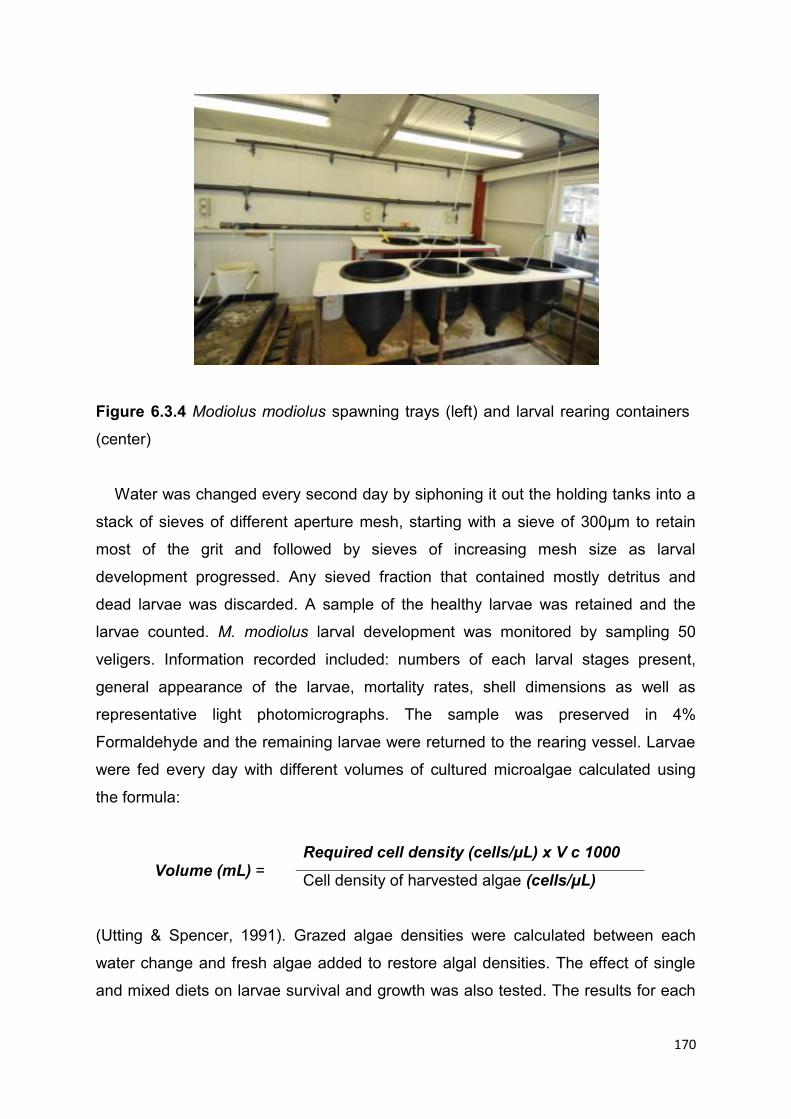
170
Figure 6.3.4 Modiolus modiolus spawning trays (left) and larval rearing containers
(center)
Water was changed every second day by siphoning it out the holding tanks into a
stack of sieves of different aperture mesh, starting with a sieve of 300µm to retain
most of the grit and followed by sieves of increasing mesh size as larval
development progressed. Any sieved fraction that contained mostly detritus and
dead larvae was discarded. A sample of the healthy larvae was retained and the
larvae counted. M. modiolus larval development was monitored by sampling 50
veligers. Information recorded included: numbers of each larval stages present,
general appearance of the larvae, mortality rates, shell dimensions as well as
representative light photomicrographs. The sample was preserved in 4%
Formaldehyde and the remaining larvae were returned to the rearing vessel. Larvae
were fed every day with different volumes of cultured microalgae calculated using
the formula:
Volume (mL) =
Required cell density (cells/μL) x V c 1000
Cell density of harvested algae (cells/μL)
(Utting & Spencer, 1991). Grazed algae densities were calculated between each
water change and fresh algae added to restore algal densities. The effect of single
and mixed diets on larvae survival and growth was also tested. The results for each

171
treatment were subjected to a repeated measures ANOVA to identify significant
differences.
The microalgal species and species combinations used and their concentrations
are listed in Table 6.3.1.
Table 6.3.1 Microalgal feeding regimes used in the M. modiolus hatchery. 2008-10
(following concentration guidelines by Helm et al. 2004)
When larvae reached pediveliger stage water was re-circulated in an upwelling
system and changed every second day checking for presence of swimming veligers
remaining in the water column. Larvae were fed daily, adding 50% more food every
passing week. Different settlement materials were tested including scrubbing pads,
monofilament net, live adult mussels and empty M. modiolus shells. Variables
measured included settlement material preference and settled larval growth and
survival.
Year Treatment Species Proportion
(%)
Concentration
(cells/µl)
2008 - C. calcitrans 100 250
2009 1 C. calcitrans 100 250
2009 2 I. galbana T-ISO 100 50
2009 3 C. calcitrans + I. galbana T-
ISO
50/50 125/50
2009 4 C. calcitrans + T. suecica 50/50 125/5
2009 5 I.galbana T-ISO +T.suecica 50/50 50/12.5
2009 6 C.calcitrans + I. galbana + T.
suecica
33/33/33 83/33/3.3
2010 - N. atomus 100 250

172
6.3.3.4 Intermediate cultivation
Intermediate cultivation consists of maintaining the spat in a nursery system until
they reach a sufficient size to resist the effect of predation and competition in the wild
(Gosling 2003). Any settled spat obtained from the previous phase was placed in a
down-welling recirculation system, normally used for species sensitive for
overcrowding such as clams and scallops (Helm et al. 2004). This was a more
conservative approach as the adequate relaying densities for M. modiolus
pediveligers are not known. Food calculations followed the formula:
F = (S X 0.4)/7
where F is the dry weight of algae (N. atomus, weight= 21.4 pg/cell) required per day
in mg and S is the live weight of spat at the beginning of each week (after Utting &
Spencer 1991).
6.3.4 Results
6.3.4.1 Broodstock size frequency
Broodstock collected from the South Basin M. modiolus beds had a mean length
of 98 mm and a length modal peak of 100 mm while the largest mussel was 124 mm
long. Males accounted for 55% of the total sample. The samples from Hadd Rock
(North Basin) had a modal peak length of 84 mm, an average length of 77 mm while
the largest mussel was 97 mm in length. Males accounted for 66% of the total
broodstock sample. The size frequency histograms (Figures 6.3.5a and 6.3.5b) omit
the spat present within the clumps.

173
Figure 6.3.5 a) North Basin (N = 80) and, b)South Basin (N = 71) broodstock size
frequency histograms.
6.3.4.2 Broodstock response to supplemental algal diet
An experiment was carried out to assess if there were differences in the response
to air exposure stimuli in conditioned and unconditioned mussels. An experiment
was set up by placing 100 adult M. modiolus in running seawater. Half of the
broodstock was given a supplement of Tetraselmis suecica using a peristaltic pump
at a rate of 1.25 L/min while the other half had no supplemental feed. The tanks were
drained after 3 days and the broodstock mussels left exposed to air overnight. The
next morning water flow was resumed. Spawning was recorded 24 hours later in
both holding tanks therefore there was no beneficial effect of adding algae to the
holding tanks.
Hadd Rock Horse Mussels
0
5
10
15
20
25
30
50.0-
54.9
55.0-
59.9
60.0-
64.9
65.0-
69.9
70.0-
74.9
75.0-
79.9
80.0-
84.9
85.0-
89.9
90.0-
94.9
95.0-
99.9
100.0-
104.9
105.0-
109.9
110.0-
114.9
115.0-
119.9
120.0-
124.9
125.0-
129.9
Size Category/mm
Fre
qu
en
cy/n
o u
nit
s
Ringhaddy Horse Mussels
0
2
4
6
8
10
12
14
16
50.0-
54.9
55.0-
59.9
60.0-
64.9
65.0-
69.9
70.0-
74.9
75.0-
79.9
80.0-
84.9
85.0-
89.9
90.0-
94.9
95.0-
99.9
100.0-
104.9
105.0-
109.9
110.0-
114.9
115.0-
119.9
120.0-
124.9
125.0-
129.9
Size Category/mm
Fre
qu
en
cy/n
o u
nit
s
a
b

174
6.3.4.3 Description of spawning and the larval cycle
During the first spawning trial North Basin broodstock mussels released an
estimated total of total 8 million eggs, each female releasing an estimated 230,000
eggs. South Basin mussels released 13 million eggs, an estimated number of
546,000 eggs per female (Figure 6.3.6). Differences in numbers of spawned eggs
between the North and South Basin broodstock populations were not statistically
significant (ANOVA: F(1,4) = 3.453; p > 0.05) Once spawning had started it continued
for almost a week. Spent gonads where observed in most animals after sacrificial
sub-samples were taken.
Figure 6.3.6 Oocyte count spawned from both broodstock M. modiolus used in the
pilot hatchery.
Fertilized egg diameter was 88.3 ± 2.35 μm while the first cleavage (two equal
blastomeres and a polar body) was observed one hour after fertilization. Fertilization
percentages were as high as 89% in some trials.
Embryonic stages, similar to those recorded for M. modiolus by Schweinitz & Lutz
(1976) and Flyachinskaya, & Naumov (2003), were documented (Figure 6.3.7). A 4-
cell stage consisting of one big macromere and three smaller micromeres was
observed two hours after fertilization. The ciliated gastrula appeared in the 10th hour
and differentiated into a trocophore of approximately 70 μm in length. The first D-
0
1
2
3
4
5
6
7
8
Me
an s
paw
ne
d e
ggs
± S
D
Mill
ion
s
North Basin (n=80)
South Basin (n=70)

175
shaped veligers appeared 24 to 48 hours after fertilization; mean length ± SD was
117 ± 19 μm. Early umbonated veligers were observed in the 15th day; mean lengths
± SD ranged from 119 ± 17.76 μm to 129.6 ± 11.43 μm depending on the diet. Fully
umbonated veligers appeared on the 18th day after fertilization, mean lengths varied
from 130.2 ± 13.09 μm to 148.1 ± 17.91 μm. After 21 days veligers with a functional
velum, reached maximum lengths of 220 μm and mean sizes of 179.8 ± 25.18 μm.
Both incipient foot and eye spot were visible in very few individuals by the 30th day.
Crawling eyed pediveligers with functional foot were observed for the first time 38
days after fertilization. The pediveligers were few and attained lengths of 350 to 400
μm. It was noticed that while some larvae seemed to be in an advanced stage of
development, considerable numbers were still in the trocophore and ciliated D-larvae
stages. Some researchers have also reported this phenomenon (Loosanoff & Davis
1963) suggesting that the larval development stage depends more on size than on
age (Schweinitz & Lutz 1976).
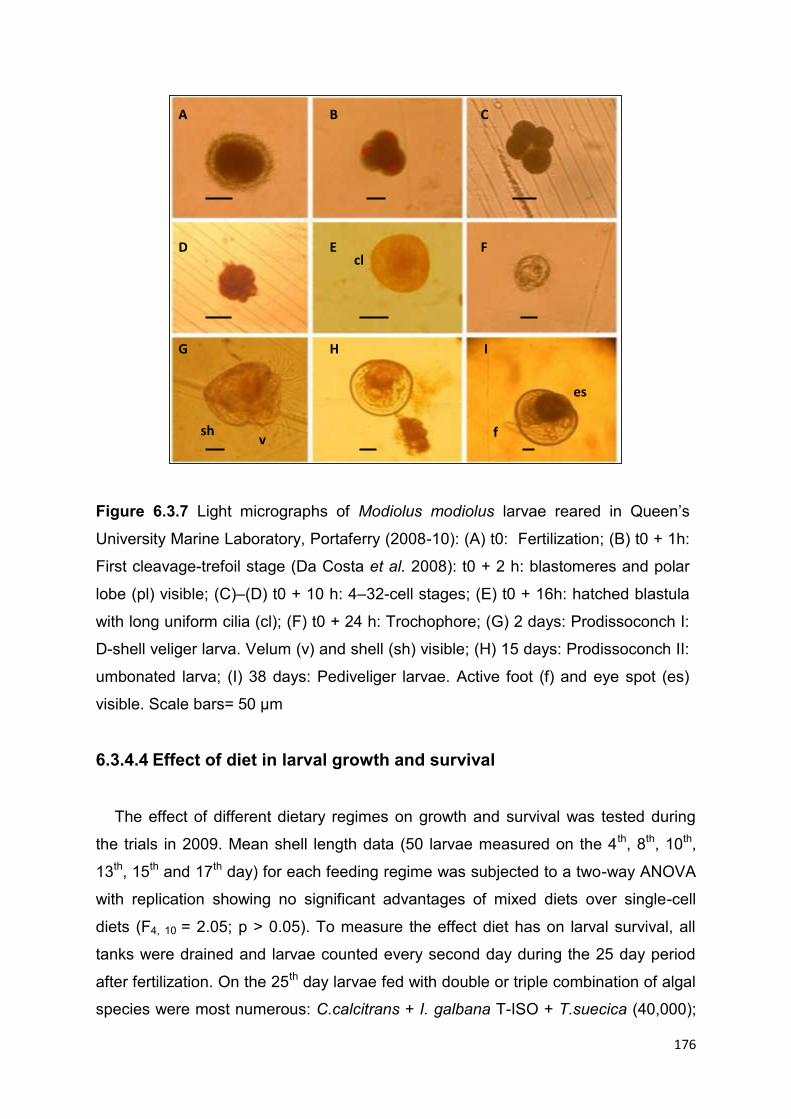
176
Figure 6.3.7 Light micrographs of Modiolus modiolus larvae reared in Queen‟s
University Marine Laboratory, Portaferry (2008-10): (A) t0: Fertilization; (B) t0 + 1h:
First cleavage-trefoil stage (Da Costa et al. 2008): t0 + 2 h: blastomeres and polar
lobe (pl) visible; (C)–(D) t0 + 10 h: 4–32-cell stages; (E) t0 + 16h: hatched blastula
with long uniform cilia (cl); (F) t0 + 24 h: Trochophore; (G) 2 days: Prodissoconch I:
D-shell veliger larva. Velum (v) and shell (sh) visible; (H) 15 days: Prodissoconch II:
umbonated larva; (I) 38 days: Pediveliger larvae. Active foot (f) and eye spot (es)
visible. Scale bars= 50 µm
6.3.4.4 Effect of diet in larval growth and survival
The effect of different dietary regimes on growth and survival was tested during
the trials in 2009. Mean shell length data (50 larvae measured on the 4th, 8th, 10th,
13th, 15th and 17th day) for each feeding regime was subjected to a two-way ANOVA
with replication showing no significant advantages of mixed diets over single-cell
diets (F4, 10 = 2.05; p > 0.05). To measure the effect diet has on larval survival, all
tanks were drained and larvae counted every second day during the 25 day period
after fertilization. On the 25th day larvae fed with double or triple combination of algal
species were most numerous: C.calcitrans + I. galbana T-ISO + T.suecica (40,000);
A B C
D E F
G H I
f
es
cl
sh v

177
C.calcitrans and T. suecica (38000); and T-ISO and T.suecica (33000). Counts of
larvae fed with single species diets were lower: C. calcitrans (19,000); I. galbana T-
ISO (23000) (Figure 6.3.8). The relationship between larval survival and algal diet
was tested using 2-way analysis of variance without replication. Mixed algal diets
performance was not significantly better than single species diets (total larvae in
each treatment 25 days from fertilization; F(4,71) = 2.28; p > 0.05).
Figure 6.3.8 Influence of algal diet in a) growth and b) survival of M. modiolus
larvae in hatchery trials. Treatments listed in Table 6.3.1.
a)
b)
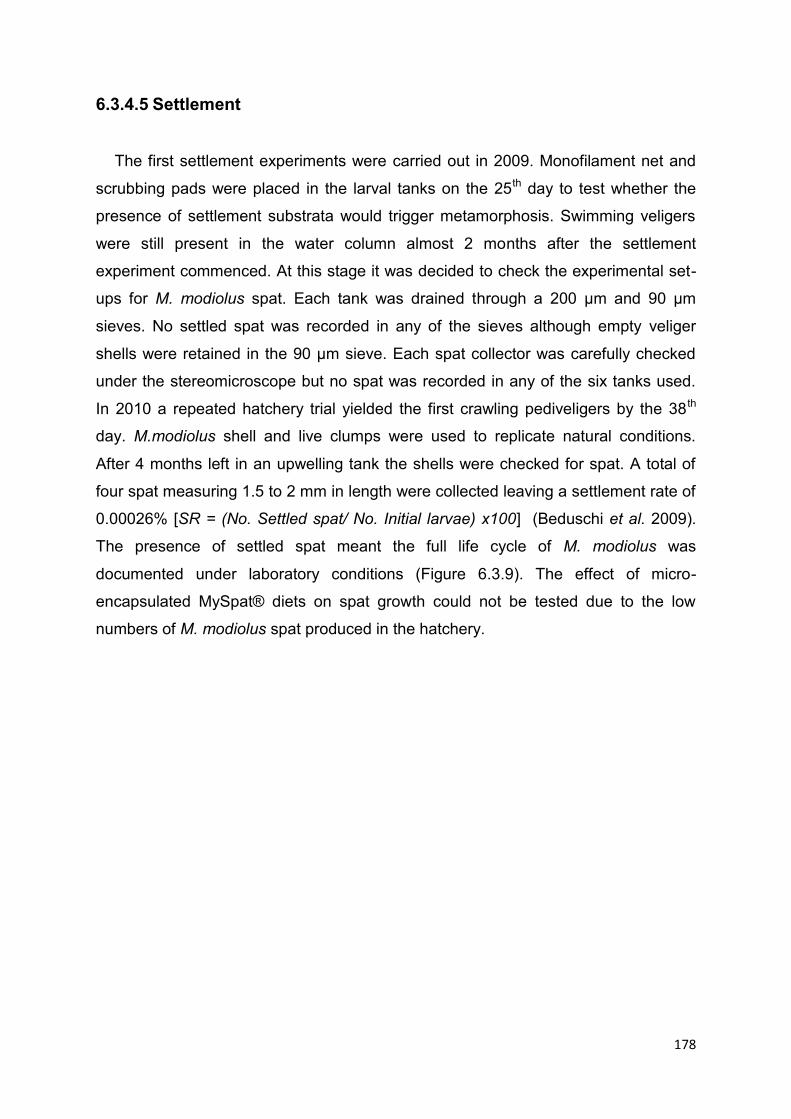
178
6.3.4.5 Settlement
The first settlement experiments were carried out in 2009. Monofilament net and
scrubbing pads were placed in the larval tanks on the 25th day to test whether the
presence of settlement substrata would trigger metamorphosis. Swimming veligers
were still present in the water column almost 2 months after the settlement
experiment commenced. At this stage it was decided to check the experimental set-
ups for M. modiolus spat. Each tank was drained through a 200 µm and 90 µm
sieves. No settled spat was recorded in any of the sieves although empty veliger
shells were retained in the 90 µm sieve. Each spat collector was carefully checked
under the stereomicroscope but no spat was recorded in any of the six tanks used.
In 2010 a repeated hatchery trial yielded the first crawling pediveligers by the 38th
day. M.modiolus shell and live clumps were used to replicate natural conditions.
After 4 months left in an upwelling tank the shells were checked for spat. A total of
four spat measuring 1.5 to 2 mm in length were collected leaving a settlement rate of
0.00026% [SR = (No. Settled spat/ No. Initial larvae) x100] (Beduschi et al. 2009).
The presence of settled spat meant the full life cycle of M. modiolus was
documented under laboratory conditions (Figure 6.3.9). The effect of micro-
encapsulated MySpat® diets on spat growth could not be tested due to the low
numbers of M. modiolus spat produced in the hatchery.

179
Figure 6.3.9 Life cycle of the horse mussel Modiolus modiolus as observed in the
experimental hatchery set up by the MRRG (flow chart adapted from Helm et al.
(2004) using original data and photographs from the present study).
6.3.5 Discussion
6.3.5.1 Hatchery cultivation of M. modiolus
The pilot hatchery set up by the Modiolus Restoration Research Group was
successful in describing the life cycle of M. modiolus in detail but very few larvae
developed to pediveliger stage.
Some aspects of the biology of M. modiolus in Strangford Lough need to be
studied in more detail, particularly regarding its reproductive behaviour. Many
temperate species require 6 to 8 weeks in the conditioning tanks before the
spawning induction phase can commence (Helm et al. 2004). The fact that
Strangford Lough M. modiolus breeding population seems to remain in a constant
ripe stage throughout the year (Seed & Brown 1977; personal observations) made
conditioning unnecessary. This fact, along with the constant presence of spat in the

180
population leads to the conclusion that M. modiolus might reproduce by releasing
small amounts of gametes throughout the year without a clear seasonality as
proposed by Seed & Brown (1977). This behaviour is very relevant to hatchery
production of M. modiolus if we select broodstocks from populations in Strangford
Lough. A clear knowledge of the natural phenomena that trigger spawning of M.
modiolus in the wild is needed for the induction spawning process. A change in
temperature usually prompts spawning in wild bivalve populations. The thermal
cycling method usually triggers spawning in most bivalve species but the results
obtained during our trials were not positive. Jasim (1976) successfully spawned M.
modiolus using temperature shock but Schweinitz & Lutz (1976) and Flyachinskaya
& Naumov (2003) also found broodstock M. modiolus unresponsive to changes in
water temperature and other traditional spawning methods. Helm et al. (2003) state
that if thermal cycling does not trigger spawning, the gametes are probably not fully
mature. The only way we consistently triggered spawning in the broodstock was
using stress by exposure to air. The method is not a replication of a natural
phenomena as the broodstock from Strangford Lough is fully subtidal and it never
gets exposed to air. However the phenomenon has been observed elsewhere (C.A.
Richardson pers. comm.). This may explain why metamorphosis was recorded only
once and why the rate of individual larval development was highly variable with
several stages present in the culture containers until the culture collapsed. If
spawning was the consequence of a highly distressing event it is possible that the
condition of the gametes was not ideal for hatchery experiments.
When pediveligers were obtained the full cycle lasted for more than 1 month
which matches observations of a long planktonic stage for M. modiolus by Ockleman
(1965) and Flyanchinskaya & Naumov (2003). Schweinitz & Lutz (1976) recorded
pediveligers after 19 days but the sea water where the larvae were kept was heated
to 21°C. In the present study it was decided to use ambient temperature and
document the larval cycle as it is likely to happen under natural conditions in
Strangford Lough. This information will be very useful in a larval dispersal model
specific for Strangford Lough.
The provision of suitable settlement substrata for M. modiolus hatchery production
is another problematic area. Field studies (Section 6.2) suggested that M. modiolus
spat rarely settle outside the matrix created by adult live mussels. Substratum
preference experiments in the wild recorded significant differences in recruitment

181
levels between inert substrata (empty shells, synthetic fibres) and clumps of live
mussels (Section 6.2). These results were also observed during the hatchery trials
with no settlement in any of the spat collectors introduced in the larval tanks.
6.3.5.2 Economics of seed mussel production
Hatchery production of commercial mussel species is considered uneconomic due
to the low economic return per unit produced; therefore most mussel industries are
based on natural spatfall (Lucas 2003). The low survival rates of hatchery reared
bivalves once transplanted is also an important factor considering the high
production costs involved (Caddy & Defeo 2003; Maguire et al. 2007).
The running costs of a pilot M. modiolus hatchery are as high if not higher than
commercial mussel hatchery considering the lack of previous knowledge regarding
basic aspects of the biology of the species. Setting up and running costs of the M.
modiolus experimental hatchery were in excess of £6,500 per month, including:
Production of microalgae
Running costs of sea water system
Electricity
Equipment
Boat usage to collect fresh broodstock
Staff salaries (technical, boatman, divers)
General hatchery costs in the Republic of Ireland at €11,500 per month in 2007
(Maguire et al. 2007) are comparatively well above the costs in which the pilot M.
modiolus hatchery incurred during its trials in 2008-10. Economic benefits of a
hatchery solely focused in producing spat for ecological restoration are harder to
estimate if compared to a commercial hatchery where the returns are based in
number of spat (in their millions) sold to grow at commercial rates for on-growing for
human consumption.
The costing shown is exclusive of intermediate cultivation costs as not enough
seed was produced to merit setting up a M. modiolus spat nursery. If that had been
possible the costs would have been much higher considering the slow growth of the

182
species as it would probably take one or two years to produce spat of just 10 mm as
ageing data collected during the project has confirmed. If relaying hatchery produced
spat was considered to be an option spat should be at least 40 mm, considering the
size at which most mussels escape predation (Roberts 1975).
6.3.6 Conclusions
The production of M. modiolus spat in a dedicated hatchery has nevertheless
some benefits over the other restoration approaches, namely cultch deployment and
translocation. It is almost non-disruptive and the spat produced comes from the local
population. Collection of natural spat using collectors deployed in different locations
in Strangford Lough was very poor due to the specific settlement preferences of M.
modiolus (Section 6.2); therefore population enhancement by collecting natural spat
is not a viable option. Translocation of locally sourced M. modiolus disrupts the few
„good‟ beds remaining while sourcing the mussels from outside the Lough would
require genetic studies and strict controls to avoid the introduction of non-native
species such as Crepidula fornicata and toxic dinoflagelates.
The nominal production of spat by the experimental hatchery was nowhere near
the millions that are needed to attempt an experimental reseeding programme as
survival of relaid spat in the field is usually very low. The high costs associated with
running the hatchery operations compared to the poor return in seed means
hatchery production of M. modiolus is not a viable restoration option at this stage.

183
7. Projection for recovery of ‘Favourable Conservation
status’ (Undertaking 8)
7.1 Summary
Most of the assessment criteria suggest that M. modiolus biogenic reefs,
particularly biotope SS.SBR.SMus.ModCvar in Strangford Lough remain in
unfavourable conservation status.
However, at some sites, notably Round Island Pinnacle, Colin Rock, north
to Craigyouran „good‟ condition exemplars of biotope
SS.SBR.SMus.ModHAs remain.
Because results from short-term temporal monitoring showed no clear
trends, it is not possible to develop a model based on the current study to
predict when favourable conservation status of M. modiolus biotopes will be
restored in Strangford Lough.
Published studies from New Zealand and Canada suggest that impacted
bivalve biogenic reefs may take extended periods to recover after the
cessation of fishing activities.
Factors affecting successional regeneration of bivalve biogenic reefs
include the period of non-disturbance, proximity of propagule sources and
hydrodynamic influences on propagule dispersal.
In Strangford Lough, much of the degraded M. modiolus habitat lies within
10-15 km of sources of propagules from the remaining beds; based on the
recovery of oyster and mussel reefs in New Zealand this suggests that
signs of natural recovery might be expected within 20 years in Strangford
Lough, provided there is no further disturbance.

184
7.2 Introduction
The long-term objective of the Modiolus Restoration Plan (DOE/DARD) (Anon
2005) is: “to restore the Strangford Lough Modiolus biogenic reef feature to
„Favourable Conservation status‟.”
Undertaking 8 of the current project is to develop projections, based on temporal
monitoring, for when „Favourable Conservation status‟ might be achieved.
7.3 Current conservation status
Table 7.1 measures current status of main M. modiolus biotopes in Strangford
Lough against the habitats directive definitions of „Favourable Conservation status‟ of
both the habitat (the biotope) and species. Most of the assessment criteria suggest
that the majority of M. modiolus biogenic reefs, particularly biotope
SS.SBR.SMus.ModCvar in Strangford Lough remain in unfavourable conservation
status. At some sites the biotope SS.SBR.SMus.ModHAs shows increasing
fragmentation. „Good‟ condition sites of this biotope at e.g. Craigyouran and West of
Round Island Pinnacle are not in pristine condition when compared with other beds
in the U.K. However, these probably represent the best remaining M. modiolus
communities in the Lough.

185
Table 7.1 Assessment of the current conservation status of M. modiolus biotopes in
Strangford Lough (December 2010)
Definitions of ‘Favourable Conservation Status’
Biotopes
Natural Habitat SS.SBR.SMus.ModCvar SS.SBR.SMus.ModHAs/ModT
Its natural range is stable or increasing.
Continuing to decline in distribution and condition.
At some sites this biotope shows increasing fragmentation. „Good‟ condition sites at e.g. Craigyouran and West of Round Island Pinnacle are not in pristine condition when compared with other beds in the U.K. However, these probably represent the best remaining M. modiolus communities in the Lough.
The specific structure and functions necessary for its long-term maintenance exist and are likely to continue for the foreseeable future.
Because there has been continued contraction in the range of its „foundation‟ species, M modiolus, this condition is not met.
This condition is only met at a small number of sites.
The conservation status of its typical species is favourable.
Although many species recorded in previous surveys are still present and presumably self-maintaining, species diversity has declined between 2003 and 2010. In addition, key species for this biotope (Chlamys varia and Aequipecten opercularis) are missing or under-represented.
Most species recorded in previous surveys are still present and presumably self-maintaining. Species diversity has not declined between 2003 and 2010.
Species (Modiolus modiolus)
Population dynamics indicate it is maintaining itself on a long-term basis as part of its natural habitat
Natural recruitment is very poor.
Natural recruitment is high.
Its natural range is not declining or likely to decline in the foreseeable future
Most of the recent (since 2003) contraction in range has been in the northern basin.
Range contraction (since 2003) less evident than in the northern basin.
There is a sufficiently large habitat to maintain it on a long-term basis
Based mainly on substratum characteristics, MAXENT modelling suggests that suitable habitat exists over much of its historical range.
Based mainly on substratum characteristics, MAXENT modelling suggests that suitable habitat exists over much of its historical range.

186
7.4 Projection for achieving „Favourable Conservation Status‟.
Because results from short-term temporal monitoring showed no clear trends, it is
not possible to develop a model based on the current study to predict when
favourable conservation status of M. modiolus biotopes will be restored in Strangford
Lough. However, there is relevant ongoing research led by AFBI into the
development of dynamic ecosystem carrying capacity models for the five sea loughs
in the north of Ireland. This research culminated in the publication of Sustainable
Mariculture in northern Irish Lough Ecosystems (SMILE) (Ferreira et al., 2007).Key
objectives of SMILE were to:
„establish functional models at the lough scale, describing key environmental
variables and processes, aquaculture activities and their interactions
evaluate the sustainable carrying capacity for aquaculture in the different
loughs, considering interactions between cultivated species, targeting
marketable cohorts, and fully integrating cultivation practices
examine the effects of overexploitation on key ecological variables
examine bay-scale environmental effects of different culture strategies.‟
During the course of the current project, the SMILE model for Strangford Lough
was expanded to incorporate additional species, Modiolus modiolus, Ostrea edulis
and Pecten maximus. This will allow carrying capacity limitations for these species
under different hypothetical scenarios to be determined (Service et al., in prep.).
Preliminary results indicate that in Strangford Lough, maximal feeding rates in M.
modiolus (weight-corrected) are significantly lower than in the blue mussel, Mytilus
edulis, which is consistent with the slower growth rate of the former. A scenario was
run, where historical M. modiolus areas were populated at a “pristine” density of 50
individuals m-2. The model predicts that M. modiolus in areas close to the mouth of
the lough will grow more quickly; this may be due to enhanced habitat suitability
although it will be compounded by density dependent effects. The model also
suggests that food availability is unlikely to be a factor limiting its recovery. (Service
et al. in prep). In addition, two published studies provide invaluable insight
intochanges in benthic communities, which follow the cessation of fishing in areas
historically impacted by mobile fishing gear in New Zealand (Cranfield et al. 2004)

187
and in Canada (Kenchington et al. 2007). These studies are highly relevant to the
present study because impacted communities in both cases included species of
horse mussel, M. modiolus in Canada and M. areoltatus in New Zealand that had
been damaged by scallop and oyster dredging respectively. Kenchington et al.
(2007) documented significant changes in the benthic community over a 30-year
period and suggested that these were primarily due to the physical impacts of mobile
fishing gear. However, they did not document habitat recovery. By contrast, Cranfield
et al. (2004) provide a model of biogenic habitat regeneration from bare substrate.
Succession from was described in 5 stages: 1) settlement of initial colonising
epifauna and infauna; 2) settlement of Modiolus areolatus and Ostrea chilensis; 3)
mussel and oyster density increase; 4) diversity and biodeposition increase; 5)
regeneration of the climax biogenic reef. Factors affecting this successional
regeneration include the period of non-disturbance, proximity of propagule sources
(Table 7.2; Cranfield et al. 2004) and hydrodynamic influences on propagule
dispersal (Ayata et al. 2009). Sedimentation and sediment mobility have also been
identified as potentially important factors which may influence the survival and
recovery of M. modiolus biogenic reefs (Service 1990; Strong and Service 2008) and
should be investigated further.
Table 7.2 Relationships between factors affecting habitat regeneration and habitat
complexity (Modified from Cranfield et al. 2004)
Habitat Complexity Rank
Height and form of habitat
Substratum characteristics
Estimated time since fished (years)
Estimated nearest source of propagules
1 Sediment Mud and sand 0 >5km 2 Sediment Pebble gravel,
fine sand 50 ~20km
3 ~20cm biogenic reefs
Pebble gravel, sand
20 10-15km
4 ~20cm biogenic reefs
Fine sand 20 <1km
5 Biogenic reefs 30-40cm high, 3-20m long
Fine sand 12 <1km

188
In Strangford Lough, much of the degraded M. modiolus habitat lies within 10-15
km of sources of propagules from the remaining beds; however, a timescale for
natural recovery in Strangford Lough can not be predicted unless there is no further
disturbance.
Historically there was a small fishery for Ostrea edulis in Strangford Lough, which
collapsed around the 1900s (Smyth et al. 2009). Recovery of O. edulis in the low
intertidal in Strangford Lough since 1998 was probably attributable to the presence
of high density commercial stocks in the 1990s, again demonstrating the importance
of propagules in community/species regeneration (Kennedy & Roberts 2006). No
sub-littoral oysters were recorded in the Lough during SLECI in 2003. However, O.
edulis was recorded at a number of sublittoral sites during the current project
(personal observations, MRRG); in addition, Chlamys varia was observed in empty
oyster shells at these sites. This observation may be comparable to stage 2
succession described by Cranfield et al. (2004).
While Table 7.1 may appear to paint a bleak picture for the potential recovery of
the M. modiolus biogenic reef feature in Strangford Lough, the experience in New
Zealand suggests that biogenic reefs comprising Ostrea sp. and Modiolus sp. may
recover over long periods if undisturbed. In addition, a number of positive elements
have emerged from the current project. First, species richness remains high and
some sites in both the north and south basins show evidence of natural recruitment.
Second, intervention involving translocation of M. modiolus onto cultch shows a
great potential to kick start the regeneration process. These positive elements of the
study form the basis of the recommendations below.
189
8 Recommendations (Undertaking 3)
8.1 Options
Do nothing
Continue to deliver the DARD/DOE Modiolus Restoration plan.
8.2 Recommendations
Recommendations below would enable DARD/DOE to continue to deliver the
Modiolus Restoration plan and follow its three essential elements.
8.2.1 PROTECTION
Maintain the ban on the use of mobile fishing gear
MRRG recommend that a total protection zone is established below the 10m
contour line between: Castle Island to Gransha Point in the North and the
Southern tip of Island Taggart to Kate‟s Pladdy in the South (Fig 8.1).
Rationale:
The recommendation meets the first objective of the the Modiolus Restoration
Plan agreed by DOE and DARD: „to identify, map and introduce total
protection for the remaining Modiolus biogenic reef sites within i year of
the adoption of this plan; damaged biogenic reefs will also be identified
and protected from further damage‟.
The proposed total protection zone:
Contains bulk of remaining M. modiolus communities
Contains experimental restoration cultch site

190
Includes a significant proportion of habitat suitable for M. modiolus biotopes
(ModCvar and ModHAs/ModT) based on habitat suitability models.
Issues:
Impacts on current stakeholder activities
This issue is without the scope of this report and fall within the responsibilities of
the competent authorities, DOE and DARD.
8.2.2 INTERVENTION
Establish at least one new artificial reef within the proposed non-disturbance
zone using weathered cultch. The reef site should be selected on the basis of
habitat suitability and larval dispersal modelling, be located within both the
proposed non-disturbance zone and the historical distribution of the Modiolus
modiolus beds with Chlamys varia, sponges, hydroids and bryozoans
(SS.SBR.SMus.ModCvar) biotope.
Ideally large numbers of adult mussels should be translocated onto cultch in
the area(s) selected for translocation. Based on preliminary results from the
current study, which found no significant difference in survival of mussels
translocated on to elevated or flattened cultch or onto unmodified substrate
the use of cultch may be redundant. However, sourcing and deployment of
cultch should be budgeted into any further intervention efforts. In addition,
because sourcing mussels for translocation remains a problem (see below)
the best approach might be to concentrate existing mussels into larger
patches. This would stabilse mussel patches due to the clumping behaviour of
mussels and overcome Allee effects whereby reproductive success
decreases with population density.
Rationale:
Experimental trials in current project show that:
• Artificial reefs stabilise quickly
• Translocated mussels show high survival

191
• Reefs are rapidly colonised by epifauna
Issues:
• The key issue involving translocation of mussels is that of acquiring sufficient
quantities of mussels to increase the chances of success. This would
necessitate collecting mussels from outside Strangford Lough for this
purpose. This was considered when the pilot reef experiment was initiated
during the present project. The proposal was rejected on the grounds that 1)
M. modiolus beds in the western Irish sea (the nearest source stocks) are
themselves already under threat (Goodwin et al. 2011); 2) there would be a
risk of introducing pathogens and alien species; 3) introduced mussels might
not be genetically compatible with populations in Strangford Lough (see for
example Maggs 2008). However, because this project has successfully
translocated mussels in small-scale trials, the potential risks and benefits of
such intervention should be re-evaluated with a view to undertaking
translocation on a large scale.
• Cost
8.2.3 MONITORING
Establish an annual programme to monitor:
• status of natural biogenic reefs
• recruitment & succession on established experimental reef
• recruitment & succession on proposed experimental reef
• selected historical sites where M. modiolus no longer occurs
Rationale:
Longer time frame is required to demonstrate:
positive or negative changes in natural reefs (natural recovery)
• Effectiveness of artificial reefs
Methodology
• Status of natural biogenic reefs:

192
Transect surveys should be repeated every 6 months at the same locations studied during
the SLECI and MRRG projects using the same methodology. The surveying method will
involve deploying a 100 m leaded line to mark the transect position at each survey areas.
Divers will move along the transects taking representative still digital photographs of the
seabed at regular 5 m intervals. M. modiolus presence will also be recorded at each 5 m tag.
The digital photographs will be analyzed in the laboratory documenting the epifaunal
assemblage, determining the abundance and percent cover of each taxon observed. M.
modiolus density and associated infaunal community will be studied by means of an annual
total removal sampling programme.
• Recruitment & succession on established and proposed experimental reefs:
A photographic and video transect survey should be carried out every 6 months to document
faunal community succession. Photographs should be analysed for M .modiolus densities
and mortalities while associated epifauna should be identified, counted and percentage
coverage calculated. A video survey should also be carried out to document condition and
structure of the experimental reef and to record the presence of species missed during the
photographic survey, particularly fish and other mobile fauna. An annual total removal survey
using smaller 0.0625 m2 to minimize disturbance should also be carried out.
Issues:
• Costs

193
Figure 8.1 Distribution of Modiolus modiolus in Strangford Lough in 2010 based on surveys
conducted by the Modiolus Restoration Research Group (Inset). M. modiolus reefs were
recorded at 123 of 442 sites surveyed and is the basis of the recommendation to establish a
total protection zone below the 10m depth contour, between Castle Island to Gransha Point in
the North and the Southern tip of Island Taggart to Kate‟s Pladdy in the South (Main figure). The
recommendation aims to meet the first objective of the Modiolus Restoration Plan agreed by
DOE and DARD: „to identify, map and introduce total protection for the remaining
Modiolus biogenic reef sites within 1 year of the adoption of this plan‟.
The map also indicates:
The position of „good‟ condition sites, at Craigyouran and Round Island Pinnacle
The experimental cultch site
Strangford Lough (Sea Fisheries Exclusion Zones) Regulations (Northern
Ireland) 2011 No. 36, Introduced 14th March 2011 are also illustrated.

194
Sea Fisheries Exclusion Zones March 2011
Proposed M. modiolus protected area
Experimental M. modiolus reef site
MRRG survey records (2008-2010)
M. modiolus present M. modiolus absent
ARDS
PENINSULA
STRANGFORD
LOUGH
IRISH
SEA
195
9.0 References
92/43/EEC Council Directive of 21 May 1992 on the conservation of natural habitats
and wild flora and fauna,
AFBI (2011). Data available from: <http://www.afbini.gov.uk/index/services/services-
specialist-advice/coastal-science/coastal-monitoring/monitored-sites/n-
strangford.htm>
Anderson, M.J, Gorley, R.N., and Clarke K.R. (2008) PERMANOVA+ for Primer:
Guide to software and statistical methods, 1st edition. PRIMER-E, Plymouth, UK
Anderson, R. P., Lew, D. & Peterson, A. T. (2003) Evaluating predictive models of
species‟ distributions: criteria for selecting optimal models. Ecological Modelling
162: 211–232.
Anon (2005) Strangford Lough Modiolus Biogenic Reef DOE/DARD Restoration
Plan. DOE/DARD, Northern Ireland. 18pp.
Anwar, N.A., Richardson, C.A. & Seed, R. (1990) Age determination, growth rate
and population structure of the horse mussel Modiolus modiolus. Journal of the
Marine Biological Association UK, 70: 441-457.
Ayata S-D., Ellien C., Dumas F., Dubois S. and Thiébaut E. (2009) Modelling larval
dispersal and settlement of the reef-building polychaete Sabellaria alveolata: Role
of hydroclimatic processes on the sustainability of biogenic reefs. Continental
Shelf Research 29: 1605 -1623.
Bartol, I.K. and Mann, R. (1997) Small-scale settlement patterns of the oyster
Crassostrea virginica on a constructed intertidal reef. Bulletin of Marine Science
61 (3): 881-897
Bayne, B.L. (1965) Growth and the delay of metamorphosis of the larvae of Mytilus
edulis (L.). Ophelia, 2(1), 1-47.
Bayne, B.L.(1976) The biology of mussel larvae. In: Marine Mussels: their Ecology
and Physiology (ed. B.L. Bayne), pp. 13-65. Cambridge University Press,
Cambridge.
Beck, M.W., Brumbaugh, R.D., Airoldi, L., Carranza, A., Coen, L.D., Crawford, C.,
Defeo, O., Edgar, G.J., Hancock, B., Kay, M., Lenihan, H., Luckenbach, M.W.,
Toropova, C.L., Zhang, G. (2009) Shellfish Reefs at Risk: A Global Analysis of
Problems and Solutions. The Nature Conservancy, Arlington VA. 52 pp.
196
Beduschi, P., de Melo, C.M.R. & Ferreira, J.M. (2009) The influence of techniques of
larvae rearing and seed collectors on the survival rate and recovery efficiency of
the Brown Mussel Perna perna (L.) in laboratory. Brazilian Archives of Biology and
Technology: 52(1), 145-152.
Boyd, R.J. (1973) The relation of the plankton to the physical, chemical and
biological features of Strangford Lough, Co. Down. Proceedings of the Royal Irish
Academy 73B: 317-353
Bradshaw C., Veale L. O., and Brand A. R. (2002) The role of scallop-dredge
disturbance in long-term changes in Irish Sea benthic communities: a re-analysis
of an historical dataset. Journal of Sea Research 47:161-184
Brown, R.A. (1984) Geographical variations in the reproduction of the horse mussel,
Modiolus modiolus (Mollusca:Bivalvia). Journal of the Marine Biological
Association of the United Kingdom 64: 751-770.
Brown, R. A. (1989) Bottom trawling in Strangford Lough: Problems and Policies. in
ten Halers, C. C., and Bijlsma, A. editor, Proceedings from the 3rd North Sea
Seminar. Rotterdam, Netherlands.
Brown, R. A. & Seed, R. (1977). Modiolus modiolus (L.) - An autoecological study.
Pages 93-100 in Keegan, B. F., O'Ceidih, P.O. & Boaden, P.J.S., editor. Biology
of Benthic Organisms. Proceedings of the 11th European Symposium on Marine
Biology, Pergamon Press, Oxford. Galway, Ireland.
Brown, R.A., Seed, R. and O‟Connor, R.J. (1976) Comparison of relative growth in
Cerastoderma (=Cardium) edule, Modiolus modiolus, and Mytilus edulis
(Mollusca-Bivalvia). Journal of Zoology 179: 297-315.
Brumbaugh, R.D., Beck, M.W., Coen, L.D., Craig, L. and Hicks, P. (2006) A
practitioner’s guide to the design and monitoring of shellfish restoration projects:
an ecosystems services approach. The Nature Conservancy, Arlington, VA.
Bushek, D., Richardson, D. Bobo, M.Y. and Coen, L.D. (2004) Quarantine of oyster
shell cultch reduces the abundance of Perkensus marinus. Journal of Shellfish
Research 23: 369-373.
Caddy, J.F. and Defeo, O. (2003) Enhancing or restoring the productivity of natural
populations of shellfish and other marine invertebrate resources. FAO Fisheries
Technical Paper 448. Food and Agriculture Organization of the United Nations.
159pp.
197
Clarke, K.R., Warwick, R.M. (2001) Change in marine communities: an approach to
statistical analysis and interpretation, 2nd edition. PRIMER-E, Plymouth, UK
Cork, M., Adnitt, C., Staniland, R. and Davison, A. (2006) Creation and Management of Marine Protected Areas in Northern Ireland. Environment and Heritage Service Research and Development Series. No. 06/18. Available from: http://www.doeni.gov.uk/niea/mpa-report_amended.pdf
Coen, L.D., Brumbaugh, R.D., Bushek, D., Grizzle, R., Luckenbach, M.W., Posey,
M.H., Powers, S.P. & Tolley, S.G. (2007) Ecosystem services related to oyster
restoration. Marine Ecology-Progress Series 341: 303-307.
Cole, V.J. (2010) Alteration of the configuration of bioengineers affects associated
taxa. Marine Ecology-Progress series 416: 127-136.
Comely, C.A. (1978) Modiolus modiolus (L.) from the Scottish west coast, Ophelia
17: 167-193
Comely, C.A. (1981) The physical and biochemical condition of Modiolus modiolus
(L.) in selected Shetland voes. Proceedings of the Royal Society of Edinburgh
80B: 299-321.
Connor, D.W, Allen, J.H., Golding, N., Howell, K.L., Lieberknecht, L.M., Northen, K.O
& Becker, J.B. (2004) The Marine Habitat Classification for Britain and Ireland
Version 04.05. JNCC, http://www.jncc.gov.uk/MarineHabitatClassification
Council of the European Communities (1992). Council Directive 92/43/EEC on the
conservation of natural habitats of wild fauna and flora. The Council of the
European Communities, Brussels.
Cranfield H.J., Rowden, A.A., Smith D.J., Gordon, D.P. and Michael K.P. (2004)
Macrofaunal assemblages of benthic habitat of different complexity and a
`proposition of a model of biogenic reef habitat regeneration in Foveaux Strait,
New Zealand. Journal of Sea Research 52: 109-125.
Cranfield, H.J., Carbines, G., Michael K.P., Dunn, A., Stotter, D.A. & Smith, D.J.
(2001). Promising signs of regeneration of blue cod and oyster habitat changed by
dredging in Foveaux Strait, southern New Zealand. New Zealand Journal of
Marine and Freshwater Research 35: 897-908.
Da Costa, F., Darriba, S. and Martínez-Patiño, D. (2008) Embryonic and larval
development of Ensis arcuatus (Jeffreys, 1865) (Bivalvia Pharidae). Journal of
Molluscan Studies 74 (2): 103-109.

198
Davenport, J. and Kjørsvik, E. (1982) Observations on a Norwegian intertidal
population of the horse mussel Modiolus modiolus. Journal of Molluscan Studies
48: 370-371.
Environment and Heritage Service (2001) Strangford Lough SAC/SPA Management
Scheme. Available from:
http://www.doeni.gov.uk/niea/strangfordmanagementscheme.pdf
Erwin, D. G. (1970) A diving survey of Strangford Lough: the benthic communities
and their relation to substrate-a preliminary account. Pages 215-224 in B. F.
Keegan, O'Ceidih, P.O. and Boaden, P.J.S., editor. Biology of Benthic Organisms.
Pergamon Press, Oxford.
Erwin, D. G. (1986) Strangford Lough benthos and the marine community concept.
Unpublished PhD Thesis. Queen's University, Belfast. 172pp.
Erwin, D.G., Picton, B.E., Connor, D.W., Howson, C.M., Gilleece, P. and Bogues,
M.J. (1986). The Northern Ireland Sublittoral Survey. Ulster Museum Belfast:
HMSO.
Erwin, D.G., Picton, B.E., Connor, D.W., Howson, C.M., Gilleece, P. and Bogues,
M.J. (1990) Inshore marine life of Northern Ireland. Belfast, HMSO for Department
of the Environment (Northern Ireland).
Ferreira, J.G. and fourteen other authors (2007) SMILE, Sustainable Mariculture in
northern Irish Lough Ecosystems. Ed. IMAR Institute of Marine Research, 100pp.
Flyachinskaya, LP.. and Naumov, A.D. (2003). Distribution and larval development in
the horse mussel Modiolus modiolus (Linnaeus, 1758) (Bivalvia, Mytilidae) from
the White Sea. Proceedings of the Zoological Institute of the Russian Acadademy
of Science 299: 39-50.
Galley, T.H., Batista, F.M., Braithwaite, R., King, J. and Beaumont, A.R. (2010)
Optimisation of larval culture of Mytilus edulis (L.). Aquaculture International 18:
315-325.
Goodwin, C., Picton, B., Breen, J., Edwards H. And Nunn, J. (2011) Sublittoral
Survey Northern Ireland (2006-2008): A review of the status of Northern Ireland
priority species of marine invertebrates. Northern Ireland Environment Agency
Research and Develpment Series No11/01. 152pp.
Gibson, L.A., Wilson, B.A., Cahill, D.A., Hill, J., (2004). Spatial prediction of rufous
bristlebird habitat in a coastal heathland: a GIS-based approach. Journal of
Applied Ecology 41: 213-223.

199
Gosling, E. (2003) Bivalve Molluscs: Biology, Ecology and Culture. Fishing New
Books, Oxford.
Griffith, B., Scott, J.M. Carpenter, J.W. & Reed C., 1989. Translocation as a species
conservation tool: status and strategy. Science 245: 477-480.
Guisan, A., Zimmerman, N.E. (2000) Predictive habitat distribution models in
ecology. Ecological Modelling 135:147-186.
Hastie, L.C, Tarr, E.C., al-Mousawi, B. and Young, M.R. (2010) Medium-term
recruitment patterns in Scottish freshwater pearl mussel Margaritifera
margaritifera populations. Endangered Species Research 11: 21-33
Helm, M.M., Bourne, N. and Lovatelli, A. (2004) Hatchery culture of bivalves - A
practical manual. FAO Publishing. Rome, 177 pp.
Héral, M., (1990). Traditional oyster culture in France. Pp. 342-387 in G. Barnabe
(ed.), Aquaculture, Volume 1. Ellis Horwood, New York.
Hochburg, M.E. & Ives, A.R. (1999) Can natural enemies enforce geographical
range limits? Ecogeography 22: 268-276.
Holt, T. J., Rees, E.I., Hawkins, S.J. and Seed, R. (1998) Biogenic Reefs (volume
IX). An overview of dynamic and sensitivity characteristics for conservation
management of Marine SACs. Scottish Association for Marine Science (UK
Marine SAC Project), Liverpool.
Howson, C.M. & Picton, B.E. (eds) (2000). The species directory of the marine fauna
and flora of the British Isles and surrounding seas. Ulster Museum and The
Marine Conservation Society, Belfast and Ross-on-Wye. CD-ROM Edition
http://europa.eu.int/comm/envitonment/nature/habdir.htm
Inve Ltd. (2009) Available from: http://www.inve.com/INVE-
Aquaculture/English/Products/Shellfish-
hatcheries/Dry+diets/MySpat/page.aspx/1151
Jasim, A.K. (1986) Some ecological aspects of Modiolus modiolus populations off
the south-east of the Isle of Man. Unpublished PhD Thesis. University of
Liverpool.
Jasim, A.K. and Brand, A.R. (1989) Observations on the reproduction of Modiolus
modiolus in Isle of Man waters. Journal of the Marine Biological Association UK
69:373-385.

200
JNCC (2011) MNCR SACFOR abundance scales. Available from: http://jncc.defra.gov.uk/ProtectedSites/SACselection/n2kforms/UK0016618.pdfUK SAC data form
Jones N S (1952) The bottom fauna off the south of the Isle of Man. Journal of
Animal Ecology 20: 132-144.
Jørgensen, C.B. (1946) Lamellibranchia. Reproduction and larval development of
Danish bottom invertebrates. Medd. Komm. Dan. Fisk. Havundersøg.,
Copenhagen, Series-Plankton 4: 277-311.
Kenchington, E. L., Kenchington, T. J., Henry, L., Fuller, S., Gonzalez, P. (2007)
Multi-decadal changes in the megabenthos of the Bay of Fundy: the effects of
fishing. Journal of Sea Research 58: 220-240.
Kennedy, R.J., Roberts, D. (2006) Commercial oyster stocks as a potential source of
larvae in the regeneration of Ostrea edulis in Strangford Lough, Northern Ireland.
Journal of the Marine Biological Association of the United Kingdom 86 (1): 153-
159.
Koivisto M E and Westerbom M. (2010) Habitat structure and complexity as
determinants of biodiversity in blue mussel beds on sublittoral rocky shores.
Marine Biology 157: 1463–1474
Kraeuter, J.N., Kennish, M.J., Dobarro, J., Fegley, S.R., Flimlin Jr., G.E. (2003)
Rehabilitation of the Northen quahog (Hard Clam) (Mercenaria mercenaria)
habitats by shelling-11 years in Barnegat Bay, New Jersey, Journal of Shellfish
Research 22(1): 61-67.
Laing, I. (1987) The use of artificial diets in rearing bivalve spat. Aquaculture 65(3-4);
243-249.
Leard, R.L., Dugas, R. & Berrigan M. (1999). Resource Management Programs for
the Eastern Oyster, Crassostrea virginica, in the U.S. Gulf of Mexico, Past,
Present, Future In : Luckenbach, M.W., Mann, R., Wesson, J.A. (Eds.), Oyster
Reef Habitat Restoration: A Synopsis and Synthesis of Approaches. Virginia
Institute of Marine Science Press, Gloucester Point, VA, pp. 159–170.
Lilleskare, J. (1905). Om Forekomst av Oskajael paa Dybvand. Norks Fiskeritidende,
98-109
Liu, A.Y., Schisterman, E.F. & Wu, C.Q. (2005) Nonparametric estimation and
hypothesis testing on the partial area under receiver operating characteristic
curves. Communications in statistics- theory and methods 34 (9-10): 2077-2088.
201
Loosanof, V.L. and Davis, H.C. (1963) Rearing of bivalve molluscs. Advances in
Marine Biology 1: 1-136
Lucas, J. (2003) Bivalves. In: Aquaculture. Farming aquatic animals and plants (Ed.
by J.S. Lucas and P.C. Southgate), pp. 157-76. Blackwell Publishing Ltd., Oxford
Maggs, C. (2008) Special Protection and Local Action for Species and Habitats (SPLASH) 2004-2008. Final Report. Queen‟s University Belfast. Available from: www.marlin.ac.uk/pdf/SPLASH%20Final%20Report.pdf Magorrian, B. H., and M. Service. (1998) Analysis of underwater visual data to
identify the impact of physical disturbance on horse mussel (Modiolus modiolus)
beds. Marine Pollution Bulletin 36: 354-359.
Magorrian, B.H., Service, M. and Clarke, W. (1995) An acoustic bottom classification
survey of Strangford Lough, Northern Ireland. Journal of the Marine Biological
Association of the United Kingdom 75: 987-992.
Maguire, J.A., Knights, T., Burnell, G., Crowe, T.C., O‟Beirn, F., McGrath, D., Ferns,
N., McDonough, N., McQuaid, N., O‟Connor, B., Doyle, R., Newell, R., Seed, R.,
Smaal, A., O‟Carroll, T., Walson, L., Dennis, J. and O‟Cinneide, M. (2007).
Management recommendations for the sustainable exploitation of mussel seed in
the Irish Sea. Marine Environment and Health Series, 31.
Mair, J. M., Moore, C. G., Kingston, P. F., Harries, D. B. (2000) A review of the
status, ecology and conservation of horse mussel Modiolus modiolus beds in
Scotland. Scottish Natural Heritage Commissioned Report F99PA08.
Mann, R. and Evans, D. (2004) Site selection for oyster habitat rehabilitation in the
Virginia portion of the Chesapeake Bay. Journal of Shellfish Research 23(1): 41-
49.
Meadows, P.S. and Shand, P. (1989) Experimental analysis of byssus thread
production by Mytilus edulis and Modiolus modiolus in sediments. Marine Biology
101: 219-226.
Mitchell, A. and Service, M. (2003). Northern Ireland Nearshore Habitat Mapping
Project.
Modiolus Restoration Research Group (2008). Unpublished reports.
Moore, C. G., Saunders, G. R., Harries, D. B., Mair, J. M., Bates, C. R., Lyndon, A.
R. (2006) The establishment of site condition monitoring of the subtidal reefs of
Loch Creran SAC. Scottish Natural Heritage Commissioned Report No. 151

202
Nunn, J. (1994) The Marine Mollusca of Ireland 1. Strangford Lough, Co. Down. Irish
biogeographical society. Bulletin No. 17(2): 23-214.
Ocklemann, K.W. (1965) Developmental types in marine bivalves and their
distribution along the Atlantic coast of Europe. In: Proceedings of the first
European Malacological Congress, London 1962 25-35.
Olsson, O. & Rogers, D.J. (2009) Predicting the distribution of a suitable habitat for
the white stork in Southern Sweden: identifying priority areas for reintroduction
and habitat restoration. Animal Conservation12: 62-70.
Palumbi SR, Sandifer PA, Allan JD, Beck MW, Fatin DG, Fogarty MJ, Halpern BS,
Incze LS, Leong JA, Norse E, Stachowicz JJ, Wall DH (2009) Managing for ocean
biodiversity to sustain marine ecosystem services. Frontiers in Ecology and the
Environment 7(4): 204-211.
Peterson, C.H., Summerson, H.C. and Leuttich Jr.,R.A. (1996) Response of bay
scallops to spawner transplants: a test of recruitment limitation. Marine Ecology
Progress Series 264: 249-264.
Phillips, S.J., Anderson, R.P., Schapire, R.E. (2006) Maximum entropy modelling of
species geographic distributions. Ecological Modelling 190; 231-259.
Phillips, S.J., Dudlík, M. (2008) Modelling of species distributions with Maxent: new
extensions and a comprehensive evaluation. Ecography 31: 161-175.
Plass-Johnson, J.G., McQuaid, C.D. & Porri, F. (2010) Top-down effects on intertidal
mussel populations: assessing two predator guilds in a South African marine
protected area. Marine Ecology-Progress Series 411: 149-159.
Powers, S., Peterson, C., Grabowski, J. & Lenihan, H. (2009) Success of constructed oyster reefs in no-harvest sanctuaries: implications for restoration. Marine Ecology Progress Series 389: 159-170
Rees, C.B. (1950). The identification and classification of lamellibranch larvae. Hull Bulletin of Marine Ecolology 4 (27):21-46.
Rees, E. I. S. (2005). Assessment of the status of horse mussel (Modiolus modiolus)
beds in the Irish Sea off NW Anglesey. Llanfairpwll.
Rees, I. (2009) An assessment of M. modiolus beds in the OSPAR area. JNCC
Report draft.

203
Rees, I. (2009) Background document for Modiolus modiolus beds. Report prepared
on behalf of the Joint Nature Conservation Committee (JNCC) for the OSPAR
COMMISSION [OSPAR Publication Number 425/2009] 28pp.
Rees, I., Sanderson, W.G., Mackie A.S.Y and Holt, R.H.F. (2008) Small-scale
variation within a Modiolus modiolus (Mollusca: Bivalvia) reef in the Irish Sea. III.
Crevice, sediment infauna and epifauna from targeted cores. Journal of the
Marine Biological Association UK 88(1): 151-156.
Rice, M.A., Valliere, A. & Caporelli, A. (2000) A review of shellfish restoration and
management projects in Rhode Island. Journal of Shellfish Research 19: 401-408.
Richardson, C.A., Crisp, D.J. & Runham, N.W. (1979). Tidally deposited growth
bands in the shell of the common cockle Cerastoderma edule (L.).Malacologia 18:
277-290.
Roberts, C. D. (1975) Investigations into a M. modiolus (L.) (Mollusca: Bivalvia)
community in Strangford Lough, Northern Ireland. Report, Underwater Association
1:27-49.
Roberts, D. (2003) Strangford Lough Ecological Change Investigation. Work Package 2 – The current status of Strangford Modiolus. KA 2.1: Diving Survey. Queen‟s University Belfast. Available from: http://www.doeni.gov.uk/niea/modiolus_position_report22dec03.pdf
Roberts, D., Davies, C., Mitchell, A., Moore, H., Picton, B., Portig, A., Preston, J.,
Service, M., Smyth, D., Strong, D. and Vize, S. (2004) Strangford Lough
Ecological Change Investigation (SLECI). Report to Environment and Heritage
Service. The Queen's University of Belfast, Belfast.
Rowell, T.W. (1967). Some aspects of the ecology, growth and reproduction of the
horse-mussel, Modiolus modiolus. M. Sc. Thesis, Queen‟s University Ontario, 138
pp.
Sagarin, R.D. & Gaines, S.D., (2002) The „abundant centre‟ distribution: to what
extent is it a Biogeographical rule? Ecology letters 5: 137-147.
Sanderson W.G., Holt R.H.F., Ramsay K., Perrins J., McMath A.J., and Rees E.I.S.
(2008) Small-scale variation within a Modiolus modiolus (Bivalvia) reef in the Irish
Sea. Ii. Epifauna recorded by divers and cameras. Journal of the Marine Biological
Association UK 88: 143-149
Schulte, D.M., Burke, R.P. & Lipcius, R.N. (2009). Unprecedented restoration of a
native oyster metapopulation. Science 325: (5944)

204
Schweinitz, E.H. and Lutz, R.A. (1976) Larval development of the northern horse
mussel, Modiolus modiolus (L.), including a comparison with the larvae of Mytilus
edulis L. as an aid in planktonic identification. Biological Bulletin 150(3), 348-360.
Seddon, P.J., Armstrong, D.P., Maloney, R.F. (2007) Developing the science of
reintroduction biology. Conservation Biology 21: 303-312.
Seed, R. (1969) The ecology of Mytilus edulis L. (Lamellibranchiata) on exposed
rocky shores. I. Breeding and settlement. Oecologia 3 : 277-316
Seed, R. (1976) Ecology. In: Marine Mussels: their Ecology and Physiology (ed. B.L.
Bayne), pp. 13-65. Cambridge University Press, Cambridge.
Seed, R. and Brown, R.A. (1975) The influence of reproductive cycle, growth, and
mortality on population structure in Modiolus modiolus (L.), Cerastoderma edule
(L.) and Mytilus edulis L., (Mollusca:Bivalvia). In: H. Barnes (Ed.), 9th European
Marine Biology Symposium. Aberdeen University Press, City: 257-274.
Seed, R. B., and Brown, R. A. (1977). A comparison of the reproductive cycles of
Modiolus modiolus (L.), Cerastoderma (=Cardium) edule (L.), and Mytilus edulis L.
In Strangford Lough, Northern Ireland. Oecologia 30:173-188.
Seed, R. and Brown, R.A. (1978) Growth as a Strategy for Survival in two Marine
Bivalves, Cerastoderma edule and Modiolus modiolus. The Journal of Animal
Ecology 47(1): 283-292.
Seed R and Suchanek T H. (1992) Population and community ecology of Mytilus. In:
Gosling E (editor) The mussel Mytilus: Ecology, Physiology, Genetics and Culture.
Elsevier, Amsterdam. pp 87-169.
Sergio, C., Figueira, R., Draper, D., Menezes, R., Sousa, A.J. (2007). Modelling
bryophyte distribution based on ecological information for extent of occurrence
assessment. Biological Conservation 135: 341-351.
Service, M. (1990). The impact of commercial trawling on the benthos of Strangford
Lough (interim report) Report to Department of Agriculture and Rural
Development. Belfast, UK.
Service, M. (1998). Monitoring benthic habitats in a marine nature reserve. Journal of
Shellfish Research 17 (5): 1487-1489.
Service, M. and Magorrian, B. H. (1997). The extent and temporal variation of
disturbance to epibenthic communities in Strangford Lough, Northern Ireland.
Journal of Marine Biological Association UK 77: 1151-1164.

205
Service, M., Moore H.M, Ferreira, J.S.and Hawkins, A.J.S., in prep. Modelling
scenarios for Modiolus modiolus restoration in Strangford Lough.
Smyth, D., (2007) Impacts of stock-enhancement strategies on Ostrea edulis in
Strangford Lough. Unpublished PhD thesis, Queen’s University Belfast, 233pp.
Smyth, D., Roberts, D. and Browne, L. (2009). Impacts of unregulated harvesting on
a recovering stock of native oysters (Ostrea edulis). Marine Pollution Bulletin 58
(6): 916-922.
Strayer, D.L. (2008). Freshwater Mussel Ecology: A Multifactor Approach to
Distribution and Abundance. Freshwater Ecology Series, University of California
Press, Berlin.
Strong, J. A. and Service, M. (2008) Historical chronologies of sedimentation and
heavy-metal contamination in Strangford Lough, Northern Ireland. Biology and
Environment: Proceedings of the Royal Irish Academy 108B: 109-126.
Tendel, O.S. & Dinesen, G.E. (2005).Biogenic sediments, substrates and habitats of
the Faeroese shelf and slope. BIOFAR Proceedings 2005, 224-242.
Trimble, A.C., Ruesink, J.L. & Dumbauld, B.R. (2009). Factors preventing the
recovery of a historically overexploited shellfish species, Ostrea lurida Carpenter
1864. Journal of Shellfish Research 28(1): 97-106.
Utting, S. D. (1988). The growth and survival of hatchery reared Ostrea edulis L. spat
in relation to environmental conditions at the on-growing site. Aquaculture 69: 27-
38.
Utting, S.D. & Spencer, B.E. (1991) The hatchery culture of bivalve mollusc larvae
and juveniles. Lab. Leafl., MAFF Fish. Res.,68, 31 pp.
Veale, L. O., Hill, A. S., Hawkins, S. J., Brand, A.R. (2000). Effects of long-term
physical disturbances by commercial scallop fishing on subtidal epifauna
assemblages. Marine Biology 137: 325-337.
Wesson, J.A., Mann, R & Luckenbach, M.W. (1999). Oyster reef restoration efforts in
Virginia In: Luckenbach, M.W., Mann, R., Wesson, J.A. (Eds.), Oyster Reef
Habitat Restoration: A Synopsis and Synthesis of Approaches. Virginia Institute of
Marine Science Press, Gloucester Point, VA, 117–129.
Wiborg, F.K. (1946) Undersøkelser over oskellet (Modiolus modiolus (L.)).
Fiskeridirektoratets Skrifter (ser. Havundsrsøkelser), 8, 85.

206
Wildish, D.J., Fader, G.B.J., Lawton, T. & MacDonald, A.J. (1998). The acoustic
detection and characteristics of sublittoral bivalve reefs in the bay of Fundy.
Continental Shelf Research 18: 105-113.
Williams, G. (1954). Fauna of Strangford Lough and neighbouring coasts.
Proceedings of the Royal Irish Academy 56: 29-133.
Williamson, H.C. (1907) The spawning, growth and movement of the musel (M.edulis
L.), horse mussel (M. modiolus L.), and the spoutfish (Solen siliqua L.). Annu.
Rep. Scot. Fish. BD. Sci. Invest., 25: 221-255
Wilson, C.D. & Roberts, D. (2011). Modelling distributional trends to develop
management strategies for endangered species. Diversity and Distributions 17:
182-189.
Wilson, C.D., Roberts, D. & Reid, N. (2011). Applying species distribution modelling
to identify areas of high conservation value for endangered species: A case study
using Margaritifera margaritifera (L.). Biological Conservation 144: 821-829.
Wolf, C.M., Griffith, B. Reed, C. & Temple, S.A. (1996). Avian and mammalian
translocations: update and reanalysis of 1987 survey data. Conservation Biology
10:1142-1154.

207
10.0 Appendices

208
Appendix 1. List of Remotely Operated Vehicle (ROV) surveys carried out in
Strangford Lough by the Modiolus Restoration Research Group (MRRG) over the
2008 to 2010 period as part of the Modiolus Restoration Plan (MRP) mapping
undertaking. Condition grades: 1) Continuous clumps; 2) Discrete clumps; 3)
Present; 4) Absent
Date Northing Easting
M. modiolus bed
description Condition
grade Substrate
description Algae/Epifauna
10/04/2008 54.39343 -5.59883 No evidence of Modiolus 4
Coarse gravel with mixed shell
and cobbles Lithothamnion
10/04/2008 54.40325 -5.61525 No evidence of Modiolus 4
Mixed gravel and shell with
occasional small boulders Lithothamnion
10/04/2008 54.40603 -5.61452 No evidence of Modiolus 4
Coarse sand, gravel, shell and
pebbles. Cerianthus lloydii
10/04/2008 54.39943 -5.58533 No evidence of Modiolus 4
Coarse sand and mixed shell
with interdispearsed large boulders Antedon bifida
15/04/2008 54.40265 -5.60325 No evidence of Modiolus 4
Gravel with frequent large
and small boulders
Phycodrys rubens
22/04/2008 54.40363 -5.59150
Shell accumulations
(80%) 4
Fine sand with overlying gravel
and shell including Modiolus Ophiotrix fragilis
15/04/2008 54.40840 -5.59200
Shell accumulations
(80%) 4
Fine sand with overlying gravel of which a large proportion are
shell Ophiotrix fragilis
15/04/2008 54.41300 -5.58787 No evidence of Modiolus 4
Gravel overlying fine sand with
occasional small and large boulders Henricia oculata
22/04/2008 54.41407 -5.62380 No evidence of Modiolus 4 Fine sand
Hydroids, Turritella
15/04/2008 54.41177 -5.58557
Shell accumulations
(70%) 4
Continuous shell bed (large proportion Modiolus-
unclear if dead or al Ophiotrix fragilis
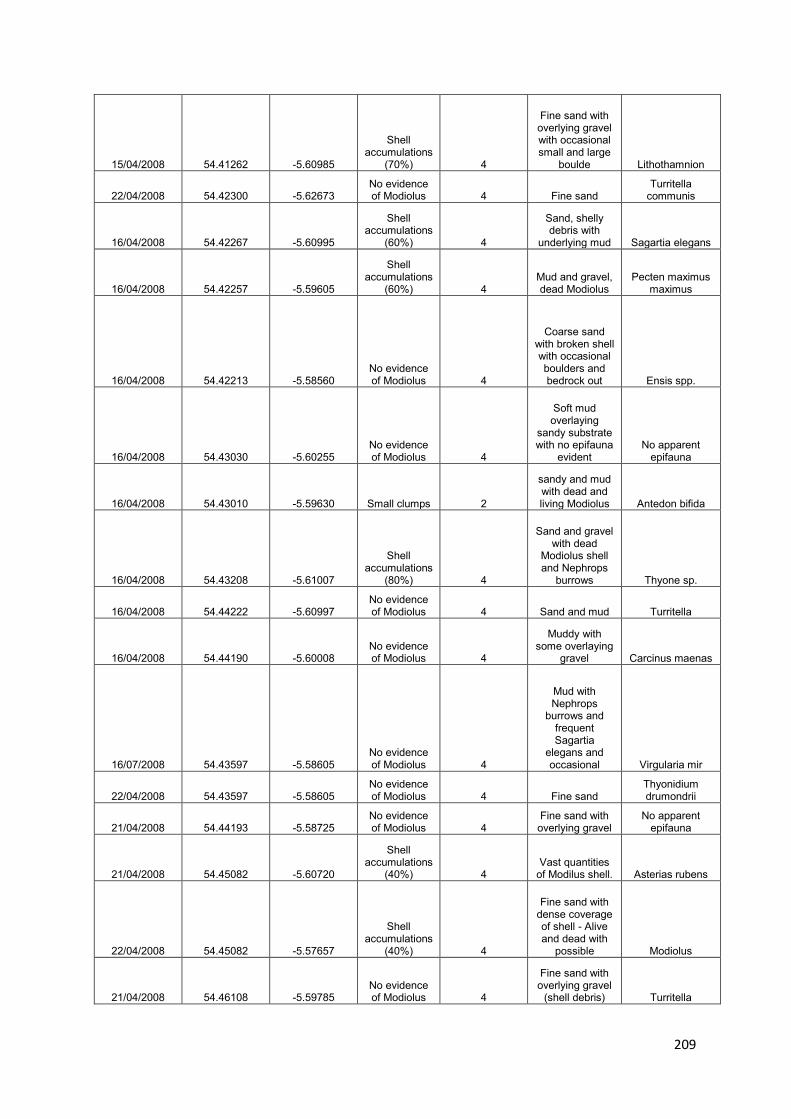
209
15/04/2008 54.41262 -5.60985
Shell accumulations
(70%) 4
Fine sand with overlying gravel with occasional small and large
boulde Lithothamnion
22/04/2008 54.42300 -5.62673 No evidence of Modiolus 4 Fine sand
Turritella communis
16/04/2008 54.42267 -5.60995
Shell accumulations
(60%) 4
Sand, shelly debris with
underlying mud Sagartia elegans
16/04/2008 54.42257 -5.59605
Shell accumulations
(60%) 4 Mud and gravel, dead Modiolus
Pecten maximus maximus
16/04/2008 54.42213 -5.58560 No evidence of Modiolus 4
Coarse sand with broken shell with occasional boulders and bedrock out Ensis spp.
16/04/2008 54.43030 -5.60255 No evidence of Modiolus 4
Soft mud overlaying
sandy substrate with no epifauna
evident No apparent
epifauna
16/04/2008 54.43010 -5.59630 Small clumps 2
sandy and mud with dead and living Modiolus Antedon bifida
16/04/2008 54.43208 -5.61007
Shell accumulations
(80%) 4
Sand and gravel with dead
Modiolus shell and Nephrops
burrows Thyone sp.
16/04/2008 54.44222 -5.60997 No evidence of Modiolus 4 Sand and mud Turritella
16/04/2008 54.44190 -5.60008 No evidence of Modiolus 4
Muddy with some overlaying
gravel Carcinus maenas
16/07/2008 54.43597 -5.58605 No evidence of Modiolus 4
Mud with Nephrops
burrows and frequent Sagartia
elegans and occasional Virgularia mir
22/04/2008 54.43597 -5.58605 No evidence of Modiolus 4 Fine sand
Thyonidium drumondrii
21/04/2008 54.44193 -5.58725 No evidence of Modiolus 4
Fine sand with overlying gravel
No apparent epifauna
21/04/2008 54.45082 -5.60720
Shell accumulations
(40%) 4 Vast quantities
of Modilus shell. Asterias rubens
22/04/2008 54.45082 -5.57657
Shell accumulations
(40%) 4
Fine sand with dense coverage of shell - Alive and dead with
possible Modiolus
21/04/2008 54.46108 -5.59785 No evidence of Modiolus 4
Fine sand with overlying gravel
(shell debris) Turritella
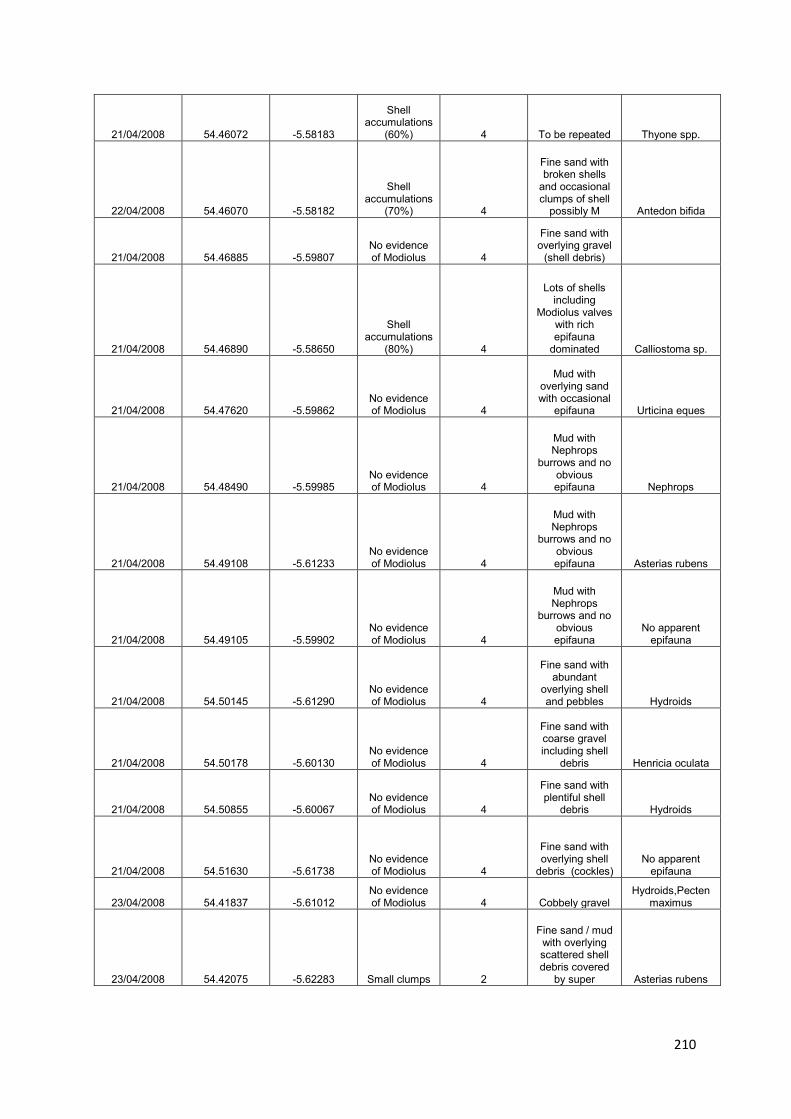
210
21/04/2008 54.46072 -5.58183
Shell accumulations
(60%) 4 To be repeated Thyone spp.
22/04/2008 54.46070 -5.58182
Shell accumulations
(70%) 4
Fine sand with broken shells
and occasional clumps of shell
possibly M Antedon bifida
21/04/2008 54.46885 -5.59807 No evidence of Modiolus 4
Fine sand with overlying gravel
(shell debris)
21/04/2008 54.46890 -5.58650
Shell accumulations
(80%) 4
Lots of shells including
Modiolus valves with rich epifauna
dominated Calliostoma sp.
21/04/2008 54.47620 -5.59862 No evidence of Modiolus 4
Mud with overlying sand with occasional
epifauna Urticina eques
21/04/2008 54.48490 -5.59985 No evidence of Modiolus 4
Mud with Nephrops
burrows and no obvious epifauna Nephrops
21/04/2008 54.49108 -5.61233 No evidence of Modiolus 4
Mud with Nephrops
burrows and no obvious epifauna Asterias rubens
21/04/2008 54.49105 -5.59902 No evidence of Modiolus 4
Mud with Nephrops
burrows and no obvious epifauna
No apparent epifauna
21/04/2008 54.50145 -5.61290 No evidence of Modiolus 4
Fine sand with abundant
overlying shell and pebbles Hydroids
21/04/2008 54.50178 -5.60130 No evidence of Modiolus 4
Fine sand with coarse gravel including shell
debris Henricia oculata
21/04/2008 54.50855 -5.60067 No evidence of Modiolus 4
Fine sand with plentiful shell
debris Hydroids
21/04/2008 54.51630 -5.61738 No evidence of Modiolus 4
Fine sand with overlying shell
debris (cockles) No apparent
epifauna
23/04/2008 54.41837 -5.61012 No evidence of Modiolus 4 Cobbely gravel
Hydroids,Pecten maximus
23/04/2008 54.42075 -5.62283 Small clumps 2
Fine sand / mud with overlying scattered shell debris covered
by super Asterias rubens

211
23/04/2008 54.42102 -5.61877
Shell accumulations
(60%) 4
Mud to fine sand with superficial
silt on all surfaces Asterias rubens
23/04/2008 54.42122 -5.61340 No evidence of Modiolus 4
Mud / fine sand with Nephrops
burrows Turritella
23/04/2008 54.42102 -5.60995 Small clumps 2
Fine sand with dense overlying
debris of scattered dead and occasioa Asterias rubens
23/04/2008 54.42272 -5.60340
Shell accumulations
(40%) 4
Fine sand with scattered shell
debris Crossaster paposus
23/04/2008 54.42353 -5.61840 Small clumps 2
Fine sand with overlying shell and occasional cobbles. Small
living c Echinus
esculentus
23/04/2008 54.42360 -5.61340 No evidence of Modiolus 4 Fine sand Turritella
23/04/2008 54.42547 -5.62270 No evidence of Modiolus 4
Fine sand with sparse epifauna Turritella
23/04/2008 54.42550 -5.61822 Small clumps 2 Mud Modiolus
23/04/2008 54.42550 -5.61337 No evidence of Modiolus 4
Fine sand with scattered shell
debris Asterias rubens
23/04/2008 54.42543 -5.61007 No evidence of Modiolus 4
tide too strong,to be repeated
25/04/2008 54.42543 -5.61007 No evidence of Modiolus 4
Muddy sand with overlying hydroids and polychaeta Asterias rubens
25/04/2008 54.42528 -5.60472 Small clumps 2 Shelly gravel
mix Modiolus
23/04/2008 54.42962 -5.62495
Shell accumulations
(30%) 4
Fine sand with overlying gravel,
pebbles and cobbles. Carcinus naena
23/04/2008 54.42848 -5.61695
Shell accumulations
(50%) 4 Muddy substrate with shell debris. Antedon bifida
23/04/2008 54.42853 -5.61333 Small clumps 2
Muddy substrate with Nephrops burrows and
overlying shelly debris. Nephrops norve
25/04/2008 54.42847 -5.61003 Small clumps 2 Shelly mud Modiolus
25/04/2008 54.42837 -5.60490 No evidence of Modiolus 4
Mud and Nephrops burrows Turritella
01/05/2008 54.44808 -5.60022
Shell accumulations
(80%) 4
Continuous dead shell
debris Alcyonium digitatum
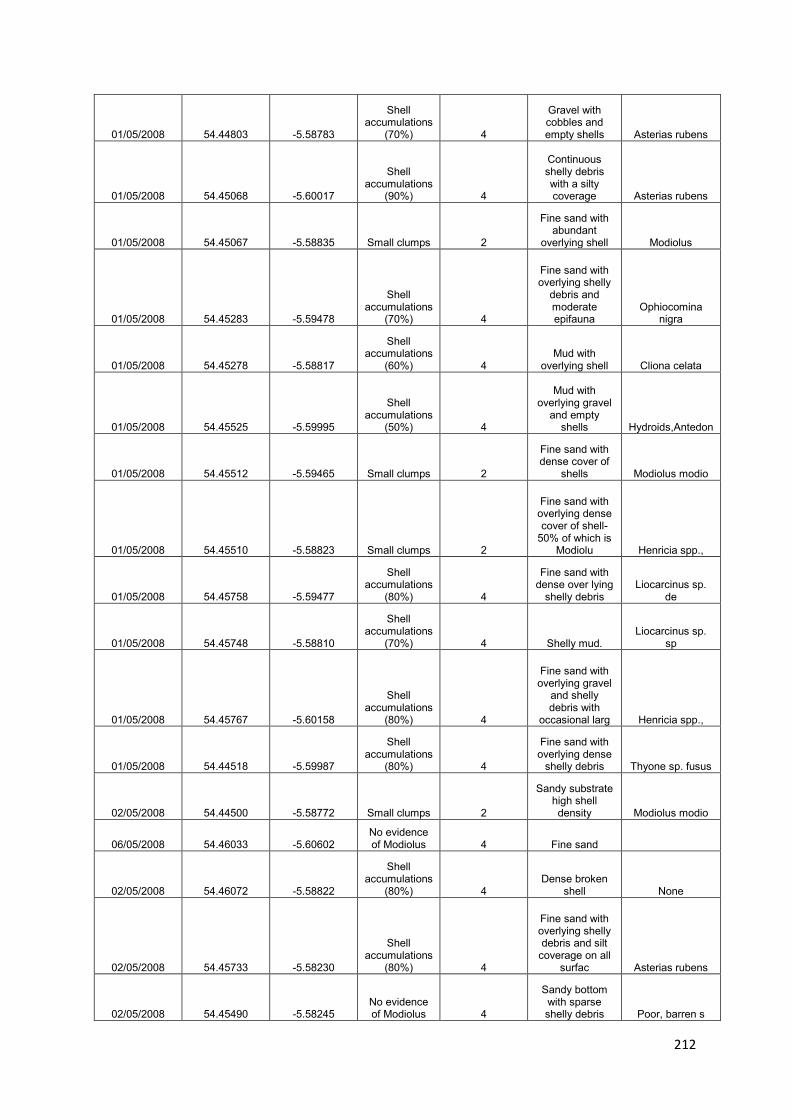
212
01/05/2008 54.44803 -5.58783
Shell accumulations
(70%) 4
Gravel with cobbles and empty shells Asterias rubens
01/05/2008 54.45068 -5.60017
Shell accumulations
(90%) 4
Continuous shelly debris with a silty coverage Asterias rubens
01/05/2008 54.45067 -5.58835 Small clumps 2
Fine sand with abundant
overlying shell Modiolus
01/05/2008 54.45283 -5.59478
Shell accumulations
(70%) 4
Fine sand with overlying shelly
debris and moderate epifauna
Ophiocomina nigra
01/05/2008 54.45278 -5.58817
Shell accumulations
(60%) 4 Mud with
overlying shell Cliona celata
01/05/2008 54.45525 -5.59995
Shell accumulations
(50%) 4
Mud with overlying gravel
and empty shells Hydroids,Antedon
01/05/2008 54.45512 -5.59465 Small clumps 2
Fine sand with dense cover of
shells Modiolus modio
01/05/2008 54.45510 -5.58823 Small clumps 2
Fine sand with overlying dense cover of shell-
50% of which is Modiolu Henricia spp.,
01/05/2008 54.45758 -5.59477
Shell accumulations
(80%) 4
Fine sand with dense over lying
shelly debris Liocarcinus sp.
de
01/05/2008 54.45748 -5.58810
Shell accumulations
(70%) 4 Shelly mud. Liocarcinus sp.
sp
01/05/2008 54.45767 -5.60158
Shell accumulations
(80%) 4
Fine sand with overlying gravel
and shelly debris with
occasional larg Henricia spp.,
01/05/2008 54.44518 -5.59987
Shell accumulations
(80%) 4
Fine sand with overlying dense
shelly debris Thyone sp. fusus
02/05/2008 54.44500 -5.58772 Small clumps 2
Sandy substrate high shell density Modiolus modio
06/05/2008 54.46033 -5.60602 No evidence of Modiolus 4 Fine sand
02/05/2008 54.46072 -5.58822
Shell accumulations
(80%) 4 Dense broken
shell None
02/05/2008 54.45733 -5.58230
Shell accumulations
(80%) 4
Fine sand with overlying shelly debris and silt
coverage on all surfac Asterias rubens
02/05/2008 54.45490 -5.58245 No evidence of Modiolus 4
Sandy bottom with sparse shelly debris Poor, barren s

213
02/05/2008 54.45268 -5.58283
Shell accumulations
(70%) 4 Shell on sandy
bottom
02/05/2008 54.45050 -5.58302 occasional Modiolus 3 Muddy sand Modiolus
02/05/2008 54.44782 -5.58297 Small clumps 2 Shelly sand Modiolus
02/05/2008 54.44510 -5.58323 Small clumps 2 Fine sand Modiolus
02/05/2008 54.44202 -5.57735
Shell accumulations
(70%) 4 Fine sand and
some silt Antedon bifida
25/04/2008 54.45050 -5.59013 No evidence of Modiolus 4
Mud with overlying dead
shell Ophiocomina ni
06/06/2008 54.45490 -5.57633 No evidence of Modiolus 4
Sand (95%), 5% broken shell Sparse epifaun
06/06/2008 54.46047 -5.56548 No evidence of Modiolus 4
90% fine sand, 10% empty shell No apparent ep
06/06/2008 54.46568 -5.56078 No evidence of Modiolus 4
80% fine sand, 20% empty shell No apparent ep
06/06/2008 54.47028 -5.55377 No evidence of Modiolus 4
70% sand, 30% broken shell No apparent ep
06/06/2008 54.47912 -5.57145 No evidence of Modiolus 4
Fine sand with some shell.
Anemones common
06/06/2008 54.47633 -5.57602 No evidence of Modiolus 4
50% sand, 50% cockle shell A. rubens (F)
06/06/2008 54.47585 -5.58612
Shell accumulations
(60%) 4
60% Shell, 40% fine sand and a
layer of silt on all substrata Thyone sp.
06/06/2008 54.47270 -5.58790
Shell accumulations
(70%) 4
40% fine sand , 60% shelly
debris Thyone sp.
09/06/2008 54.46657 -5.57133 No evidence of Modiolus 4
Mud and fine sand Algal biofilm
09/06/2008 54.39703 -5.61803 Small clumps 2 Gravelly dead
shells Marthasterias,
09/06/2008 54.39928 -5.58998 No evidence of Modiolus 4
Gravelly, cobble, pebble, boulders
Ophiocomina nigra
09/06/2008 54.40220 -5.59667
Shell accumulations
(60%) 4
Boulders, gravel, dead
shell and cobble Ophiocomina
nigra
09/06/2008 54.40612 -5.59237 No evidence of Modiolus 4
Shelly sand and Boulders
Nemertesia, Ophiurids
09/06/2008 54.41233 -5.59468 No evidence of Modiolus 4
Selly sand with some empty
Modiolus Ophiotrix bed
09/06/2008 54.41585 -5.60902
Shell accumulations
(90%) 4
Empty shell/gravel,
Boulders Ophiocomina ni
09/06/2008 54.41787 -5.59788
Shell accumulations
(60%) 4 Fine sand and
shells Ophiocomina ni
09/06/2008 54.41800 -5.58590 No evidence of Modiolus 4
Fine shelly sand and some empty
shells Hydroids,Ophiu

214
09/06/2008 54.42753 -5.58233
Shell accumulations
(90%) 4 Dead shell and
gravel Sagartiogeton,
09/06/2008 54.42662 -5.59608 No evidence of Modiolus 4 Shelly sand Hydroids, Saga
10/06/2008 54.46167 -5.60938
Shell accumulations
(50%) 4
Shell substrate on mud or dine
sand bottom Somw red algae
10/06/2008 54.46817 -5.61377
Shell accumulations
(50%) 4
Shell on fine sand with odd
patch of Nephrops
ground Sparse epifaun
10/06/2008 54.47293 -5.59815
Shell accumulations
(90%) 4 Moderate
amounts of shell Shrimp, Thyone
sp.
10/06/2008 54.46447 -5.59642 No evidence of Modiolus 4 Mud/ fine sand
Nephrops, Asterias
10/06/2008 54.47400 -5.61300 No evidence of Modiolus 4
Shell debris on mud with silt
Hydroids, Nephrops
10/06/2008 54.48083 -5.61410 No evidence of Modiolus 4
Empty shells, muddy sand,
Nephrops burrows Pagurus sp.
10/06/2008 54.48305 -5.60725 No evidence of Modiolus 4
Shell debris on Mud - very silty Nephrops
13/06/2008 54.43628 -5.57755 No evidence of Modiolus 4 Muddy sandy
Gobius sp., hydroids
13/06/2008 54.44730 -5.57688 No evidence of Modiolus 4 Pebble, gravel
Antedon bifidañ Gobius sp.
13/06/2008 54.43685 -5.59303 No evidence of Modiolus 4 Mud
Turritella, Nephrops
13/06/2008 54.43718 -5.61057 No evidence of Modiolus 4 Muddy sand Nephrops
13/02/2009 54.42847 -5.59902
High density of clumps (5-
10) with patches of
Modiolus shell 1 Hydroid turf Small clumps
13/02/2009 54.42846 -5.59364
fine silty sand between
patches of brittle stars 4
Dense O. fragilis, Echinus
No evidence of Modiolus
13/02/2009 54.43041 -5.59891
Moderate Modiolus shell on shelly mud 2
Accumulations of shell
13/02/2009 54.43048 -5.59375
small frequent clumps on
silty fine sand 1 Echinus
abundant Small clumps
13/02/2009 54.43235 -5.59874
fine silty sand with
occasional Modiolus shell 3
Accumulations of shell
13/02/2009 54.43239 -5.59364
Frequent clumps (5-10) on silty fine sand and
dense Modiollus
shell 1 Many crinoids
on clumps Small clumps
13/02/2009 54.43700 -5.59888 soft muddy
sand 4 Nephrops and
Turritella No evidence of
Modiolus

215
13/02/2009 54.44138 -5.59247 Silty fiine
sand and mud 4 no epifauna,
Nephrops No evidence of
Modiolus
13/02/2009 54.44379 -5.59684 Shelly muddy
sand 4 Nephrops and
Asterias No evidence of
Modiolus
13/02/2009 54.44409 -5.59149
Small clumps of shell on
silty fine sand with
occasional cobbles 2
Nephrops , cerianthus
Accumulations of shell
16/02/2009 54.43040 -5.59634
Large very frequent
clumps (1-6) on coarse sand and shell mix
(10% shell) 1
Abundant epifauna on
clumps:Antedon, Hydroids, O.
nigra, E.esculentus,
Flustra foliacea
Very large clumps (>10 individuals)
16/02/2009 54.43053 -5.59106
Distinct individual
occasional small clumps
(1-4) on a sandy
substrate 2
Sparse epifauna: Echinus
esculentus, Hydroids, Solaster paposus,
Alcyonium Small clumps
13/02/2009 54.43495 -5.59888
Muddy sand with broken shell and
occasional cobble 4 Nephrops
No evidence of Modiolus
13/02/2009 54.43509 -5.59378
Frequent clumps (5-10)
dense with occasional
barren areas on fine sand and silt with broken shell 1
Asterias, Antedon, More
mobile epifaunal species
Very large clumps (>10 individuals)
13/02/2009 54.43817 -5.59303 Fine silty sand with Nephrops 4
No evidence of Modiolus
13/02/2009 54.42661 -5.60393
Silty fine sand with a little mud with
some broken shell on surface 4
Accumulations of shell
13/02/2009 54.42446 -5.59928
Continuous patches of
broken shell and cobbles 4
No evidence of Modiolus
13/02/2009 54.42312 -5.60057
Shell on cobble and
pebble 4 No evidence of
Modiolus
16/02/2009 54.43052 -5.58774 Sandy mud
shell mix 4 sparse:
Ceriantus lloydii Accumulations of
shell
16/02/2009 54.43246 -5.58835
Occasional clumps of
Modiolus on sandy shell 2 Sparse: Echinus Small clumps
16/02/2009 54.43544 -5.58962
Large clumps in close
proximity frequent (1-8) on sandy mud with shell mix 1
Antedon, O.nigra, E. esculentus, Hydroids, Asterias
Very large clumps (>10 individuals)

216
16/02/2009 54.43815 -5.58918
Occasional small clumps
on 80% coverage of
dead Modiolus shell 2
Sparse: Solaster,
Thyone sp., Antedon Small clumps
16/02/2009 54.42681 -5.59895
Sandy/mud with dead Modilus,
Chlamys and Ostrea mix 4
Cerianthus lloydii, Echinus Esculentus and Pecten maximus
maximus Accumulations of
shell
16/02/2009 54.42653 -5.59330
Frequent small clumps
(1-5) on coarse
sand/shell (Modiolus and
Chlamys) 1
sparse epifauna with Echinus esculentus Small clumps
16/02/2009 54.43245 -5.59090
Frequent clups (1-8) with some
large clumps (12+)on
sandy shell with broken
Modiolus and Chlamys 1
Antedon, Echinus Hydrois
Asterias O. nigra, Solaster
paposus Large clumps
16/02/2009 54.43751 -5.59408
Sandy substrate with some ripples 4 Urticina eques
No evidence of Modiolus
16/02/2009 54.43554 -5.58667
Frequent small (1-4)
with occasional large clump
on shelly sandy mud. 2
No antedon on clumps. Sparse
epifauna Small clumps
17/02/2009 54.42479 -5.59316
Dense accumulations
of Modiolus shell 4 No epifauna
Accumulations of shell
17/02/2009 54.42473 -5.58741
Boulder substrate unlevelled
ground filled with shell and
silt 4
Antedon, Pecten maximus, Hydroids, Echinus
No evidence of Modiolus
17/02/2009 54.42661 -5.59074
Large boulder piles with area
of cobble 4
abundant assemblages on
boulders No evidence of
Modiolus
17/02/2009 54.42853 -5.59090
Occasional clumps of
Modiolus (8-10) on sandy
with shell substrate 2 Large clumps
17/02/2009 54.42869 -5.58783
Sandy with 20% shell
debris 4 Nephrops , cerianthus
Accumulations of shell
17/02/2009 54.42856 -5.58453 Modiolus shell
on cobble 4 Hydroids Accumulations of
shell
17/02/2009 54.43055 -5.58489 Soft mud 4 No evidence of
Modiolus
17/02/2009 54.43425 -5.58477 Sandy mud on cobbles 4
No evidence of Modiolus

217
17/02/2009 54.43397 -5.58703
Occasional small clumps (1-5) on silty
sand with shell mix 2 Hydroids Small clumps
17/02/2009 54.43399 -5.58942
Frequent large clumps (10+) on silty
sand 1
O. nigra, Antedon, Hydoids Large clumps
17/02/2009 54.43915 -5.57887
Muddy sand with broken shell and
occasional cobble 4 Sparse epifauna
No evidence of Modiolus
17/02/2009 54.44206 -5.58208
Frequent small clumps
(1-5) and large (15+) in high densities on silty sand. Looks like a fragmented
bed 1 well developed
Very large clumps (>10 individuals)
17/02/2009 54.42492 -5.59044
Cobble on fine sand with shell debris 4
Amphiura, Pecten maximus Hydrois, Flustra
No evidence of Modiolus
18/02/2009 54.44202 -5.57936
Sandy mud- dead
Modiolus bed 4 Accumulations of
shell
18/02/2009 54.44044 -5.57966
Shelly mud ( Modiolus) on
boulder outcrops and
bed rock 4 sparse
epipfauna Accumulations of
shell
18/02/2009 54.44415 -5.58162
Frequent clumps (1-10) individuals) 1
Antedon, hydroids, echinus
abindant.
Very large clumps (>10 individuals)
18/02/2009 54.44584 -5.57775 Coarse shell
mix 4
Antedon, abundant hydroids,
Nemertesia, S.argentia, Abundant echinus
Accumulations of shell
28/04/2009 54.51623 -5.62313
Soft mud, no apparent epifauna 4 Soft Mud None apparent
28/04/2009 54.51558 -5.62132 Nephrops
ground 4
Mud with some shell (not Modiolus) N. norvegicus
28/04/2009 54.51845 -5.61157 None
apparent 4 soft mud None apparent
28/04/2009 54.51840 -5.61750 None
apparent 4 soft mud None apparent
28/04/2009 54.51865 -5.62232 None
apparent 4 soft mud None apparent
28/04/2009 54.51867 -5.62747 None
apparent 4 soft mud None apparent
28/04/2009 54.52065 -5.62752 None
apparent 4 soft mud None apparent
28/04/2009 54.52083 -5.62235 None
apparent 4 soft mud None apparent
28/04/2009 54.52080 -5.61758 None
apparent 4 soft mud None apparent
11/05/2009 54.45742 -5.56938 None 4 mud Hydroids

218
11/05/2009 54.46305 -5.56248 10% shell 4 very soft
A. abietina, Iophon
hynmandi, A.rubens, Myxilla,
Cliona celata
11/05/2009 54.46477 -5.55695
5% shell on Nephrops
ground 4 very soft Nephrops norvegicus
11/05/2009 54.46973 -5.55932 Nephrops burrows 4
very soft mud with 70% mixed
shell
11/05/2009 54.47152 -5.57060
Soft sediment with sponges and hydroids 4
11/05/2009 54.47242 -5.56972 Firmer than
previous sites 4 80% crushed
shell C. lepadiformis,
C. celata
11/05/2009 54.47402 -5.56783
Soft mud with clumps of hydroids 4
broken shell on soft mud
hydroids, sponges, abietinaria
11/05/2009 54.47627 -5.56530
Soft bottom with scattered
shell 4 soft mud,
scattered shell S. elegans, E.
esculentus
11/05/2009 54.47968 -5.56187 Nephrops
ground 4 soft mud N. norvegicus
11/05/2009 54.47968 -5.56187
Soft mud with some broken
shell on surface 4 soft mud S. elegans
20/05/2009 54.51133 -5.61527 None 4 very soft sand None apparent
20/05/2009 54.51192 -5.61283 None 4 very soft sand None apparent
20/05/2009 54.50883 -5.60330 None 4
mixed shell (50%) not
Modiolus and occasional Nephrops burrows
A.rubenss, hydroids
20/05/2009 54.51185 -5.61262 5% Modiolus
shell 4 Hydroid clumps
20/05/2009 54.50568 -5.61460 40% Modiolus
shell 4 Soft with shell
and overlying silt C.paposus
20/05/2009 54.50182 -5.60995 None 4
Sofft undulating substrate with shell 96%) OF
cockle size
20/05/2009 54.49737 -5.60285 None 4
Mixed sustrate : cobbles (70%)- soft sediment
with Hydroid turf covering surfaces
Hydroids, A.spirodeta, A
digitatum
20/05/2009 54.49840 -5.60907 None 4
very soft bumpy sediment with
50% shell (sub- fossil)
20/05/2009 54.49923 -5.60075 None 4
very soft bumpy sediment with
50% shell (sub- fossil)
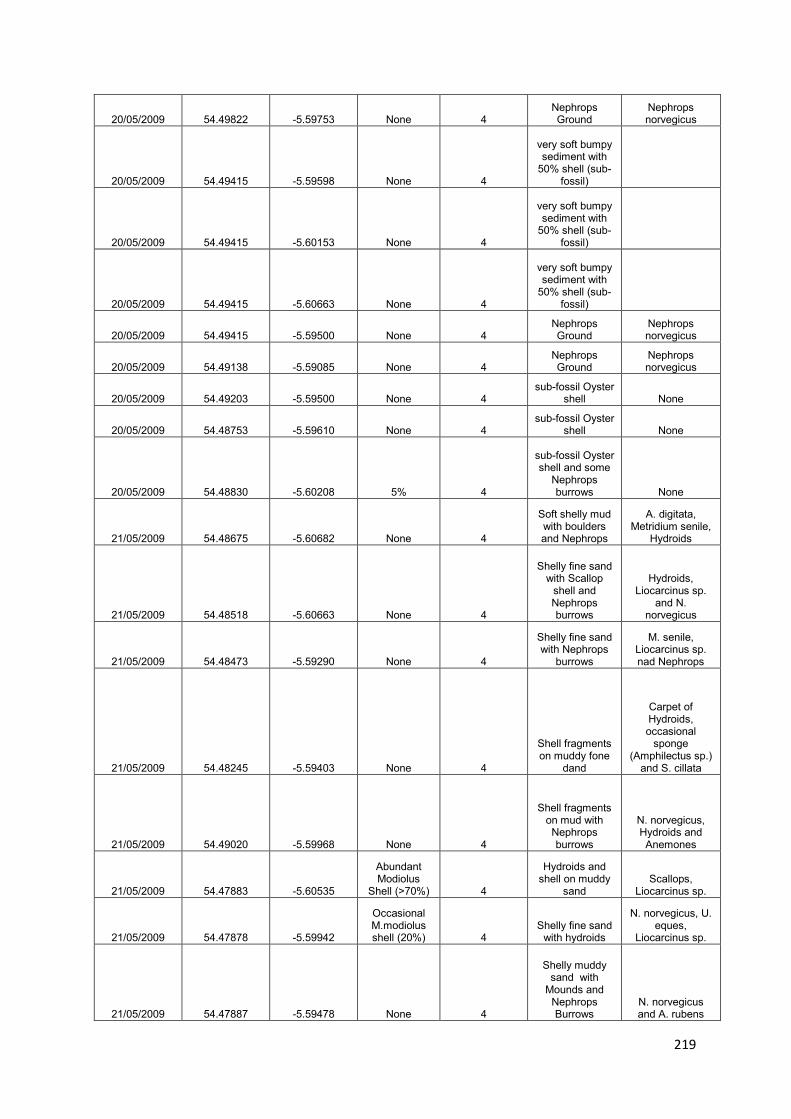
219
20/05/2009 54.49822 -5.59753 None 4 Nephrops Ground
Nephrops norvegicus
20/05/2009 54.49415 -5.59598 None 4
very soft bumpy sediment with
50% shell (sub- fossil)
20/05/2009 54.49415 -5.60153 None 4
very soft bumpy sediment with
50% shell (sub- fossil)
20/05/2009 54.49415 -5.60663 None 4
very soft bumpy sediment with
50% shell (sub- fossil)
20/05/2009 54.49415 -5.59500 None 4 Nephrops Ground
Nephrops norvegicus
20/05/2009 54.49138 -5.59085 None 4 Nephrops Ground
Nephrops norvegicus
20/05/2009 54.49203 -5.59500 None 4 sub-fossil Oyster
shell None
20/05/2009 54.48753 -5.59610 None 4 sub-fossil Oyster
shell None
20/05/2009 54.48830 -5.60208 5% 4
sub-fossil Oyster shell and some
Nephrops burrows None
21/05/2009 54.48675 -5.60682 None 4
Soft shelly mud with boulders and Nephrops
A. digitata, Metridium senile,
Hydroids
21/05/2009 54.48518 -5.60663 None 4
Shelly fine sand with Scallop
shell and Nephrops burrows
Hydroids, Liocarcinus sp.
and N. norvegicus
21/05/2009 54.48473 -5.59290 None 4
Shelly fine sand with Nephrops
burrows
M. senile, Liocarcinus sp. nad Nephrops
21/05/2009 54.48245 -5.59403 None 4
Shell fragments on muddy fone
dand
Carpet of Hydroids, occasional
sponge (Amphilectus sp.)
and S. cillata
21/05/2009 54.49020 -5.59968 None 4
Shell fragments on mud with Nephrops burrows
N. norvegicus, Hydroids and Anemones
21/05/2009 54.47883 -5.60535
Abundant Modiolus
Shell (>70%) 4
Hydroids and shell on muddy
sand Scallops,
Liocarcinus sp.
21/05/2009 54.47878 -5.59942
Occasional M.modiolus shell (20%) 4
Shelly fine sand with hydroids
N. norvegicus, U. eques,
Liocarcinus sp.
21/05/2009 54.47887 -5.59478 None 4
Shelly muddy sand with
Mounds and Nephrops Burrows
N. norvegicus and A. rubens

220
21/05/2009 54.47935 -5.58922 None 4
Shell fragments on muddy sand
with hydroid cover hydroids
21/05/2009 54.47603 -5.59328
Some Modiolus shell
(10%) 4
Shell debris nad Hydroid cover
on muddy sand
M. senile, Liocarcinus sp.,
U.eques, T. fusus
21/05/2009 54.47537 -5.60528 None 4 Muddy sand
21/05/2009 54.47272 -5.60408 None 4
Shell fragments abundant on muddy sand with hydroid
cover on a flat bottom
Hydroids, Liocarcinus sp.
21/05/2009 54.47363 -5.58880
Some Modiolus shell
(10%) 4
Soft shelly muddy sand
with occasional Modiolus shell
Hydroids, Liocarcinus sp.,
Thyone sp., Sponges
21/05/2009 54.47070 -5.58757
some Modiolus shell
(10%) 4
Soft shelly muddy sand
with occasional Modiolus shell
Crangon, Amphilectus, U.
eques, A. rubens, Thyone sp., M. senile, Pecten
maximus
21/05/2009 54.47063 -5.58260
Abundant Modiolus shell
(70%) 4
resembled old M. modilus bed on muddy sand
with Scallop shell
C. lepadiformis, Liocarcinus sp.,
Sponges, Anemone,
A.rubens, Thyone sp.
21/05/2009 54.47057 -5.59807 None 4
Shell fragments on muddy sand with Hydroids
Hydroids, Liocarcinus sp.
22/05/2009 54.46643 -5.59783
Very fine sand and soft mud,
Nephrops ground 4
no apparent species
23/05/2009 54.46825 -5.58990 Modiolus and Chlamys shell 4
no apparent species
24/05/2009 54.46727 -5.58580 Abundant
shell 4
25/05/2009 54.45927 -5.58698 Abundant
shell 4 Mud
26/05/2009 54.46660 -5.58182 Odd Modiolus
shell 4 Fine sand/mud
02/06/2009 54.41608 -5.60225 None 4
gravelly sand with small
boulders, cobble & pebbels (40%)
A. Bifida, O. Fragilis,
Hydroids, P. Maximus,
Sponges, S. Paposus
22/06/2009 54.41248 -5.60623 O. fragilis bed 4 gravel, sand O. Fragilis
22/06/2009 54.41445 -5.60248 O. fragilis bed 4 boulders on
gravel O. Fragilis
22/06/2009 54.49825 -5.60782 None
apparent 4 muddy sand
with shell

221
22/06/2009 54.49840 -5.61327 None
apparent 4
muddy sand with some
cobbles/pebbleb (10%)
Echinus, Sycon, Liocarcinus sp.,
burrowing anemones
22/06/2009 54.49810 -5.59510
Muddy sand with some shell debris 4 muddy sand
Turritella, anemones, brittle
stars
22/06/2009 54.40983 -5.62638
Turritella, brittle star
arms 4 Fine sand/mud
Turritella, anemones,
Necora puber
22/06/2009 54.40758 -5.63218 None
apparent 4
mud with some coblle and bedrock outcrops
22/06/2009 54.40852 -5.61145 None
apparent 4 shelly coarse
sand Flustra foliacea
22/06/2009 54.40878 -5.60172 O. fragilis bed 4 gravel, boulders O. fragilis
22/06/2009 54.40305 -5.60885
Anemone covered boulders 4
boulders on cobbles, pebbel,
shell
22/06/2009 54.40617 -5.60823 Shell
aggregations 4 Dense shell on
gravel Ophiurids
22/06/2009 54.40605 -5.60262 None
apparent 4 boulders on shelly gravel
22/06/2009 54.40882 -5.60662 None
apparent 4
shelly gravel with patchces of
fine sand
12/10/2009 54.41398 -5.58928 Very few shell 4
coarse sandy bottom with
Occasional A. rubens and occasional
O.fragilis clumps
12/10/2009 54.41398 -5.59248
Good shell coverage
(70%) 4
coarse sand with patches of
O. fragilis
12/10/2009 54.41328 -5.59680 Shell 4
fraquent sma;; boulders with
high coverage of epifauna
O.fragilis, hydroids, Urchins
and Oysters
12/10/2009 54.41502 -5.59592 Sparse shells 4
Boulders of mixed sizes with
cobbles and gravel and thick coverage of O.
nigra O.nigra
12/10/2009 54.41482 -5.58817 shell 4
gravelly with occasional boulders
O.albida, O.fragilis, O.
nigra
12/10/2009 54.41823 -5.58728 None
apparent 4 Coarse sand
with ophiuroids
Sparse epifauna with frequent
O.albida,
12/10/2009 54.41983 -5.59492
Good coverage of M.modiolus shell (60%) 4
fine sand with overlaying
broken shell
12/10/2009 54.41983 -5.59902
O. Fragilis bed with
Modiolus shell (30%) 4
soft mud with occasional large
boulders
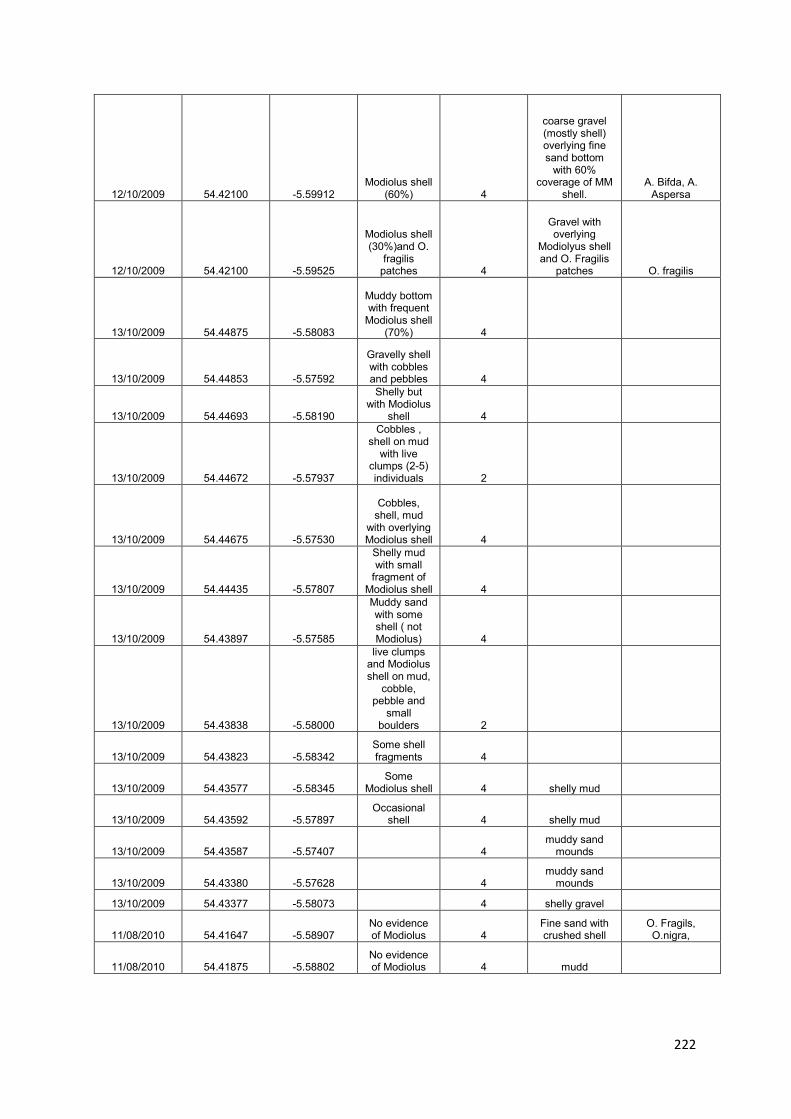
222
12/10/2009 54.42100 -5.59912 Modiolus shell
(60%) 4
coarse gravel (mostly shell) overlying fine sand bottom
with 60% coverage of MM
shell. A. Bifda, A.
Aspersa
12/10/2009 54.42100 -5.59525
Modiolus shell (30%)and O.
fragilis patches 4
Gravel with overlying
Modiolyus shell and O. Fragilis
patches O. fragilis
13/10/2009 54.44875 -5.58083
Muddy bottom with frequent
Modiolus shell (70%) 4
13/10/2009 54.44853 -5.57592
Gravelly shell with cobbles and pebbles 4
13/10/2009 54.44693 -5.58190
Shelly but with Modiolus
shell 4
13/10/2009 54.44672 -5.57937
Cobbles , shell on mud
with live clumps (2-5) individuals 2
13/10/2009 54.44675 -5.57530
Cobbles, shell, mud
with overlying Modiolus shell 4
13/10/2009 54.44435 -5.57807
Shelly mud with small
fragment of Modiolus shell 4
13/10/2009 54.43897 -5.57585
Muddy sand with some shell ( not Modiolus) 4
13/10/2009 54.43838 -5.58000
live clumps and Modiolus shell on mud,
cobble, pebble and
small boulders 2
13/10/2009 54.43823 -5.58342 Some shell fragments 4
13/10/2009 54.43577 -5.58345 Some
Modiolus shell 4 shelly mud
13/10/2009 54.43592 -5.57897 Occasional
shell 4 shelly mud
13/10/2009 54.43587 -5.57407 4 muddy sand
mounds
13/10/2009 54.43380 -5.57628 4 muddy sand
mounds
13/10/2009 54.43377 -5.58073 4 shelly gravel
11/08/2010 54.41647 -5.58907 No evidence of Modiolus 4
Fine sand with crushed shell
O. Fragils, O.nigra,
11/08/2010 54.41875 -5.58802 No evidence of Modiolus 4 mudd

223
11/08/2010 54.41838 -5.59103
O. fragilis patch with O. Nigra around
outside 4 O. Fragilis, O.
nigra
11/08/2010 54.42142 -5.59210
O. fragilis bed,
extensive among
boulders 4 mudd, large
boulders
11/08/2010 54.42142 -5.59153 no apparent
life 4 very soft bottom
11/08/2010 54.42158 -5.58895
O. fragilis patches
(small) with anemones 4
11/08/2010 54.43853 -5.59622 Nephrops 4 soft bottom N.norvegicus
11/08/2010 54.43715 -5.60025 Nephrops 4 soft bottom N.norvegicus
11/08/2010 54.43857 -5.60362 Nephrops 4 soft bottom N.norvegicus
11/08/2010 54.44150 -5.60233 4
11/08/2010 54.43982 -5.60442
Occasional shell into
broken shell 4
11/08/2010 54.43915 -5.58505 fine sand
11/08/2010 54.44683 -5.58593 Modiolus shell 4 fine sand
11/08/2010 54.44692 -5.58903 Modiolus shell 4 fine sand
11/08/2010 54.44633 -5.58913 Crushed shell
(100%) 4
11/08/2010 54.44748 -5.58655
Shell aggregations
(80%) 4
11/08/2010 54.44778 -5.58597
shell aggregations
(100%) 4
11/08/2010 54.44792 -5.58568
Shell aggregations finer (80%) 4
11/08/2010 54.44820 -5.58530 Shell (60%) 4 Fine sand
11/08/2010 54.47403 -5.59240 Old Modiolus
shell 4 Fine sand T. roscovita
11/08/2010 54.47383 -5.58402
100% crushed shell with A.
aspersa mounds 4 Fine sand A.aspersa
11/08/2010 54.42413 -5.59762 Some shell 4 Fine sand
A.aspersa, alcyonium
digitata, Pecten maximus
maximus, Thyone sp. spp.
11/08/2010 54.47458 -5.59960
100% crushed shell with A.
aspersa mounds 4 Fine sand A.aspersa
11/08/2010 54.46438 -5.59108
100% crushed shell with A.
aspersa mounds 4 Fine sand A.aspersa
11/08/2010 54.46210 -5.58535 100% crushed
shell 4 Fine sand

224
Appendix 2. List of dive surveys carried out in Strangford Lough by the
Modiolus Restoration Research Group (MRRG) over the 2008 to 2010 period.
Date No.
dives Location Northing Easting
Max Depth
(m) Tasks
17/07/2008 1 Scott‟s Hole (
MOD 4) 54.4508 -5.6009 20 DPV reef boundary
mapping
17/07/2008 1 Scott‟s Hole (
MOD 4) 54.4508 -5.6009 12 DPV reef boundary
mapping
22/07/2007 1
Ringhaddy Sound North
most hole 54.4509 -5.6283 17.3 Live Modiolus
collection
22/07/2008 1
Ringhaddy Sound middle hole opposite
pier 54.4478 -5.6272 14.2 Live Modiolus
collection
23/07/2008 1 Taggart Island
19.4 Live Modiolus
collection
23/07/2008 1 Taggart Island
12.5
24/07/2008 1 SE Hadd Rock 54.4550 -5.5956 16.8 Live Modiolus
collection
24/07/2008 1 SE Hadd Rock 54.4539 -5.5937 21.2 Live Modiolus
collection
25/07/2008 2 Brown Rocks 54.4241 -5.6203 15 Looking for southern
good site
25/07/2008 2 Brown Rocks
Looking for southern good site
28/07/2008 2
W of Sand Rock heading
south
17.7
Finding Boundary of Modiolus bed with
DPVs
28/07/2008 2
W of Sand Rock heading
North
12
Finding Boundary of Modiolus bed with
DPVs
29/07/2008 2 W Sand rock 54.4543 -5.5938 29.2
Finding Boundary of Modiolus bed with
DPVs
01/08/2008 2 SSE Black
Rock 54.4246 -5.6176 21 Live Modiolus
collection
21/08/2008 2 S Hadd Rock 54.4534 -5.5914 28 Quadrats
22/08/2008 2 S Hadd Rock 54.4534 -5.5914 18 Quadrats
26/08/2008 2 S Hadd Rock
Quadrats
28/08/2008 3 S Hadd Rock
22.0 Quadrats
28/08/2008 1 S Hadd Rock
Quadrats
28/08/2008 1 S Hadd Rock
27.0 Quadrats
29/08/2008 2 S Hadd Rock 54.4530 -5.5917 23.7 Quadrats
08/09/2008 1 S Hadd rock 54.4534 -5.5914 17.6 Quadrats
08/09/2008 1 S Hadd rock 54.4530 -5.5917 21.7 Quadrats
08/09/2008 1 East of Hadd
Pole 54.4531 -5.5917 19.8 Quadrats

225
10/09/2008 2 Quoile North of Green Island
5.8 Quadrats
16/09/2008
1 North Janes
rock 54.4501 -5.6030 16 exploratory
1 North Janes
rock 54.4491 -5.6135
exploratory
16/09/2008
1 North Janes
rock 54.4501 -5.6030
exploratory
1 North Janes
rock 54.4508 -5.6057 20.8 exploratory
17/09/2008
2
North Janes rock to Scott‟s
hole 54.4508 -5.6057
exploratory
1
North Janes rock to Scott‟s
hole 54.4505 -5.6070
exploratory
1
North Janes rock to Scott‟s
hole 54.4503 -5.6080
exploratory
17/09/2008
1 Scott‟s Hole to
Finyan pt 54.4504 -5.6272
exploratory
1
54.4505 -5.6138
exploratory
1
54.4506 -5.6153
exploratory
17/09/2008
1 Janes rock to
sand rock 54.4499 -5.6031
exploratory
1 Janes rock to
sand rock
17/09/2008
1
Heading south from Janes rock in the channel 54.4517 -5.6007
exploratory
1
Heading south from Janes rock in the channel 54.4464 -5.6017
exploratory
18/09/2008
1 Hadd rock to
Slave
34.8
Repeat SLECI transect from Hadd to
Slave
1
1 South Hadd
rock
1 South Hadd
rock 54.4549 -5.5944 24.4
Repeat SLECI site eastward to site of
good Modiolus
1
54.4552 -5.5944
22/09/2008
1
South Hadd rock (good Modiolus position)
swimming west 54.4539 -5.5937 20.8 exploratory
1
54.4552 -5.5978
24/09/2008 11
South Hadd rock (good Modiolus) 54.4539 -5.5937 22.3 Quadrats

226
1
South Hadd rock (good Modiolus position) 54.4539 -5.5937 22.1 Quadrats
25/09/2008
2
South Hadd rock (good Modiolus position) 54.4539 -5.5937 22.3 Quadrats
1
South Hadd rock (good Modiolus position) 54.4539 -5.5937 21.7 Quadrats
29/09/2008
1 East of Brown Rock Pladdy 54.4292 -5.6168 27 Exploratory (video)
1 East of Brown Rock Pladdy 54.4300 -5.6147
1 East of Brown Rock Pladdy 54.4292 -5.6168 22.4 Exploratory (video)
2/10/20008 1 East of Brown Rock Pladdy 54.4292 -5.6168 19 Quadrats
2/10/20008 1 East of Brown Rock Pladdy 54.4292 -5.6168 20 Quadrats
06/10/2008 2 East of Brown Rock Pladdy 54.4292 -5.6168 21 Quadrats
06/10/2008 2 North of
Dunnyneill
15 Exploratory
07/10/2008 2 Colin Rock 54.4310 -5.5976 22.5 Exploratory
08/10/2008 1 Marlfield bay 54.4292 -5.6335 17 Exploratory
08/10/2008 1 Marlfield bay
25 Exploratory
15/10/2008 3 S. Hadd godd site(missed) 54.4539 -5.5937 28 DPV mapping
15/10/2008 1 S. Hadd godd
site 54.4536 -5.5962 22.6 DPV mapping
15/10/2008 1 S. Hadd godd
site 54.4555 -5.5964
DPV mapping
03/11/2008
2 S.Hadd 54.4555 -5.5964 20 Deploying spat
collectors
1 S.Hadd 54.4555 -5.5964 20 Spat collectors
04/11/2008
2 S.Hadd 54.4555 -5.5964 22.3 Deploying spat
collectors
1 S.Hadd 54.4555 -5.5964 22.3 Deploying spat
collectors
05/11/2008
2 S.Hadd 54.4555 -5.5964 20.5 Deploying spat
collectors
1 S.Hadd 54.4555 -5.5964 20.1 Deploying spat
collectors
1
54.4555 -5.5964 23.3 Exploratory
06/11/2008
1 Brown Rocks 54.4235 -5.6140 35.8 Exploratory
1 Brown Rocks 54.4238 -5.6154 1 Brown Rocks 54.4241 -5.6151 1 Brown Rocks 54.4272 -5.6159 27.9 Exploratory
1 Brown Rocks 54.4272 -5.6156

227
13/01/2009 2
South Hadd Rock (good condition) 54.4539 -5.5937 22.3 Quadrats
05/03/2009 2
South Hadd Rock (good condition) 54.4539 -5.5937 22.3 Quadrats
06/03/2009 2
South Hadd Rock (good condition) 54.4539 -5.5937
12/03/2009 2 Hadd Rock
(Buoyed line) 54.4545 -5.5943
Spat collectors
13/03/2009 2 Hadd Rock
(Buoyed line)
Spat collectors
19/03/2009 2 Hadd Rock
(Buoyed line)
Spat collectors
20/03/2009 2 Hadd Rock
(Buoyed line)
Spat collectors
24/03/2009 2 Hadd Rock
(Buoyed line)
Retrieve spat collectors
30/03/2009 2 Hadd Rock
(Buoyed line)
24
check for any remaining spat
collectors
30/03/2009 2
South Hadd Rock (poor
site) 54.4534 -5.5914 20.1 Quadrats (N. poor
site)
31/03/2009 2
South Hadd Rock (poor
site) 54.4534 -5.5914 24.8 Quadrats (N. poor
site)
31/03/2009 2
South Hadd Rock (poor
site) 54.4534 -5.5914 23.9 Quadrats (N. poor
site)
31/03/2009 2 Ringhaddy 54.4534 -5.5914 12 spat collectors
01/04/2009 2 E. Brown Rock 54.4292 -5.6168 21 Quadrats (S.poor site)
02/04/2009 2 E. Brown Rock 54.4292 -5.6168 19 Quadrats (S.poor site)
20/04/2009 2 Brown rocks
Quadrats (S. goood site)
21/04/2009 2 Brown rocks
Quadrats (S. goood site)
21/04/2009 2 Brown rocks
Quadrats (S. goood site)
23/04/2009
1 East of
Craigyouran 54.4421 -5.5826 36.3 Exploratory mapping
1 East of
Craigyouran 54.4422 -5.5804 36.3 Exploratory mapping
24/04/2009
1 East of
Craigyouran 54.4426 -5.5833
Exploratory mapping
1 East of
Craigyouran 54.4428 -5.5826
Exploratory mapping
13/05/20009 1 Ringhaddy 54.4465 -5.6265
Collection of spat collectors
25/05/2009 1 Hadd Rock
(Buoyed line)
Collect small M.modiolus. Collect
M.modiolus shell

228
25/05/2009 1 Hadd Rock
(Buoyed line)
Collect small M.modiolus. Collect
M.modiolus shell
01/06/2009
1 East of Sheila's
island 54.4949 -5.5598
Exploratory/mapping
1
SMILE project diving
03/06/2009 2 Selk Rock 54.4178 -5.6260
Exploratory/mapping
1
54.4112 -5.6235
Exploratory/mapping
03/06/2009 Selk Rock
Exploratory/mapping
05/06/2009
1 Ballyhom Bay 54.4198 -5.6208
Exploratory/mapping
1
54.4206 -5.6252
Exploratory/mapping
1
54.4179 -5.6256
Exploratory/mapping
1
54.4175 -5.6263
Exploratory/mapping
08/06/2009 1 Brown Rocks 54.4295 -5.6243
Spat collectors(Pecten, Modiolus, empty
Modiolus)
10/06/2009 2 Scott‟s Hole 54.4518 -5.6024 18
Deployment of spat collector trays (live
Mod, Pecten, empty Mod)
15/06/2009 1 west of Brown
Rocks
Collection of 300 Modiolus
22/06/2009 1
Holm Bay/west of Limestone
Pladdy 54.4175 -5.6263 16 Spat collectors
23/06/2009 2 Holm Bay 54.9169 -5.6262
Collection of live Modiolus
24/06/2009
2
54.4180 -5.6254
Collection of live Modiolus
1
54.4167 -5.6256 1
54.4322 -5.6251
30/06/2009 1
Southern Experimental
site
01/07/2009
2
Southern experimental
site (holm Bay) 54.4172 -5.6024
Deploy fragmentation sacks
1
Hadd Rock (SLECI
quadrats)
06/07/2009
3
Chapel Island/ scallop
collection site
Scallop collection for AFBI
1 North of
jackdaw island 1 Kate‟s Pladdy 54.4113 -5.5824
08/07/2009 1 Mc Loughlin‟s
rock 54.3978 -5.6180
10/07/2009
1 Limestone rock 54.3952 -5.6135
Exploratory dive
1
54.3955 -5.6182 16/07/2008 2 Brown rocks

229
06/08/2009 2 Southern exp
site(Holm Bay)
Sack Experiment
07/08/2009 Scott‟s Hole 54.4520 -5.6020
13/08/2009
2 S.Hadd (good
quad site)
2 S.Hadd (poor
quad site)
24/08/2009 2
Holm Bay(collection
part II) 54.4169 -5.6247
Collection for live Modiolus (experiment
part (II))
25/08/2009 2 Holm Bay
Collection for live Modiolus (experiment
part (II))
01/09/2009 2
Scott‟s Hole (clumping
experiment part (II) 54.4499 -5.6026
Mixed shell on sandy mud with Antedon
09/09/2009
1 N.Long Sheelah 54.4542 -5.5949
Repeat SLECI transect
1 N.Long Sheelah 54.4552 -5.5944
Repeat SLECI transect
10/09/2009
2
N.W Long Sheelah (T 14) heading south 54.4661 -5.5980 15.7
Repeat SLECI transect
S.E Janes Rock (T16)
heading south 54.4459 -5.5993 21.2 Repeat SLECI
transect
15/09/2009
2 Slave Rock
Transect 8 (in) 54.4600 -5.5828 32.8 Repeat SLECI
transect
N long Sheelah
(t 11 to 12) 54.4503 -5.5974 16 Repeat SLECI
transect
16/09/2009
1 East of Brown
rocks 54.4510 -5.5980
Repeat SLECI transect
1 East of sand
rock 54.4510 -5.5980
Repeat SLECI transect
01/10/2009 2 Scott‟s Hole ( Sack exp (II) )
Open and inspect sacks
05/10/2009 1 Scott‟s Hole (
Trays) 54.4518 -5.6024
Spat collector retrieval
07/10/2009 1 Mooring
inspection
C-mar mooring inspection
08/10/2009 1 West of brown Rock Pladdy 54.4297 -5.6240 20 Spat collector retrieval
12/10/2009 1 Browns rocks 54.4222 -5.6155 16.2
Site selection for cultch deployment ( H.
Edwards recommended site)
12/10/2009 1 Browns rocks 54.4219 -5.6208
site selection for cultch deployment ( H.
Edwards recommended site)
14/10/2009 4 Holm Bay
Collection Site 54.4169 -5.6247 17.8 Collect modiolus for cultch experiment

230
23/11/2009 Scott‟s Hole 54.4497 -5.6035 19.5 Collect modiolus shell
for spat collectors
30/11/2009 4 Long Sheelah
Scallop collection for AFBI
02/12/2009 3
Chapel Island/ scallop
collection site 54.3868 -5.5973 20 Scallop collection for
AFBI
04/12/2009 3
Cultch deployment
site
Deployment of additional cultch bags
07/12/2009 3 Kates Pladdy
24 Scallop collection for
AFBI
16/12/2009 2 Hadd rock 54.4542 -5.5930 21 Spat collector deployment
20/01/2010 2 Kates Pladdy
23.3
Divers from Wales and IOM to see
Strangford Lough Modiolus
22/01/2010 2 Hadd Rock 54.4542 -5.5930 20.3 Spat collector deployment
26/01/2010 3 Holm Bay 54.4169 -5.6247 17.3
MMRG Spat collector deployment and
modiolus collection
27/01/2010 3 Holm Bay 54.4169 -5.6247 17 Collect modiolus for cultch experiment
02/02/2010 6
Cultch deployment
site 54.4213 -5.6203 19.7 Reposition cultch bags
03/02/2010 6
Cultch deployment
site 54.4213 -5.6203 17.8 Reposition cultch bags
10/02/2010 2 Black Rock 54.4297 -5.6240 22.2 Find trays and YSI
Instrument - achieved
19/02/2010 4
Cultch deployment
site 54.4213 -5.6203 16.9
Map out cultch site and attempt to
reposition marked bags
22/02/2010 4
Cultch deployment
site 54.4213 -5.6203 18.5 Reposition cultch bags
23/02/2010 4
Cultch deployment
site 54.4213 -5.6203 23.6 Reposition cultch bags
24/02/2010 4
Cultch deployment
site 54.4213 -5.6203 20
Reposition cultch bags and relocate mooring
block
25/02/2010 3
Cultch deployment
site 54.4213 -5.6203 18.6 Reposition cultch bags
26/02/2010 2 Hadd Rock
21
Search for spat collectors and collect modiolus for gonad
samples

231
1 Holm Bay 54.4169 -5.6247 18.5
Search for spat collectors and collect modiolus for gonad
samples
02/03/2010 1 Holm Bay 54.4169 -5.6247 14.1 Collect modiolus for cultch experiment
03/03/2010 3 Holm Bay 54.4169 -5.6247 14 Collect modiolus for cultch experiment
04/03/2010 2 Holm Bay 54.4169 -5.6247 12.5 Collect modiolus for cultch experiment
09/03/2010 3
Cultch deployment
site 54.4213 -5.6203 18.8 Flatten cultch plots
11/03/2010 2
Cultch deployment
site 54.4213 -5.6203 18.2 Flatten cultch plots
12/03/2010
3
Cultch deployment
site 54.4213 -5.6203 20.4 Continue to arrange
cultch plots
1 Hadd Rock 54.4542 -5.5930 20.5 Check new mooring
block site
1 Holm Bay 54.4172 -5.6267 13.6 Check new mooring
block site
24/03/2010
Cultch deployment
site 54.4213 -5.6203 16.6
Continue arranging cultch plots, light and temperature logger
deployment
1 Hadd Rock 54.4542 -5.5930 17.6 Light and temperature
logger deployment
1 Holm Bay 54.4172 -5.6267 12.2 Light and temperature
logger deployment
25/03/2010 4
Cultch deployment
site 54.4213 -5.6203 19.9
Finish cultch plot arrangement, and
begin to translocate modiolus
29/03/2010 3
Cultch deployment
site 54.4213 -5.6203 19.6 Continue moving of modiolus onto plots
12/04/2010 3
Cultch deployment
site 54.4213 -5.6203 19.7
Deploy flags, sediment traps, and complete modiolus
movement on to plots. Video survey of plots.
13/04/2010 2
Cultch deployment
site 54.4213 -5.6203 20.3
Finish flagging and translocation of
modiolus on to plots
1
East of Black Rock transect
1 54.4280 -5.6174 26 SLECI repeat transect
14/04/2010 1
East of Black Rock transect
2 54.4476 -5.6143 32 SLECI repeat transect
1
N. Green Island Passage 54.4641 -5.6138 34 SLECI repeat transect

232
15/04/2010 1 Hadd Rock 54.4520 -5.5890 34.7 SLECI repeat transect
19/04/2010 2
Cultch deployment
site 54.4213 -5.6203 17.7
Deploy sediment traps, and baseline
cultch survey.
20/04/2010 2 Hadd Rock
26 SLECI repeat transect
21/04/2010
1
Round Island Pinnacle
transect 1 54.4336 -5.5912 30.8 SLECI repeat transect
1
Round Island Pinnacle
transect 2 54.4336 -5.5912 31 SLECI repeat transect
2
Cultch deployment
site 54.4213 -5.6203 16.6 Cultch baseline survey
- plot heights
26/04/2010
2 Hadd Rock 54.4542 -5.5930 24.5 Collect Modiolus for hatchery broodstock
2 Holm Bay 54.4172 -5.6267 15.8 Collect Modiolus for hatchery broodstock
05/05/2010
1 Hadd Rock 54.4542 -5.5930 17.2
Retrieval of temperature and light
loggers
1 Holm Bay 54.4172 -5.6267 11.7
Retrieval of temperature and light
loggers
1
Cultch deployment
site 54.4213 -5.6203 26
Retrieval of temperature and light
loggers/ initial
06/05/2010
1 Holm Bay
Mooring Block 54.4172 -5.6267 12.2 Deploy data loggers and spat collectors.
1
Cultch deployment
site 54.4213 -5.6203 17.8 Data logger deployment.
1 AFBI Buoy
9.9 Connect ADCP frame
to AFBI Buoy
1 Hadd Rock
Mooring Block 54.4542 -5.5930 17 Data logger deployment.
2 N. Long Sheelah
18.6
Modiolus collection for size frequency and
age analysis
1 Round Island Mooring Block
28.5
Data logger deployment.
14/05/2010
2 Round Island Mooring Block 54.4344 -5.5871 30.6
Mooring block inspection
2
Cultch deployment
site 54.4213 -5.6203 21.5 ROV at cultch site for
fish monitoring.
17/05/2010 1 Brown Rocks
Trays 54.4297 -5.6240 20.5 Find and photograph
tray experiment
18/05/2010 2 Brown Rocks
Trays 54.4297 -5.6240 18.5 Begin removal of trays
19/05/2010 2 Brown Rocks
Trays 54.4297 -5.6240 18.8 Collect all materials
from trays
20/05/2010 1 Brown Rocks
Trays 54.4297 -5.6240 18.9 Complete removal of
tray material.

233
27/05/2010
1 Brown Rocks
transect 1 54.4287 -5.4477 36.7 SLECI repeat transect
1 Brown Rocks
transect 2 54.4287 -5.6178 27.2 SLECI repeat transect
28/05/2010
1 Long Sheelah
transect 1
16.5 SLECI repeat transect
1 Long Sheelah
transect 2 54.4498 -5.5981 16.5 SLECI repeat transect
31/05/2010
1 AFBI Buoy
9
1
South of Hadd Rock transect
1 54.4529 -5.5893 30.1 SLECI repeat transect
1 South of Hadd rock transect 2 54.4511 -5.5889 27.8 SLECI repeat transect
1
Between Long Sheelah and Hadd Rock Transect 1 54.4554 -5.5920 31.3 SLECI repeat transect
1
Between Long Sheelah and Hadd Rock Transect 2 54.4538 -5.5923 31.7 SLECI repeat transect
02/06/2010
1
North of Round Island Pinnacle
transect 1 54.4336 -5.5912 27.7 SLECI repeat transect
1
North of Round Island Pinnacle
transect 2
25 SLECI repeat transect
1 Sand Rock transect 1
17.5 SLECI repeat transect
1 Sand Rock transect 2
18 SLECI repeat transect
03/06/2010
2
Round Island Pinnacle
Mooring Block 54.4344 -5.5871 29.3
Data logger and sediment trap deployment
1
Cultch deployment
site 54.4213 -5.6203 17.2 Sediment trap deployment
1 Holm Bay
Mooring Block 54.4172 -5.6267 13.2 Sediment trap deployment
04/06/2010
2 Hadd Rock 54.4540 -5.5930 26.3 Collection dive and
spat collector search
2 Holm Bay 54.4169 -5.6247 15.7 Collection dive and
spat collector search
07/06/2010
2
Green Island Passage to Great Minis transect1 54.4645 -5.6124 18 SLECI repeat transect
2
Green Island Passage to Great Minis transect2 54.4638 -5.6062 16.5 SLECI repeat transect
08/06/2010 2 Scott‟s Hole Transect 1 54.4498 -5.6068 22.2 SLECI repeat transect

234
2 Scott‟s Hole transect 2 54.4502 -5.6079 20.5 SLECI repeat transect
11/06/2010 2
Round Island Pinnacle
Mooring Block 54.4344 -5.5871 25
Modiolus collection for size frequency and
age analysis
14/06/2010
2 Long Sheelah
transect 1 54.4506 -5.5996 17.6 SLECI repeat transect
2 Long Sheelah
transect 2 54.4497 -5.5998 18.6 SLECI repeat transect
2 E. Black Rock 54.4282 -5.6169 22.7
Modiolus collection for size frequency and
age analysis
2 Craigyouran
43.8
Too deep for planned collection
17/06/2010 2 Craigyouran
43
22/06/2010 2 Scott‟s Hole 54.4518 -5.6024 20 Locate Scott‟s Hole
Tray experiment
24/06/2010 2 Scott‟s Hole
Trays 54.4518 -5.6024 20 Remove tray contents
30/06/2010
1
Round Island Pinnacle
Mooring Block 54.4344 -5.5871 28 Sediment trap
collection
1 Craigyouran
35.5
Modiolus collection for size frequency and
age analysis
1 AFBI Buoy
10 ADCP collection
1 Hadd Rock
Mooring Block 54.4542 -5.5930 23.6 Sediment trap
collection
1
Cultch deployment
site 54.4213 -5.6203 19.5
Sediment trap and spat collector
collection
1 Holm Bay
Mooring Block 54.4172 -5.6267 14 Sediment trap
collection
16/07/2010
1 Hadd Rock
Mooring Block 54.4542 -5.5930 17.8 Deploy data loggers and sediment traps
2
Cultch deployment
site 54.4213 -5.6203 18.2 Deploy data loggers and sediment traps
1 Holm Bay
Mooring Block 54.4172 -5.6267 13.4 Deploy data loggers and sediment traps
20/07/2010
1 Hadd Rock
20.5 Gonad sample
collections
1 Holm Bay
17.9 Gonad sample
collections
23/07/2010 1 Drop Off
26 Video site,
familiarisation dive
26/07/2010 2 East Black
Rock 54.4279 -5.6158 25 Quadrat total removal
27/07/2010 2 North Long
Sheelah 54.4547 -5.5932 29.1 Quadrat total removal
11/08/2010 2
Round Island Pinnacle
Mooring Block 54.4344 -5.5871 33.3
Quadrat total removal/Search for
Mooring Block

235
18/08/2010 1
Round Island Pinnacle
Mooring Block 54.4344 -5.5871 29 Deploy data loggers
08/09/2010
1 Holm Bay
Sacks 54.4172 -5.6024 14.8 Locate sacks - unsuccessful
1 Holm Bay
Mooring Block 54.4172 -5.6267 14.8 Data logger retrieval
1 Scott‟s Hole
Sacks 54.4499 -5.6026 30 Sack experiment
09/09/2010
1 Scott‟s Hole
Sacks 54.4499 -5.6026 14.8 Sack experiment
1 Hadd Rock Collection 54.4542 -5.5930 21.2
Gonad sample collections
1 Holm Bay
Collection Site 54.4169 -5.6247 14.6 Gonad sample
collections
1
"Sacks" waypoint Holm
Bay
14.6
22/09/2010
1 West of RIP way point
31.4
2
Cultch deployment
site 54.4213 -5.6203 19.7
06/10/2010
1 Hadd Rock 54.4542 -5.5930 22.2
3
Cultch deployment
site 54.4213 -5.6203 20.9
Video and photo samples, predator
prey sample collection, general
area mapping
1 Holm Bay
Mooring Block 54.4172 -5.6267 15 Secure ADCP from
Cultch site
20/10/2010
1
Round Island Pinnacle
Mooring Block 54.4344 -5.5871 32 ADCP collection
2
Cultch deployment
site 54.4213 -5.6203 18 Cultch site survey and
clean lines
01/11/2010
1 Hadd Rock 54.4542 -5.5930 19
1 Holm Bay
Mooring Block 54.4172 -5.6267 15
1
Cultch deployment
site 54.4213 -5.6203 17.5 Collect data loggers
1 Holm Bay
Mooring Block 54.4172 -5.6267 13 Collect data loggers
07/12/2010
2 Brown Rocks
TRQ
30 Total Removal
Quadrats
1 Long Sheelah
TRQ
30 Total Removal
Quadrats
08/12/2010 2 Hadd Rock
TRQ
36 Total Removal
Quadrats
09/12/2010 2 Round Island Pinnacle TRQ
29.4
Total Removal Quadrats
13/12/2010 2 Round Island
21.3 Total Removal

236
14/12/2010
1 Hadd Rock
Mooring Block 54.4542 -5.5930 20.1 Hadd Rock Mooring
block
1 Holm Bay
Mooring Block 54.4172 -5.6267 13.1
Gonad sample collections and data
logger retrieval
1 Hadd Rock 54.4542 -5.5930 17

237
Appendix 3: Modiolus Researchers Group Meeting 19-20 January 2010
Program – January 19th : Location: Exploris education suite
Time Speaker Title
9.30 Registration
10:00 Bernard Picton M. modiolus communities in Strangford Lough, diving
observations of changes since 1976.
10:30 Joe Breen Background to creation of the Modiolus Restoration
Research Project
10:40 Dai Roberts The Modiolus Restoration Research Project
11.00 Break
11:20 Anne M. Mahon
Dave Smyth
Jose Fariñas
Current status of M. Modiolus in Strangford Lough
Restoration through cultch deployment and
translocation
Experimental aquaculture of M. modiolus
11:50 Bill Sanderson Variability in horse mussel reefs
12: 30 Ivor Rees A description of an impoverished sand scoured
Modiolus community
12.40 Charlie
Lindenbaum
Acoustic methods of monitoring in Modiolus beds
2:00 Bob Brown Geographical variation in the reproduction of M.
modiolus
2.20 Terry Holt The history of Modiolus around the Isle of Man
2:40 Fiona Gell Description of recently discovered Modiolus beds off
the Isle of Man
3.00 Break
3.20 Dan B Harris An overview of Modiolus research in Scottish waters
4.00 Discussion
Bob Brown Summary of talks/ discussion
7.00 Dinner in the Portaferry Hotel
Chair of first session: Dai Roberts
Chair of second session: Mark McCaughan
Chair of third session: Graham Seymour
Chair of fourth session: Bob Brown

238
Program – January 20th
Time Activity
9.30 Dive and ROV boats departing at 9.30 am from ferry slip
10.00 Tour of marine lab, hatchery and video footage
11.30- 12.00 Boats return to Portaferry
12.30 Tea, coffee and sandwiches in the seminar room
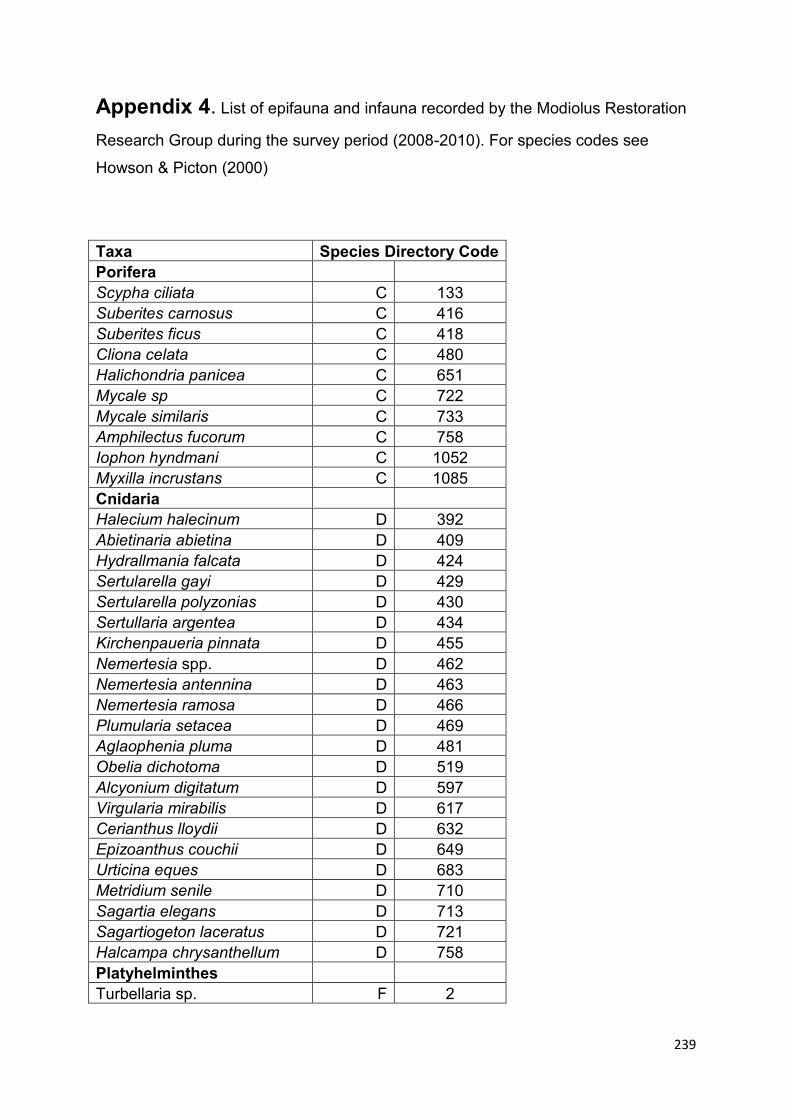
239
Appendix 4. List of epifauna and infauna recorded by the Modiolus Restoration
Research Group during the survey period (2008-2010). For species codes see
Howson & Picton (2000)
Taxa Species Directory Code
Porifera Scypha ciliata C 133
Suberites carnosus C 416
Suberites ficus C 418
Cliona celata C 480
Halichondria panicea C 651
Mycale sp C 722
Mycale similaris C 733
Amphilectus fucorum C 758
Iophon hyndmani C 1052
Myxilla incrustans C 1085
Cnidaria Halecium halecinum D 392
Abietinaria abietina D 409
Hydrallmania falcata D 424
Sertularella gayi D 429
Sertularella polyzonias D 430
Sertullaria argentea D 434
Kirchenpaueria pinnata D 455
Nemertesia spp. D 462
Nemertesia antennina D 463
Nemertesia ramosa D 466
Plumularia setacea D 469
Aglaophenia pluma D 481
Obelia dichotoma D 519
Alcyonium digitatum D 597
Virgularia mirabilis D 617
Cerianthus lloydii D 632
Epizoanthus couchii D 649
Urticina eques D 683
Metridium senile D 710
Sagartia elegans D 713
Sagartiogeton laceratus D 721
Halcampa chrysanthellum D 758
Platyhelminthes Turbellaria sp. F 2

240
Taxa Species Directory Code
Nemertea Tubulanus annulatus G 28
Cerebratulus fuscus G 41
Lineus longissimus G 54
Priapulida Priapulus caudatus J 7
Sipuncula Golfingia vulgaris N 17
Annelida: Polychaeta Adyte pellucida P 32
Harmothoe sp. P 50
Malmgrenia andreapolis P 51
Harmothoe impar P 65
Malmgrenia arenicolae P 67
Lepidonotus squamatus P 82
Polynoe scolopendrina P 84
Pholoe inornata P 92
Pholoe synophthalmica P 94
Sthenelais limicola P 106
Sthenelais boa P 107
Sthenelais zetlandica P 111
Eteone flava P 117
Eteone longa P 118
Eteone barbata P 126
Phyllodoce mucosa P 145
Pirakia punctifera P 157
Eumida bahusiensis P 164
Eumida sanguinea P 167
Paranaitis kosteriensis P 176
Glycera alba P 256
Glycera tridactyla P 265
Goniada maculata P 271
Sphaerodorum flavum P 291
Kefersteinia cirrata P 305
Nereimyra punctata P 311
Ophiodromus flexuosus P 313
Odontosyllis ctenosoma P 386
Odontosyllis gibba P 388
Nereis zonata P 478
Perinereis cultrifera P 480
Platynereis dumerilii P 484
Nephtys sp. P 494
Nephtys histricis P 500

241
Taxa Species Directory Code
Nephtys incisa P 501
Nephtys kersivalensis P 502
Lumbrineris latreilli P 582
Levinsenia gracilis P 693
Aonides paucibranchiata P 723
Polydora ciliata P 752
Prionospio fallax P 765
Spio spp. P 787
Spio filicornis P 790
Spiophanes bombyx P 794
Spiophanes kroyeri P 796
Aphelochaeta marioni P 824
Caulleriella zetlandica P 831
Chaetozone setosa P 834
Cirratulus sp P 835
Cirratulus cirratus P 836
Aphelochaeta filiformis P 837
Tharyx spp. P 847
Flabelligera affinis P 881
Pherusa plumosa P 885
Capitella capitata P 907
Mediomastus fragilis P 919
Notomastus latericeus P 921
Arenicola marina P 931
Euclymene sp. P 961
Euclymene oerstedii P 964
Ophelina acuminata P 1014
Scalibregma celticum P 1026
Scalibregma inflatum P 1027
Myriochele heeri P 1096
Owenia fusiformis P 1098
Terebellida sp P 1099
Lagis koreni P 1107
Sabellaria alveolata P 1116
Melinna palmata P 1124
Ampharete sp. P 1133
Ampharete lindstroemi P 1139
Amphicteis gunneri P 1142
Terebellides stroemi P 1175
Terebellidae spp P 1179
Eupolymnia nebulosa P 1189
Eupolymnia nesidensis P 1190
Pista cristata P 1217

242
Taxa Species Directory Code
Polycirrus medusa P 1242
Polycirrus plumosus P 1244
Streblosoma intestinalis P 1252
Branchiomma bombyx P 1263
Euchone rubrocinta P 1280
Euchone southernii P 1281
Myxicola infundibulum P 1300
Sabella pavonina P 1320
Hydroides norvegica P 1334
Pomatoceros sp P 1339
Pomatoceros lamarckii P 1340
Pomatoceros triqueter P 1341
Serpula vermicularis P 1343
Annelida: Oligochaeta Tubificoides spp. P 1487
Chelicerata Pycnogonida Q 2
Crustacea: Cirripedia Semibalanus balanoides R 70
Balanus spp. R 74
Balanus balanus R 76
Crustacea: Leptostraca Nebalia bipes S 6
Crustacea: Mysidacea Mysis sp. S 31
Crustacea: Amphipoda Lysianassa ceratina S 303
Tryphosella sarsi S 344
Atylus sp. S 409
Dexamine spinosa S 415
Ampelisca spinipes S 438
Ampelisca typica S 442
Jassa falcata S 509
Maera othonis S 519
Corophium sp. S 605
Corophium sextonae S 615
Crustacea: Decapoda Apseudes talpa S 1177
Palaemon elegans S 1317
Palaemon serratus S 1319
Thoralus cranchii S 1360
Pandalus montagui S 1377
Nephrops norvegicus S 1402

243
Taxa Species Directory Code
Upogebia pusilla S 1420
Anapagurus sp. S 1446
Pagurus bernhardus S 1457
Galathea intermedia S 1472
Galathea strigosa S 1476
Munida rugosa S 1478
Pisidia longicornis S 1482
Hyas araneus S 1518
Inachus dorsettensis S 1526
Inachus phalangium S 1528
Macropodia rostrata S 1532
Eurynome spinosa S 1537
Cancer pagurus S 1566
Liocarcinus spp. S 1577
Liocarcinus depurator S 1580
Liocarcinus pusillus S 1584
Necora puber S 1589
Carcinus maenas S 1594
Pinnotheres pisum S 1638
Mollusca: Polyplacophora Leptochiton asellus W 53
Hanleya hanleyi W 65
Callochiton achatinus W 75
Acanthochitona crinitus W 85
Mollusca: Gastropoda Diodora graeca W 116
Gibbula spp. W 158
Gibbula cineraria W 163
Calliostoma zizyphinum W 182
Turritella communis W 270
Calyptraea chinensis W 436
Capulus ungaricus W 443
Trivia monacha W 461
Boreotrophon truncatus W 680
Buccinum undatum W 708
Hinia reticulata W 745
Hinia incrassata W 747
Mollusca: Nudibranchia Tritonia hombergii W 1250
Onchidoris sp. W 1320
Jorunna tomentosa W 1386
Mollusca: Pelecypoda Nucula nucleus W 1570

244
Taxa Species Directory Code
Nucula sulcata W 1571
Mytilus edulis W 1695
Modiolus modiolus W 1702
Modiolarca tumida W 1718
Ostrea edulis W 1758
Pecten maximus W 1771
Aequipecten opercularis W 1773
Chlamys varia W 1779
Palliolum tigerinum W 1786
Anomia ephippium W 1807
Pododesmus patelliformis W 1814
Loripes lucinalis W 1824
Myrtea spinifera W 1827
Lucinoma borealis W 1829
Thyasira flexuosa W 1837
Mysella bidentata W 1906
Astarte sulcata W 1925
Gari fervensis W 2051
Abra alba W 2059
Venus verrucosa W 2089
Timoclea ovata W 2104
Venerupis spp. W 2110
Tapes spp. W 2111
Tapes rhomboides W 2113
Venerupis senegalensis W 2124
Dosinia lupinus W 2128
Mya sp. W 2145
Mya truncata W 2147
Corbula gibba W 2157
Hiatella arctica W 2166
Bryozoa Crisia spp. Y 13
Crisia denticulata Y 16
Crisia eburnea Y 17
Alcyonidium diaphanum Y 76
Membranipora membranacea Y 170
Electra pilosa Y 178
Flustra foliacea Y 187
Bugula flabellata Y 243
Scrupocellaria reptans Y 276
Scrupocellaria scruposa Y 279
Cellaria spp. Y 299
Cellaria fistulosa Y 300
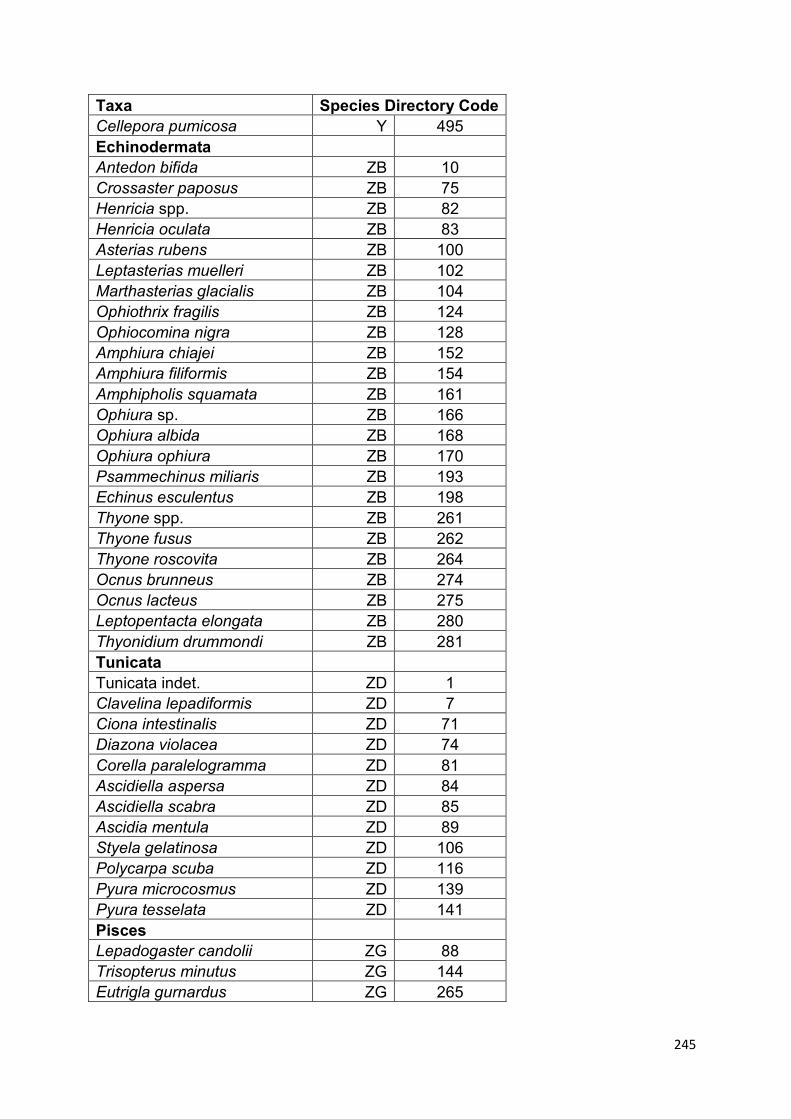
245
Taxa Species Directory Code
Cellepora pumicosa Y 495
Echinodermata Antedon bifida ZB 10
Crossaster paposus ZB 75
Henricia spp. ZB 82
Henricia oculata ZB 83
Asterias rubens ZB 100
Leptasterias muelleri ZB 102
Marthasterias glacialis ZB 104
Ophiothrix fragilis ZB 124
Ophiocomina nigra ZB 128
Amphiura chiajei ZB 152
Amphiura filiformis ZB 154
Amphipholis squamata ZB 161
Ophiura sp. ZB 166
Ophiura albida ZB 168
Ophiura ophiura ZB 170
Psammechinus miliaris ZB 193
Echinus esculentus ZB 198
Thyone spp. ZB 261
Thyone fusus ZB 262
Thyone roscovita ZB 264
Ocnus brunneus ZB 274
Ocnus lacteus ZB 275
Leptopentacta elongata ZB 280
Thyonidium drummondi ZB 281
Tunicata Tunicata indet. ZD 1
Clavelina lepadiformis ZD 7
Ciona intestinalis ZD 71
Diazona violacea ZD 74
Corella paralelogramma ZD 81
Ascidiella aspersa ZD 84
Ascidiella scabra ZD 85
Ascidia mentula ZD 89
Styela gelatinosa ZD 106
Polycarpa scuba ZD 116
Pyura microcosmus ZD 139
Pyura tesselata ZD 141
Pisces Lepadogaster candolii ZG 88
Trisopterus minutus ZG 144
Eutrigla gurnardus ZG 265

246
Taxa Species Directory Code
Lipophrys pholis ZG 412
Pholis gunnellus ZG 440
Callionymus lyra ZG 452
Gobius niger ZG 467
Pomatoschistus minutus ZG 479
Pomatoschistus pictus ZG 481