FINAL REPORT (11/13/14) Research - SCC Inside
25
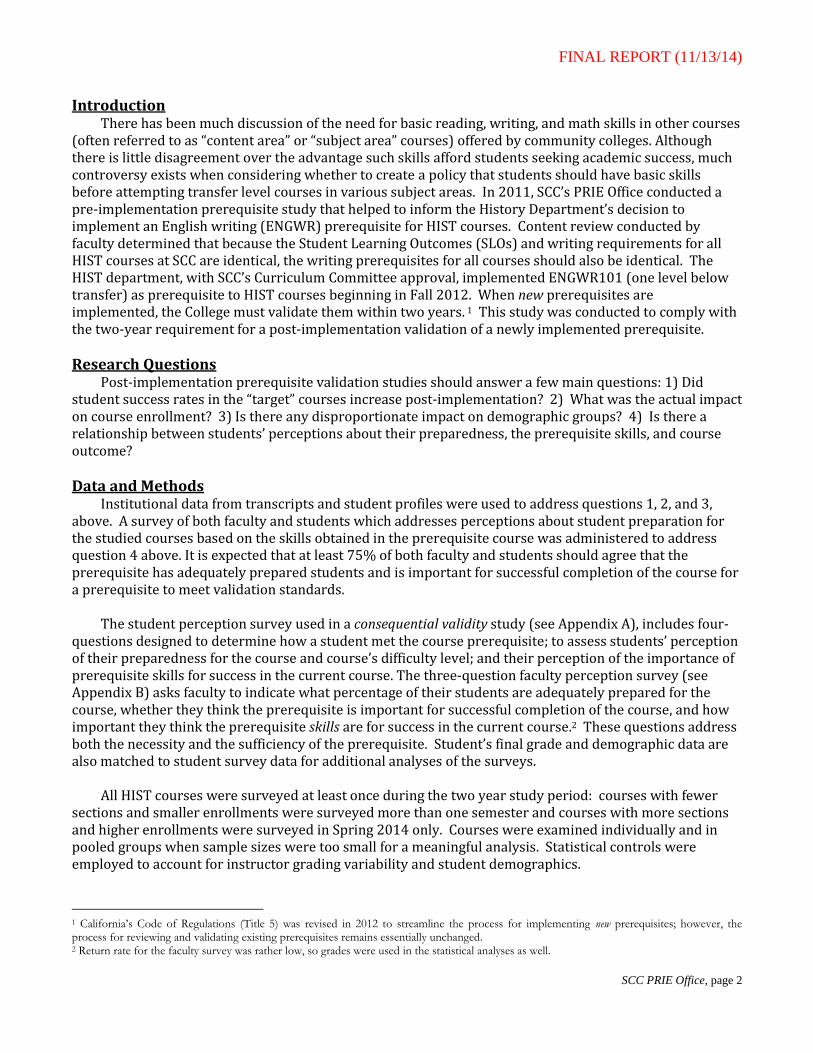
FINAL REPORT (11/13/14) PREREQUISITE VALIDATION STUDY HISTORY: 2014 Anne Danenberg, M.A. Research Analyst Abstract: This study addresses some key research questions regarding the implementation of an English writing prerequisite for SCC’s History courses. The evidence suggests that, on average, course success rates have trended upward, reaching above college average in Spring 2014; enrollments have trended downward along with overall college enrollments; and student composition—particularly ethnic composition—has not changed significantly since implementation in 2012. In a consequential validity component of the study, over 90% of students in courses post-implementation perceive that they are at least adequately prepared and course success rates for the survey respondents support that perception (86.6% successful). Students also perceive that prerequisite writing skills are moderately important for success in the courses—in most courses approximately 60% say that writing skills are necessary or important for success in the history course. Research Report Working together Pursuing Excellence Inspiring Achievement Sacramento City College Office of Planning, Research, and Institutional Effectiveness (PRIE)
Transcript of FINAL REPORT (11/13/14) Research - SCC Inside
FINAL REPORT (11/13/14)
PREREQUISITE VALIDATION STUDY HISTORY: 2014
Anne Danenberg, M.A. Research Analyst
Abstract: This study addresses some key research questions regarding the implementation of an English writing prerequisite for SCC’s History courses. The evidence suggests that, on average, course success rates have trended upward, reaching above college average in Spring 2014; enrollments have trended downward along with overall college enrollments; and student composition—particularly ethnic composition—has not changed significantly since implementation in 2012. In a consequential validity component of the study, over 90% of students in courses post-implementation perceive that they are at least adequately prepared and course success rates for the survey respondents support that perception (86.6% successful). Students also perceive that prerequisite writing skills are moderately important for success in the courses—in most courses approximately 60% say that writing skills are necessary or important for success in the history course.
Research Report
Working together Pursuing Excellence
Inspiring Achievement
Sacramento City College Office of Planning, Research, and Institutional Effectiveness (PRIE)
FINAL REPORT (11/13/14)
SCC PRIE Office, page 2
Introduction There has been much discussion of the need for basic reading, writing, and math skills in other courses
(often referred to as “content area” or “subject area” courses) offered by community colleges. Although there is little disagreement over the advantage such skills afford students seeking academic success, much controversy exists when considering whether to create a policy that students should have basic skills before attempting transfer level courses in various subject areas. In 2011, SCC’s PRIE Office conducted a pre-implementation prerequisite study that helped to inform the History Department’s decision to implement an English writing (ENGWR) prerequisite for HIST courses. Content review conducted by faculty determined that because the Student Learning Outcomes (SLOs) and writing requirements for all HIST courses at SCC are identical, the writing prerequisites for all courses should also be identical. The HIST department, with SCC’s Curriculum Committee approval, implemented ENGWR101 (one level below transfer) as prerequisite to HIST courses beginning in Fall 2012. When new prerequisites are implemented, the College must validate them within two years. 1 This study was conducted to comply with the two-year requirement for a post-implementation validation of a newly implemented prerequisite.
Research Questions Post-implementation prerequisite validation studies should answer a few main questions: 1) Did
student success rates in the “target” courses increase post-implementation? 2) What was the actual impact on course enrollment? 3) Is there any disproportionate impact on demographic groups? 4) Is there a relationship between students’ perceptions about their preparedness, the prerequisite skills, and course outcome?
Data and Methods Institutional data from transcripts and student profiles were used to address questions 1, 2, and 3,
above. A survey of both faculty and students which addresses perceptions about student preparation for the studied courses based on the skills obtained in the prerequisite course was administered to address question 4 above. It is expected that at least 75% of both faculty and students should agree that the prerequisite has adequately prepared students and is important for successful completion of the course for a prerequisite to meet validation standards.
The student perception survey used in a consequential validity study (see Appendix A), includes four-questions designed to determine how a student met the course prerequisite; to assess students’ perception of their preparedness for the course and course’s difficulty level; and their perception of the importance of prerequisite skills for success in the current course. The three-question faculty perception survey (see Appendix B) asks faculty to indicate what percentage of their students are adequately prepared for the course, whether they think the prerequisite is important for successful completion of the course, and how important they think the prerequisite skills are for success in the current course.2 These questions address both the necessity and the sufficiency of the prerequisite. Student’s final grade and demographic data are also matched to student survey data for additional analyses of the surveys.
All HIST courses were surveyed at least once during the two year study period: courses with fewer sections and smaller enrollments were surveyed more than one semester and courses with more sections and higher enrollments were surveyed in Spring 2014 only. Courses were examined individually and in pooled groups when sample sizes were too small for a meaningful analysis. Statistical controls were employed to account for instructor grading variability and student demographics.
1 California’s Code of Regulations (Title 5) was revised in 2012 to streamline the process for implementing new prerequisites; however, the process for reviewing and validating existing prerequisites remains essentially unchanged. 2 Return rate for the faculty survey was rather low, so grades were used in the statistical analyses as well.

FINAL REPORT (11/13/14)
SCC PRIE Office, page 3
Survey materials were returned by 73 sections, yielding 1,648 student surveys. Survey responses were matched to institutional data, including final grades and student demographic data, yielding 1,522 matched records. Table 1 summarizes courses, sections, and numbers of student surveys returned by course.
Table 1 Numbers of Sections and Surveys by HIST Course, Spring 2014
HIST 300 3 74 HIST 344 3 39
HIST 302 4 93 HIST 360 4 81
HIST 307 4 83 HIST 364 2 40
HIST 308 3 67 HIST 365 1 20
HIST 310 17 448 HIST 373 4 71
HIST 311 12 281 HIST 375 4 58
HIST 320 3 113 HIST 380 5 92
HIST 321 3 76 HIST 485 1 12
Total Sections = 73 TOTAL SURVEYS = 1,648
COURSES
SURVEYEDTotal Sections
Student Surveys
Received
COURSES
SURVEYEDTotal Sections
Student Surveys
Received
History Success Rates Before and After Implementation
This section summarizes success rates pre- and post-implementation. Figure 1 illustrates the overall HIST success rate for ten semesters from Fall 2009 when the pre-implementation data were studied. Success percentages rose from mid-50’s to high-60’s in Spring 2014 when the post-implementation study concluded.
Figure 1
56.054.5
58.0 59.362.0 62.8 62.2 61.3
64.1
69.6
0
10
20
30
40
50
60
70
80
F09 S10 F10 S11 F11 S12 F12 S13 F13 S14
Percent
HIST Pooled Success Rate by Term
SUCCESSRATE
FINAL REPORT (11/13/14)
SCC PRIE Office, page 4
Pre-implementation, the success rate was substantially below the college average of approximately mid-60-percentages. Although there has been some fluctuation in the department’s success rate, it rose significantly over time, reaching almost 70% in Spring 2014.
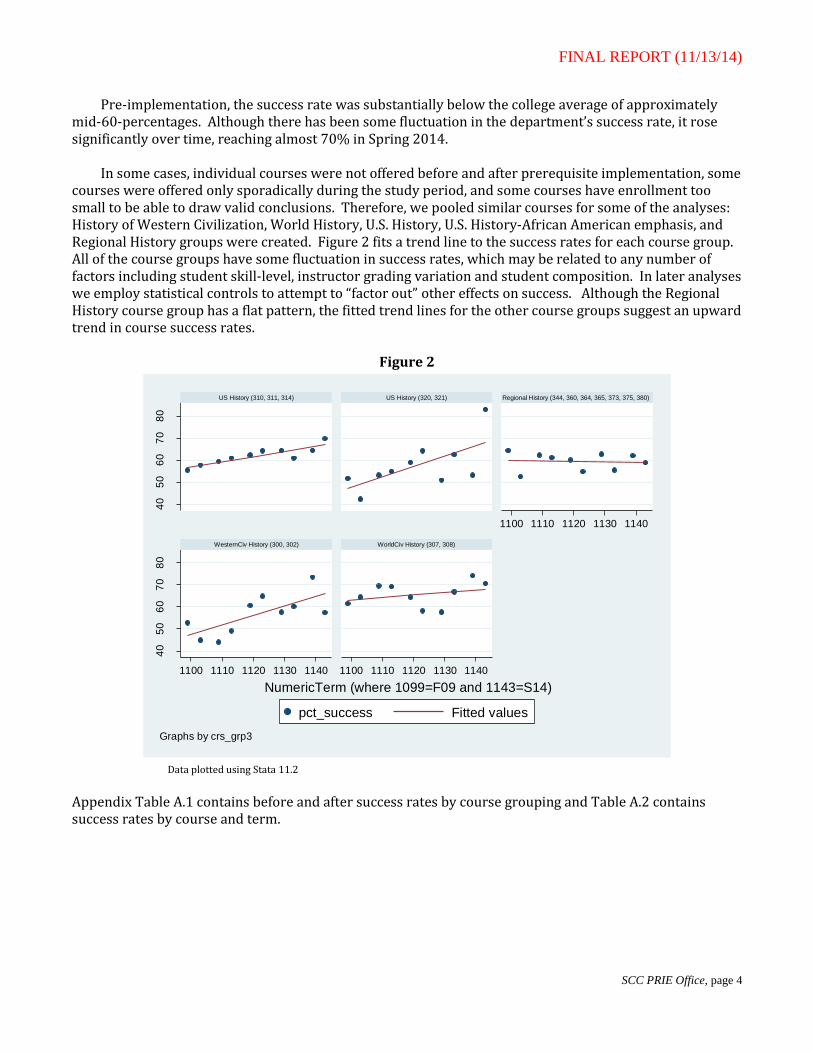
In some cases, individual courses were not offered before and after prerequisite implementation, some courses were offered only sporadically during the study period, and some courses have enrollment too small to be able to draw valid conclusions. Therefore, we pooled similar courses for some of the analyses: History of Western Civilization, World History, U.S. History, U.S. History-African American emphasis, and Regional History groups were created. Figure 2 fits a trend line to the success rates for each course group. All of the course groups have some fluctuation in success rates, which may be related to any number of factors including student skill-level, instructor grading variation and student composition. In later analyses we employ statistical controls to attempt to “factor out” other effects on success. Although the Regional History course group has a flat pattern, the fitted trend lines for the other course groups suggest an upward trend in course success rates.
Figure 2
Data plotted using Stata 11.2
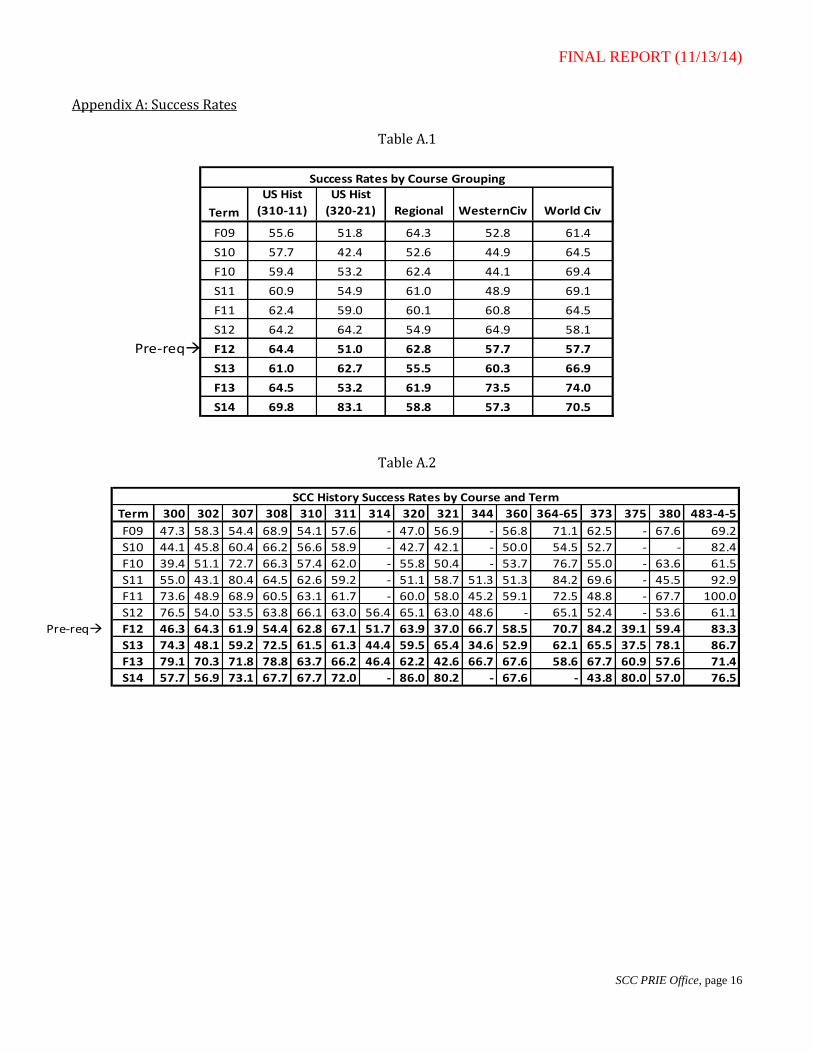
Appendix Table A.1 contains before and after success rates by course grouping and Table A.2 contains success rates by course and term.
40
50
60
70
80
40
50
60
70
80
1100 1110 1120 1130 1140
1100 1110 1120 1130 1140 1100 1110 1120 1130 1140
US History (310, 311, 314) US History (320, 321) Regional History (344, 360, 364, 365, 373, 375, 380)
WesternCiv History (300, 302) WorldCiv History (307, 308)
pct_success Fitted values
NumericTerm (where 1099=F09 and 1143=S14)
Graphs by crs_grp3
FINAL REPORT (11/13/14)
SCC PRIE Office, page 5
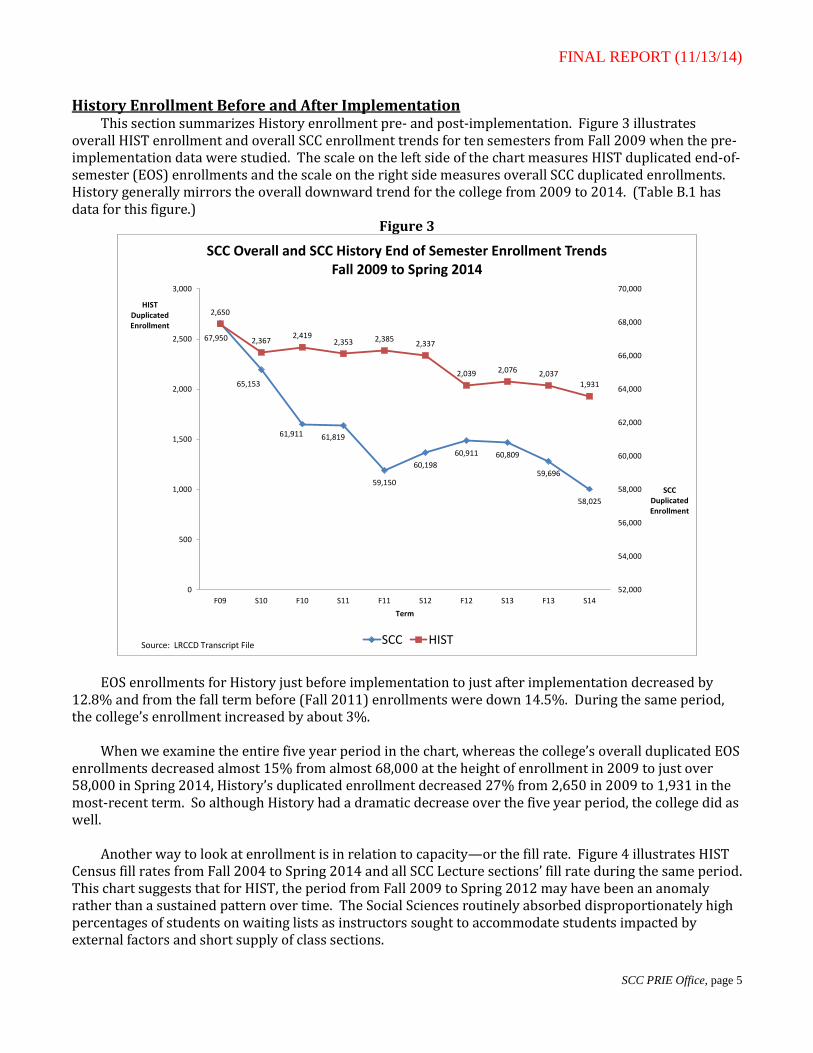
History Enrollment Before and After Implementation This section summarizes History enrollment pre- and post-implementation. Figure 3 illustrates
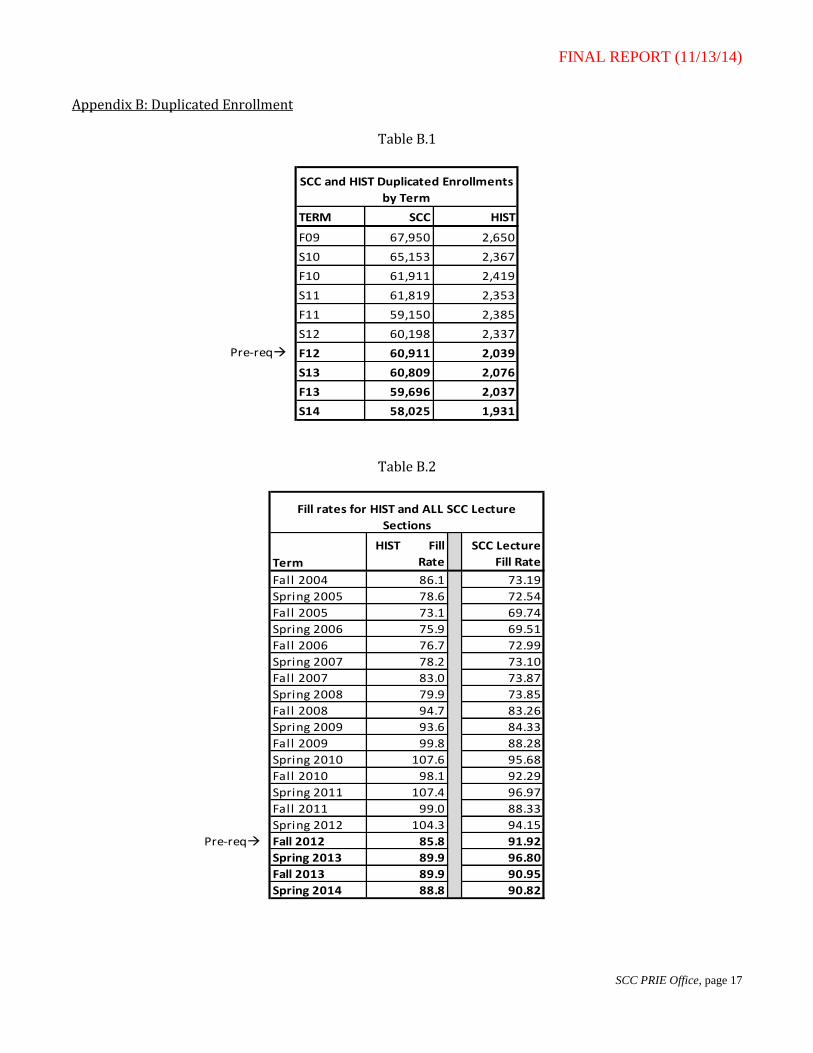
overall HIST enrollment and overall SCC enrollment trends for ten semesters from Fall 2009 when the pre-implementation data were studied. The scale on the left side of the chart measures HIST duplicated end-of-semester (EOS) enrollments and the scale on the right side measures overall SCC duplicated enrollments. History generally mirrors the overall downward trend for the college from 2009 to 2014. (Table B.1 has data for this figure.)
Figure 3
EOS enrollments for History just before implementation to just after implementation decreased by 12.8% and from the fall term before (Fall 2011) enrollments were down 14.5%. During the same period, the college’s enrollment increased by about 3%.
When we examine the entire five year period in the chart, whereas the college’s overall duplicated EOS
enrollments decreased almost 15% from almost 68,000 at the height of enrollment in 2009 to just over 58,000 in Spring 2014, History’s duplicated enrollment decreased 27% from 2,650 in 2009 to 1,931 in the most-recent term. So although History had a dramatic decrease over the five year period, the college did as well.
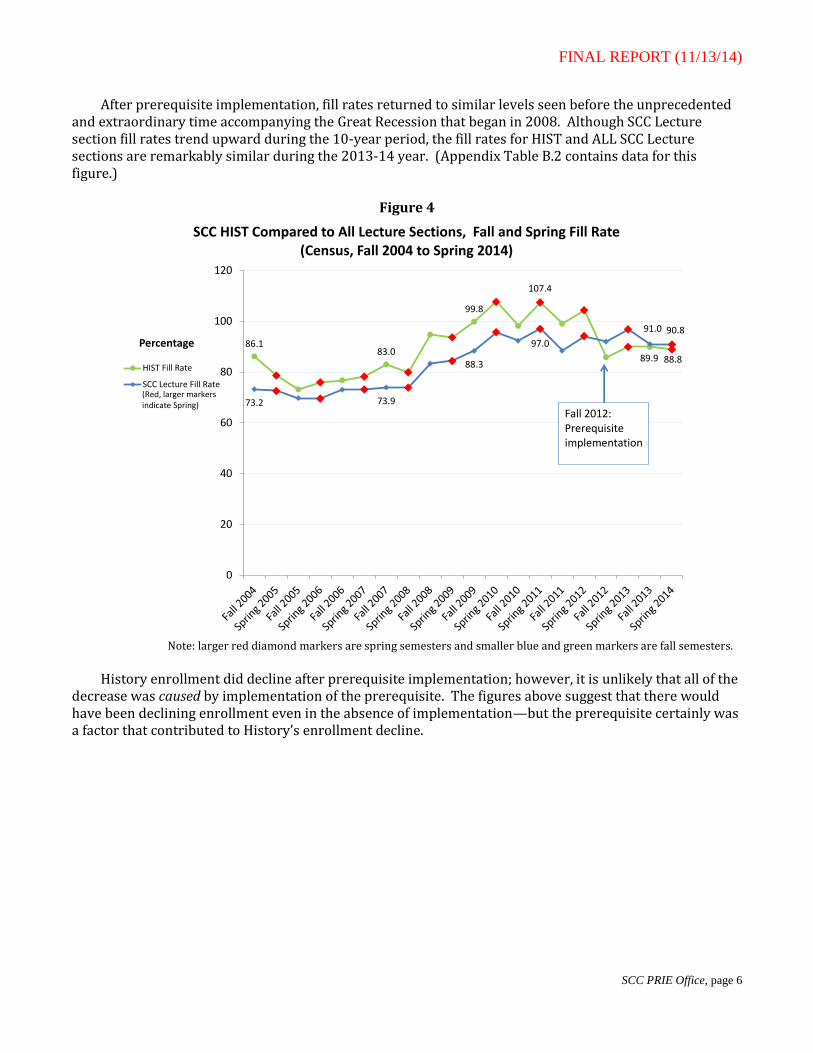
Another way to look at enrollment is in relation to capacity—or the fill rate. Figure 4 illustrates HIST Census fill rates from Fall 2004 to Spring 2014 and all SCC Lecture sections’ fill rate during the same period. This chart suggests that for HIST, the period from Fall 2009 to Spring 2012 may have been an anomaly rather than a sustained pattern over time. The Social Sciences routinely absorbed disproportionately high percentages of students on waiting lists as instructors sought to accommodate students impacted by external factors and short supply of class sections.
67,950
65,153
61,911 61,819
59,150
60,198
60,911 60,809
59,696
58,025
2,650
2,3672,419
2,353 2,3852,337
2,039 2,076 2,037
1,931
0
500
1,000
1,500
2,000
2,500
3,000
F09 S10 F10 S11 F11 S12 F12 S13 F13 S14
52,000
54,000
56,000
58,000
60,000
62,000
64,000
66,000
68,000
70,000
HISTDuplicated Enrollment
Term
SCC Duplicated Enrollment
SCC Overall and SCC History End of Semester Enrollment Trends Fall 2009 to Spring 2014
SCC HISTSource: LRCCD Transcript File
FINAL REPORT (11/13/14)
SCC PRIE Office, page 6
After prerequisite implementation, fill rates returned to similar levels seen before the unprecedented and extraordinary time accompanying the Great Recession that began in 2008. Although SCC Lecture section fill rates trend upward during the 10-year period, the fill rates for HIST and ALL SCC Lecture sections are remarkably similar during the 2013-14 year. (Appendix Table B.2 contains data for this figure.)
Figure 4
Note: larger red diamond markers are spring semesters and smaller blue and green markers are fall semesters.
History enrollment did decline after prerequisite implementation; however, it is unlikely that all of the
decrease was caused by implementation of the prerequisite. The figures above suggest that there would have been declining enrollment even in the absence of implementation—but the prerequisite certainly was a factor that contributed to History’s enrollment decline.
86.183.0
99.8
107.4
89.9 88.8
73.2 73.9
88.3
97.0
91.0 90.8
0
20
40
60
80
100
120
Percentage
SCC HIST Compared to All Lecture Sections, Fall and Spring Fill Rate (Census, Fall 2004 to Spring 2014)
HIST Fill Rate
SCC Lecture Fill Rate
Fall 2012: Prerequisiteimplementation
(Red, larger markers indicate Spring)

FINAL REPORT (11/13/14)
SCC PRIE Office, page 7
Disproportionate Impact on Student Groups Concerns have been raised about whether a prerequisite would limit student access for some student
groups more than others. When ethnicity, gender, age, income, and disability status are considered one-by-one, the composition of students after prerequisite implementation compared to before implementation exhibits some key patterns. The percentages of most of student subgroups examined post-implementation have been remarkably similar to the college as a whole and to the composition before the prerequisite was implemented. This finding suggests that there has not been a disproportionate impact on those groups. While the ethnic composition before and after implementation was of great concern before the prerequisite was implemented, it appears to be quite similar to the pre-implementation composition. Ethnicity or Race
This section looks at whether ethnic composition has changed, and if so, whether there is any association between changes in ethnic composition and the implementation of a prerequisite. Many factors may be associated with changes in ethnic composition, so this study cannot establish causality.
Figure 5 illustrates the overall HIST percentages from Fall 2009 to Spring 2014 for students identifying as African American, Asian, Latino, or White.3 Although students do not directly identify as “multi-race,” the chart shows that the percentage of students identifying as more than one ethnicity or race has risen by approximately the same amount that African American percentage appears to have decreased. (Appendix C and additional data analyses not shown here explore African American access in more detail.)
Figure 5
3 Other ethnic groups are relatively small.
0
5
10
15
20
25
30
35
F09 S10 F10 S11 F11 S12 F12 S13 F13 S14
Percentage
Ethnic Composition of HIST Overall Enrollments for Groups with at least 5% of Enrollment in Any Single Term
(Fall 2009 to Spring 2014)
African American
Asian
Hispanic/Latino
Multi-Race
White
Unknown

FINAL REPORT (11/13/14)
SCC PRIE Office, page 8
Similarly, when we examine the apparent jump in white percentage from Fall 2012 to Spring 2013,
much of it is actually due to a change in reporting mechanisms rather than a true increase in the white percentage. Between 2012 and 2014, data capture categories and methods have changed a few times.
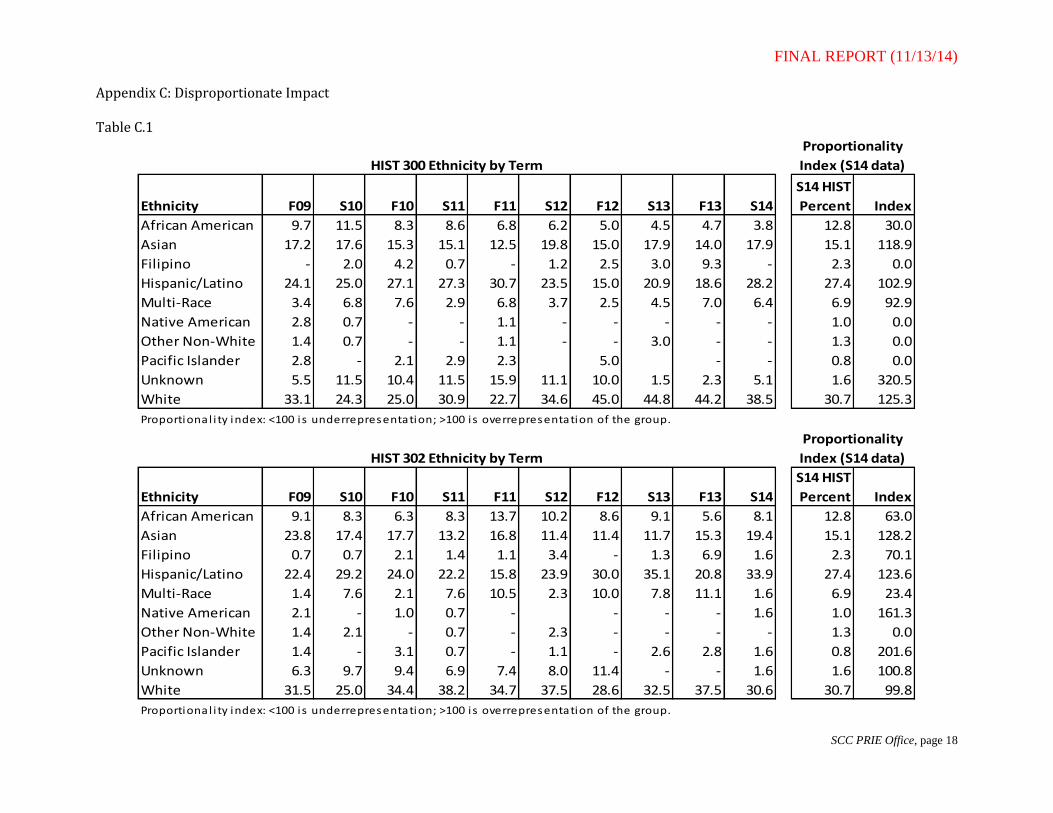
Using a Proportionality Index methodology set forth by the California Community College Chancellor’s Office (CCCCO), Table 2 compares the proportion of each ethnic subgroup in History to the ethnicity’s proportion at SCC overall. If there were perfect proportionality, the percentage in the Proportionality Index column on the right side of the table would be 100 percent. Percentages over 100 mean that the group is overrepresented and those below 100 mean that the group is underrepresented compared to the college overall. Although some of the smaller groups such as Pacific Islanders (low), Native Americans and Other, non-White (high) are disproportionately represented in History, the larger groups do not exhibit enough disproportionate impact in Spring 2014 to be alarming—according to the CCCCO guidelines. 4
Appendix C contains individual HIST courses compared to overall History ethnic composition for the
most-recent semester—Spring 2014 and ethnic composition from Fall 2008 through Spring 2014. We would expect that specialty courses such as regional history courses and U.S. History–African American emphasis would attract special-interest demographics more than broad survey courses would. Therefore, disproportionate impact for these courses should be considered in context of pre- and post-implementation rather than compared to overall HIST ethnic composition. In general, there has been quite a bit of fluctuation for proportions of several of the ethnic groups. Notably, prerequisite implementation in Fall 2012 does not appear to have made a permanent “dent” in previous group levels. Appendix C contains more detail about ethnic composition before and after implementation.
Table 2
Ethnicity, Spring 2014
SCC
Percent
HIST
Percent
Proportionality
Index
African American 12.7 12.8 100.6
Asian 18.6 15.1 81.5
Filipino 2.6 2.3 88.8
Hispanic/Latino 27.0 27.4 101.6
Multi-Race 6.0 6.9 115.8
Native American 0.7 1.0 136.4
Other Non-White 0.9 1.3 152.4
Pacific Islander 1.3 0.8 63.8
Unknown 1.8 1.6 89.9
White 28.4 30.7 107.8
Black (overlapping categories) 17.1 17.4 101.6
4 The standard of 20% or more difference from a selected reference group—in this case the College—being considered as disproportionate is based on the “80% Rule” that comes from Section 60-3, Uniform Guidelines on Employee Selection Procedure (1978); 43 FR 38295(August 25, 1978). The CCCCO makes clear that other standards could be chosen for the proportionality index, however, this analysis is consistent with the U.S. Equal Employment Opportunity Commission’s (EEOC) guidelines. http://www.eeoc.gov/policy/docs/qanda_clarify_procedures.html (retrieved 10/1/2014).

FINAL REPORT (11/13/14)
SCC PRIE Office, page 9
Another way to look at whether ethnic composition is different post-implementation is using a
statistical method known as analysis of variance (ANOVA). This procedure allows us to compare the variation of ethnic categories pre-and post-implementation. Table 3 contains the results from an ANOVA procedure that shows a few key statistics which support the conclusion that the ethnic composition of HIST overall was not significantly different post-implementation when compared to pre-implementation ethnic composition. First, there is no correlation between pre-post and ethnic composition; second, the R2 statistic is zero—which means that pre-post grouping does not explain any of the variance in ethnicity; third, the F statistic is quite small (0.3) and is not statistically significant, which means that there is no systematic difference between pre- and post-implementation ethnic composition.
Table 3
Number of obs = 22522
R-squared = 0.0000
Source SS df MS F Prob > F
Between pre-post 3.496031 1 3.4960305 0.3 0.5867
Within pre-post 266330.2 22520 11.826384
Total 266333.7 22521 11.826014
Correlation
0.00
One-way Analysis of Variance by Pre-post for Numericized Ethnic Groups
Regardless of the method used for examining possible changes in ethnic composition and
disproportionality, implementation of the prerequisite does not appear to have caused any permanent changes in ethnic composition. In fact, fluctuation in ethnic composition before implementation was immediately apparent from the data points.
Duplicated Enrollment: Gender, Age, Income, Disability, and Ethnicity Table 4 contains gender, age, income, and disability duplicated enrollment percentages for SCC and
HIST before the prerequisite implementation (Fall 2011) and after it (Spring 2014). The most-consistent pattern that is evident in the table is that whether compared to SCC overall or compared to the fall term before implementation, for most of the demographics examined, the composition of enrollment in history courses is not disproportionate to the composition of enrollment at SCC, nor has the composition changed substantially since before implementation. Exceptions are non-traditional college-age in 2011 and

FINAL REPORT (11/13/14)
SCC PRIE Office, page 10
Table 4
disabled student-enrollment before and after prerequisite implementation. However, when we consider the overall percentage of Disability Services & Programs for Students (DSPS) enrollment at SCC, the 1 to 2% gap between SCC and HIST is quite small even though the gap is more than 20%.when we use the proportionality index method to compare. Perhaps more importantly, the percentage of DSPS enrollment in SCC history classes is higher in 2014 than in 2011. Table 5 contains duplicated enrollment at SCC and in HIST by ethnicity. The table shows that for most groups, there is not any disproportionality that would be considered alarming. The three groups that have more than 20% difference from the group’s representation at SCC overall-in 2014 are very small groups—Native Americans; Other, non-white; and Pacific Islanders. -
Table 5
When examining enrollment by demographic characteristics, we find that HIST students are remarkably reflective of the student population at SCC, and this pattern exists across most of the demographics examined.
Disproportionate Impact
Gender SCC % HIST % SCC % HIST % 2011 2014
Female 54.4 51.5 53.1 51.0 0.95 0.96
Male 44.8 47.7 45.1 46.8 1.06 1.04
Age Group
Traditional College Age 62.9 71.0 62.1 69.7 1.13 1.12
Not Traditonal College Age 37.1 29.0 37.9 30.4 0.78 0.80
Income Level
Low Income or Below Poverty 64.7 66.1 69.8 66.3 1.02 0.95
Disability Status
DSPS 6.0 4.3 6.8 5.4 0.72 0.79
ProportionalityFall 2011 Spring 2014
Ethnicity SCC % HIST % SCC % HIST % 2011 2014
African American 12.0 12.4 12.9 12.7 1.03 0.98
Asian 16.7 14.8 17.9 15.0 0.88 0.84
Filipino 2.4 2.1 2.5 2.3 0.90 0.93
Hispanic/Latino 25.1 25.0 28.0 28.0 1.00 1.00
Multi-Race 5.0 5.9 6.3 7.1 1.18 1.12
Native American 0.7 0.7 0.7 1.0 1.04 1.34
Other Non-White 0.9 0.9 0.8 1.2 0.98 1.43
Pacific Islander 1.1 1.1 1.3 0.7 0.98 0.56
Unknown 10.2 10.9 1.7 1.6 1.07 0.95
White 25.9 26.3 27.8 30.5 1.01 1.09
ProportionalityFall 2011 Spring 2014

FINAL REPORT (11/13/14)
SCC PRIE Office, page 11
Consequential Validity: Student Perceptions of Preparedness and Prerequisite Skills Characteristics of the survey respondents are examined to see how closely they mirror the overall
characteristics of SCC students (and HIST, because it is representative of SCC overall). We use Spring 2014 for comparison because the majority of surveys were given in that term. However, students who were surveyed were matched to transcript and profile data for the term of enrollment. Table 6 contains age group, ethnicity, and income level tabulations for students who provided a student ID number that could be accurately matched to SCC Institutional Research (IR) data.
Table 6 Demographic Characteristics of Survey Respondents and SCC Students
Ethnicity
Sample
Number
Sample
Percent
SCC
Percent Age Group
Sample
Number
Sample
Percent
SCC
Percent
African American 168 11.1 12.7 18 - 20 578 38.1 29.3
Asian 226 14.9 18.6 21 - 24 502 33.1 27.6
Filipino 32 2.1 2.6 25 - 29 215 14.2 16.2
Hispanic/Latino 426 28.1 27.0 30 - 39 153 10.1 13.1
Multi-Race 108 7.1 6.0 40 and Over 65 4.3 12.7
Native American 15 1.0 0.7 Under 18 4 0.3 1.2
Other Non-White 11 0.7 0.9 Income Level
Pacific Islander 11 0.7 1.3 Below Poverty 612 40.3 43.1
Unknown 24 1.6 1.8 Low 350 23.1 23.0
White 496 32.7 28.4 Middle And Above 389 25.6 21.7
Total 1,517 100.0 100.0 Unable to Determine 166 10.9 12.2
The survey respondents are more white, more Latino, more multi-race, less Asian, and less African
American than SCC in 2014. They are younger (71% versus 57% under 25) and slightly better off in terms of income level (63% versus 66% low or below poverty). The differences may be a function of the survey’s timing—it is administered at least six to eight weeks into the semester and thus does not included students who dropped with a “W,” while the IR data does include those students.
Table 7 contains Spring 2014 success rates for surveyed students. When we examine success rates for only those students who took the survey and who were matched to IR data, the overall success rate for matched students is 86.6%. Even the lowest success rate (HIST 375) is over 72% for students who participated in the survey and were matched to IR data. Clearly, students who remain in History courses for at least half the term have a very good chance of successfully completing the course.
Table 7
HIST Course % Successful
Matched to
SCC IR Data HIST Course % Successful
Matched to
SCC IR Data
300 82.1 67 344 93.9 33
302 81.1 90 360 90.8 76
307 88.2 76 364 97.1 35
308 93.9 66 365 85.0 20
310 85.2 413 373 81.4 70
311 84.5 252 375 72.2 54
320 95.1 101 380 90.1 81
321 90.1 71 485 100.0 12
Totals:
Success Rates for HIST Students Matched to IR Data by Course
Success = 86.6%Matched = 1,517
FINAL REPORT (11/13/14)
SCC PRIE Office, page 12
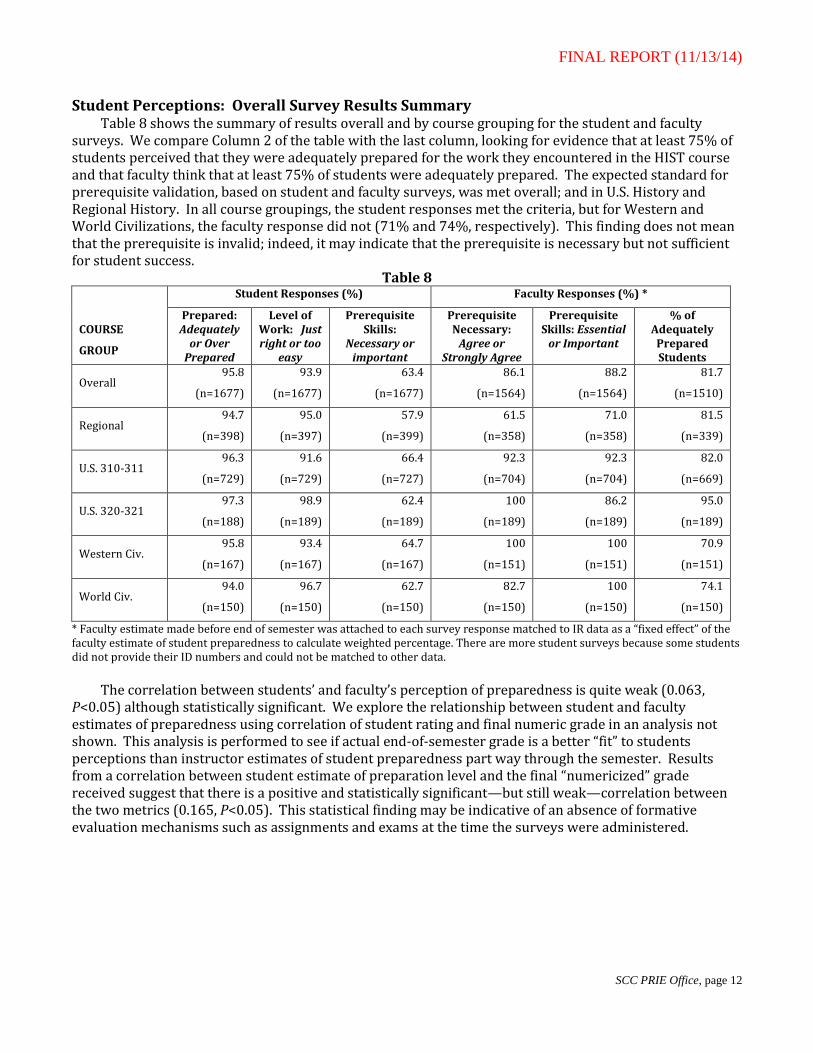
Student Perceptions: Overall Survey Results Summary Table 8 shows the summary of results overall and by course grouping for the student and faculty
surveys. We compare Column 2 of the table with the last column, looking for evidence that at least 75% of students perceived that they were adequately prepared for the work they encountered in the HIST course and that faculty think that at least 75% of students were adequately prepared. The expected standard for prerequisite validation, based on student and faculty surveys, was met overall; and in U.S. History and Regional History. In all course groupings, the student responses met the criteria, but for Western and World Civilizations, the faculty response did not (71% and 74%, respectively). This finding does not mean that the prerequisite is invalid; indeed, it may indicate that the prerequisite is necessary but not sufficient for student success.
Table 8
COURSE
GROUP
Student Responses (%) Faculty Responses (%) *
Prepared: Adequately
or Over Prepared
Level of Work: Just right or too
easy
Prerequisite Skills:
Necessary or important
Prerequisite Necessary:
Agree or Strongly Agree
Prerequisite Skills: Essential
or Important
% of Adequately
Prepared Students
Overall 95.8
(n=1677)
93.9
(n=1677)
63.4
(n=1677)
86.1
(n=1564)
88.2
(n=1564)
81.7
(n=1510)
Regional 94.7
(n=398)
95.0
(n=397)
57.9
(n=399)
61.5
(n=358)
71.0
(n=358)
81.5
(n=339)
U.S. 310-311 96.3
(n=729)
91.6
(n=729)
66.4
(n=727)
92.3
(n=704)
92.3
(n=704)
82.0
(n=669)
U.S. 320-321 97.3
(n=188)
98.9
(n=189)
62.4
(n=189)
100
(n=189)
86.2
(n=189)
95.0
(n=189)
Western Civ. 95.8
(n=167)
93.4
(n=167)
64.7
(n=167)
100
(n=151)
100
(n=151)
70.9
(n=151)
World Civ. 94.0
(n=150)
96.7
(n=150)
62.7
(n=150)
82.7
(n=150)
100
(n=150)
74.1
(n=150)
* Faculty estimate made before end of semester was attached to each survey response matched to IR data as a “fixed effect” of the faculty estimate of student preparedness to calculate weighted percentage. There are more student surveys because some students did not provide their ID numbers and could not be matched to other data.
The correlation between students’ and faculty’s perception of preparedness is quite weak (0.063,
P<0.05) although statistically significant. We explore the relationship between student and faculty estimates of preparedness using correlation of student rating and final numeric grade in an analysis not shown. This analysis is performed to see if actual end-of-semester grade is a better “fit” to students perceptions than instructor estimates of student preparedness part way through the semester. Results from a correlation between student estimate of preparation level and the final “numericized” grade received suggest that there is a positive and statistically significant—but still weak—correlation between the two metrics (0.165, P<0.05). This statistical finding may be indicative of an absence of formative evaluation mechanisms such as assignments and exams at the time the surveys were administered.
FINAL REPORT (11/13/14)
SCC PRIE Office, page 13
Student Perceptions: Detailed student survey results for courses History of Western Civilization (300 and 302)
History-300 had 74 students from 3 sections that completed the student survey. When asked to assess their level of preparedness for the course, 94.6% of the students felt they were adequately or over- prepared for the work in the course. Furthermore, 91.9% of the students described the level of work in the course as “just right” or “too easy,” and 64.9% of the students feel that the prerequisite skills are necessary or important for their success in the course.
History 302 had 93 students from 4 sections that completed the student survey. When asked to assess
their level of preparedness for the course, 96.8% of the students felt they were adequately or over- prepared for the work in the course. Furthermore, 94.6% of the students described the level of work in the course as “just right” or “too easy,” and 64.5% of the students feel that the prerequisite skills are necessary or important for their success in the course. History of World Civilization (307 and 308)
History-307 had 83 students from 4 sections that completed the student survey. When asked to assess their level of preparedness for the course, 92.8% of the students felt they were adequately or over- prepared for the work in the course. Furthermore, 97.6% of the students described the level of work in the course as “just right” or “too easy,” and 57.8% of the students feel that the prerequisite skills are necessary or important for their success in the course.
History 308 had 67 students from 3 sections that completed the student survey. When asked to assess
their level of preparedness for the course, 95.5% of the students felt they were adequately or over- prepared for the work in the course. Furthermore, 95.5% of the students also described the level of work in the course as “just right” or “too easy,” and 68.7% of the students feel that the prerequisite skills are necessary or important for their success in the course. History of the United States (310, 311, 320, 321, and 485)
History-310 had 447 students from 17 sections that completed the student survey. When asked to assess their level of preparedness for the course, 96.2% of the students felt they were adequately or over- prepared for the work in the course. Furthermore, 93.7% of the students described the level of work in the course as “just right” or “too easy,” and 66.1% of the students feel that the prerequisite skills are necessary or important for their success in the course.
History 311 had 282 students from 12 sections that completed the student survey. When asked to
assess their level of preparedness for the course, 96.5% of the students felt they were adequately or over- prepared for the work in the course. Furthermore, 88.3% of the students described the level of work in the course as “just right” or “too easy,” and 64.5% of the students feel that the prerequisite skills are necessary or important for their success in the course.
History-320 had 113 students from 3 sections that completed the student survey. When asked to
assess their level of preparedness for the course, 97.4% of the students felt they were adequately or over- prepared for the work in the course. Furthermore, 98.2% of the students described the level of work in the course as “just right” or “too easy,” and 62.8% of the students feel that the prerequisite skills are necessary or important for their success in the course.
History 321 had 76 students from 3 sections that completed the student survey. When asked to assess
their level of preparedness for the course, 97.3% of the students felt they were adequately or over- prepared for the work in the course. Furthermore, 100% of the students described the level of work in the

FINAL REPORT (11/13/14)
SCC PRIE Office, page 14
course as “just right” or “too easy,” and 61.8% of the students feel that the prerequisite skills are necessary or important for their success in the course.
History-485 (honors) had 12 students from 1 section that completed the student survey. When asked
to assess their level of preparedness for the course, 100% of the students felt they were adequately or over- prepared for the work in the course. Furthermore, 83.3% of the students described the level of work in the course as “just right,” but 16.7% of the honor students thought the course was “too hard.” However, 66.7% of the students feel that the prerequisite skills are necessary or important for their success in the course. It is important to remember that results from such a small sample are inconclusive when assessing how students in History Honors generally perceive the course and their skill level. Note that all students still in this section at the end of the semester received passing grades in Spring 2014. Regional History (344, 360, 364, 365, 373, 375, 380)
Because few sections of each of some courses are typically offered each semester, data were collected for four semesters—from Fall 2012 to Spring 2014. Student and faculty surveys were sent to all sections of these courses. A total of 23 sections returned survey materials, with 401 completed surveys.
History 344 (California) had 39 students from 3 sections that completed the student survey. When
asked to assess their level of preparedness for the course, 94.9% of the students felt they were adequately or over- prepared for the work in the course. Furthermore, 97.4% of the students described the level of work in the course as “just right” or “too easy,” and 79.5% of the students feel that the prerequisite skills are necessary or important for their success in the course.
History 360 (Africa) had 81 students from 4 sections that completed the student survey. When asked
to assess their level of preparedness for the course, 93.7% of the students felt they were adequately or over- prepared for the work in the course. Furthermore, 93.7% of the students described the level of work in the course as “just right” or “too easy,” but only 38% of the students feel that the prerequisite skills are necessary or important for their success in the course.
History 364-365 (Asia) had 60 students from 3 sections that completed the student survey. When
asked to assess their level of preparedness for the course, 93.3% of the students felt they were adequately or over- prepared for the work in the course. Furthermore, 95.0% of the students described the level of work in the course as “just right” or “too easy,” and 61.7% of the students feel that the prerequisite skills are necessary or important for their success in the course.
History 373 (Mexico) had 71 students from 4 sections that completed the student survey. When asked
to assess their level of preparedness for the course, 93.0% of the students felt they were adequately or over- prepared for the work in the course. Furthermore, 95.8% of the students described the level of work in the course as “just right” or “too easy,” and 64.8% of the students feel that the prerequisite skills are necessary or important for their success in the course.
History 375 (Caribbean) had 58 students from 4 sections that completed the student survey. When
asked to assess their level of preparedness for the course, 94.8% of the students felt they were adequately or over- prepared for the work in the course. Furthermore, 89.7% of the students described the level of work in the course as “just right,” and no one described the course as “too easy.” Note that 63.8% of the students feel that the prerequisite skills are necessary or important for their success in the course.
History 380 (Middle East) had 92 students from 5 sections that completed the student survey. When
asked to assess their level of preparedness for the course, 97.8% of the students felt they were adequately or over- prepared for the work in the course. Furthermore, 97.8% of the students also described the level

FINAL REPORT (11/13/14)
SCC PRIE Office, page 15
of work in the course as “just right” or “too easy,” and 54.4% of the students feel that the prerequisite skills are necessary or important for their success in the course.
This section provides evidence that although there is variation across the History courses, students generally perceive themselves to be well-prepared for the work they are encountering in SCC’s History courses since the prerequisite was implemented. However, they do not seem to think that the English skills acquired before taking the given History course are particularly important to that preparation. It may be that students are not connecting the ability to write at a particular level of competence with the ability to demonstrate mastery of History content. However, this study does not specifically address that question.
Conclusion
This study has addressed some key research questions regarding the implementation of an English writing prerequisite for SCC’s History courses. The evidence suggests that, on average, course success rates have trended upward, reaching above college average in Spring 2014; enrollments have trended downward along with overall college enrollments; and student composition—particularly ethnic composition—has not changed significantly since implementation in 2012. There is little worrisome disproportionate impact evident in 2014—especially when considered in context of the specific focus and topics of a given history course. Over 90% of students in courses post-implementation perceive that they are at least adequately prepared and success rates for the survey respondents support that perception (86.6% successful). Students also perceive that prerequisite writing skills are moderately important for success in the courses—in most courses approximately 60% say that writing skills are necessary or important for success in the history course.
What the History Department’s prerequisite policy is in the future is a philosophical question for the
department; however, it does not appear from the data examined in this study that prerequisite implementation “harmed” SCC’s history students by limiting access or creating barriers to success.
FINAL REPORT (11/13/14)
SCC PRIE Office, page 16
Appendix A: Success Rates
Table A.1
Term
US Hist
(310-11)
US Hist
(320-21) Regional WesternCiv World Civ
F09 55.6 51.8 64.3 52.8 61.4
S10 57.7 42.4 52.6 44.9 64.5
F10 59.4 53.2 62.4 44.1 69.4
S11 60.9 54.9 61.0 48.9 69.1
F11 62.4 59.0 60.1 60.8 64.5
S12 64.2 64.2 54.9 64.9 58.1
Pre-req F12 64.4 51.0 62.8 57.7 57.7
S13 61.0 62.7 55.5 60.3 66.9
F13 64.5 53.2 61.9 73.5 74.0
S14 69.8 83.1 58.8 57.3 70.5
Success Rates by Course Grouping
Table A.2
Term 300 302 307 308 310 311 314 320 321 344 360 364-65 373 375 380 483-4-5
F09 47.3 58.3 54.4 68.9 54.1 57.6 - 47.0 56.9 - 56.8 71.1 62.5 - 67.6 69.2
S10 44.1 45.8 60.4 66.2 56.6 58.9 - 42.7 42.1 - 50.0 54.5 52.7 - - 82.4
F10 39.4 51.1 72.7 66.3 57.4 62.0 - 55.8 50.4 - 53.7 76.7 55.0 - 63.6 61.5
S11 55.0 43.1 80.4 64.5 62.6 59.2 - 51.1 58.7 51.3 51.3 84.2 69.6 - 45.5 92.9
F11 73.6 48.9 68.9 60.5 63.1 61.7 - 60.0 58.0 45.2 59.1 72.5 48.8 - 67.7 100.0
S12 76.5 54.0 53.5 63.8 66.1 63.0 56.4 65.1 63.0 48.6 - 65.1 52.4 - 53.6 61.1
Pre-req F12 46.3 64.3 61.9 54.4 62.8 67.1 51.7 63.9 37.0 66.7 58.5 70.7 84.2 39.1 59.4 83.3
S13 74.3 48.1 59.2 72.5 61.5 61.3 44.4 59.5 65.4 34.6 52.9 62.1 65.5 37.5 78.1 86.7
F13 79.1 70.3 71.8 78.8 63.7 66.2 46.4 62.2 42.6 66.7 67.6 58.6 67.7 60.9 57.6 71.4
S14 57.7 56.9 73.1 67.7 67.7 72.0 - 86.0 80.2 - 67.6 - 43.8 80.0 57.0 76.5
SCC History Success Rates by Course and Term
FINAL REPORT (11/13/14)
SCC PRIE Office, page 17
Appendix B: Duplicated Enrollment
Table B.1
TERM SCC HIST
F09 67,950 2,650
S10 65,153 2,367
F10 61,911 2,419
S11 61,819 2,353
F11 59,150 2,385
S12 60,198 2,337
Pre-req F12 60,911 2,039
S13 60,809 2,076
F13 59,696 2,037
S14 58,025 1,931
SCC and HIST Duplicated Enrollments
by Term
Table B.2
Term
HIST Fill
Rate
SCC Lecture
Fill Rate
Fall 2004 86.1 73.19
Spring 2005 78.6 72.54
Fall 2005 73.1 69.74
Spring 2006 75.9 69.51
Fall 2006 76.7 72.99
Spring 2007 78.2 73.10
Fall 2007 83.0 73.87
Spring 2008 79.9 73.85
Fall 2008 94.7 83.26
Spring 2009 93.6 84.33
Fall 2009 99.8 88.28
Spring 2010 107.6 95.68
Fall 2010 98.1 92.29
Spring 2011 107.4 96.97
Fall 2011 99.0 88.33
Spring 2012 104.3 94.15
Pre-req Fall 2012 85.8 91.92
Spring 2013 89.9 96.80
Fall 2013 89.9 90.95
Spring 2014 88.8 90.82
Fill rates for HIST and ALL SCC Lecture
Sections
FINAL REPORT (11/13/14)
SCC PRIE Office, page 18
Appendix C: Disproportionate Impact Table C.1
Ethnicity F09 S10 F10 S11 F11 S12 F12 S13 F13 S14
S14 HIST
Percent Index
African American 9.7 11.5 8.3 8.6 6.8 6.2 5.0 4.5 4.7 3.8 12.8 30.0
Asian 17.2 17.6 15.3 15.1 12.5 19.8 15.0 17.9 14.0 17.9 15.1 118.9
Filipino - 2.0 4.2 0.7 - 1.2 2.5 3.0 9.3 - 2.3 0.0
Hispanic/Latino 24.1 25.0 27.1 27.3 30.7 23.5 15.0 20.9 18.6 28.2 27.4 102.9
Multi-Race 3.4 6.8 7.6 2.9 6.8 3.7 2.5 4.5 7.0 6.4 6.9 92.9
Native American 2.8 0.7 - - 1.1 - - - - - 1.0 0.0
Other Non-White 1.4 0.7 - - 1.1 - - 3.0 - - 1.3 0.0
Pacific Islander 2.8 - 2.1 2.9 2.3 5.0 - - 0.8 0.0
Unknown 5.5 11.5 10.4 11.5 15.9 11.1 10.0 1.5 2.3 5.1 1.6 320.5
White 33.1 24.3 25.0 30.9 22.7 34.6 45.0 44.8 44.2 38.5 30.7 125.3
Proportional i ty index: <100 is underrepresentation; >100 is overrepresentation of the group.
Ethnicity F09 S10 F10 S11 F11 S12 F12 S13 F13 S14
S14 HIST
Percent Index
African American 9.1 8.3 6.3 8.3 13.7 10.2 8.6 9.1 5.6 8.1 12.8 63.0
Asian 23.8 17.4 17.7 13.2 16.8 11.4 11.4 11.7 15.3 19.4 15.1 128.2
Filipino 0.7 0.7 2.1 1.4 1.1 3.4 - 1.3 6.9 1.6 2.3 70.1
Hispanic/Latino 22.4 29.2 24.0 22.2 15.8 23.9 30.0 35.1 20.8 33.9 27.4 123.6
Multi-Race 1.4 7.6 2.1 7.6 10.5 2.3 10.0 7.8 11.1 1.6 6.9 23.4
Native American 2.1 - 1.0 0.7 - - - - 1.6 1.0 161.3
Other Non-White 1.4 2.1 - 0.7 - 2.3 - - - - 1.3 0.0
Pacific Islander 1.4 - 3.1 0.7 - 1.1 - 2.6 2.8 1.6 0.8 201.6
Unknown 6.3 9.7 9.4 6.9 7.4 8.0 11.4 - - 1.6 1.6 100.8
White 31.5 25.0 34.4 38.2 34.7 37.5 28.6 32.5 37.5 30.6 30.7 99.8
Proportional i ty index: <100 is underrepresentation; >100 is overrepresentation of the group.
Proportionality
Index (S14 data)
HIST 300 Ethnicity by Term
HIST 302 Ethnicity by Term
Proportionality
Index (S14 data)

FINAL REPORT (11/13/14)
SCC PRIE Office, page 19
Table C.2
Ethnicity F09 S10 F10 S11 F11 S12 F12 S13 F13 S14
S14 HIST
Percent Index
African American 1.3 5.6 7.2 6.0 4.0 8.5 5.0 6.8 2.9 12.9 12.8 100.4
Asian 13.0 16.7 20.5 16.0 17.3 10.0 16.7 15.1 5.7 14.3 15.1 94.6
Filipino - - - 2.0 - 0.8 3.3 1.4 - - 2.3 0.0
Hispanic/Latino 24.7 16.7 20.5 26.0 22.7 26.2 21.7 21.9 32.9 28.6 27.4 104.3
Multi-Race 10.4 3.7 6.0 6.0 8.0 6.9 10.0 11.0 5.7 7.1 6.9 103.5
Native American - - 1.2 - - - 1.7 1.4 1.4 1.4 1.0 142.9
Other Non-White 2.6 1.9 - 1.3 - - 2.7 - 1.4 1.3 109.9
Pacific Islander - - - 4.0 1.5 1.7 1.4 1.4 - 0.8 0.0
Unknown 5.2 5.6 9.6 6.0 17.3 10.0 16.7 2.7 1.4 - 1.6 0.0
White 42.9 50.0 34.9 34.0 29.3 36.2 23.3 35.6 48.6 34.3 30.7 111.7
Proportional i ty index: <100 is underrepresentation; >100 is overrepresentation of the group.
Ethnicity F09 S10 F10 S11 F11 S12 F12 S13 F13 S14
S14 HIST
Percent Index
African American 3.8 5.3 4.8 7.3 9.9 10.3 6.5 6.9 3.0 10.5 12.8 82.2
Asian 9.0 16.0 25.0 16.1 12.3 12.1 5.2 15.7 21.2 12.3 15.1 81.3
Filipino 3.8 2.3 - 0.8 2.5 1.9 1.3 - - 1.8 2.3 76.3
Hispanic/Latino 19.2 22.9 25.0 25.0 32.1 27.1 26.0 24.5 18.2 14.0 27.4 51.2
Multi-Race 6.4 5.3 7.1 4.0 4.9 4.7 9.1 7.8 6.1 - 6.9 0.0
Native American 1.3 - 1.2 - - 0.9 - - - - 1.0 0.0
Other Non-White 1.3 2.3 - 2.4 - - 1.3 - - 1.8 1.3 135.0
Pacific Islander 3.8 - - - 2.5 0.9 - 2.9 3.0 - 0.8 0.0
Unknown 6.4 3.8 8.3 8.1 7.4 10.3 13.0 3.9 6.1 3.5 1.6 219.3
White 44.9 42.0 28.6 36.3 28.4 31.8 37.7 38.2 42.4 56.1 30.7 182.9
Proportional i ty index: <100 is underrepresentation; >100 is overrepresentation of the group.
Proportionality
Index (S14 data)
Proportionality
Index (S14 data)
HIST 307 Ethnicity by Term
HIST 308 Ethnicity by Term
FINAL REPORT (11/13/14)
SCC PRIE Office, page 20
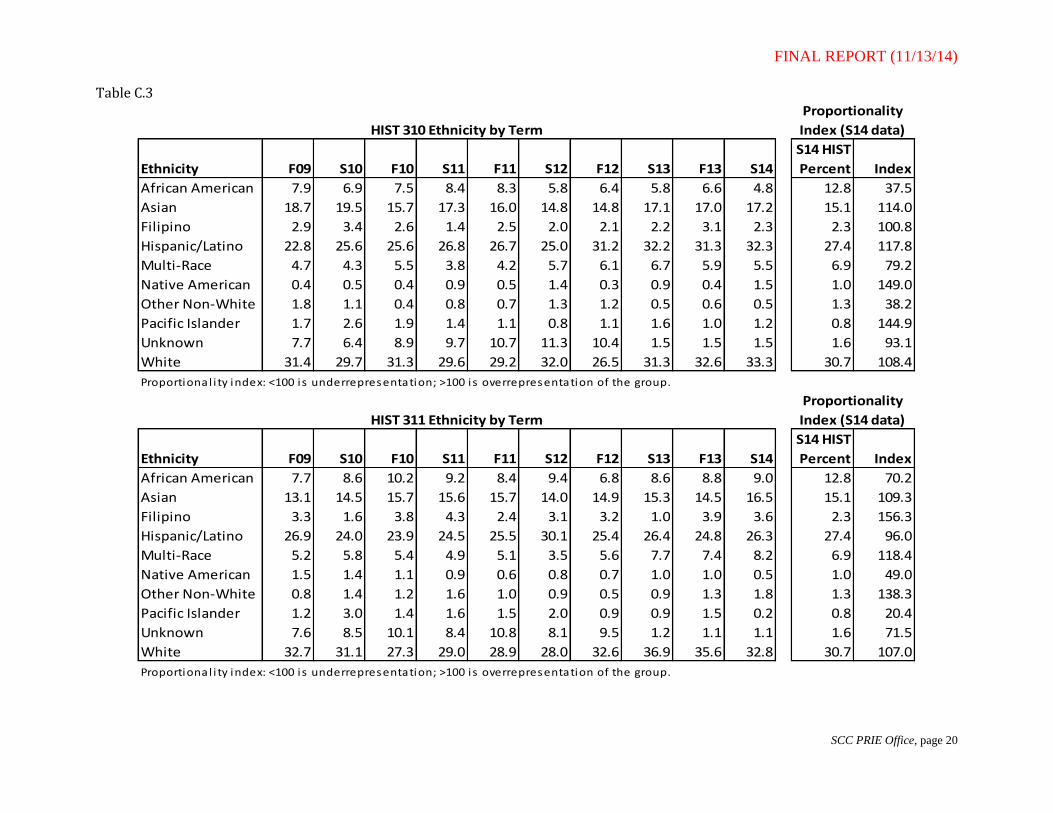
Table C.3
Ethnicity F09 S10 F10 S11 F11 S12 F12 S13 F13 S14
S14 HIST
Percent Index
African American 7.9 6.9 7.5 8.4 8.3 5.8 6.4 5.8 6.6 4.8 12.8 37.5
Asian 18.7 19.5 15.7 17.3 16.0 14.8 14.8 17.1 17.0 17.2 15.1 114.0
Filipino 2.9 3.4 2.6 1.4 2.5 2.0 2.1 2.2 3.1 2.3 2.3 100.8
Hispanic/Latino 22.8 25.6 25.6 26.8 26.7 25.0 31.2 32.2 31.3 32.3 27.4 117.8
Multi-Race 4.7 4.3 5.5 3.8 4.2 5.7 6.1 6.7 5.9 5.5 6.9 79.2
Native American 0.4 0.5 0.4 0.9 0.5 1.4 0.3 0.9 0.4 1.5 1.0 149.0
Other Non-White 1.8 1.1 0.4 0.8 0.7 1.3 1.2 0.5 0.6 0.5 1.3 38.2
Pacific Islander 1.7 2.6 1.9 1.4 1.1 0.8 1.1 1.6 1.0 1.2 0.8 144.9
Unknown 7.7 6.4 8.9 9.7 10.7 11.3 10.4 1.5 1.5 1.5 1.6 93.1
White 31.4 29.7 31.3 29.6 29.2 32.0 26.5 31.3 32.6 33.3 30.7 108.4
Proportional i ty index: <100 is underrepresentation; >100 is overrepresentation of the group.
Ethnicity F09 S10 F10 S11 F11 S12 F12 S13 F13 S14
S14 HIST
Percent Index
African American 7.7 8.6 10.2 9.2 8.4 9.4 6.8 8.6 8.8 9.0 12.8 70.2
Asian 13.1 14.5 15.7 15.6 15.7 14.0 14.9 15.3 14.5 16.5 15.1 109.3
Filipino 3.3 1.6 3.8 4.3 2.4 3.1 3.2 1.0 3.9 3.6 2.3 156.3
Hispanic/Latino 26.9 24.0 23.9 24.5 25.5 30.1 25.4 26.4 24.8 26.3 27.4 96.0
Multi-Race 5.2 5.8 5.4 4.9 5.1 3.5 5.6 7.7 7.4 8.2 6.9 118.4
Native American 1.5 1.4 1.1 0.9 0.6 0.8 0.7 1.0 1.0 0.5 1.0 49.0
Other Non-White 0.8 1.4 1.2 1.6 1.0 0.9 0.5 0.9 1.3 1.8 1.3 138.3
Pacific Islander 1.2 3.0 1.4 1.6 1.5 2.0 0.9 0.9 1.5 0.2 0.8 20.4
Unknown 7.6 8.5 10.1 8.4 10.8 8.1 9.5 1.2 1.1 1.1 1.6 71.5
White 32.7 31.1 27.3 29.0 28.9 28.0 32.6 36.9 35.6 32.8 30.7 107.0
Proportional i ty index: <100 is underrepresentation; >100 is overrepresentation of the group.
Proportionality
Index (S14 data)
Proportionality
Index (S14 data)
HIST 310 Ethnicity by Term
HIST 311 Ethnicity by Term

FINAL REPORT (11/13/14)
SCC PRIE Office, page 21
Table C.4
Ethnicity F09 S10 F10 S11 F11 S12 F12 S13 F13 S14
S14 HIST
Percent Index
African American 61.3 55.8 52.7 50.7 41.1 38.1 38.3 47.4 38.5 51.3 12.8 401.0
Asian 4.8 3.8 3.1 6.7 10.1 5.1 14.0 6.1 11.1 10.6 15.1 70.3
Filipino - - 0.8 5.2 3.1 2.8 1.9 0.9 1.7 0.9 2.3 38.5
Hispanic/Latino 9.7 13.5 13.2 9.7 15.5 21.0 15.0 18.4 21.4 17.7 27.4 64.6
Multi-Race 7.3 8.3 7.8 8.2 7.0 7.4 10.3 15.8 12.8 9.7 6.9 141.1
Native American 1.6 - 0.8 - 0.8 0.6 1.9 - - 2.7 1.0 265.5
Other Non-White 1.6 0.6 2.3 2.2 2.3 1.1 - - 1.7 0.9 1.3 68.1
Pacific Islander 1.6 1.9 3.1 - 1.6 1.7 - - 0.9 1.8 0.8 221.2
Unknown 8.1 9.6 8.5 9.0 10.1 10.2 12.1 - - - 1.6 0.0
White 4.0 6.4 7.8 8.2 8.5 11.9 6.5 11.4 12.0 4.4 30.7 14.4
Proportional i ty index: <100 is underrepresentation; >100 is overrepresentation of the group.
Ethnicity F09 S10 F10 S11 F11 S12 F12 S13 F13 S14
S14 HIST
Percent Index
African American 57.3 47.6 48.3 50.7 46.3 47.4 37.2 38.6 50.0 47.8 12.8 373.3
Asian 8.2 8.8 4.2 6.6 6.6 5.3 6.4 7.6 3.1 8.8 15.1 58.6
Filipino - 0.7 - - 0.7 3.8 1.1 3.0 1.0 1.8 2.3 77.0
Hispanic/Latino 10.9 14.3 14.2 12.5 17.6 17.3 18.1 22.0 16.3 18.6 27.4 67.8
Multi-Race 8.2 8.2 7.5 7.4 9.6 7.5 12.8 9.1 9.2 9.7 6.9 141.1
Native American - - 0.8 0.7 2.2 - 2.1 - - - 1.0 0.0
Other Non-White 0.9 - 0.8 2.9 - - 1.1 - 2.0 2.7 1.3 204.2
Pacific Islander 0.9 0.7 - 0.7 - - 2.1 0.8 1.0 2.7 0.8 331.9
Unknown 7.3 12.2 15.8 11.8 8.1 12.8 12.8 1.5 2.0 0.9 1.6 55.3
White 6.4 7.5 8.3 6.6 8.8 6.0 6.4 17.4 15.3 7.1 30.7 23.1
Proportional i ty index: <100 is underrepresentation; >100 is overrepresentation of the group.
HIST 320 Ethnicity by Term
Proportionality
Index (S14 data)
Proportionality
Index (S14 data)HIST 321 Ethnicity by Term

FINAL REPORT (11/13/14)
SCC PRIE Office, page 22
Table C.5
Ethnicity F09 S10 F10 S11 F11 S12 F12 S13 F13 S14
S14 HIST
Percent Index
African American - - - 17.5 6.3 19.0 4.0 8.0 9.5 - 12.8 n/a
Asian - - - 7.5 9.4 7.1 12.0 20.0 4.8 - 15.1 n/a
Filipino - - - 2.5 - 2.4 8.0 - - - 2.3 n/a
Hispanic/Latino - - - 27.5 28.1 40.5 24.0 20.0 19.0 - 27.4 n/a
Multi-Race - - - 10.0 18.8 2.4 4.0 8.0 19.0 - 6.9 n/a
Native American - - - - 6.3 - - - - - 1.0 n/a
Other Non-White - - - 2.5 - - 4.0 - - - 1.3 n/a
Pacific Islander - - - 2.5 3.1 - - 8.0 - - 0.8 n/a
Unknown - - - 10.0 9.4 11.9 16.0 - - - 1.6 n/a
White - - - 20.0 18.8 16.7 28.0 36.0 47.6 - 30.7 n/a
Proportional i ty index: <100 is underrepresentation; >100 is overrepresentation of the group.
Ethnicity F09 S10 F10 S11 F11 S12 F12 S13 F13 S14
S14 HIST
Percent Index
African American 47.2 41.0 39.0 42.5 34.1 - 46.3 41.9 40.0 32.4 12.8 252.8
Asian - 10.3 - 5.0 11.4 - 2.4 - 2.9 - 15.1 0.0
Filipino - - - - - - - 6.5 - 5.9 2.3 255.8
Hispanic/Latino 5.6 10.3 19.5 17.5 13.6 - 22.0 9.7 25.7 8.8 27.4 32.2
Multi-Race 5.6 10.3 7.3 7.5 4.5 - 2.4 6.5 8.6 17.6 6.9 255.8
Native American 2.8 - - 2.5 2.3 - - 3.2 2.9 - 1.0 0.0
Other Non-White 2.8 - 2.4 2.5 - - - - 2.9 - 1.3 0.0
Pacific Islander - - 2.4 - - - 2.4 - - - 0.8 0.0
Unknown 11.1 15.4 14.6 20.0 13.6 - 7.3 - 2.9 2.9 1.6 183.8
White 25.0 12.8 14.6 2.5 20.5 - 17.1 32.3 14.3 32.4 30.7 105.4
Proportional i ty index: <100 is underrepresentation; >100 is overrepresentation of the group.
Proportionality
Index (S14 data)
Proportionality
Index (S14 data)
HIST 344 Ethnicity by Term
HIST 360 Ethnicity by Term

FINAL REPORT (11/13/14)
SCC PRIE Office, page 23
Table C.6
Ethnicity
F09
(364)
S10
(365)
F10
(364)
S11
(365)
F11
(364)
S12
(365)
F12
(364)
S13
(365)
F13
(364) S14
S14 HIST
Percent Index
African American 5.4 4.7 7.1 5.3 2.3 2.3 - 3.4 10.3 - 12.8 n/a
Asian 51.4 30.2 28.6 28.9 46.5 25.6 46.3 24.1 13.8 - 15.1 n/a
Filipino 2.7 2.3 - 5.3 7.0 9.3 2.4 3.4 10.3 - 2.3 n/a
Hispanic/Latino 16.2 11.6 16.7 18.4 7.0 7.0 19.5 6.9 6.9 - 27.4 n/a
Multi-Race 10.8 9.3 7.1 7.9 2.3 14.0 - 13.8 24.1 - 6.9 n/a
Native American - - - - - - - - - - 1.0 n/a
Other Non-White 2.7 - 2.4 - - - - 3.4 - - 1.3 n/a
Pacific Islander - - - - - - - - 3.4 - 0.8 n/a
Unknown - 9.3 11.9 5.3 16.3 9.3 9.8 - - - 1.6 n/a
White 10.8 32.6 26.2 28.9 18.6 32.6 22.0 44.8 31.0 - 30.7 n/a
Proportional i ty index: <100 is underrepresentation; >100 is overrepresentation of the group.
Ethnicity F09 S10 F10 S11 F11 S12 F12 S13 F13 S14
S14 HIST
Percent Index
African American - 1.9 2.5 6.7 - - - - - - 12.8 0.0
Asian 2.0 - 2.5 2.2 4.7 - - 3.8 - 6.9 15.1 45.7
Filipino 2.0 - - - - - - - - - 2.3 0.0
Hispanic/Latino 77.6 74.1 67.5 84.4 81.4 92.9 81.3 73.1 72.4 72.4 27.4 264.3
Multi-Race 2.0 - 2.5 - 2.3 - 12.5 7.7 3.4 - 6.9 0.0
Native American - 1.9 - - - - - - - - 1.0 0.0
Other Non-White 6.1 - - - - 2.4 - - - - 1.3 0.0
Pacific Islander - - - 2.2 - - - - - - 0.8 0.0
Unknown 4.1 9.3 12.5 - 4.7 - - - 3.4 - 1.6 0.0
White 6.1 9.3 12.5 4.4 7.0 4.8 6.3 15.4 20.7 20.7 30.7 67.4
Proportional i ty index: <100 is underrepresentation; >100 is overrepresentation of the group.
Proportionality
Index (S14 data)
Proportionality
Index (S14 data)
HIST 364 or 365 Ethnicity by Term
HIST 373 Ethnicity by Term
FINAL REPORT (11/13/14)
SCC PRIE Office, page 24
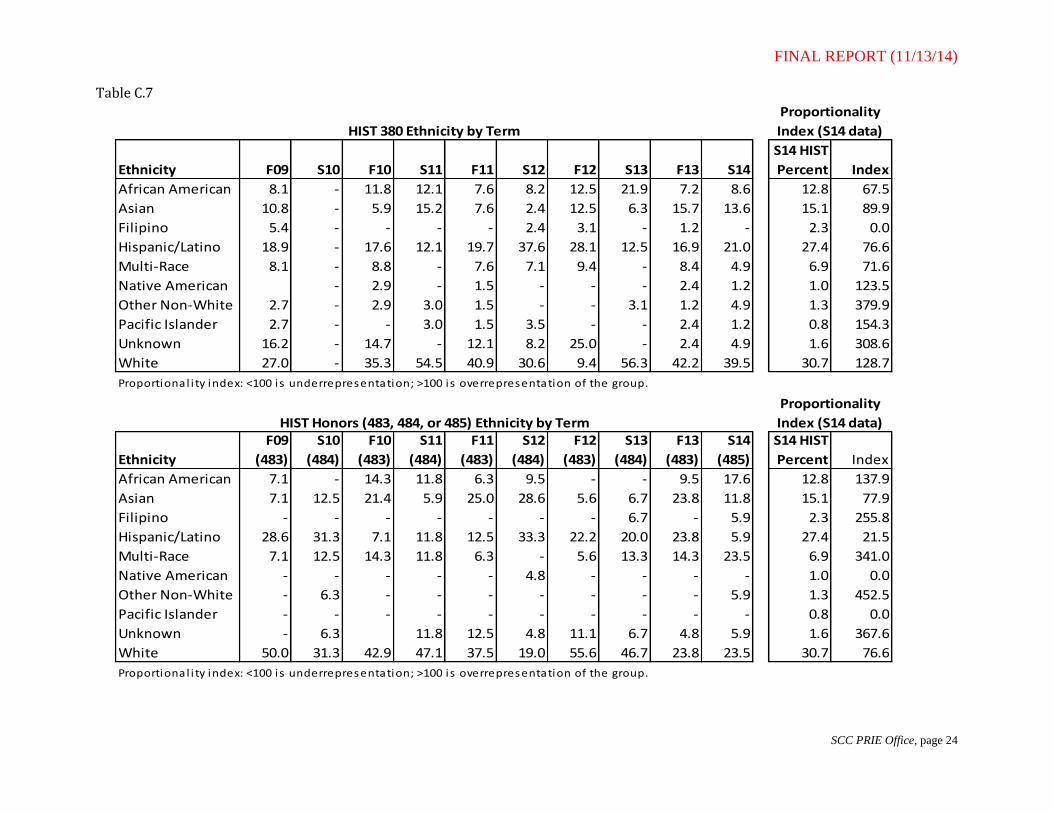
Table C.7
Ethnicity F09 S10 F10 S11 F11 S12 F12 S13 F13 S14
S14 HIST
Percent Index
African American 8.1 - 11.8 12.1 7.6 8.2 12.5 21.9 7.2 8.6 12.8 67.5
Asian 10.8 - 5.9 15.2 7.6 2.4 12.5 6.3 15.7 13.6 15.1 89.9
Filipino 5.4 - - - - 2.4 3.1 - 1.2 - 2.3 0.0
Hispanic/Latino 18.9 - 17.6 12.1 19.7 37.6 28.1 12.5 16.9 21.0 27.4 76.6
Multi-Race 8.1 - 8.8 - 7.6 7.1 9.4 - 8.4 4.9 6.9 71.6
Native American - 2.9 - 1.5 - - - 2.4 1.2 1.0 123.5
Other Non-White 2.7 - 2.9 3.0 1.5 - - 3.1 1.2 4.9 1.3 379.9
Pacific Islander 2.7 - - 3.0 1.5 3.5 - - 2.4 1.2 0.8 154.3
Unknown 16.2 - 14.7 - 12.1 8.2 25.0 - 2.4 4.9 1.6 308.6
White 27.0 - 35.3 54.5 40.9 30.6 9.4 56.3 42.2 39.5 30.7 128.7
Proportional i ty index: <100 is underrepresentation; >100 is overrepresentation of the group.
Ethnicity
F09
(483)
S10
(484)
F10
(483)
S11
(484)
F11
(483)
S12
(484)
F12
(483)
S13
(484)
F13
(483)
S14
(485)
S14 HIST
Percent Index
African American 7.1 - 14.3 11.8 6.3 9.5 - - 9.5 17.6 12.8 137.9
Asian 7.1 12.5 21.4 5.9 25.0 28.6 5.6 6.7 23.8 11.8 15.1 77.9
Filipino - - - - - - - 6.7 - 5.9 2.3 255.8
Hispanic/Latino 28.6 31.3 7.1 11.8 12.5 33.3 22.2 20.0 23.8 5.9 27.4 21.5
Multi-Race 7.1 12.5 14.3 11.8 6.3 - 5.6 13.3 14.3 23.5 6.9 341.0
Native American - - - - - 4.8 - - - - 1.0 0.0
Other Non-White - 6.3 - - - - - - - 5.9 1.3 452.5
Pacific Islander - - - - - - - - - - 0.8 0.0
Unknown - 6.3 11.8 12.5 4.8 11.1 6.7 4.8 5.9 1.6 367.6
White 50.0 31.3 42.9 47.1 37.5 19.0 55.6 46.7 23.8 23.5 30.7 76.6
Proportional i ty index: <100 is underrepresentation; >100 is overrepresentation of the group.
Proportionality
Index (S14 data)
Proportionality
Index (S14 data)HIST Honors (483, 484, or 485) Ethnicity by Term
HIST 380 Ethnicity by Term
FINAL REPORT (11/13/14)
SCC PRIE Office, page 25
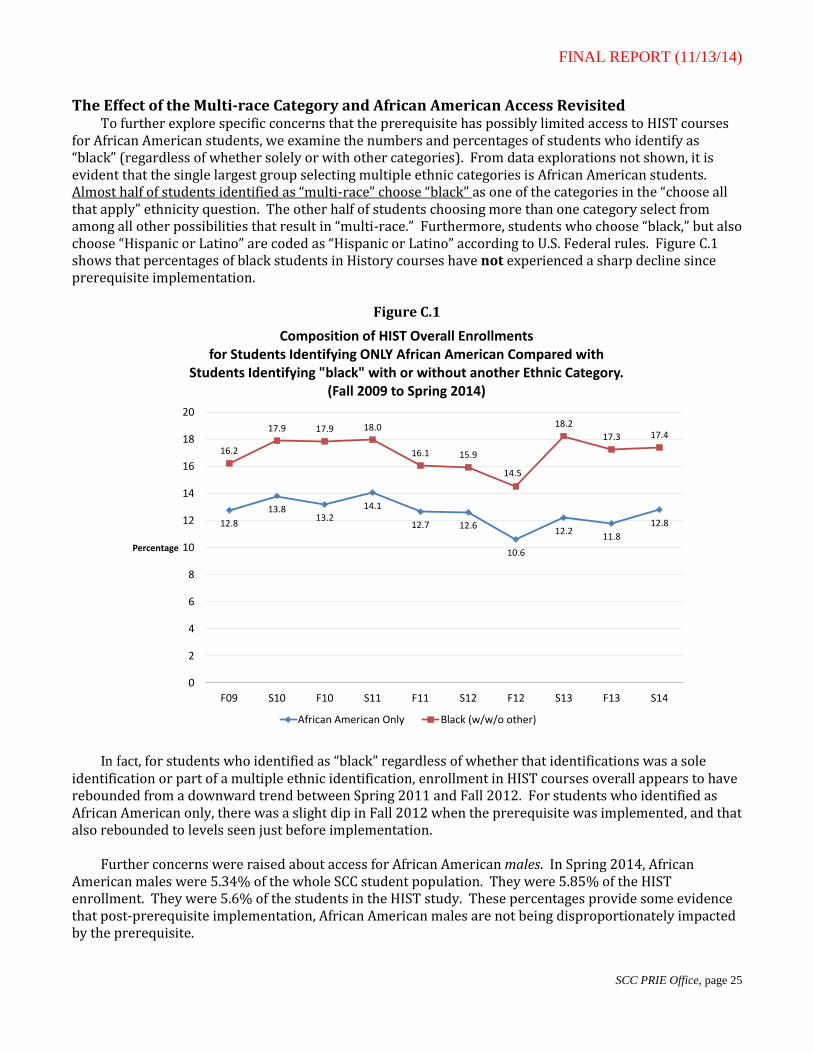
The Effect of the Multi-race Category and African American Access Revisited To further explore specific concerns that the prerequisite has possibly limited access to HIST courses
for African American students, we examine the numbers and percentages of students who identify as “black” (regardless of whether solely or with other categories). From data explorations not shown, it is evident that the single largest group selecting multiple ethnic categories is African American students. Almost half of students identified as “multi-race” choose “black” as one of the categories in the “choose all that apply” ethnicity question. The other half of students choosing more than one category select from among all other possibilities that result in “multi-race.” Furthermore, students who choose “black,” but also choose “Hispanic or Latino” are coded as “Hispanic or Latino” according to U.S. Federal rules. Figure C.1 shows that percentages of black students in History courses have not experienced a sharp decline since prerequisite implementation.
Figure C.1
In fact, for students who identified as “black” regardless of whether that identifications was a sole identification or part of a multiple ethnic identification, enrollment in HIST courses overall appears to have rebounded from a downward trend between Spring 2011 and Fall 2012. For students who identified as African American only, there was a slight dip in Fall 2012 when the prerequisite was implemented, and that also rebounded to levels seen just before implementation.
Further concerns were raised about access for African American males. In Spring 2014, African American males were 5.34% of the whole SCC student population. They were 5.85% of the HIST enrollment. They were 5.6% of the students in the HIST study. These percentages provide some evidence that post-prerequisite implementation, African American males are not being disproportionately impacted by the prerequisite.
12.8
13.813.2
14.1
12.7 12.6
10.6
12.211.8
12.8
16.2
17.9 17.9 18.0
16.1 15.9
14.5
18.2
17.3 17.4
0
2
4
6
8
10
12
14
16
18
20
F09 S10 F10 S11 F11 S12 F12 S13 F13 S14
Percentage
Composition of HIST Overall Enrollments for Students Identifying ONLY African American Compared with
Students Identifying "black" with or without another Ethnic Category.(Fall 2009 to Spring 2014)
African American Only Black (w/w/o other)