FINAL PROJECT REPORT MODOT PROJECT RI 99-030 South of...
74
FINAL PROJECT REPORT MODOT PROJECT RI 99-030 Investigation of Agents of Practical Use to Stabilize Slopes and Erosion Along the I-55 Corridor South of Sikeston, Missouri: Phases I & II Dr. Thomas M. Petry, P.E. Civil Engineering Department University of Missouri-Rolla Date Submitted: April 19, 2001 The opinions, findings, and conclusions expressed in this publication are those of the principal investigator and the Research, Development and Technology Division of the Missouri Department of Transportation. They are not necessarily those of the U.S. Department of Transportation, Federal Highway Administration. This report does not constitute a standard or regulation.
Transcript of FINAL PROJECT REPORT MODOT PROJECT RI 99-030 South of...

FINAL PROJECT REPORT
MODOT PROJECT RI 99-030
Investigation of Agents of Practical Use to Stabilize Slopes and Erosion Along the I-55 Corridor South of Sikeston, Missouri: Phases I & II
Dr. Thomas M. Petry, P.E. Civil Engineering Department University of Missouri-Rolla
Date Submitted: April 19, 2001
The opinions, findings, and conclusions expressed in this publication are those of the principal investigator and the Research, Development and Technology Division of the Missouri Department of Transportation. They are not necessarily those of the U.S. Department of Transportation, Federal Highway Administration. This report does not constitute a standard or regulation.
TECHNICAL REPORT DOCUMENTATION PAGE
1. Report No. 2. Government Accession No. 3. Recipient's Catalog No. RDT 99-030 4. Title and Subtitle 5. Report Date
April, 2001 6. Performing Organization Code
Investigation of Agents of Practical Use to Stabilize Slopes and Erosion Along the I-55 Corridor South of Sikeston, Missouri
UMR 7. Author(s) 8. Performing Organization Report No. Thomas M. Petry, Ph.D., P.E. 9. Performing Organization Name and Address 10. Work Unit No.
11. Contract or Grant No.
Civil Engineering Department University of Missouri-Rolla 1870 Miner Circle, Rolla, MO 65409-0030 RI 99-030 12. Sponsoring Agency Name and Address 13. Type of Report and Period Covered
Final Report 14. Sponsoring Agency Code
Missouri Department of Transportation Research, Development and Technology P. O. Box 270-Jefferson City, MO 65102 MoDOT 15. Supplementary Notes The investigation was conducted in cooperation with the U. S. Department of Transportation, Federal Highway Administration. 16. Abstract Disturbed, remolded and undisturbed samples of Mississippi River embayment soils were tested for the use of agents to improve their behavior, to reduce their erosion and to overcome their problematic tendencies for slope failures along the I-55 corridor south of Sikeston, Missouri. Both a mixture of 50% quicklime-50% class C fly ash from Sikeston, and lime kiln dust (Code L) were found effective when added to the soils at the 12% by dry weight of soil level. The addition of these agents, because the treatments are believed to be permanent, is economical because of the elimination of almost yearly rebuilding of slopes in the area. 17. Key Words 18. Distribution Statement Slope Failures, Soil Stabilization, Alluvial Soils, Lime, Fly Ash, Lime Kiln Dust, Portland cement, Direct Shear Testing of Stabilized Soils.
o restrictions. This document is available to the public through National Technical Information Center, Springfield, Virginia 22161
19. Security Classification (of this report) 20. Security Classification (of this page) 21. No. of Pages 22. Price Unclassified Unclassified
Form DOT F 1700.7 (06/98)

ACKNOWLEDGEMENTS
The principal investigator wished to thank the Missouri Department of Transportation for their support of this project. The Research, Development and Technology Division was instrumental in providing this support. The Material Division, especially the Geotechnical Branch, was instrumental in approving the project concept and providing support. The principal investigator wishes to recognize the many fine efforts of Tom Fennessey, senior materials research engineer for MoDOT during this project. His coordination and assistance were instrumental in its success. The principal investigator wishes to thank the personnel of District 10 of MoDOT who assisted in this project. Mike Myers, District Geologist was involved in initially finding slopes, providing the Fly Ash used, and coordinating sampling efforts. William Chasteen and Ron Underwood, Operations Engineers, were helpful in identifying the problem and slopes where failures had occurred. The maintenance personnel at Hayti provided sampling sites and the equipment and labor to obtain the large bulk samples. The success of this project was dependent on the efforts of all these individuals. The principal investigator wishes to thank the Civil Engineering Department at UMR for the facilities to conduct this research and the student research assistants who worked on the project. Mr. Bob Myers, Graduate Research Assistant, conducted most of the preparation and testing of soils, supervised an undergraduate research assistant and coordinated and managed the laboratory. He coordinated equipment and procedures being used, and provided valuable input for this report. Mr. Bryan Gregory, Undergraduate Research Assistant, joined the team on this project for the summer 2000 semester. He earned upper level credit for his participation. He assisted in preparation of soil samples, manufacturing of specimens for test and accomplishment of standard soil mechanics testing.

EXECUTIVE SUMMARY The incidents of shallow to moderately deep slope failures in fill slopes along the I-55 corridor south of Sikeston, Missouri, have been a frequent and pose continuous maintenance problems for MoDOT personnel. These fills have been constructed of Mississippi River embayment soils and are generally as high as needed for clearance over I-55 traffic. Historically, these slope failures have generally been repaired by pushing the failed materials back up on the slope utilizing available maintenance equipment. On occasion they have been repaired by cutting into the slope and removal of material, which is then compacted in horizontal layers to reform the slope. Even when this procedure is followed the repaired slopes have eventually started to fail again. The project reported was undertaken to determine the effectiveness of applicable agents that could be practically applied to the soils in the failing slopes so as to dramatically or permanently reduce the need for slope rebuilding. Large bulk samples were taken from two sites near Hayti of the near surface materials of the slopes where failures had been occurring, so that these samples were of disturbed and of remolded soils. Undisturbed samples were taken using borings that penetrated the fills from the top of the slopes above where the bulk samples were taken. The undisturbed samples were subjected to identification tests, unconfined compression tests and direct shear tests, both peak and residual. These materials were determined to vary significantly with depth and with respect to the bulk samples taken, as would be expected for Mississippi River embayment materials. The bulk samples were tested for their identification test properties, their compaction characteristics, their 3-dimensional swelling tendencies, and unconfined and direct shear strengths. The bulk samples were treated and subjected to pH and Atterberg Limits testing to determine their Modification Optimums for the agents, and for their unconfined compression strengths to determine their Stabilization Optimums of agents added. Agents considered for use included Lime Kiln Dust, Quicklime, Portland cement, and combinations of Quicklime and a class C Fly Ash. The treated materials were also tested for their 3-dimensional swelling tendencies, for their direct shear strengths, both peak and residual, and for their resistance to break down under Wet-Dry and Freeze-Thaw testing. The study concluded that the soils of the Mississippi River embayment, as represented by the samples taken, can be modified by all the agents used to effectively reduce their shrink-swell tendencies and can be stabilized to differing degrees by the agents tested. The most effective of the agents tested was a 50% Quicklime to 50% class C Fly Ash from Sikeston combination and the second most effective was Lime Kiln Dust (Code L). The use of 12% of either agent by dry weight of soil is recommended. The cost of placing these in the slope as it is repaired in layers, over rebuilding without them in layers, is more than offset by the permanence of slope stability for the life of the slope, over the costs of rebuilding the slopes periodically.

TABLE OF CONTENTS
List of Figures - List of Tables - Introduction 1 Objective 1 Present Conditions 1 Soil Stabilization Concepts 3 Technical Approach 5 Undisturbed Samples 14 Stabilizing Agents 21 Agents Applied to Soils 21 Three-Dimensional Swell Testing of Modified Soils 27 Selection of Percent Agents for Strength Testing 29 Unconfined Compression Testing for Stabilization Optimum Selection 29 Direct Shear Testing 34 Wet-Dry and Freeze-Thaw Testing 36 Slope Stability Analyses 38 Economic Considerations 39 Results and Discussion 39 Conclusions 41 Recommendations 42 Implementation Plan 42 Principal Investigator and Project Members 42 Implementation Objective 43 Appendix A: Non-Standard Test Procedures 44 Appendix B: Detailed Results 47

LIST OF FIGURES
Figure 1. Slope Failure at MM 24 of I-55, East Access Road 2 Figure 2. Slope Failure at MM 17 of I-55, North Bound Bridge 2 Figure 3. Technical Approach Flow Chart 7 Figure 4. MM 24 Bulk Sample Site with Slope Failure 9 Figure 5. Sampling Trench for Silty Soil at MM 24 10 Figure 6. Sampling Trench for Clayey Soil at MM 17 10 Figure 7. Natural Grain Size Analysis of Bulk Samples 12 Figure 8. Standard Proctor Compaction of Bulk Samples 13 Figure 9. Boring Number V-00-26, East Service Road of I-55 at MM 24 15 Figure 10. Boring Number V-00-27, Between I-55 S-N and I-155 W, MM 17 16 Figure 11. Boring Log for Hole V-00-26, MM 24, I-55 17 Figure 12. Boring Log for Hole V-00-27, MM 17, I-55 at I-155 18 Figure 13. Hydrometer Grain Size Analysis of Undisturbed Silt Samples, MM 24 19 Figure 14. Hydrometer Grain Size Analysis of Undisturbed Clay Samples, MM 17 19 Figure 15. pH of Stabilizing Agents in Water 26 Figure 16. Typical pH Test Curve – Clay and Quick Lime 26 Figure 17. Typical Atterberg Limits Series Curve – Clay and Quick Lime 27 Figure 18. 28 Day Unconfined Compression Strengths for Treated Clay 33 Figure 19. 28 Day Unconfined Compression Strengths for Treated Silt 33

LIST OF TABLES
Table A. Natural Properties of Bulk Samples 11 Table B. 3 Dimensional Swell of the Natural Soil 11 Table C. Natural Properties of the Undisturbed Samples 20 Table D. Atterberg Limits of Undisturbed Samples 20 Table E. Atterberg Limits Series Results 22 Table F. Modification Optimums 25 Table G. Results of the Standard Proctor Compaction for
Natural and Treated Soils 25 Table H. 3-D Swell Performance of Treated Clay 28 Table I. 3-D Swell Performance of Treated Silt 28 Table J. Unconfined Compression Results-Undisturbed 29 Table K. Unconfined Compression Results-Bulk 30 Table L. Average Unconfined Compression Strengths of Treated Clay (psi) 30 Table M. Average Unconfined Compression Strengths of Treated Silt (psi) 31 Table N. Direct Shear Test Results for Bulk Clay-Untreated and Treated -
Average of Two Tests 35 Table O. Direct Shear Test Results for Bulk Silt-Untreated and Treated -
Average of Two Tests 35 Table P. Direct Shear Test Results-Undisturbed 36 Table Q. Wet-Dry, Freeze-Thaw - Bulk Silt Soil 37 Table R. Wet-Dry, Freeze-Thaw - Bulk Clay Soil 37 Table S. Slope Stability Results - Factors of Safety 38

1
FINAL PROJECT REPORT - MODOT PROJECT RI 99-030
INTRODUCTION Project Title: Investigation of Agents of Practical Use to Stabilize Slopes and Erosion Along the
I-55 Corridor South of Sikeston, Missouri.
Project Period: January 1, 2000 through December 31, 2000 (Extended to March 31, 2001)
Submitted to: Missouri Department of Transportation Contact: Tom Fennessey, Senior Materials Engineer Research Agencies: The Curators of the University of Missouri, University of Missouri-Rolla Rolla, Missouri 65401
Principal Investigator: Dr. Thomas M. Petry
OBJECTIVE A laboratory investigation of the efficacy of agents which may be applied to slopes of alluvial silt soils and the Sharkey clay soils along the I-55 corridor south of Sikeston, Missouri, to provide economical stability which will prevent slope failures and surface erosion in existing slopes and those of future construction in the area.
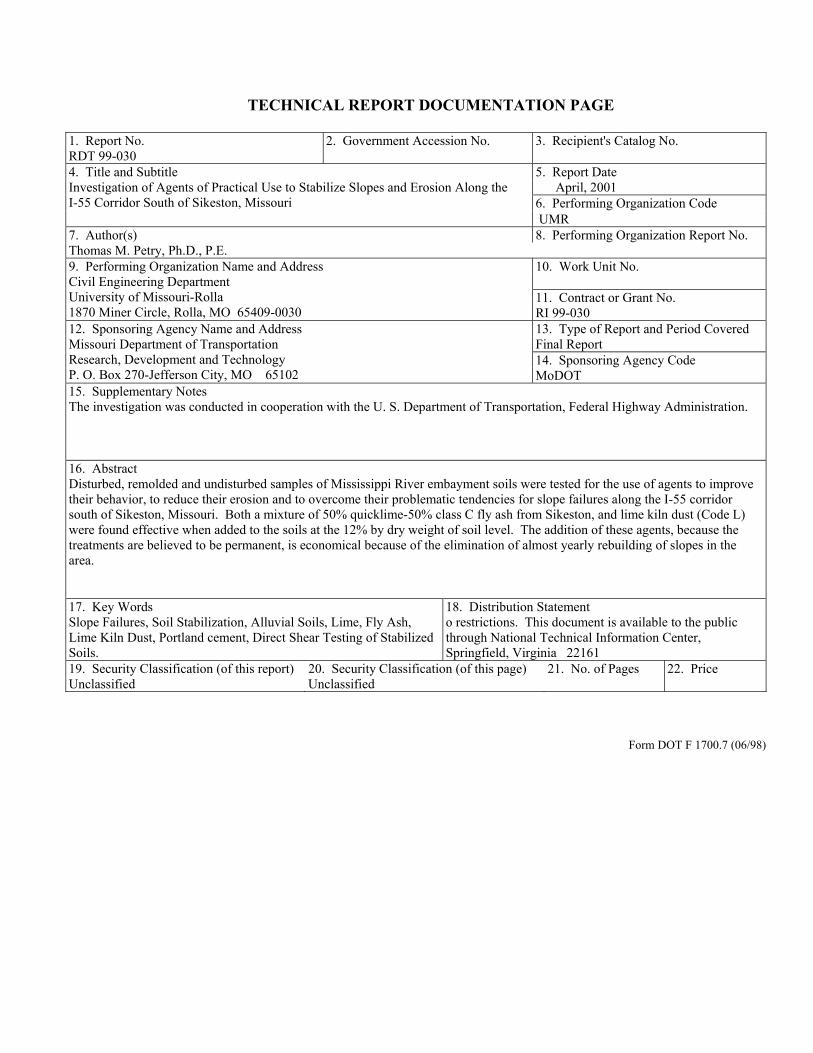
PRESENT CONDITIONS During a meeting between Mike Fritz and the Principal Investigator (PI), which took place in the spring of 1999, the PI first became aware of significant slope stability problems along the I-55 corridor. The PI contacted Mike Myers, MoDOT engineer of District 10, in Sikeston, and set up a meeting to discuss these problems. At that meeting, with Mike Myers, Ron Underwood and Willie Chasteen, the PI found that there were five places south of Sikeston where significant slope and erosion problems had occurred. During a subsequent trip south of Sikeston the PI observed these problems and took samples of selected materials from slope failures at Mile Marker (MM) 24 and Mile Marker 17. Figures 1 and 2 are typical of the slope failures noted.
The first of these sampling sites was along the slopes of the east outer road, north of the overpass at MM 24. The materials that had failed on both sides of the ramp have been determined to be silt soils of the Mississippi River flood plain, borrowed and placed in this fill. Most of the slope failures observed on this trip are believed to be in slopes made of this material. This site is shown in Figure 1.
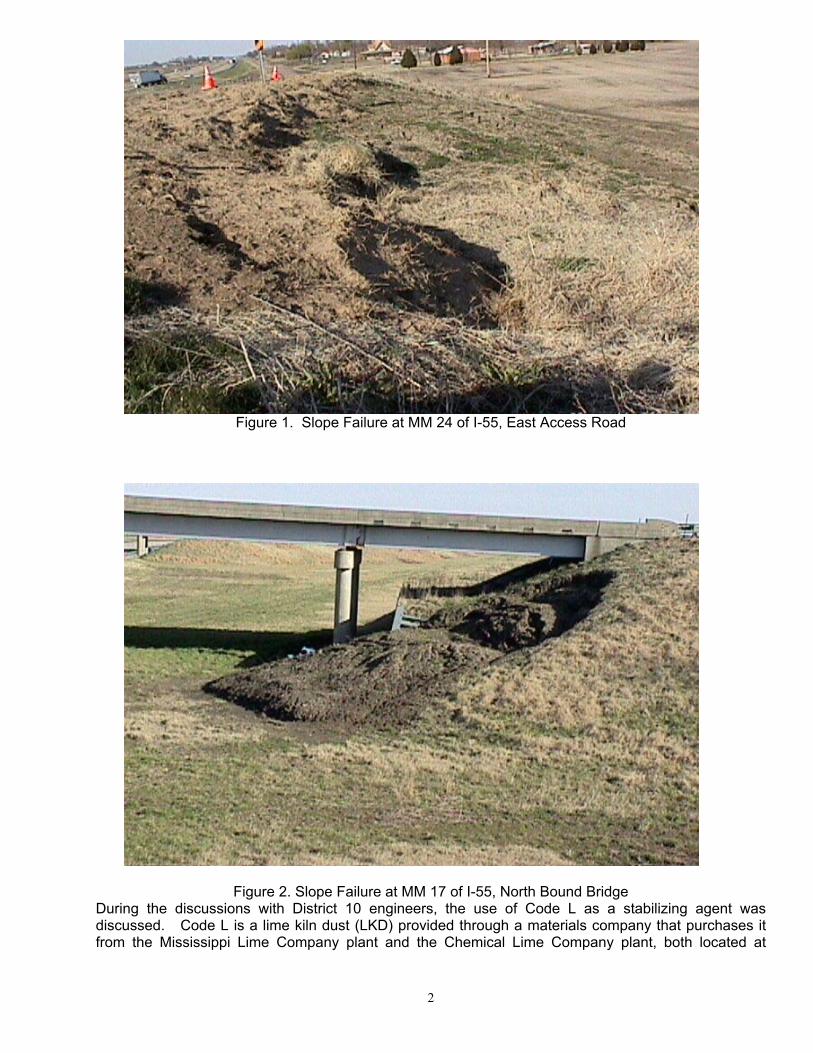
The second sampling site was at the southwest corner of the southbound lane bridge of I-55 at MM 17. Both this bridge abutment fill and the one at the south end of the northbound bridge of I 55 had failed. The material at this site has been identified as a highly plastic clay. It is believed to be Sharkey clay, which is also a Mississippi River flood plain soil, often used for fill in that area. Figure 2 shows the bridge approach fill failure at the southwest corner of the northbound bridge of I 55 where it crosses over I 155.
2
Figure 1. Slope Failure at MM 24 of I-55, East Access Road
Figure 2. Slope Failure at MM 17 of I-55, North Bound Bridge
During the discussions with District 10 engineers, the use of Code L as a stabilizing agent was discussed. Code L is a lime kiln dust (LKD) provided through a materials company that purchases it from the Mississippi Lime Company plant and the Chemical Lime Company plant, both located at
3
Sainte Genevieve, Missouri. The experience described by the engineers was that Code L was a good stabilization agent for the soils along the I-55 corridor. The PI has found out that Code L contains about 30% lime and the remaining is basically inert material. One of the main reasons for using Code L is its low cost, compared to other stabilizing agents.
The PI determined that other agents were available that may be as economical to use as Code L to use to stabilize these slopes. These included quick lime (QL) from Sainte Genevieve, and fly ash (FA) from a power plant in the Sikeston area. In addition, Portland cement (PC), if small enough quantities were needed to stabilize the soils under consideration, was considered as a possible stabilizing agent for the silt soils. Cement kiln dust (CKD) was not mentioned by anyone as available in the area of the project. The clay soils in the area were known to react to Code L, and, therefore, were expected to react with quick lime, and, possibly, with class C fly ash. Class C fly ash is known to have significant amounts of quick lime in it, along with other compounds that can cause it to set up like a cement.
The PI has had much success stabilizing clays with the types of calcareous stabilizers mentioned above, and good success stabilizing silty and sandy soils with those mentioned above for the silt soil. The key in this project will be to study the effects of these agents relative to the quantities needed to stabilize the soils and the relative economics of their use in the south I-55 corridor. It is important to maximize the effects, while utilizing simplified construction techniques, which will result in practical and economical solutions to the problems of slope stability and erosion control. The economics of the use of these agents will be addressed as to how much they would cost versus a process where no agents were used and the slopes rebuilt. Current practices have, as the PI was told by MoDOT maintenance personnel, not provided permanent corrections to the slope problems noted, only temporary ones, sometimes last one season only before needing repair again.
The significance of this project lies in the results of determining which agents, quantities and techniques could be used to effectively and economically repair slope failures and prevent further occurrences of failures. The results can also be applied to new construction utilizing these materials. SOIL STABILIZATION CONCEPTS The concept of stabilization applied during this study was to improve the subject slope erosion resistance and/or resistance to slope failures. History has shown that these slopes which were constructed using the interstate standards of the time using materials borrowed from the Mississippi River embayment have presented continual maintenance problems because of these two slope instabilities. If they were to be reconstructed using normal compacted layer techniques, it is likely that they would again, eventually, fail to be stable. It is the nature of these kinds of materials, containing significant silt content and significant clay content to behave as has been seen. The clay portion of the soil changes volume with the changes in moisture content brought about by the natural cyclic patterns of weather. Eventually, the clay portions of the soils exposed near the surface of the slope will retain only their residual strength, that which is available after large amounts of shear strain that occur during the shrinking and swelling cycles. On the other hand, the silts in these soils are mostly dependent on confinement for their friction strength and are susceptible to development of pore pressures that can dramatically reduce their effective strength. In addition, the silts, that are along with the clays that shrink and swell, eventually are in configurations that are of loosely associated grains. These silts, therefore, cannot resist the forces that cause erosion and that actuate slope failures. To overcome the problems believed to be present in the soils under study, it is believed feasible to improve selected properties by the addition of agents and thereby make the soils stable. In order to
4
reduce and, possibly, negate the shrink-swell potential of the clays present agents can be used that affect the physico-chemical environment inside of and around the clay particles. In addition, enough agent can be added to produce cementitious materials that will hold the particles in the soil mass and strengthen the soil mass to prevent slope failures. One of the most effective cations prevalently used to accomplish physico-chemical improvements in clays is Calcium. When the pH environment is optimal, at near 12.4, Calcium cations, when present in sufficient concentrations, will be exchanged for other, less stable cations. A Calcium "fixed" clay will have a relatively thin double water layer made up of cation laden water. This can cause a very highly plastic soil, with a Plastic Index (PI) of near 60, to behave as a silt soil and have a PI of less than 10. In addition, the highly plastic clay soil that had a very large shrink and swell potential, can have essentially no shrink-swell tendency at all when modified in this manner. The amount of an agent added to bring the clay soil to a situation of the least PI and shrink-swell tendency is the Modification Optimum (MO). The stabilizing agents chosen for this study all have potential of producing the effects described above in the soils that were included in this study. However, of the agents chosen, Portland cement, which acts mostly by coating and cementing particles together, requires a great deal of pulverization and mixing without delay so that the treated soils can be compacted before the cement is setup. Therefore, although PC was tested in the modification phase for all materials to establish the PC MO (Portland cement modification optimum), it will not be applied to the clay soil for the next phase of stabilization. Agents that were considered for treatment of the clay included QL, LKD and FA. The second type of stabilizing effect that occurs when agents are added to silts and to modified clays is bonding of the particle structure with cementitious materials. Those that result from all the agents that were considered during this study are pozzalans. These types of materials are the main cementing materials when PC is applied, when enough QL is added to form them with the clay present, and when LKD and FA are applied, having the constituents in them that the mixture of QL and clay has. In each case, there is a mixture of agent, or combination of agents and soil, that provide the best ingredients and pH environment for pozzolan formation. Because it was believed that the silt did not have enough clay in it to promote proper pozzolan formation when QL is applied, the silt was treated after initial testing with only LKD, FA and PC. It had been the experience of the PI that FA alone may not work well, because of the low amount of QL present in it. For this reason, where FA was to be applied to the soils tested and investigation of how much QL would be needed as an additive was done. It often takes as much as an equal amount of QL as FA to achieve the best results of both modification and stabilization. The optimal amount of agent or agent combination needed to produce the largest strength gain in the soil treated is the Stabilization Optimum (SO). Sometimes a target strength measured by a particular soil strength test is used to arrive at this amount of agent or agent combination, but normally testing is done to determine the amount to be added to find the maximum strength, however it is measured. During this study, the unconfined compression test was utilized to determine the SO for all agent or agent combination-soil combinations. After the SO's were determined, direct shear tests were conducted on treated and cured specimens to determine the improvements in residual strength that could be developed, since these are the strengths that represent the lowest values for slope stability analyses. For each soil MO's and SO's were determined for each agent and agent combination tested. The QL MO and QL SO are often referred to as the LMO and LSO, and the similar short forms are used for the other agents and agent combinations.

5
In addition, it had been determined by past published research done by the PI that not putting enough of these type of agents into a treated soil may lead to a partial or near total reversal of the modification of the soils treated. Because of this possibility, it is prudent to place as much agent or agent combination in the treated field soils to provide stabilization. Other, field conditions that must be considered have to do with the best environment for treatment, the pH of the treated soils and the use of additional amounts of agent for field conditions. Since the reactions described above are dependent on chemical reactions, it is imperative that the moisture content of the treated soil be held to 5% above the optimum for compaction of the stabilized soil during the treatment process until lowered to the optimum for compaction purposes. Each treated and compacted layer must be kept moist for period of several days. Second, because of the way the agents used in this testing are applied and react with water, the pH of the treated soil will remain high (over 10) for a relatively long time. To promote the growth of vegetation on the surface of the slopes a layer of topsoil will have to be added after the slope is built with treated soils. Finally, to make sure that the required amount of agent is mixed into the treated soils the amounts added in the field are increased by 1% over that determined by laboratory testing. TECHNICAL APPROACH General The overall program being followed in this project was to organize planning with MoDOT personnel in Jefferson City and Sikeston, take soil samples for test and agents to be added, and evaluate the use of these agents in the soils. This initiated with collection of bulk samples of the soils to be tested from sites adjacent to those in Figures 1 and 2, choosing stabilizing agents which practically could be applied to these soils, and determining the natural properties of bulk samples. The soils were treated with various percentages of the applicable agents and tested in the laboratory of UMR for selected properties that may indicate the levels of agents needed to modify their behaviors. In addition, natural and undisturbed samples were taken of the materials in the slopes sampled in bulk and testing of their properties were initiated. Once compaction characteristics of bulk samples soils in their treated states were determined, preparation of unconfined compression specimens for determination of optimal levels of agents for stabilization were initiated. The results of unconfined compression testing of these specimens, when cured, provided data that allow for determination of agent percentages for final stages of testing. Soils treated with optimal percentages of agents for modification and stabilization were tested for shear strength, wet-dry endurance and freeze-thaw endurance. All of the results will be reported to MoDOT, for consideration of field applications of these agents to overcome the problems noted. A diagram of the Technical Approach is included as Figure 3. Bulk Samples Bulk sampling was done during a visit arranged by Mike Myers, District 10 Geologist on February 7, 2000. Mike provided Sikeston fly ash samples and arranged for the maintenance crew at Hayti to assist in the sampling process. Two-1500 pound samples were taken out of current slope failure areas of bridge approach fills at the 24 and 17 Mile Markers. The first sampling operation is shown in Figures 4 and 5. Figure 4 is of the slope failure area at MM 24 on the east side of the southeast approach of the east access road as it approaches the bridge to cross I-55. This slope is south of the overpass from the slope pictured in Figure1. Figure 5 is of the trench from which the so-called silt or silty soils were sampled. The sampling trench shown in Figure 6 is located in a slope failure area of the

6
west slope of a fill on the northbound lanes of I-55 between two bridges at MM 17. This slope is the next one north of that pictured in Figure 2 and across I 155 from it. The soil taken from the MM 17 site is called clay or clayey. As will be covered later, and which is shown in Figures 5 and 6, these soils are similar in color and very different in expected behavior. Initial testing of these bulk soil samples included determination of their index properties, their compaction characteristics, and their tendencies for shrink and swell. Figure 7 shows the grain size distributions found for these samples using a combination of sieve and hydrometer testing. It is important to note that the grain size distributions of these soils have very similar slopes, with the major difference being the percent clay in each. Table A includes the Atterberg limits found for these untreated soils, the percents organics found in them and their linear shrinkage behaviors. The clay soil has a relatively high Liquid Limit (LL) of 52 and a Plastic Index (PI) of 31. This material is believed to be representative of the Sharkey Clay found in the region and would be classified as an A-7-6 by AASHTO. Although the percent organics is not significantly high, it is believed it will have an effect on the

7
Initial Sampling
Preliminary Testing
Bulk Samples Agents Undisturbed
Untreated Treated pH Tests Boring Logs
G. S. D. pH Tests Assign Tests
Organics & pH
A.L. & L.S. Series
G. S. D.
A. L. &
L.S. Select
M.O.'s A. L. & L.S.
Compac-
tion Unc. Comp.
Compac-tion
3-D Swell
3-D Swell Unc. Comp.
Series Direct Shear
Unc.
Comp. Select
S. O.'s
Direct Shear
Direct Shear
Wet / Dry Wet / Dry
Freeze /
Thaw Freeze /
Thaw
Definitions: G.S.D.= Grain Size Distribution A.L.= Atterberg Limits L.S. = Linear Shrinkage Unc. Comp.= Unconfined Compression M.O.= Modification Optimum S.O. = Stabilization Optimum
Figure 3. Technical Approach Flow Chart

8
stabilization of this soil. This clay soil exhibited a linear shrinkage of 19.4% when drying from near it’s LL. The silt soil has a LL of 43 and a PI of 24, indicating that it’s behavior patterns should be
significantly different than that of the clay. However, it is also classified by AASHTO as an A-7-6. The levels of organics in this silt are similar to those in the clay, and it displayed a linear shrinkage of 16%.
The procedure followed for the Linear Shrinkage testing is provided in Appendix A. All other procedures, except for that used for 3-D Swell and preparation and size of specimens, followed
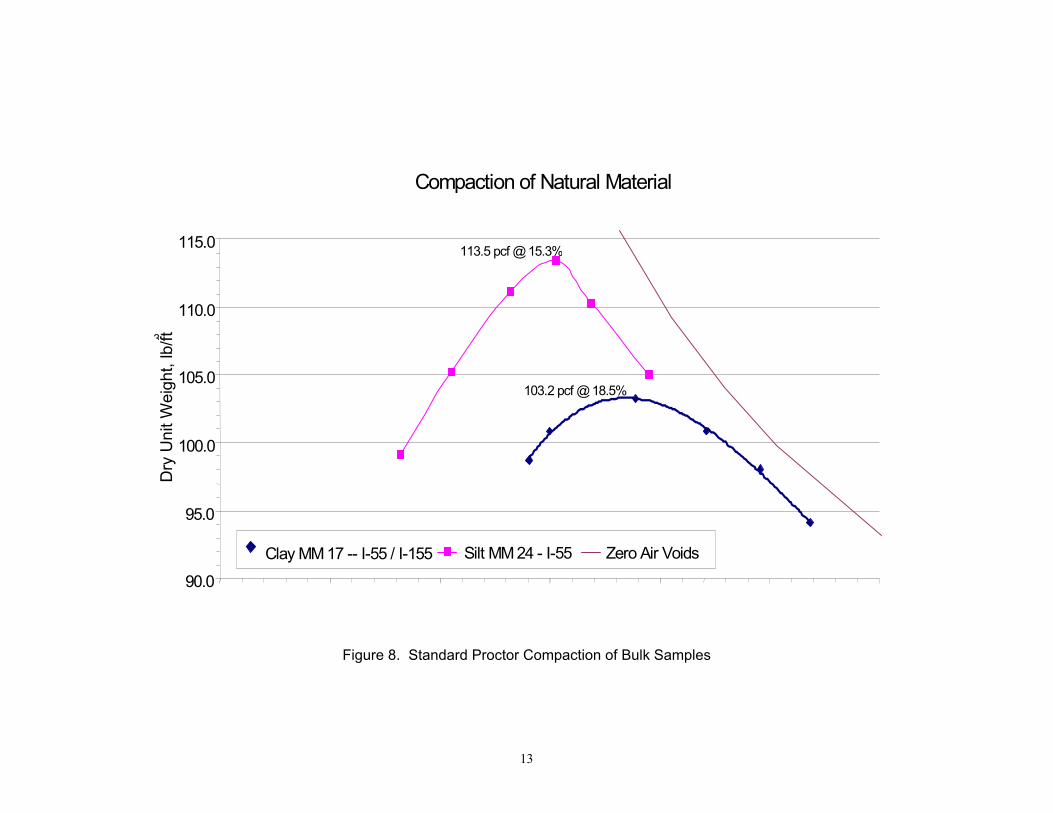
applicable ASTM Standards. The exceptions will be detailed below. The bulk samples were sieved and pulverized to enable their stabilization, and were mixed as thoroughly as possible to prevent sampling variances. A level of pulverization representing that normally specified in the field was been used for compaction, strength testing specimens, swelling test specimens and durability specimens. This degree of pulverization provides that 100% of the material is smaller than 1 inch in size and 60% of it passes through a number 4 U.S. series sieve. This was used because the performance of stabilizers in the field depends on how well the agent is intimately mixed with the soil and that is significantly different for specified field pulverization standard materials than for laboratory materials pulverized to 100% passing the number 4 U.S. series sieve or, even much finer, materials pulverized to pass the number 40 U.S. series sieve. The differences of appearance of these materials are further supported by their compaction characteristics. Figure 8 shows the dry unit weight-water content curves for both soils when a standard level of compaction energy is utilized. The silt soil compacts to a dry unit weight of 113.5 pcf at an optimum water content of 15.3%. The clay soil can be compacted to a dry unit weight of 103.2 pcf when an optimum water content of 18.5% is used. The relative shape and location of these compaction curves fit well for the material behavioral differences expected. Considering the variance in materials found in relatively undisturbed samples, discussed later in this report, if will be necessary for compaction curves to be developed for each site where repair or construction is to be done in the field. The values shown here are for the samples tested and were used in preparation of specimens for these tests, and should not be considered representative of the behavior of other materials. Although standard procedures have been used for the development of grain size analyses, Atterberg limits and compaction characteristics, those followed for determination of linear shrinkage and 3 dimensional swelling are not standard in Missouri. The linear shrinkage determinations were made using the TXDOT standard test and the 3 dimensional swelling test used has been under development for about ten years by the author. Having used this type of swelling test in over 500 tests simulating field subgrades of soils and treated soils, the author is confident of how it represent behavior of these soils in worse-case scenarios. It was originally developed to simulate a pavement subgrade experiencing sulfate induced heave and has been used extensively to test for treatments to overcome this highly damaging phenomenon. Procedures for both the shrinkage test and the 3 dimensional swell test are provided in Appendix A. The results of 3 dimensional swell tests conducted on specimens made from the bulk samples are shown in Table B. These tests were initiated for each soil at the optimum water content for standard compaction and at three or four percent below the optimums. The silt soil displayed a vertical swell of 2.2 % and horizontal swell of 3.1 % when compacted at its optimum water content, and when compacted at 3 % below optimum water content exhibited a vertical swell of 2.3 % and a horizontal swell of 2.9 %. Although there does not appear to be much difference in the swelling behavior of this silt soil between these initial moisture levels, a vertical swell of 2 % in a foot of subgrade could show up as a vertical rise of 0.25 inches and a 3 % horizontal swell could manifest itself in a lengthening of the layer 10 feet long by 3.6 inches. Comparison of these results to those for the treated silt will indicate the level of success of stabilization.

9
The 3 dimensional swell results for the clay soil are indicative of its problematic behavior in the field. When compacted at its optimum it displayed a vertical swell of 3.4 % and a horizontal swell of 2.9 %. However, when compacted at four percent below its optimum, it exhibited a vertical swell of 7.3 % and a horizontal swell of 3.3 %. These larger swelling potentials could cause a one-foot layer to heave almost an inch and a 10 foot long longitudinal section to increase in length nearly four inches. Neither of these seems excessive, unless the soil is supporting a pavement system. Comparison of these behaviors with those of the treated soil will assist in determining optimal stabilization.
Figure 4. MM 24 Bulk Sample Site with Slope Failure

10
Figure 5. Sampling Trench for Silty Soil at MM 24
Figure 6. Sampling Trench for Clayey Soil at MM 17

11
Table A. Natural Properties of the Bulk Samples
Clay Silt Liquid Limit 52 Liquid Limit 43 Plastic Limit 21 Plastic Limit 19
Plasticity Index 31 Plasticity Index 24 Linear Shrinkage 19% Linear Shrinkage 16%
% Organics 3.0% % Organics 3.4%
Table B. 3 Dimensional Swell of the Natural Soil
Clay % Horizontal Swell % Vertical Swell W.C. % Initial dry Unit Weight, pcf
at OMC 2.9 3.4 19.2 103.5 -4% OMC 3.3 7.3 15.6 100.1
Silt
at OMC 3.1 2.2 103.3 -3% OMC 2.9 2.3 97.9

12
Figure 7. Natural Grain Size Analysis of Bulk Samples
0
10
20
30
40
50
60
70
80
90
100
0.0010.010.1110100 Grain Size, D (mm)
Per
cent
Fin
er
C lay MM 17 I-55 / I-155 Silt MM 24 -- I-55
U.S. Standard sieve size No.
200 40 10 43/4 "3 "
13
Figure 8. Standard Proctor Compaction of Bulk Samples
Compaction of Natural Material
90.0
95.0
100.0
105.0
110.0
115.0
Dry
Uni
t Wei
ght,
lb/ft3
Clay MM 17 -- I-55 / I-155 Silt MM 24 - I-55 Zero Air Voids
113.5 pcf @ 15.3%
103.2 pcf @ 18.5%
14
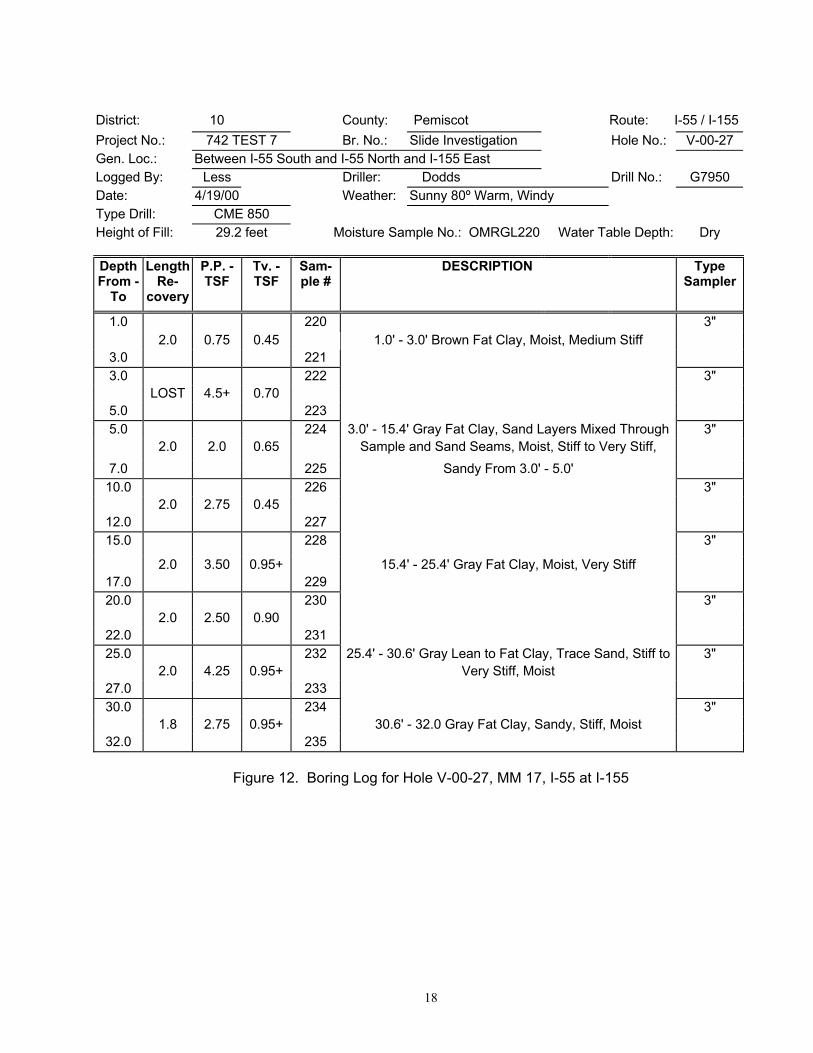
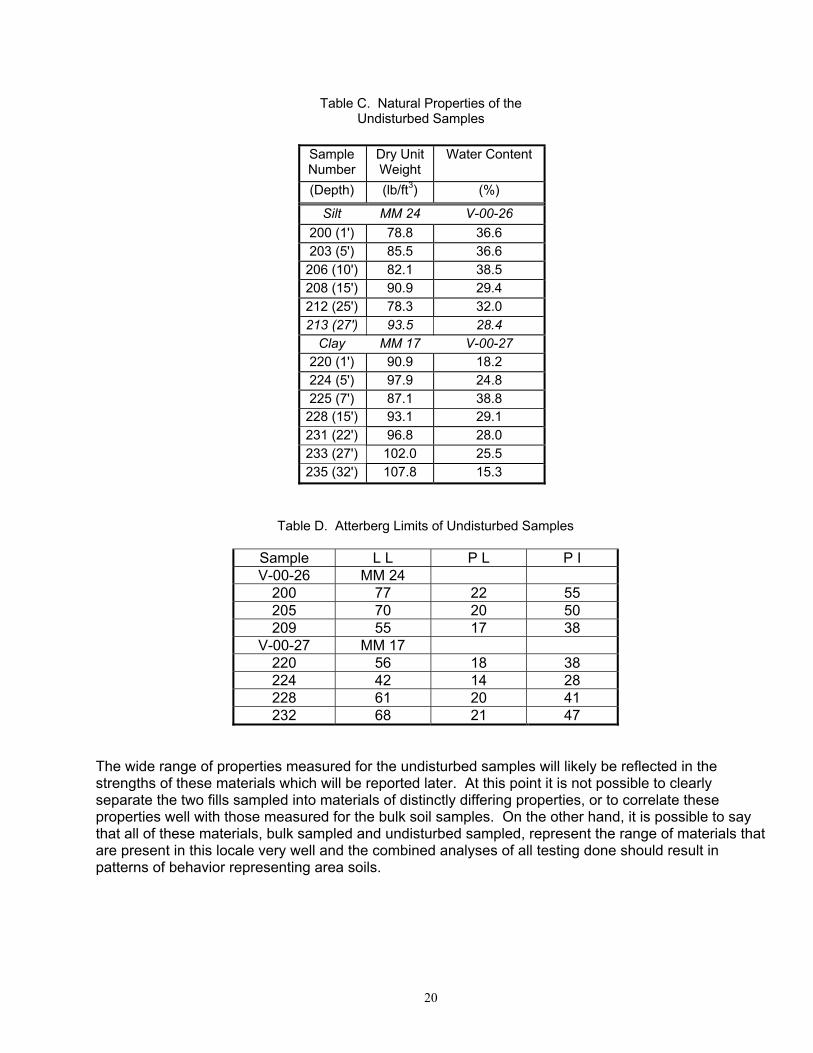
The measured unconfined compression strength, direct shear strengths and performance of the bulk sample materials in the wet/dry and freeze/thaw tests will be provided and discussed at the same time as those of the treated materials. In addition, the strength properties measured for the undisturbed samples will be discussed at that time. This is done to reduce repetition of information in this report and to allow easier comparison of results. Undisturbed Samples During the process of collecting the bulk samples, locations were marked at the top of each slope from which they came for undisturbed sampling of the materials in the fills. These locations were communicated to Tom Fennessey, who arranged for MoDOT personnel to drill and sample these materials. This occurred on April 19, 2000. The sampling process included continuous thin walled sampling and extrusion in the field. The samples were taken from depth including the full depth of the fill and were sealed and returned to the UMR Geotechnical Laboratories for further testing. Figures 9 and 10 show the locations of these borings at MM 24 and MM 17, respectively. Boring logs for the borings at MM 24 and MM 17, respectively, are shown in Figures 11 and 12. The purpose for these samples was to verify the conditions of the fill, the stratigraphy of the materials in the fill and to allow for shear strength testing of the fill materials. It is important to note that the materials are not very uniform. In order to sort out which of the samples to use for what tests, three types of tests were conducted to assist in differentiating these materials. The results of the first set of tests, to determine the in situ dry unit weights and water contents of the fills are shown in Table C. The silt materials vary in dry unit weight from 78.3 pcf to 90.9 pcf, and in water content from 29.4 % to 36.6 %. The clay soils varied in dry unit weight from 87.1 pcf to 107.8 pcf, and in water content from 15.3 % to 38.8 %. These variances of properties are not unexpected, and may be of use during final analyses of results. The variance of the materials found in each of these fills meant that an assumption that testing one sample would lead to correlation with testing of another in the same fill, and that the strength testing done will have to be correlated using statistical methodologies, if they can be at all. An additional property was measured for each of the samples to further indicate their relationship with one another. Hydrometer grain size testing was done to indicate the relative slopes of grain size curves in the fine fraction and to determine what relative percents of clay were present in these soils. The results of these tests are given in Figures 13 and 14. Analyses so far indicate that most of the materials from the same fill have nearly parallel grain size curves, with one exception. This means that the major difference may be the percent clay in each sample. Analyses of these results were used in determining which sample were tested for what properties, and to possibly enable correlations of results. The last set of tests used to assist in differentiating these undisturbed samples included a set of Atterberg Limits tests. The results of these tests are given in Table D. It is interesting to note the variance of properties for samples taken from the same boring, in each case. The boring materials from the fill assumed to consist mainly of more clayey soils appear to be less plastic than those from the boring in the fill assumed to contain more silty soils. It is apparent that the materials in the interior of these fills are somewhat different than those on the exteriors of the fills from where the bulk samples were taken; however, the bulk samples are believed representative of all the soils sampled. The overall variance of properties measured for the undisturbed samples indicates the true nature of Mississippi River bottom soils at least in this local. Those sampled from near MM 24 had 85 to 95% fines and 45 to 59% clay. They had dry unit weights varying from 78.3 to 90.9 pcf and water contents from 29.4 to 36.6%, had liquid limits from 55to 77 and plastic indeces from 38 to 55. Those sampled

15
from near MM 17 had 40 to 87% fines and 20 to 47% clay. These materials had dry unit weights varying from 87.1 to 107.8 pcf and moisture contents of 15.3 to 38.8 %. These materials had measured liquid limits varying from 42 to 68 and plastic indices from 28 to 47.
Figure 9. Boring Number V-00-26, East Service Road of I-55 at MM 24
16
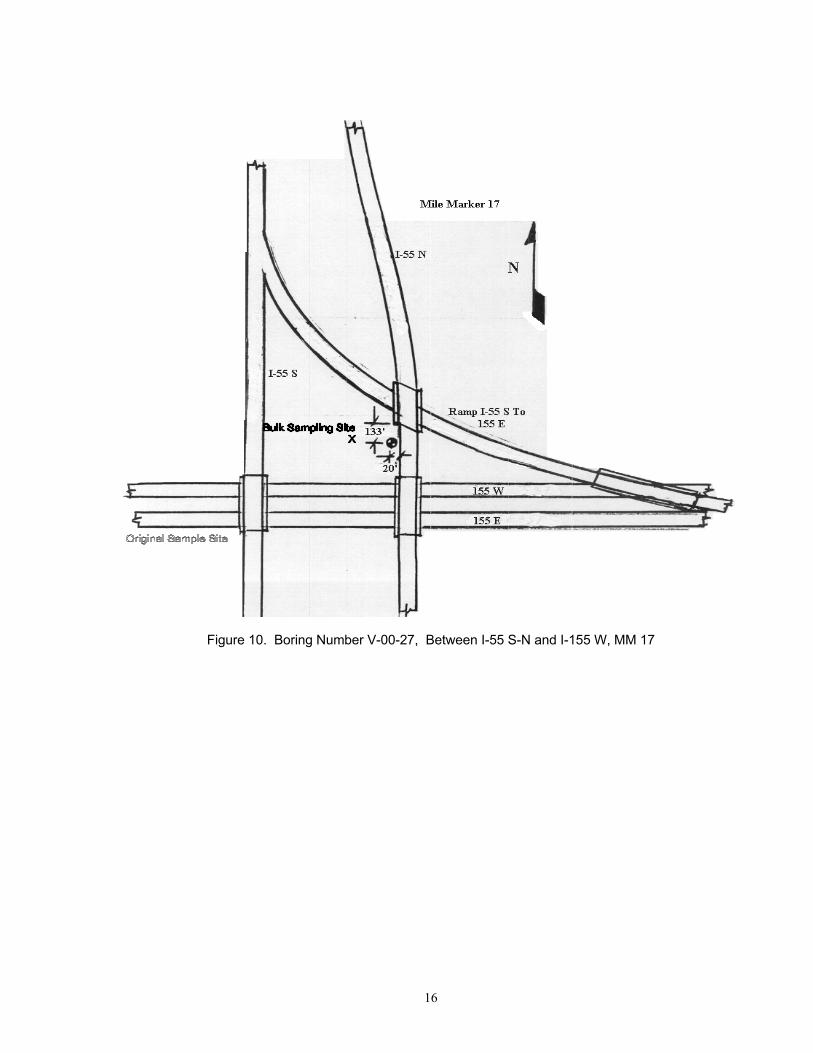
Figure 10. Boring Number V-00-27, Between I-55 S-N and I-155 W, MM 17
17
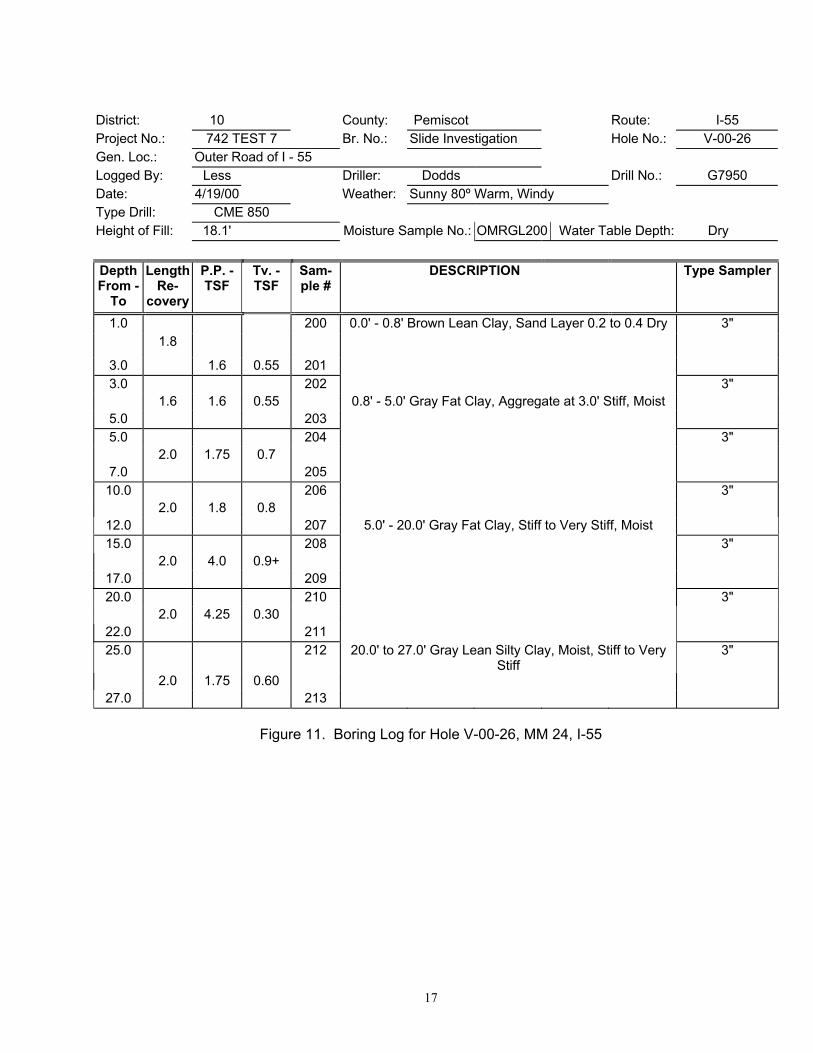
District: 10 County: Pemiscot Route: I-55 Project No.: 742 TEST 7 Br. No.: Slide Investigation Hole No.: V-00-26 Gen. Loc.: Outer Road of I - 55 Logged By: Less Driller: Dodds Drill No.: G7950 Date: 4/19/00 Weather: Sunny 80º Warm, Windy Type Drill: CME 850 Height of Fill: 18.1' Moisture Sample No.: OMRGL200 Water Table Depth: Dry
Depth From -
To
Length Re-
covery
P.P. - TSF
Tv. - TSF
Sam-ple #
DESCRIPTION Type Sampler
1.0 200 0.0' - 0.8' Brown Lean Clay, Sand Layer 0.2 to 0.4 Dry 3" 1.8
3.0 1.6 0.55 201 3.0 202 3"
1.6 1.6 0.55 0.8' - 5.0' Gray Fat Clay, Aggregate at 3.0' Stiff, Moist 5.0 203 5.0 204 3"
2.0 1.75 0.7 7.0 205
10.0 206 3" 2.0 1.8 0.8
12.0 207 5.0' - 20.0' Gray Fat Clay, Stiff to Very Stiff, Moist 15.0 208 3"
2.0 4.0 0.9+ 17.0 209 20.0 210 3"
2.0 4.25 0.30 22.0 211 25.0 212 20.0' to 27.0' Gray Lean Silty Clay, Moist, Stiff to Very
Stiff 3"
2.0 1.75 0.60 27.0 213
Figure 11. Boring Log for Hole V-00-26, MM 24, I-55
18
District: 10 County: Pemiscot Route: I-55 / I-155Project No.: 742 TEST 7 Br. No.: Slide Investigation Hole No.: V-00-27 Gen. Loc.: Between I-55 South and I-55 North and I-155 East Logged By: Less Driller: Dodds Drill No.: G7950 Date: 4/19/00 Weather: Sunny 80º Warm, Windy Type Drill: CME 850 Height of Fill: 29.2 feet Moisture Sample No.: OMRGL220 Water Table Depth: Dry
Depth From -
To
Length Re-
covery
P.P. - TSF
Tv. - TSF
Sam-ple #
DESCRIPTION Type Sampler
1.0 220 3" 2.0 0.75 0.45 1.0' - 3.0' Brown Fat Clay, Moist, Medium Stiff
3.0 221 3.0 222 3"
LOST 4.5+ 0.70 5.0 223 5.0 224 3.0' - 15.4' Gray Fat Clay, Sand Layers Mixed Through 3"
2.0 2.0 0.65 Sample and Sand Seams, Moist, Stiff to Very Stiff, 7.0 225 Sandy From 3.0' - 5.0'
10.0 226 3" 2.0 2.75 0.45
12.0 227 15.0 228 3"
2.0 3.50 0.95+ 15.4' - 25.4' Gray Fat Clay, Moist, Very Stiff 17.0 229 20.0 230 3"
2.0 2.50 0.90 22.0 231 25.0 232 25.4' - 30.6' Gray Lean to Fat Clay, Trace Sand, Stiff to 3"
2.0 4.25 0.95+ Very Stiff, Moist 27.0 233 30.0 234 3"
1.8 2.75 0.95+ 30.6' - 32.0 Gray Fat Clay, Sandy, Stiff, Moist 32.0 235
Figure 12. Boring Log for Hole V-00-27, MM 17, I-55 at I-155

19
Figure 13. Hydrometer Grain Size Analysis of Undisturbed Silt Samples, MM 24
Figure 14. Hydrometer Grain Size Analysis of Undisturbed Clay Samples, MM 17
0
10
20
30
40
50
60
70
80
90
100
0.0010.010.1110100Grain Size, D (mm)
200 203 208 212
U.S. Standard sieve size No.
200 40 10 43/4"3 " 100
0
10
20
30
40
50
60
70
80
90
100
0.0010.010.1110100Grain Size, D (mm)
Per
cent
Fin
er
220 225 231 233 235
U.S. Standard sieve size No.
200 40 10 43/4 "3 " 100
20
Table C. Natural Properties of the Undisturbed Samples
Sample Number
Dry Unit Weight
Water Content
(Depth) (lb/ft3) (%)
Silt MM 24 V-00-26 200 (1') 78.8 36.6 203 (5') 85.5 36.6
206 (10') 82.1 38.5 208 (15') 90.9 29.4 212 (25') 78.3 32.0 213 (27') 93.5 28.4
Clay MM 17 V-00-27 220 (1') 90.9 18.2 224 (5') 97.9 24.8 225 (7') 87.1 38.8
228 (15') 93.1 29.1 231 (22') 96.8 28.0 233 (27') 102.0 25.5 235 (32') 107.8 15.3
Table D. Atterberg Limits of Undisturbed Samples
Sample L L P L P I V-00-26 MM 24
200 77 22 55 205 70 20 50 209 55 17 38
V-00-27 MM 17 220 56 18 38 224 42 14 28 228 61 20 41 232 68 21 47
The wide range of properties measured for the undisturbed samples will likely be reflected in the strengths of these materials which will be reported later. At this point it is not possible to clearly separate the two fills sampled into materials of distinctly differing properties, or to correlate these properties well with those measured for the bulk soil samples. On the other hand, it is possible to say that all of these materials, bulk sampled and undisturbed sampled, represent the range of materials that are present in this locale very well and the combined analyses of all testing done should result in patterns of behavior representing area soils.

21
Stabilizing Agents Once the basic identification of the soil was done, selection of agents to stabilize these soils was accomplished. This selection was dependent on whether there was sufficient clay present to rely on clay modification-pozzolanic stabilization or whether the materials to provide pozzolanic reactions would have to be added as part of the agent mix. Both of these soils have sufficient clay to allow for some cation exchange and modification, but the silt soil may not have had sufficient clay to provide the materials for pozzolans to form without addition of pozzolan forming materials. The other factor that was considered was how easily pulverization and mixing could be accomplished in one pass, which is required for some agents and agent combinations. Heavy clays are particularly hard to pulverize and need to go through modification to assist in pulverization and mixing. Because of the availability and normal use of agents, as well as the applicability of types of agents, three agents or agent mixtures were chosen for each soil in this study. In order to stabilize the silt soil, Lime Kiln Dust (LKD), Portland cement (PC) and a mixture of Quick Lime and Fly Ash (QL-FA) were chosen. The first was chosen because of the history of its use by MoDOT, the second because of its common use on this type of soil, and the third because of the Sikeston Fly Ash available. To stabilize the clay soil, LKD, QL-FA and Quick Lime (QL) were chosen. Portland cement has to be placed, mixed and compacted during one pass and this probably would be difficult with this clay. The use of QL in its place is logical, since this agent will easily modify most clays and can produce pozzolan building materials as well in these soils. The use of QL in silts is not feasible since clays are needed for the constituents to build pozzolans. LKD provides both CaO and the necessary constituents. In order to determine the levels of agents to add to these soils, testing of the agents and agent mixtures, and testing of these agents and mixtures added to the soils were necessary. To establish the pH environment that each agent combination may provide in the soils, a series of pH tests of agent-water mixes was conducted. It was determined early in the process of evaluating agent mixtures that a QL-FA mix would have to contain 50% of each agent to achieve success. Although there will be results reported for the Fly Ash (FA) alone and a mixture of 25% QL and 75% FA, these were not pursued further in the testing sequence, and their pH test results are not shown. Figure 15 displays how the pH's of agent-water solutions for the agents to be used vary for differing concentrations of agent. It can be seen that the QL-FA agent combination has the potential to provide the highest pH in the soil, while the QL solutions are next, and LKD solutions fall below these. The pH of a PC solution tends to increase with concentration of the levels tested. Establishment and maintenance of a fairly high pH (about 12.5) are keys to the best cation exchange environment and best pozzolan cement formation. Agents Applied to Soils The standard pH series test procedure was utilized to test mixtures of lime agents, water and soil. This process has become standard for determination of the level of lime, either QL or Hydrated Lime, which is needed in a clay soil to “fix” the soil. Fixation, in this case, implies accomplishing all the cation exchange that can be done for the clay in the soil and providing the maximum modification of shrink-swell behavior for the clay. This procedure was done for both soils as treated with QL and LKD. An example of the type of curve that results is shown in Figure 16. This curve of the pH of QL-Water-Clay mixtures, as the percent QL is increased, maximizes at a pH of 12.29 at 5% agent. The percentages of this agent to be applied for the Atterberg Limits-Linear Shrinkage series for lime agents were determined using the pH test results. The remaining pH versus percent agent or agent combination curves are included in Appendix B.
22
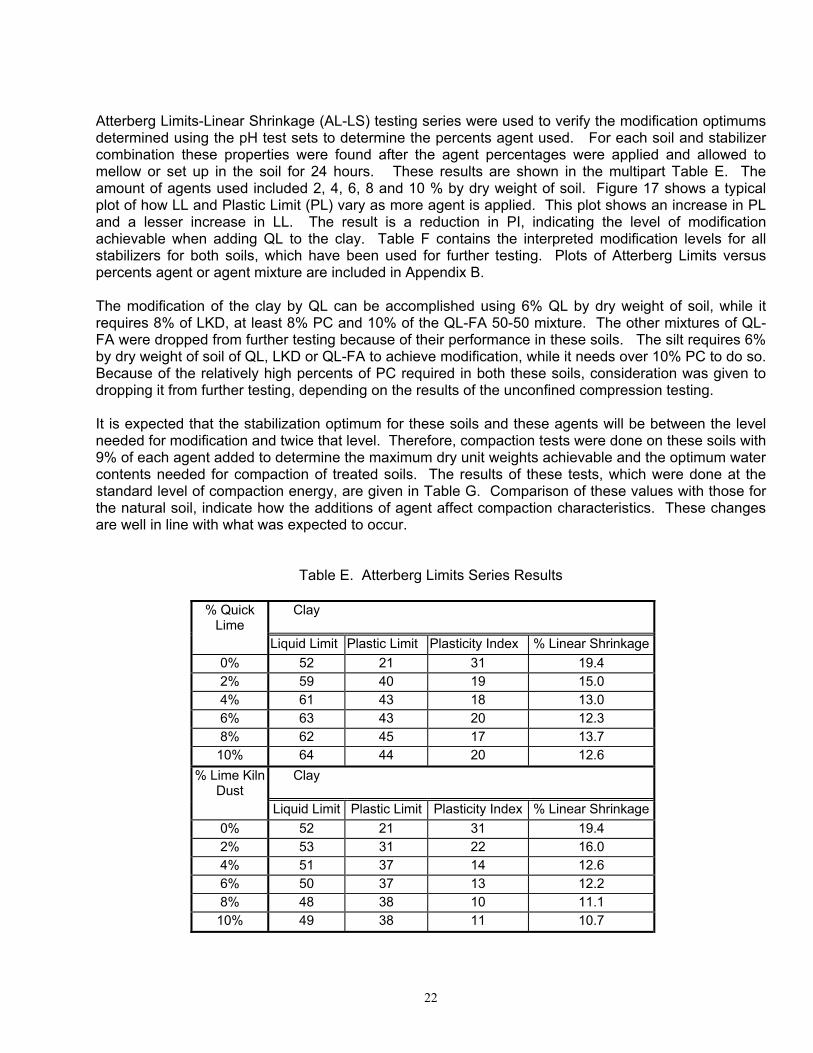
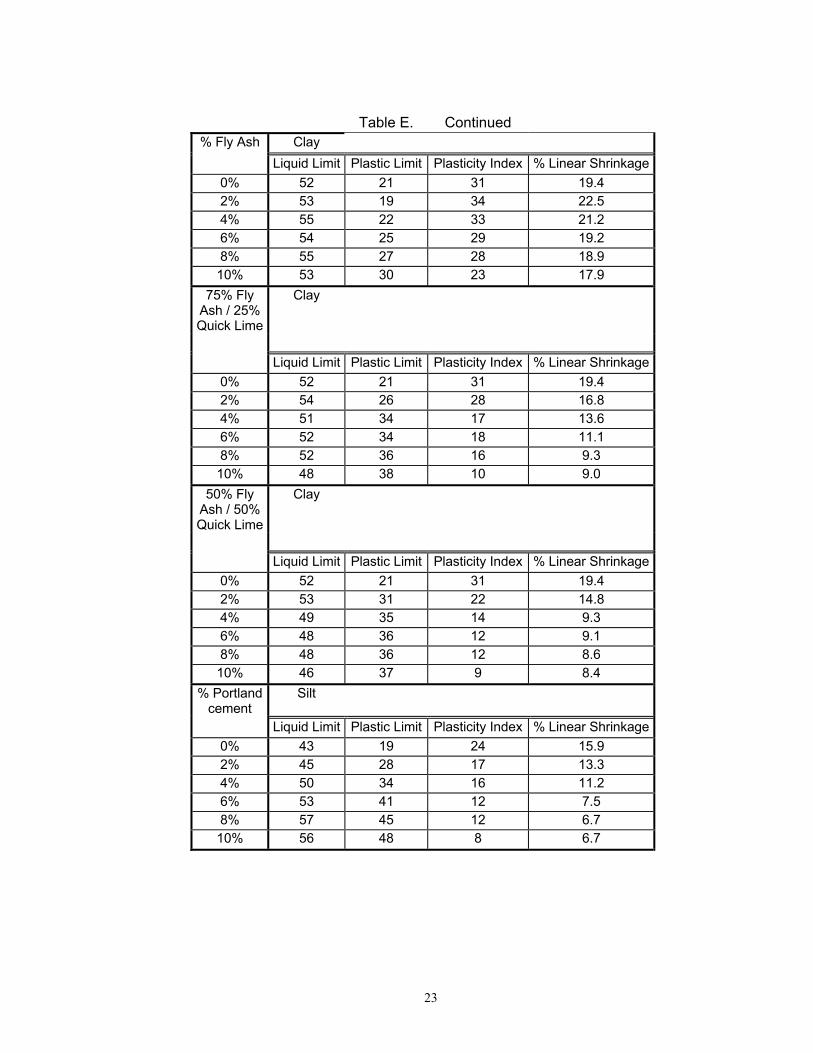
Atterberg Limits-Linear Shrinkage (AL-LS) testing series were used to verify the modification optimums determined using the pH test sets to determine the percents agent used. For each soil and stabilizer combination these properties were found after the agent percentages were applied and allowed to mellow or set up in the soil for 24 hours. These results are shown in the multipart Table E. The amount of agents used included 2, 4, 6, 8 and 10 % by dry weight of soil. Figure 17 shows a typical plot of how LL and Plastic Limit (PL) vary as more agent is applied. This plot shows an increase in PL and a lesser increase in LL. The result is a reduction in PI, indicating the level of modification achievable when adding QL to the clay. Table F contains the interpreted modification levels for all stabilizers for both soils, which have been used for further testing. Plots of Atterberg Limits versus percents agent or agent mixture are included in Appendix B. The modification of the clay by QL can be accomplished using 6% QL by dry weight of soil, while it requires 8% of LKD, at least 8% PC and 10% of the QL-FA 50-50 mixture. The other mixtures of QL-FA were dropped from further testing because of their performance in these soils. The silt requires 6% by dry weight of soil of QL, LKD or QL-FA to achieve modification, while it needs over 10% PC to do so. Because of the relatively high percents of PC required in both these soils, consideration was given to dropping it from further testing, depending on the results of the unconfined compression testing. It is expected that the stabilization optimum for these soils and these agents will be between the level needed for modification and twice that level. Therefore, compaction tests were done on these soils with 9% of each agent added to determine the maximum dry unit weights achievable and the optimum water contents needed for compaction of treated soils. The results of these tests, which were done at the standard level of compaction energy, are given in Table G. Comparison of these values with those for the natural soil, indicate how the additions of agent affect compaction characteristics. These changes are well in line with what was expected to occur.
Table E. Atterberg Limits Series Results
% Quick Lime
Clay
Liquid Limit Plastic Limit Plasticity Index % Linear Shrinkage 0% 52 21 31 19.4 2% 59 40 19 15.0 4% 61 43 18 13.0 6% 63 43 20 12.3 8% 62 45 17 13.7 10% 64 44 20 12.6
% Lime Kiln Dust
Clay
Liquid Limit Plastic Limit Plasticity Index % Linear Shrinkage 0% 52 21 31 19.4 2% 53 31 22 16.0 4% 51 37 14 12.6 6% 50 37 13 12.2 8% 48 38 10 11.1 10% 49 38 11 10.7
23
Table E. Continued
% Fly Ash Clay Liquid Limit Plastic Limit Plasticity Index % Linear Shrinkage
0% 52 21 31 19.4 2% 53 19 34 22.5 4% 55 22 33 21.2 6% 54 25 29 19.2 8% 55 27 28 18.9 10% 53 30 23 17.9
75% Fly Ash / 25% Quick Lime
Clay
Liquid Limit Plastic Limit Plasticity Index % Linear Shrinkage
0% 52 21 31 19.4 2% 54 26 28 16.8 4% 51 34 17 13.6 6% 52 34 18 11.1 8% 52 36 16 9.3 10% 48 38 10 9.0
50% Fly Ash / 50% Quick Lime
Clay
Liquid Limit Plastic Limit Plasticity Index % Linear Shrinkage
0% 52 21 31 19.4 2% 53 31 22 14.8 4% 49 35 14 9.3 6% 48 36 12 9.1 8% 48 36 12 8.6 10% 46 37 9 8.4
% Portland cement
Silt
Liquid Limit Plastic Limit Plasticity Index % Linear Shrinkage 0% 43 19 24 15.9 2% 45 28 17 13.3 4% 50 34 16 11.2 6% 53 41 12 7.5 8% 57 45 12 6.7 10% 56 48 8 6.7

24
Table E. Continued
% Fly Ash Silt Liquid Limit Plastic Limit Plasticity Index % Linear Shrinkage
0% 43 19 24 15.9 2% 44 19 25 14.2 4% 45 21 24 13.6 6% 45 24 21 13.4 8% 44 26 18 12.9 10% 44 25 19 11.8
% Lime Kiln Dust
Silt
Liquid Limit Plastic Limit Plasticity Index % Linear Shrinkage 0% 43 19 24 15.9 2% 44 27 17 14.4 4% 42 30 12 11.3 6% 40 31 9 10.2 8% 41 31 10 11.0 10% 41 30 11 10.0
75% Fly Ash / 25% Quick Lime
Silt
Liquid Limit Plastic Limit Plasticity Index % Linear Shrinkage
0% 43 19 24 15.9 2% 44 27 17 14.6 4% 43 30 13 10.7 6% 41 31 10 9.8 8% 42 31 11 8.1 10% 42 31 11 7.4
50% Fly Ash / 50% Quick Lime
Silt
Liquid Limit Plastic Limit Plasticity Index % Linear Shrinkage
0% 43 19 24 15.9 2% 42 28 14 12.2 4% 41 31 10 8.6 6% 39 32 7 8.1 8% 39 31 8 8.0 10% 39 31 8 7.7

25
Table F. Modification Optimums
Modification Optimums from pH Testing
and Atterberg Limit Series Agent Clay Silt
Quick Lime 6% NA Lime Kiln Dust 8% 6%
Portland cement NA > 10% 10% 6%
50% Fly Ash / 50% Quick Lime
Table G. Results of the Standard Proctor Compaction for Natural and Treated Soils
Results of the Standard Proctor Compaction on Natural and Treated Soils
Natural 9% Quick Lime 9% Lime Kiln Dust 9% 50 / 50 Fly Ash - Lime
9% Portland cement
OMC γdry max OMC γdry max OMC γdry max OMC γdry max OMC γdry max
(%) (pcf) (%) (pcf) (%) (pcf) (%) (pcf) (%) (pcf)
Clay 18.5 103.2 22.7 98 19.8 98 19.9 98.6 N / A N / A
Silt 15.3 113.5 N / A N / A 20.8 98 18.1 99.2 16.4 104.3

26
Figure 15. pH of Stabilizing Agents in Water
12
12.1
12.2
12.3
12.4
12.5
12.6
12.7
12.8
12.9
13
0% 1% 2% 3% 4% 5% 6% 7% 8% 9% 10%
Percent Stabilizer
Quick Lime Lime Kiln Dust Portland Cement 50% Fly Ash / 50% Quick Lime
Figure 16. Typical pH Test Curve - Clay and Quick Lime
77.5
88.5
99.510
10.511
11.512
12.513
0% 1% 2% 3% 4% 5% 6% 7% 8% 9% 10%
Percent Stabilizer

27
Three-Dimensional Swell Testing of Modified Soils The clay bulk sample, originally taken from the slope at MM 17, was tested for 3-D swell performance when treated with the M.O. amounts of applicable stabilizer agent combinations. The results are shown in Table H. The results of the swell testing done at the optimum water content illustrate the possible benefits of these treatments. However, the results of the swell tests done at initial water contents of 4% below optimum show the full measure of what has been accomplished with swell reduction. The natural soil at 4% below optimum expressed a horizontal swell of 3.3% and vertical heave of 7.3%. Addition of 6% quicklime reduces this to 0.4% horizontal swell and 0% vertical heave. When adding 8% LKD the horizontal swell goes to 0% and vertical heave to 0.04%. The addition of 10% of the 50/50 mixture of QL and Fly Ash resulted in a horizontal swell of 0.05% and 0.1% vertical heave. All of these combinations have provided sufficient swelling potential reduction to warrant their use for this purpose. Testing of the clay in 3-D swell with high water contents, above optimum, would likely result in lesser swelling potential. Although this would have been interesting for comparative purposes, it is highly unlikely that an exposed slope of clay, or silt either, would remain moisture stable. In fact, through drying and wetting cycles would present the worse case of swelling following a drying cycle, such as represented by the specimens at lower water contents than the optimum.
Figure 17. Typical Atterberg Limits Series Curve - "Clay" and Quick Lime
0
10
20
30
40
50
60
70
0% 2% 4% 6% 8% 10% 12%
Percent Stabilizer
Liquid Limit Plastic Limit

28
Table H. 3-D Swell Performance of Treated Clay
Target WC % Dry Unit Wt. pcf % Horizontal Swell % Vertical Swell
Natural at OMC 19.2 103.5 2.9 3.4 -4% OMC 15.6 100.1 3.3 7.3
6% QL at OMC 24.8 101.6 0.0 0.0 -4% OMC 17.2 99.74 0.4 0.0
8% LKD at OMC 18.1 102.9 0.0 0.0 -4% OMC 15.3 100.6 0.0 0.0
10% 50/50 at OMC 21.0 100.21 0.0 0.0 -4% OMC 17.0 99.0 0.1 0.1
The bulk sample taken from the fill at MM 24 was also tested for its 3-D swelling characteristics when treated with Portland cement, LKD and the 50/50 mixture of QL and fly ash. The results of these tests are given in Table I. The untreated silt soil had similar 3-D swelling characteristics in the natural state irregardless if compacted at drier or optimum water contents. It showed a tendency to swell horizontally of about 3% and a vertical heave potential of about 2.2%. This swell behavior was dramatically improved, even at lower water contents with the addition of 10 Portland cement. The resulting horizontal swell was 0.02% and vertical heave was 0.04%. Adding LKD at the 6% level to this soil effectively eliminated its swelling potential. The 50/50 mixture of QL and fly ash when added resulted in a reduction of swelling potentials to below 0.08% horizontally and 0.1% vertically. All of these treated soil swell potentials are well within acceptable limits, proving the efficacy of these treatments.
Table I. 3-D Swell Performance of Treated Silt
Target W.C. % Dry Unit Wt. pcf % Horizontal Swell % Vertical Swell Natural at OMC 15.2 103.3 3.1 2.2
-3% OMC 10.9 97.9 2.9 2.3
10% PC at OMC 16.2 104.1 0.0 0.0 -3% OMC 14.2 103.3 0.0 0.0
6% LKD at OMC 20.3 100.1 0.0 0.0
-3% OMC 17.8 100.6 0.0 0.0
6% 50/50 at OMC 18.3 102.2 0.0 0.0 -3% OMC 15.2 101.5 0.1 0.1

29
Selection of Percent Agents for Strength Testing In order to provide strength results in percentage ranges that would more than cover the amount needed for optimal stabilization, the average percent needed for modification, 7.5%, for all agent and soil combinations was used to set up a range. It was deemed necessary to test at 0% and percents slightly below the level for modification (7.5% average) and at percents approximately twice the average M.O., staying within practical levels. The percentages of agents used included 0, 4 and up to 14% in 2% increments. Unconfined Compression Testing for S.O. Selection Because of the ease of preparation, curing and testing, the unconfined compression test has long been used to determine the amount of agent to add to a soil for the purpose of strength gain or stabilization optimum. In addition, it has proven through experience to correlate well with the field performance of stabilized soils. For these reasons, in this study, the unconfined compression test was utilized to determine the Stabilization Optimums (S.O.'s), which would be used eventually to treat soils specimens for direct shear testing, wet-dry testing and freeze-thaw testing. In order to provide determination of unconfined compression strength improvements provided by the treatments, selected undisturbed samples and remolded samples were tested. The undisturbed specimens were trimmed from Shelby tube samples to be approximately twice as long as they were in diameter. Remolded specimens were 2.5 inches in diameter and 5.0 inches long. Preparation of specimens for unconfined compression testing was complete early in July 2000. Three specimens were prepared at the levels of 0, 4, 6, 8, 10, 12, and 14 % agent or agent mixtures by dry weight for each soil and agent combination. The total number of specimens prepared was 114. These were cured for 28 days then tested for their unconfined compression strength. The results of unconfined compression testing of undisturbed specimens are given in Table J. The unconfined compression strength of these materials varied from about 13 psi to about 29 psi as their water contents and dry unit weights also varied. Higher strengths corresponded with higher dry unit weights and lower water contents, as expected. Considering information about these materials shown before, their strength results are not differentiated by soil type.
Table J. Unconfined Compression Results-Undisturbed
Soil Maximum Stress
Water Content
Dry Unit Weight
(lb/in2) (%) (lb/ft3) Sample 206 12.75 38.48 82.06 Sample 213 22.62 28.42 93.50 Sample 224 14.35 24.75 97.88 Sample 228 29.13 29.10 93.05
Unconfined Compression specimens were compacted at water contents close to their optimum using the bulk samples. It is important to note that the compaction results given earlier reflected what dry unit weights could be achieved when all the soil compacted was pulverized to pass the #4 U. S. series sieve, while these were compacted at normal field gradations for modified or stabilized soils. This was also be the case for all treated soils to be tested. All the untreated and treated soils used to mold
30
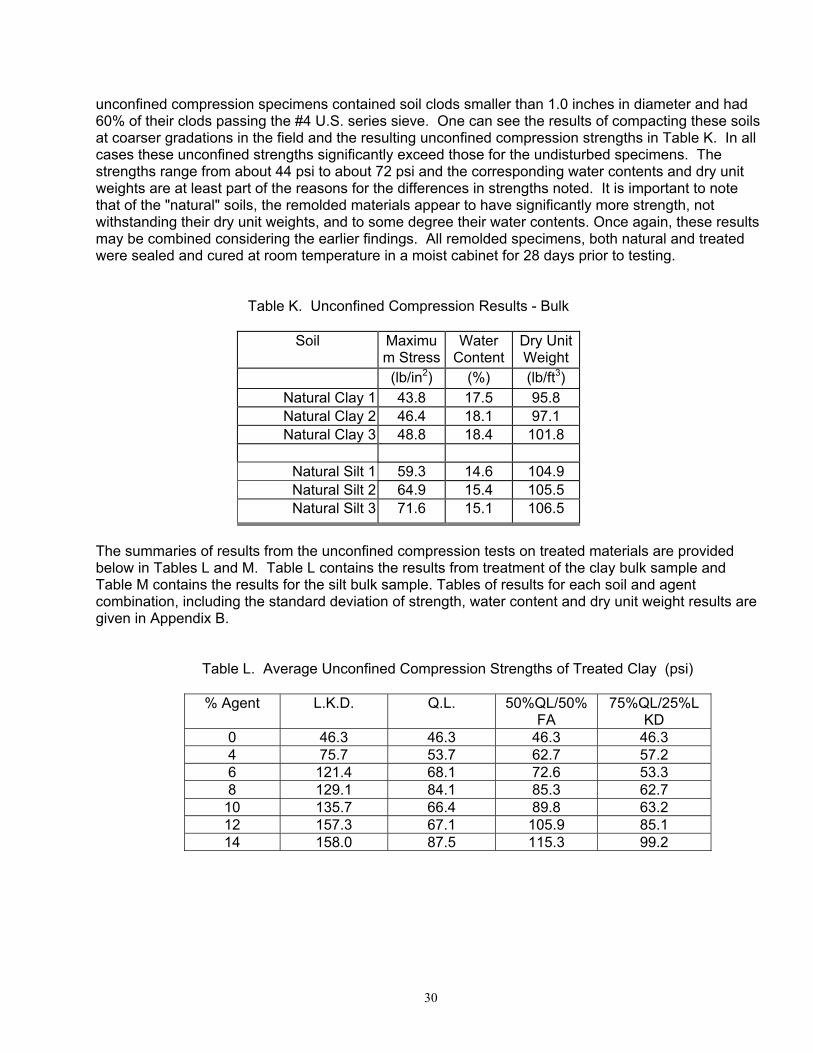
unconfined compression specimens contained soil clods smaller than 1.0 inches in diameter and had 60% of their clods passing the #4 U.S. series sieve. One can see the results of compacting these soils at coarser gradations in the field and the resulting unconfined compression strengths in Table K. In all cases these unconfined strengths significantly exceed those for the undisturbed specimens. The strengths range from about 44 psi to about 72 psi and the corresponding water contents and dry unit weights are at least part of the reasons for the differences in strengths noted. It is important to note that of the "natural" soils, the remolded materials appear to have significantly more strength, not withstanding their dry unit weights, and to some degree their water contents. Once again, these results may be combined considering the earlier findings. All remolded specimens, both natural and treated were sealed and cured at room temperature in a moist cabinet for 28 days prior to testing.
Table K. Unconfined Compression Results - Bulk
Soil Maximum Stress
Water Content
Dry Unit Weight
(lb/in2) (%) (lb/ft3) Natural Clay 1 43.8 17.5 95.8 Natural Clay 2 46.4 18.1 97.1 Natural Clay 3 48.8 18.4 101.8
Natural Silt 1 59.3 14.6 104.9 Natural Silt 2 64.9 15.4 105.5 Natural Silt 3 71.6 15.1 106.5
The summaries of results from the unconfined compression tests on treated materials are provided below in Tables L and M. Table L contains the results from treatment of the clay bulk sample and Table M contains the results for the silt bulk sample. Tables of results for each soil and agent combination, including the standard deviation of strength, water content and dry unit weight results are given in Appendix B.
Table L. Average Unconfined Compression Strengths of Treated Clay (psi)
% Agent L.K.D. Q.L. 50%QL/50%FA
75%QL/25%LKD
0 46.3 46.3 46.3 46.3 4 75.7 53.7 62.7 57.2 6 121.4 68.1 72.6 53.3 8 129.1 84.1 85.3 62.7
10 135.7 66.4 89.8 63.2 12 157.3 67.1 105.9 85.1 14 158.0 87.5 115.3 99.2

31
Table M. Average Unconfined Compression Strengths of Treated Silt (psi)
% Agent L.K.D. P.C. 50%QL/50%FA
75%QL/25% LKD
0 65.3 65.3 65.3 65.3 4 62.9 90.1 45.5 49.1 6 61.2 111.4 61.4 51.4 8 71.2 134.2 80.2 58.1
10 89.5 179.8 103.2 68.0 12 94.3 287.9 124.3 78.9 14 106.2 235.8 120.7 99.2
Corresponding figures that illustrate the nature of these unconfined compression results and make comparisons easier are given in Figures 18 and 19. When comparing the results provided above and below and those included in Appendix B, there are indications of how well each agent worked and how the differences in dry unit weights and water contents may have been part of the strengths that resulted. First of all, the silt soil compacts more easily and at a lower water content, thereby, perhaps, providing a situation that provides higher strengths. Second, the variance of dry unit weights and water contents in remolded treated soils in all cases are small, owing to the tight controls used during their compaction. Each cylinder was molded using samples carefully prepared and sealed in plastic bags until compaction, selected amounts of the soil were put in a mold and were compressed to a desired unit weight one third of the specimen at a time. Even though this procedure was followed and each specimen was cured under the same conditions, the variance of the resulting strength is significantly higher than that of the dry unit weight and water contents. The major cause of these variations in unconfined compression strength are believed due to differences in soil constituents from less than perfect mixing and in the gradation of clods compacted into each specimens. After compaction, the interactions between compacted clods will vary, affecting unconfined compression strength. These results further support the use of at least three replications of each treatment for this process. What becomes apparent in Tables L and M and in Figures 18 and 19 are the agents and levels of treatment that should be used for possible treatment and for further testing in direct shear, wet-dry and freeze-thaw. At times analyses of such results are based on target unconfined strengths needed for the treated soil. During this research the percent agent that provided maximum unconfined strength was of most concern. The developed stabilized unconfined strengths were compared, however, and the percent of agents needed to provide approximately 100 psi unconfined compression strength were taken as a minimum percentage to be used as the S.O.. The treated clay reacted well with LKD and better with the 50/50 mix of QL and fly ash than with the QL alone. The addition of 6% LKD provided very good strength gain at this M.O., while the quicklime and 50/50 mix provided moderately good strength at 8%. At the 12% level of treatment, LKD provided very good strength gain and the 50/50 mix provided good strength gain, while that provided by the quicklime had dropped. These results only would support using 12% LKD or the 50/50 mix for stabilization of the clay. It is important to remember that the soil called the "clay" was not 100% clay and the soil called the "silt" was not 100% silt. Both are actually mixtures of clay and silt. Because of the clay present in the "clay" soil and the amount of silt present, as it turns out, the use of QL by itself is not as effective at providing strength gain as the mixture of QL and fly ash and the LKD, since they contain constituents with which to form pozzolans. The results for the treated silt are similar, however, somewhat different. At the 6% treatment level, the M.O., The LKD did not provide as much strength as in the clay, and this strength represents little

32
change from the untreated remolded soils. This is the case with all the agents applied for this level of treatment, except for Portland cement. Addition of 6% Portland cement provided good to very good strength gain. When looking at the 12% treatment level this trend is more pronounced. The addition of Portland cement provided the largest strength gain of all combinations and soils tested, and it provided an over four-fold increase in strength over the untreated remolded soil. The addition of 12% LKD provided a good to very good strength gain, and the same percent of the 50/50 mix provided good strength gain. These results support the use of 12% Portland cement, LKD or the 50/50 mix of quicklime and fly ash for stabilization of the silt. The decision was made following the unconfined compression testing that treatment levels of 6% and 12% would be used for the final stages of testing on both soils. The remaining specimens for direct shear, wet-dry and freeze-thaw testing were prepared using the field gradation materials discussed above and specimen preparation techniques similar to that discussed above. Because of the generally poor results obtained using a mixture of 75% quicklime and 25% LKD, this agent combination was dropped from further consideration. This had been tried because of the possibility of making a slurry of this combination to apply, and because it had reportedly been successful in the treatment of District 6 silty soils for modification to prepare subgrades as a construction platform for paving. Prior to all remaining tests, each specimen was sealed in a plastic bag, in a moist cabinet, at room temperature, for the prescribed periods of days of cure.

33
Figure 18. 28 Day Unconfined Compression Strengths for Treated Clay
Figure 19. 28 Day Unconfined Compression Strengths for Treated Silt
0
20
40
60
80
100
120
140
160
180
0% 2% 4% 6% 8% 10% 12% 14% 16%
Percent Stabilizer
Lime Kiln Dust Quick Lime 50% Fly Ash / 50% Quick Lime 75% Quick Lime / 25% Lime Kiln Dust
0
50
100
150
200
250
300
350
0% 2% 4% 6% 8% 10% 12% 14% 16%
Percent Stabilizer
Lime Kiln Dust 50% Fly Ash / 50% Quick Lime Portland Cement 75% Quick Lime / 25% Lime Kiln Dust
34
Direct Shear Testing Direct shear testing was done in three phases. The first testing was done on remolded specimens compacted from the bulk samples. The second phase was done on treated and compacted specimens of the bulk samples and the third was done on selected undisturbed samples. All specimens compacted were prepared under the same controls used for unconfined compression specimens and were compacted to make specimens just high enough for direct shear testing and 2 and 1/2 inches in diameter. All compacted specimens for direct shear testing were sealed into plastic bags and cured at room temperature in a moist cabinet for 28 days prior to testing. Direct shear specimens were cut from undisturbed samples to the same dimensions and tested as soon as possible afterward. In all cases, the remolded untreated and treated specimens were manufactured so that two complete direct shear tests could be done for each treatment and soil. Since only selected undisturbed samples were available, one complete direct shear test set of specimens was trimmed from each sample. The purpose of using direct shear testing was to be able to develop the peak and residual shear strength parameters for each soil and combination. During the first phase of testing, the rate of testing to produce an apparent fully drained or effective stress condition was investigated. This was believed to require the slowest shearing rate for the clay samples. As can be seen in the results of that testing on the remolded bulk sample materials, in Table N, a cohesion intercept of zero was achieved at a strain rate of 0.05% strain per minute. In order to have consistent comparisons with untreated samples, treated samples and undisturbed samples, this rate of testing was used throughout all phases of direct shear testing. As discussed below, the results achieved for the undisturbed samples, which were tested last, show cohesions developed that differ significantly from those for the bulk samples. The reasoning for this will be discussed later. It will be seen that the remolded bulk sample strengths from direct shear testing will be similarly lower than those for the undisturbed samples, as was the case in the unconfined compression testing. Typical and average values of direct shear strength parameters will be given during this discussion and the remaining, more detailed results, can be found in Appendix B. The presentation of direct shear testing results will begin with those for the remolded untreated bulk soils and the treated soils, then proceed to those for the undisturbed samples. The results for the bulk samples, untreated and treated, are summarized in Tables N and O. Each resulting cohesion and phi angle are based on a total of 6 points developed for two test sequences and the R2 value from the linear regression line are shown next to them. Although some straight line fits are not very close to the resulting data, most have a very close fit. The regression fit was best, as can be seen, for the residual strengths and least well fit for the untreated soils. Table N contains the direct shear results for the bulk clay sample, untreated and treated. It can be seen that the untreated sample when remolded had a zero cohesion intercept (actually it was very slightly negative for the best fit) for both peak and residual values. The resulting phi values are considered reasonable, but on the high side for a clay. The largest difference for the treated soils was the cohesion intercept in all cases being well above zero, and the next pleasing result was the phi angles were 1 1/2 to 2 times those for the untreated clay. There was an expected loss in cohesion from the peak to residual values, but these were very respectable values in residual behavior. It appears that, looking only at the residual values, the addition of 6% of the 50% quicklime and 50% fly ash mixture provided the best low percentage residual results, while the addition of 12% quicklime provided the best high percentage results. All of the applications tested in this sequence can be considered viable stabilization processes for residual direct shear strengths. When considering the peak values of strength measured, the stabilization effects are even stronger.

35
Table N. Direct Shear Test Results for Bulk Clay-Untreated and Treated - Average of Two Tests
% Agent Peak C (psf) Peak Φ(o) Peak R2 Res. C (psf) Res. Φ (o) Res. R2
0 Zero 22.0 0.60 Zero 20.8 0.63 6% Q.L. 2699 41.4 0.85 921 36.5 0.94
12% Q.L. 3053 46.6 0.84 746 40.4 0.69 6% LKD 4146 38.3 0.88 985 32.1 0.91
12% LKD 4694 38.1 0.87 1741 30.6 0.87 6% 50/50 2680 49.4 0.88 714 39.4 0.95
12% 50/50 5465 41.0 0.84 1441 30.3 0.67
Table O. Direct Shear Test Results for Bulk Silt-Untreated and Treated - Average of Two Tests
% Agent Peak C (psf) Peak Φ (o) Peak R2 Res. C (psf) Res. Φ (o) Res. R2 0 242 19.8 0.86 242 19.7 0.86
6% P.C. 6255 50.9 0.47 173 37.6 0.89 12% P.C. 6462 58.0 0.72 774 35.7 0.96 6% LKD 2820 31.3 0.94 1016 31.0 0.84
12% LKD 1792 44.9 0.95 7 41.5 0.84 6% 50/50 3346 34.9 0.89 1088 38.8 0.95
12% 50/50 2718 47.2 0.96 753 40.5 0.98 Study of the results from direct shear testing on bulk silt specimens, untreated and treated, shown in Table O above, indicate differing phenomena taking place. First of all, the silt materials have similar cohesion intercept and phi angles for the peak and residual values. The phi angles measured are similar as that measured for the residual value in the clay and the cohesion intercept is a relatively low value as well for the silt. Obviously the addition of Portland cement to the silt soil provide it with very large peak direct shear cohesion and friction. However, the residual strengths of the same materials have low cohesion and phi angles no better than that achieved by other agents. The overall best residual strength agent performance shown for the silt for both levels of agent added, is by the 50% quicklime-50% fly ash mixture. One unusual property change is noted in the results of the silt treated with 6% of the 50/50 mixture. The residual phi angle measured is larger than the peak phi angle. This is the opposite of the expected results and may be due to the shift of shear resistance within the materials, but could also have to do with the fit of the straight line to the data determined. It can be noted that, for the untreated and treated silt, the changes of phi angles from peak to residual values is mixed between virtually no change to large changes, and to this one increase of phi, indicating that treated materials do not follow the same behavioral patterns as generally seen for untreated soils. Direct shear testing of undisturbed samples from both borings showed results that were unexpected. A summary of these is given in Table P. The results for sample 204 are given in two forms, the first using all data points and the second disregarding the data from the highest confining pressure. This is done because regression analyses of the complete data set provides, as seen in the table, negative friction angles. The second listing of results is believed to be more correct and does correlate well with that for the other samples. The residual cohesion intercepts and friction angles measured are significantly different than those found for the remolded bulk sample untreated materials. In the case of the clay soil, which would correspond to the samples 221 and 230, the remolded material had zero residual cohesion and a residual friction angle of 20.8 degrees. Samples 221 and 230 had residual cohesion

36
and residual friction angles of about 5 degrees. The silt remolded bulk soil, corresponding to samples 204 and 212, had a low residual cohesion and residual friction angle of 19.7 degrees, while the undisturbed samples had significantly more cohesion and residual friction angles averaging about 9 degrees. The variance of properties shown in Table P further indicate the nature of the fill soils of this area. When comparing these undisturbed direct shear results with those of the treated soils, it is possible to see the benefits of stabilization.
Table P. Direct Shear Test Results - Undisturbed
Sample No. Peak C (psf) Peak Φ (o) Peak R2 Res. C (psf) Res. Φ (o) Res. R2 204 (3) ★ 1378 -2.6 0.13 1126 -2.7 0.29 204 (2) ★ 838 9.0 (1.0) 778 4.7 (1.0)
212 ★ 930 12.7 0.98 607 12.9 0.99 221 ◆ 646 6.9 0.99 519 5.5 0.98 230 ◆ 945 7.1 0.98 796 5.0 0.98
★ MM 24 - Silt ◆ MM 17 - Clay Wet-Dry and Freeze-Thaw Testing The wet-dry and freeze-thaw tests were chosen to determine how well the untreated and treated materials would respond to these extreme weathering processes. The procedures followed were as close to ASTM standards D 559-96 and D 560-96as possible, considering the equipment available to conduct the tests. Specimens were compacted using materials prepared as close to field specifications as possible, as described earlier. All treated materials, except those treated with Portland cement, were allowed to mellow for approximately 24 hours before compaction. The Portland cement treated materials were compacted immediately after treatment. Wet-dry specimens were made in the 1/30 cubic foot molds, resulting in a specimen height of 4.58 inches and diameter of 4.0 inches. The freeze-thaw apparatus used required limiting the size of specimens to 2.5 inches high and 2.5 inches in diameter. All wet-dry and freeze-thaw specimens were cured at room temperature in a sealed plastic bag, inside a moist cabinet, for 7 days prior to testing. Percent of loss of dry weight of soil specimen is cumulative for the cycles listed and is determined once per cycle of wet-dry or freeze-thaw. Because of the differing agent combinations used, the results for the silt and clay bulk samples will be shown separated. Table Q contains the wet-dry and freeze-thaw results for the untreated and treated silt. Table R holds similar results for the clay materials. More detailed results are available in Appendix B. It is important to note that, although many specimens did not make it through the complete 12 cycles of these extreme weathering tests, the treated soils in many cases did well.

37
Table Q Wet-Dry, Freeze-Thaw Results for Bulk Silt Soil
Natural Portland cement Lime Kiln Dust 50% Quick Lime / 50% Fly Ash
6% 12% 6% 12% 6% 12% Wet / Dry
Cycles Completed, (Average of 2 Tests)
0 12 12 12 12 12 12
Average Soil Loss, (% of dry weight)
Failed (Fell Apart)
32.86 8.89 69.53 59.32 51.00 37.19
Freeze / Thaw
Cycles Completed, (Average of 2 Tests)
0 12 12 6 8 10 11
Average Soil Loss, (% of dry weight)
Failed (Fell Apart)
61.24 6.43 Failed Failed Failed Failed
The untreated silt specimens were unable to endure any cycles of either the wet-dry or freeze-thaw tests. All treatment combinations tested were able to provide the silt soil with good resistance to wet-dry testing, however, the Portland cement treated silt performed best for both percents agent added, while the specimens treated with 50% quicklime and 50% fly ash were second in resistance to wet-dry testing. Also, the Portland cement treated silt specimens resisted the effects of freeze-thaw well, as expected. The 50%/50% agent mix provided this silt with good resistance to freeze-thaw testing, such that the specimens completed 10 and 11 cycles before coming apart. It is interesting to note that the LKD treated silt specimens did not perform nearly as well as those treated with the other agent combinations.
Table R. Wet-Dry, Freeze-Thaw Results for Bulk Clay Soil
Natural Quick Lime Lime Kiln Dust 50% Quick Lime /
50% Fly Ash
6% 12% 6% 12% 6% 12%
Wet / Dry Cycles Completed,
(Average of 2 Tests) 0 12 12 3 8 7 8
Average Soil Loss, (% of dry weight)
Failed (Fell Apart)
60.97 72.21 Failed Failed Failed Failed
Freeze / Thaw
Cycles Completed, (Average of 2 Tests)
0 5 5 6 8 7 10
Average Soil Loss, (%of dry weight)
Failed (Fell Apart)
Failed Failed Failed Failed Failed Failed

38
As was the case with the silt soil, the bulk clay soils were unable to endure either the wet-dry or freeze-thaw extreme weathering tests. However, selected specimens of the clay, when treated with quicklime were able to endure all the cycles of the wet-dry test and a few cycles of the freeze-thaw test. In addition, the specimens treated with the 50/50 mixture of quicklime and fly ash were able to endure several cycles of the wet-dry tests and many cycles of the freeze-thaw tests. The specimens treated with LKD exhibited performances between those of the specimens treated with quicklime and the 50/50 mixture. These performances of treated clay do indicate significant improvement over those of the untreated clay. SLOPE STABILITY ANALYSES: A limited number of slope stability analyses were conducted using the properties of untreated soils from this project. It is believed necessary to use the residual strengths measured for this, since these slopes have sufficient clay in them and the climatic conditions are such that the actual strength of the soil in most cases is its residual strength. Most often, slopes in the locale where these samples have been taken that have failed, especially having near-surface or shallow failures, have been repaired by pushing the failed soil back up in place and compacting it using maintenance equipment available. For this reason, the analyses done using the properties of the remolded bulk samples are most meaningful. Table S includes the results of the analyses done. In all cases the slopes appear to be stable when laid back at a 3H:1V angle. The remolded bulk samples soils were unable to stand on a 2H:1V slope, which is indicative of why the slopes were failing in the field. The undisturbed samples provided stability when constructed on a 2H:1V slope; however, this is mainly because they retained some cohesion in the residual testing process. If only their friction angles were used, without cohesion, the undisturbed samples would fail at even flatter slopes than the remolded soils. Considering the large increases of residual cohesion and, especially, friction angle measured for treated soils in this project, it is expected that the treated soils can be constructed and remain safe in slopes steeper than 2H:1V. None of these analyses were done using any seismic loading, which has, undoubtedly contributed to some of the slope failures in the region studied. MoDOT personnel have reported that small tremors are felt on a fairly frequent basis, although, none of the slope failures noted could have been triggered by a significant seismic event, since none have recently occurred. If this were included all factors of safety presented would be diminished some.
Table S. Slope Stability Results - Factors of Safety
Silt Soils MM 24 3 H : 1 V 2 H : 1 V Remolded (No C) 1.196 0.833
Sample 204 (C & Φ) 2.387 2.139 Sample 212 (C & Φ) 2.868 2.434
Clay Soils MM 17 3 H : 1 V 2 H : 1 V Remolded (No C) 1.427 0.797
Sample 221 (C & Φ) 1.455 1.216 Sample 230 (C & Φ) 1.842 1.578
The slope stability increases assumed to occur when the subject soils would be stabilized are based on the increases of shear strength caused by the addition of the agents. An assumption made, but not stated, then, is that the entire slope, that is to say the part most susceptible to slope failure, has been rebuilt using stabilized soils. This is likely to occur since rebuilding these slopes should be done by

39
removal of about 8 feet depth of the slope face, after topsoil is removed, treating this soil and building the slope back in horizontal layers 8 feet wide and about 1 foot deep using the stabilized soil. ECONOMIC CONSIDERATIONS: Since the reports of MoDOT maintenance personnel indicate that many of the slopes that have failed in the region of this study have done so almost yearly. It is difficult to estimate how long these slopes may have resisted slope failure again if they had been rebuilt using horizontal layers for rebuilding rather than merely pushing the material back up the slope. The author's experience indicates that slope failures would have once again happened in these rebuilt slopes every three to five years, but no evidence is available from MoDOT to support this. The cost of rebuilding slopes by pushing materials back up the slope is also difficult to estimate, as is the cost of maintenance personnell rebuilding the slopes using more thorough methods, as described above. If the object of soil stabilization was to add the most costly of the materials most likely to be used to repair these slopes, quicklime, one could estimate the cost of adding this material to reconstructing these slopes using horizontal layers as described above. Using 12% quicklime by dry weight of soil and having a soil dry unit weight of 100 pcf would require 12 pounds of quicklime per cubic foot of treated soil. If the slope was 20 feet high and 100 feet long, and was rebuilt to an 8 foot depth, it would take, 16,000 cubic feet, it would take 192,000 pounds or 96 tons of quicklime to do the treatment. If quicklime costs $100 per ton delivered and in place, the total additional cost of the treatment would be $9,600. When applying this treatment, as indicated by much experience, the repair could be considered permanent, so that this added cost of $9,600 could be considered spread out over the many years of life of the slope. If the life of the slope is 40 years and the best service life without slope failure was considered to be 5 years then the cost per year is $240 and per repair is $1,200. This is when the repairs are done using horizontal layers and these repairs would easily surpass the cost of $1,200 each. It is, therefore, considered economical to use as expensive an agent as quicklime to repair these slopes. What is more interesting, the use of 50% quicklime and 50% fly ash would be considerably less costly, since the cost of the fly ash is about 1/4 of that for quicklime. The use of LKD to stabilize these slopes would be even less than the repair using the 50/50 mixture, since the cost of LKD is about 1/4 to 1/3 of that for quicklime. This low additional cost of permanent repair would be more than completely paid for by the cost of doing the repairs, even when done by maintenance personnel, each 5 years, without the addition of an agent. Economics of long-term maintenance of slopes, therefore, favors the use of the stabilizing agents recommended by this study. RESULTS AND DISCUSSION: The results presented in this report are complete. Their significance has been discussed in the paragraphs above to a great extent. The soils sampled in bulk have the appearance of acting like a silty soil and a clayey soil, but both are classified as A-7-6 by AASHTO. They differ in their grain size distributions mainly by the percent clay they contain. The clay exhibited swelling tendencies on the high end of moderate, while the silt exhibited somewhat less and moderate swelling potential. Their compaction characteristics follow what would be expected for these types of materials and, when treated with the agents, changes to these behaviors were as expected. Both soils appear to be successfully modified and stabilized by the agents applied to differing degrees for differing agents. The agents utilized appear to be able to modify these soils at practical percentages of application and stabilize them to different degrees, depending on the measure of stability.

40
Testing so far on the undisturbed samples indicate that at both sites they vary significantly within the fills. For each fill the materials tested have similar slopes to their grain size curves, with one exception, so that the major differences may be in their percent clay. The strength characteristics of these samples are as varied as their other properties, making it difficult to compare results of these, the bulk sample materials, or the treated materials as the silt or the clay soil. All the untreated soils tested are considered representative of the Mississippi embayment soils of the Hayti area and can be discussed as one group for that reason. After initial strength testing the combination treatment of 75% Quicklime and 25% LKD was dropped. Stability of these materials, as measured by 3-D swell testing, unconfined compression testing, direct shear testing, wet-dry testing and freeze-thaw testing has been significantly improved by the addition of the agents and combinations applied. In all cases the swelling nature of the soils tested is improved to acceptable levels with the addition of the Modification Optimum of agents tested. The addition of up to 12% LKD by dry weight to the clay soil provided over a 3-fold increase in unconfined compression strength, while when added at the M.O. this strength was more than twice the untreated. The addition of quicklime was not as successful in providing unconfined compression strength, while the addition of a 50/50 mix of Quicklime and Fly Ash provided over half as much unconfined compression strength increase as the LKD. When added to the silt soil, the Portland cement provided large unconfined compression strength increases to two times the natural strength at the M.O. and over 4 times the natural strength at the S.O. In this soil the addition of the 50/50 mixture provided higher unconfined strengths, than the LKD. However, the LKD caused strength increases are still significant at the S.O. levels of treatment. When considering only the residual strength testing done, it is readily apparent that the agents tested were very effective at improving stability. The cohesions developed are significant and would be instrumental in providing excellent stability, while the friction angles resulting are 1 1/2 to 2 times that measured for the untreated soils. The results for the clay soils indicate that the addition of Quicklime provided more overall residual direct shear strength than did the 50/50 mixture, while that provided by LKD was significant. In the case of the silt soil, additions of the 50/50 mix provided the best overall residual direct shear strength, while that provided by LKD was next and that from the addition of Portland cement was close to that for LKD. It is important to note that without the addition of enough stabilizer, such as in the case of quicklime, there is a risk of some modification effects being lost. It is believed that if enough stabilizer is added to provided significant pozzolan cementation and related strength gain happens, this risk is significantly reduced. The wet-dry results indicate that addition of quicklime to the clay will result in the best performance, at either level of treatment used, that 12% LKD will work moderately well, as will either percentage applied of the 50/50 mixture. All agent percentages added to the silt tested appear to provide protection from this type of weathering, with both levels of Portland cement working the best, and the 50/50 mixture being next most successful. The Freeze-Thaw test environment is the most extreme applied to these soils during this project. The clay appears to be most successfully protected from freeze-thaw by the addition of either percent of the 50/50 mixture of Quicklime and Fly Ash. The LKD percentages were almost as successful, and the quicklime did provide a fair amount of protection. The silt soil was most successfully protected from freeze-thaw by the addition of either percent of Portland cement, while the next most successful protection treatments were with the 50/50 mixture. Lime Kiln Dust did provide a fairly good resistance to the actions of freeze-thaw, as well.

41
It is evident from the results provided above that these soils, when untreated and placed in a fill of significant height and at the angles of slopes noted along I-55 south of Sikeston, will fail eventually. It is also evident that stabilization using the agents applied during this project will prevent these failures and erosion of the slopes. CONCLUSIONS: The completion of this project is due to the efforts of many, including MoDOT District 10 personnel, our contact person, Tom Fennessey, and the fine research and technical staff at UMR. Mike Myers, District 10 Geologist and the maintenance crews at Hayti were instrumental in the process of collecting the bulk samples, and Tom Fennessey coordinated the undisturbed sampling of fill soils, making timely availability of these soils. The fine efforts of Bob Myers, research assistant at UMR, have been the main contributing factor of the success of this project. The results and discussion above lead to the following conclusions derived from this project: 1. The existing fill soils along I-55 south of Sikeston, Missouri, have the potential to fail, at least in
shallow and progressively more problematic failures. Currently applied methods of reconstruction of these failed slopes by pushing the materials back in place are not effective in providing a stable slope for more than one year, most of the time.
2. The natural soils within the scope of this study are highly variant both vertically and horizontally, so
much that they should not be separated into categories of silt or clay soils, as were the bulk samples. All the soils borrowed from the Mississippi embayment area to build fills should be grouped into one material for construction and remediation efforts.
3. The additions of 6% by dry weight of all the stabilizers included in the final stages of testing, when
applied correctly to these soils will provide modification, which reduces plasticity and shrinkage, and substantially reduces swelling tendencies. Although these modification optimum treatments essentially eliminate the reasons for cyclic shrink-swell shear strength reduction of the natural soils tested, they would not be considered permanent in resisting leaching of agents from the soils.
4. The additions of 12% by dry weight of the stabilizers applied to the silt bulk sample provided
adequate unconfined strength, excellent residual direct shear strength, good to excellent wet-dry protection and at least moderate resistance to freeze-thaw testing. When this level of agent of the types tested is added properly to the soils tested, its effects are considered permanent.
5. The additions of 12% by dry weight of the stabilizers applied to the clay bulk sample provided
adequate unconfined strength, excellent residual direct shear strength, fair to excellent wet-dry protection and at least fair to moderate resistance to freeze-thaw testing. The effects gained by additions of this level of agent to the soils tested are considered to be permanent.
6. The slopes along I-55 south of Sikeston, Missouri can be effectively stabilized using practical
amounts of the some of the stabilizers tested in this project. It is likely, considering all the factors measured during this project, that the 50/50 mixture of Quicklime and Fly Ash may be the best overall stabilizer combination studied. The use of LKD at stabilization levels may also be acceptable. It is clear that the cost of the addition of these agents, even at stabilization levels, when the treatments are permanent, is more than offset by the savings of maintenance of failed slopes every five years or more often.

42
RECOMMENDATIONS: It is recommended that field treatments of existing failed or apparently stable slopes along I-55 south of Sikeston, Missouri, be accomplished and that the treated slopes be monitored for performance for as long as possible, and at least two years. Treatments to be applied should be determined by cooperation of the PI, appropriate MoDOT personnel, utilizing the economic realities and availability of stabilizers and personnel to rebuild the slopes. The most likely treatments will include levels of treatment at the 12% level of agent by dry weight of soil, using at least LKD, and the 50/50 mixture of Quicklime and Fly Ash. These are agents have been proven to be effective in the soils tested, that are believed to represent the soils of the area, and the level of treatment will assure permanent improvements in the field. Implementation Plan The benefits to MoDOT and the State during this project have been a determination of natural properties of the silt and clay soils along the I-55 corridor, south of Sikeston, an investigation and optimization of agents which may be effectively used for slope repair and construction, and a set of recommendations for application of these findings. The economics of the use of these agents has been described above and indicates that, over the life of the slopes, the application of the agents recommended will be paid for by reduced maintenance costs. In order to prove out this concept, soils from slopes that have failed should be treated with 12% by dry weight of soil with the agents recommended, and should be rebuilt using similar construction procedures, without addition of agents, to determine the actual field benefits of agent additions. These slopes should be rebuilt by removal of the failed material to a depth equal to at least the width needed to work a layer in place, followed by rebuilding one treated horizontal layer at a time. Once the actual benefits indicated by the performance of these trial slopes are known, the development of maintenance policies and methods should be implemented. In the long-term, as maintenance records are reviewed, these benefits will be further substanciated. PRINCIPAL INVESTIGATOR AND PROJECT MEMBERS: Dr. Thomas M. Petry, the PI, has directed the progress of the project, has personally traveled to Hayti to obtain the bulk samples and set the locations for undisturbed sampling, has coordinated activities and reporting with the MoDOT Contact, Tom Fennessey and supervised the planning for and accomplishment of testing done. Mr. Bob Myers, Graduate Research Assistant, has conducted most of the preparation and testing of soils, supervised an undergraduate research assistant and coordinated and managed the laboratory. He has coordinated equipment and procedures being used, and provided valuable input for this report. Mr. Bryan Gregory, Undergraduate Research Assistant, has joined the team on this project for the summer semester. He is earning upper level credit for his participation. He has assisted in preparation of soil samples, manufacturing of specimens for test and accomplishment of standard soil mechanics testing.

43
IMPLEMENTATION OBJECTIVE: The objective of implementation of the recommendations of this study is to provide permanently stable slopes of the fills made of Mississippi River embayment soils along the I-55 corridor south of Sikeston, Missouri.

44
APPENDIX A: NON-STANDARD TEST PROCEDURES
1. Texas Bar Shrinkage Procedure- TXDOT -TEX 107-E, Part II p. 45 2. 3-D Swell Test Procedure p. 46

45
Texas Bar Shrinkage Procedure - TXDOT - TEX 107-E, Part II 1. Samples are prepared in the same manner as for Atterberg Limits Testing. 2. The mold used is usually made of aluminum or steel, and has the internal dimensions of 6 inches in length and 1/2 inch in width and height. 3. The moistened soils left over from the liquid limit determination are increased in moisture level until they are slightly over the liquid limit. Enough soil must be available to fill the mold at least two times. The proper wetness of the soil is determined by forming a layer of it in the bottom of a bowl which is approximately 1/2 inch in thickness. The layer needs to be thick enough so that a Casagrande grooving tool will cut into it slightly while forming a groove into the layer. If the groove formed flows together by itself, just closing at the bottom, the wetness level is correct. If slight jarring is required to close the groove, the soil is not wet enough, and if the groove slumps together to its full depth or a groove cannot stand open at all the soil is too wet. The paste must be homogeneous as possible and of the same consistency throughout. 4. Thoroughly clean and lightly grease the inside walls and the bar linear shrinkage mold. Shape the soil bar by placing a small portion of the wet soil evenly into the mold. Gently tap the mold on the table top to cause the soil to flow and assist in the removal of entrapped air bubbles. When the mold is filled, remove excess soil from the bar by the means of a straight edge. 5. Air dry the soil bar at room temperature for at least 24 hours or until the soil bar 'pulls' away from the mold sides. The mold may be placed on top of an oven for several hours to facilitate the drying process. After the soil has pulled away from the sides of the mold, place the mold in a drying oven set at 110o C and allow the soil to come to a constant weight or dry condition. 6. After drying remove the mold from the oven and cool to room temperature. Measure and record the original and final lengths of the mold and resulting soil bar. 7. Linear Shrinkage = [(LWW-- LLDD))// LLW ] X 100
LW = Length of Bar Wet or Length of Mold LD = Length of Bar Dry (105 to 110 Degrees Centigrade)
46
3-D Swell Test Procedure 1. Samples of soil to be compacted for this test should be pulverized to the same degree as expected
for field applications, either treated or untreated, brought to the moisture content specified for compaction and sealed in a container to maintain their moisture level.
2. The mold used is a standard compaction mold that is 6.0 inches in inside diameter and 4 1/2 inches
high. This mold must be clean and mounted on a suitable base plate and will have a detachable collar to allow for compaction of the top layer of soil.
3. The soil should be compacted using the compactive effort specified for field use and should consist
of at least three uniformly thick layers of compacted soil. 4. The compacted specimen must be protected from moisture loss prior to the start of the test. 5. The compacted specimen is placed on a clean porous stone that is 6.0 inches in diameter. 6. A strip of geotextile wicking filter fabric, the width of which is equal to the specimen height and
length of which is equal to the circumference of the specimen, is placed around the perimeter of the sides of the specimen.
7. One-half of a 6 inch triaxial membrane, cut so as to make two short membranes, is wrapped around
the specimen and the geotextile wicking fabric material, leaving the porous stone exposed and wrapping over the top of the specimen.
8. All of the specimen and its wrappings, except for the porous stone are then sealed with plastic
wrap. 9. The assemblage is then placed into a bowl deep enough to allow water to be placed in it and
around the specimen to a level slightly above the top of the porous stone. 10. The diameter of the specimen assemblage is determined using a Pi tape and the height of the
assemblage in the bowl is measured and both of these measurements are recorded. 11. Water is added to the appropriate level in the bowl and the timer is started. 12. The height of the assemblage and diameter of the specimen and its wrappings are determined
periodically and recorded. 13. When sufficient time is passed and/or no further swell occurs in the specimen the test is complete. 14. The specimen may be sampled for its moisture content, and other testing may be conducted on it
as seen appropriate. 15. Vertical swell is determined as the gain in height of the assemblage divided by the original height of
the specimen. Horizontal swell is found by dividing the gain in specimen diameter by the original specimen diameter.

47
APPENDIX B: DETAILED RESULTS Table B-1. Silt-Lime pH 49 Table B-2. Silt-LKD pH 49 Table B-3. Clay-Lime pH 50 Table B-4. Clay-LKD pH 50 Figure B-1. Silt-Lime Atterberg Limits Series 51 Figure B-2. Clay-LKD Atterberg Limits Series 51 Figure B-3. Silt-LKD Atterberg Limits Series 52 Figure B-4. Clay-Portland cement Atterberg Limits Series 52 Figure B-5. Silt-Portland cement Atterberg Limits Series 53 Figure B-6. Clay-50/50 Mixture Atterberg Limits Series 53 Figure B-7. Silt-50/50 Mixture Atterberg Limits Series 54 Table B-5. Linear Shrinkage Results 55 Table B-6. Unconfined Compression Results for Clay and LKD 56 Table B-7. Unconfined Compression Results for Clay and Quicklime 56 Table B-8. Unconfined Compression Results for Clay and 50/50 Mix 57 Table B-9. Unconfined Compression Results for Clay and 75/25 Mix 57 Table B-10. Unconfined Compression Results for Silt and LKD 57 Table B-11. Unconfined Compression Results for Silt and 50/50 Mix 58 Table B-12. Unconfined Compression Results for Silt and Portland Cement 58 Table B-13. Unconfined Compression Results for Silt and 75/25 Mix 58 Figure B-8. Direct Shear Results - Natural Clay (Bulk) 59 Figure B-9. Direct Shear Results - Clay and Quicklime 60 Figure B-10. Direct Shear Results - Clay and LKD 60 Figure B-11. Direct Shear Results - Clay and 50/50 Mixture 61 Figure B-12. Direct Shear Results - Natural Silt (Bulk) 61

48
Figure B-13. Direct Shear Results - Silt and Portland cement 62 Figure B-14. Direct Shear Results - Silt and LKD 62 Figure B-15. Direct Shear Results - Silt and 50/50 Mixture 63 Table B-14. Wet - Dry Results 64 Table B-15. Freeze - Thaw Results 66

49
Table B-1 Silt-Lime pH
% Lime pH 0 7.97 1 12.01 2 12.40 3 12.45 4 12.47 5 12.48 6 12.49 7 12.50
0 7.98 8 12.48 9 12.48 10 12.48
Table B-2 Silt-LKD pH
% LKD pH 0 7.81 1 11.06 2 12.01 3 12.31 4 12.49 5 12.59 6 12.63 7 12.66 8 12.66 9 12.66 10 12.67

50
Table B-3
Clay-Lime pH % Lime pH
0 7.27 1 11.90 2 12.19 3 12.22 4 12.25 5 12.29 6 12.29 7 12.28 8 12.29 9 12.28 10 12.28
Table B-4 Clay-LKD pH
% LKD pH
0 7.60 1 11.47 2 12.32 3 12.59 4 12.74 5 12.80 6 12.86 7 12.86 8 12.89 9 12.89 10 12.88
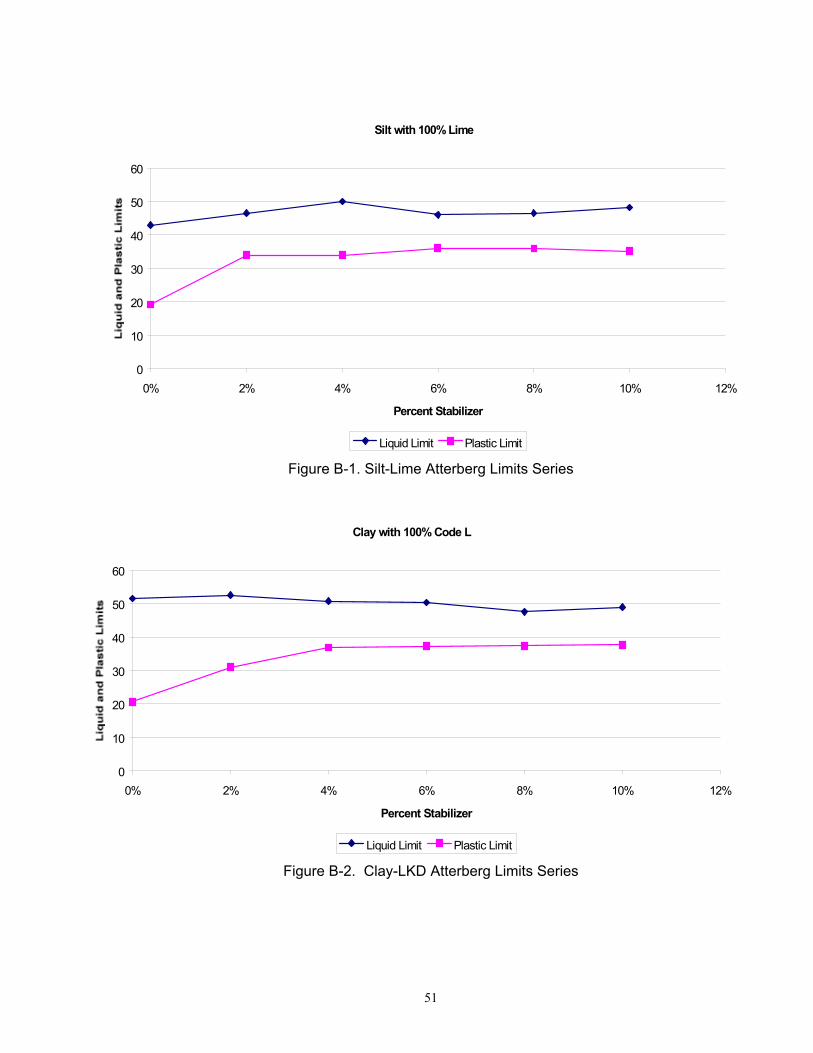
51
Figure B-1. Silt-Lime Atterberg Limits Series
Figure B-2. Clay-LKD Atterberg Limits Series
Silt with 100% Lime
0
10
20
30
40
50
60
0% 2% 4% 6% 8% 10% 12%
Percent Stabilizer
Liquid Limit Plastic Limit
Clay with 100% Code L
0
10
20
30
40
50
60
0% 2% 4% 6% 8% 10% 12%
Percent Stabilizer
Liquid Limit Plastic Limit

52
Figure B-3. Silt-LKD Atterberg Limits Series
Figure B-4. Clay-Portland cement Atterberg Limits Series
Silt with 100% Code L
0
5
10
15
20
25
30
35
40
45
50
0% 2% 4% 6% 8% 10% 12%
Percent Stabilizer
Liquid Limit Plastic Limit
Clay with 100% Cement
0
10
20
30
40
50
60
70
0% 2% 4% 6% 8% 10% 12%
Percent Stabilizer
Liquid Limit Plastic Limit

53
Figure B-5. Silt-Portland cement Atterberg Limits Series
Figure B-6. Clay-50/50 Mixture Atterberg Limits Series
Silt with 100% Cement
0
10
20
30
40
50
60
0% 2% 4% 6% 8% 10% 12%
Percent Stabilizer
Liquid Limit Plastic Limit
Clay with 50% Flyash, 50% Lime
0
10
20
30
40
50
60
0% 2% 4% 6% 8% 10% 12%
Percent Stabilizer
Liquid Limit Plastic Limit
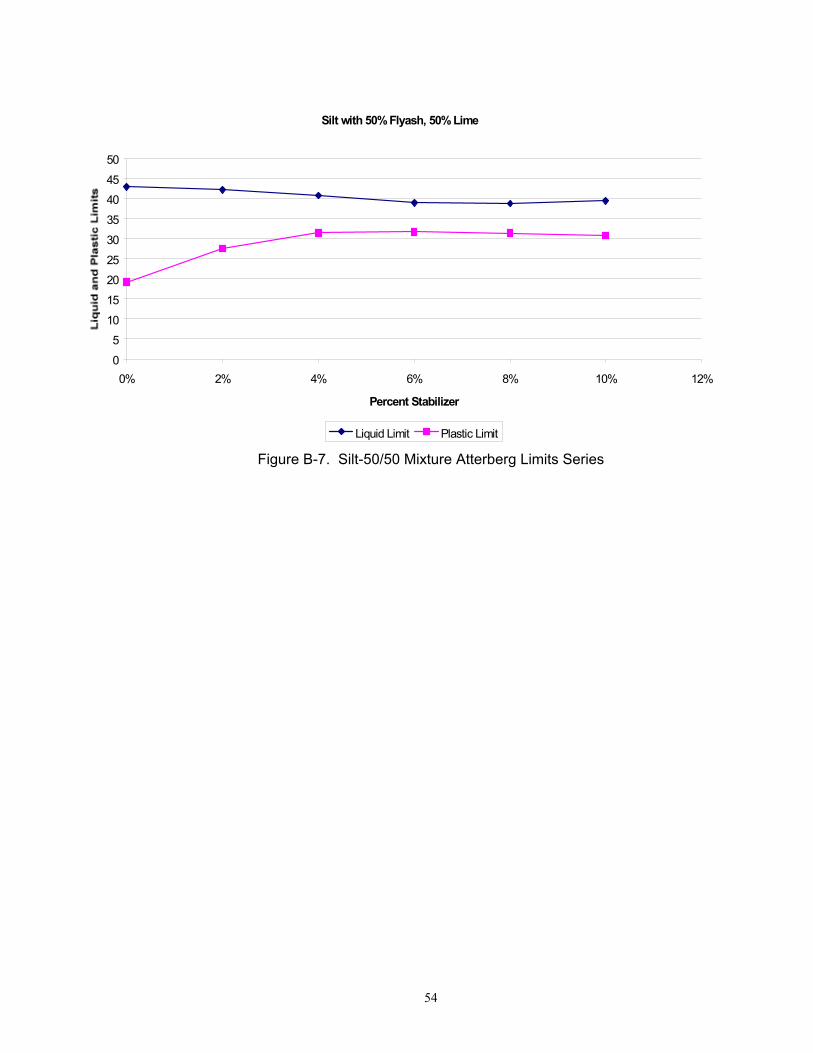
54
Figure B-7. Silt-50/50 Mixture Atterberg Limits Series
Silt with 50% Flyash, 50% Lime
0
5
10
15
20
25
30
35
40
45
50
0% 2% 4% 6% 8% 10% 12%
Percent Stabilizer
Liquid Limit Plastic Limit
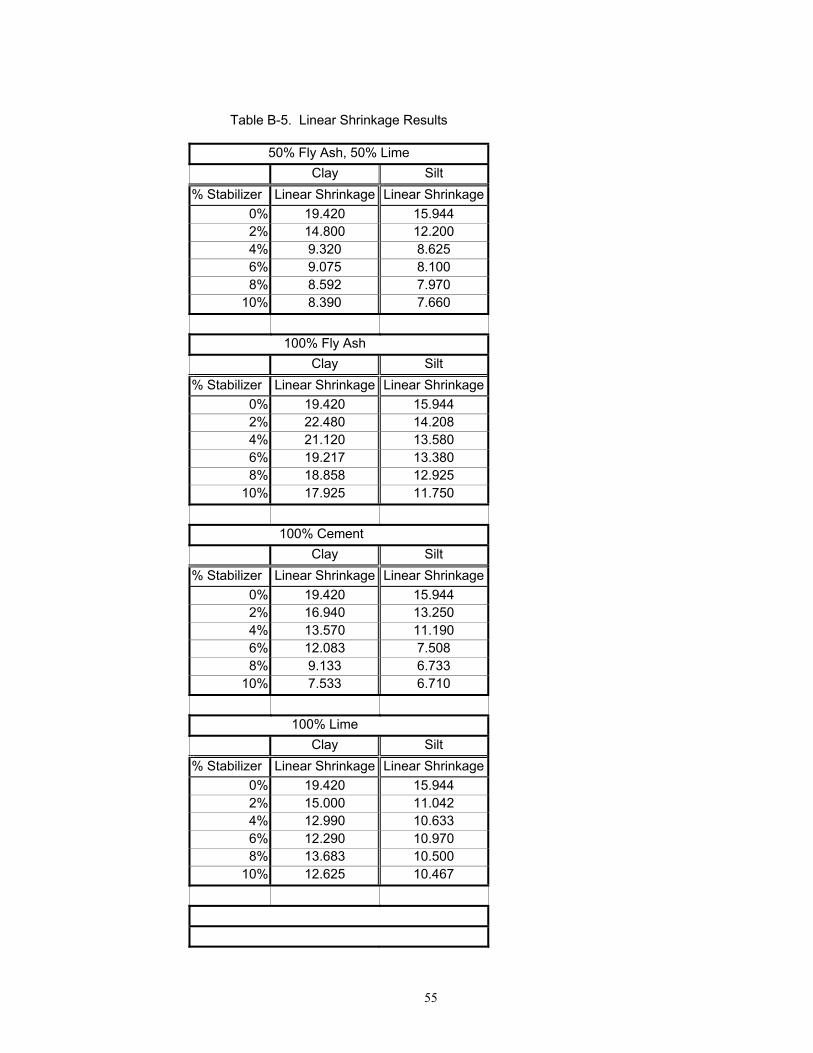
55
Table B-5. Linear Shrinkage Results
50% Fly Ash, 50% Lime Clay Silt
% Stabilizer Linear Shrinkage Linear Shrinkage0% 19.420 15.944 2% 14.800 12.200 4% 9.320 8.625 6% 9.075 8.100 8% 8.592 7.970
10% 8.390 7.660
100% Fly Ash Clay Silt
% Stabilizer Linear Shrinkage Linear Shrinkage0% 19.420 15.944 2% 22.480 14.208 4% 21.120 13.580 6% 19.217 13.380 8% 18.858 12.925
10% 17.925 11.750
100% Cement Clay Silt
% Stabilizer Linear Shrinkage Linear Shrinkage0% 19.420 15.944 2% 16.940 13.250 4% 13.570 11.190 6% 12.083 7.508 8% 9.133 6.733
10% 7.533 6.710
100% Lime Clay Silt
% Stabilizer Linear Shrinkage Linear Shrinkage0% 19.420 15.944 2% 15.000 11.042 4% 12.990 10.633 6% 12.290 10.970 8% 13.683 10.500
10% 12.625 10.467
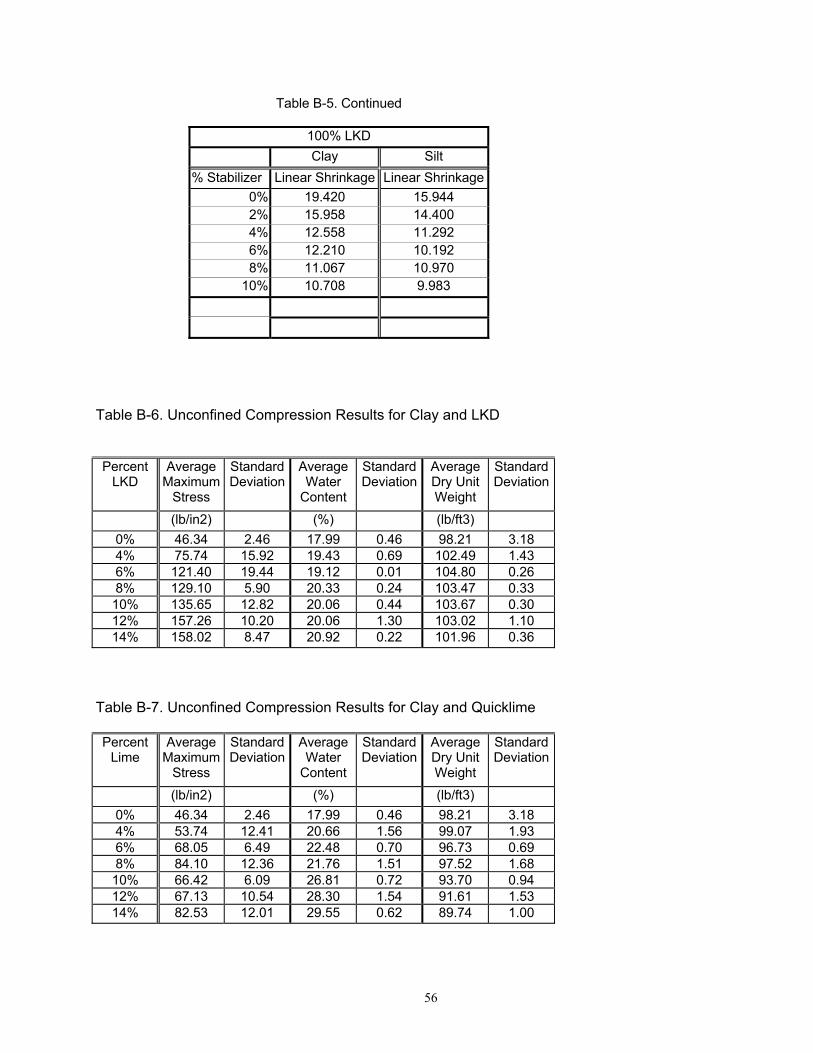
56
Table B-5. Continued
100% LKD Clay Silt
% Stabilizer Linear Shrinkage Linear Shrinkage0% 19.420 15.944 2% 15.958 14.400 4% 12.558 11.292 6% 12.210 10.192 8% 11.067 10.970
10% 10.708 9.983
Table B-6. Unconfined Compression Results for Clay and LKD
Percent LKD
Average Maximum
Stress
Standard Deviation
Average Water
Content
Standard Deviation
Average Dry Unit Weight
Standard Deviation
(lb/in2) (%) (lb/ft3) 0% 46.34 2.46 17.99 0.46 98.21 3.18 4% 75.74 15.92 19.43 0.69 102.49 1.43 6% 121.40 19.44 19.12 0.01 104.80 0.26 8% 129.10 5.90 20.33 0.24 103.47 0.33 10% 135.65 12.82 20.06 0.44 103.67 0.30 12% 157.26 10.20 20.06 1.30 103.02 1.10 14% 158.02 8.47 20.92 0.22 101.96 0.36
Table B-7. Unconfined Compression Results for Clay and Quicklime
Percent
Lime Average
Maximum Stress
Standard Deviation
Average Water
Content
Standard Deviation
Average Dry Unit Weight
Standard Deviation
(lb/in2) (%) (lb/ft3) 0% 46.34 2.46 17.99 0.46 98.21 3.18 4% 53.74 12.41 20.66 1.56 99.07 1.93 6% 68.05 6.49 22.48 0.70 96.73 0.69 8% 84.10 12.36 21.76 1.51 97.52 1.68 10% 66.42 6.09 26.81 0.72 93.70 0.94 12% 67.13 10.54 28.30 1.54 91.61 1.53 14% 82.53 12.01 29.55 0.62 89.74 1.00

57
Table B-8. Unconfined Compression Results for Clay with 50/50 Mix
Percent 50 / 50 QL/FA
Average Maximum
Stress
Standard Deviation
Average Water
Content
Standard Deviation
Average Dry Unit Weight
Standard Deviation
(lb/in2) (%) (lb/ft3) 0% 46.34 2.46 17.99 0.46 98.21 3.18 4% 62.73 13.89 19.01 0.24 102.57 0.28 6% 72.59 5.27 20.10 0.71 101.21 1.01 8% 85.25 14.71 18.60 0.19 102.33 0.31 10% 89.84 14.90 18.91 0.17 101.40 0.71 12% 105.87 2.39 19.04 0.52 101.31 0.69 14% 115.32 24.44 19.05 0.44 101.21 0.31
Table B-9. Unconfined Compression Results for Clay and 75/25 Mix Percent 75 / 25 QL/LKD
Average Maximum
Stress
Standard Deviation
Average Water
Content
Standard Deviation
Average Dry Unit Weight
Standard Deviation
(lb/in2) (%) (lb/ft3) 0% 46.34 2.46 17.99 0.46 98.21 3.18 4% 57.24 8.80 22.14 0.23 99.78 0.43 6% 53.28 8.68 20.73 0.58 99.27 2.76 8% 62.72 11.95 21.52 0.60 99.96 0.32 10% 63.15 10.10 23.35 0.56 97.77 0.63 12% 85.06 16.19 23.31 0.06 98.26 0.20 14% 99.24 3.59 23.04 0.15 98.88 0.32
Table B-10. Unconfined Compression Results for Silt and LKD Percent
LKD Average
Maximum Stress
Standard Deviation
Average Water
Content
Standard Deviation
Average Dry Unit Weight
Standard Deviation
(lb/in2) (%) (lb/ft3) 0% 65.25 6.19 15.05 0.41 105.61 0.85 4% 62.86 11.00 19.75 0.49 103.37 0.50 6% 61.22 6.99 21.32 0.20 101.64 0.36 8% 71.19 3.99 20.20 0.38 101.87 0.19 10% 89.50 11.09 19.40 0.45 103.08 0.49 12% 94.31 12.68 19.80 0.64 102.83 0.91 14% 106.18 11.59 19.26 0.50 103.06 0.32
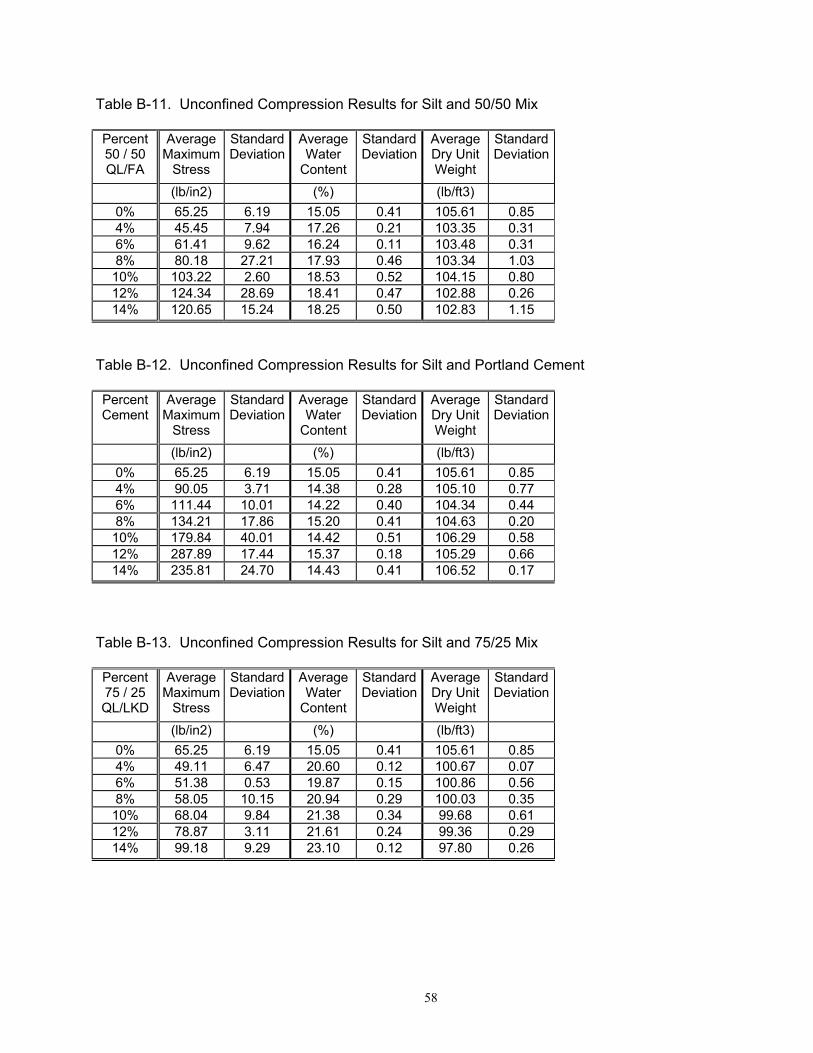
58
Table B-11. Unconfined Compression Results for Silt and 50/50 Mix Percent 50 / 50 QL/FA
Average Maximum
Stress
Standard Deviation
Average Water
Content
Standard Deviation
Average Dry Unit Weight
Standard Deviation
(lb/in2) (%) (lb/ft3) 0% 65.25 6.19 15.05 0.41 105.61 0.85 4% 45.45 7.94 17.26 0.21 103.35 0.31 6% 61.41 9.62 16.24 0.11 103.48 0.31 8% 80.18 27.21 17.93 0.46 103.34 1.03 10% 103.22 2.60 18.53 0.52 104.15 0.80 12% 124.34 28.69 18.41 0.47 102.88 0.26 14% 120.65 15.24 18.25 0.50 102.83 1.15
Table B-12. Unconfined Compression Results for Silt and Portland Cement Percent Cement
Average Maximum
Stress
Standard Deviation
Average Water
Content
Standard Deviation
Average Dry Unit Weight
Standard Deviation
(lb/in2) (%) (lb/ft3) 0% 65.25 6.19 15.05 0.41 105.61 0.85 4% 90.05 3.71 14.38 0.28 105.10 0.77 6% 111.44 10.01 14.22 0.40 104.34 0.44 8% 134.21 17.86 15.20 0.41 104.63 0.20 10% 179.84 40.01 14.42 0.51 106.29 0.58 12% 287.89 17.44 15.37 0.18 105.29 0.66 14% 235.81 24.70 14.43 0.41 106.52 0.17
Table B-13. Unconfined Compression Results for Silt and 75/25 Mix Percent 75 / 25 QL/LKD
Average Maximum
Stress
Standard Deviation
Average Water
Content
Standard Deviation
Average Dry Unit Weight
Standard Deviation
(lb/in2) (%) (lb/ft3) 0% 65.25 6.19 15.05 0.41 105.61 0.85 4% 49.11 6.47 20.60 0.12 100.67 0.07 6% 51.38 0.53 19.87 0.15 100.86 0.56 8% 58.05 10.15 20.94 0.29 100.03 0.35 10% 68.04 9.84 21.38 0.34 99.68 0.61 12% 78.87 3.11 21.61 0.24 99.36 0.29 14% 99.18 9.29 23.10 0.12 97.80 0.26

59
Figure B-8. Direct Shear Results - Natural Clay (Bulk)
N a tu ra l C la y
R 2 = 0 .5 9 6 9
R 2 = 0 .6 3 3 5
0
5 0 0
1 0 0 0
1 5 0 0
2 0 0 0
2 5 0 0
3 0 0 0
3 5 0 0
4 0 0 0
0 1 0 0 0 2 0 0 0 3 0 0 0 4 0 0 0 5 0 0 0 6 0 0 0 7 0 0 0
N o rm a l F o rc e , ( lb /ft2 )
c = 0
Φ p e a k = 2 2 .0
Φ re s id u a l = 2 0 .8

60
Figure B-9. Direct Shear Results - Clay and Quicklime
Figure B-10. Direct Shear Results - Clay and LKD
C lay and Q u ick L im e
0
2000
4000
6000
8000
10000
12000
0 1000 2000 3000 4000 5000 6000 7000
N orm a l Force , (lb /ft2)
P eak -- 6% Q L R esidua l -- 6% Q L P eak -- 12% Q L R esidua l -- 12% Q L
C la y a n d L im e K iln D u s t
0
2 0 0 0
4 0 0 0
6 0 0 0
8 0 0 0
1 0 0 0 0
1 2 0 0 0
0 1 0 0 0 2 0 0 0 3 0 0 0 4 0 0 0 5 0 0 0 6 0 0 0 7 0 0 0
N o rm a l F o rc e , ( lb / f t2 )
P e a k - - 6 % L K D R e s id u a l - - 6 % L K D P e a k - - 1 2 % L K D R e s id u a l - - 1 2 % L K D
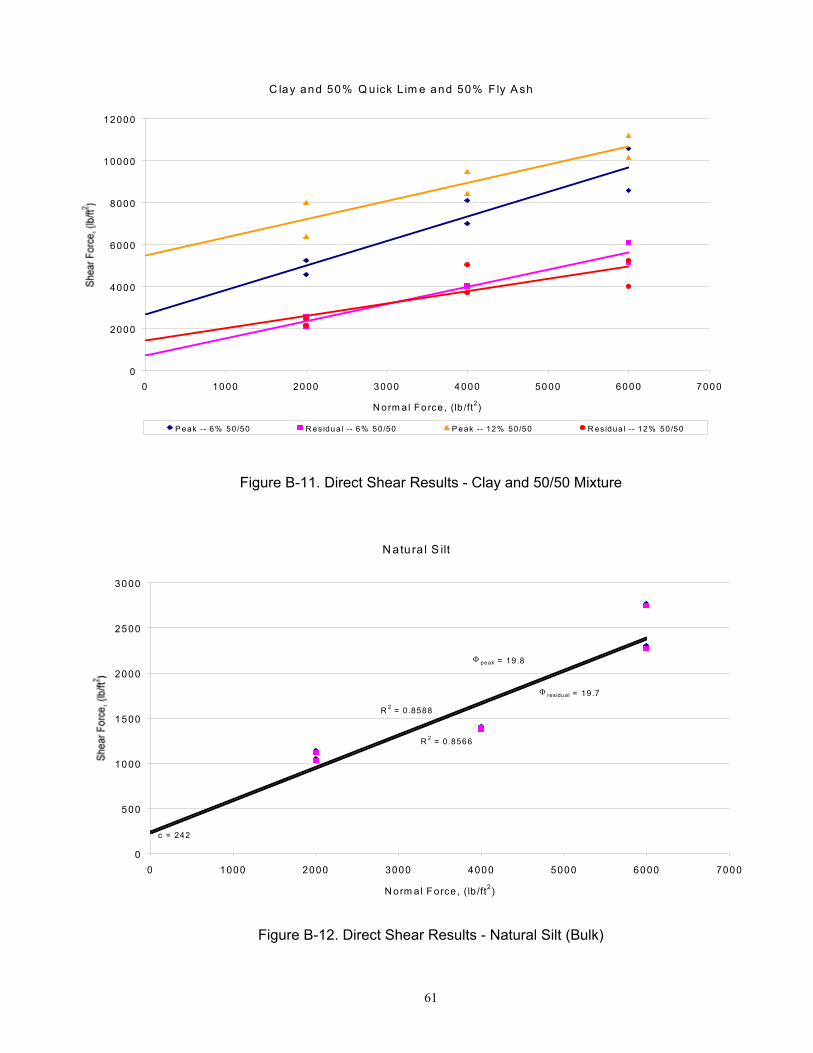
61
Figure B-11. Direct Shear Results - Clay and 50/50 Mixture
Figure B-12. Direct Shear Results - Natural Silt (Bulk)
C lay and 50% Q uick L im e and 50% F ly A sh
0
2000
4000
6000
8000
10000
12000
0 1000 2000 3000 4000 5000 6000 7000
N orm a l Fo rce , (lb /ft2)
P eak -- 6% 50/50 R es idua l -- 6% 50 /50 P eak -- 12% 50/50 R es idua l -- 12% 50 /50
N atu ra l S ilt
R 2 = 0 .8588
R 2 = 0 .8566
0
500
1000
1500
2000
2500
3000
0 1000 2000 3000 4000 5000 6000 7000
N orm al Force, (lb /ft2)
c = 242
Φ peak = 19 .8
Φ res idual = 19.7

62
Figure B-13. Direct Shear Results - Silt and Portland cement
Figure B-14. Direct Shear Results - Silt and LKD
S ilt a n d P o rtla n d C e m e n t
0
2 0 0 0
4 0 0 0
6 0 0 0
8 0 0 0
1 0 0 0 0
1 2 0 0 0
1 4 0 0 0
1 6 0 0 0
1 8 0 0 0
2 0 0 0 0
0 1 0 0 0 2 0 0 0 3 0 0 0 4 0 0 0 5 0 0 0 6 0 0 0 7 0 0 0
N o rm a l F o rc e , ( lb /f t2 )
P e a k - - 6 % P C R e s id u a l - - 6 % P C P e a k - - 1 2 % P C R e s id u a l - - 1 2 % P C
S ilt a n d L im e K iln D u s t
0
1 0 0 0
2 0 0 0
3 0 0 0
4 0 0 0
5 0 0 0
6 0 0 0
7 0 0 0
8 0 0 0
9 0 0 0
0 1 0 0 0 2 0 0 0 3 0 0 0 4 0 0 0 5 0 0 0 6 0 0 0 7 0 0 0
N o rm a l F o rce , ( lb /ft2)
P e a k -- 6 % L K D R e s id u a l -- 6 % L K D P e a k -- 1 2 % L K D R e s id u a l -- 1 2 % L K D

63
Figure B-15. Direct Shear Results - Silt and 50/50 Mixture
S ilt a nd 5 0% Q u ick L im e an d 5 0% L im e K iln D us t
0
1 0 0 0
2 0 0 0
3 0 0 0
4 0 0 0
5 0 0 0
6 0 0 0
7 0 0 0
8 0 0 0
9 0 0 0
1 0 0 0 0
0 1 0 0 0 2 0 0 0 3 0 0 0 4 0 0 0 5 0 0 0 6 0 0 0 7 0 0 0
N o rm a l F o rce , (lb /ft2)
P e a k -- 6 % 50 /5 0 R es idu a l -- 6 % 5 0 /50 P e ak -- 1 2 % 50 /5 0 R es idu a l -- 12 % 50 /5 0
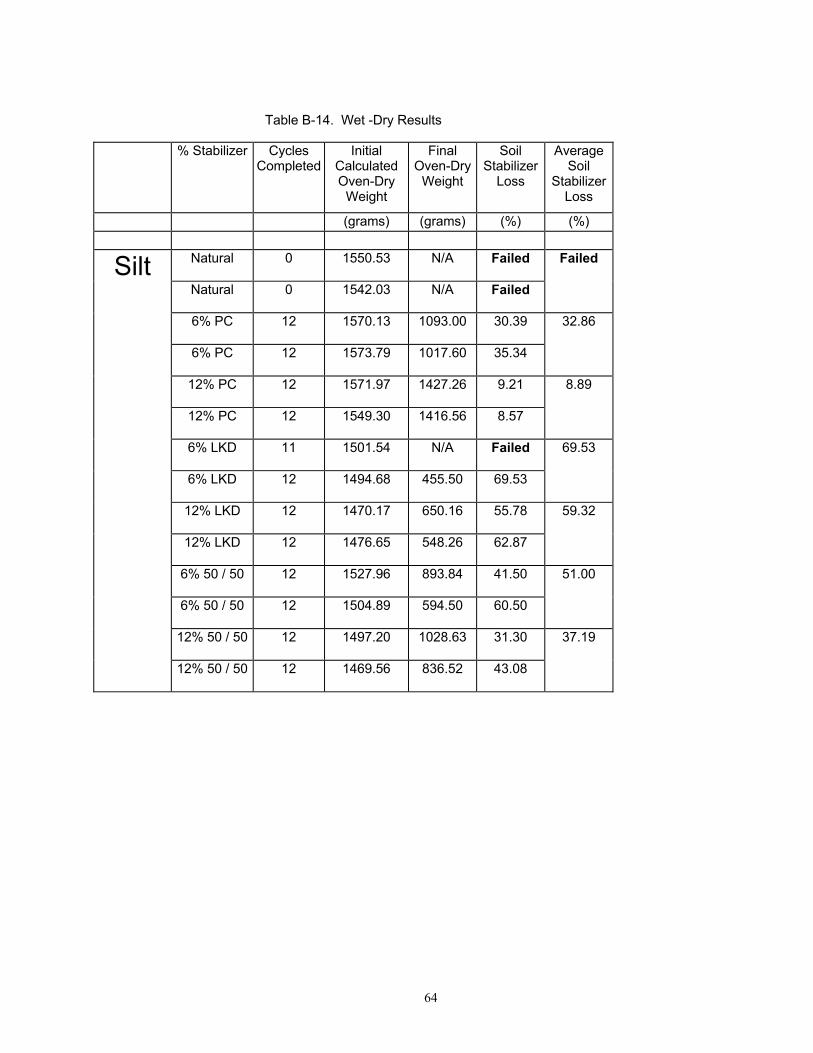
64
Table B-14. Wet -Dry Results
% Stabilizer Cycles Completed
Initial Calculated Oven-Dry
Weight
Final Oven-Dry
Weight
Soil Stabilizer
Loss
Average Soil
Stabilizer Loss
(grams) (grams) (%) (%)
Silt Natural 0 1550.53 N/A Failed Failed
Natural 0 1542.03 N/A Failed
6% PC 12 1570.13 1093.00 30.39 32.86
6% PC 12 1573.79 1017.60 35.34
12% PC 12 1571.97 1427.26 9.21 8.89
12% PC 12 1549.30 1416.56 8.57
6% LKD 11 1501.54 N/A Failed 69.53
6% LKD 12 1494.68 455.50 69.53
12% LKD 12 1470.17 650.16 55.78 59.32
12% LKD 12 1476.65 548.26 62.87
6% 50 / 50 12 1527.96 893.84 41.50 51.00
6% 50 / 50 12 1504.89 594.50 60.50
12% 50 / 50 12 1497.20 1028.63 31.30 37.19
12% 50 / 50 12 1469.56 836.52 43.08

65
Table B-14. Continued
% Stabilizer Cycles Completed
Initial Calculated Oven-Dry
Weight
Final Oven-Dry
Weight
Soil Stabilizer
Loss
Average Soil
Stabilizer Loss
(grams) (grams) (%) (%)
Clay Natural 0 1453.32 N/A Failed Failed
Natural 0 1458.38 N/A Failed
6% QL 12 1430.59 570.85 60.10 60.97
6% QL 12 1416.13 540.44 61.84
12% QL 12 1389.82 500.08 64.02 72.21
12% QL 12 1370.53 268.59 80.40
6% LKD 3 1444.31 N/A Failed Failed
6% LKD 3 1422.25 N/A Failed
12% LKD 7 1451.44 N/A Failed Failed
12% LKD 8 1459.90 N/A Failed
6% 50 / 50 5 1462.64 N/A Failed Failed
6% 50 / 50 8 1478.41 N/A Failed
12% 50 / 50 8 1480.38 N/A Failed Failed
12% 50 / 50 8 1469.14 N/A Failed

66
Table B-15. Freeze-Thaw Results
% Stabilizer Cycles Completed
Initial Calculated Oven-Dry
Weight
Final Oven-Dry
Weight
Soil Stabilizer
Loss
Average Soil
Stabilizer Loss
(grams) (grams) (%) (%)
Silt Natural 0 376.00 N/A Failed Failed
Natural 0 372.89 N/A Failed
6% PC 12 418.15 209.64 49.86 61.24
6% PC 12 334.55 91.60 72.62
12% PC 12 352.19 326.98 7.16 6.43
12% PC 12 362.43 341.75 5.71
6% LKD 6 351.50 N/A Failed Failed
6% LKD 6 344.41 N/A Failed
12% LKD 8 336.27 N/A Failed Failed
12% LKD 8 327.54 N/A Failed
6% 50 / 50 10 344.35 N/A Failed Failed
6% 50 / 50 10 353.68 N/A Failed
12% 50 / 50 11 349.22 N/A Failed Failed
12% 50 / 50 11 340.61 N/A Failed
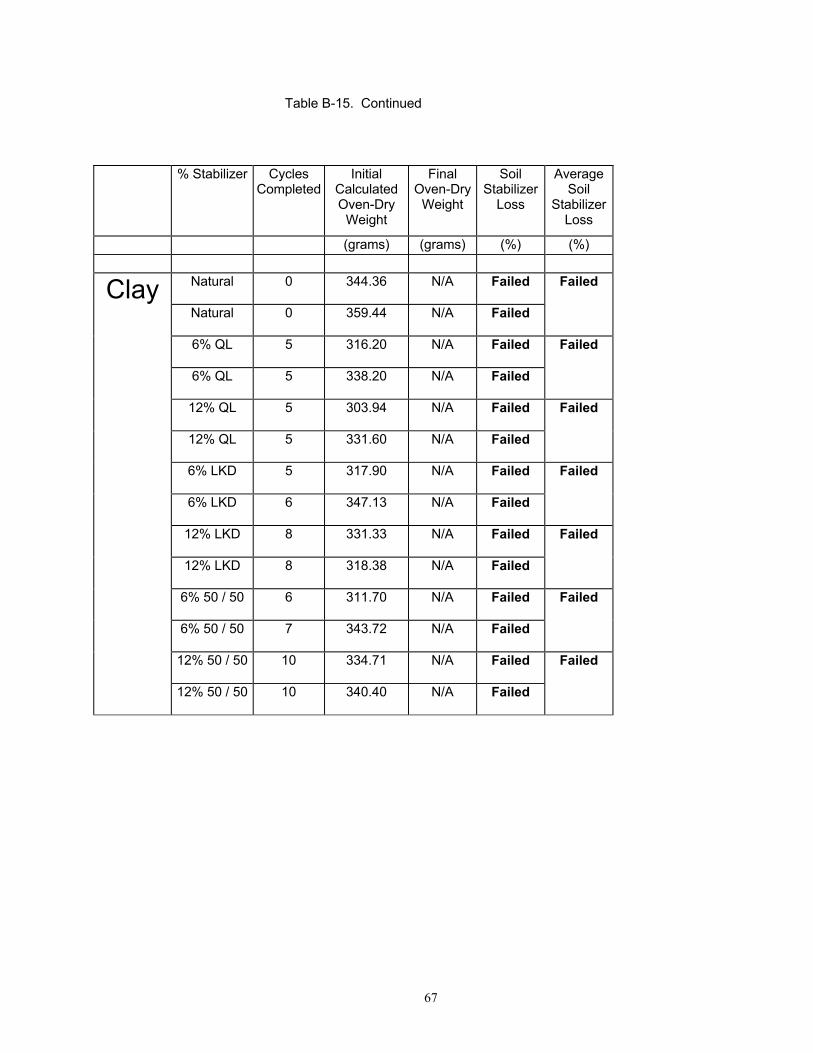
67
Table B-15. Continued
% Stabilizer Cycles Completed
Initial Calculated Oven-Dry
Weight
Final Oven-Dry
Weight
Soil Stabilizer
Loss
Average Soil
Stabilizer Loss
(grams) (grams) (%) (%)
Clay Natural 0 344.36 N/A Failed Failed
Natural 0 359.44 N/A Failed
6% QL 5 316.20 N/A Failed Failed
6% QL 5 338.20 N/A Failed
12% QL 5 303.94 N/A Failed Failed
12% QL 5 331.60 N/A Failed
6% LKD 5 317.90 N/A Failed Failed
6% LKD 6 347.13 N/A Failed
12% LKD 8 331.33 N/A Failed Failed
12% LKD 8 318.38 N/A Failed
6% 50 / 50 6 311.70 N/A Failed Failed
6% 50 / 50 7 343.72 N/A Failed
12% 50 / 50 10 334.71 N/A Failed Failed
12% 50 / 50 10 340.40 N/A Failed