![ALICE’S JOURNEY AS A DREAMING FORM OF ANXIETIES …eprints.undip.ac.id/77082/1/[FINAL_PROJECT]_Aldi... · 1.5. Methods of Study In this final project, the writer uses library research](https://static.fdocuments.in/doc/165x107/60e46a1b17f92e3c586c6350/aliceas-journey-as-a-dreaming-form-of-anxieties-finalprojectaldi-15.jpg)
Final Project Report - Universitylib.tkk.fi/Final_project/2008/urn012542.pdf · Final Project...
94
Final Project Report José de la Fuente Abad THE USE OF BGAN TO IMPLEMENT A ROBUST TSUNAMI EARLY WARNING SYSTEM Thesis submitted in partial fulfilment of the requirements for the degree of Master of Science in Technology Espoo, Tuesday, 01 July 2008 Supervisor Professor Jyri Hämäläinen Instructor Dr. Edward Mutafungwa
Transcript of Final Project Report - Universitylib.tkk.fi/Final_project/2008/urn012542.pdf · Final Project...

Final Project Report
José de la Fuente Abad
THE USE OF BGAN TO IMPLEMENT A ROBUST TSUNAMI EARLY WARNING
SYSTEM
Thesis submitted in partial fulfilment of the requirements
for the degree of Master of Science in Technology
Espoo, Tuesday, 01 July 2008
Supervisor Professor Jyri Hämäläinen
Instructor Dr. Edward Mutafungwa

01/07/08 Jose de la Fuente/ Helsinki University of Technology, Department of Electrical and Communications Engineering, Communications Laboratory
i
HELSINKI UNIVERSITY OF TECHNOLOGY
Abstract of the Master’s Thesis
Author: José de la Fuente Abad
Name of the Thesis: The use of BGAN to implement a Robust Tsunami Early Warning
System
01/07/2008 Number of pages: 10+83
Department: Department of Electrical and Communications Engineering
Professorship: S-72.FP30
Supervisor: Professor Jyri Hämäläinen
Instructor: Dr. Edward Mutafungwa
A tsunami is a series of waves created when a body of water, such as an ocean, is rapidly
displaced probably by an oceanic earthquake. The effects of a tsunami for the population
can be devastating due to the immense volumes of water and energy involved
The EU-funded Distant Early Warning System (DEWS) project is currently
implementing a reference model for a national and regional warning dissemination
system of possible hazards or disasters, especially in the prevention of tsunamis. In
DEWS several universities and companies are participating specially coming from
Europe and from the three countries of interest Sri Lanka, Indonesia and Thailand.
The Department of Communications and Networking of the Helsinki University of
Technology (TKK) is a consortium member of the DEWS project working on the
development of the communications architecture between the different Emergency
Centres, first responders and general public.
In this thesis report we present the implementation of a backup satellite communications
system between DEWS centres and governmental authorities in order to enable the
warning dissemination in case the terrestrial communication structures are disrupted due
to the hazard effects.
The backup communications structure would employ the BGAN Inmarsat service for the
date transmission. BGAN ensures the coverage in almost global earth area and support
mobility on its terminals, offering adequate characteristics for an emergency
communications system. To that end, we design and describe this communications
architecture and discuss its performance in the possible scenarios based on simulations.
Keywords: BGAN, Early Warning System, DEWS, Tsunami

01/07/08 Jose de la Fuente/ Helsinki University of Technology, Department of Electrical and Communications Engineering, Communications Laboratory
ii
ESCUELA TÉCNICA SUPERIOR DE INGENIEROS DE TELECOMUNICACIÓN
UNIVERSIDAD POLITÉCNICA DE MADRID
Abstract del
Autor: José de la Fuente Abad
Titulo del proyecto: Uso de BGAN para la implementación de un sistema de alarma
anticipada frente Tsunamis
01/07/2008 Número de Páginas: 10+83
Departamento: Departamento de Ingeniería Eléctrica y de Comunicación
Cátedra: S-72.FP30
Supervisor: Profesor Jyri Hämäläinen
Instructor: Dr. Edward Mutafungwa
Un tsunami es una serie de olas creadas cuando una gran masa de agua es rápidamente
desplazada posiblemente debido a un terremoto subacuatico. Los efectos del tsunami para
la población pueden ser devastadores debido a los inmensos volúmenes de agua y energía
envueltos.
El proyecto DEWS fundado por la UE actualmente esta implementando un modelo de
referencia para la creación de un sistema nacional y regional de diseminación de alarmas
frente a posibles desastres, especialmente focalizado a tsunamis. En DEWS están
participando varias universidades y empresas provenientes de Europa y de los tres países
de interés: Sri Lanka, Indonesia y Tailandia.
El Departamento de Electrónica y Comunicaciones y Redes de la Universidad
Tecnológica de Helsinki es miembro del proyecto DEWS trabajando en el desarrollo de
la arquitectura de comunicaciones entre los diferentes Centros de Alarma, las autoridades
y el público en general.
En este texto presentamos la implementación de un sistema de reserva basado en
comunicaciones por satélite entre los centros DEWS y las autoridades para permitir la
diseminación de la alarma en el caso de que el resto de vías estén inutilizadas
El sistema de reserve esta basado en el servicio BGAN de Inmarsat. BGAN tiene
cobertura en la mayoría del territorio terrestre y soporta movilidad en sus terminales,
ofreciendo las características adecuadas para un sistema de alarma. Con este fin se ha
diseñado la arquitectura de comunicaciones de este sistema y se ha discutido su
rendimiento basado en las simulaciones desarrolladas
Palabras Clave: BGAN, Sistema de Alarma Anticipada, DEWS, Tsunami

01/07/08 Jose de la Fuente/ Helsinki University of Technology, Department of Electrical and Communications Engineering, Communications Laboratory
iii
PREFACE
This Final Project Thesis report has been developed based on the work performed for the
DEWS project in Communications Laboratory at the Department of Electrical and
Communications Engineering in the Helsinki University of Technology.
First of all, I would like to thank Dr. Edward Mutafungwa for the opportunity to write this
thesis for the DEWS project and for his assistance and valuable guidance during the course
of my work. I am also grateful to the Professor Jyri Hämäläinen for his help in the
development of my work. Finally, I am thankful also to Krisztina Cziner for giving me the
opportunity to collaborate with the Communications Laboratory.
I would also like to thank all the personnel and DEWS-project partners for their documents
and information provided for this thesis.
I would like to thank my family and all my friends for the support and care given during
this period. Finally, I dedicate this thesis to the good friends known along my period in
Finland, we will all continue with our different paths in live but we will always remember.
Espoo, June 2008
Jose de la Fuente Abad

01/07/08 Jose de la Fuente/ Helsinki University of Technology, Department of Electrical and Communications Engineering, Communications Laboratory
iv
Table of Contents PREFACE ....................................................................................................................................................... III
LIST OF FIGURES ........................................................................................................................................ VI
1. INTRODUCTION .................................................................................................................................... 1
1.1. MOTIVATION ...................................................................................................................................... 1 1.2. BACKGROUND ON DEWS PROJECT .................................................................................................... 1 1.3. MAIN RESEARCH CONTRIBUTION ...................................................................................................... 3 1.4. ORGANIZATION OF THE REPORT ......................................................................................................... 3
2. PROBLEM STATEMENT ..................................................................................................................... 5
2.1. COMMUNICATIONS VIEW .................................................................................................................... 5 2.1.1 Warning Centers .......................................................................................................................... 5 2.1.2 Upstream flow .............................................................................................................................. 6 2.1.3 Downstream flow .......................................................................................................................... 6 2.1.4 Service Objectives ......................................................................................................................... 7 2.1.5 Possible Communication Channels ............................................................................................. 8
2.2. REGIONAL OVERVIEW ........................................................................................................................ 9 2.2.1 Indonesia Overview ...................................................................................................................... 9 2.2.2 Sri Lanka Overview .................................................................................................................... 11 2.2.3 Thailand Overview ..................................................................................................................... 12
2.3. SATELLITE COMMUNICATIONS ......................................................................................................... 13 2.3.1 Satellite Communications Introduction .................................................................................... 13 2.3.2 Satellite Standards Overview ..................................................................................................... 14 2.3.3 Satellite Protocols Overview ...................................................................................................... 15 2.3.4 Satellite Communications DEWS .............................................................................................. 16
3. GENERIC DEWS MODEL OF REFERENCE .................................................................................. 18
3.1. GENERAL ARCHITECTURE ................................................................................................................ 18 3.2. TSUNAMI DISASTER DECISION MAKING .......................................................................................... 20 3.3. DISSEMINATION CHANNELS ............................................................................................................. 25
3.3.1 Upstream Communications Architecture .................................................................................. 25 3.3.2 Downstream Communications Architecture ............................................................................. 27 3.3.3 Communication between EWCs ................................................................................................ 28 3.3.4 Communications between EWCs and first responders and general public ............................. 29
3.4. MESSAGE COMPOSITION .................................................................................................................. 31
4. SPECIFICATIONS OF THE SIMULATION ..................................................................................... 33
4.1. OBJECTIVES OF THE SIMULATION ..................................................................................................... 33 4.2. BASIS AND RESOURCES OF THE SIMULATION .................................................................................... 33
4.2.1 Simulation Tool Description ...................................................................................................... 33 4.2.2 Tool and Simulations Limitations ............................................................................................. 34
4.3. JUSTIFICATION FOR USING BGAN .................................................................................................... 35 4.3.1 BGAN Network Architecture ..................................................................................................... 36
4.3.1.1 BGAN IP Connections ....................................................................................................................... 38 4.3.1.2 VPN over BGAN structure ................................................................................................................ 39
4.3.2 BGAN User Terminals Specifications ....................................................................................... 39 4.3.2.1 Technical specifications of the terminals ........................................................................................... 39 4.3.2.2 PDP Contexts Management ............................................................................................................... 41 4.3.2.3 IP Addressing of the UT .................................................................................................................... 41
4.4. DESIGN OF THE SCENARIOS .............................................................................................................. 43
5. ANALYSES OF THE RESULTS ......................................................................................................... 45

01/07/08 Jose de la Fuente/ Helsinki University of Technology, Department of Electrical and Communications Engineering, Communications Laboratory
v
5.1. SCENARIOS ....................................................................................................................................... 45 5.1.1 EWC to EWC .............................................................................................................................. 45 5.1.2 EWC to multiple authorities ...................................................................................................... 46
5.2. FACTORS OF INFLUENCE .................................................................................................................. 48 5.2.1 Number of Authorities receiving the warning ........................................................................... 48 5.2.2 Updating the Warning Information .......................................................................................... 48 5.2.3 Influence of the Background Traffic ........................................................................................ 50
6. CONCLUSIONS .................................................................................................................................... 52
6.1. DISCUSSION ..................................................................................................................................... 52
7. REFERENCES ....................................................................................................................................... 54
ANNEX A: ICT GATHERED INDICATORS ............................................................................................. 58
ANNEX B: GSM AND CDMA COVERAGE AREAS IN THE DEWS COUNTRIES ............................ 70
ANNEX C: GENERAL SIMULATION INPUTS ........................................................................................ 83
ANNEX D: RAIN CONTOURS WORLD MAP .......................................................................................... 84

01/07/08 Jose de la Fuente/ Helsinki University of Technology, Department of Electrical and Communications Engineering, Communications Laboratory
vi
LIST OF FIGURES
Figure 1 Logical flow of technical activities in the DEWS project ....................................... 2
Figure 2 Upstream information flow ...................................................................................... 6
Figure 3 Downstream information flow ................................................................................. 7
Figure 4 Nation and Regional Centers in Indonesia [4] ....................................................... 10
Figure 5 Last mile dissemination channels in Sri Lanka ...................................................... 12
Figure 6: Actual and future BGAN Coverage [26] .............................................................. 16
Figure 7: Schematic Architecture of DEWS ........................................................................ 18
Figure 8: Initial phase, the earthquake detected ................................................................... 21
Figure 9: Second phase, from the earthquake to the tsunami detection ............................... 22
Figure 10: Third phase, from the tsunami detection to the landfall ..................................... 23
Figure 11: Fourth phase, post tsunami communication ....................................................... 24
Figure 12: Upstream Communication Architecture ............................................................. 26
Figure 13: Upstream Communication Infrastructure ........................................................... 27
Figure 14: Example of two EWC using the VPN ................................................................ 29
Figure 15: EWC to first responders and general public communications ............................ 30
Figure 16: Rain Attenuation for the different Spectrum bands [37] .................................... 36
Figure 17 BGAN Logical Architecture [49] ........................................................................ 37
Figure 18: UT Technical Comparison .................................................................................. 41
Figure 19: IP addressing on the HNS 9201 [29] .................................................................. 42
Figure 20: IP addressing on Explorer 500 and 700 in NAT mode [29] ............................... 42
Figure 21: Qualnet Simulation Scenarios Architecture ........................................................ 43
Figure 22: Schematic for BGAN Ground Network .............................................................. 44
Figure 23: Time Delays and Throughput from one EWC to another ................................... 46
Figure 24: Time Delays between EWC and four authorities ............................................... 47
Figure 25: Influence of the amount of Authorities to receive the warning .......................... 48
Figure 26: Timeline with transmission interference ............................................................. 49
Figure 27: Influence of Background traffic in both scenarios .............................................. 50

01/07/08 Jose de la Fuente/ Helsinki University of Technology, Department of Electrical and Communications Engineering, Communications Laboratory
vii
LIST OF ACRONYMS
ACK Acknowledgment
API Application Programming Interface
APN Access Point Name
BGAN Broadband Global Area Network
BMG Badan Meteorologi Dan Geofisika
BPPT Badan Pengkajian Dan Penerapan Teknologi
BTS Base Transceiver Station
CAP Common Alerting Protocol
CBR Constant Bit Rate
CDMA Code Division Multiple Access
CONDWA Committee on National Disaster Warning Administration
COPNDWS Committee on Policy of the National Disaster Warning System
CS Circuit Switched
DEWS Distant Early Warning System
DHCP Dynamic Host Configuration Protocol
DMC Disaster Management Centre
DVB-RCS Digital Video Broadcasting - Return Channel via Satellite
ESA European Space Agency
ETSI European Telecommunications Standards Institute
EWC Early Warning Centre
FEC Forward Error Correction
FTP File Transfer Protocol
GITEWS German Indonesian Tsunami Early Warning System
GSM Global System for Mobile communications
GPS Global Positioning System
GFZ GeoForschungsZentrum Potsdam
HMI Human Machine Interface
HNS Hughes Network Systems
ICT Information and Communications Technology
IEC International Electrotechnical Commission

01/07/08 Jose de la Fuente/ Helsinki University of Technology, Department of Electrical and Communications Engineering, Communications Laboratory
viii
IEEE Institute of Electrical and Electronics Engineers
IETF Internet Engineering Task Force
INCO International Cooperation
IP Internet Protocol
IPSec Internet Protocol Security
ISO International Organization for Standardization
JMA Japan Meteorological Agency
L2F Layer 2 Forward Protocol
L2TP Layer 2 Tunnelling Protocol
LAN Local-Area Network
LLC Limited Liability Company
MPPE Microsoft Point-to-Point Encryption
NAT Network Address Translation
NCDM National Council for Disaster Management
NDWC National Disaster Warning Centre
NEITWC National Earthquake Information and Tsunami Warning Centre
NGO Non-Governmental Organization
OBU Ocean Bottom Unit
OSI Open Systems Interconnection
PASTI Pasifik Satelit Nusantara
PDP Programmed Data Processor
PEP Performance Enhancement Proxy
PPP Point-to-Point Protocol
PPTP Point-to-Point Tunneling Protocol
PS Packet Switched
PTWC Pacific Tsunami Warning Center
QoS Quality of service
REITWC Regional Earthquake Information and Tsunami Warning Centre
SAS Satellite Access Stations
SOA Service Oriented Architecture
SMS Short Message Service
TC SES Technical Committee for Satellite Earth Stations

01/07/08 Jose de la Fuente/ Helsinki University of Technology, Department of Electrical and Communications Engineering, Communications Laboratory
ix
TCP Transmission Control Protocol
TDMA Time Division Multiple Access
TFT Traffic Flow Templates
TISS Terrestrial Interface SubSystem
TOT Telephone Organization of Thailand
UDP User Datagram Protocol
UML Unified Modeling Language
USB Universal Serial Bus
UT User Terminal
VBR Variable bit rate
VPN Virtual Private Network
VSAT Very Small Aperture Terminal
WAN Wide Area Network
WP Work Package

01/07/08 Jose de la Fuente/ Helsinki University of Technology, Department of Electrical and Communications Engineering, Communications Laboratory
1
1. INTRODUCTION
1.1. Motivation
At December 26 of 2004 an earthquake with a magnitude from 9.1 to 9.3 took place next to
the west coast of Sumatra, Indonesia. As a consequence of the earthquake a set of tsunamis
were formed, resulting in thousands of casualties in eleven countries. At that moment there
were no prevention systems among the Indian Ocean and no warning systems to make the
population be aware of the imminent tsunami event.
Several natural or human-made disasters may occur, such as, earthquakes, epidemics,
terrorism, in any given country. The preparation and planning against these possible events
reduces the human causalities and material losses. The tsunami of 2004 made the
authorities realize the necessity of developing effective warning systems to alert the
population of impending tsunami hazards and improve the international cooperation among
the possible affected countries.
A tsunami is a series of ocean surface waves generated by a submarine earthquake,
submarine volcanic eruption, landslide, or meteor impact. Offshore earthquakes are by far
the most common cause of tsunamis [50]. The detection of a tsunami is possible due to the
use of seismic and sea level sensors and ground movement monitoring, enabling the
reduction of the time between when the earthquake occurs to the moment when the warning
centers are aware of the tsunami and are able to send the warning to the authorities and
population.
1.2. Background on DEWS Project
One of the many initiatives being implemented in response to this requirement for tsunami
warning systems is the European Union (EU) funded Distant Early Warning System
(DEWS) project. The objective of the DEWS project is to design a Reference Model to
promote the integration of the warning capacities which already exist by the creation of an
innovated tsunami early warning system in Indonesia, Sri Lanka and Thailand, henceforth
referred to as INCO or Indian Ocean Countries. The DEWS project brings together partners
from academia, industry and public authorities, from the EU as well as the INCO countries,

01/07/08 Jose de la Fuente/ Helsinki University of Technology, Department of Electrical and Communications Engineering, Communications Laboratory
2
sharing knowledge and technology to perform the different tasks to develop the DEWS
model.
The design and implementation of the DEWS system is divided into seven work packages
(WP), each constituting several key tasks. Among these seven packages the Helsinki
University of Technology is involved in WP1, WP2 and WP3 (see Figure 1). The objective
of the WP1 is to provide a deep understanding for the design and development of DEWS by
compiling information about the user requirements, system requirements and relevant
standards among the countries of interest. WP2 will design the DEWS architecture and
create the technical specifications for the implementation. The WP3 involves the
development of interfaces of the service bus between the DEWS centers with the sensor
platform and other DEWS centers; and dissemination of alerts, warning or notifications
messages to external user groups [15].
Areas of TKK involvement
Figure 1 Logical flow of technical activities in the DEWS project

01/07/08 Jose de la Fuente/ Helsinki University of Technology, Department of Electrical and Communications Engineering, Communications Laboratory
3
1.3. Main Research Contribution
This thesis analyzes the performance of the satellite communication links between Early
Warning Centres and first responders based on the Broadband Global Area Network
(BGAN) technology. The telecommunication system among the DEWS centres is simulated
using the multi-core enabled network simulation software Qualnet.
BGAN enables the DEWS centres to implement a telecommunications system independent
of the situation of the terrestrial infrastructures. This service can be used as a backup of the
usual technologies of the different centres as well as to obtain direct communication links
with first responders. Therefore, the DEWS communications architecture is made robust by
the use redundant satellite links in order to assure an appropriate performance in the
dissemination of the warning messages.
The BGAN backup will provide the Early Warning Centres (EWC) with the same services
obtained in the common access to the telecommunications networks in order to assure the
adequate communication between EWCs and EWC and first responders.
In the simulations we analyze the performance of these BGAN links on the possible
scenarios of DEWS based on the different technologies and characteristics of the
dissemination processes. The User Terminal model, the type of warning message to
disseminate, the characteristics of the emergency system structure and so forth will
influence in critical performance indicators such as the time delay of the message
transmission.
The thesis also contributes with the recompilation for the WP1 of IT national statistics in
the countries of operation in order to provide reliable arguments for the necessity of
including satellite links to achieve appropriate performance.
1.4. Organization of the Report
The background and main research contribution of this report has been summarized in
Section 1. The rest of the report is organized as follows. Section 2 provides a general
introduction in areas of interest in the telecommunications field. After, the Section 3

01/07/08 Jose de la Fuente/ Helsinki University of Technology, Department of Electrical and Communications Engineering, Communications Laboratory
4
provides the necessary information about the DEWS system structure and flows of work
within it.
Section 4 describes the objectives of the simulation process as well as the technologies
employed. Then Section 5 provides an analysis of the results achieved in the simulations
and Section 6 summarizes the conclusions. In addition the Annexes contain the statistical
information compiled in the first part of our work performed for DEWS.

01/07/08 Jose de la Fuente/ Helsinki University of Technology, Department of Electrical and Communications Engineering, Communications Laboratory
5
2. PROBLEM STATEMENT
The model developed by DEWS promotes the integration of national and regional warning
centers controlling and managing flows of upstream information, from the sensors to the
warning centers, and of downstream information, from the warning centers to the
authorities and population. DEWS will cover the technical field, such as the interaction
with the different sensors and the design of the dissemination channels of communications,
and also the organizational field, working with the cooperation and communication
between different warning centers of different regions or countries.
The reference model works from an Enterprise field, providing business processes in early
warning systems based on international standards, an Information field, dealing with the
analysis of the upstream and downstream information and a Computational field, focused in
the decomposition of the system into a set of services [1].
2.1. Communications view
The designed model establishes a communication system to send the upstream information
from the sensors to the warning centers and the downstream information from the warning
centers to the authorities and population.
2.1.1 Warning Centers
The warning centers will manage data from the different flows of upstream information and
they will create a situation picture to determine the risks and the possibilities of an
imminent tsunami in order to prepare the communications channels to disseminate the
warnings.
The implementation of the DEWS reference model consists of three national early warning
centers each attending their own independent set of sensors and several regional centers that
enable exchange of measurement data and other information between the three centers [1].

01/07/08 Jose de la Fuente/ Helsinki University of Technology, Department of Electrical and Communications Engineering, Communications Laboratory
6
2.1.2 Upstream flow
The upstream components will acquire data coming from different sensors such as seismic
sensors, buoys, tide gauges, and so forth. Since the most of the sensors already installed are
designed for different scientific disciplines, the objective of the sensor system is to collect
the different data and offer all the information via a standard interface.
Figure 2 Upstream information flow
The upstream components also develop an evaluation of the measures in order to monitor
the data obtained. The sensor and the tsunami monitoring system are contribution of the
GITEWS project already developed by GFZ in the Indian Ocean [24].
2.1.3 Downstream flow
The downstream component will disseminate the warning message after defining the
objective recipients and the information which may be appropriate to be broadcasted. The
communication network will allow the broadcasting of the warnings by several different
channels with the possibility of including priorities in the dissemination and communication
between the different warning centers with backup channels in case of line failures. The
DEWS downstream segment constitutes two key components: the information logistics
component and the information dissemination component.

01/07/08 Jose de la Fuente/ Helsinki University of Technology, Department of Electrical and Communications Engineering, Communications Laboratory
7
Figure 3 Downstream information flow
The information logistics component acquires the content of the warning messages based
on the situation picture and prepare their compilation in a standard form, in order to be sent
to the different possible users:
Authorities
Local warning systems
Media
The public
The information dissemination component converts the warning messages into data formats
suited to particular outbound physical communication channels.
2.1.4 Service Objectives
The authorities must ensure that sufficient information about an imminent disaster can
reach the maximum number of people in the areas of risk, in addition private organizations,
charities and NGOs must also be aware of the situation [18]. The dissemination of the

01/07/08 Jose de la Fuente/ Helsinki University of Technology, Department of Electrical and Communications Engineering, Communications Laboratory
8
warning messages has to deal with the different possible scenarios where the public may be
located such as:
Citizens in their own dwelling.
Citizens at their place of work.
Citizens in public venues (i.e. sports complexes, shopping malls, etc.).
Citizens traveling on foot.
Citizens traveling in a vehicle.
To reach all this possible contexts a wide number of possibilities in the dissemination
channels are offered in order to assure the notification to the entire population at risk.
In addition the messages should be distributed in a standardized model only to the people at
risk in an understandable way, also taking into account the possibility of people with other
languages or disabilities.
2.1.5 Possible Communication Channels
The reference model designed in DEWS must ensure the dissemination of the warning
messages to all types of public, in all the possible scenarios. In addition, simple channels
could be more effective than the modern technologies available in the area. The most
important possibilities would be:
The media such as Broadcast Television and Radio are one of the most important
options in order to reach the population in a fast and effective way; both of them
have high levels of penetration even in non-developed countries and involve an
appropriate way to reach rural areas.
Siren systems also provide and effective channels to disseminate the warning
message, allowing the authorities to activate the devices by radio in order to
broadcast pre-recorded messages.
In developing countries mobile phones have higher penetration rates than fixed lines
what brings us a new possible channel to disseminate the warning; however the
possibilities of overloading the network in the moment of the disaster oblige the
warning system to provide more options.

01/07/08 Jose de la Fuente/ Helsinki University of Technology, Department of Electrical and Communications Engineering, Communications Laboratory
9
Furthermore, Internet and email systems have relatively low usage in the possible
risk areas so their use is still limited in the context disseminating warning messages
to the general public.
The majority of the telecommunications infrastructures supporting these different channels
of dissemination will be at risk during the natural disaster. In addition, terrestrial antennas
and repeaters may not have enough coverage in the areas [53]. Therefore, the use of
satellite communications gives a reliable backup solution which will be the main focus for
of the studies presented in the next chapters.
2.2. Regional Overview
2.2.1 Indonesia Overview
In Indonesia the government has already developed the National Earthquake Information
Centre in Jakarta hosted by the meteorological agency Badan Meteorologi Dan Geofisika
(BMG) and is being upgraded into the Indonesian National Earthquake Information and
Tsunami Warning Centre (NEITWC), replacing the interactive data processing with
automatic processes.
In addition ten Regional Earthquake Information and Tsunami Warning Centers (REITWC)
exist in Indonesia; all of them receive data of their particular network of seismograph
sensors in order to determine possible tsunamis in their areas. The Regional Centre situated
close to Jakarta would act as backup for the National Centre.
The NEITWC will send information to the different REITWC and they will activate the
dissemination of the warning using the possible channels.

01/07/08 Jose de la Fuente/ Helsinki University of Technology, Department of Electrical and Communications Engineering, Communications Laboratory
10
Figure 4 Nation and Regional Centers in Indonesia [4]
By 2005 there were no dedicated telephone lines for the communication between the
different centers so at the moment radio links are being developed for local level and
satellite links for a national level.
The NEITWC will prepare the data compilation from the Regional Centers and develop the
decision making in order to disseminate the warning. When a significant earthquake is
detected by the NEITWC the following decision making procedure is applied [36]:
Earthquake Magnitude > 5 Richter: Send SMS to BMG staff
Earthquake Magnitude > 6 Richter: Send SMS to officials in relevant agencies
Earthquake Magnitude > 7 Richter: inform the Ministers of Science and
Technology, Communications and Information, Transportation, Internal Affairs and
the Office of the President
The warning can be delivered by a multiple set of possible channels so the most appropriate
must be chosen to perform a successful dissemination. The decision will be based in the
national statistics (see Annex A: ICT Gathered Indicators). The BMG can cut into the
television and radio to broadcast warning messages, the use of these media will be one of
the most useful channels due to the high penetration rates of television and radio, by
contrast the dissemination to the population by internet would be almost useless due to the
poor penetration.

01/07/08 Jose de la Fuente/ Helsinki University of Technology, Department of Electrical and Communications Engineering, Communications Laboratory
11
Currently warning messages are broadcast to government authorities and leaders by SMS
and phone calls, and the general public can also subscribe to these SMS messages
reception. The penetration of fixed lines is poor but the mobile cellular subscribers’ rate is
high and has a good grown rate making it also a good channel to disseminate the warning.
The mobile technologies used by the different providers in the country are GSM and
CDMA, and each provider has a different coverage area in the country (see Annex B: GSM
and CDMA Coverage Areas).
2.2.2 Sri Lanka Overview
The Disaster Management Act No.13 of 2005 provides the legal basis for a disaster risk
management framework in Sri Lanka. The Act establishes the National Council for Disaster
Management (NCDM), chaired by the President, and the Disaster Management Centre
(DMC) will perform the designated operations [34].
In the country there are several governmental organizations with sufficient communications
networks to disseminate the warning message among the population if a connection with
the authorities is created. In addition, the police force is divided in several districts, all of
them connected to the Command Centre of the police; these connections are secure enough
to not be affected by a natural hazard.
The decision to disseminate the warning is made after the confirmation of an imminent
tsunami by the Pacific Tsunami Warning Centre (PTWC) and the Japan Meteorological
Agency (JMA) (see Figure 5 below).

01/07/08 Jose de la Fuente/ Helsinki University of Technology, Department of Electrical and Communications Engineering, Communications Laboratory
12
Figure 5 Last mile dissemination channels in Sri Lanka
The Warning Centers will inform the television and radio stations by telephone lines in
order to start sending the warning among the population and also to the police force by HF
radio so the police personnel can help in the dissemination. The military
telecommunications network is also used to perform the warning process.
Fixed lines have a poor penetration rate in Sri Lanka even if some providers have good
coverage areas, on the other hand mobile lines have high penetration rates with good
growth rates, making the mobile communication a possible way to disseminate the warning.
Again the technologies used by the different providers are GSM and CDMA (see Annex B:
GSM and CDMA Coverage Areas).
2.2.3 Thailand Overview
In Thailand the Committee on Policy of the National Disaster Warning System
(COPNDWS) deals with the legal issues related with the warning project and systems,

01/07/08 Jose de la Fuente/ Helsinki University of Technology, Department of Electrical and Communications Engineering, Communications Laboratory
13
while the Committee on National Disaster Warning Administration (CONDWA) provides
with technical advice [35].
The National Disaster Warning Centre (NDWC) established in 2005 functions under the
COPNDWS and CONDWA, and is responsible for receiving and monitoring data coming
from seismic and water-level sensors, national and also from networks in Europe, Asia and
USA, receiving this data by the use of telephone, fax or email. Its main tasks are to manage
this information in order to be ready to send it to the different officials, emergency agencies
and general public, coordinate with other warning systems of other communities and
prepare the processes for decision-making.
The NDWC is able to disseminate warning messages via the TV Channel 5 and also to
activate the warning system towers, situated among the risk areas and connected to the
NDWC by satellite, which are able to send the warning message in different languages or
dialects depending on the area.
As in the other two studied countries the penetration of the fixed lines is poor even if TOT-
Public Company Limited, having the monopoly in the fixed telephone network, provides
communications also to rural communities. On the other hand, again the mobile telephone
penetration is much higher and the providers use GSM and CDMA technologies (see
Annex B: GSM and CDMA Coverage Areas).
2.3. Satellite Communications
2.3.1 Satellite Communications Introduction
For the Early Warning System the satellite communication presents an attractive alternative
communications technology in order to reach the maximum amount of warning systems,
authorities and citizens in all kind of zones and regions in alert.
The satellite communications industry is migrating from its role as trunk connectors
between networks to a role of broadcasting media to the end users as a consequence of the
increasing installation of optical fiber and demand of mobile and IP-based services.

01/07/08 Jose de la Fuente/ Helsinki University of Technology, Department of Electrical and Communications Engineering, Communications Laboratory
14
These satellite links provide the communications network with enough bandwidth to
integrate web-based services between the different centers. Nowadays, the majority of
operating systems and vendors have achieved a culture of development of Service Oriented
Architecture (SOA) web services. The use of web services provides the DEWS system with
higher level of flexibility and actualization, simpler processes of online information access
and reduction of software development costs [45]. However the SOA services consume
higher amounts of bandwidth than traditional distributed applications and will need
minimum levels of latency to avoid WAN congestion [38].
2.3.2 Satellite Standards Overview
In the actual satellite communications situation many standards and technologies are used
by the different satellite companies and Internet providers [17]. In order to achieve a
consensus standard in this field, the Technical Committee for Satellite Earth Stations (TC
SES) is trying to harmonize the existing standards for reduced fragmentation.
Nowadays the two most relevant standards for the satellite telecommunications are BGAN
and DVB-RCS. BGAN, Broadband Global Area Network, is the network offered by the
newest generation of communication satellites for mobile terminals of Inmarsat. This
service provides a global area of coverage except the poles, enabling the use of small user
terminals (UT) for communications at high data rates. It enables the users to access point-
to-point services on portable or semi-fixed mobile platforms, offering bit rates about 500
kbps. In addition, the UT supports constant bit rate (CBR) and variable bit rates (VBR)
applications with different QoS depending on the model of terminal.
Still in process of development is the BGAN Air interface and Platform extension, which
belong to a project of the European Space Agency (ESA). The objectives of the extension
of BGAN reside in the intention of developing an efficient support of multicast in this
technology [19]. This project will increase the performance of BGAN in maritime,
aeronautical and land-mobile environments improving the basic service and supporting
omni-directional terminals.
The BGAN system is able to offer both circuit switched (CS) and packet switched (PS)
connections. Circuit switched is commonly focused to voice and narrowband data

01/07/08 Jose de la Fuente/ Helsinki University of Technology, Department of Electrical and Communications Engineering, Communications Laboratory
15
applications while packet switched is chosen for linking communication between the end
user and Internet or any private Intranet. On the other hand, DVB-RCS, Digital Video
Broadcasting – Return Channel via Satellite, offers bi-directional or two-way transmission
of digital data employing combinations of the C, Ku and Ka bands.
The use of a basic ground station will serve as the gateway infrastructure to provide the
satellite management and the interface with the terminals and WANs. This technology
allows the Internet Service Providers (ISPs) to implement their telecommunications
networks over bent pipe satellites located in geostationary orbits.
DVB-RCS offers unicast access services to the users connected to a terminal or indirectly
connected to a terminal by a private LAN. The user will be able to access one ISP Network,
which will provide him access to Internet or Private Network.
2.3.3 Satellite Protocols Overview
In the transport layer of the satellite communications the protocols used are Transport
Control Protocol (TCP) and User Datagram Protocol (UDP). TCP provides error checking,
retransmission and congestion avoidance and even if it works well in satellite links, its
performance can be limited by the latency and bandwidth of these links. On the other hand
UDP does not provide error checking, retransmission or congestion avoidance facilities, but
it works without any limitations under satellite communications except some influence of
the latency of the link and a rare occurrence of packet loss [21].
To provide end-to-end security and Virtual Private Network (VPN) implementations,
encryption of the data is necessary. The Sequence Number, Acknowledgment Number, and
Window bit fields control data flow between two TCP devices [16]. When the window is
exhausted, the sender must stop until it receives another Acknowledgment Number with a
Window size. In this way, each side of a TCP connection controls the rate at which it
receives data.
In VPNs IPsec not only encrypt the data portion of packets, they also encrypt the TCP port
number and IP address of the sender’s computer, so only the VPN software at the remote
site can decipher where packets originated and acknowledge receipt of data [51] resulting in

01/07/08 Jose de la Fuente/ Helsinki University of Technology, Department of Electrical and Communications Engineering, Communications Laboratory
16
substantial throughput degradation. To avoid the throughput cap the TCP session is broken
in three segments by installing Performance Enhancement Proxies (PEP) at each side of the
satellite link. Prompt ACKs from the PEP give the sender permission to send more data,
even before the previous window of data reaches the far-end earth station. The customer
can send at the same rate available on the LAN, up to the capacity of the satellite circuit.
2.3.4 Satellite Communications DEWS
The coverage area of the communications satellites range from narrow spot beams with
smaller areas than a continent, to the areas about a third of the earth’s surface, and both
options usually available in the same satellite. They allow us to reach rural, remote and also
maritime areas in order to disseminate the warning.
In the area of the three countries of interest, the company Inmarsat provides a wide range of
services in its areas of coverage (See Figure 6). The telecommunications networks can use
the land service BGAN in order to deliver the warning message being able to broadcast data
to the whole surface of these countries.
Figure 6: Actual and future BGAN Coverage [26]
Iridium Satellite LLC provides voice and data communications solutions with a complete
coverage in a global area with a satellite constellation of 66 low-earth orbiting satellites, in
addition, Iridium satellites are prepare to transfer the data also from maritime zones serving
the DEWS warning centers to receive the data from buoys and GPS sensors.

01/07/08 Jose de la Fuente/ Helsinki University of Technology, Department of Electrical and Communications Engineering, Communications Laboratory
17
Another opportunity is the Palapa satellites series owned by Telkom Indonesia for
distribution of voice, video and data in the area. These satellites are used by this company
for the telecommunication network being combined with terrestrial solutions.
VSATs are also available for use with antennas smaller than 3 meters (most VSAT
antennas range from 75 cm to 1.2 m) and offering transportable, on-the-move (with phased-
array antennas) or mobile maritime communications.

01/07/08 Jose de la Fuente/ Helsinki University of Technology, Department of Electrical and Communications Engineering, Communications Laboratory
18
3. Generic DEWS Model of Reference
The model developed by DEWS is based on the results of the German Indonesian Tsunami
Early Warning System (GITEWS) developed by GeoForschungsZentrum (GFZ) Potsdam.
As an innovation DEWS provides a new generation of interoperable early warning systems.
The model structures the collaboration of the national and regional warning centres
developing their communications service bus with standardized protocols [10].
3.1. General Architecture
A logical overview of the structure of DEWS model is offered in Figure 7, where inside the
integration platform square, the contributions of GITEWS are designated in blue and the
innovations developed by DEWS are in orange.
Figure 7: Schematic Architecture of DEWS
The Sensor System offers a service bus compiling the data coming from buoys, seismic
sensors, etc and providing a standardized interface to the Tsunami Monitoring Component.
SENSOR PLATFORM Seismic System
GPS Tide Gauges
Buoys Simulation
TSUNAMI MONITORING COMPONENT
Sensor Registry
Sensor System Management
Decision Process Controller
COMMAND & CONTROL COMPONENT
User Data Repository
Command/Control and
Decision Support
Message Controller
SITUATION PICTURE COMPONENT
Geo-Data Management Controller
Situation Picture Controller
INFORMATION
LOGISTICS Content Translation Content Definition
INFORMATION
DISSEMINATION Media Conversion Dissemination ER On-field Information
Distribution Services and Applications DISTRIBUTION CHANNELS
USER Rescue Services Government Agencies
Media Infrastructure Providers
Citizens
Distribution Networks

01/07/08 Jose de la Fuente/ Helsinki University of Technology, Department of Electrical and Communications Engineering, Communications Laboratory
19
The Tsunami Monitoring Component generates tsunami events messages after an
evaluation of the data achieved from the Sensor System. It offers a user interface which
allows the activation of these sensors and the recompilation of their data. In this component
the Decision Process Controller is in charge of the execution of the standardized processes
for the detection of an imminent tsunami and of the decision making involved. The Sensor
System Management and the Sensor Registry are in charge of the registration and
maintenance of the sensor technical parameters and their availability.
The Situation Picture Component will create the situation picture to provide an overall view
of the current situation based on spatial data. Using the information available it will create
map products to be distributed to target groups in the areas in danger. The subcomponent
Geodata Management Controller will develop the topography and risk maps and the
Situation Picture Controller will be responsible for the maintenance of the graphic version
of the situation picture and secure its availability to be accessed by the authorities.
The Command and Control Component is the central component of DEWS. It receives
information from the other Early Warning Systems and the situation picture study
developed by the Situation Picture Component and is also in charge of disseminating the
warning messages to the end users. The Command/Control and Decision Support controls
the decision making processes and provides with the Human Machine Interface (how the
users interact with the system) of DEWS. The Warning and Message Controller will
manage the communication between the Situation Picture Component and all the
components related with the dissemination of the warnings to the authorities and
population. Finally the User Data subcomponent supports the Command & Control and
Decision subcomponent by storing pre-defined information such as warning message
distribution lists or operational plans.
The Information Logistics Component will acquire and store content and information about
the users such as authorities, media and the public, in order to reduce the time of delivering
the warnings and translate it into the different languages. For the Content Definition and
Translation we have the Information Logistics Controller, responsible of executing the
needed processes to create the warning messages, the Information Aggregation, which
compile significant event data and prepare it in standardized messages, the Content

01/07/08 Jose de la Fuente/ Helsinki University of Technology, Department of Electrical and Communications Engineering, Communications Laboratory
20
Conversion, which adopt the messages to the different channel and languages requirements
and finally, the Demand Management, responsible of the recompilation of information of
the users groups and their information requirements.
The Information Dissemination Component is responsible of transforming these warning
messages into bit streams and the activation or deactivation of its transmission through the
different physical connections.
3.2. Tsunami Disaster Decision Making
The tsunami-related activities fall within the domain of multiple organizations and
government agencies. Therefore, there is a clear need for all the possible decision and
action making processes to be established in advance in order to assure the faster
dissemination of the warning messages when a hazard is detected.
Nevertheless, the large amount of processes involving the DEWS model makes impossible
to represent all the workflow into activity diagrams, however in this chapter we introduce
the decision and action processes referring to the main possible hazard, a tsunami disaster.
The process is separated into four phases from the detection of the earthquake to the post
tsunami scenario and the activities are separated into four scenarios, the physical scenario,
the sensor system, the DEWS centres and the dissemination channels. The process is
represented using the UML activity diagram type [10].

01/07/08 Jose de la Fuente/ Helsinki University of Technology, Department of Electrical and Communications Engineering, Communications Laboratory
21
Figure 8: Initial phase, the earthquake detected
In this phase is represented the actions to be taken after the detection of an earthquake, the
sensor system is going to send the alert to the DEWS centres, where the situation is going
to be rationalized and managed.
If the magnitude of the earthquake exceeds a pre-determined threshold the different centres
will disseminate an earthquake warnings to the authorities and will start the simulations
with the measured valued of the earthquake to determine the possibility of an imminent
tsunami.
01/07/08 Jose de la Fuente/ Helsinki University of Technology, Department of Electrical and Communications Engineering, Communications Laboratory
22
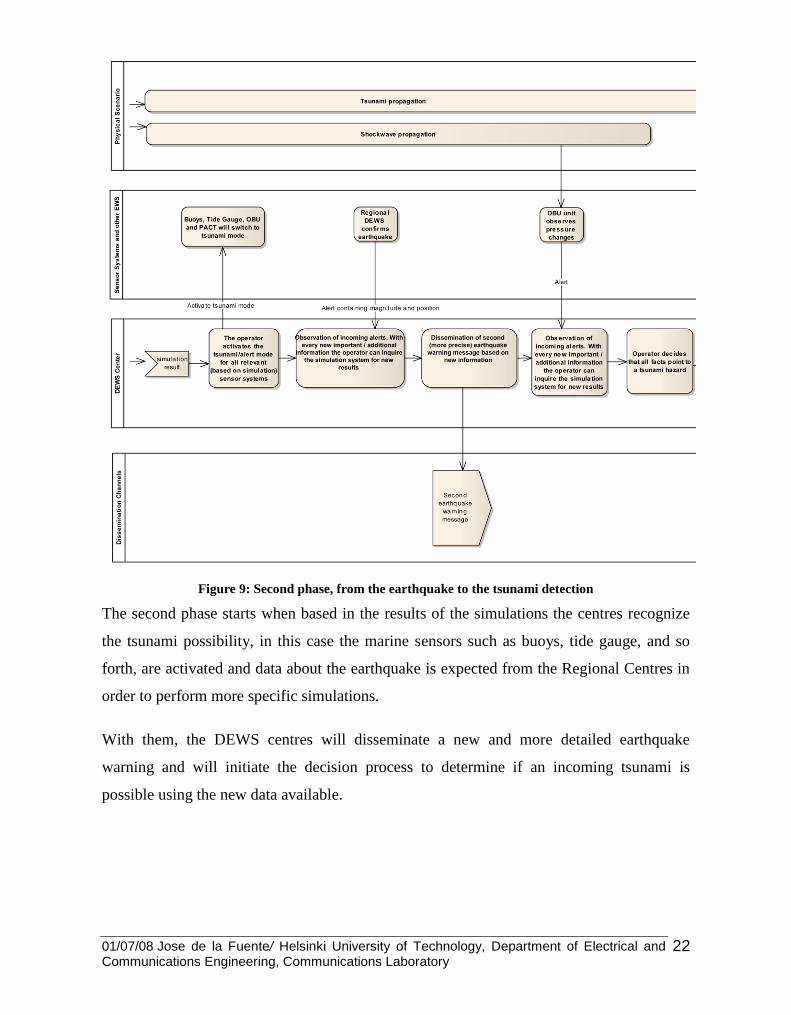
Figure 9: Second phase, from the earthquake to the tsunami detection
The second phase starts when based in the results of the simulations the centres recognize
the tsunami possibility, in this case the marine sensors such as buoys, tide gauge, and so
forth, are activated and data about the earthquake is expected from the Regional Centres in
order to perform more specific simulations.
With them, the DEWS centres will disseminate a new and more detailed earthquake
warning and will initiate the decision process to determine if an incoming tsunami is
possible using the new data available.

01/07/08 Jose de la Fuente/ Helsinki University of Technology, Department of Electrical and Communications Engineering, Communications Laboratory
23
Figure 10: Third phase, from the tsunami detection to the landfall
If a tsunami is expected, the DEWS centres will determine the areas in danger and
disseminate the first tsunami warning message to the affected groups with the appropriate
content.
After the new data coming from the buoys and tide gauges the centres will perform the
dissemination of the second tsunami warning message with more specific information and
will start the recompilation of new information of the coming events and the situation of the
landfall.
01/07/08 Jose de la Fuente/ Helsinki University of Technology, Department of Electrical and Communications Engineering, Communications Laboratory
24
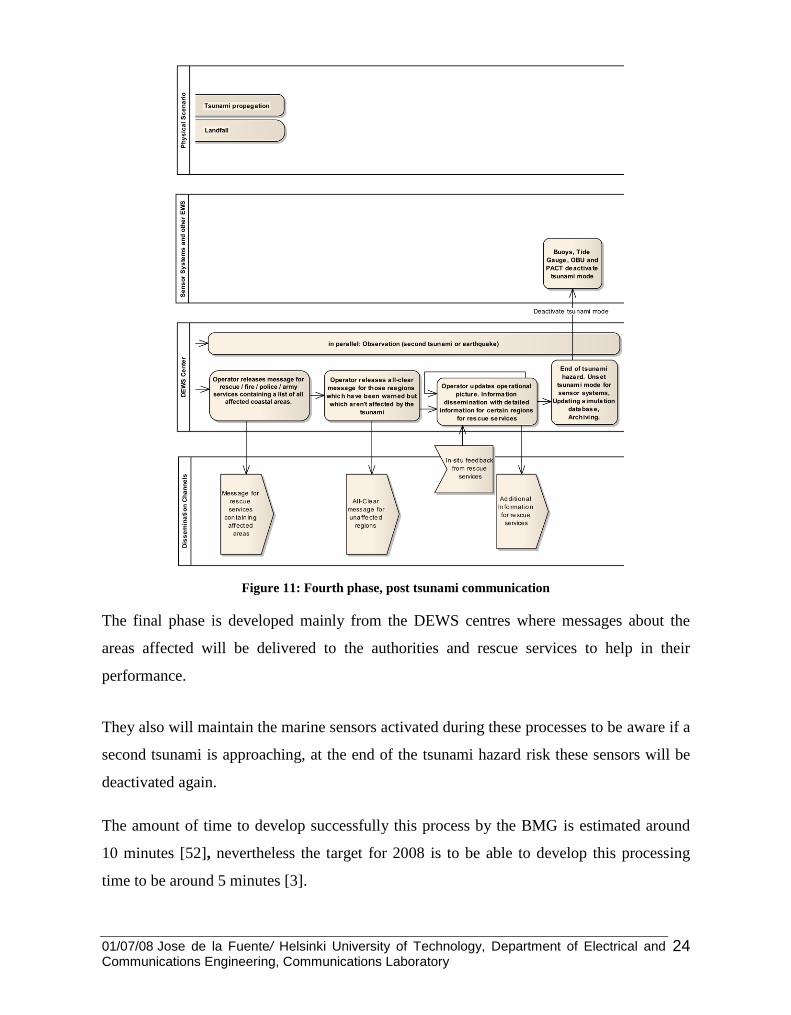
Figure 11: Fourth phase, post tsunami communication
The final phase is developed mainly from the DEWS centres where messages about the
areas affected will be delivered to the authorities and rescue services to help in their
performance.
They also will maintain the marine sensors activated during these processes to be aware if a
second tsunami is approaching, at the end of the tsunami hazard risk these sensors will be
deactivated again.
The amount of time to develop successfully this process by the BMG is estimated around
10 minutes [52], nevertheless the target for 2008 is to be able to develop this processing
time to be around 5 minutes [3].

01/07/08 Jose de la Fuente/ Helsinki University of Technology, Department of Electrical and Communications Engineering, Communications Laboratory
25
3.3. Dissemination Channels
At the moment the DEWS project has been developing the definition and characteristics for
the communication model in Indonesia, designing the architecture for the different DEWS
stakeholders and the services and processes which would take place between them.
The previous early warning system GITEWS established four application servers at BMG,
which works as the National Warning Centre in Indonesia, two of them for managing the
sensor system and the other two for the decision support system. In each pair one of the two
servers will function as a backup for the other one.
During one year of operations the data coming from Buoys, Gauges, GPS-Master Stations
and Seismic Sensors Wave Data are estimated not to exceed 2,5 TB (2400 GB). According
to this estimate, data can only be stored for approx six months because the system will use
the Sun Storage 3510 FC with a storage capacity of 1,2 TB [11].
In addition to the hardware components, the possible communication networks and their
availability in a selected scenario are also defined including the channels and protocols used
in the architecture.
3.3.1 Upstream Communications Architecture
The data flow from the sensor system to the DEWS centres is defined mostly based in the
already existing networks developed by GITEWS. Even if during any communication only
the main channel will be used, the reference model provides multiple communication
options from the sensor system.
The following figure provides an overview of the communication hardware and protocols
options where the different alternatives can be observed, the dotted lines represent options
which remain to be confirmed for the development of the system [12].

01/07/08 Jose de la Fuente/ Helsinki University of Technology, Department of Electrical and Communications Engineering, Communications Laboratory
26
Figure 12: Upstream Communication Architecture
A VPN will be created among the different partners and the protocols used will be:
TCP/IP-based:
TCP
o BGAN
o VSAT
Point to Point Protocol (PPP) for TCP/IP
o Pasti
o Iridium
Serial Line Based (Modulator - Demodulator):
Custom
o The sonar modems for OBU/PACT use proprietary protocols
ZModem [mutually exclusive with PPP]
o Pasti
o Iridium
In addition the stakeholders who will receive and manage the information from the sensor
system will be:
Bakosurtanai (Badan Koordinasi Survei dan Pemetaan Nasional): The
Indonesian National Coordinating Agency for Surveys and Mapping.
BPPT (Badan Pengkajian Dan Penerapan Teknologi): The Indonesian National
Technology-Centre for Marine Exploration

01/07/08 Jose de la Fuente/ Helsinki University of Technology, Department of Electrical and Communications Engineering, Communications Laboratory
27
BMG (Badan Meteorologi Dan Geofisika): The Indonesian Geophysical
Service who hosts the national Tsunami Early Warning Centre.
GFZ-Potsdam: GFZ Departments are involved in the development of the
Gauges, Buoy-, GPS- and Seismic components for the GITEWS project.
The data is received following the infrastructure shown in figure 13:
Figure 13: Upstream Communication Infrastructure
3.3.2 Downstream Communications Architecture
In order to disseminate the warning successfully, broadcast communications will be used by
the model. Without any filters or interaction, the messages will be sent between the source
partners to the destinations.
The messages will contain specific information in a simple format in order to facilitate its
transmission through the wide range of possible channels due to the low bandwidth needed.
The exchange of messages should also provide tracking to provide with information to
post-tsunamis analysis and knowledge management, looking for developing the system by
learning how was the performance of the dissemination.
In the dissemination of the warning the stakeholders will have different roles and
information needs, they will be:

01/07/08 Jose de la Fuente/ Helsinki University of Technology, Department of Electrical and Communications Engineering, Communications Laboratory
28
DEWS Centres: The regional centres will assure a minimum level of decision
making among the affected areas and will provide with supplementary information
to the neighbour centres, they also will replicate all the information messages to the
national centre [9].
Disaster Management Institutions: They will manage all the information coming
from the sensors and are in charge of activating the alerting process and their
cancellation if it is a false warning or if it is finished.
Central Government: Must be periodically informed and must be given a
continuously updated overview of the emergency situation.
Local authorities, police, fire brigades, military, hospitals, etc: Must prepare to the
event, organize first intervention and first aid measures. They are mostly recipient
of alert and cancellation messages.
Media companies, tourist organizations: Must spread the news in a controlled way,
assist and look after foreign people. They are mostly recipient of alert and
cancellation messages [12].
3.3.3 Communication between EWCs
The Warning Centres will need to maintain a continuous communication both in national
level and international level sharing data and coordination their actions. The best approach
for this connectivity is the creation of a Virtual Private Network (VPN) due to its secured
channels established among public networks, its flexibility and the large costs saving [14].
A VPN combines the advantages of using a private network and the advantages of using
and public network. It provides an illusionary private network using a public network to
transmit the data between the nodes. With a VPN the users are able to access to network-to-
network and remote-user-to-network connections via an encrypted link through the public
internet network.
The use of a VPN partially eliminates the necessity of installing all the hardware needed to
develop a private network and are especially profitable in long distances communications
where arranged lines would be more expensive. On the other hand, VPNs induce to
questions about security, reliability and the possibility of poor performance.

01/07/08 Jose de la Fuente/ Helsinki University of Technology, Department of Electrical and Communications Engineering, Communications Laboratory
29
The EWC will receive the VPN services from network operators or providers, configuring
it between the different centres. This VPN can be provided by one single operator if the rest
of EWCs are within its area of coverage, otherwise the VPN would be supported by
multiple providers.
In the DEWS project the VPN will communicate the national centres and regional centres
allowing reliable transmission, robustness, tampering resistance and adequate speed [12].
An example inter-EWC VPN is shown in Figure 14.
Local Network
CE PE Service Provider
Network A
EWC 1
Data Transfer
Internet Access
Voice Communications
Streaming Video
Storage Networking
Intranet/Extranet
Remote Access
etc.
EWC Service Requirements
VPN Tunnel
Service Provider
Network B
VPN TunnelCE
Local
Network
Inter-Provider
Connection
PE
EWC 3
Router
Firewall
VPN
Gatewayetc.
L2/L3 Switch
Router
etc.
PE
CE-PE Connectivity
PE
L2/L3 Switch
Router
etc.
Notes: CE = Customer Edge, EWC = Early Warning Center, L1 = Layer 1 (physical layer), L2 = Layer 2 (data link layer), PE = Provider Edge, VPN =
Virtual Private Network.
Copper (twisted pair, coaxial), Fiber,
Digital Microwave, Satellite etc.
Example EWC VPN
CELocal
Network
EWC 2
Figure 14: Example of two EWC using the VPN
3.3.4 Communications between EWCs and first responders and general public
The first responders will belong to organizations such as emergency services, security
forces, government agencies, and so forth, organizations responsible for maintaining the
safety and security of the general public. In case of hazard warning they will also be in
charge of the timely and reliable distribution of the warnings and instructions to the
population.

01/07/08 Jose de la Fuente/ Helsinki University of Technology, Department of Electrical and Communications Engineering, Communications Laboratory
30
Therefore it is essential to develop a permanent or rapidly configurable connectivity
between the EWC and the first responders in order to provide the capacity of sharing key
data and disseminating warning messages. For this reason DEWS advocates for the
implementation of VPNs between the National EWC and the first responders. Connectivity
from the EWC to both the general public and first responders is typically provided over a
range of public fixed and wireless networks (see Figure 15 below).
Presence
Mobility
Authentication
Applications
Session
Control etc.
Wireless
Access
Fixed Access
Third Party Providers and
Developer Community
Network Servers
Provider CoreProvider-Edge
Other Carriers’ Network,
Internenational Network
National Warning Center
Regional
Warning Center
User Environment Access Networks Transport Network
General Public &
First Responders
Edge Nodes
Core Nodes
Base
Stations
Access
Points
Copper
Loop
Fiber
Loop
Internet
Radio
Towers
Figure 15: EWC to first responders and general public communications
As a complement to these networks we test the implementation of a backup links via
satellite technologies using the BGAN service. Their objective will be to serve as a
communication channel independent of the possible consequences of the hazard among the
terrestrial structures. This backup will provide the same services of the common access to
the telecommunication networks in order to disseminate the warning among the first
responders and therefore among the general public.

01/07/08 Jose de la Fuente/ Helsinki University of Technology, Department of Electrical and Communications Engineering, Communications Laboratory
31
3.4. Message Composition
The warning message will have different characteristics and size depending on the
information and data to be sent. DEWS has based the development of the warning message
on the Common Alerting Protocol (CAP) in order to standardize the content of the
notifications which are going to be sent to first responders and government agencies
working in different fields inside the emergency response and in different countries with
several languages.
The common alerting protocol (CAP) provides an open, standardized, XML-based message
format for exchanging all-hazard warnings, alerts or notifications, over diverse
dissemination channels. CAP message includes hazard-specific information elements, such
as, event category, event description, instructions, sender ID, time stamps, level of urgency,
level of certainty, level of severity, area description and also supports the inclusion of
associated multimedia content e.g. digital maps [32], [13].
The routing information in the message includes elements for enabling the location-based
message delivery in the target area, distribution type, distribution status, description of roles
and their tasks (for sender, receiver, consumers etc.), and keywords describing the message
content.
The format, size and content/detail and level of difficulty of the messages delivered to a
specific group are designed based in two factors. First, the level of expertise necessary to
understand and effectively performance the needed tasks included in the standardized CAP
message and in the associated resources. Second, the inherent limitations in the type and
size of message formats (e.g., text, audio, image files etc.) that could be delivered over a
particular dissemination channel and displayed in a targeted user terminal.
User groups such as Public Authorities or Government Agencies, Emergency Response
Organizations, etc will receive warning messages with a high level of expertise. They will
need this information in order to coordinate rapid provisioning of state resources for
evacuation operations covering the areas targeted by the warning messages.

01/07/08 Jose de la Fuente/ Helsinki University of Technology, Department of Electrical and Communications Engineering, Communications Laboratory
32
On the other hand, organizations such as Telecommunications Service Providers, Broadcast
Media, Local Warning Systems and the General Public will receive the warning message
and will re-distribute simplified warning messages to the customers connected to their
networks, audience of a TV or radio channel, or to the segment of the public within the area
of the Local Warning System. All the process has the final objective of reaching the general
public, whose role is to be primary message consumers.
The size of the files to be sent will range from a few kB if the message is composed only by
a text based in CAP, to a few MB is the message will include multimedia data such as
maps, audio and so forth.

01/07/08 Jose de la Fuente/ Helsinki University of Technology, Department of Electrical and Communications Engineering, Communications Laboratory
33
4. Specifications of the Simulation
4.1. Objectives of the Simulation
In this stage we develop the simulation processes of the communications networks to obtain
an approximated performance of the real implementations for the following cases:
Between two or more Early Warning Centres
Between Early Warning Centres and local authorities, local warning systems,
emergency warning centres, government agencies authorities etc.
The purpose of this thesis is to analyze the performance of the BGAN service as the core
technology for the DEWS communications, simulating its characteristics with the means
offered by Qualnet Simulator. These estimated results will help to design an appropriate
communications structure in order to cope with the DEWS requirements in terms of
delivery time, data transmission rates achieved, management of different User Terminal
models, etc. Our proposal is the use of the BGAN service for DEWS communications to
provide a reliable backup for the commonly used channels in case they are disrupted as a
hazard consequence.
Managing the different possible types of digital messages to be sent in case of emergency
and the physical and technical characteristics of our communications network we are able
to measure their effects in the performance of the system.
4.2. Basis and resources of the simulation
4.2.1 Simulation Tool Description
Qualnet is communication networks evaluation software which simulates wireless, wired
and mixed platform links and devices performance. The tool enables the user to represent
the entire network in a digital scenario with the specific devices, terrain effects,
atmospheric effects and human interaction effects [41].
Qualnet Model works with ISO stack based layer architecture, in addition, application
programming interface (API) are enabled between the different layers in order to provide a
higher modular programming interface and suitability.

01/07/08 Jose de la Fuente/ Helsinki University of Technology, Department of Electrical and Communications Engineering, Communications Laboratory
34
The Qualnet Product Family consists of Qualnet Developer plus a number of model
libraries, for the simulation in study the Satellite Model Library will be used. Qualnet
Developer integrates the following tools for the design and measure of the simulations:
Qualnet Scenario Designer prepares the model of the scenario to be studied. It
covers the input of the different characteristics for the physical connections and
functional parameters of the networks installed.
Qualnet Scenario Animator and 3D Visualizer provides an animated visualization of
the scenario simulation while it is running. The user can observe the packets and
data flows as well as issues such as the devices’ mobility, the packet queues, the
devices’ signals, etc.
Qualnet Analyzer provides statistical graphics displaying an amount of measures
involving the performance of the network during its running. It includes statistics
from the physical layer to the application layer.
Qualnet Packet Tracer enables the user to perform a packet level monitoring,
providing data about the packet’s contents and statistics during its transmissions.
4.2.2 Tool and Simulations Limitations
The simulator tool presents a number of limitations for the complete implementation of the
BGAN system into the scenarios. Some particular technical specifications of the service are
not available in Qualnet due to the relative infancy of the satellite library of the simulator.
Furthermore, a bent-pipe configuration of the satellite is employed in the simulations. This
contrast to the Inmarsat I-4 satellites which operate an on-board digital processing payload
architecture for functions, such as, beam routing in multibeam systems; frequency mapping
between uplink and downlink; gain control and data rate conversion.
Despite these feature limitations and unavailability of some inputs in the simulation
interface, the Qualnet and the Satellite Library used in this work allow sufficient
specifications in providing a fairly reliable approximated behavior of BGAN system. To
that end, the limitations the BGAN technical specifications have been configured into the

01/07/08 Jose de la Fuente/ Helsinki University of Technology, Department of Electrical and Communications Engineering, Communications Laboratory
35
simulations as well as the characteristics of devices such as the User Terminals in order to
display trusty transmissions patterns in the results.
4.3. Justification for using BGAN
Inmarsat is an international telecommunications company founded in 1979. The company
owns the most advanced fleet of commercial communications satellites, covering around 85
per cent of the world's landmass and 98 per cent of the world's population [26].
Among its services BGAN represents the most adequate option for the installation of the
satellite communications links among the DEWS system, providing emergency and disaster
response operations with reliable connections.
First, BGAN offers coverage among the areas of interest in Indonesia, Sri Lanka and
Thailand as well as among cooperative countries such as USA, Europe or Japan (see Figure
6). This characteristic will permit DEWS to implement an international cooperation system.
Secondly, the BGAN standards is designed to provide a wide range of appropriate services
for the use in Warning System such as internet and intranet solutions, video on demand,
video-conferencing, fax, e-mail, telephone and high-speed LAN access. On the other hand,
other standards like DVB are more focused to perform a specific service such as video
broadcasting.
Thirdly, BGAN provides a reliable communications option in hazard environments. Under
normal circumstances the EWCs will have access to the terrestrial communications
networks such as fixed broadband Internet access, fixed/mobile phone lines, etc. by the
common point of access and therefore the use of satellite communication terminals may be
minimal. Nevertheless after the hazard apparition the terrestrial telecommunications
structures of the affected areas may be disrupted. The possession of BGAN User Terminals
by the EWCs of the system will serve as a backup in case the common channels are not
available.
The possession of BGAN terminals by the emergency responders can easily restore a
communication network in case the terrestrial structures are disrupted. Especially for
vehicular and on-terrain emergency response units, BGAN offers communication with the

01/07/08 Jose de la Fuente/ Helsinki University of Technology, Department of Electrical and Communications Engineering, Communications Laboratory
36
mobility advantage. The small dimensions of BGAN terminals make them easy to quickly
be setup and pointed to I-4 satellites, in contrast to VSATs terminals which could even
require 2m dishes.
In addition Sri Lanka, Thailand and Indonesia situated equatorial climate zones, one of the
most rainy areas of the world rainfall rates of more that 120mmhr-1
(rainfall rates of more
than 120 milliliters per hour along the 0,01% of a year)(See Annex D) . The use of the C-
and L-band of the spectrum of BGAN achieves the negligible disruption due to rain fading
(see Figure 16 below).
Figure 16: Rain Attenuation for the different Spectrum bands [37]
BGAN provides the warning system with combination of voice and high data rates
communications which assure operability from the first moment of the hazard appearance,
even when the terrestrial networks are disrupted [27]. For this reason BGAN is currently
being used by many disaster and recovery organizations around the world such as Red
Cross, Red Moon, Oxfam, etc as well as by government agencies e.g. in the case of the
hurricanes Katrina and Felix in USA [7].
4.3.1 BGAN Network Architecture
BGAN is designed as a customer’s service. However it is being developed as one of the
most important standards to define satellite communications. The BGAN function is based

01/07/08 Jose de la Fuente/ Helsinki University of Technology, Department of Electrical and Communications Engineering, Communications Laboratory
37
in the Inmarsat 4-F1, F2, and F3 satellites, designed to be around 100 times more powerful
and provide a ten-fold increase in communications capacity compared to earlier generation
of Inmarsat satellites. Inmarsat 4-F1 and F2 were launched in March and November of
2005 respectively and Inmarsat 4-F3 in planned to be launched in 2008.
The satellites Inmarsat I4 F1, F2 and F3 operate with a bandwidth of 34 MHz in each spot
beam. The channelisation is performed by the division of this bandwidth into 200 kHz
TDMA channels [49]. The system links the data flows of the users coming from the
terminals through the satellites and connects to the public and private telecommunications
networks by three Satellite Earth Stations situated in London (England), Fucino (Italy) and
Burum (Netherlands). The BGAN communications architecture allows the connections
between user terminals and IP and Circuit Switched Networks (See Figure 17 below).
Figure 17 BGAN Logical Architecture [49]
The external devices can connect with the User terminal trough several possibilities such as
WiFi, USB, Ethernet and so forth (see 4.3.2.1 Technical specifications of the terminals).
The forward and return satellite links with the User Terminals work in the L-band of the
spectrum (1.5/1.6 GHz) while the forward and return satellite links with the Satellite Earth
Stations work in frequencies of the C-band (4/6 GHz). The telecommunications system
stipulates a 3.5dB link margin and uses and Turbo Coding Forward Error Correction (FEC)
[28].
The management of the channels resources for the different applications from the User
Terminal is controlled by the use of the Packet Data Protocols (PDP) contexts. One PDP is
opened with each IP connection activated and in each of these contexts, the characteristics
such as data rate, QoS, routing, etc. will be defined.

01/07/08 Jose de la Fuente/ Helsinki University of Technology, Department of Electrical and Communications Engineering, Communications Laboratory
38
BGAN communications work with the use of Traffic Flow Templates (TFT), which
represent a set of filters with the mission of ensuring that any specific data traffic for one
application does not have to share its connection with another application. The TFTs will be
associated to the secondary PDP contexts managing the streaming connections we will
mention later.
4.3.1.1 BGAN IP Connections
The satellite communication links in BGAN support two different types of IP data
connections, first, the standard IP and secondly, the streaming IP [29]. When a standard IP
connection is opened the system activates a primary PDP context and when a streaming IP
connection is activated after it, a secondary PDP context is set.
The standard IP connection is designed for typical office applications and services such as
internet access, email, FTP, etc. Depending on the terminal it offers data rates up to
492kbps over a shared connection.
The streaming IP connection is suited for video and audio applications. It works with the
possibility of opening different streaming connections sharing the link with the standard
connection. The streaming IP supports different available data rates to be chosen separately
for the video and audio streaming of 32kbps, 64kbps, 128kbps (only HNS 9201 and
Explorer 500 user terminals) and 256kbps (only HNS 9201). This traffic rates will be
controlled by the TFTs, only allowing the specific rate to flow.
When the streaming connections are activated, the terminal negotiates a specific QoS with
the BGAN network, nevertheless, the observed throughput can be inferior to the one
selected due to the overheads and the interconnection with terrestrial networks.
For a standard IP connection is recommended the use of the TCP protocol since it is suited
for applications such as web browsing, FTP, etc. and the packet delivery must be
guaranteed by the packet-retransmission.
For the streaming IP connection a protocol configured for time-critical applications, giving
more preference to the rapid delivery than to the losing of packets, such as UDP is more
suited. The achieved data rates will be more close to the selected since UDP manage their
transmission according to the channel capacity but without the packet retransmission.

01/07/08 Jose de la Fuente/ Helsinki University of Technology, Department of Electrical and Communications Engineering, Communications Laboratory
39
4.3.1.2 VPN over BGAN structure
BGAN service enables the users to connect with other users or organizations through
Virtual Private Networks (VPN) over the public telecommunications networks. By the use
of tunnelling protocols the data is encrypted and sent over the physical channels to the
receiver, where the data is decrypted. The tunnelling protocols supported by BGAN are
IPSec, PPTP/L2F and L2TP.
IPSec is composed by a set of protocols developed by the IETF in order to support the
secure exchange of packets in the IP layer by the utilization of two different encryption
modes: Transport and Tunnel. The Transport mode encrypts only the data part of the
packets leaving the headers untouched while the Tunnel model encrypts both parts.
The Point-to-Point Tunnelling Protocol (PPTP) is used to secure PPP connections over
TCP/IP links based in Microsoft Point-to-Point Encryption (MPPE) protocol to provide the
encrypting methodology for the packets [39]. L2F have the same characteristics but it has
been developed by Cisco Systems.
The L2TP protocol is created by merging the Cisco L2F and the Microsoft PPTP protocols.
It acts like a layer link protocol for tunnelling network traffic between two peers over an
existing network. IPSec is commonly used by this protocol to secure its packets and in
addition it adds the use of a pre-shared key for the authentication of the users.
The necessary compression and encryption of the data for its transmission over VPNs is
usually going to increase the packets size. However in BGAN the final size of the data is
not increased in most of the cases since the compression is done before the encryption [30].
4.3.2 BGAN User Terminals Specifications
4.3.2.1 Technical specifications of the terminals
The terminals work in frequencies from 1525.0 to 1559.0 MHz in the reception and from
1626.5 to 1660.5 MHz in the transmission of data from and to the satellite, with an
Equivalent isotropically radiated power (EIRP) from 10 dBW (1dBW=30dBm) to 20 dBW
depending on the terminal [43] [47] and using QPSK modulation [23].

01/07/08 Jose de la Fuente/ Helsinki University of Technology, Department of Electrical and Communications Engineering, Communications Laboratory
40
The interface between the terminal and the connected device can be established by USB,
with the USB specification 1.1 standard, by Ethernet/LAN with the ISO/IEC 8877:1992
and IEEE 802.3 1998 edition standards, by WiFi with IEEE 802.11 a/b/g standards or
Bluetooth with the Power Class 1 standard. The support of WiFi operations allows almost
all kind of devices to connect to the User Terminal.
BGAN has a classification of Class 1, Class 2 and Class 3 for different terminal types [8]:
Class 1 BGAN terminals are best suited for professional applications, used under
extremely dusty, rainy, cold or hot conditions. Class 1 equipment features full
BGAN bandwidth of 492 kbps uplink / 492 kbps downlink and streaming
possibilities of up to 256 kbps guaranteed bandwidth. The terminals HNS 9210 and
Thrane & Thrane Explorer 700 belong to this category.
Class 2 BGAN terminals are best suited for professional and semi-professional
users. The equipment is light and user-friendly, capable of support communication
under most conditions. Bandwidth is 464 kbps uplink / 448 kbps downlink and
streaming possibilities up to 128 kbps guaranteed bandwidth. Class 2 equipment can
be shared by several multiple users.
Class 3 BGAN terminals are best suited for light users. The products have less
features, its performance is focused on its cost-efficiency and the equipment is not
water-proof. Bandwidth is 384 kbps uplink / 240 kbps downlink and streaming
possibilities up to 64 kbps guaranteed bandwidth. Class 3 equipment is only
available for single users.
The terminals involved in the simulations are the Thrane & Thrane Explorer 110, 300, 500
and 700 and the HNS 9210 (see Figure 18 below).

01/07/08 Jose de la Fuente/ Helsinki University of Technology, Department of Electrical and Communications Engineering, Communications Laboratory
41
Figure 18: UT Technical Comparison
4.3.2.2 PDP Contexts Management
Each model of terminal has a different method to manage the PDP issues and the
combination of PDP primary and secondary contexts. The most advanced and commonly
used terminals models are the HNS 9201 of Hughes Network Systems and the Explorer
Series of Thrane & Thrane.
HNS 9201 is able to support up to eleven PDP primary or secondary contexts
simultaneously, providing to each one with a different IP address and enabling each context
to connect to a different APN with a specific QoS. On the other hand the Explorer
Terminals are able to open one primary PDP context on a LAN interface simultaneously
with another primary context in the USB interface. All the users connected to the LAN
interface will share the same context.
4.3.2.3 IP Addressing of the UT
Once the terminals connect to the BGAN network they receive an IP address. Each
different computer connected to the terminal obtains a private IP address directly from the
terminal or from a router connected to the terminal.
The HNS 9201 Terminal uses the DHCP to dynamically provide with the IP addresses to
each computer connected to the LAN, up to eleven users. While the public IP address,
which can be static or dynamic, of the terminal will be allocated by the BGAN Service
Provider, the default private IP address of the terminal will be 192.168.128.100 and the
connected devices will be allocated in addresses like 192.168.128.x (see Figure 19).

01/07/08 Jose de la Fuente/ Helsinki University of Technology, Department of Electrical and Communications Engineering, Communications Laboratory
42
The DHCP server will map each private IP address of each connected device with a public
IP address in the network. By this method the terminal enables each user to be connected
without having to share the IP address with the other users.
Figure 19: IP addressing on the HNS 9201 [29]
Thrane & Thrane Explorer 500 and 700 support two different methods for the IP addressing
management, NAT mode or router mode. NAT mode dynamically allocates the IP
addresses to the connected devices, having 192.168.0.1 as default address for the terminal
and providing the users with address such as 192.168.0.x. In the same way as in the HNS
9201 the public IP address for the terminal is allocated by the BGAN Service Provider.
However in contrast to this terminal the different users of the Explorer 500 or 700 all the
private IP addresses will correspond to just one public IP address and they will have to
share the Standard or the Streaming IP connection (see Figure 20).
Figure 20: IP addressing on Explorer 500 and 700 in NAT mode [29]
In the router mode the allocation of the IP addresses is not developed by the terminal. In
this case the public IP address allocated by the BGAN Service provider is offered to only

01/07/08 Jose de la Fuente/ Helsinki University of Technology, Department of Electrical and Communications Engineering, Communications Laboratory
43
one single connected device which can be a computer or a router. The case is a router
would mean it receives the public IP address and it allocates the private IP addresses to its
connected devices from its own pool of IP addresses.
4.4. Design of the Scenarios
In the simulation we have been working in two possible scenarios of the DEWS system,
first the exchange of data between two EWCs and second, the transmission of the warning
message from the EWC to different authorities and government agencies of the area. The
simulation scenario has been programmed to adequate the communication characteristics to
the technical specifications offered by the BGAN service. Once the performance of these
two scenarios is analysed, the influence of some possible factors is measured.
The computer devices inside an early warning centre will by connected by a hub to the
satellite terminal of BGAN in order to communicate to the satellite. This LAN connection
is based in the IEEE 802.3 1998 edition standard with a bandwidth of 100Mbps using IPv4.
The IP addressing design of the scenarios is based on the dynamic mode of the HNS 9201
as well as in the NAT mode of the Thrane&Thrane Explorer Series mentioned above.
Figure 21: Qualnet Simulation Scenarios Architecture
Based on the different possible models of the User Terminals, the characteristics and data
rates are established in the simulation. In addition the satellite communication links are
designed to work in the L-band of the spectrum and to correspond to a bandwidth of 200
kHz offered by BGAN in the channelisation (See Annex C).
In a UT to UT communication the demodulated signals may not match with the quality
requested by the terminals, due to the power attenuation in the downlink and uplink with

01/07/08 Jose de la Fuente/ Helsinki University of Technology, Department of Electrical and Communications Engineering, Communications Laboratory
44
the satellite, the limitation in the satellite transponder radio frequency power and the small
size of the User Terminals [37]. For this reason the BGAN structure uses the Satellite
Access Stations (SAS) of Fucino, Burum and London as a hub station with more powerful
transmitters. This BGAN operation is implemented in the developed simulations in Qualnet
to provide more realistic results.
Figure 22: Schematic for BGAN Ground Network
The processes of the simulations have been managed to cope with the different possibilities
to be designed in the model of disseminating alerts/warning messages in the system. As
mentioned before each first responder will have different roles in the dissemination of the
warning and different task to perform in the affected areas. For this reason the sent
messages will have different characteristics and size and the communications channels will
affect them in different ways. After running the simulations, the statistics of interest
provided by Qualnet are compiled and analyzed.

01/07/08 Jose de la Fuente/ Helsinki University of Technology, Department of Electrical and Communications Engineering, Communications Laboratory
45
5. Analyses of the Results
In this study, where the time of alerts/warning dissemination is crucial, much interest is
centred on the consequences of the channelisation of the satellite links as well as on the
performance of the possible user terminals offered in the market for BGAN
communications. These consequences will be provoked not only by the type of BGAN
communication channel and by the model of User Terminal used, but also by the
characteristics of the message itself.
The dissemination of basic and low-expertise alerts/warning can be implemented by the
transmission of text messages with the crucial information for the authorities and
population of the affected areas. This scenario will imply low warning message sizes low
capacity demands and short delivery times.
In contrast the dissemination of high-expertise level warning messages will involve the
transmission of more complicated CAP format messages which may include multimedia
information such as maps of the affected areas developed in the DEWS Situation Picture
Component. In this case the performance of the dissemination will reach higher values of
time delay.
5.1. Scenarios
5.1.1 EWC to EWC
Along the transmission of warning messages between two different national or regional
EWC the satellite links will have enough resources to deliver them properly, according to
the reaction time limitations in the emergency process. This appropriate performance will
allow the system to achieve low levels of time delay in the message dissemination from one
centre to another.
The dedication of an entire BGAN communication channel only for the transmission of the
warning message provides enough bandwidth resources in the satellite links. The process
will achieve low time delays even for large messages (see Figure 23 below).

01/07/08 Jose de la Fuente/ Helsinki University of Technology, Department of Electrical and Communications Engineering, Communications Laboratory
46
Time Delay from EWC to EWC
0
1
2
3
4
5
6
1kB 5kB 10kB 50kB 100kB 500kB 1MB 5MB
Message Size
Tim
e D
ela
y (
min
)Class 3: Explorer 110/Explorer 300Class2: Explorer 500
Class 1: HNS9210/Explorer 700
Throughput from EWC to EWC
0
20000
40000
60000
80000
100000
120000
140000
1kB 5kB 10kB 50kB 100kB 500kB 1MB 5MB
Message Size
Th
rou
gh
pu
t (b
ps)
Class 3: Explorer 110/Explorer 300
Class 2: Explorer 500
Class 1: HNS9210/Explorer 700
Figure 23: Time Delays and Throughput from one EWC to another
Despite the differences of capacity of maximum data rates between the different models of
UTs, in this scenario the time gaps between the performances of the different models do not
reach values superior to milliseconds.
Depending on the size of the warning message to be sent, the capacities of the satellite line
will be seized to different levels. In a scenario where two EWC share a direct
communication between their User Terminals through the BGAN network the maximum
performance of the line in terms of throughput will only be reached with large files.
5.1.2 EWC to multiple authorities
In order to disseminate the warning to the population the National EWC will not have
enough resources to use all the possible communication options, for this reason this centre
will have to be able to send the message to the regional authorities and government
agencies which will have the appropriate power.
The consequences of which different model of User Terminals is used into the performance
of the warning implementations are going to have more significance in this scenario. In
addition the performance gaps between the different implementations will tend to become
more obvious as the size of the warning message increases. The figure below shows the
results of the communication between a EWC and a default number of four authorities
where we can appreciate this effect.

01/07/08 Jose de la Fuente/ Helsinki University of Technology, Department of Electrical and Communications Engineering, Communications Laboratory
47
Figure 24: Time Delays between EWC and four authorities
Similarly to the previous scenario, in the communication between one EWC and an amount
of governmental authorities the capacities of the channels are seized as the size of the
message increase. However, in this scenario the performance in terms of throughput of the
different user terminals will have larger gaps than when transmitting just between two
EWC. In addition the maximum throughput to be achieved in the channel will be reached
with smaller size of messages than in the previous scenario.
In comparison between the two scenarios, by sending the different warning messages to
several authorities rather than just one single EWC, we will obtain higher values of time
delay and low levels of possible maximum throughput rates to be achieved.

01/07/08 Jose de la Fuente/ Helsinki University of Technology, Department of Electrical and Communications Engineering, Communications Laboratory
48
5.2. Factors of Influence
5.2.1 Number of Authorities receiving the warning
The number of authorities participating in the dissemination of the warning and therefore
participating in the communications with the EWC will influence in the performance of the
system. The congestion of the line will provoke higher time delays and decrease the
throughput of the different channels. In the next figure we present the influence of the
number of authorities to receive the warning in a transmission of 1MB message with
different terminals.
Variation of Time Delay based in the number of
authoritiy
0
0,5
1
1,5
2
2,5
3
1 2 3 4 5 6
Number of Authorities
Tim
e D
ela
y (
min
) Class 1: HNS 9210/
Explorer 700
Class 2: Explorer
500
Class 3: Explorer
110/ Explorer 300
Variation of Throughput based in the number of
authorities
0
20000
40000
60000
80000
100000
120000
1 2 3 4 5 6
Number of Authorities
Th
rou
gh
pu
t (b
ps)
Class 1: HNS 9210/
Explorer 700
Class 2: Explorer
500
Class 3: Explorer
110/ Explorer 300
Figure 25: Influence of the amount of Authorities to receive the warning
Since the different authorities in this scenario will have different rates of time delay and
throughput, we have taken in account only the worst case rates in order to be aware of the
most inconvenient performances.
5.2.2 Updating the Warning Information
In Section 3.2 it was noted that the tsunami decision process involved sending multiple
message types in the warning dissemination process, such as, the detection of the
earthquake, the possibility of tsunami, the detection of tsunami, etc. In addition once the
incoming tsunami has been detected, the dissemination of new messages in order to update
the information may be necessary.
In a situation where the updated message is sent when no other messages are being
transmitted, the time delays rates will be equal to the measured above. However both
transmissions can coincide in time in a situation with a short time margin between the last
message transmission and the updated message incoming transmission. In the time range

01/07/08 Jose de la Fuente/ Helsinki University of Technology, Department of Electrical and Communications Engineering, Communications Laboratory
49
where both messages’ packets are being sent the congestion of the communication channel
will produce higher rates of time delay, affecting in more extent to the second transmission.
Nevertheless in the scenario with communications between two single EWC the influence
of channel congestion increase was not appreciable in the simulations results. A situation
where while a first warning message is being sent, a second transmission for a new
incoming warning message starts was measured in the simulator. The time range for
receiving the messages in this scenario distinguished in less than a second from the time
range when the messages were sent without interferences.
On the other hand, in a scenario with communications from one EWC to a default number
of four authorities the transmission interference of two different messages had important
consequences in the time delay rates. In the figure below the timelines of three different
tested situations are shown, one single message sent at t=50s, one single message sent at
t=70s and one message sent at t=50s with another transmission starting at t=70s. The
messages had a size of 1MB and were transmitted by the User Terminal HNS 9210.
Figure 26: Timeline with transmission interference
We can appreciate the extension of the transmission time of the messages in the scenario
with both transmissions coinciding in time. This may significantly affect the updating
message, with the increase of the transmission time reaching values of minutes, durations of
which are undesirable for a an early warning system where the response time is crucial.

01/07/08 Jose de la Fuente/ Helsinki University of Technology, Department of Electrical and Communications Engineering, Communications Laboratory
50
5.2.3 Influence of the Background Traffic
In the communication between the EWCs and between EWCs and first responders there is
the possibility of transmitting key information in addition to the warning messages. The key
data transmission will be transmitted continuously, in contrast to the warning messages
which are only sent in particular situations such as when an earthquake is detected, when a
tsunami is possible, and so forth.
We assume this background traffic to be composed by key information such as data
measurements, voice, messaging communication, video conferencing or media files with
useful information. For this reason the bandwidth range employed to these transmissions
can vary, affecting in different extents to the transmission of a warning message. The
prioritization of alerts/warning message traffic maybe important to be considered in the
design of the system in order to avoid disruption from background traffic
The simulations have shown the influence gap of the different background traffic rates
depending on each scenario, displaying a higher tolerance to its consequences in a EWC to
EWC situation. In the communications between EWC and several authorities the same
consequences were reached with lower background traffic rates (see Figure 27). Note that
the graphs stop displaying the values of the variables once the results have become useless
(due to the excessive time delay).
Time Delay of the Alarm Mesage in the scenarios
0
1
2
3
4
5
6
7
8
0Bps
4,09
6kbp
s
8,19
2kbp
s
16,3
84kb
ps
32,7
68kb
ps
65,5
36kb
ps
131,
072k
bps
262,
144k
bps
360k
bps
400k
bps
Background Traffic
Tim
e D
ela
y (
min
)
EWC to EWC
EWC to fourauthorities
Throughput of the alarm message
0
20000
40000
60000
80000
100000
120000
0Bps
4,09
6kbp
s
8,19
2kbp
s
16,3
84kb
ps
32,7
68kb
ps
65,5
36kb
ps
131,
072k
bps
262,
144k
bps
360k
bps
400k
bps
Background Traffic
Th
rou
gh
pu
t (b
ps)
EWC to EWC
EWC to four authorities
Figure 27: Influence of Background traffic in both scenarios
With low rates of background traffic the performance of the transmission in both scenarios
is affected in a low extent. However, as well as the background traffic rates increase the
performance quickly achieve unacceptable values in terms of time delay of the warning

01/07/08 Jose de la Fuente/ Helsinki University of Technology, Department of Electrical and Communications Engineering, Communications Laboratory
51
message dissemination. We can appreciate the sensibility difference between the two
scenarios and the limitations of the permitted background traffic rates in order to achieve
the appropriate time delays for the warning message.
In addition it was observed in the simulation results a similar development of the
transmission measures of the background traffic packets for both scenarios. The time delay
and throughput rates for this traffic increased with similar growth paths achieving time
delays up to 1.5 seconds per packet.

01/07/08 Jose de la Fuente/ Helsinki University of Technology, Department of Electrical and Communications Engineering, Communications Laboratory
52
6. Conclusions
6.1. Discussion
This thesis report proposes and analyzes the BGAN technology to serve as a backup for the
telecommunications channels of the DEWS centers. By means of Qualnet the possible
scenarios in the DEWS architecture have been tested with the adaptation of the BGAN
technical specifications into the simulations.
The compilation of the simulations results display the approximated performance statistics
of the BGAN service in the dissemination of the warning messages. Even if the QualNet
simulator’ limitations impede the full implementation of the technical specifications of
BGAN, the results show a reliable approximation of the behavior trends in the system. The
variation of the dissemination performances serve as a point of importance for the
designing of the possible communications backup structure.
The short time range from the detection of the hazard to its apparition forces the DEWS
system to seek for the most time saving implementations. For this reason the main
performance indicator taken in account in the results is the time delay spent in the
transmission of the warning message in order to develop the dissemination to the general
public.
The EWC to several authorities communications scenario demonstrates a higher sensibility
to the possible factors affecting the dissemination channels. The User Terminal model
implemented in the system provokes important time delay gaps in the transmission of the
messages, in addition these gaps become larger as well as the message expertise increase.
In the use of the BGAN based communication implementation, the architecture of the
dissemination plan plays an important role since the sensibility of this scenario is
aggravated with the increase of the number of authorities or first responders receiving the
warning messages.
On the other hand, in a single EWC to EWC scenario the performance of the transmission
channel will be less influenced by the User Terminal used in the communication structure.
The different simulations have similar time delay results irrespective the UT model
implemented. The time delay rates will increase as the message expertise and therefore the

01/07/08 Jose de la Fuente/ Helsinki University of Technology, Department of Electrical and Communications Engineering, Communications Laboratory
53
message size augment. However, the maximum capacity of the channel is not fully utilized
except for rare cases where the message size could be considered to be extremely large in
the context of the assumptions of this study.
Additional factors will influence in the system performance and should be taken in account
in the communications structure design. The protocol of the message dissemination can
alter the time delay rates when, in order to update the actual information, the transmission
of the updated message coincide with other warning message transmission. The
communication between a EWC to a default number of first responders was affected with
an increase in the time delay of both message transmissions, while the EWC to EWC
scenario presented high resistance to the influence of this factor.
The existence of possible background traffic in the line, in addition to the warning message
transmissions, has relevant consequences into the performance of both possible scenarios.
The traffic rate levels which provoke excessive time delays of the warning messages have
different values depending on the scenario we are treating. In the two scenarios tested the
time delay trends follow similar growth paths but the inappropriate levels are reached with
different amount of background traffic rates, showing more capacity in the EWC to EWC
scenario.
The development of the BGAN backup structure would need the design of the technical
characteristics of the system such as the type of message, the information contained on it,
the maximum permitted time to disseminate the warning and so forth. Based on the
modeling and design results the behavior of the system can pre-approximated in order to
select the appropriate implementation of the system to achieve the optimum performance.

01/07/08 Jose de la Fuente/ Helsinki University of Technology, Department of Electrical and Communications Engineering, Communications Laboratory
54
7. References
[1] ATOS Sections V2.7:”Description of work”- Distant Early Warning System
Innovation Project Annex I July 2007
[2] Badan Pusat Statistik (BPS-Statistics Indonesia): www.bps.go.id/
[3] Bautista B.C., Philippine Institute of Volcanology and Seismology: Current
Initiatives in the Development of Tsunami Early Warning Systems in the South
China Sea Region, December 2007
[4] BMDG - Badan Meteorologi Dan Geofisika: http://www.bmg.go.id/depan.bmg
[5] CAT Telecom Public Company Limited: www.cattelecom.com/
[6] CDMA Development Group: www.cdg.org/
[7] Crouch S., THALES Group: THALES BGAN–Broadband Satellite, January 2007
[8] Danimex Communication: Broadband Global Area Network, Broadband for a
mobile planet, 2005
[9] DEWS Consortium Deliverable 1.4 Scenario Document: Warning
Dissemination and Alert Processes – DEWS Specific Targeted Research Project,
GTZ Potsdam, March 2008
[10] DEWS Consortium Deliverable 1.6 Overall System Requirements Document –
DEWS Specific Targeted Research Project, GTZ Potsdam, January 2008
[11] DEWS Consortium Deliverable 2.3: Physical View and Communications–
DEWS Specific Targeted Research Project, GTZ Potsdam, February 2008
[12] DEWS Consortium Deliverable 2.5 Communications View – DEWS Specific
Targeted Research Project, GTZ Potsdam, March 2008
[13] DEWS Consortium Success Plan - STRP Project Priority 2, Atos Origin sae, June
2008
[14] DEWS Consortium WP2 Perspectives - Public Safety Communications Group
TKK, January 2007
[15] DEWS Consortium WPs 2nd Review Presentations, ATR2 Madrid, April 2008

01/07/08 Jose de la Fuente/ Helsinki University of Technology, Department of Electrical and Communications Engineering, Communications Laboratory
55
[16] Encore Networks, Inc: High Performance VPN Solutions over Satellite Networks,
Virginia October 2004
[17] ETSI GRSC5 7.1: Satellite Earth Stations and Systems, Jean-Jacques Bloch, SES
Chairman. GSC-12 Kobe 2007
[18] ETSI-TS-102182: EMTEL Requirements for communications from authorities to
citizens during emergencies
[19] ESA European Space Agency Mobility Communications Documents: BGAN
Extension Phase 2 Document, April 2008
[20] Excelcom (XL): www.xl.co.id/
[21] Fidler J. H., G Hernandez, M Lalovic, T Pell and I G Rose: BT Technology
Journal, A New Opportunity for Broadband Applications Vol. 20 No 1, Springer
Netherlands January 2002
[22] Fitch M., Fidler J. H.: BT Technology Journal, An Overview of Satellite Access
Networks J Vol. 18 No 3 Pages: 94 – 101, July 2000
[23] Gambaruto E., Richharia M. , Trachtman E.: Results Of Inmarsat BGAN-X
Land Vehicular Propagation Tests, Orizzonti Ltd, Inmarsat Ltd, United Kingdom,
2007
[24] GITEWS webpage: http://www.gitews.org/
[25] GSMA - GSM Association Coverage Maps: www.gsmworld.com
[26] Inmarsat: About Inmarsat: www.inmarsat.com/About
[27] Inmarsat BGAN applications: Emergency response July 2007.
[28] Inmarsat BGAN services and applications: Reference Manual, Issue 1 July 2003
[29] Inmarsat BGAN solutions guide: BGAN and IP data connections, Version 1.0
May 2006
[30] Inmarsat BGAN solutions guide: Using VPNs over BGAN, Version 1.0 May
2006

01/07/08 Jose de la Fuente/ Helsinki University of Technology, Department of Electrical and Communications Engineering, Communications Laboratory
56
[31] ITU International Telecommunication Union Free Statistics:
http://www.itu.int/ITU-D/ict/statistics/
[32] ITU-T X.1303: Common alerting protocol (CAP 1.1), September 2007
[33] Lanka Bell Corp.: www.lankabell.net
[34] Löwe P. GFZ-Potsdam: Deliverable 1.1 Country Report Sri Lanka, Sixth
Framework Programme Information Society Technologies, January 2008
[35] Löwe P. GFZ-Potsdam: Deliverable 1.2 Country Report Thailand, Sixth
Framework Programme Information Society Technologies, October 2007
[36] Löwe P. GFZ-Potsdam: Deliverable 1.3 Country Report Indonesia, Sixth
Framework Programme Information Society Technologies, February 2008
[37] Maral G.: VSAT Networks, Second Edition Ed. John Wiley & Sons, Ltd. 2003
[38] Pearl Z.: Web services: pump up the volume: bandwidth consumption and network
latency challenges must be addressed - Cover Story, 2004 Nelson Publishing.
[39] Schneier B., Mudge: Cryptanalysis of Microsoft's Point-to-Point Tunneling
Protocol (PPTP), Springer-Verlag pp. 192-203, October 1999
[40] Shin Satellite Public Company Limited: www.thaicom.net
[41] SNT - Scalable Network Technologies, Inc: Qualnet Product Family, 2006
[42] SLT Sri Lanka Telecom: www.slt.lk
[43] SpiderSat Communications: Hughes Network Systems, LLC HNS 9201 High
performance, multi-user device technical specifications
[44] Suntel Telecommunications: www.suntel.tk
[45] SYS-CON Media Inc.: The Impact of SOA and Web Services on Wide-Area
Networks, 2008
[46] TELKOM - Portal Korporat PT. Telekomunikasi Indonesia Tbk:
www.telkom.co.id/
[47] Thrane & Thrane Terminal Technical Specifications: BGAN Explorer 110,
BGAN Explorer 300, BGAN Explorer 500 and BGAN Explorer 700

01/07/08 Jose de la Fuente/ Helsinki University of Technology, Department of Electrical and Communications Engineering, Communications Laboratory
57
[48] TOT Public Company Limited: www.tot.co.th/
[49] Trachtman E. Broadband for a mobile planet, International Workshop For B3G/4G
Satellite Communications, 23.11.2006, Seoul
[50] U.S.AID Asia, Indian Ocean Tsunami Warning System Program: Tsunami
Warning Centre Reference Guide, Bangkok, Thailand 2007
[51] McKinney R. and Lambert R.: VSAT Systems, VPN over Satellite A comparison
of approaches, 2006
[52] Weniza S., Meteorological and Geophysical Agency (BMG): Global Seismic
Network for Great Inter-Plate Earthquakes in Asia and Pacific, March 2007
[53] WISECOM Deliverable 2.1-1: Terrestrial and Satellite Systems for Emergency
Situations-State of the Art, December 2006

01/07/08 Jose de la Fuente/ Helsinki University of Technology, Department of Electrical and Communications Engineering, Communications Laboratory
58
Annex A: ICT Gathered Indicators
In the work performed for DEWS involving this thesis, a statistical research was performed
at the beginning. The recompilation of ICT indicators in the countries of interest is shown
in the Annexes A and B.
Indonesia (reference: ITU)
Basic Indicators
Population
2004 2005 2006
Total Density Total Density Total Density
(M) (per km2) (M) (per km2) (M) (per km2)
222.61 116 222.78 116 225.46 117
GDP (one year before)
2004 2005 2006
Total per capita Total per capita Total per capita
(B US$) (US$) (B US$) (US$) (B US$) (US$)
237.4 1'104 256.8 1'154 287.0 1'288
Total Telephone Subscribers
2004 2005 2006
Total per 100 Total per 100 Total per 100
(000s) inhabitants (000s) inhabitants (000s) inhabitants
40'328.2 18.13 59'682.2 26.79 78'623.7 34.87
Main Telephone Lines
Main telephone lines
2004 2005 2006
CAGR(%) CAGR(%) CAGR(%)
(000s) 1999 - 04 (000s) 2000-05 (000s) 2001 - 06
9'991.6 10.4 12'772.3 13.9 14'820.7 15.5
Main telephone lines per 100 inhabitants
2004 2005 2006
CAGR(%) CAGR(%) CAGR(%)
2004 1999 - 04 2005 2000-05 2006 2001 - 06
4,49 8.7 5,73 12.2 6,57 13.8

01/07/08 Jose de la Fuente/ Helsinki University of Technology, Department of Electrical and Communications Engineering, Communications Laboratory
59
Mobile cellular subscribers
Mobile cellular subscribers (2004) As % of
total
CAGR per 100 % telephone
(000s) (%) inhabitants Digital subscribers
2004 1999 -
04
2004 2004 2004
30'336.6 68.7 13,63 33.9 75.2
Mobile cellular subscribers (2005) As % of
total
CAGR per 100 % telephone
(000s) (%) inhabitants Digital subscribers
2005 2000 -
05
2005 2005 2005
46'910.0 66.5 21,60 21.9 78.6
Mobile cellular subscribers (2006) As % of
total
CAGR per 100 % telephone
(000s) (%) inhabitants Digital subscribers
2006 2001 -
06
2006 2006 2006
63'803.0 57.8 28,30 16.1 81.1

01/07/08 Jose de la Fuente/ Helsinki University of Technology, Department of Electrical and Communications Engineering, Communications Laboratory
60
Internet
Internet(2004) Broadband
Subscribers(2004)
Subscribers
(000s)
Subscribers per
100 inhab.
Users
(000s)
Users per
100 inhab.
Total
(000s)
Per 100
inhab.
1'087.4 0.49 11'226.1 5,04 84.9 0.04
Internet(2005) Broadband
Subscribers(2005)
Subscribers
(000s)
Subscribers per
100 inhab.
Users
(000s)
Users per
100 inhab.
Total
(000s)
Per 100
inhab.
1'500.0 0.67 16'000.0 7,18 108.2 0.05
Internet (2006) Broadband
Subscribers(2006)
Subscribers
(000s)
Subscribers per
100 inhab.
Users
(000s)
Users per
100 inhab.
Total
(000s)
Per 100
inhab.
1'500.0 0.67 16'000.0 7,18 108.2 0.05

01/07/08 Jose de la Fuente/ Helsinki University of Technology, Department of Electrical and Communications Engineering, Communications Laboratory
61
Radio[Source: Badan Pusat Statistik (BPS-Statistics Indonesia)]
Percentage of population aged over 10 years who listened the radio
2003 2006
50,29 % 40,26
Television [Source: Badan Pusat Statistik (BPS-Statistics Indonesia)]
Percentage of population aged over 10 years who watched television
2003 2006
84,94 % 85,86 %

01/07/08 Jose de la Fuente/ Helsinki University of Technology, Department of Electrical and Communications Engineering, Communications Laboratory
62
Personal Computers (Source:World Bank) Personal computer per 1000 people in 2005: 14
Thailand (reference: ITU)
Basic Indicators
Population
2004 2005 2006
Total Density Total Density Total Density
(M) (per km2) (M) (per km2) (M) (per km2)
63.69 124 64,23 125 64.76 126
GDP (one year before)
2004 2005 2006
Total per capita Total per capita Total per capita
(B US$) (US$) (B US$) (US$) (B US$) (US$)
143.2 2'267 163.5 2'567 176.6 2'749
Total Telephone Subscribers
2004 2005 2006
Total per 100 Total per 100 Total per 100
(000s) inhabitants (000s) inhabitants (000s) inhabitants
34'190.3 53.68 38'171.2 59.43 47'888.9 73.95
Main Telephone Lines
Main telephone lines
2004 2005 2006
CAGR(%) CAGR(%) CAGR(%)
(000s) 1999 - 04 (000s) 2000-05 (000s) 2001 - 06
6'811.6 5,50 7'034.7 4,70 7'073.4 3,20
Main telephone lines per 100 inhabitants
2004 2005 2006
CAGR(%) CAGR(%) CAGR(%)
2004 1999 - 04 2005 2000-05 2006 2001 - 06
10,69 4,50 10,95 3,80 10,92 2.3

01/07/08 Jose de la Fuente/ Helsinki University of Technology, Department of Electrical and Communications Engineering, Communications Laboratory
63
Mobile cellular subscribers
Mobile cellular subscribers (2004) As % of total
CAGR per 100 % telephone
(000s) (%) inhabitants Digital subscribers
2004 1999 - 04 2004 2004 2004
27'378.7 63,60 42,98 99.5 80,10
Mobile cellular subscribers (2005) As % of total
CAGR per 100 % telephone
(000s) (%) inhabitants Digital subscribers
2005 2000 - 05 2005 2005 2005
31'136.5 59.1 48,97 87.5 81.6
Mobile cellular subscribers (2006) As % of total
CAGR per 100 % telephone
(000s) (%) inhabitants Digital subscribers
2006 2001 - 06 2006 2006 2006
40'815.5 40.1 63,02 66.8 85.2

01/07/08 Jose de la Fuente/ Helsinki University of Technology, Department of Electrical and Communications Engineering, Communications Laboratory
64
Internet
Internet(2004) Broadband
Subscribers(2004)
Subscribers
(000s)
Subscribers
per
100 inhab.
Users
(000s)
Users
per
100
inhab.
Total
(000s)
Per 100
inhab.
2'403.7 3.81 6'971.5 10,95 75.0 0.12
Internet(2005) Broadband
Subscribers(2005)
Subscribers
(000s)
Subscribers
per
100 inhab.
Users
(000s)
Users
per
100
inhab.
Total
(000s)
Per 100
inhab.
2'403.7 3.81 7'284.2 11,34 105.0 0.16
Internet (2006) Broadband
Subscribers(2006)
Subscribers
(000s)
Subscribers
per
100 inhab.
Users
(000s)
Users
per
100
inhab.
Total
(000s)
Per 100
inhab.
2'403.7 3.81 8'465.8 13,70 105.0 0.16
CAGR: Compound Annual Growth Rate.

01/07/08 Jose de la Fuente/ Helsinki University of Technology, Department of Electrical and Communications Engineering, Communications Laboratory
65
Television (Source: Wikipedia)
35.5 million televisions in use in 2005:
Personal Computers (Source:World Bank)
Personal computer per 1000 people in 2005: 58

01/07/08 Jose de la Fuente/ Helsinki University of Technology, Department of Electrical and Communications Engineering, Communications Laboratory
66
Sri Lanka (reference: ITU) Basic Indicators Population
2004 2005 2006
Total Density Total Density Total Density
(M) (per km2) (M) (per km2) (M) (per km2)
19.46 297 20.74 316 20.91 319
GDP (one year before)
2004 2005 2006
Total per capita Total per capita Total per capita
(B US$) (US$) (B US$) (US$) (B US$) (US$)
18.2 947 20.1 1'031 23.5 1'135
Total Telephone Subscribers
2004 2005 2006
Total per 100 Total per 100 Total per 100
(000s) inhabitants (000s) inhabitants (000s) inhabitants
3'202.4 16.45 4'605.8 22.20 7'296.6 34.89
Main Telephone Lines
Main telephone lines
2004 2005 2006
CAGR(%) CAGR(%) CAGR(%)
(000s) 1999 - 04 (000s) 2000-05 (000s) 2001 - 06
991.2 8.2 1'244.0 10.1 1'884.1 17.9
Main telephone lines per 100 inhabitants
2004 2005 2006
CAGR(%) CAGR(%) CAGR(%)
2004 1999 - 04 2005 2000-05 2006 2001 - 06
5,90 6.7 6,00 7.6 9,10 15.3

01/07/08 Jose de la Fuente/ Helsinki University of Technology, Department of Electrical and Communications Engineering, Communications Laboratory
67
Mobile cellular subscribers Mobile cellular subscribers (2004) As % of
total
CAGR per 100 % telephone
(000s) (%) inhabitants Digital subscribers
2004 1999 - 04 2004 2004 2004
2'211.2 53.8 11,36 49.5 69.0
Mobile cellular subscribers (2005) As % of
total
CAGR per 100 % telephone
(000s) (%) inhabitants Digital subscribers
2005 2000 - 05 2005 2005 2005
3'361.8 50.9 16,21 32.6 73.0
Mobile cellular subscribers (2006) As % of total
CAGR per 100 % telephone
(000s) (%) inhabitants Digital subscribers
2006 2001 - 06 2006 2006 2006
5'412.5 52.0 25,88 20.2 74.2

01/07/08 Jose de la Fuente/ Helsinki University of Technology, Department of Electrical and Communications Engineering, Communications Laboratory
68
Internet
Internet(2004) Broadband
Subscribers(2004)
Subscribers
(000s)
Subscribers
per
100 inhab.
Users
(000s)
Users per
100 inhab.
Total
(000s)
Per 100
inhab.
93.4 0.48 280.0 0,44 20.4 0.11
Internet(2005) Broadband
Subscribers(2005)
Subscribers
(000s)
Subscribers
per
100 inhab.
Users
(000s)
Users per
100 inhab.
Total
(000s)
Per 100
inhab.
115.0 0.55 350.0 1,69 26.1 0.13
Internet (2006) Broadband
Subscribers(2006)
Subscribers
(000s)
Subscribers per
100 inhab.
Users
(000s)
Users per
100 inhab.
Total
(000s)
Per 100
inhab.
130.1 0.62 428.0 2,50 29.1 0.14
CAGR: Compound Annual Growth Rate.

01/07/08 Jose de la Fuente/ Helsinki University of Technology, Department of Electrical and Communications Engineering, Communications Laboratory
69
Personal Computers (Source:World Bank)
Personal computer per 1000 people in 2005: 27

01/07/08 Jose de la Fuente/ Helsinki University of Technology, Department of Electrical and Communications Engineering, Communications Laboratory
70
Annex B: GSM and CDMA Coverage Areas in the DEWS
countries
Indonesia GSM
Excelcom (XL) [Source: http://www.xl.co.id/ (2008)]
•Technology: GSM 900/1800
•XL Network has covered the main island of Indonesia:
Sumatera, Java, Bali, Lombok, Kalimantan and Sulawesi
Hutchison CP Telecommunications (3) [ Source:http://www.three.co.id/3coverage/ (2008)]
•Technology: GSM 1800

01/07/08 Jose de la Fuente/ Helsinki University of Technology, Department of Electrical and Communications Engineering, Communications Laboratory
71
PT Indonesian Satellite Corporation Tbk (INDOSAT) [ Source:GSMA]
•Technology: GSM 900/1800
•Technology: GSM 1800
PT Natrindo Telepon Seluler (Lippo Telecom) [ Source:GSMA]
•Technology: GSM 1800

01/07/08 Jose de la Fuente/ Helsinki University of Technology, Department of Electrical and Communications Engineering, Communications Laboratory
72
PT Telekomunikasi Selular (TELKOMSEL) [ Source:GSMA]
•Technology: GSM 900/1800
CDMA
The following networks operate in this country:
Operator 2G/3G Type of system Status
Infrastructure
Vendor(s) CDMA Coverage
PT Bakrie
Telecom
3G -
CDMA2000
1xEV-DO
Rel. 0
WLL,800 MHz Launch
TBA
Coverage Pending
PT Bakrie
Telecom
3G -
CDMA2000
1X
WLL,800 MHz Commercial Nortel Banten, DKI Jaya-
Jakarta, West Java
PT Indosat 3G -
CDMA2000
1xEV-DO
Rel. 0
Cellular/PCS,800
MHz
Commercial Huawei, Balikpapan
PT Mobile-8
Telecom
3G -
CDMA2000
1X
Cellular,800
MHz
Commercial Samsung Anyer, Bantar, Bekasi,
Bogor, BSD, Carita,
Cibadak, Cibinong,
Cibitung, Cibubur,
Cicurug, Cikampet,
Cikande, Cikarang,
Cikupa, Cilegon,
Cileungsi, Cimanggu,
Cisaura, Depok, DKI
Jaya-Jakarta, Gebang,
Gunung Putri, Jatisari,
Karawaci, Karawang,
Klari, Pandeglang,
Parung, Puncak Pass,

01/07/08 Jose de la Fuente/ Helsinki University of Technology, Department of Electrical and Communications Engineering, Communications Laboratory
73
Purwakarta, Rangkas
Bitung, Sadang,
Sawangar, Sentul,
Serang, Serpong,
Sindanglaya,
Sukabumi, Tajur,
Tambun, Tangerang,
Tol Serpong
PT Mobile-8
Telecom
3G -
CDMA2000
1X
Cellular,800
MHz
Commercial Samsung Arjawinangun,
Bandung, Banjar,
Banjaran, Cadas,
Cagak, Ciamis,
Cianjur, Ciater,
Cikalong Wetan,
Cilimus, Cimahi Kota,
Cipatat, Ciranjang,
Cirebon, Ciwidey,
Cugenang, Garut,
Gekbrong, Gunung
Bengkung, Indramayu,
Jatibarang, Jatiwangi,
Karang Ampei, Kopo,
Kuningan, Lembang,
Losarang, Losari,
Majalengka,
Malangbong, Nagrek-
Pasir Cicis, Padalarang,
Pamanukan,
Pangandaran,
Pangeran, Patrol,
Pengalengan, Piered,
Rajapolah, Rancaekek,
Singaparna, Soreang,
Sukabumi, Sukaraja
Sukabumi, Sumedang,
Tanjung Sari,
Tasikmalaya
PT Mobile-8
Telecom
3G -
CDMA2000
1X
Cellular,800
MHz
Commercial Samsung Ampel, Bandungan,
Bangsri, Bangsri-
Brebes, Banjarnegara,
Bantul, Banyumanik,
Bawen, Blora, Bojong,
Borobudur, Boyolali,
Brebes, Bumiayu,
Cepu, Cilacap, Comal,
Delanggu, Demak, DI
Yogyakarta, Gombong,
Gringsing, Imogiri,
Jepara, Karang Awen,
Karang Pucung,
Karanganyar,
Kartosuro, Kebumen,
Kedu, Kendal,
Klampok, Klaten,
Klepu, Kopi Eva,
Krumput, Kudus,

01/07/08 Jose de la Fuente/ Helsinki University of Technology, Department of Electrical and Communications Engineering, Communications Laboratory
74
Kutoarjo,
Kutowinangun,
Lompong, Magelang,
Majenang, Margosari,
Masaran, Mranggen,
Muntilan, Ngroto, Pati,
Pekalongan, Pemalang,
Prambanan, Purwodadi,
Purwokerto, Purworejo,
Randublatung,
Rembang, Salatiga,
Secang, Semarang,
Slawi, Solo, Sragen,
Subah, Sukoharjo,
Surodadi, Tanjung,
Tawangmangu, Tegal,
Tulis, Ungaran,
Wanareja, Wates,
Wonogiri, Wonosobo,
Yuwono
PT Mobile-8
Telecom
3G -
CDMA2000
1X
Cellular,800
MHz
Commercial Samsung Ambulu, Asembagus,
Babat, Bajulmati,
Balung Kota, Bancar,
Bangil, Bangkalan,
Banyuwangi, Basuki,
Batu, Beji, Blitar,
Bojonegoro,
Bondowoso, Bromo
Panajakan, Brondong,
Caruban, Cerme,
Dampit, Gedangan,
Gempol, Genteng,
Glenmore, Gresik,
Gunung Doek, Gunung
Kawi, Gunung
Kuncung/Trenggalek,
Jalur Bangil-
Probolinggo, Jatiroto,
Jember, Jombang,
Kalibaru, Kandangan,
Karangjati, Karangrejo,
Kediri, Kencong,
Kepanjen, Kertosono,
Ketapang, Klakah,
Kraksaan, Lamongan,
Lawang, Leces,
Lumajang, Madiun,
Magetan, Malang,
Milwang, Mojokerto,
Muncar, Ngandong,
Nganjuk, Ngawi,
Ngebel, Nguling,
Ngunut, Padangan,
Paiton, Pamekasan,
Panceng, Pandaan,
Pare, Pasir Putih,
Pasuruan, Ploso,

01/07/08 Jose de la Fuente/ Helsinki University of Technology, Department of Electrical and Communications Engineering, Communications Laboratory
75
Ponorogo, Prigen,
Probolinggo, Puger,
Purwosari, Rogojampi,
Sampang, Saradan,
Sarangan, Sedati,
Sedayu, Sidoarjo,
Singosari, Situbondo,
Sukodadi, Sukorejo,
Sukowono, Sumber
Manjing, Sumber
Pucung, Sumenep,
Surabaya, Tanggul,
Tanggul Angin, Tapen,
Trenggalek, Tuban,
Tulung Agung,
Tumpang, Turen,
Wates, Widodaren,
Wlingi, Wongsorejo,
Wonosalam
PT Sampoerna
Telekomunikasi
Indonesia
3G -
CDMA2000
1X
Cellular,450
MHz
Commercial Huawei Coverage Pending
PT Smart
Telecom
3G -
CDMA2000
1xEV-DO
Rev. A
PCS ,1900 MHz Launch
TBA
ZTE Coverage Pending
PT Smart
Telecom
3G -
CDMA2000
1xEV-DO
Rel. 0
PCS ,1900 MHz Launch
TBA
ZTE Jakarta
PT Smart
Telecom
3G -
CDMA2000
1X
PCS ,1900 MHz Commercial ZTE Coverage Pending
PT TELKOM
Indonesia
3G -
CDMA2000
1X
WLL,800 MHz Commercial Samsung Balikpapan, Denpasar,
Surabaya
PT TELKOM
Indonesia
3G -
CDMA2000
1X
WLL,800 MHz Deployment Ericsson Bekasi, Bogor, Jakarta,
Tangerang
PT TELKOM
Indonesia
3G -
CDMA2000
1X
Cellular,800
MHz
Deployment Samsung Bali, Java, Kalimantan,
Sulawesi

01/07/08 Jose de la Fuente/ Helsinki University of Technology, Department of Electrical and Communications Engineering, Communications Laboratory
76
PT TELKOM
Indonesia
3G -
CDMA2000
1X
WLL,800 MHz Deployment Motorola Sumatra
PT TELKOM
Indonesia
2G - IS-
95A
Cellular,800
MHz
Commercial Motorola East Java, Surabaya
PT TELKOM
Indonesia
2G - IS-
95A
WLL,1900 MHz Commercial Motorola Bandung, West Java
Thailand
GSM
The following networks operate in this country:
ACT Mobile Company, Limited (ACT GSM 1900) [ Source:GSMA]
•Technology: GSM 900/1800 and 3G 2100 still in planning process (planned for July 2008)
Advanced Info Service PLC (AIS GSM)[ Source:GSMA] •Technology: GSM 900

01/07/08 Jose de la Fuente/ Helsinki University of Technology, Department of Electrical and Communications Engineering, Communications Laboratory
77
Digital Phone Co Ltd (GSM 1800) [ Source: GSMA]
•Technology: GSM 1800
Total Access Communications Co (DTAC) [ Source: GSMA]
•Technology: GSM 1800
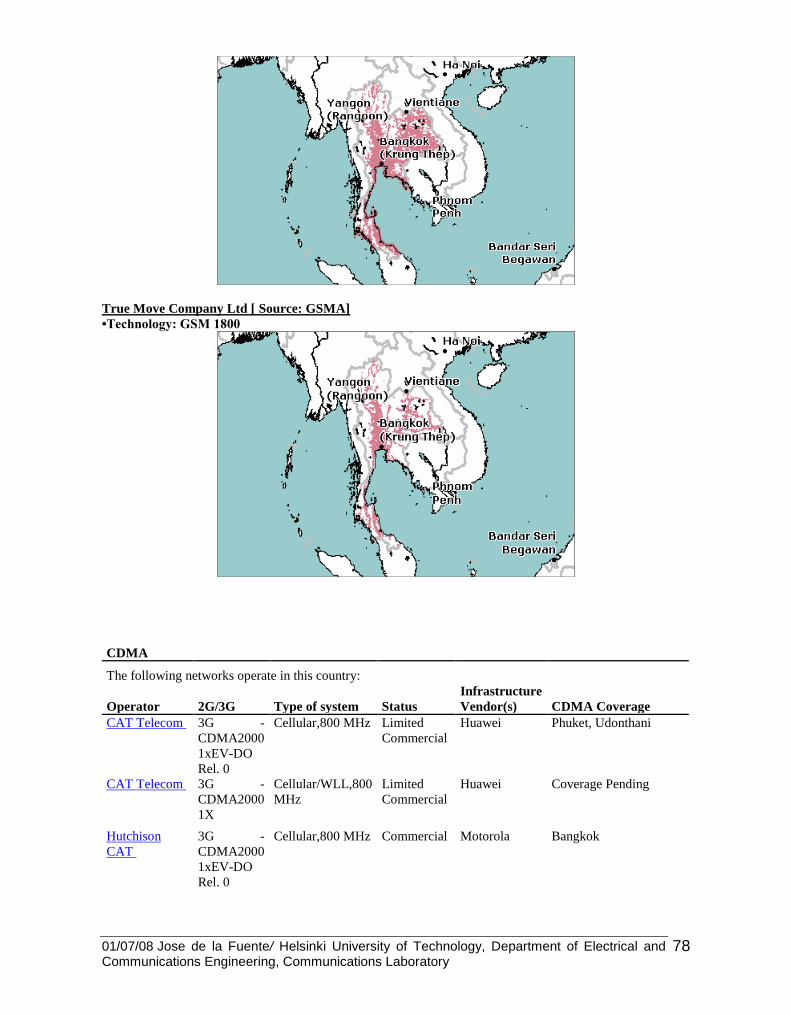
01/07/08 Jose de la Fuente/ Helsinki University of Technology, Department of Electrical and Communications Engineering, Communications Laboratory
78
True Move Company Ltd [ Source: GSMA]
•Technology: GSM 1800
CDMA
The following networks operate in this country:
Operator 2G/3G Type of system Status
Infrastructure
Vendor(s) CDMA Coverage
CAT Telecom 3G -
CDMA2000
1xEV-DO
Rel. 0
Cellular,800 MHz Limited
Commercial
Huawei Phuket, Udonthani
CAT Telecom 3G -
CDMA2000
1X
Cellular/WLL,800
MHz
Limited
Commercial
Huawei Coverage Pending
Hutchison
CAT
3G -
CDMA2000
1xEV-DO
Rel. 0
Cellular,800 MHz Commercial Motorola Bangkok

01/07/08 Jose de la Fuente/ Helsinki University of Technology, Department of Electrical and Communications Engineering, Communications Laboratory
79
Hutchison
CAT
3G -
CDMA2000
1X
Cellular,800 MHz Commercial Motorola, Ang Thong, Ayudhaya,
Bangkok, Central region
of Thailand,
Chachoengsao,
Chanthaburi, Chon Buri,
Karn Chana Buri,
Kirikhan, Lopburi,
Nakhon Nayok, Nakhon
Prathom, Nonthaburi,
Pajuap, Patumthani,
Petchaburi,
Prajeanburi, Ratchaburi,
Rayong, Sa Keaw,
Samut Prakan, Samut
Sakhon, Samut
Songkram, Sara Buri,
Supan Buri, Trat
Nortel
Hutchison
CAT
2G - IS-
95A
Cellular,800 MHz Commercial Alcatel-
Lucent
Bangkok, Central region
of Thailand
Sri lanka
GSM
Dialog Telekom Ltd [ Source:GSMA]
•Technology: GSM 900/1800

01/07/08 Jose de la Fuente/ Helsinki University of Technology, Department of Electrical and Communications Engineering, Communications Laboratory
80
•Technology: 3G 2100
Hutchison Telecommunications Lanka (Pte) Limited [ Source:GSMA]
•Technology: GSM 900
Mobitel (Pvt) Limited [ Source: http://www.mobitellanka.com/]

01/07/08 Jose de la Fuente/ Helsinki University of Technology, Department of Electrical and Communications Engineering, Communications Laboratory
81
•Technology: GSM 1800 •Technology: 3,5G
Tigo (Private) Limited [ Source: http://www.mobitellanka.com/]
•Technology: GSM 900/1800
CDMA
Operator 2G/3G
Type of
system Status
Infrastructure
Vendor(s)
CDMA
Coverage
Dialog 3G -
CDMA2000
1X
WLL, Commercial Huawei Chillaw,
Kalutara,
Kandy,
Kegalla,
Kurunegala,
Puttalam,
450 MHz

01/07/08 Jose de la Fuente/ Helsinki University of Technology, Department of Electrical and Communications Engineering, Communications Laboratory
82
Ratnapura
Lanka Bell 3G -
CDMA2000
1X
WLL, Commercial Huawei, Ampara,
Anuradhapura,
Badulla,
Chillaw,
Colombo,
Galle,
Hambantota,
Kalutara,
Kandy,
Kataragama,
Kegalla,
Kurunegala,
Matale,
Matara,
Monaragala,
Negombo,
Nuwara-Eliya,
Polonaruwa,
Puttalam,
Ratnapura,
Trincomalee,
Vavnlya
1900 MHz ZTE
Sri Lanka Telecom
Limited
3G -
CDMA2000
1X
WLL, Commercial ZTE Islandwide
800 MHz
Suntel 3G -
CDMA2000
1xEV-DO
WLL, Trial Huawei Coverage
Pending 800 MHz
Suntel 3G -
CDMA2000
1X
WLL, Commercial Huawei Nationwide
800 MHz
Tritel Services Private
Limited
3G -
CDMA2000
1X
WLL, Launch TBA Huawei Islandwide
450 MHz

01/07/08 Jose de la Fuente/ Helsinki University of Technology, Department of Electrical and Communications Engineering, Communications Laboratory
83
Annex C: General Simulation Inputs
Channel Frequency 1.6 GHz
Network Protocol IPv4
Satcom type Bent pipe
Bandwidth 384/464/484kbps
Propagation Delay 270ms
Radio Type Satellite RSV PHY
Channel Bandwidth 200 kHz
Preamble Size 64
Modulation Profile QPSK
R-S Block and Code Size REED-SOLOMON 204-188
R-S Shorten Last Codeword YES
Convolutional Coding Profile VITERBI 1-2
Guard Time 10us
Adjacent Channel Interference 18dB
Adjacent Satellite Interference 30dB
Intermodulation Distortion 25dB
Receiver Threshold 7dB
Error Model Threshold-Based
Error Threshold 7dB
LAN Subnet MAC Protocol 802.3
802.3 Bandwidth 100Mbps
802.3 Prop Delay 2.5us

01/07/08 Jose de la Fuente/ Helsinki University of Technology, Department of Electrical and Communications Engineering, Communications Laboratory
84
Annex D: Rain Contours World Map
Source: Maral G. 2003